Embed Size (px)
Citation preview
© 2014 Environmental Risk Communications, Inc.
Contact:
John Rosengard(415) 336-5085
www.erci.com
Estimating and Disclosing Environmental Liabilities
February 2015 Call: (914) 339-0033Code: 443-350-915
© 2014 Environmental Risk Communications, Inc.
Today’s Webinar Outline
Speaker Background
GAAP Framework
- ASC 410, GASB 49
Fair Value Measurement
Non-Performance Risk of Counterparty Default
Best Practices
Q&A
© 2014 Environmental Risk Communications, Inc.
Speaker Background: John Rosengard
21 years at ERCI; founder/creator of Defender software suite
14 US corporate remediation teams [>60 audits]
3000 unique liabilities
200 decision analysis projects
4 US port authority remediation teams [>10 audits]
Counterparty credit tracking system
MBA, Northwestern; BS, Georgetown
…not an attorney or an engineer or a CPA
© 2014 Environmental Risk Communications, Inc.
Elevator Speech
Environmental liabilities are significant and growing
Legacy and ongoing releases to soil, GW, sediments
More GAAP standards than ever
More environmental regulations than ever
More raw data than ever
Counterparties defaulting regularly
Reliably stating environmental liabilities is a challenge
Fair value is the trend
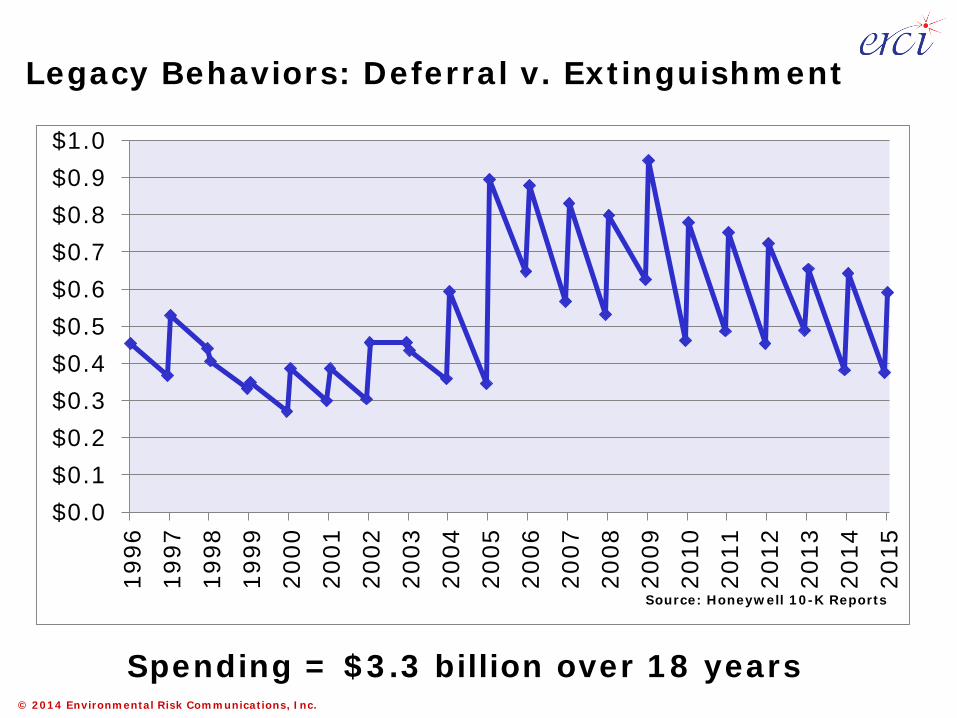
Legacy behaviors brought deferral, not extinguishment
We decided long ago that the dangers of excessive and unwarranted concealment of pertinent facts far outweighed the dangers which are cited to justify it. – John F. Kennedy, April 27, 1961
© 2014 Environmental Risk Communications, Inc.
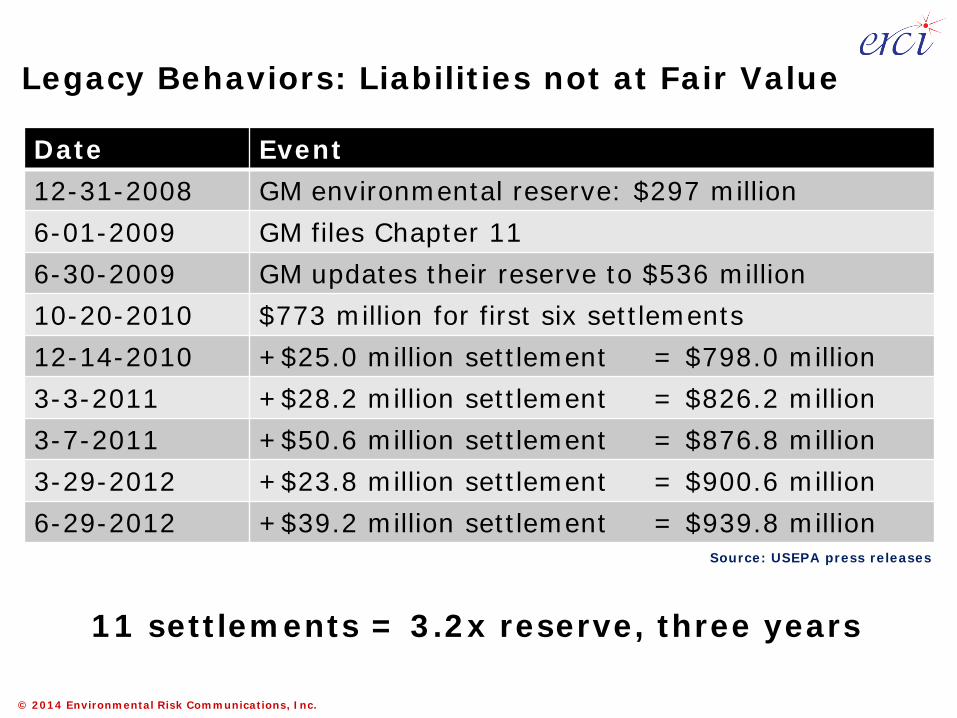
Legacy Behaviors: Liabilities not at Fair Value
Date Event12-31-2008 GM environmental reserve: $297 million6-01-2009 GM files Chapter 116-30-2009 GM updates their reserve to $536 million10-20-2010 $773 million for first six settlements12-14-2010 +$25.0 million settlement = $798.0 million3-3-2011 +$28.2 million settlement = $826.2 million3-7-2011 +$50.6 million settlement = $876.8 million3-29-2012 +$23.8 million settlement = $900.6 million6-29-2012 +$39.2 million settlement = $939.8 million
11 settlements = 3.2x reserve, three years
Source: USEPA press releases
© 2014 Environmental Risk Communications, Inc.
$0.0$0.1$0.2$0.3$0.4$0.5$0.6$0.7$0.8$0.9$1.0
1996
1997
1998
1999
2000
2001
2002
2003
2004
2005
2006
2007
2008
2009
2010
2011
2012
2013
2014
2015
Legacy Behaviors: Deferral v. Extinguishment
Source: Honeywell 10-K Reports
Spending = $3.3 billion over 18 years
© 2014 Environmental Risk Communications, Inc.
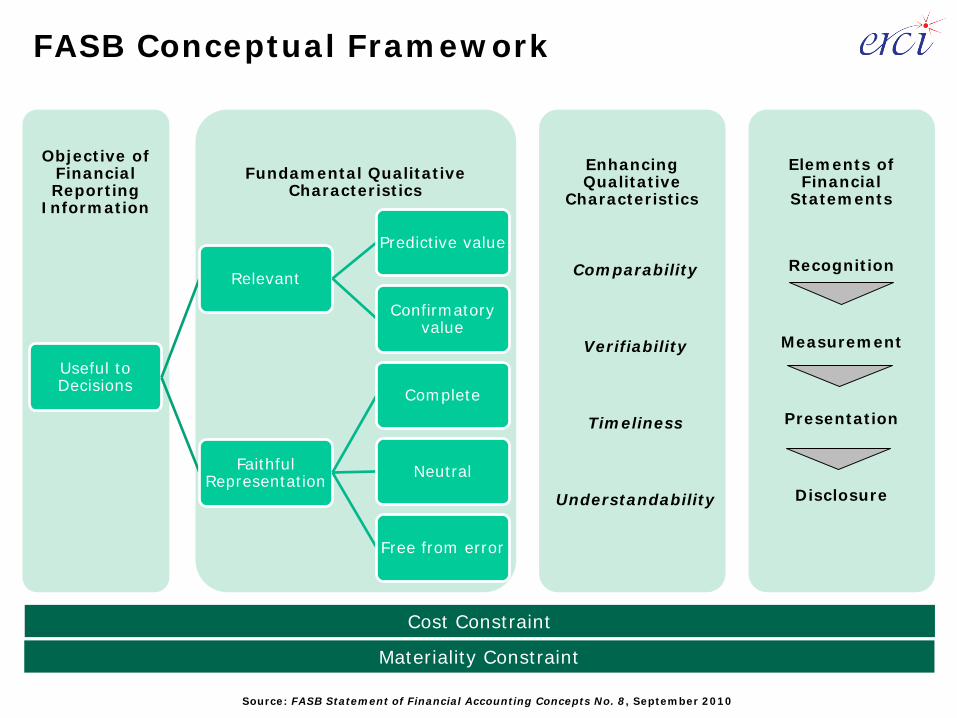
FASB Conceptual Framework
Source: FASB Statement of Financial Accounting Concepts No. 8, September 2010
Enhancing Qualitative
CharacteristicsFundamental Qualitative
Characteristics
Objective of Financial Reporting
Information
Useful to Decisions
Relevant
Predictive value
Confirmatory value
Faithful Representation
Complete
Neutral
Free from error
Elements of Financial
Statements
Comparability
Verifiability
Timeliness
Understandability
Recognition
Measurement
Presentation
Disclosure
Cost Constraint
Materiality Constraint
© 2014 Environmental Risk Communications, Inc.
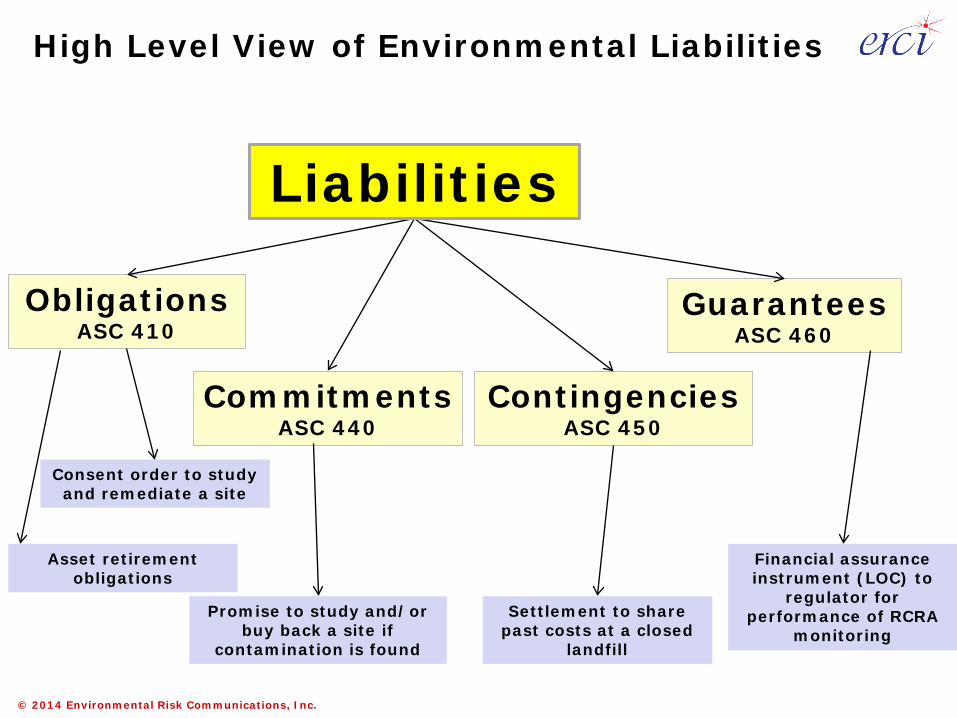
High Level View of Environmental Liabilities
ObligationsASC 410
CommitmentsASC 440
ContingenciesASC 450
GuaranteesASC 460
Liabilities
Consent order to study and remediate a site
Promise to study and/or buy back a site if
contamination is found
Settlement to share past costs at a closed
landfill
Financial assurance instrument (LOC) to
regulator for performance of RCRA
monitoring
Asset retirement obligations
© 2014 Environmental Risk Communications, Inc.
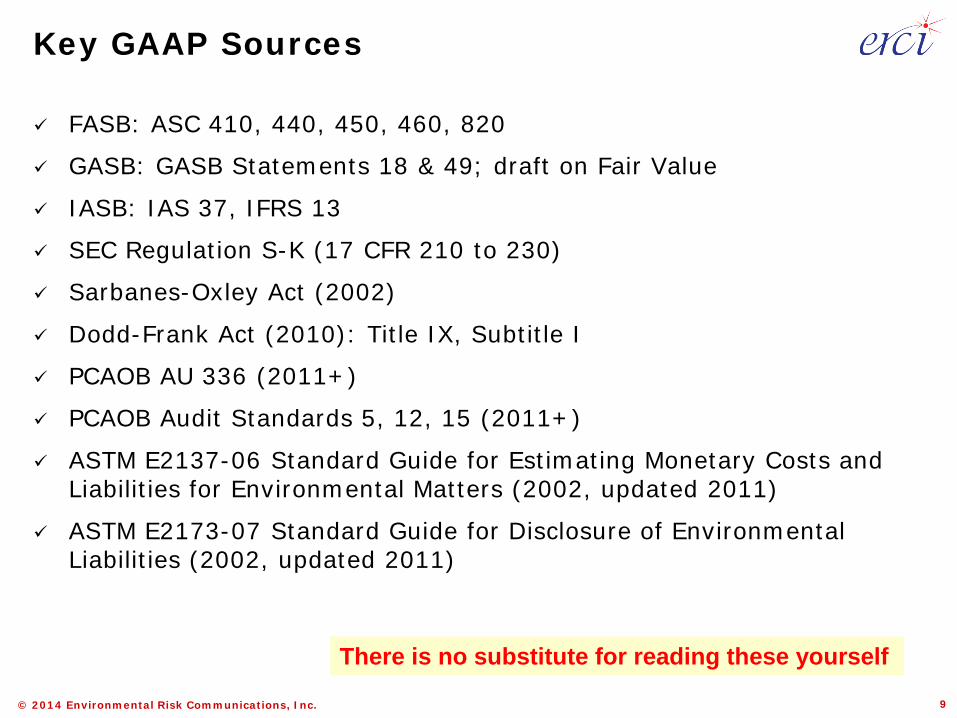
Key GAAP Sources
FASB: ASC 410, 440, 450, 460, 820
GASB: GASB Statements 18 & 49; draft on Fair Value
IASB: IAS 37, IFRS 13
SEC Regulation S-K (17 CFR 210 to 230)
Sarbanes-Oxley Act (2002)
Dodd-Frank Act (2010): Title IX, Subtitle I
PCAOB AU 336 (2011+)
PCAOB Audit Standards 5, 12, 15 (2011+)
ASTM E2137-06 Standard Guide for Estimating Monetary Costs and Liabilities for Environmental Matters (2002, updated 2011)
ASTM E2173-07 Standard Guide for Disclosure of Environmental Liabilities (2002, updated 2011)
There is no substitute for reading these yourself
9
© 2014 Environmental Risk Communications, Inc.
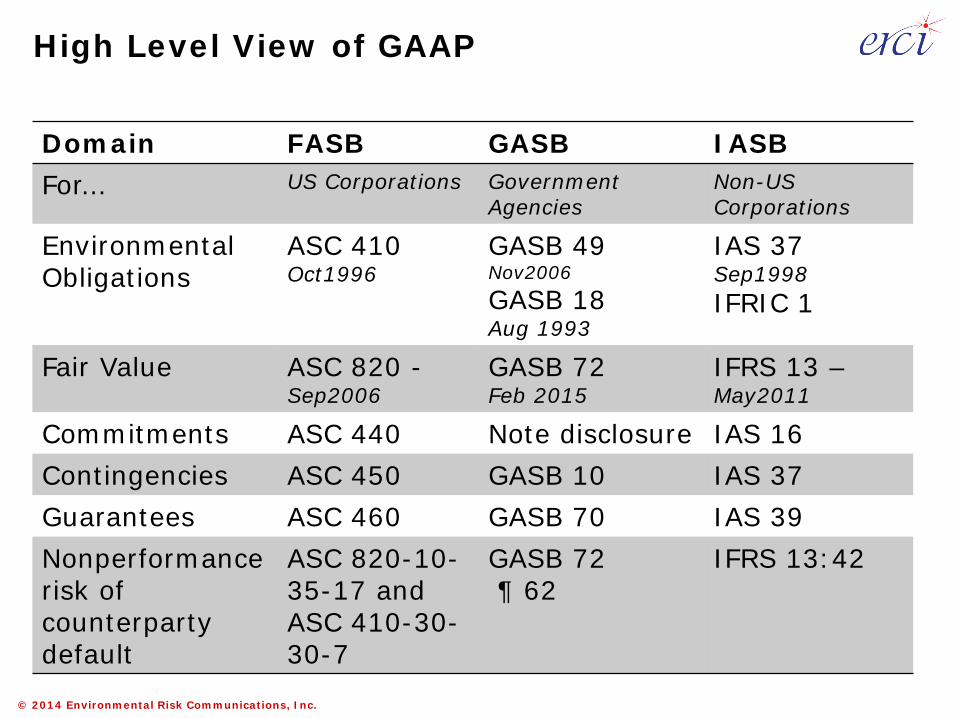
High Level View of GAAP
Domain FASB GASB IASBFor… US Corporations Government
AgenciesNon-US Corporations
Environmental Obligations
ASC 410Oct1996
GASB 49Nov2006GASB 18Aug 1993
IAS 37Sep1998IFRIC 1
Fair Value ASC 820 -Sep2006
GASB 72Feb 2015
IFRS 13 –May2011
Commitments ASC 440 Note disclosure IAS 16Contingencies ASC 450 GASB 10 IAS 37Guarantees ASC 460 GASB 70 IAS 39Nonperformancerisk of counterparty default
ASC 820-10-35-17 and ASC 410-30-30-7
GASB 72¶ 62
IFRS 13:42
© 2014 Environmental Risk Communications, Inc.
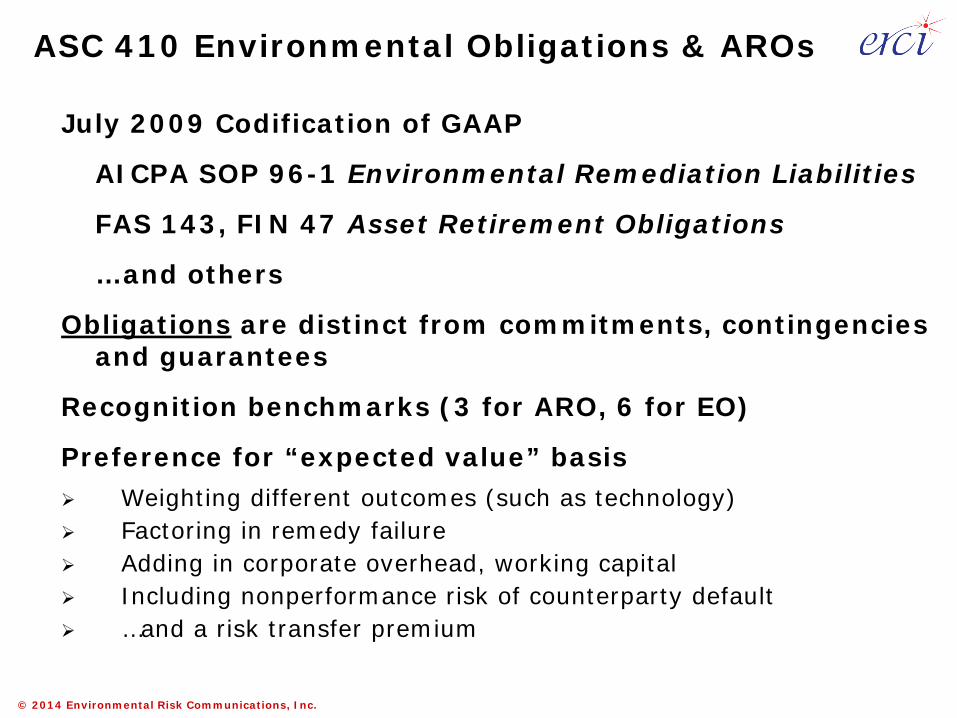
ASC 410 Environmental Obligations & AROs
July 2009 Codification of GAAP
AICPA SOP 96-1 Environmental Remediation Liabilities
FAS 143, FIN 47 Asset Retirement Obligations
…and others
Obligations are distinct from commitments, contingencies and guarantees
Recognition benchmarks (3 for ARO, 6 for EO)
Preference for “expected value” basis Weighting different outcomes (such as technology) Factoring in remedy failure Adding in corporate overhead, working capital Including nonperformance risk of counterparty default …and a risk transfer premium
© 2014 Environmental Risk Communications, Inc.
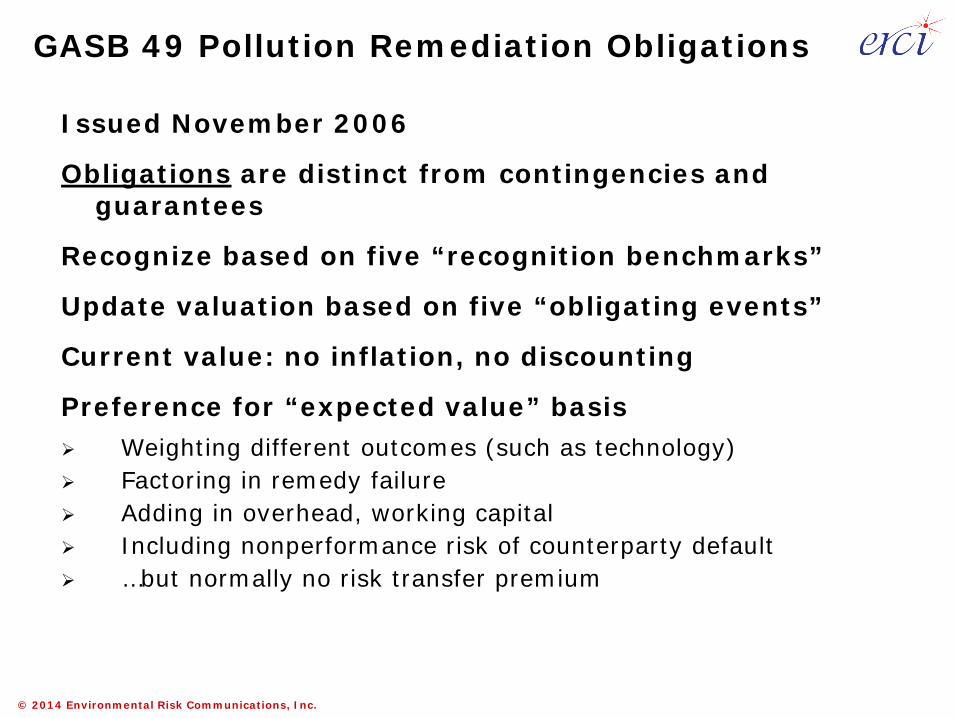
GASB 49 Pollution Remediation Obligations
Issued November 2006
Obligations are distinct from contingencies and guarantees
Recognize based on five “recognition benchmarks”
Update valuation based on five “obligating events”
Current value: no inflation, no discounting
Preference for “expected value” basis Weighting different outcomes (such as technology) Factoring in remedy failure Adding in overhead, working capital Including nonperformance risk of counterparty default …but normally no risk transfer premium
© 2014 Environmental Risk Communications, Inc.
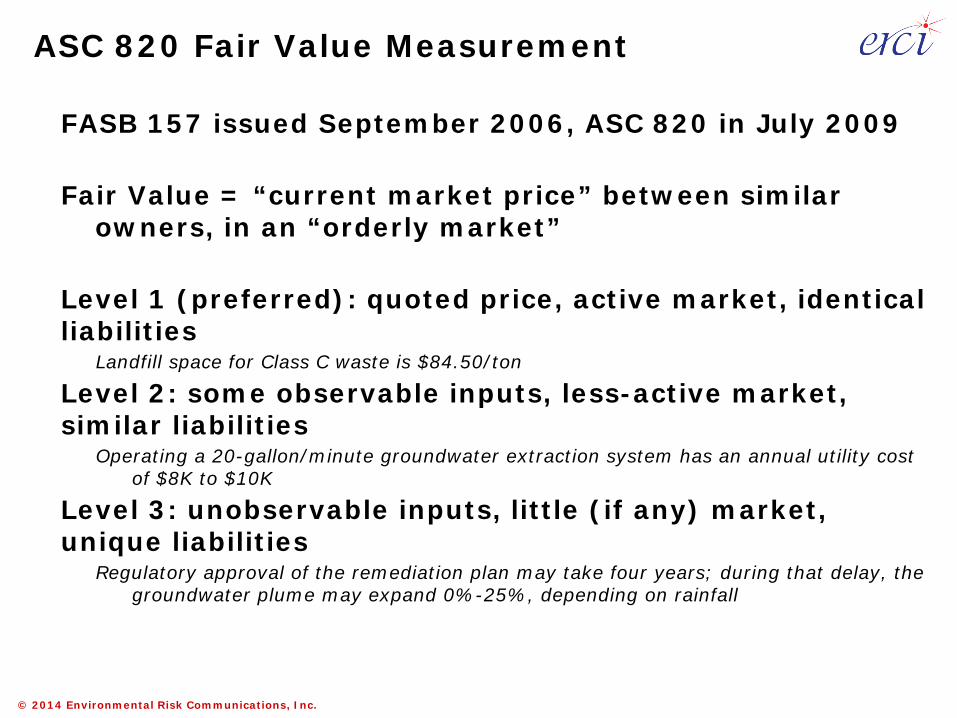
ASC 820 Fair Value Measurement
FASB 157 issued September 2006, ASC 820 in July 2009
Fair Value = “current market price” between similar owners, in an “orderly market”
Level 1 (preferred): quoted price, active market, identical liabilities
Landfill space for Class C waste is $84.50/ton
Level 2: some observable inputs, less-active market, similar liabilities
Operating a 20-gallon/minute groundwater extraction system has an annual utility cost of $8K to $10K
Level 3: unobservable inputs, little (if any) market, unique liabilities
Regulatory approval of the remediation plan may take four years; during that delay, the groundwater plume may expand 0%-25%, depending on rainfall
© 2014 Environmental Risk Communications, Inc.
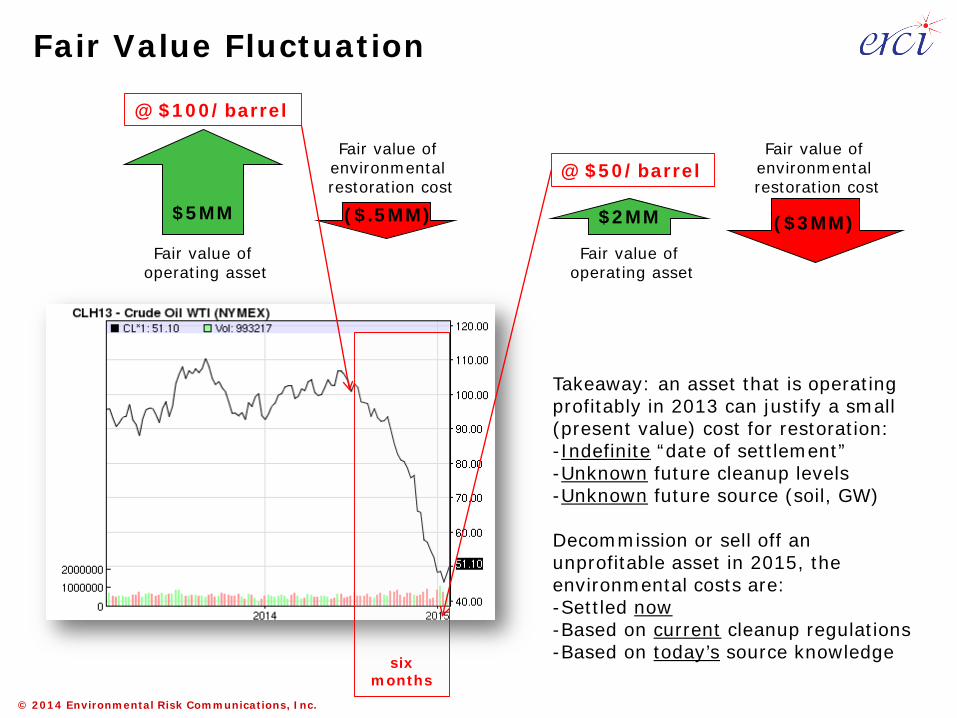
Fair Value Fluctuation
six months
Fair value of environmental restoration cost
Fair value of operating asset
Fair value of environmental restoration cost
Fair value of operating asset
@ $100/barrel
@ $50/barrel
Takeaway: an asset that is operating profitably in 2013 can justify a small (present value) cost for restoration:-Indefinite “date of settlement”-Unknown future cleanup levels-Unknown future source (soil, GW)
Decommission or sell off an unprofitable asset in 2015, the environmental costs are:-Settled now-Based on current cleanup regulations-Based on today’s source knowledge
$5MM ($.5MM) $2MM ($3MM)
© 2014 Environmental Risk Communications, Inc.
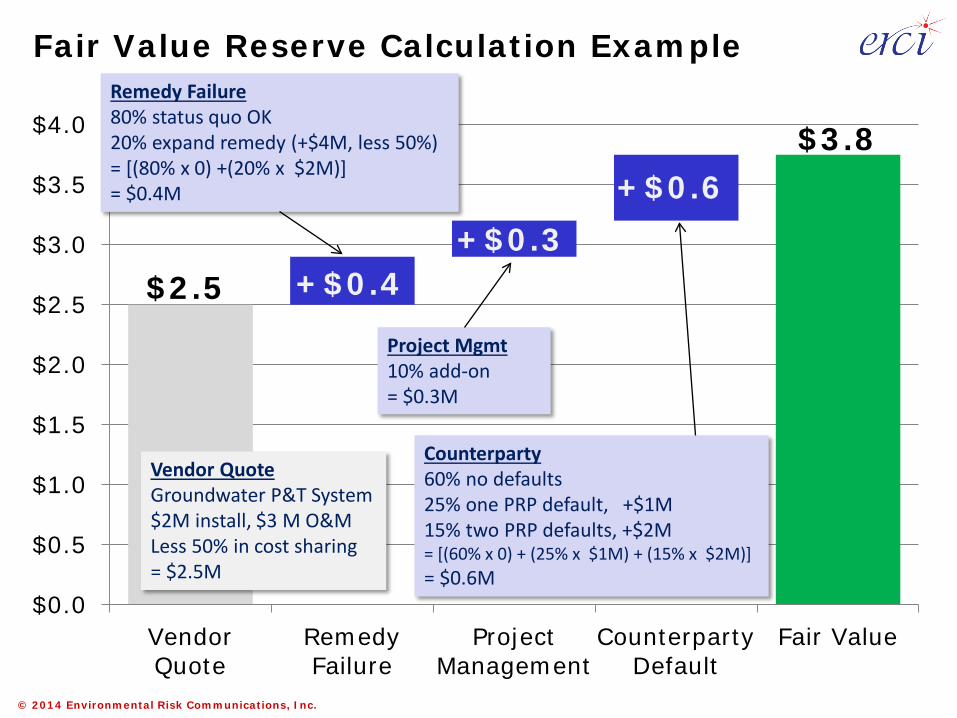
Fair Value Reserve Calculation Example
$0.0
$0.5
$1.0
$1.5
$2.0
$2.5
$3.0
$3.5
$4.0
VendorQuote
RemedyFailure
ProjectManagement
CounterpartyDefault
Fair Value
Vendor QuoteGroundwater P&T System$2M install, $3 M O&MLess 50% in cost sharing= $2.5M
Remedy Failure80% status quo OK20% expand remedy (+$4M, less 50%)= [(80% x 0) +(20% x $2M)] = $0.4M
Project Mgmt10% add-on= $0.3M
Counterparty60% no defaults25% one PRP default, +$1M15% two PRP defaults, +$2M= [(60% x 0) + (25% x $1M) + (15% x $2M)] = $0.6M
$2.5
$3.8
+$0.4+$0.3
+$0.6
© 2014 Environmental Risk Communications, Inc.
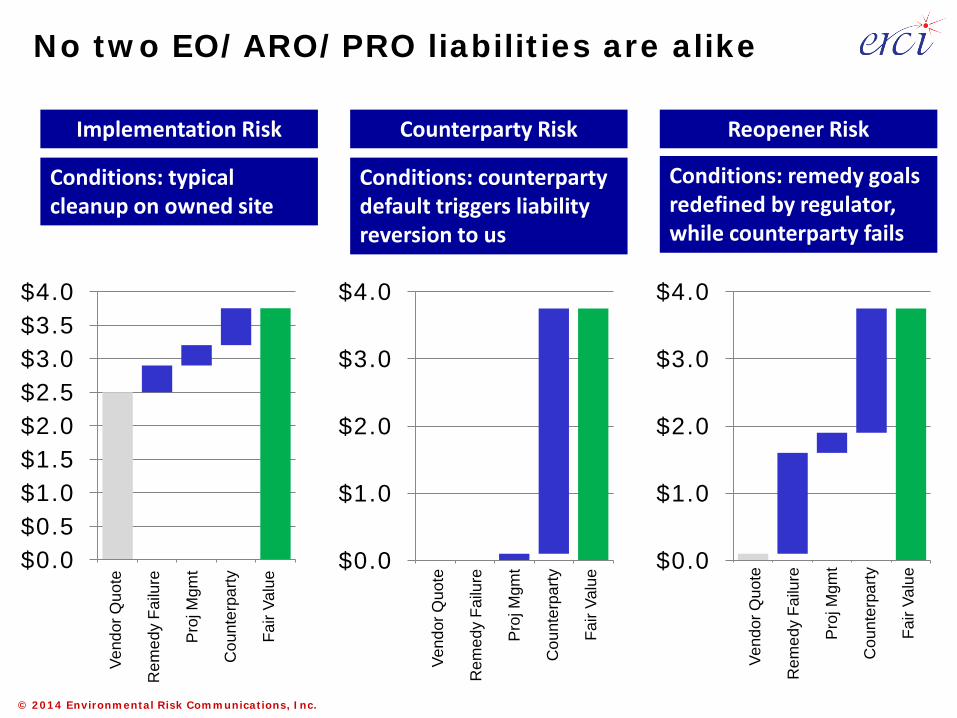
No two EO/ARO/PRO liabilities are alike
$0.0$0.5$1.0$1.5$2.0$2.5$3.0$3.5$4.0
$0.0
$1.0
$2.0
$3.0
$4.0
1 2 3 4 5 $0.0
$1.0
$2.0
$3.0
$4.0
1 2 3 4 5
Implementation Risk Counterparty Risk Reopener Risk
Conditions: typical cleanup on owned site
Conditions: counterparty default triggers liability reversion to us
Conditions: remedy goals redefined by regulator, while counterparty fails
Vend
or Q
uote
Rem
edy
Failu
re
Proj
Mgm
t
Cou
nter
party
Fair
Valu
e
Vend
or Q
uote
Rem
edy
Failu
re
Proj
Mgm
t
Cou
nter
party
Fair
Valu
e
Vend
or Q
uote
Rem
edy
Failu
re
Proj
Mgm
t
Cou
nter
party
Fair
Valu
e
© 2014 Environmental Risk Communications, Inc.
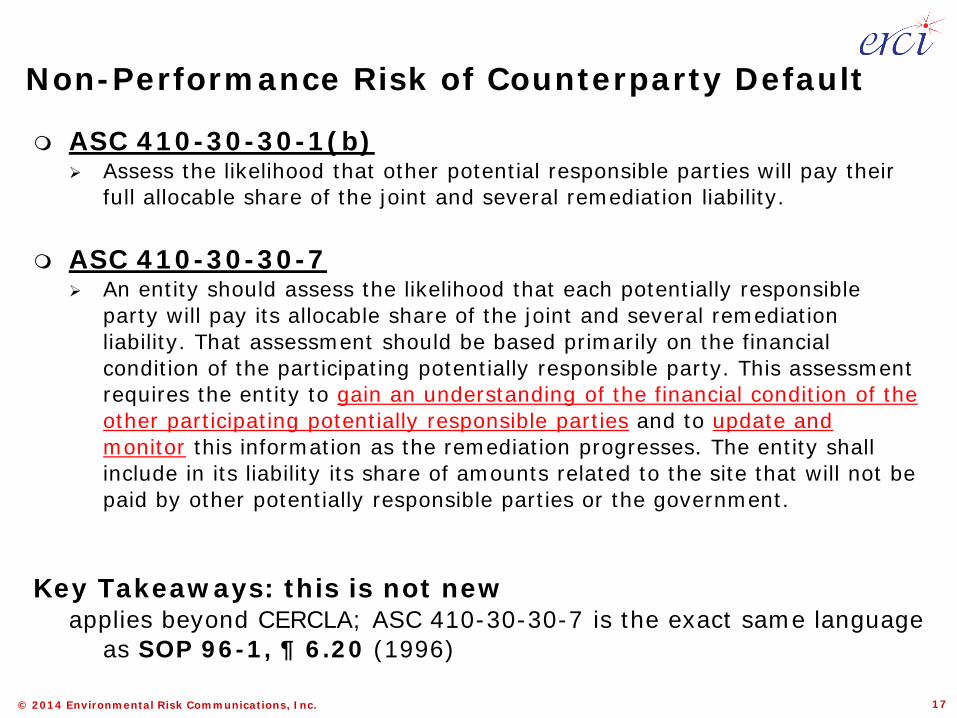
Non-Performance Risk of Counterparty Default
ASC 410-30-30-1(b) Assess the likelihood that other potential responsible parties will pay their
full allocable share of the joint and several remediation liability.
ASC 410-30-30-7 An entity should assess the likelihood that each potentially responsible
party will pay its allocable share of the joint and several remediation liability. That assessment should be based primarily on the financial condition of the participating potentially responsible party. This assessment requires the entity to gain an understanding of the financial condition of the other participating potentially responsible parties and to update and monitor this information as the remediation progresses. The entity shall include in its liability its share of amounts related to the site that will not be paid by other potentially responsible parties or the government.
Key Takeaways: this is not newapplies beyond CERCLA; ASC 410-30-30-7 is the exact same language
as SOP 96-1, ¶ 6.20 (1996)
17
© 2014 Environmental Risk Communications, Inc.
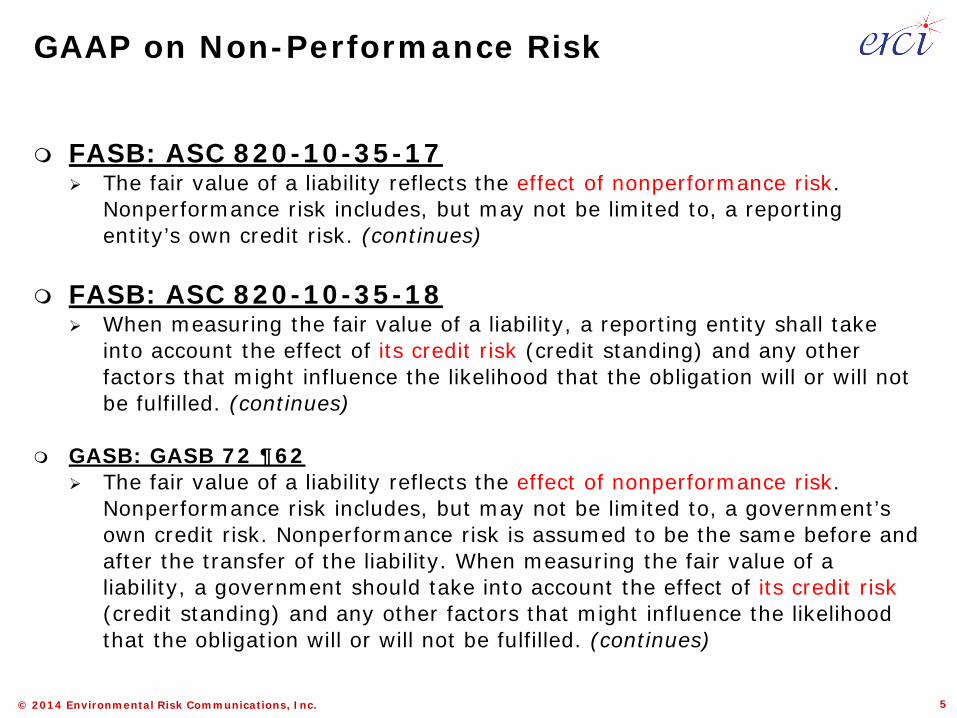
FASB: ASC 820-10-35-17 The fair value of a liability reflects the effect of nonperformance risk.
Nonperformance risk includes, but may not be limited to, a reporting entity’s own credit risk. (continues)
FASB: ASC 820-10-35-18 When measuring the fair value of a liability, a reporting entity shall take
into account the effect of its credit risk (credit standing) and any other factors that might influence the likelihood that the obligation will or will not be fulfilled. (continues)
GASB: GASB 72 ¶62 The fair value of a liability reflects the effect of nonperformance risk.
Nonperformance risk includes, but may not be limited to, a government’s own credit risk. Nonperformance risk is assumed to be the same before and after the transfer of the liability. When measuring the fair value of a liability, a government should take into account the effect of its credit risk (credit standing) and any other factors that might influence the likelihood that the obligation will or will not be fulfilled. (continues)
GAAP on Non-Performance Risk
5
© 2014 Environmental Risk Communications, Inc.
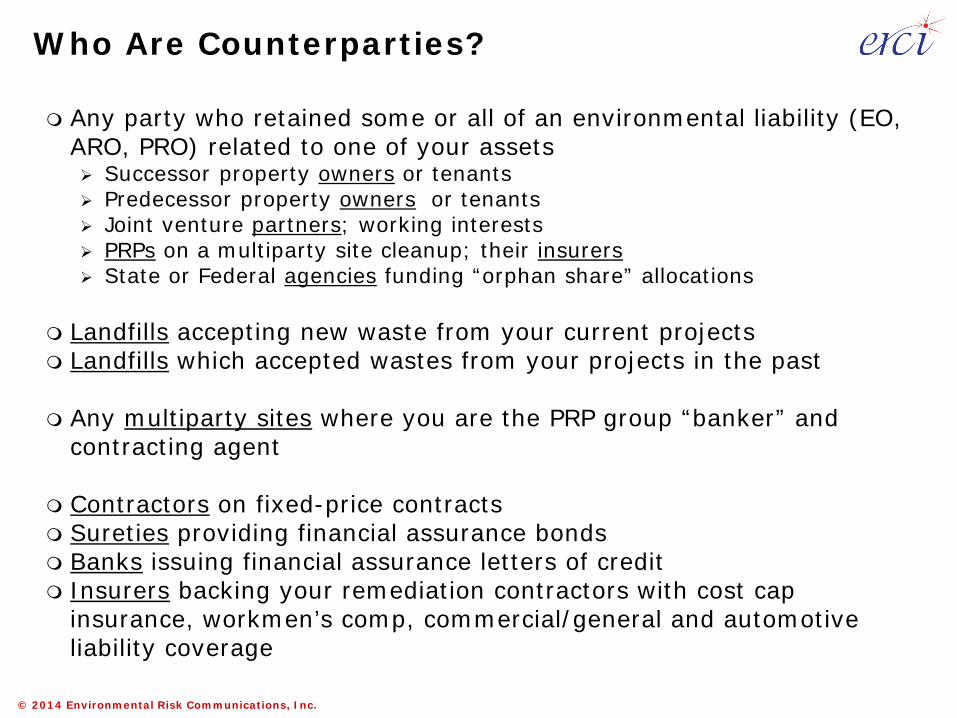
Who Are Counterparties?
Any party who retained some or all of an environmental liability (EO, ARO, PRO) related to one of your assets Successor property owners or tenants Predecessor property owners or tenants Joint venture partners; working interests PRPs on a multiparty site cleanup; their insurers State or Federal agencies funding “orphan share” allocations
Landfills accepting new waste from your current projects Landfills which accepted wastes from your projects in the past
Any multiparty sites where you are the PRP group “banker” and contracting agent
Contractors on fixed-price contracts Sureties providing financial assurance bonds Banks issuing financial assurance letters of credit Insurers backing your remediation contractors with cost cap
insurance, workmen’s comp, commercial/general and automotive liability coverage
© 2014 Environmental Risk Communications, Inc.
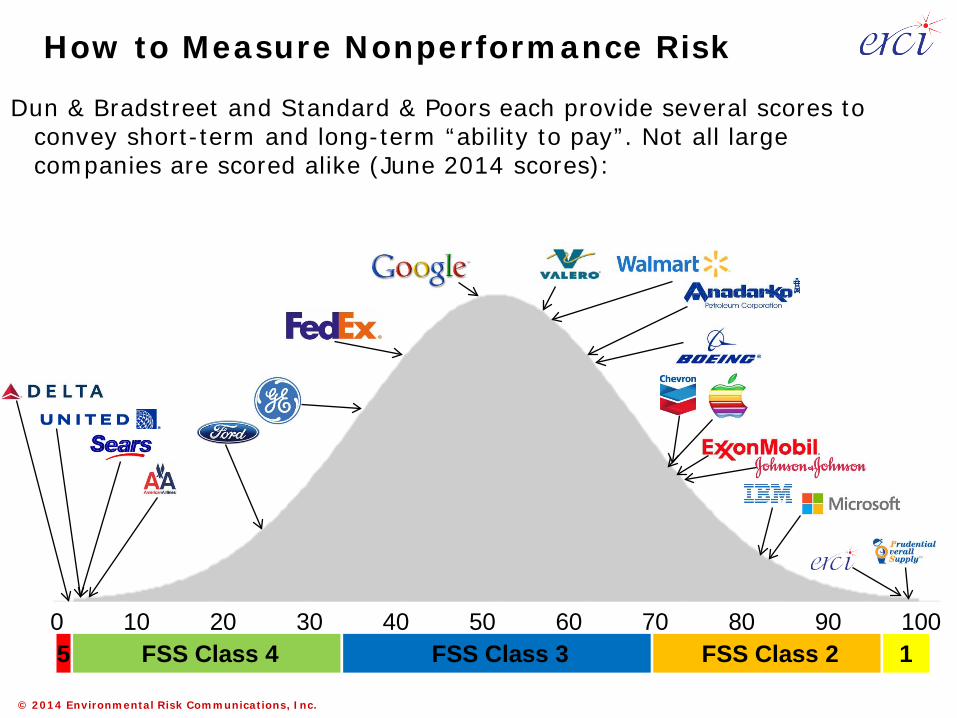
How to Measure Nonperformance Risk
Dun & Bradstreet and Standard & Poors each provide several scores to convey short-term and long-term “ability to pay”. Not all large companies are scored alike (June 2014 scores):
0 10 20 30 40 50 60 70 80 90 1001 FSS Class 2FSS Class 3FSS Class 45
© 2014 Environmental Risk Communications, Inc.
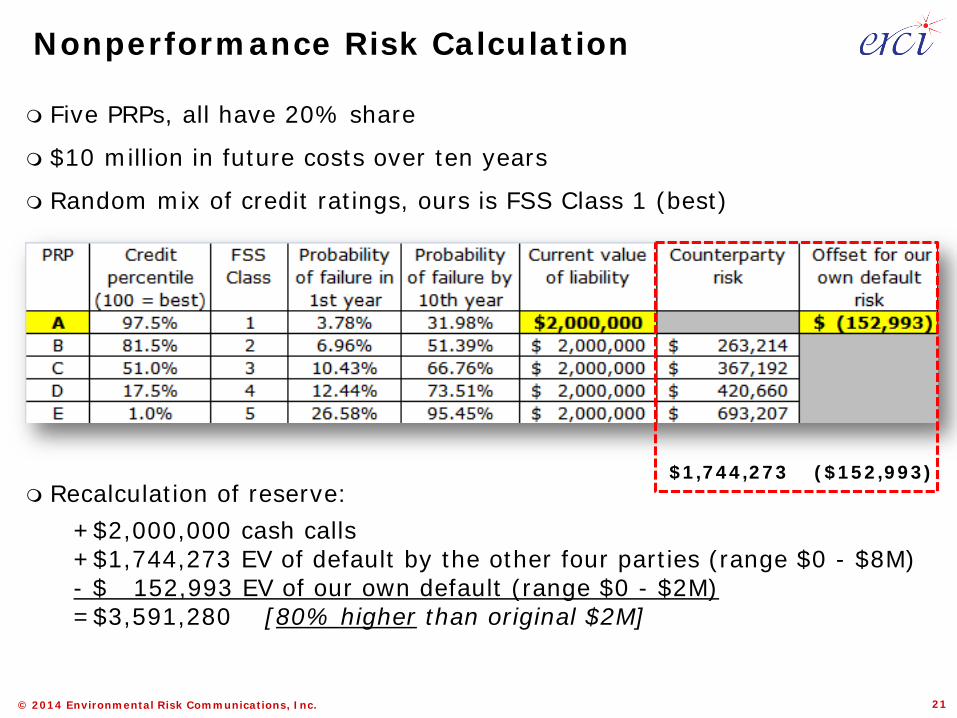
Nonperformance Risk Calculation
Five PRPs, all have 20% share
$10 million in future costs over ten years
Random mix of credit ratings, ours is FSS Class 1 (best)
Recalculation of reserve:+$2,000,000 cash calls+$1,744,273 EV of default by the other four parties (range $0 - $8M)- $ 152,993 EV of our own default (range $0 - $2M)=$3,591,280 [80% higher than original $2M]
$1,744,273 ($152,993)
21
© 2014 Environmental Risk Communications, Inc.
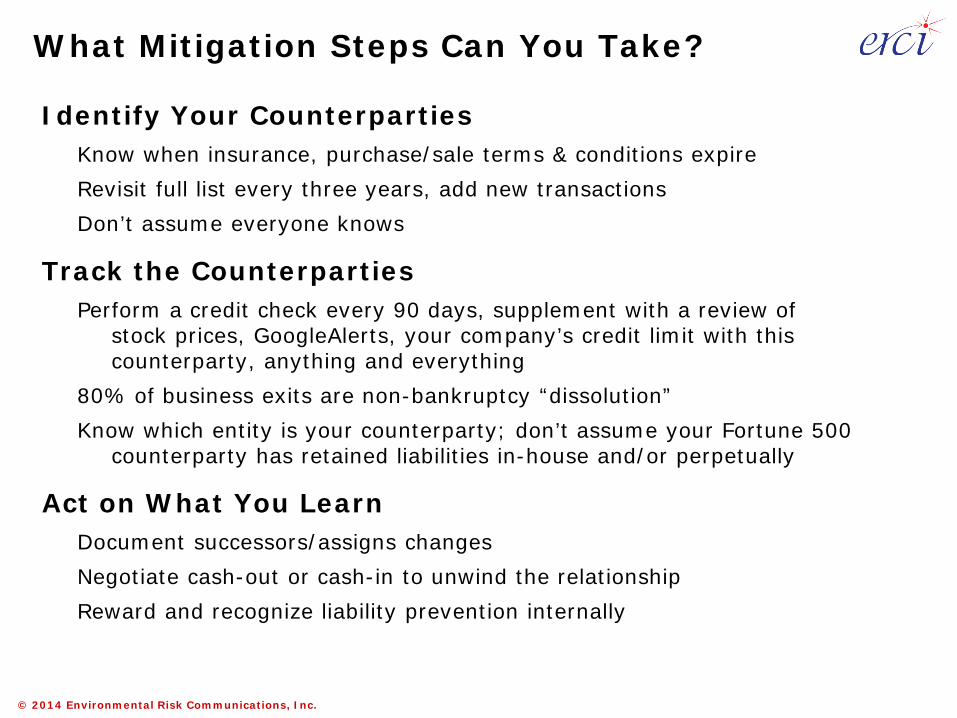
What Mitigation Steps Can You Take?
Identify Your CounterpartiesKnow when insurance, purchase/sale terms & conditions expireRevisit full list every three years, add new transactionsDon’t assume everyone knows
Track the CounterpartiesPerform a credit check every 90 days, supplement with a review of
stock prices, GoogleAlerts, your company’s credit limit with this counterparty, anything and everything
80% of business exits are non-bankruptcy “dissolution”Know which entity is your counterparty; don’t assume your Fortune 500
counterparty has retained liabilities in-house and/or perpetually
Act on What You LearnDocument successors/assigns changesNegotiate cash-out or cash-in to unwind the relationshipReward and recognize liability prevention internally
© 2014 Environmental Risk Communications, Inc.
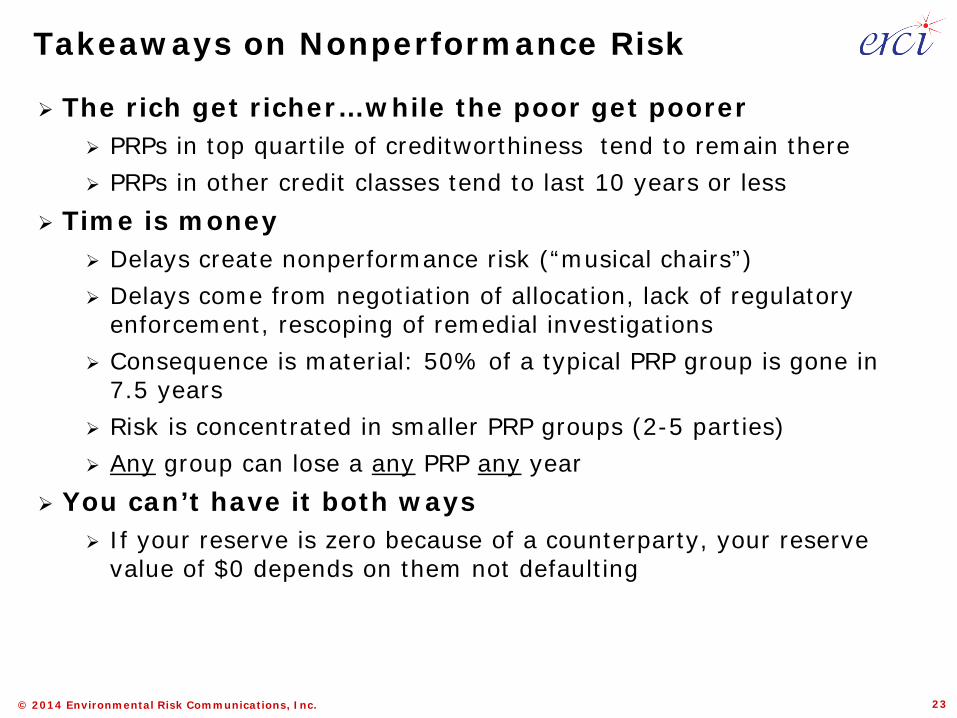
Takeaways on Nonperformance Risk
The rich get richer…while the poor get poorer PRPs in top quartile of creditworthiness tend to remain there PRPs in other credit classes tend to last 10 years or less
Time is money Delays create nonperformance risk (“musical chairs”) Delays come from negotiation of allocation, lack of regulatory
enforcement, rescoping of remedial investigations Consequence is material: 50% of a typical PRP group is gone in
7.5 years Risk is concentrated in smaller PRP groups (2-5 parties) Any group can lose a any PRP any year
You can’t have it both ways If your reserve is zero because of a counterparty, your reserve
value of $0 depends on them not defaulting
23
© 2014 Environmental Risk Communications, Inc.
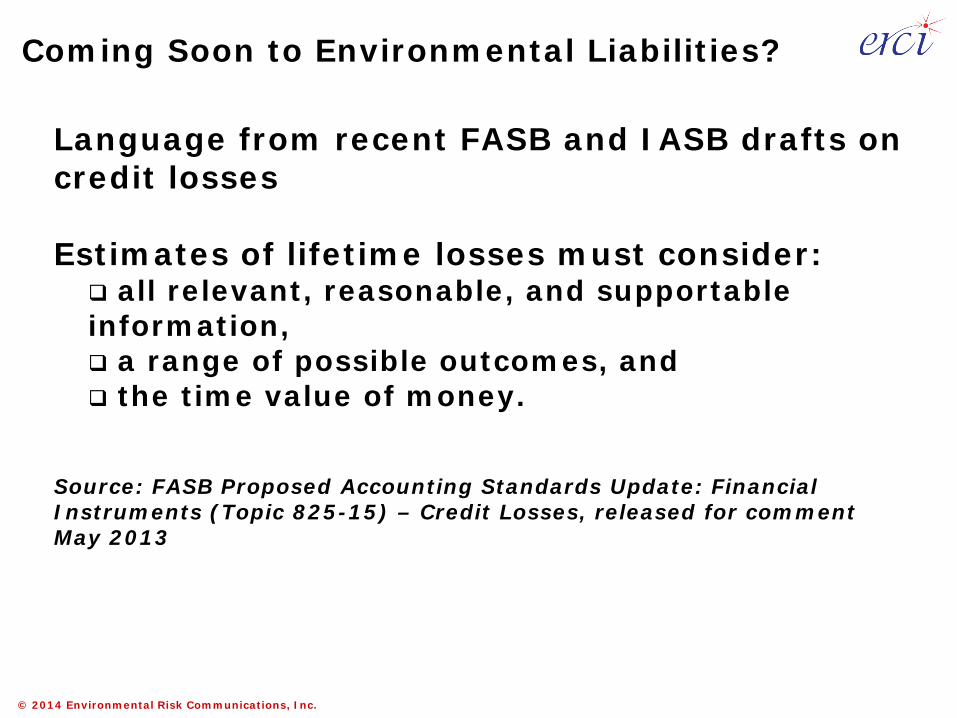
Coming Soon to Environmental Liabilities?
Language from recent FASB and IASB drafts on credit losses
Estimates of lifetime losses must consider: all relevant, reasonable, and supportable information, a range of possible outcomes, and the time value of money.
Source: FASB Proposed Accounting Standards Update: Financial Instruments (Topic 825-15) – Credit Losses, released for comment May 2013
© 2014 Environmental Risk Communications, Inc.
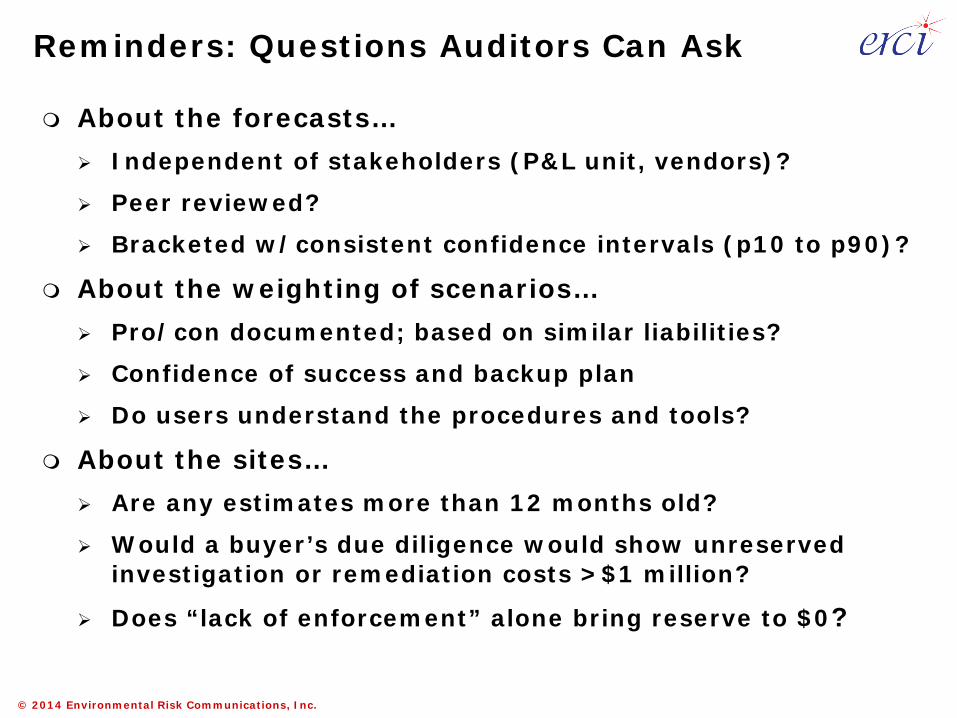
Reminders: Questions Auditors Can Ask
About the forecasts… Independent of stakeholders (P&L unit, vendors)?
Peer reviewed?
Bracketed w/consistent confidence intervals (p10 to p90)?
About the weighting of scenarios… Pro/con documented; based on similar liabilities?
Confidence of success and backup plan
Do users understand the procedures and tools?
About the sites… Are any estimates more than 12 months old?
Would a buyer’s due diligence would show unreserved investigation or remediation costs >$1 million?
Does “lack of enforcement” alone bring reserve to $0?
© 2014 Environmental Risk Communications, Inc.
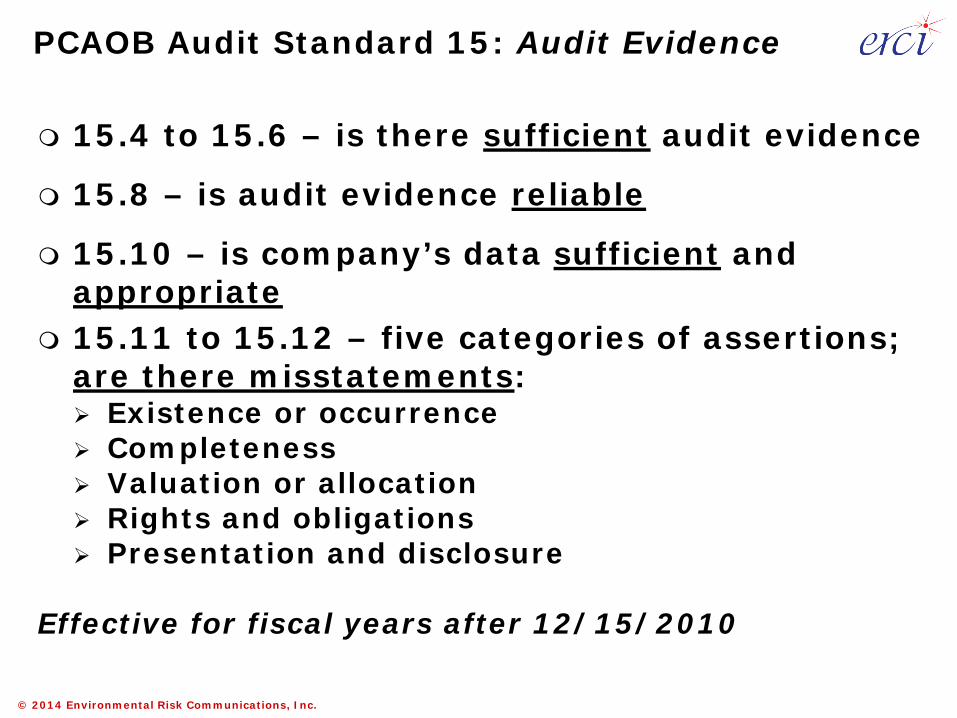
PCAOB Audit Standard 15: Audit Evidence
15.4 to 15.6 – is there sufficient audit evidence
15.8 – is audit evidence reliable
15.10 – is company’s data sufficient and appropriate
15.11 to 15.12 – five categories of assertions; are there misstatements: Existence or occurrence Completeness Valuation or allocation Rights and obligations Presentation and disclosure
Effective for fiscal years after 12/15/2010
© 2014 Environmental Risk Communications, Inc.
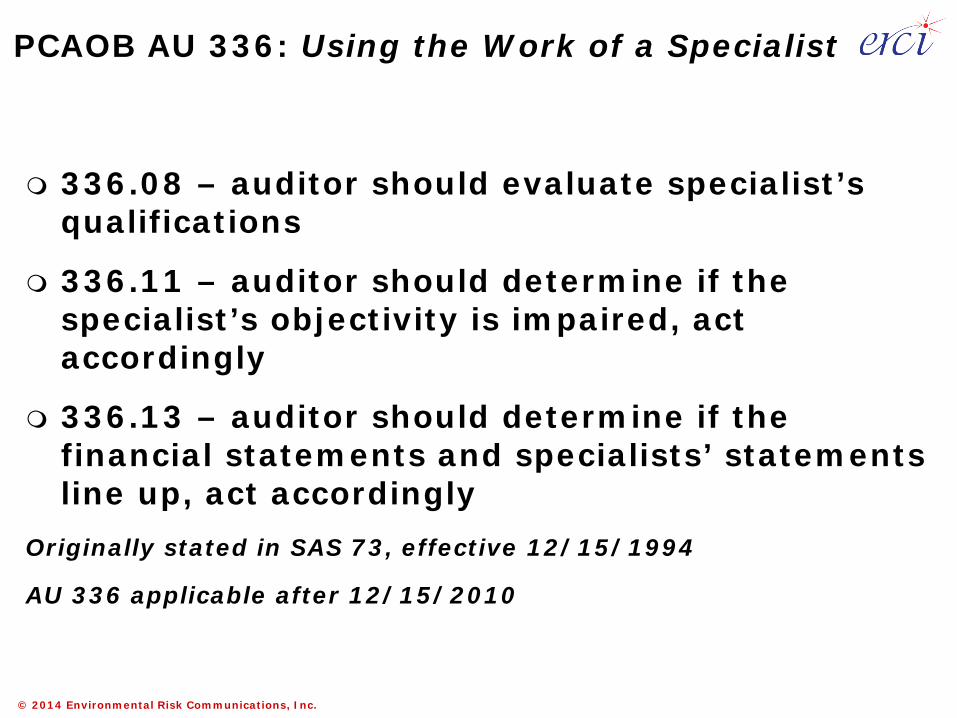
PCAOB AU 336: Using the Work of a Specialist
336.08 – auditor should evaluate specialist’s qualifications
336.11 – auditor should determine if the specialist’s objectivity is impaired, act accordingly
336.13 – auditor should determine if the financial statements and specialists’ statements line up, act accordingly
Originally stated in SAS 73, effective 12/15/1994
AU 336 applicable after 12/15/2010
© 2014 Environmental Risk Communications, Inc.
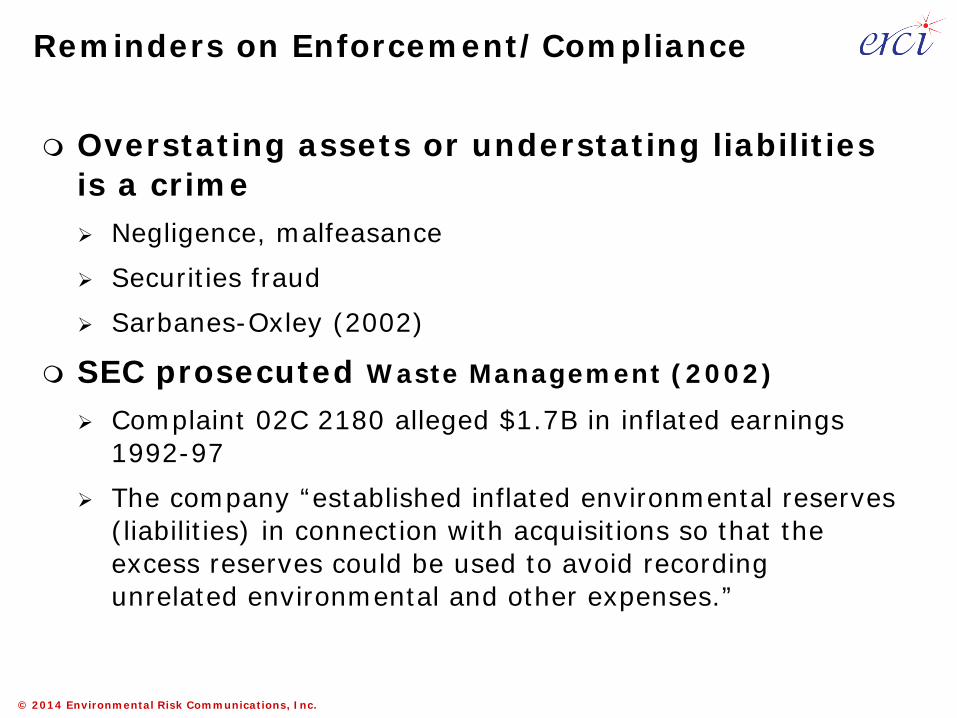
Reminders on Enforcement/Compliance
Overstating assets or understating liabilities is a crime Negligence, malfeasance Securities fraud Sarbanes-Oxley (2002)
SEC prosecuted Waste Management (2002)
Complaint 02C 2180 alleged $1.7B in inflated earnings 1992-97
The company “established inflated environmental reserves (liabilities) in connection with acquisitions so that the excess reserves could be used to avoid recording unrelated environmental and other expenses.”
© 2014 Environmental Risk Communications, Inc.
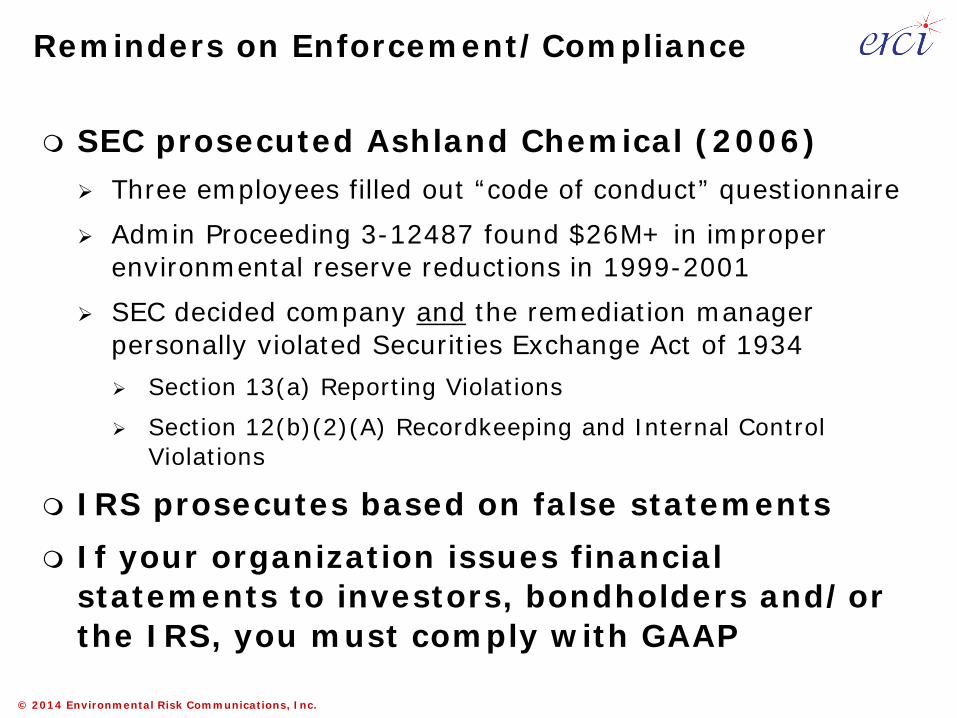
Reminders on Enforcement/Compliance
SEC prosecuted Ashland Chemical (2006) Three employees filled out “code of conduct” questionnaire Admin Proceeding 3-12487 found $26M+ in improper
environmental reserve reductions in 1999-2001 SEC decided company and the remediation manager
personally violated Securities Exchange Act of 1934 Section 13(a) Reporting Violations Section 12(b)(2)(A) Recordkeeping and Internal Control
Violations
IRS prosecutes based on false statements If your organization issues financial
statements to investors, bondholders and/or the IRS, you must comply with GAAP
© 2014 Environmental Risk Communications, Inc.
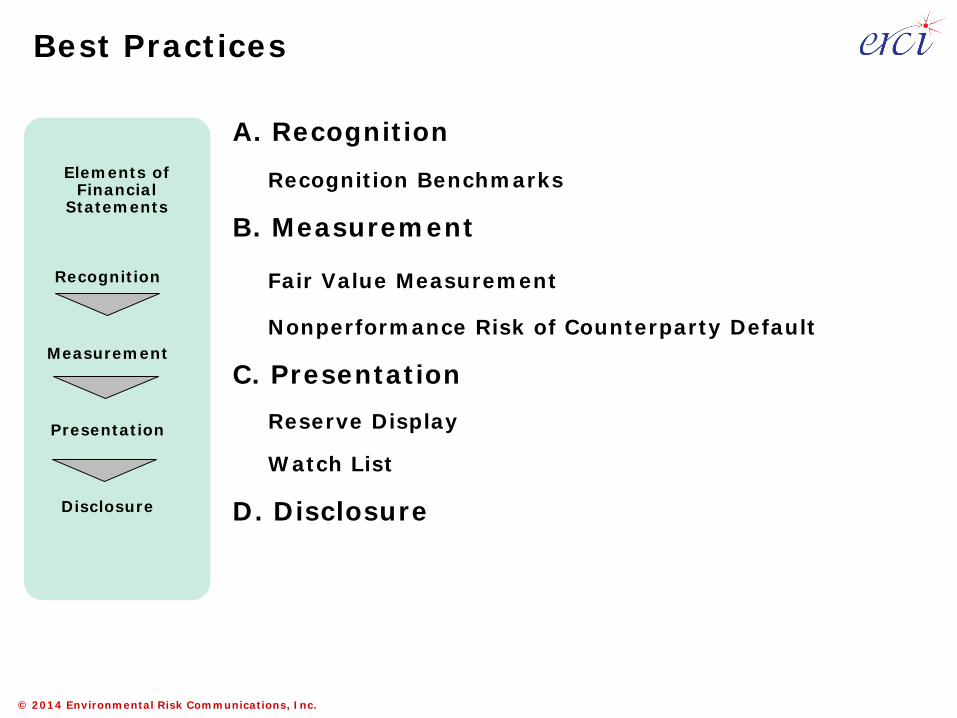
Best Practices
A. Recognition
Recognition Benchmarks
B. Measurement
Fair Value Measurement
Nonperformance Risk of Counterparty Default
C. PresentationReserve Display
Watch List
D. Disclosure
Elements of Financial
Statements
Recognition
Measurement
Presentation
Disclosure
© 2014 Environmental Risk Communications, Inc.
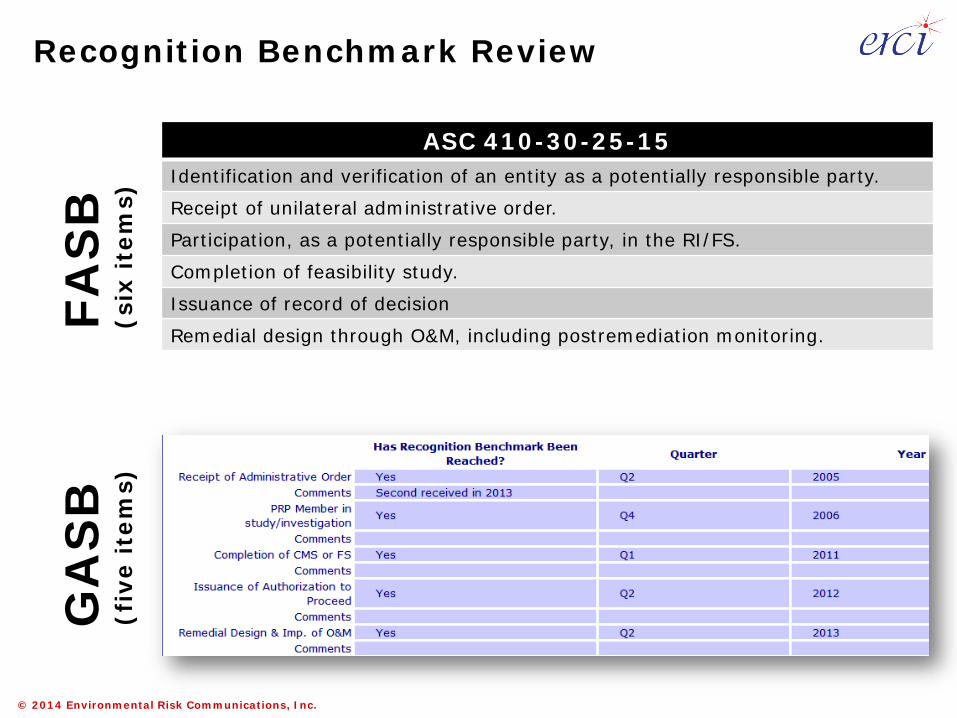
Recognition Benchmark Review
ASC 410-30-25-15Identification and verification of an entity as a potentially responsible party.
Receipt of unilateral administrative order.
Participation, as a potentially responsible party, in the RI/FS.
Completion of feasibility study.
Issuance of record of decision
Remedial design through O&M, including postremediation monitoring.
FAS
B
(six
item
s)G
AS
B
(fiv
e it
ems)
© 2014 Environmental Risk Communications, Inc.
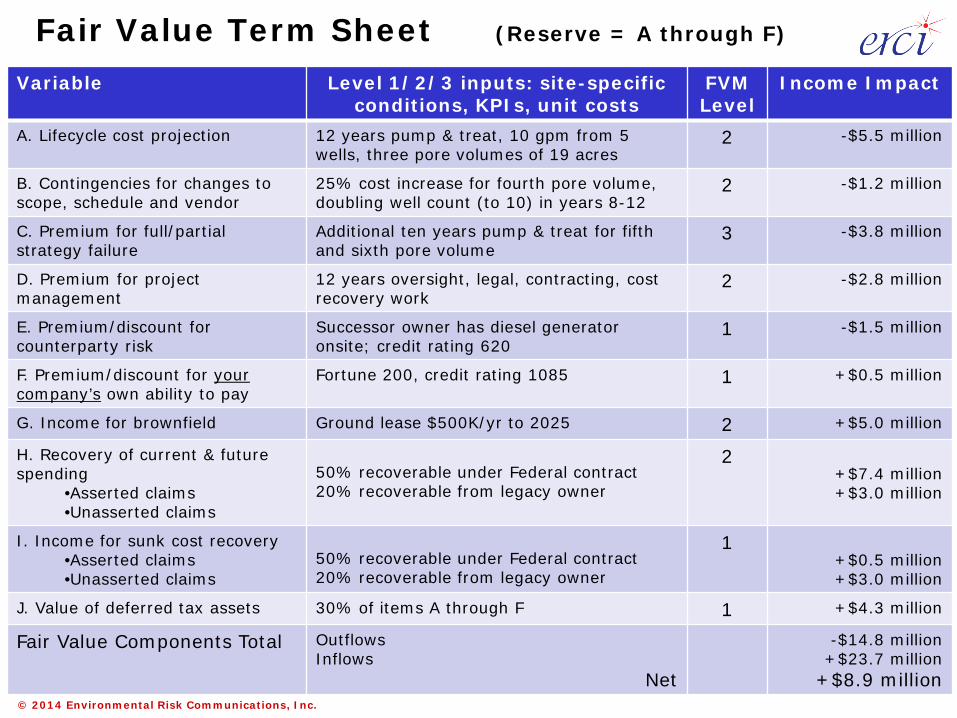
Fair Value Term Sheet (Reserve = A through F)
Variable Level 1/2/3 inputs: site-specific conditions, KPIs, unit costs
FVM Level
Income Impact
A. Lifecycle cost projection 12 years pump & treat, 10 gpm from 5 wells, three pore volumes of 19 acres
2 -$5.5 million
B. Contingencies for changes to scope, schedule and vendor
25% cost increase for fourth pore volume, doubling well count (to 10) in years 8-12
2 -$1.2 million
C. Premium for full/partial strategy failure
Additional ten years pump & treat for fifth and sixth pore volume
3 -$3.8 million
D. Premium for project management
12 years oversight, legal, contracting, cost recovery work
2 -$2.8 million
E. Premium/discount for counterparty risk
Successor owner has diesel generator onsite; credit rating 620
1 -$1.5 million
F. Premium/discount for your company’s own ability to pay
Fortune 200, credit rating 1085 1 +$0.5 million
G. Income for brownfield Ground lease $500K/yr to 2025 2 +$5.0 million
H. Recovery of current & future spending
•Asserted claims•Unasserted claims
50% recoverable under Federal contract20% recoverable from legacy owner
2+$7.4 million+$3.0 million
I. Income for sunk cost recovery•Asserted claims•Unasserted claims
50% recoverable under Federal contract20% recoverable from legacy owner
1+$0.5 million+$3.0 million
J. Value of deferred tax assets 30% of items A through F 1 +$4.3 million
Fair Value Components Total OutflowsInflows
Net
-$14.8 million+$23.7 million
+$8.9 million
© 2014 Environmental Risk Communications, Inc.
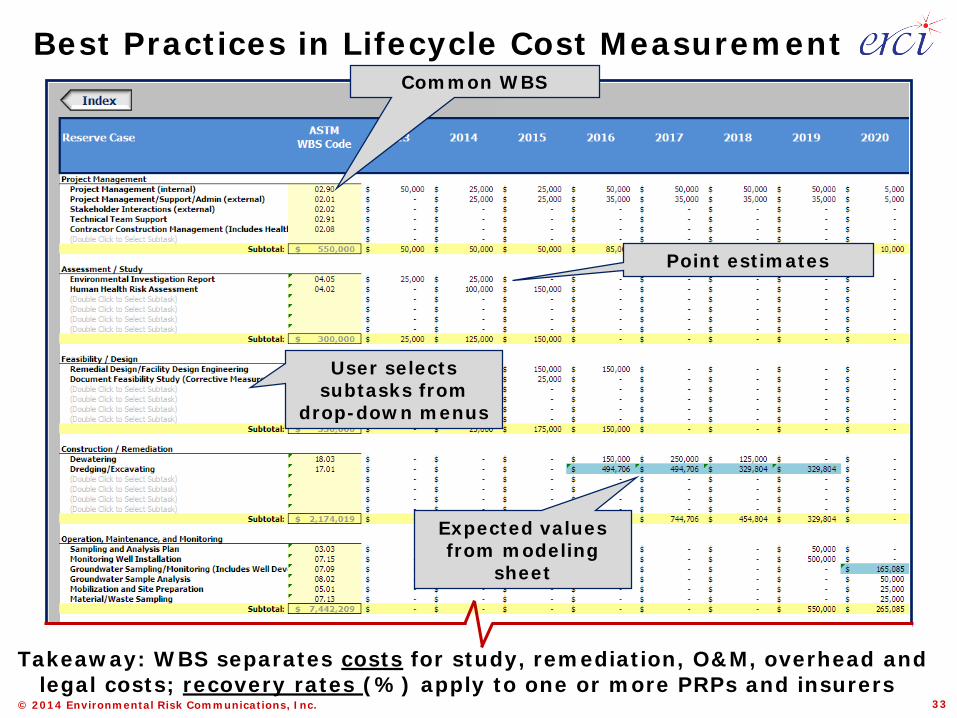
Best Practices in Lifecycle Cost Measurement
Point estimates
Expected values from modeling
sheet
User selects subtasks from
drop-down menus
Common WBS
Takeaway: WBS separates costs for study, remediation, O&M, overhead and legal costs; recovery rates (%) apply to one or more PRPs and insurers
33
© 2014 Environmental Risk Communications, Inc.
Best Practices in Measurement, Display
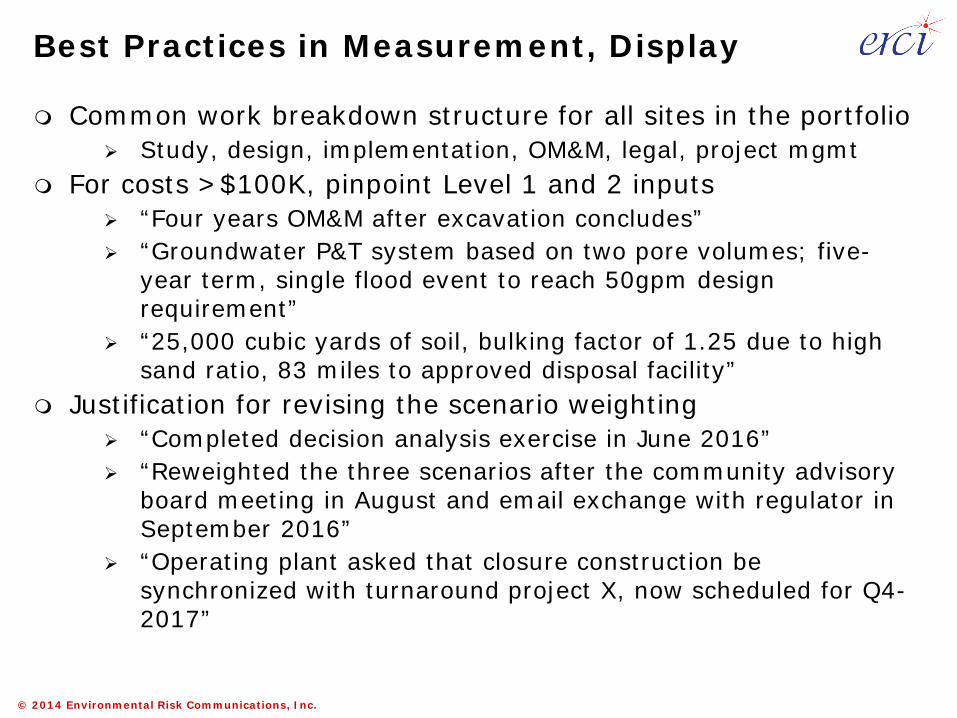
Common work breakdown structure for all sites in the portfolio Study, design, implementation, OM&M, legal, project mgmt
For costs >$100K, pinpoint Level 1 and 2 inputs “Four years OM&M after excavation concludes” “Groundwater P&T system based on two pore volumes; five-
year term, single flood event to reach 50gpm design requirement”
“25,000 cubic yards of soil, bulking factor of 1.25 due to high sand ratio, 83 miles to approved disposal facility”
Justification for revising the scenario weighting “Completed decision analysis exercise in June 2016” “Reweighted the three scenarios after the community advisory
board meeting in August and email exchange with regulator in September 2016”
“Operating plant asked that closure construction be synchronized with turnaround project X, now scheduled for Q4-2017”
© 2014 Environmental Risk Communications, Inc.
Capitalizing Liability Spending
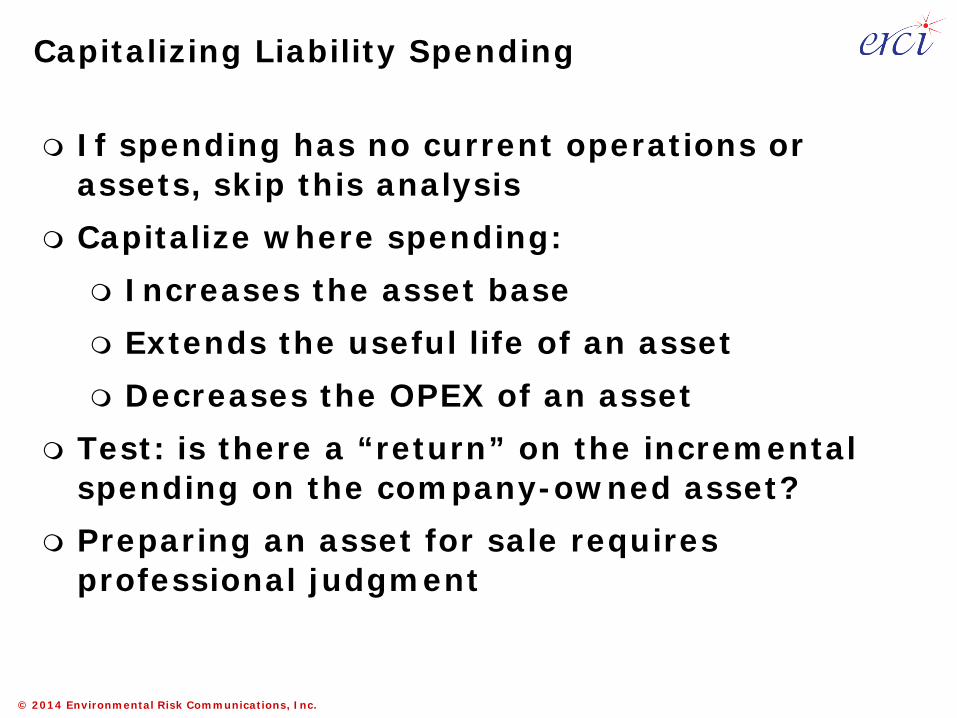
If spending has no current operations or assets, skip this analysis
Capitalize where spending: Increases the asset base Extends the useful life of an asset Decreases the OPEX of an asset
Test: is there a “return” on the incremental spending on the company-owned asset?
Preparing an asset for sale requires professional judgment
© 2014 Environmental Risk Communications, Inc.
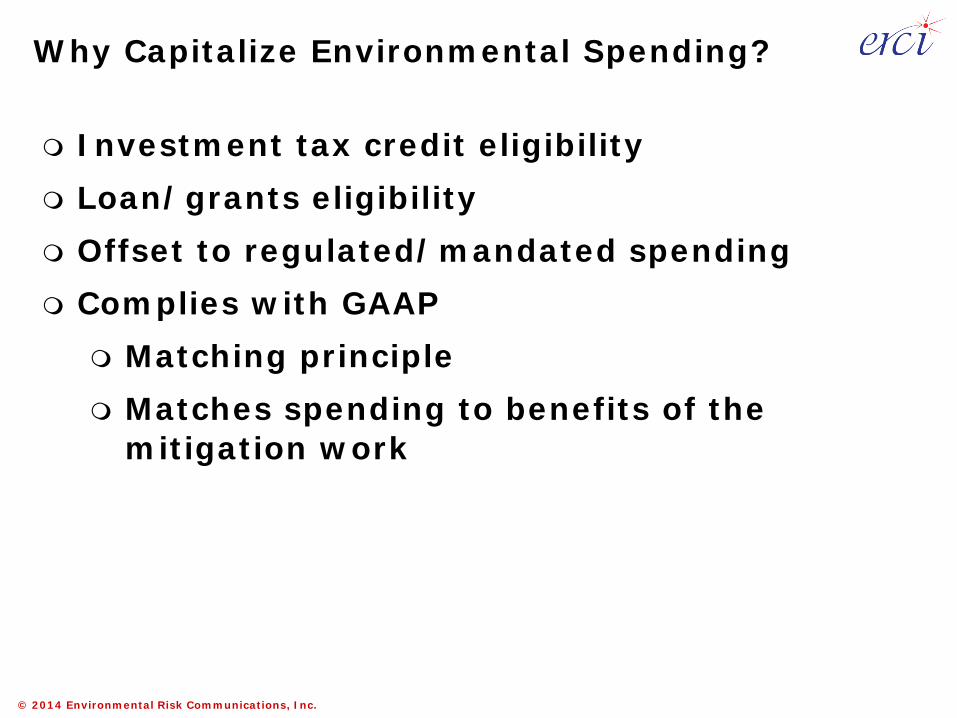
Why Capitalize Environmental Spending?
Investment tax credit eligibility Loan/grants eligibility Offset to regulated/mandated spending Complies with GAAP
Matching principle Matches spending to benefits of the
mitigation work
© 2014 Environmental Risk Communications, Inc.
Best Practices: Reserve DisplayEnvironmental Reserve 2014 2013 2012
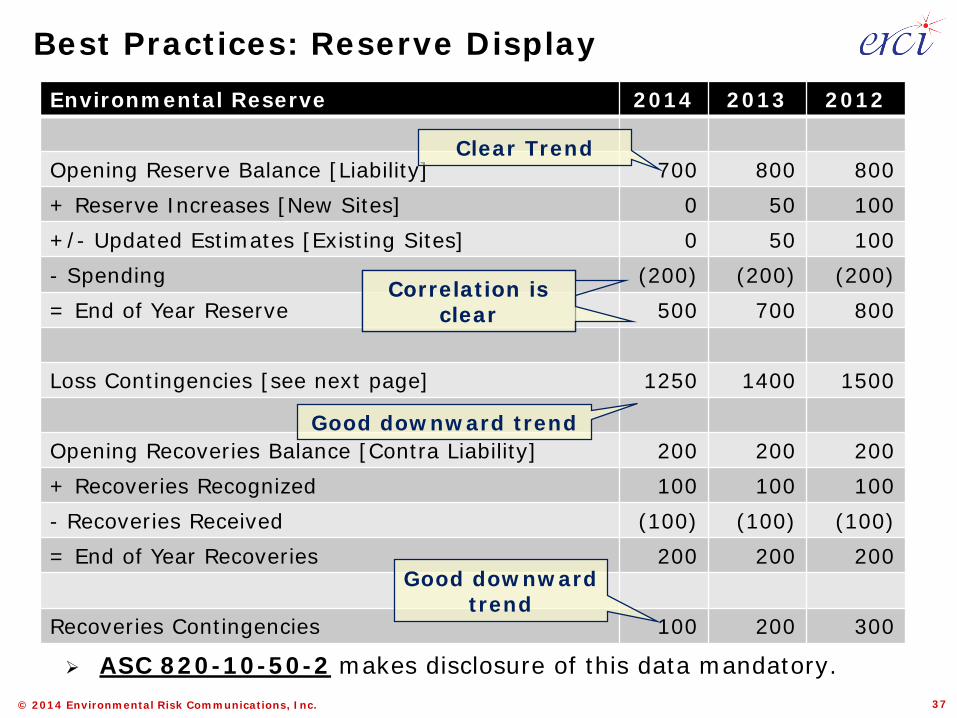
Opening Reserve Balance [Liability] 700 800 800+ Reserve Increases [New Sites] 0 50 100+/- Updated Estimates [Existing Sites] 0 50 100- Spending (200) (200) (200)= End of Year Reserve 500 700 800
Loss Contingencies [see next page] 1250 1400 1500
Opening Recoveries Balance [Contra Liability] 200 200 200+ Recoveries Recognized 100 100 100- Recoveries Received (100) (100) (100)= End of Year Recoveries 200 200 200
Recoveries Contingencies 100 200 300
Clear Trend
Correlation is clear
Correlation is clear
Good downward trend
Good downward trend
ASC 820-10-50-2 makes disclosure of this data mandatory.37
© 2014 Environmental Risk Communications, Inc.
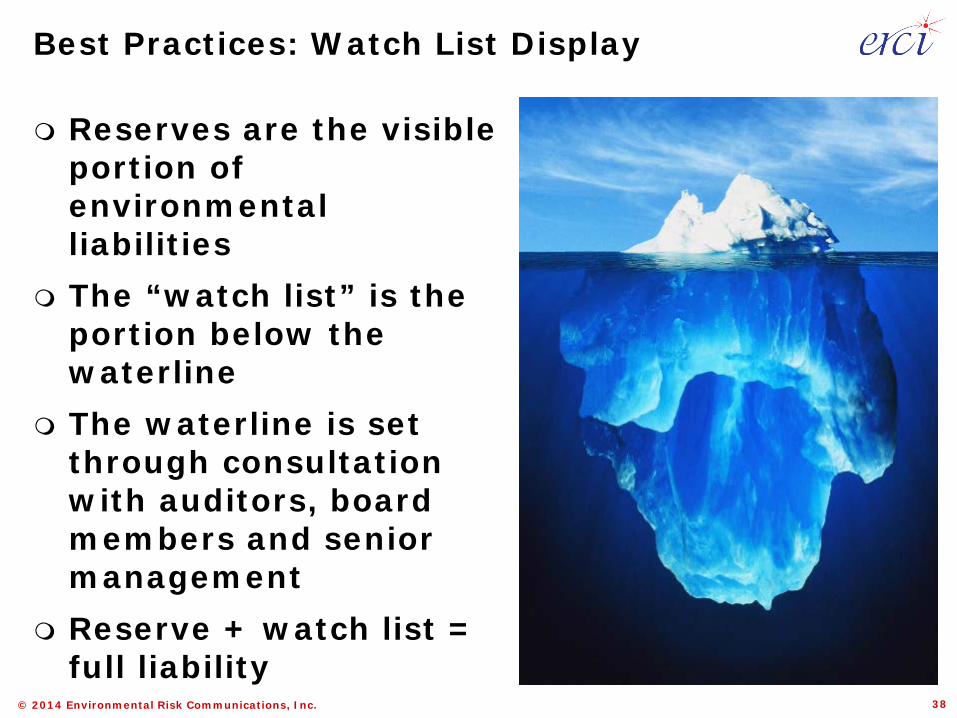
Best Practices: Watch List Display
Reserves are the visible portion of environmental liabilities
The “watch list” is the portion below the waterline
The waterline is set through consultation with auditors, board members and senior management
Reserve + watch list = full liability
38
© 2014 Environmental Risk Communications, Inc.
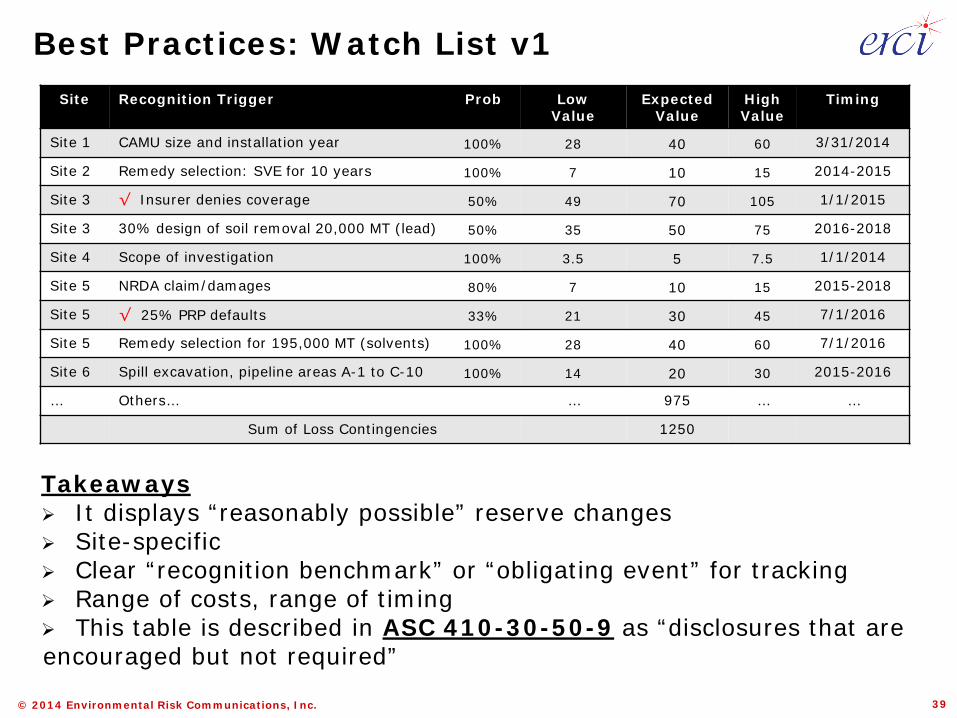
Site Recognition Trigger Prob Low Value
Expected Value
HighValue
Timing
Site 1 CAMU size and installation year 100% 28 40 60 3/31/2014
Site 2 Remedy selection: SVE for 10 years 100% 7 10 15 2014-2015
Site 3 √ Insurer denies coverage 50% 49 70 105 1/1/2015
Site 3 30% design of soil removal 20,000 MT (lead) 50% 35 50 75 2016-2018
Site 4 Scope of investigation 100% 3.5 5 7.5 1/1/2014
Site 5 NRDA claim/damages 80% 7 10 15 2015-2018
Site 5 √ 25% PRP defaults 33% 21 30 45 7/1/2016
Site 5 Remedy selection for 195,000 MT (solvents) 100% 28 40 60 7/1/2016
Site 6 Spill excavation, pipeline areas A-1 to C-10 100% 14 20 30 2015-2016
… Others… … 975 … …
Sum of Loss Contingencies 1250
Best Practices: Watch List v1
Takeaways It displays “reasonably possible” reserve changes Site-specific Clear “recognition benchmark” or “obligating event” for tracking Range of costs, range of timing This table is described in ASC 410-30-50-9 as “disclosures that are encouraged but not required”
39
© 2014 Environmental Risk Communications, Inc.
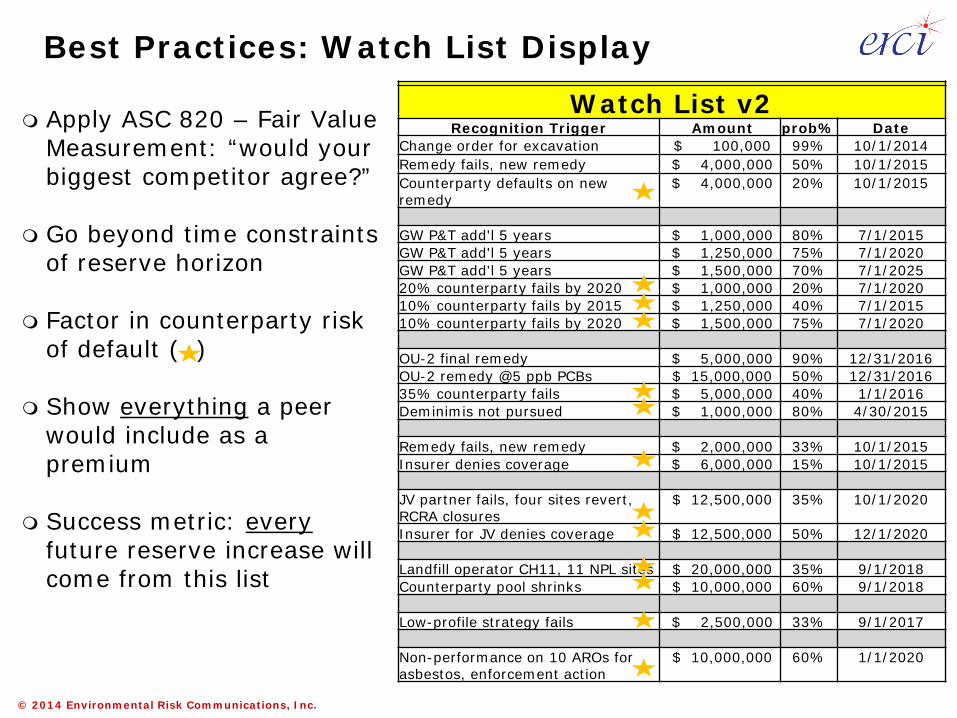
Best Practices: Watch List Display
Watch List v2Recognition Trigger Amount prob% Date
Change order for excavation $ 100,000 99% 10/1/2014Remedy fails, new remedy $ 4,000,000 50% 10/1/2015Counterparty defaults on new remedy
$ 4,000,000 20% 10/1/2015
GW P&T add'l 5 years $ 1,000,000 80% 7/1/2015GW P&T add'l 5 years $ 1,250,000 75% 7/1/2020GW P&T add'l 5 years $ 1,500,000 70% 7/1/202520% counterparty fails by 2020 $ 1,000,000 20% 7/1/202010% counterparty fails by 2015 $ 1,250,000 40% 7/1/201510% counterparty fails by 2020 $ 1,500,000 75% 7/1/2020
OU-2 final remedy $ 5,000,000 90% 12/31/2016OU-2 remedy @5 ppb PCBs $ 15,000,000 50% 12/31/201635% counterparty fails $ 5,000,000 40% 1/1/2016Deminimis not pursued $ 1,000,000 80% 4/30/2015
Remedy fails, new remedy $ 2,000,000 33% 10/1/2015Insurer denies coverage $ 6,000,000 15% 10/1/2015
JV partner fails, four sites revert, RCRA closures
$ 12,500,000 35% 10/1/2020
Insurer for JV denies coverage $ 12,500,000 50% 12/1/2020
Landfill operator CH11, 11 NPL sites $ 20,000,000 35% 9/1/2018Counterparty pool shrinks $ 10,000,000 60% 9/1/2018
Low-profile strategy fails $ 2,500,000 33% 9/1/2017
Non-performance on 10 AROs for asbestos, enforcement action
$ 10,000,000 60% 1/1/2020
Apply ASC 820 – Fair Value Measurement: “would your biggest competitor agree?”
Go beyond time constraints of reserve horizon
Factor in counterparty risk of default ( )
Show everything a peer would include as a premium
Success metric: everyfuture reserve increase will come from this list
© 2014 Environmental Risk Communications, Inc.
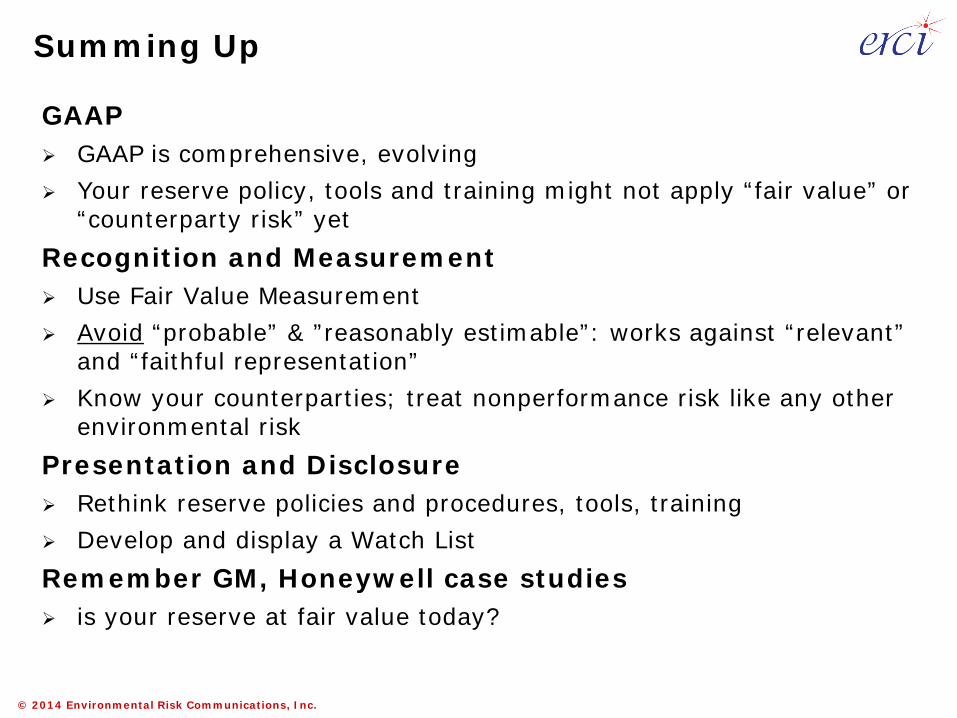
Summing Up
GAAP GAAP is comprehensive, evolving Your reserve policy, tools and training might not apply “fair value” or
“counterparty risk” yetRecognition and Measurement Use Fair Value Measurement Avoid “probable” & ”reasonably estimable”: works against “relevant”
and “faithful representation” Know your counterparties; treat nonperformance risk like any other
environmental riskPresentation and Disclosure Rethink reserve policies and procedures, tools, training Develop and display a Watch ListRemember GM, Honeywell case studies is your reserve at fair value today?
© 2014 Environmental Risk Communications, Inc.
Next Steps
Website: www.erci.com
LinkedIn Group, Facebook page, YouTube page
Email [email protected] Link to on-demand webinars @ YouTube (audio + video) PDF of this presentation (original PPTX format on request) Where to find ASC 410, GASB49, ASTM, IAS37
February 2015 webinars on Fair Value Measurement Estimating and Disclosing Environmental Liabilities Auditors Tough Questions on Environmental Liabilities
March 2015 webinars on Managing Nonperformance Risk of Environmental Counterparties Obstacles to Recognizing and Measuring Environmental Liabilities
42