Embed Size (px)
Citation preview

SHIFTING CARS/M2WS TO ACTIVE & PUBLIC TRANSPORTATION IN TAIWANAVOID, SHIFT, IMPROVED AND SHARE APPROACHES
Presenter Wayne Gao Ph.D

WHY GREEN TRANSPORTATION IS A TOP PRIORITY IN CLIMATE MITIGATION

OUTLINES OF PRESENTATION
1. Challenges in Shifting to Green and Active Mobility
2. Problems and Benefits of Shifting to Green/Active Mobility in Taiwan
3. Space for Cycling/Walking v.s Parking!!
4. What will happen if we succeed?
5. Conclusions

Strategic Building Blocks of Green Transportation & Climate Change
• ADVOCACY: Car Free Day & Zones and Car Free Government Car
Free Day• SHARED: Shared bike/E-bike/E-car Shared
Mobility
• IMPROVE: Better Public Transit; Electrification of vehicles
Better Public TransitElectrification
• SHFIT to Public Transit & Active Mobility Space 4 Walking Biking/Rollerblading
• AVOID: Transit-Oriented Development (TOD); Walk to schools/works
Compact & Resilient City

CO2 Emissions by Sectors in Taiwan The Growth of CO2 emission in Transportation
Blue: Growth of total trips
CO2 Emissions from Transportation will continue to soar to 2030 and beyond

UKUSA
Germany France
Taiwan

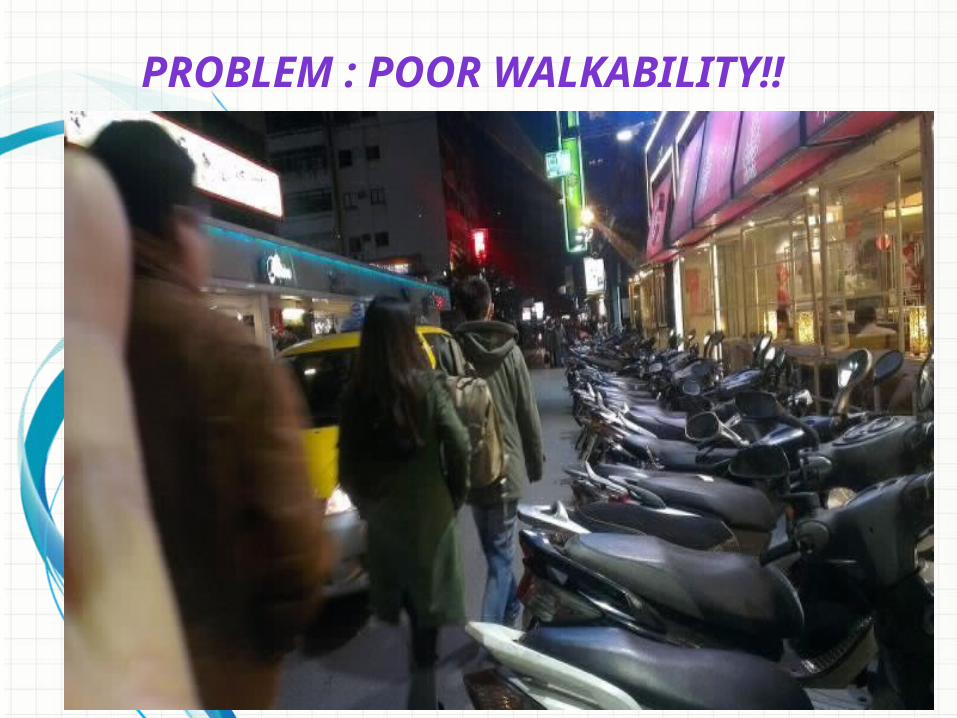
PROBLEM : POOR WALKABILITY!!
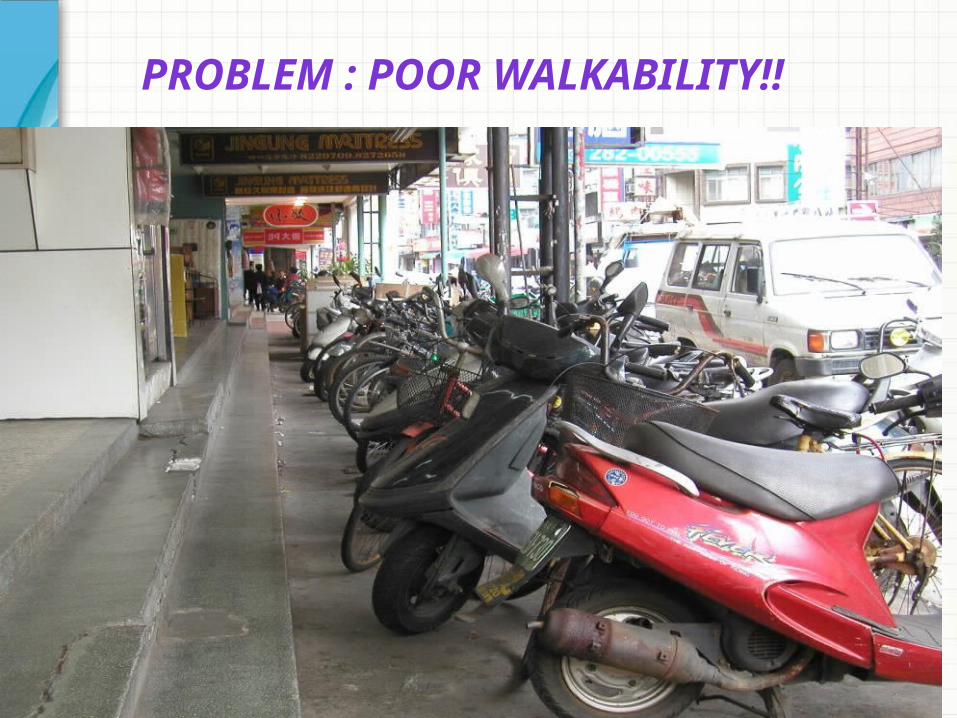
PROBLEM : POOR WALKABILITY!!

New Environment
PROBLEM : POOR WALKABILITY!!

New Colleagues

PROBLEM : POOR WALKABILITY!!
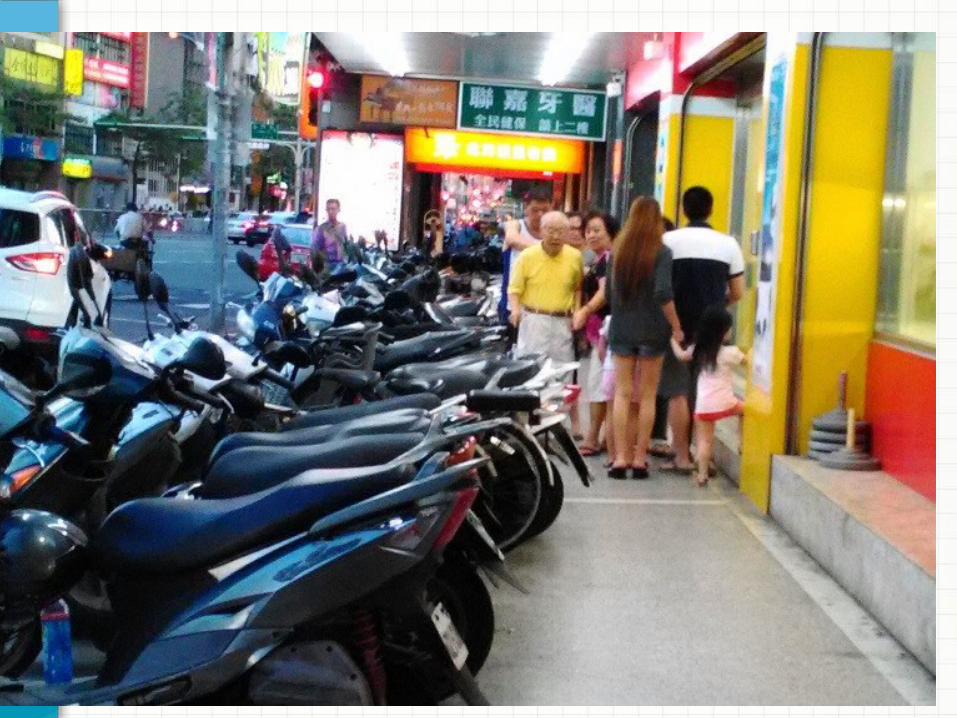
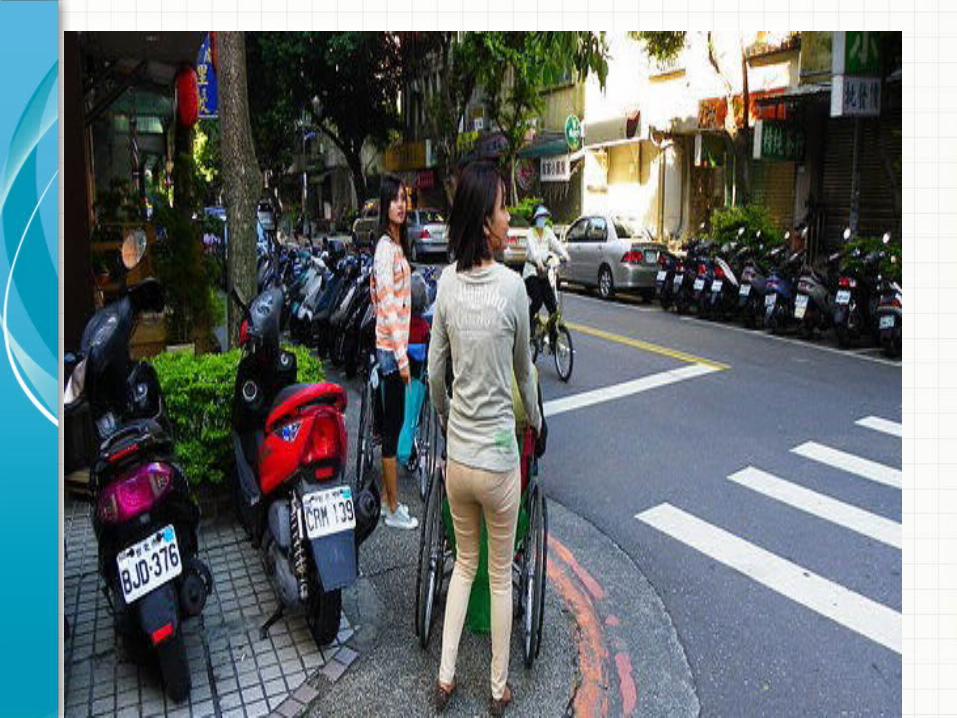


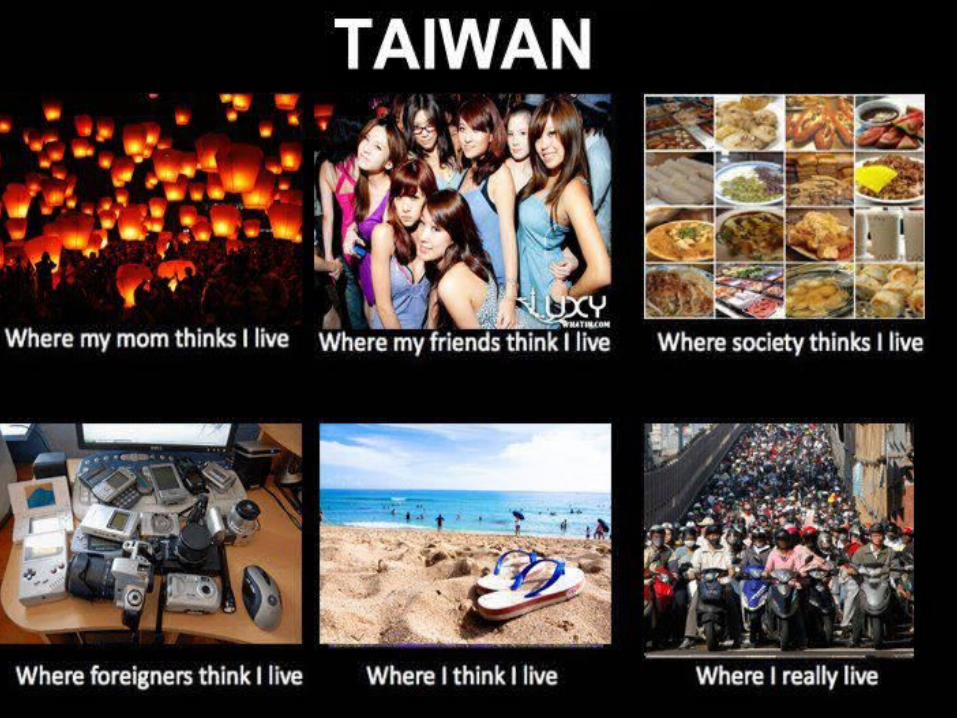
Total Unrestricted D2D service: Distorted Convenient M2Ws :
Collective Inconvenience!
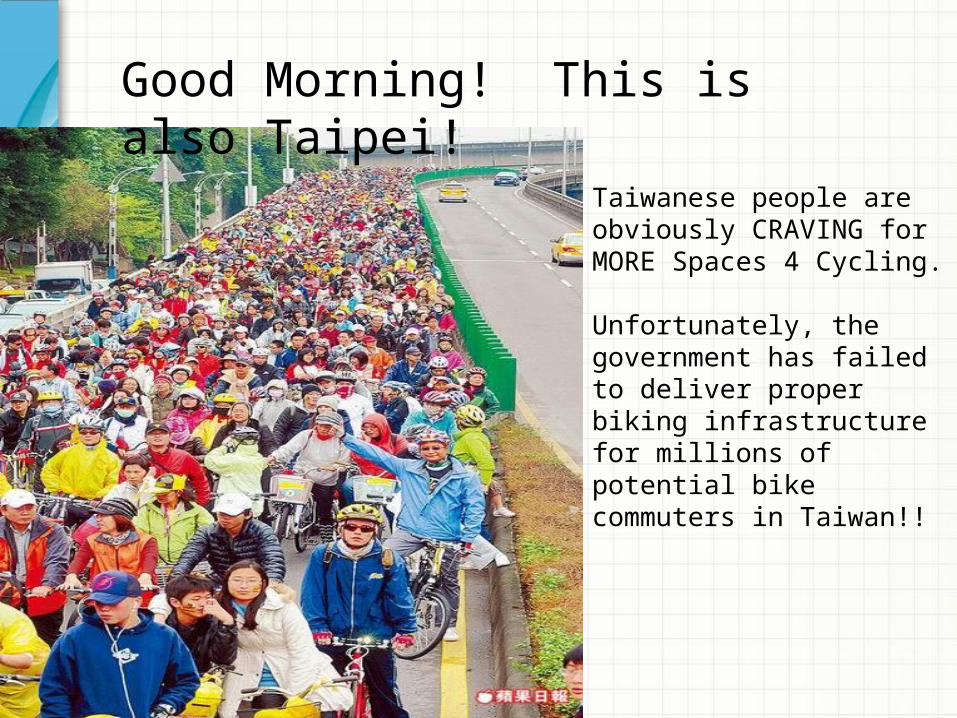
Taiwanese people are obviously CRAVING for MORE Spaces 4 Cycling.
Unfortunately, the government has failed to deliver proper biking infrastructure for millions of potential bike commuters in Taiwan!!
Good Morning! This is also Taipei!

Taipei
Sao Pa...
Madrid
Vienna
Berlin
Zuric
h
Stock
...
Moscow
London
Tokyo
Seoul
Singa..
.Cari
o
Cape ...
Shanghai
Istanbul
Hong K...
0
100
200
300
400
500
600
700
800
M2Ws/1,000 population
No. of car/1,000 population
selected major cities
No.
of V
ehic
les
Number of vehicles per 1,000 population

Fast growth of MRT fails to reduce PV usage
Taipei 2011 2012 2013
Public Transit
41.3% 43.4% 41.8%
PVs Share
46.4% 44.6% 47.4%Highest
Daily Use of Transportations (DOT, 2014)
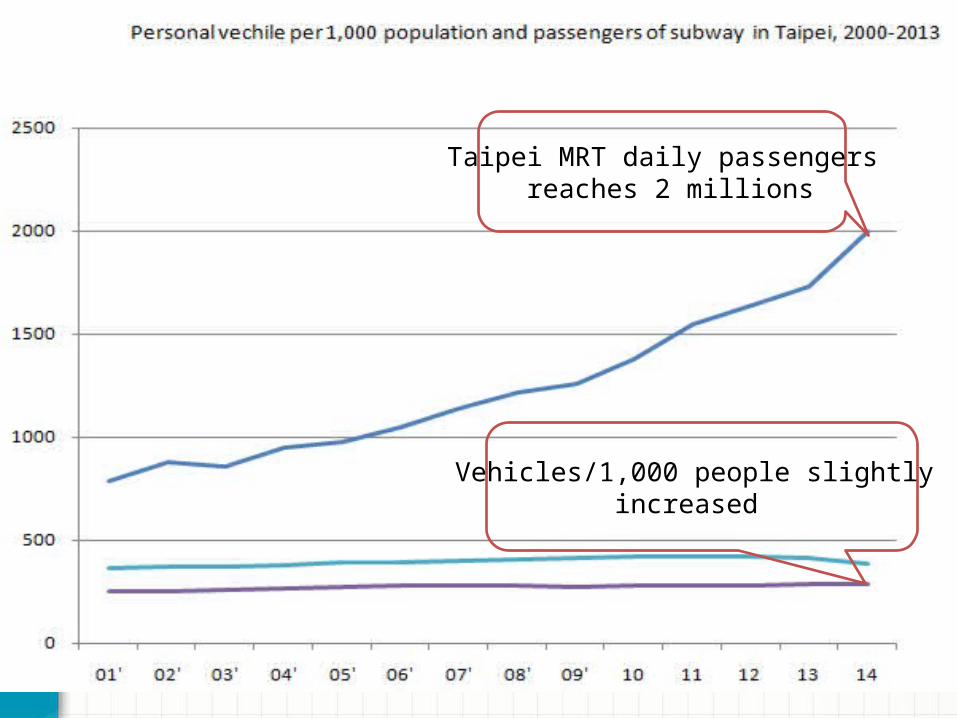
Taipei MRT daily passengers reaches 2 millions
Vehicles/1,000 people slightly increased

Measuring the Enormous social costs of motorbike usage in Taiwan (lives)
99年 100年 101年 102年 103年250,000
300,000
350,000
400,000
450,000
1,500
1,600
1,700
1,800
1,900
2,000
2,100
2,200
293,764315,201
334,082
373,568
413,2292,0472,117
2,0401,928
1,819
M2Ws; 59%
Car; 18%
Pedes-trian ; 13%
% of Traffic Death by Means of Transportation
# of death from M2Ws is equivalent to32 mid-sized aircraft crashes58 air crash deaths VS. 1,819 M2Ws deaths
80 81 82 83 84 85 86 87 88 89 90 91 92 93 94 95 96 97 98 99 100 101 1020
200
400
600
800
1,000
1,200
1,400
1,600
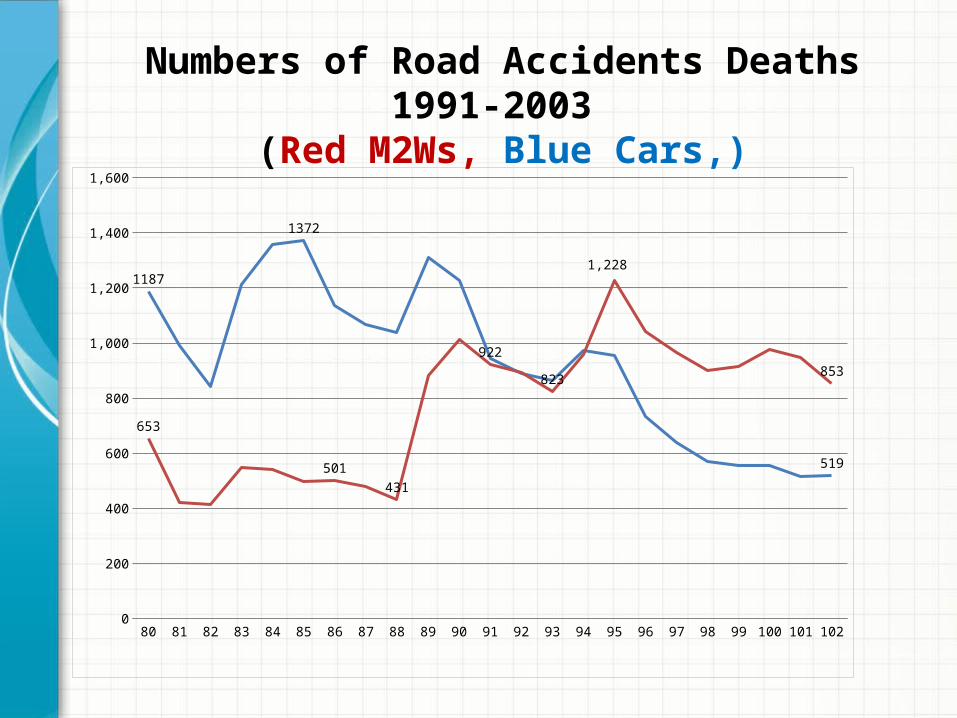
1187
1372
519
653
501431
922
823
1,228
853
Numbers of Road Accidents Deaths 1991-2003 (Red M2Ws, Blue Cars,)

59% of traffic death & 82% of traffic Injuries are M2Ws related (2003-2013)
25
58.7%
Motorbike/Scooter81.7%
Traffic Injuries by means ofTransportation in Taiwan
Traffic death by means ofTransportation in Taiwan
Total costs of traffic accident in Taiwan 470 billion NTD (14 billion US) per year
每年交通意外傷亡總成本 4,747億台幣
Motorbike/Scooter

Avoid Approaches
• ADVOCACY: Car Free DAY/Car Free Zones/Car Free Government
CFD• SHARED: Public Bike/Public E-bike Shared
Mobility
• IMPROVE: Better Public Transit; Electrification of vehicles
Better Public TransitElectrification
• SHFIT to Public Transportation and Active Mobility
Space 4 Biking/Walking/Rollerblading
• AVOID: Transit-Oriented Development (TOD)
Compact & Resilient City

Transit-Oriented Development Is Critical to Climate Mitigation
Taipei : 2.6 milliontones of CO2 : 2.0 Tones/Person

Compact City

Compact and Resilient City

Two months ago in Taipei after Typhoon

SHIFT Approaches
• ADVOCACY: Car Free DAY/Car Free Zones/Car Free Government
CFD• SHARED: Public Bike/Public E-bike Shared
Mobility
• IMPROVE: Better Public Transit; Electrification of vehicles
Better Public TransitElectrification
• SHFIT to Public Transportation and Active Mobility
Reclaiming Space for Biking/Walking/Rollerblading
• AVOID: Transit-Oriented Development (TOD) Compact & Resilient City

Reclaiming Space for Biking!!

Reclaiming Parking Space for Biking!!


Empty off-street parking due to All Free on-street parking at NTU

Reclaiming Space for Biking!!

Reclaiming Parking Space for Biking!!

Reclaiming Space for Biking!!

Reclaiming Space for Biking!!

Reclaiming Parking Space for Biking!!
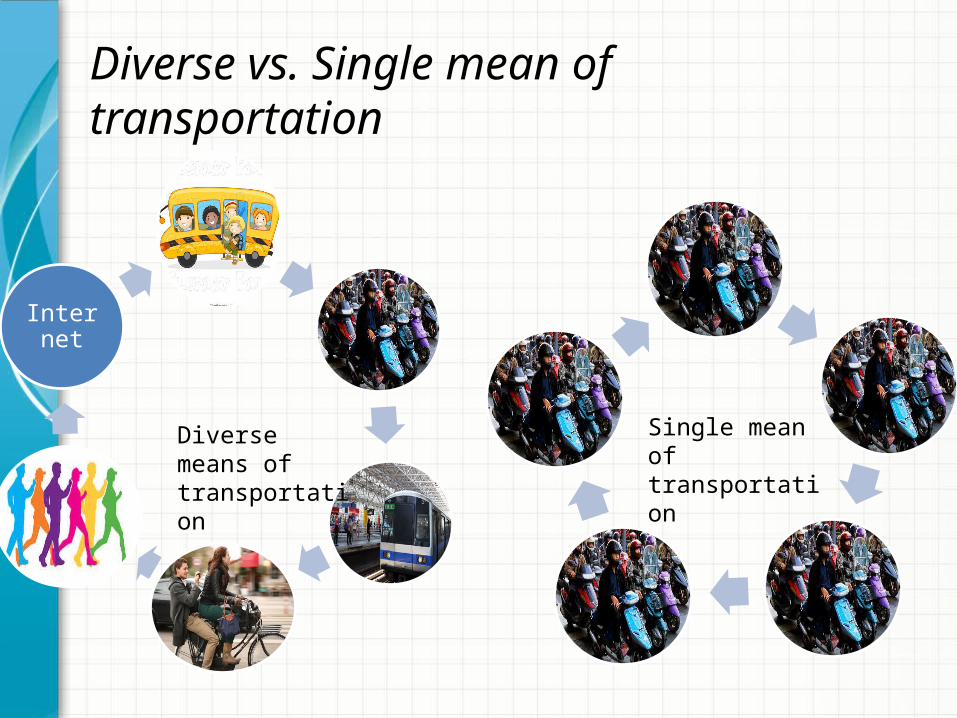
Diverse vs. Single mean of transportation
Internet
Diverse means of transportation
Single mean of transportation
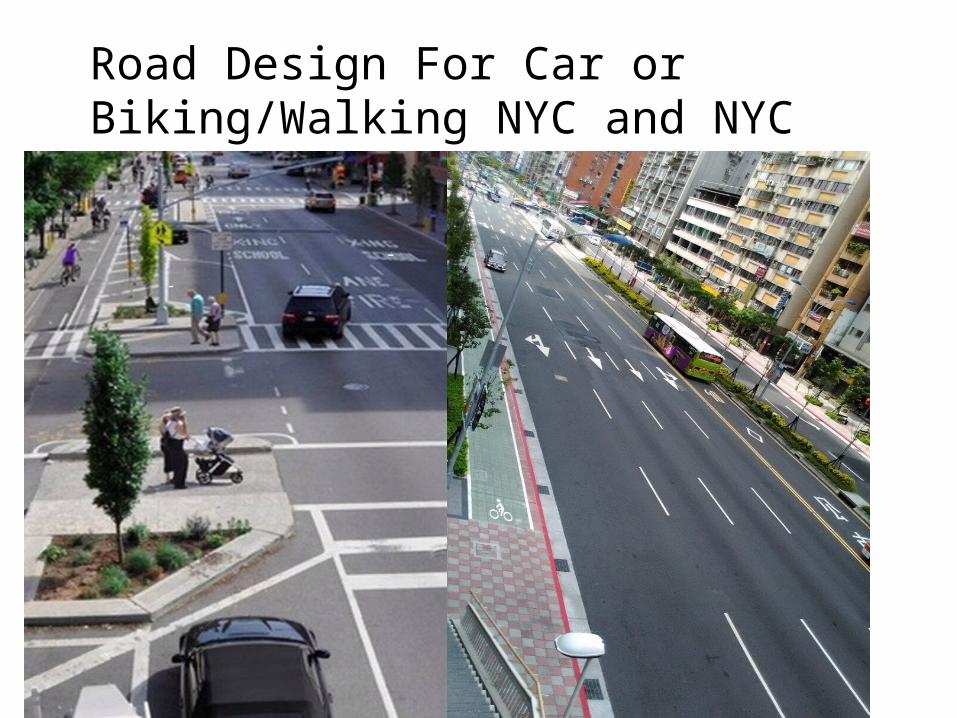
Road Design For Car or Biking/Walking NYC and NYC

Maximizing Space 4 C in Taiwan
Increasing cost for PVs usage: parking and congestion fees & carbon tax etc.
Reducing PVs that occupy potential biking space
Turn on-street parking into bikelines Car free zones/CAR FREE DAY, reclaiming main roads for cycling/jogging regularly in weekends


Company Logo

Company Logo

London
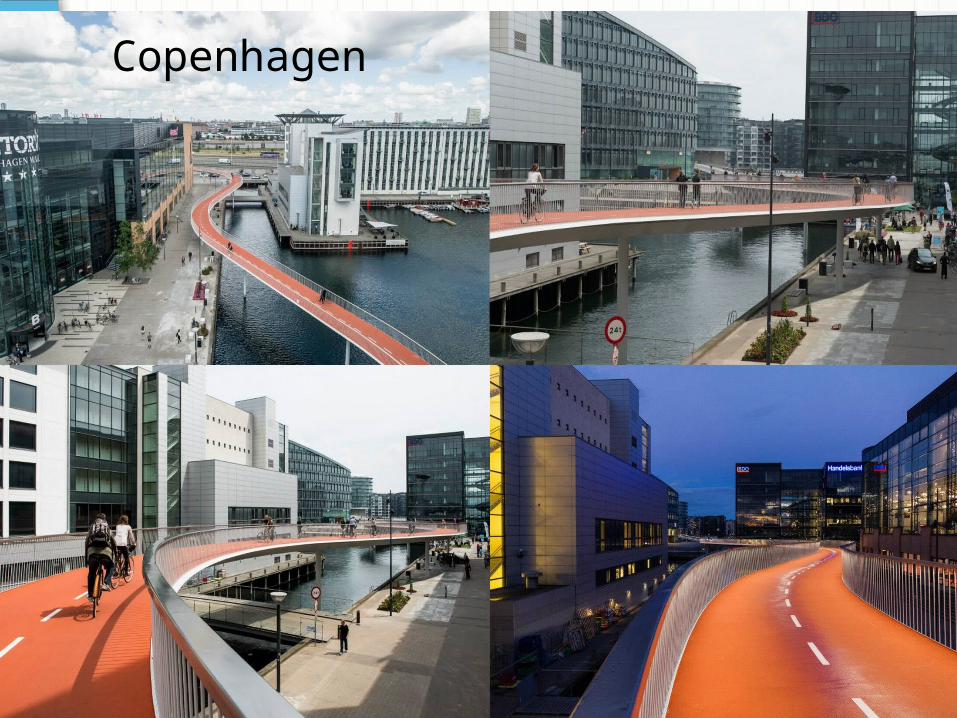
Copenhagen
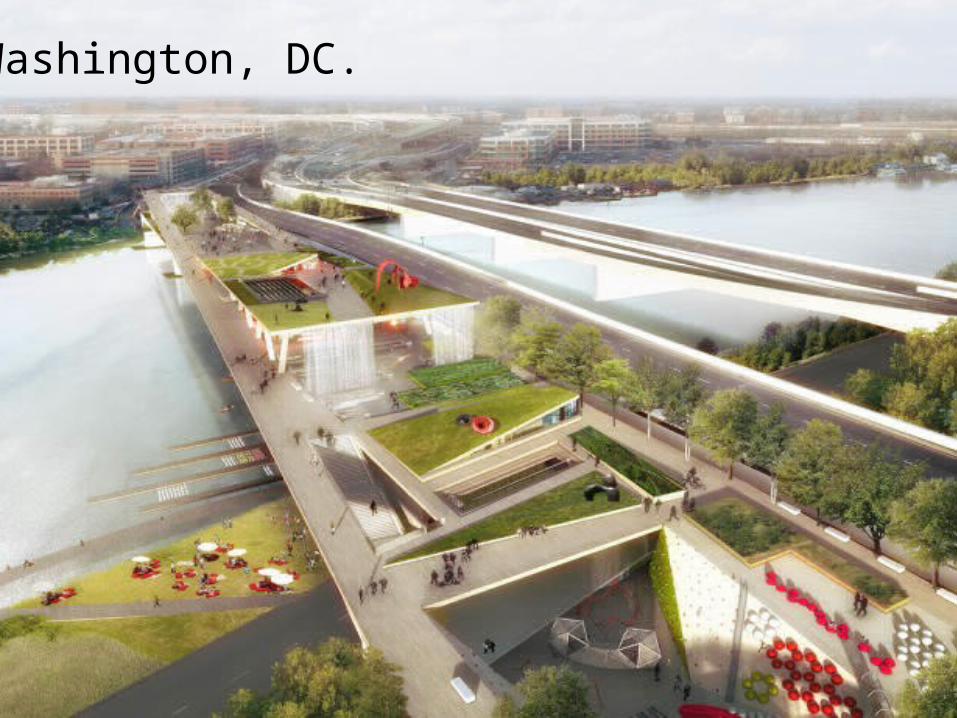
Washington, DC.

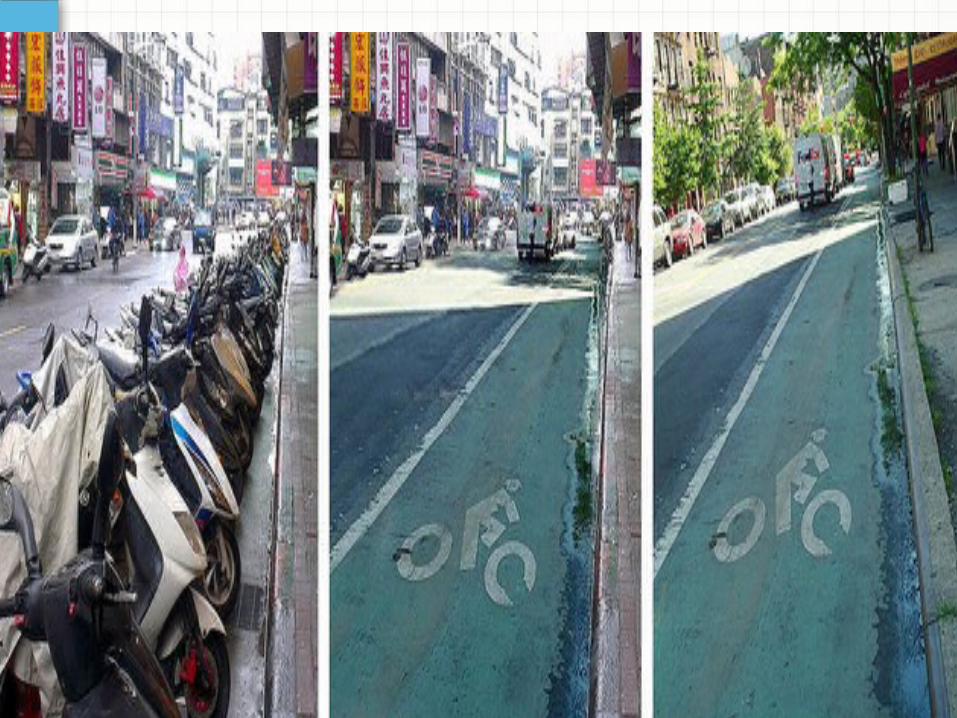

Unproductive on-street parking or bikeways?


10% less M2Ws = 360 km bikeway in Taipei Metropolitan
There are 3.6 million M2Ws in Taipei metropolitan If we reduce 10% • 3.6 million x 10% = 360,000 M2Ws
• One M2Ws occupies 1mx2m on-street pace
• 360,000 M2Ws parking space = 360 KM on-street bikeway

Turning on-street parking to bikeline
1km for productive bikeline or idle on-street parking?

1 km for biking? Parking space for 1,000 idle motorbikes?
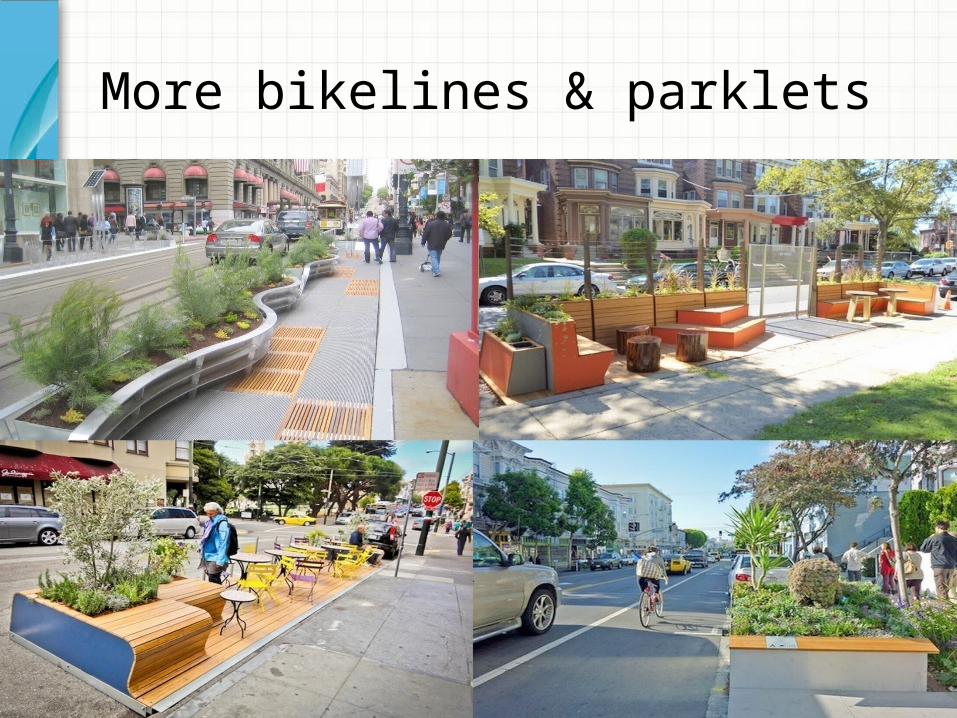
More bikelines & parklets

Improve Approaches
• ADVOCACY: Car Free DAY/Car Free Zones/Car Free Government
CFD• SHARED: Public Bike/Public E-bike Shared
Mobility • IMPROVE: Better Public Transit; Electrification of vehicles
Better Public TransitElectrification
• SHFIT to Public Transportation and Active Mobility
Space for Biking/Walking/Rollerblading
• AVOID: Transit-Oriented Development (TOD) Compact & Resilient City

About 2 million Ghost M2Ws

EPA’s New Clean Air Policy • 39 billion NTD(1.2 billion USD) 2015-2020 of which 2 programs
related to M2Ws!
• Phasing out 1 million old 2 strike M2Ws in 6 years (Out of 2.2 million 2 strike M2Ws still exist )
• Subsidizing 600,000 New E-Scooters/Motorbikes in 6 year! (Out of 4.8 million new M2Ws sold in 6 years)

Phasing out 1 million old 2 strike M2Ws in 6 years (i.e. 160,000 M2Ws/Year)!
• Policy goal: reduce # of 2 Strike M2Ws!!
• Policy goal should be: Eliminating % of M2Ws violating emission laws!
• Currently, there are probably 30~%(10+yrs~), about 4 million M2Ws unqualified to newest emission standards
• 30~% M2Ws did not comply to yearly exhaustion checking!
• There is a 500,000~ old M2Ws phasing out of street annually without intervention!

Subsidizing 600,000 New Electric Scooters/Motorbikes!
• Policy goal is to increase number of EV sold!
• Policy goal should be increase % of overall mileages travelled with EV.
• One Share EV travelled 5-10 times/day than personal owed one!
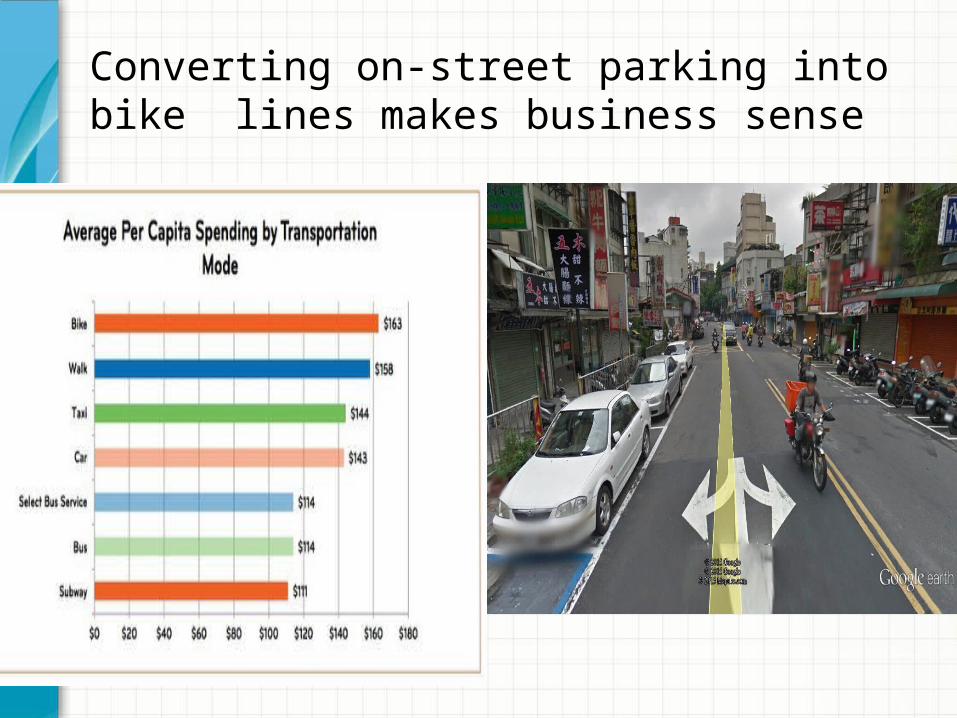
Converting on-street parking into bike lines makes business sense

SHARED Approaches
• ADVOCACY: Car Free DAY/Car Free Zones/Car Free Government
CFD• SHARED: Public Bike/Public E-bike Shared
Mobility • IMPROVE: Better Public Transit; Electrification of vehicles
Better Public TransitElectrification
• SHFIT to Public Transportation and Active Mobility
Space for Biking/Walking/Rollerblading
• AVOID: Transit-Oriented Development (TOD) Compact & Resilient City

Sharing is Smart

How to reduce PVs, especially M2Ws?
Increasing supply:
• BRT & Subways• Car sharing/pooling• Provide city-wide share
bike & share e-bike
Reducing demand:
• Buy back old, 2 strike M2Ws (10+ yrs)
• On-street parks fees for all private vehicles
• PVs restricted zones• carbon tax
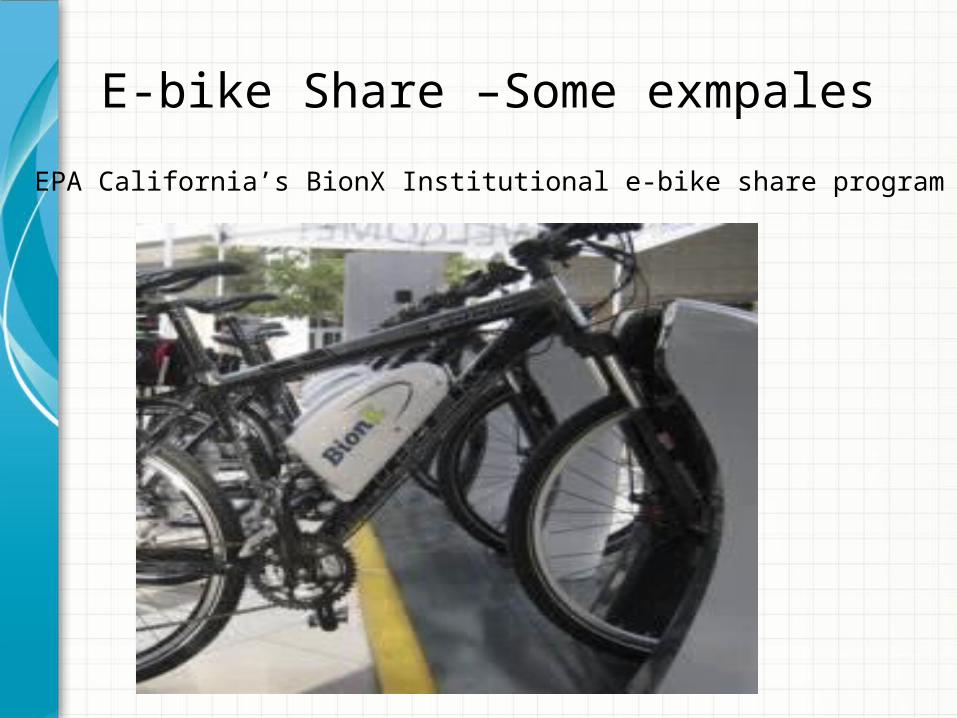
E-bike Share –Some exmpales
EPA California’s BionX Institutional e-bike share program

Shared e-bike may significantly reduce Density of M2Ws/Car
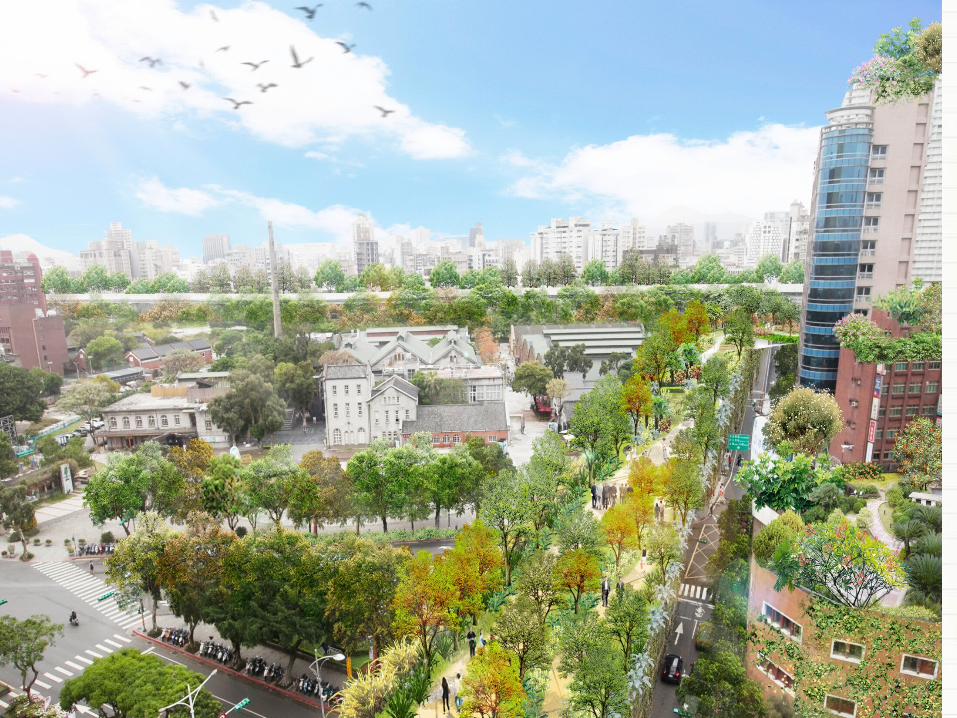
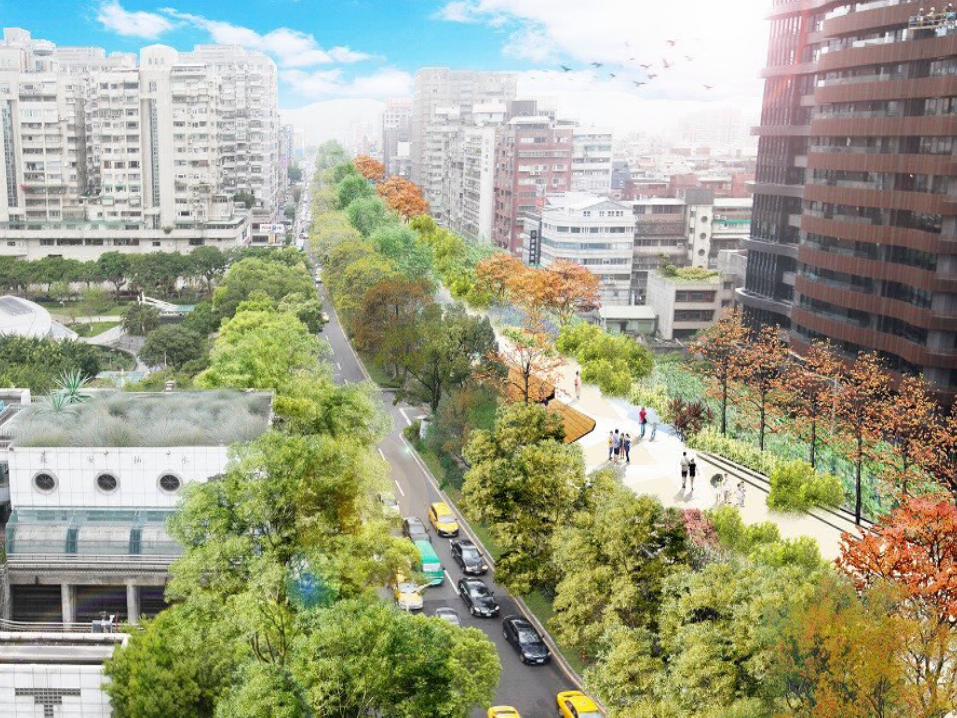
then More and better walking
environments
More protected cycling routes
Better air quality More space for parks and gardens
Safer and slower traffic, more life!

Roads are for moving people not parking vehciles
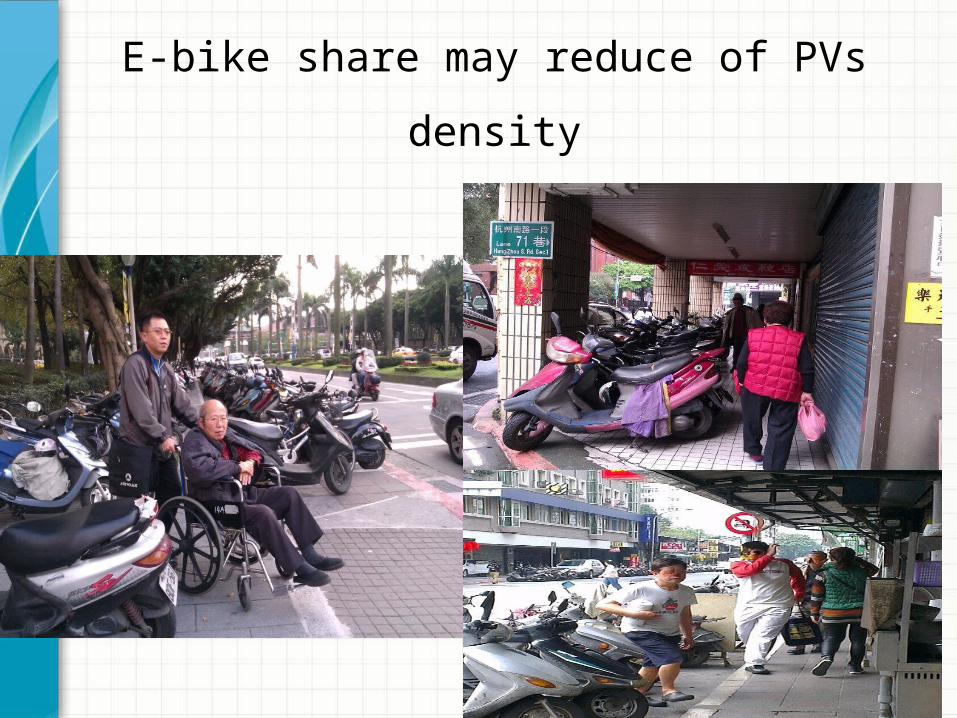
E-bike share may reduce of PVs density
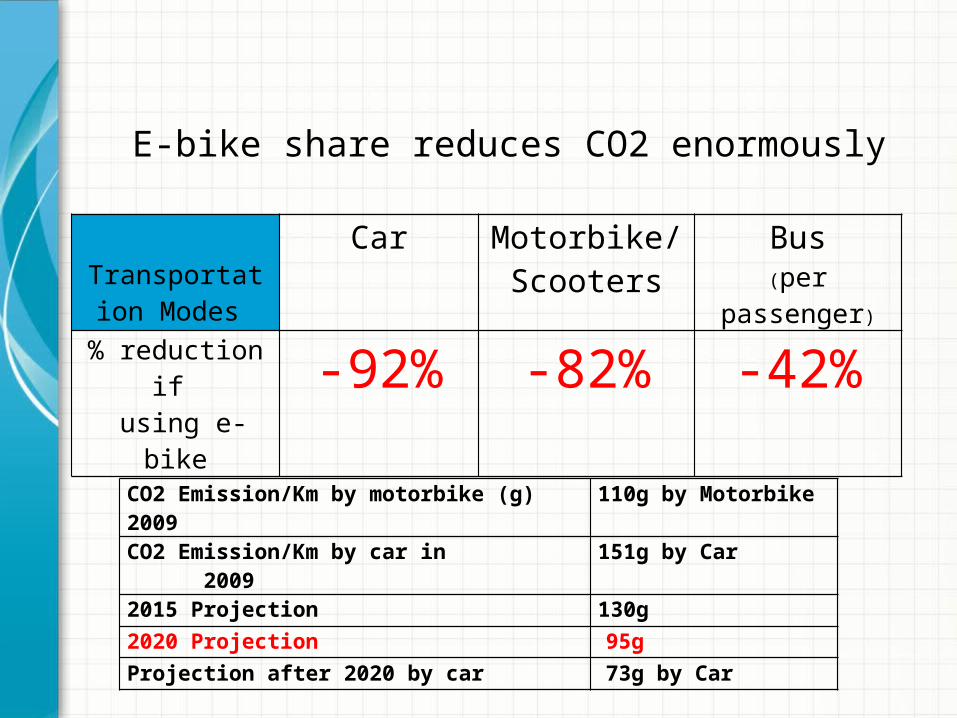
Transportation Modes
Car Motorbike/ Scooters
Bus(per passenger)
% reduction if using e-bike -92% -82% -42%
E-bike share reduces CO2 enormously
CO2 Emission/Km by motorbike (g) 2009 110g by MotorbikeCO2 Emission/Km by car in 2009 151g by Car 2015 Projection 130g2020 Projection 95gProjection after 2020 by car 73g by Car

1,650 E-bikes in 120 stationsMadrid, Spain
• 25 euro/membership fees
• 40 cent euro/first 30 mins
• 50 cent euro/every 30 mins
• 70 km/per charge

E-bike is slower therefore safer
Two wheels vehicle Highest Speed
(km)
Highest speed allowed (km)
Risk &
Speed
E-bicycle 25 60 Low
E-scooter 45 60 Low
Conventional Motorbike
120~ 60High
Heavy Motorbike
200~ 60Very high
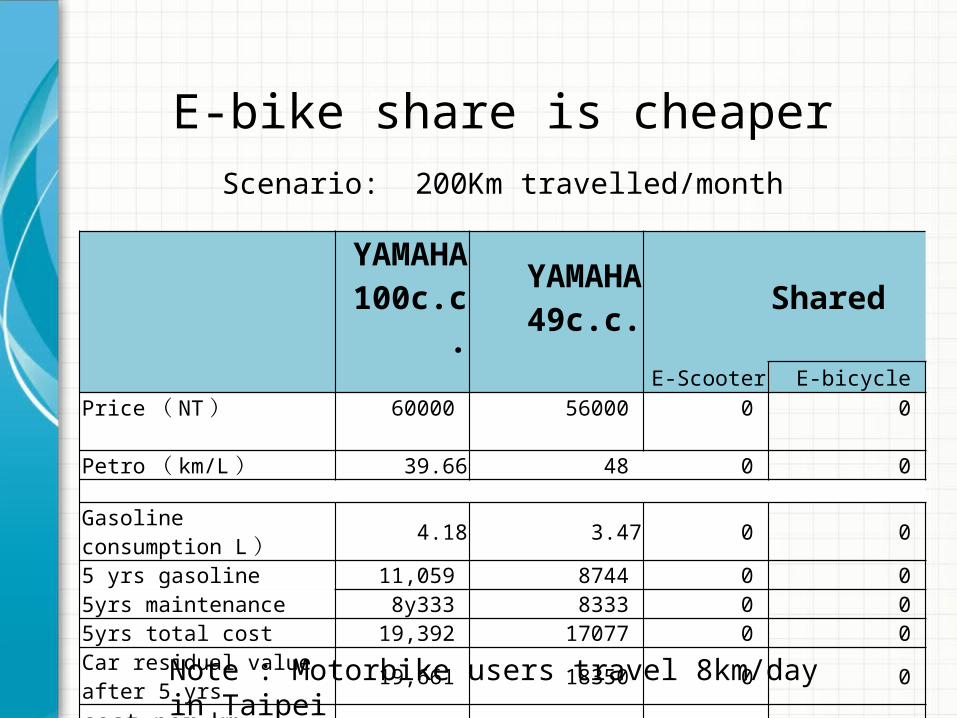
E-bike share is cheaperScenario: 200Km travelled/month
YAMAHA
100c.c.YAMAHA
49c.c. Shared
E-Scooter E-bicycle
Price( NT) 60000 56000 0 0 Petro( km/L) 39.66 48 0 0
Gasoline consumption L) 4.18 3.47 0 0 5 yrs gasoline 11,059 8744 0 0 5yrs maintenance 8y333 8333 0 0 5yrs total cost 19,392 17077 0 0 Car residual value after 5 yrs 19,661 18350 0 0 cost per km travelled 4.98 4.56 1.78 2.45yrs total cost in NT 59,731 54,727 21,360 28,800 Note : Motorbike users travel 8km/day in Taipei

E-bike share more cost-effectiveTo transfer 100,000 trips/day from PV to PT
Increase public transit usage Public e-bike New Subway Line
Transfer 100,000 trips/day from individual vehicle usage to pubic transit
2 billions NT20,000 e-bike
26 billions NT 6.5 KM new Subway
Costs & returns of the system cost to user2-15 NT/km
cost to user 20 -60NT/trip
Individualized transit service Excellent Good
Last mile convenience Excellent Good
Public Transit discount Yes Yes

If Taiwan provides solution for managing M2Ws we can help – Hanoi, Vietnam

Saigon, Vietnam

Hanoi Jakarta, Indoenisia

New Delhi

BIG picture in mind

Enormous extra social benefits gained from reducing CO2 Emissions by transportation sector
Saving Lives: Less road accident deaths & Injuries and better air quality!
Healthy Lives: More & better walking & cycling spaces
Quality of Life: More space for parks & gardens
Saving MONEY : One trillion USD for Taiwan by 2050

"NEVER DOUBT THAT A SMALL GROUP OF THOUGHTFUL, COMMITTED CITIZENS CAN CHANGE THE WORLD; INDEED, IT'S THE ONLY THING THAT EVER HAS." - MARGARET MEAD
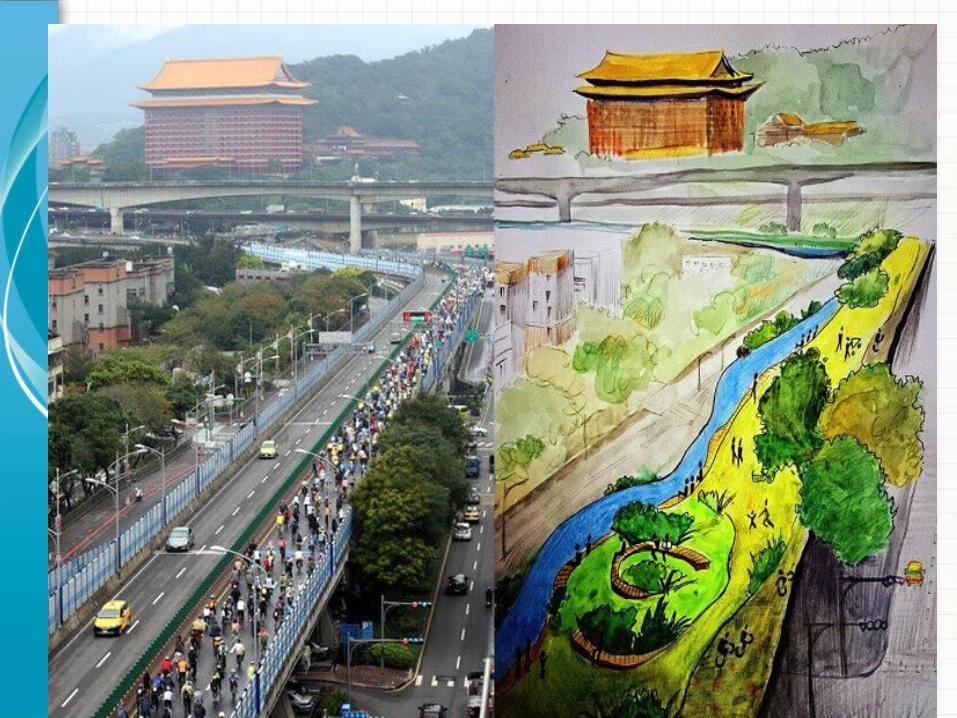
Photo: Reclaiming the Street XinSheng elevated road campaign in Taipei

Discussions
• Elasticity of substitution between different transport modes:
Q: Will manage M2Ws (by cost, space and speed) increase usage of car, bus, MRT, bike/Walk or avoid?
• Measuring “extra benefits” of reducing CO2 emissions
from transportation! Q: How much “extra benefits” comparing to reducing CO2 from
other sectors: Lives, Money, and Healh!

Thanks for your attention! Questions? Comments?
Photo: Reclaiming the Street, Taipei