Embed Size (px)
Citation preview
HighNitrateConcentrationsinMidwesternStreamsin2013Following
the2012Drought
Jeff Frey – IN WSCPete Van Metre – TX WSCUSGSNational Water-Quality Assessment Program (NAWQA)
NAWQACycle3– 2013‐2022• NationalFixedStationNetwork 100streamsmonitoredforlong‐termtrends
• RegionalStreamQualityAssessments Intensivesingleseasonstudies
• PrincipleAquiferSurveysGroundwaterquality• IntegratedWatershedStudiesGW‐SWrelationsinafewsettings
• Forecasting Modelsofsurface‐ andground‐waterqualityandeffectsonaquaticecology
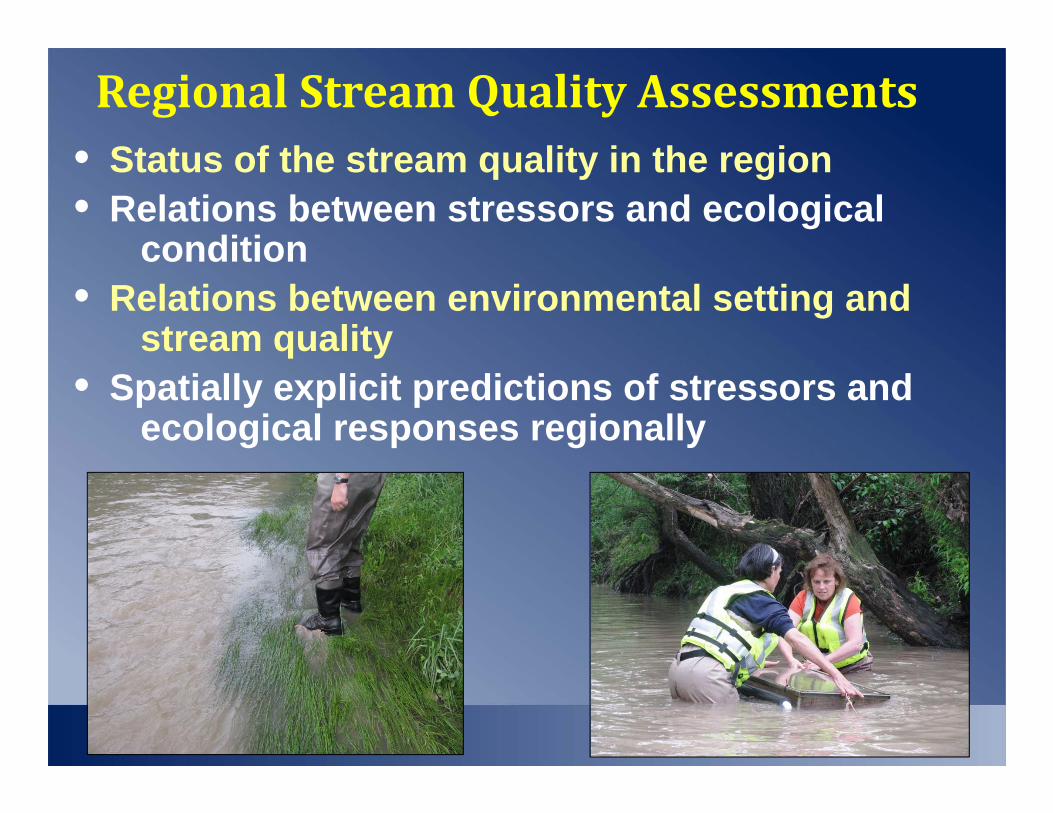
RegionalStreamQualityAssessments• Status of the stream quality in the region• Relations between stressors and ecological
condition• Relations between environmental setting and
stream quality • Spatially explicit predictions of stressors and
ecological responses regionally
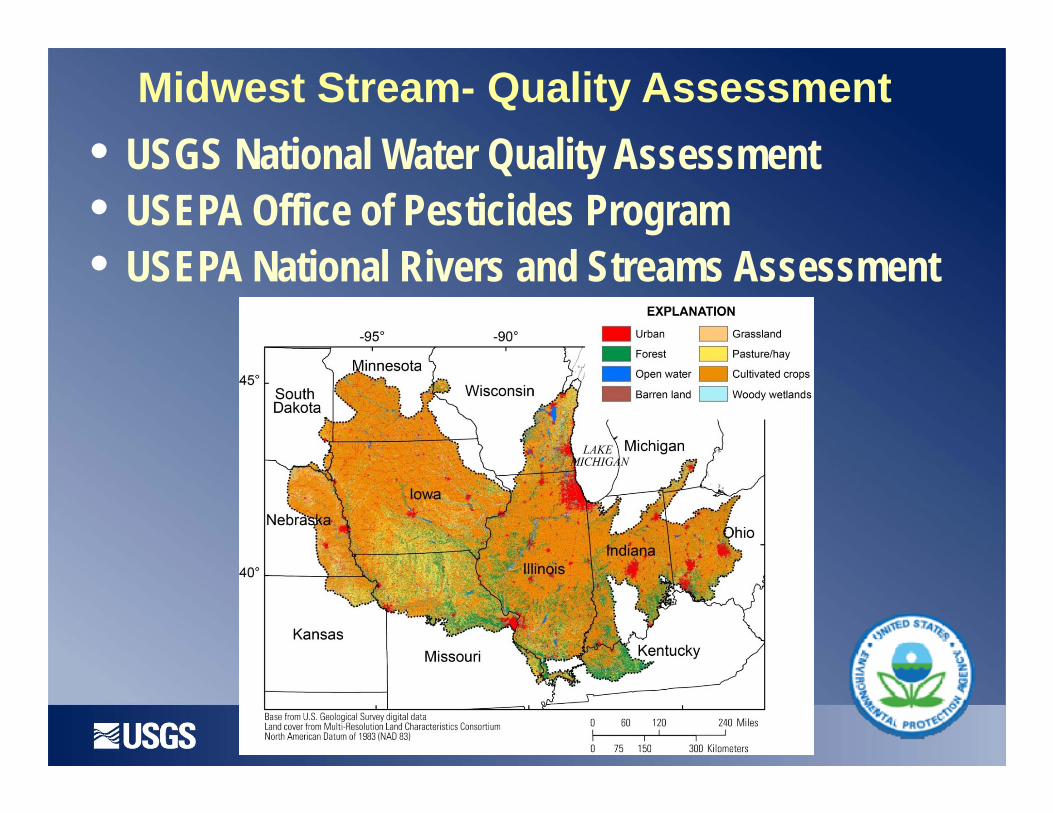
Midwest Stream- Quality Assessment• USGS National Water Quality Assessment• USEPA Office of Pesticides Program• USEPA National Rivers and Streams Assessment
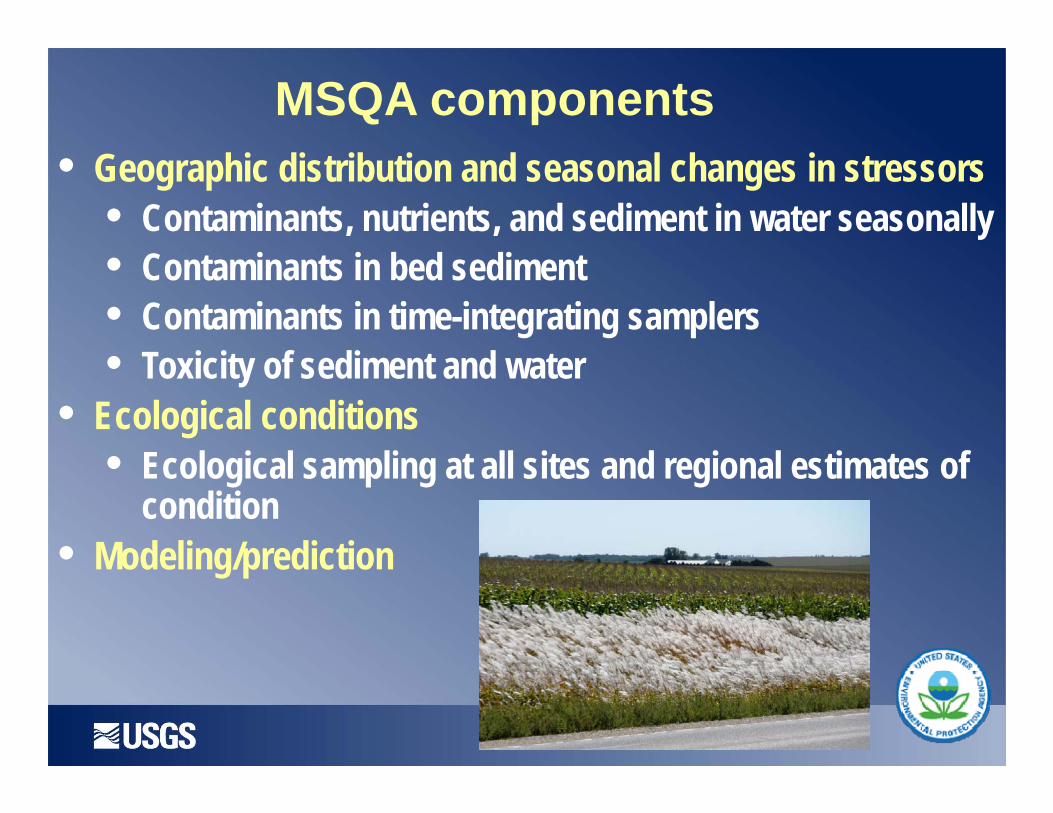
MSQA components• Geographic distribution and seasonal changes in stressors
• Contaminants, nutrients, and sediment in water seasonally• Contaminants in bed sediment• Contaminants in time-integrating samplers• Toxicity of sediment and water
• Ecological conditions• Ecological sampling at all sites and regional estimates of
condition• Modeling/prediction
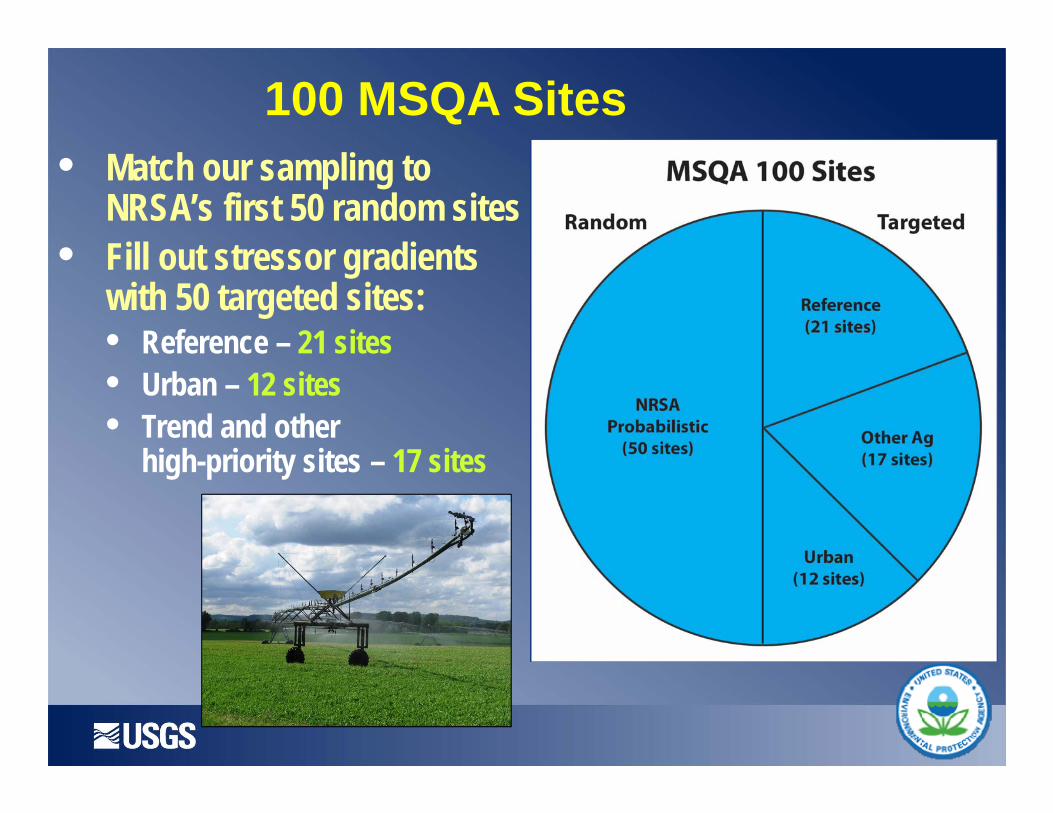
100 MSQA Sites• Match our sampling to
NRSA’s first 50 random sites• Fill out stressor gradients
with 50 targeted sites:• Reference – 21 sites• Urban – 12 sites• Trend and other
high-priority sites – 17 sites
West
South
East
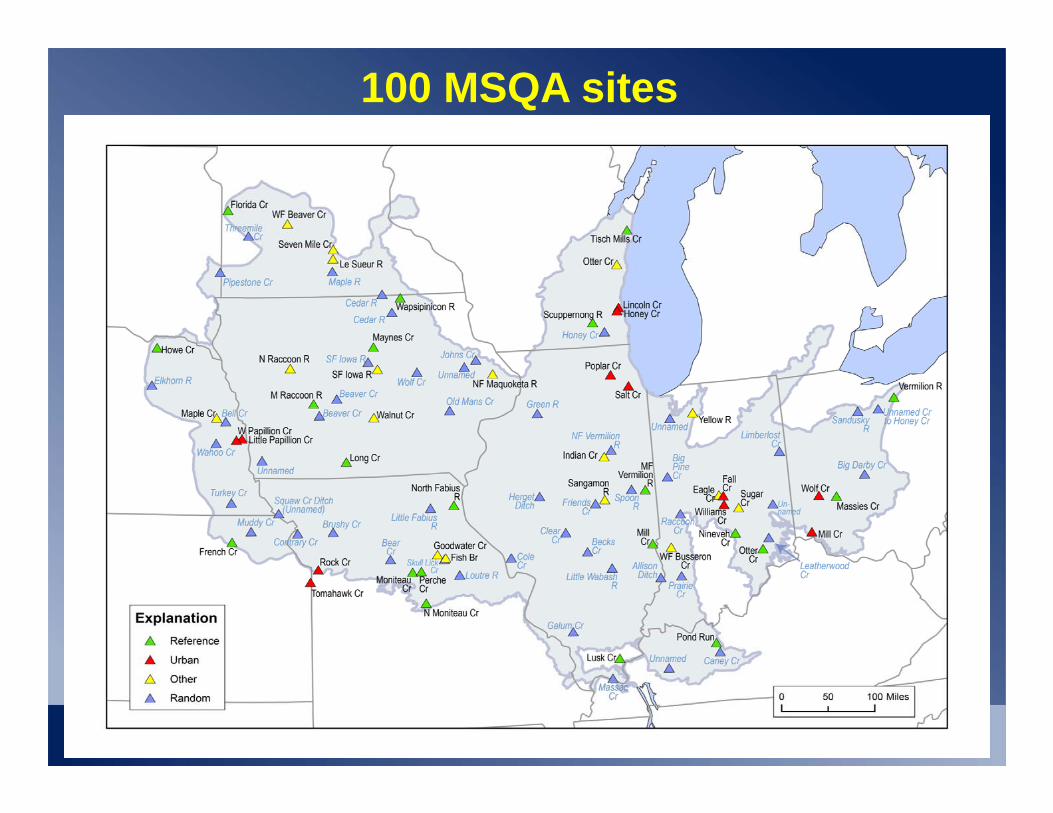
Blue – randomGreen – refYellow – other agRed -- urban
100 MSQA sites

Des Moines Water WorksNews ReleaseHistoric Nitrate Levels in Des Moines Water Works’ SourceWaterTuesday, May 28, 2013Nitrate concentrations continue to remain exceptionally high in both the Raccoon and Des Moines Rivers. Through extensive and expensive water treatment, Des Moines Water Works’ finished drinking water is currently under the Environmental Protection Agency’s (EPA) maximum contaminant level (MCL) of 10 milligrams per liter (mg/l) and is safe for drinking.
High nitrate concentrations in Iowa caused expensive and unintended consequences
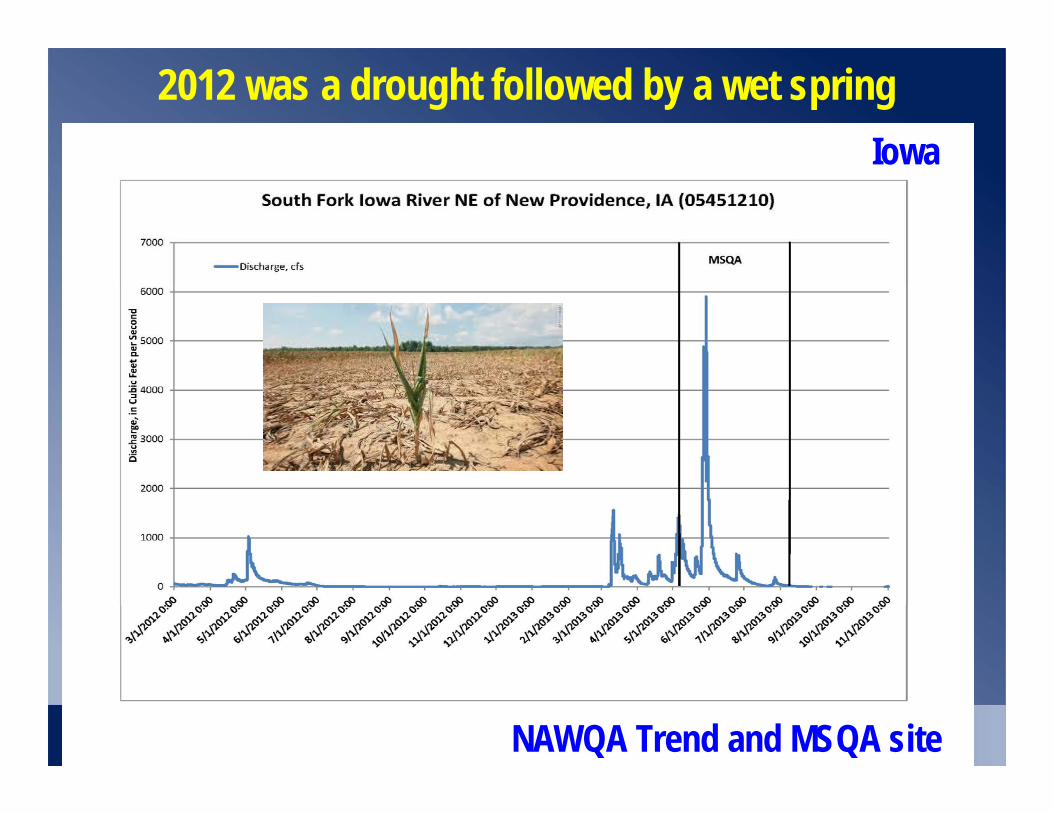
2012 was a drought followed by a wet springIowa
NAWQA Trend and MSQA site
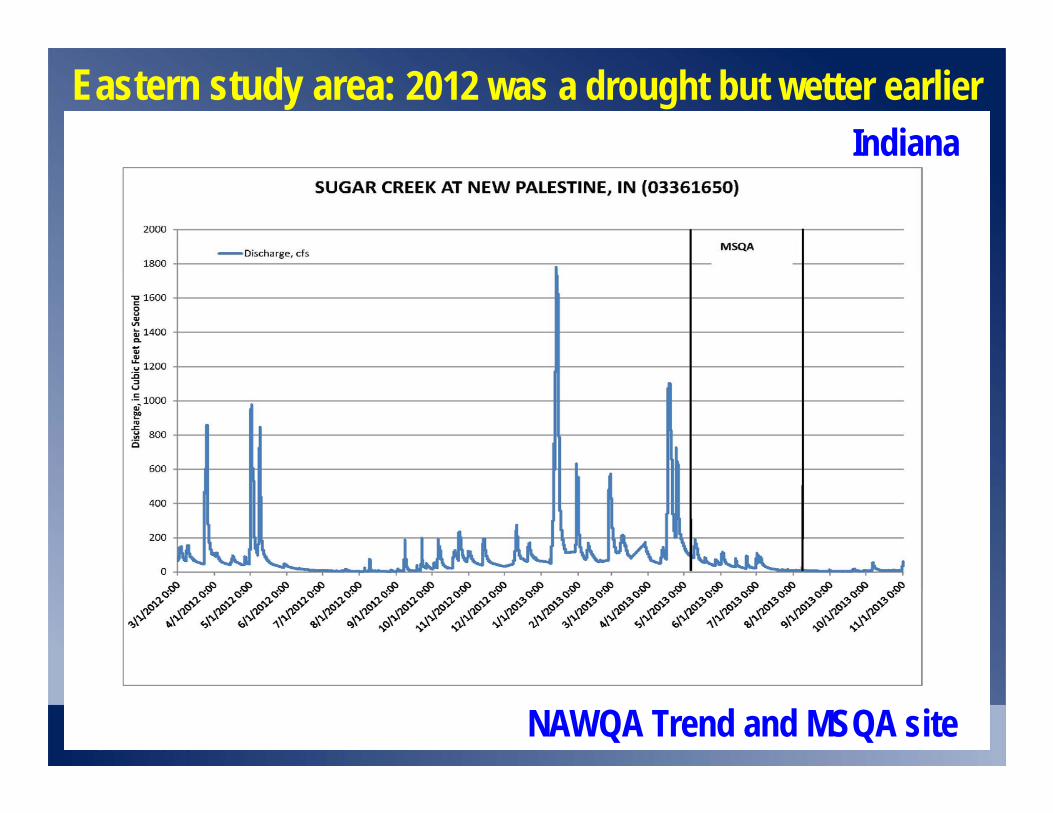
Eastern study area: 2012 was a drought but wetter earlierIndiana
NAWQA Trend and MSQA site
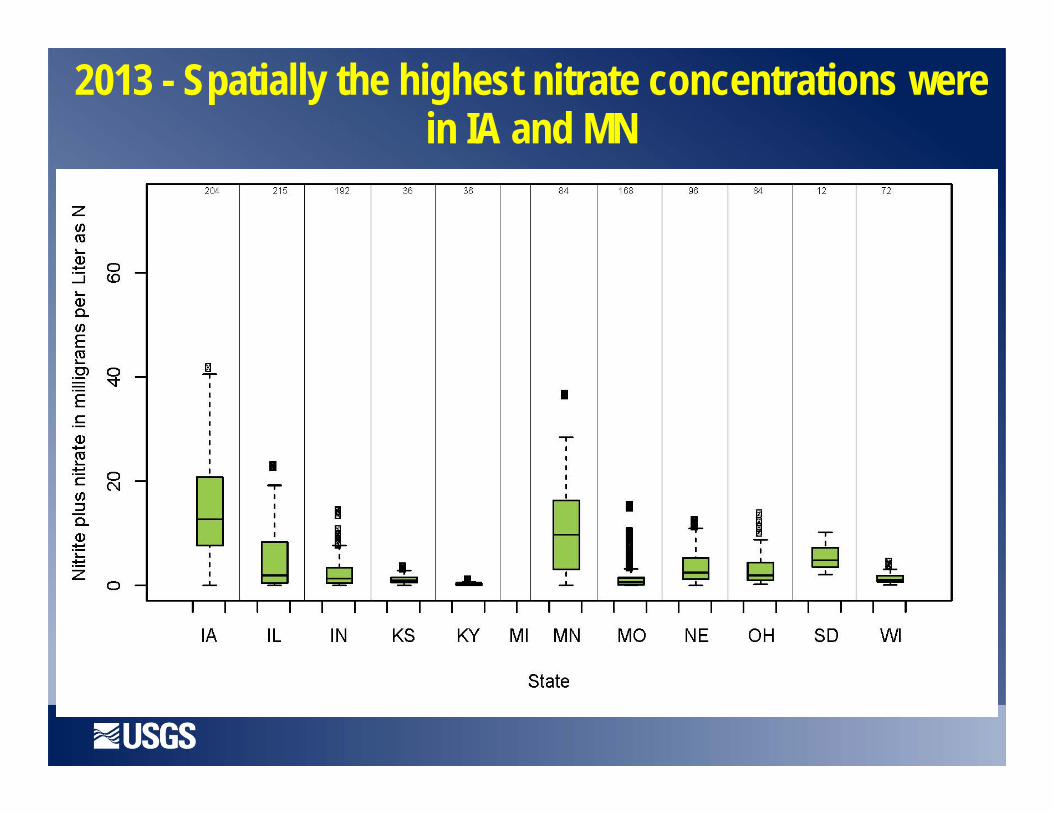
2013 - Spatially the highest nitrate concentrations were in IA and MN

2013 - Spatially the highest nitrate concentrations were in IA and MN
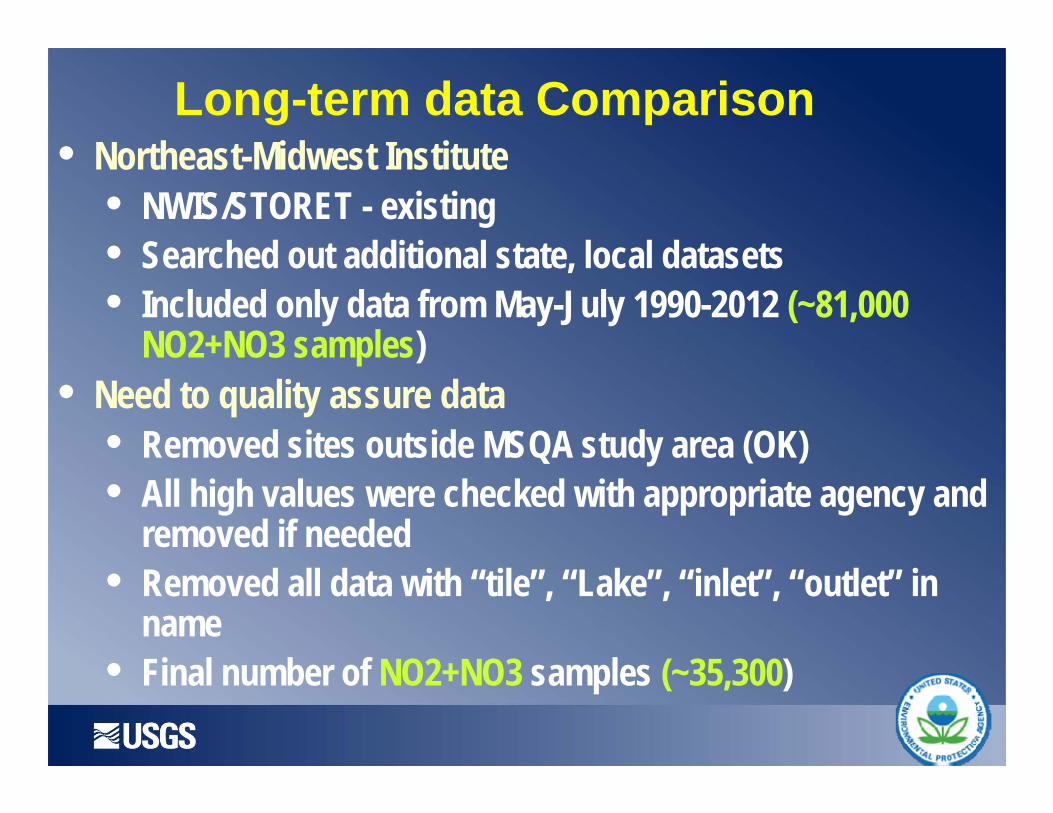
Long-term data Comparison• Northeast-Midwest Institute
• NWIS/STORET - existing• Searched out additional state, local datasets• Included only data from May-July 1990-2012 (~81,000
NO2+NO3 samples)• Need to quality assure data
• Removed sites outside MSQA study area (OK)• All high values were checked with appropriate agency and
removed if needed• Removed all data with “tile”, “Lake”, “inlet”, “outlet” in
name• Final number of NO2+NO3 samples (~35,300)
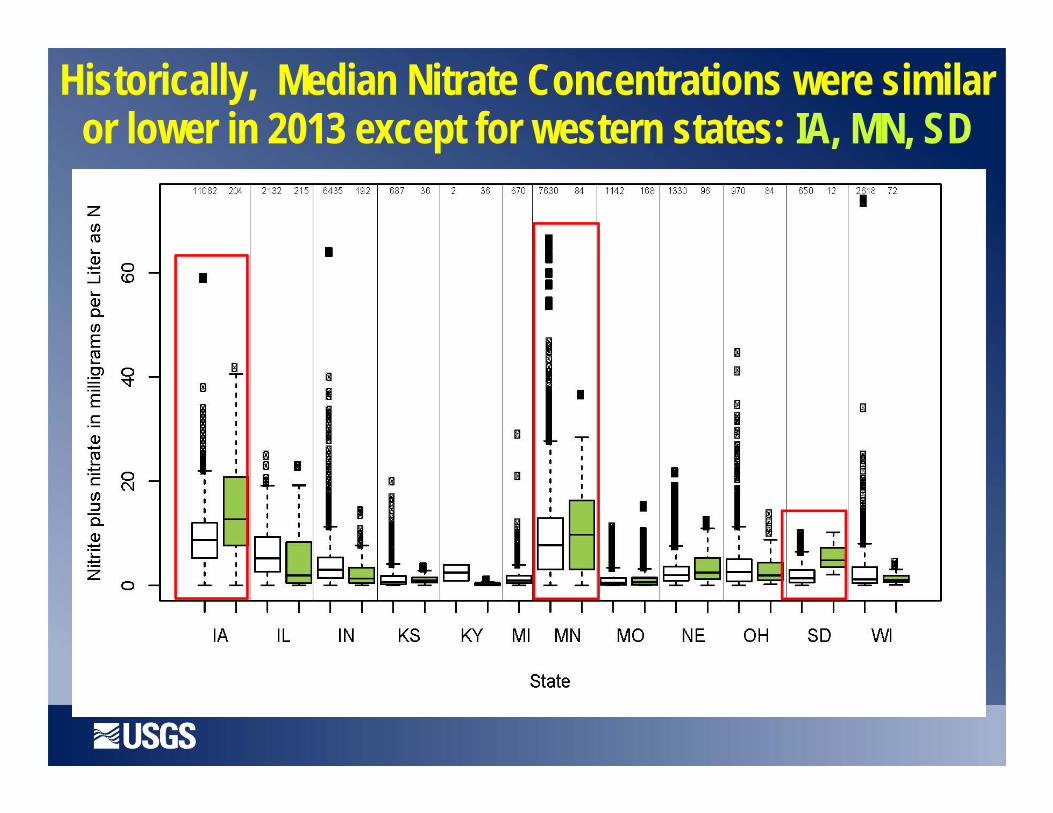
Historically, Median Nitrate Concentrations were similar or lower in 2013 except for western states: IA, MN, SD
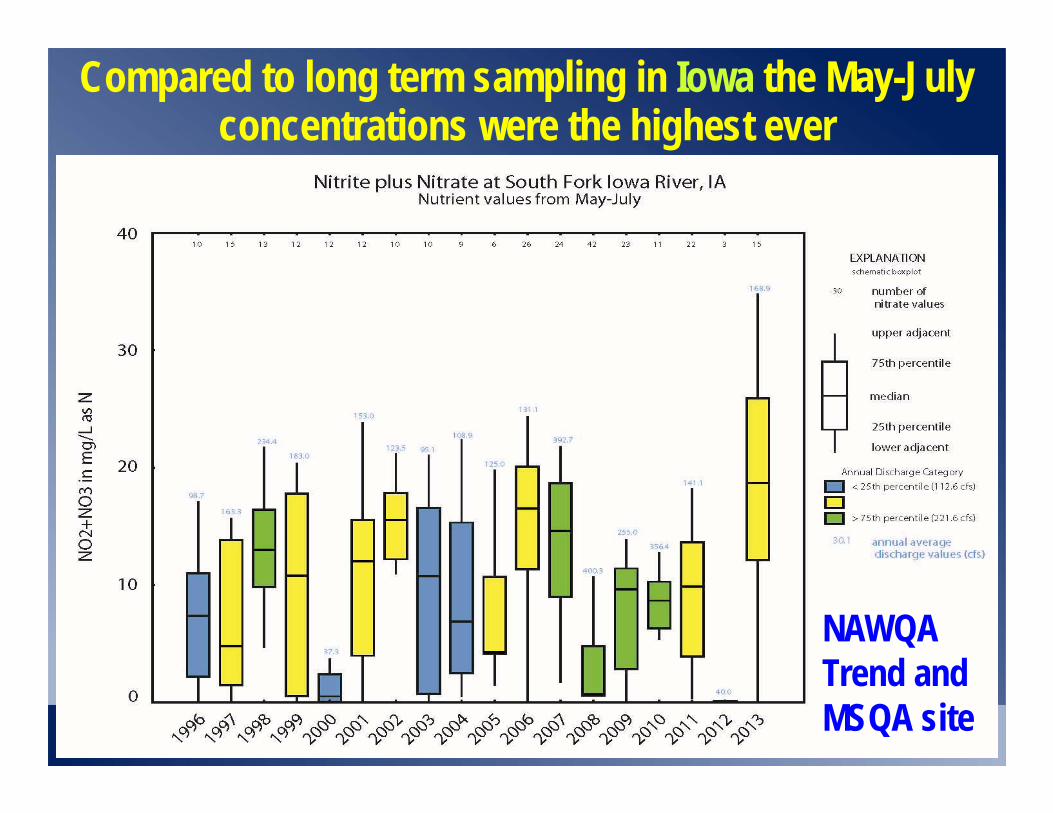
Compared to long term sampling in Iowa the May-July concentrations were the highest ever
NAWQA Trend and MSQA site
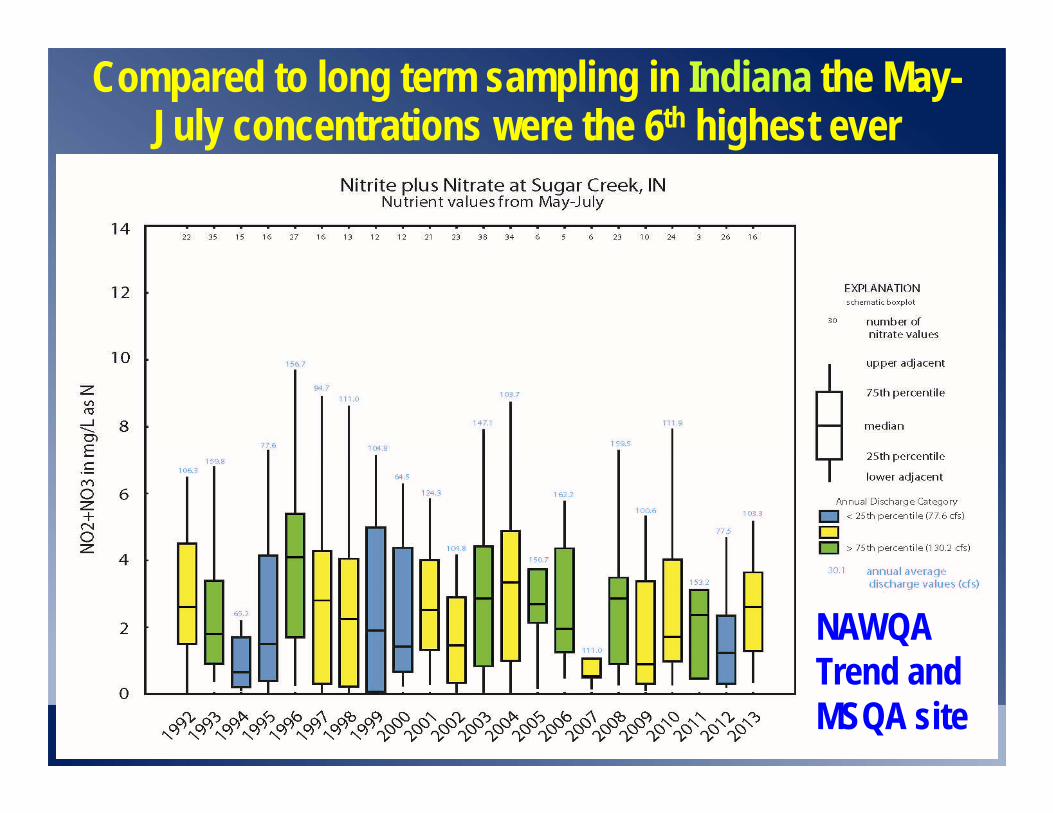
Compared to long term sampling in Indiana the May-July concentrations were the 6th highest ever
NAWQA Trend and MSQA site
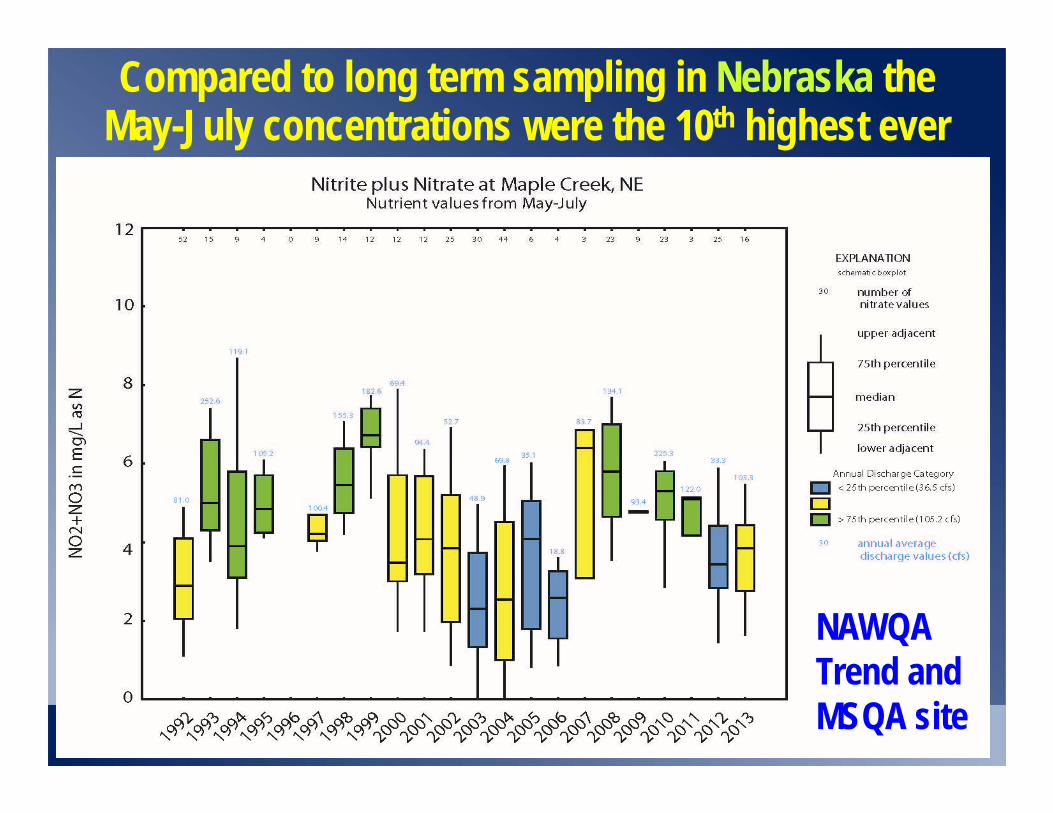
Compared to long term sampling in Nebraska the May-July concentrations were the 10th highest ever
NAWQA Trend and MSQA site
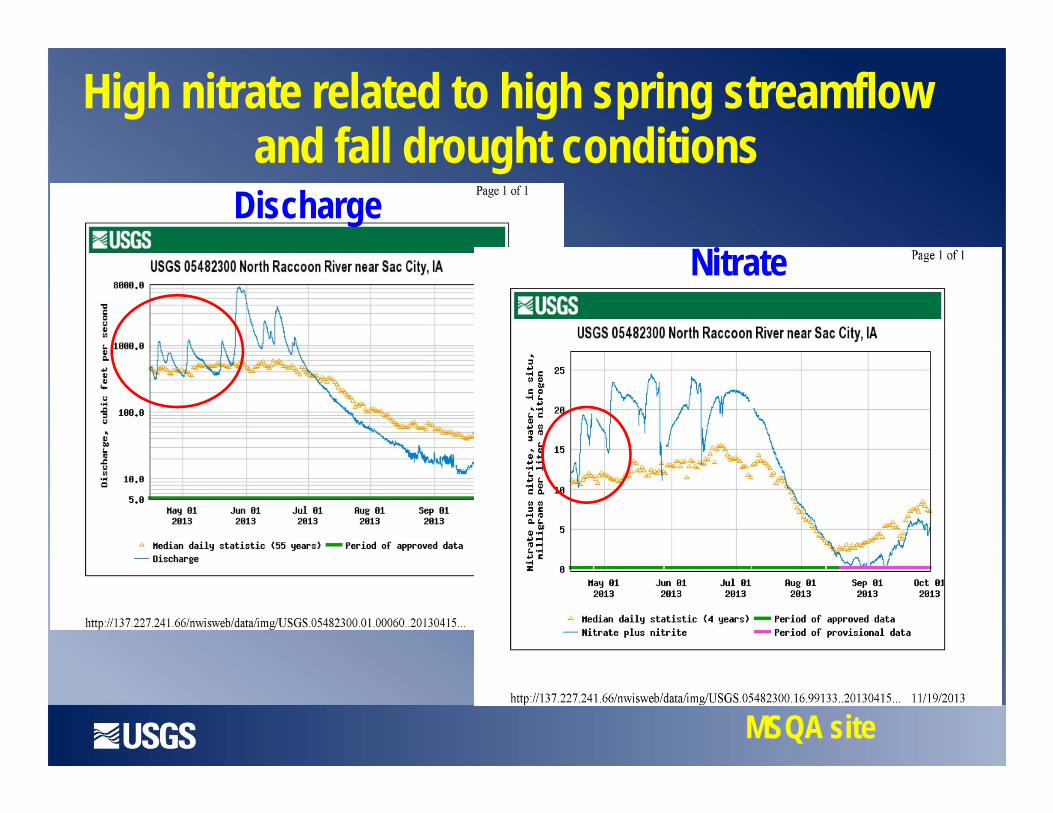
High nitrate related to high spring streamflowand fall drought conditions
MSQA site
DischargeNitrate
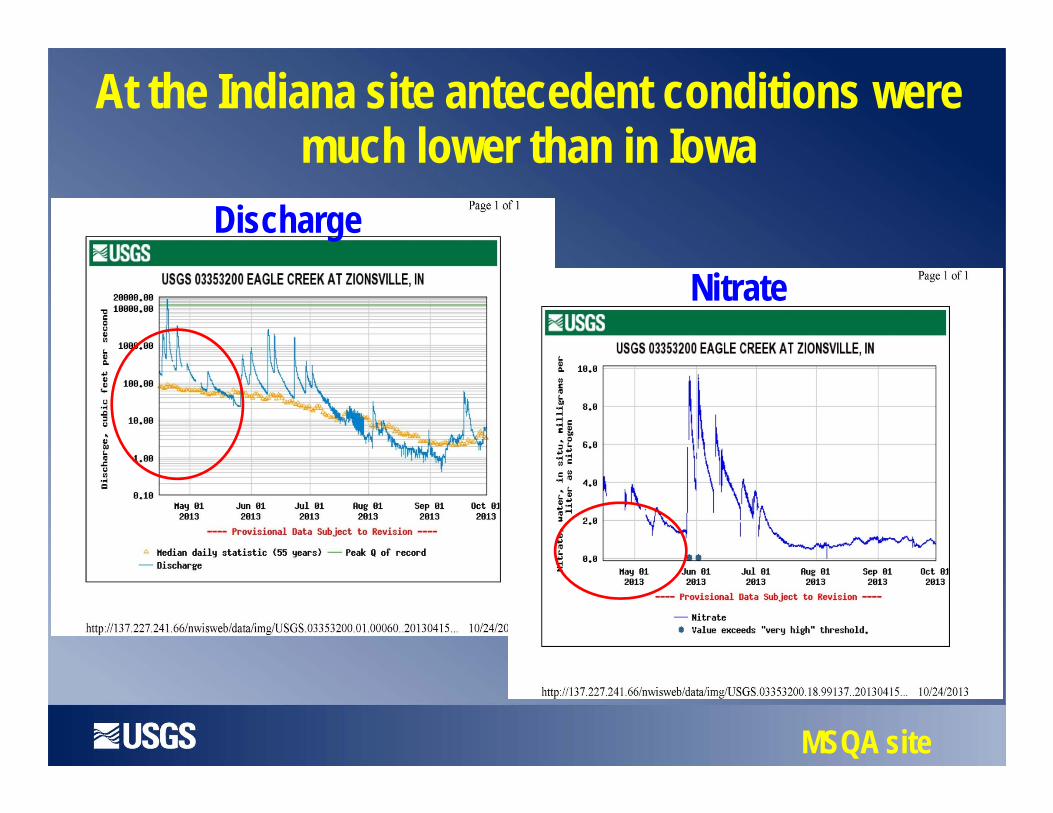
At the Indiana site antecedent conditions were much lower than in Iowa
MSQA site
Discharge
Nitrate
Summary and Future Analysis• Nitrate concentrations were high in 2013 in a wet spring
that followed a drought year in 2012• Highest concentrations – high 30 to low 40 mg/L
• High concentrations followed a west to east regional pattern • This corresponded to the highest loading and longest
drought period• The highest concentrations were in IA and MN in 2013 but
also historical data suggesting drought was only a part of the high nitrate values in 2013
• Correlate streamflow and rainfall with nitrate data
Information and ContactsNAWQA – USGS http://water.usgs.gov/nawqaOPP – USEPA http://www.epa.gov/pesticides/NRSA – USEPA http://water.epa.gov/type/rsl/monitoring/riverssurvey/index.cfm
Jeff Frey(317) 600-2751 [email protected] Van Metre(512) 927-3506 [email protected]
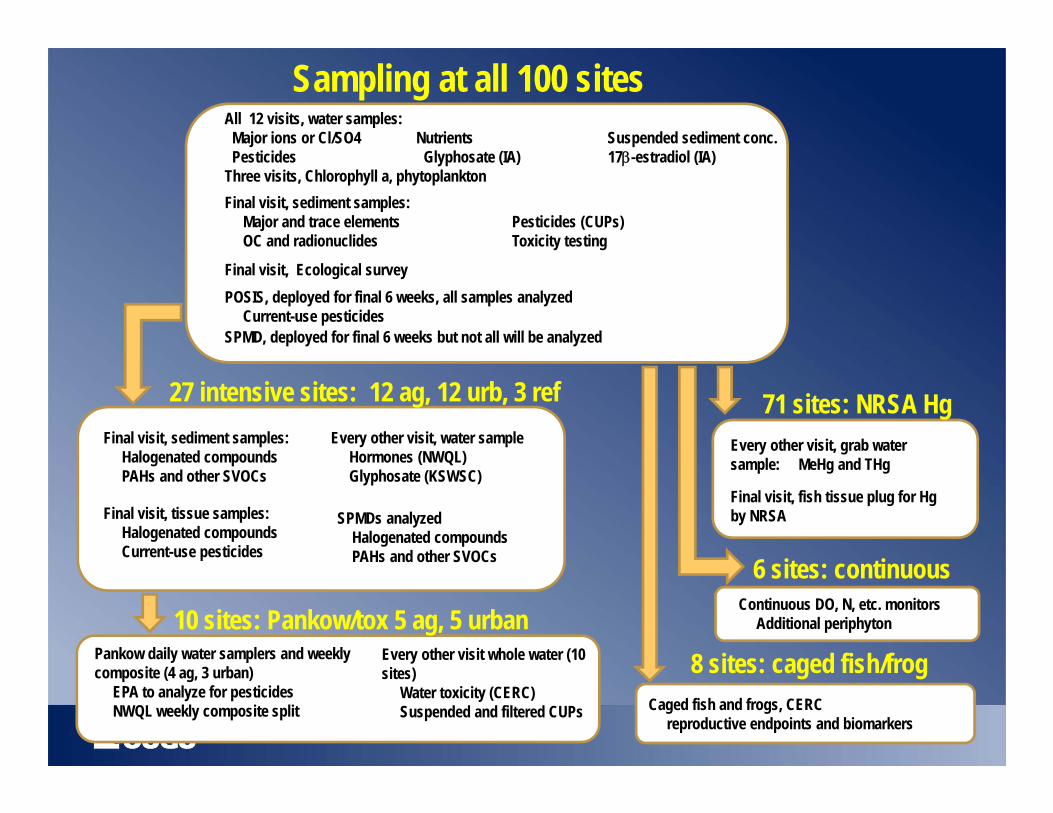
All 12 visits, water samples:Major ions or Cl/SO4 Nutrients Suspended sediment conc.Pesticides Glyphosate (IA) 17-estradiol (IA)
Three visits, Chlorophyll a, phytoplanktonFinal visit, sediment samples:
Major and trace elements Pesticides (CUPs)OC and radionuclides Toxicity testing
POSIS, deployed for final 6 weeks, all samples analyzedCurrent-use pesticides
SPMD, deployed for final 6 weeks but not all will be analyzed
Final visit, sediment samples:Halogenated compoundsPAHs and other SVOCs
Pankow daily water samplers and weekly composite (4 ag, 3 urban)
EPA to analyze for pesticidesNWQL weekly composite split
Final visit, tissue samples:Halogenated compoundsCurrent-use pesticides
Sampling at all 100 sites
27 intensive sites: 12 ag, 12 urb, 3 ref
10 sites: Pankow/tox 5 ag, 5 urban8 sites: caged fish/frog
SPMDs analyzed Halogenated compoundsPAHs and other SVOCs
Caged fish and frogs, CERCreproductive endpoints and biomarkers
Final visit, Ecological survey
Every other visit, grab water sample: MeHg and THg
71 sites: NRSA Hg Every other visit, water sample
Hormones (NWQL)Glyphosate (KSWSC)
Every other visit whole water (10 sites)
Water toxicity (CERC)Suspended and filtered CUPs
Final visit, fish tissue plug for Hg by NRSA
6 sites: continuous Continuous DO, N, etc. monitors
Additional periphyton