Embed Size (px)
Citation preview
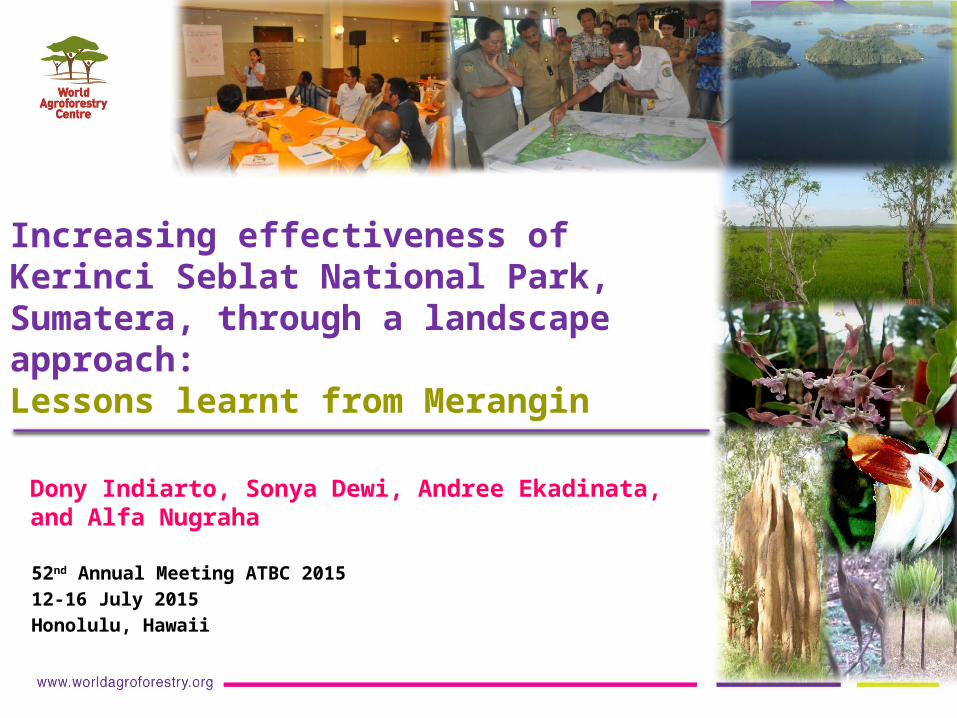
Increasing effectiveness of Kerinci Seblat National Park, Sumatera, through a landscape approach: Lessons learnt from Merangin
Dony Indiarto, Sonya Dewi, Andree Ekadinata, and Alfa Nugraha
52nd Annual Meeting ATBC 201512-16 July 2015Honolulu, Hawaii
Background
• This study focuses on Kerinci Seblat National Park (TNKS), the largest National Park in Sumatra, which spans lowland, montane, and pine forest ecosystems.
• TNKS is home to rich biodiversity, which lately is threatened by loss and fragmentation of habitat.
• The role of agroforestry is not recognized while rich literatures show that matrix matters within landscape mosaics.
Kerinci Seblat National Part
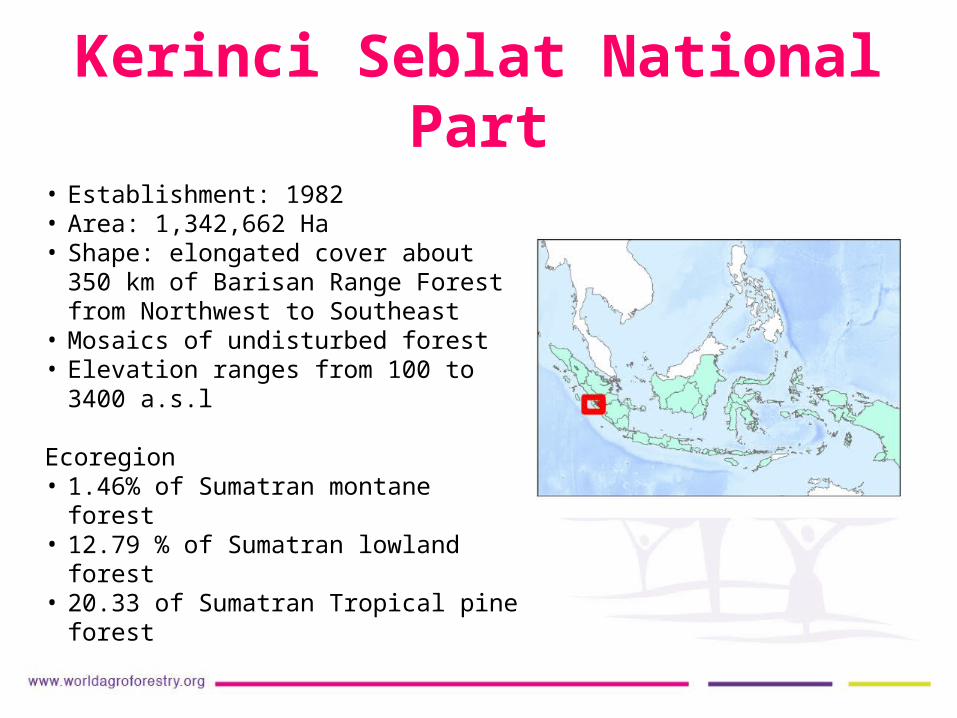
• Establishment: 1982• Area: 1,342,662 Ha • Shape: elongated cover about 350 km
of Barisan Range Forest from Northwest to Southeast
• Mosaics of undisturbed forest• Elevation ranges from 100 to 3400
a.s.l
Ecoregion• 1.46% of Sumatran montane forest• 12.79 % of Sumatran lowland forest• 20.33 of Sumatran Tropical pine forest
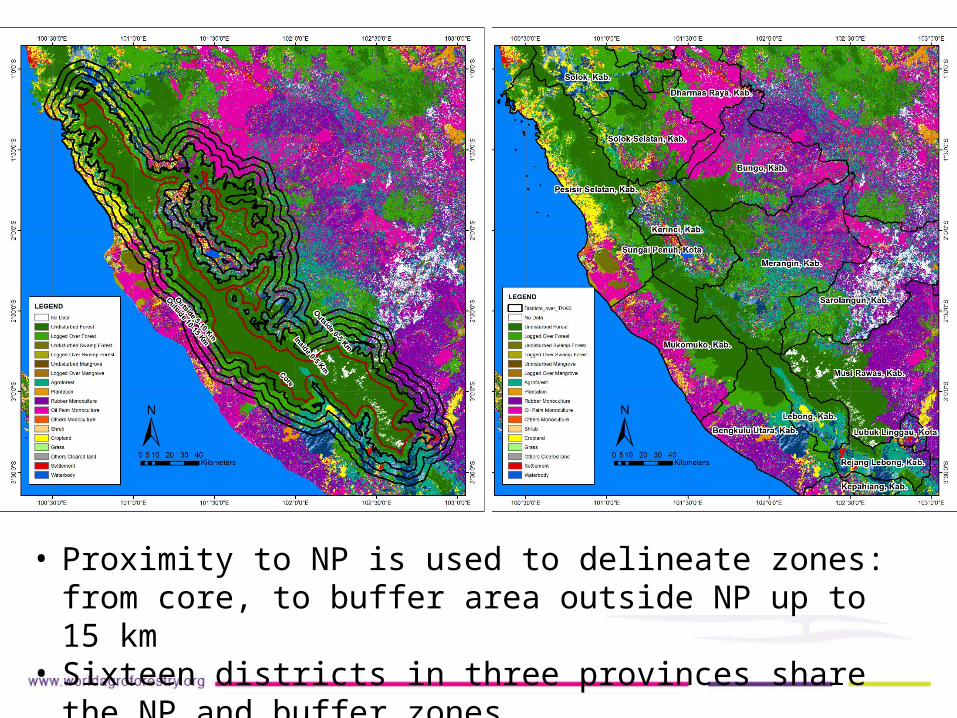
• Proximity to NP is used to delineate zones: from core, to buffer area outside NP up to 15 km
• Sixteen districts in three provinces share the NP and buffer zones
LULCC in NP and surroundings
• Due to high population growth, in-migration, and external market demand, encroachment to TNKS during 20 years period is rampant (240,262 ha forest loss or 17% area)
• In the area surrounding TNKS, conversion of more integrated land-use system such as agroforestry into more intensified uses, especially estate crops, has been active (109,389 ha less of agroforest area and 212,981 ha of increased in estate crops).
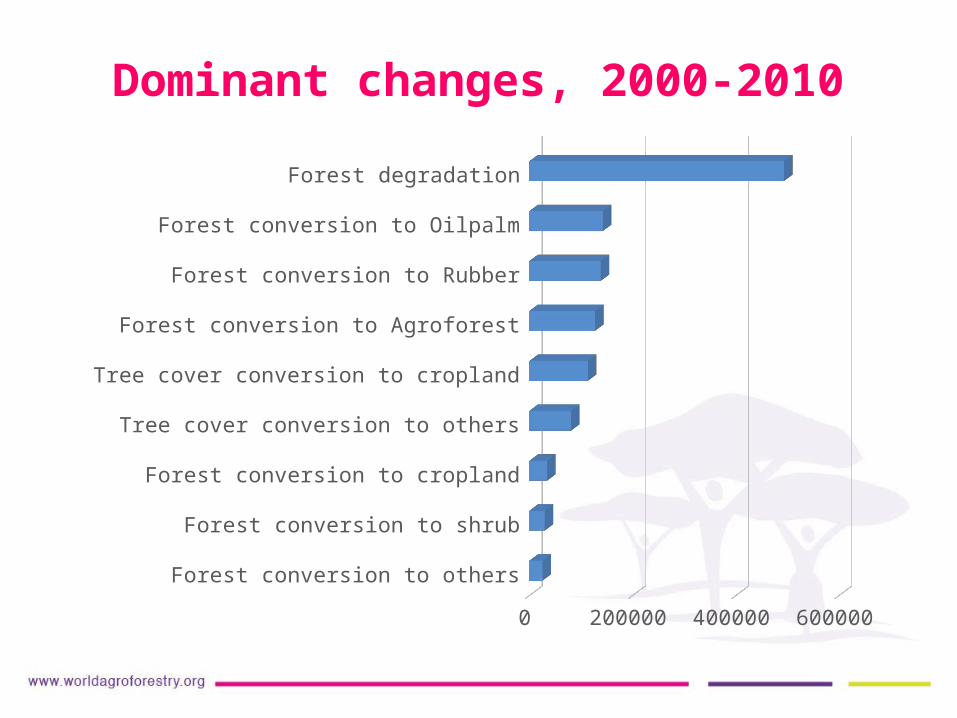
Dominant changes, 2000-2010
Forest conversion to others
Forest conversion to shrub
Forest conversion to cropland
Tree cover conversion to others
Tree cover conversion to cropland
Forest conversion to Agroforest
Forest conversion to Rubber
Forest conversion to Oilpalm
Forest degradation
0 100000 200000 300000 400000 500000
Characterizing habitat changes
• Similarity in habitat qualities across land use/cover classes
• Landscape configuration• Integration of focal area to the landscape• Land sparing or land sharing?

Contrast Table – Plot level
Land Cover Type Forest
Undisturbed forest 0Logged over forest-high density 0.147Logged over forest-low density 0.246
Agroforest 0.4
Timber plantation 0.9
Estate crop 0.9
Shrub 0.6
Configuration: Total Edge Contrast Index (TECI) – Landscape level
Total edge contrast index (TECI) of dense forest is calculated using Fragstat (McGarigal, 2002) as:
for each pixel of size 1 ha in the landscape, where:
– ei is total length (m) of edge in the sub-landscape between dense forest pixel and any other land use/cover type i
– di is the dissimilarity (edge contrast weight) between dense forest pixel (or other defined focal habitat) and any other land use/cover type i
(100)
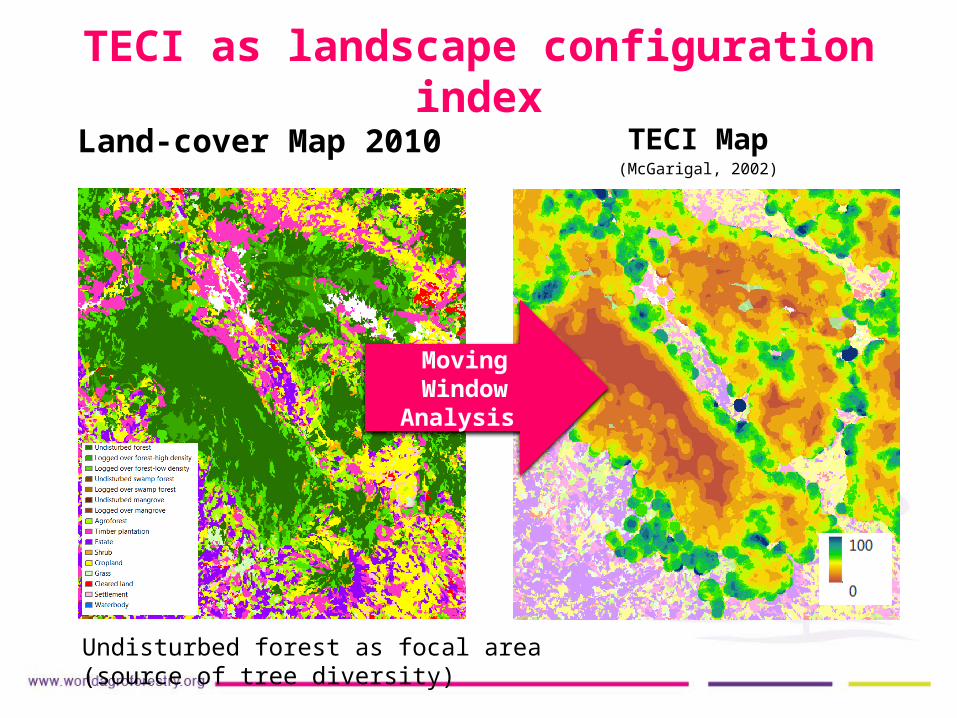
TECI as landscape configuration index
Land-cover Map 2010 TECI Map(McGarigal, 2002)
Undisturbed forest as focal area (source of tree diversity)
Moving Window Analysis
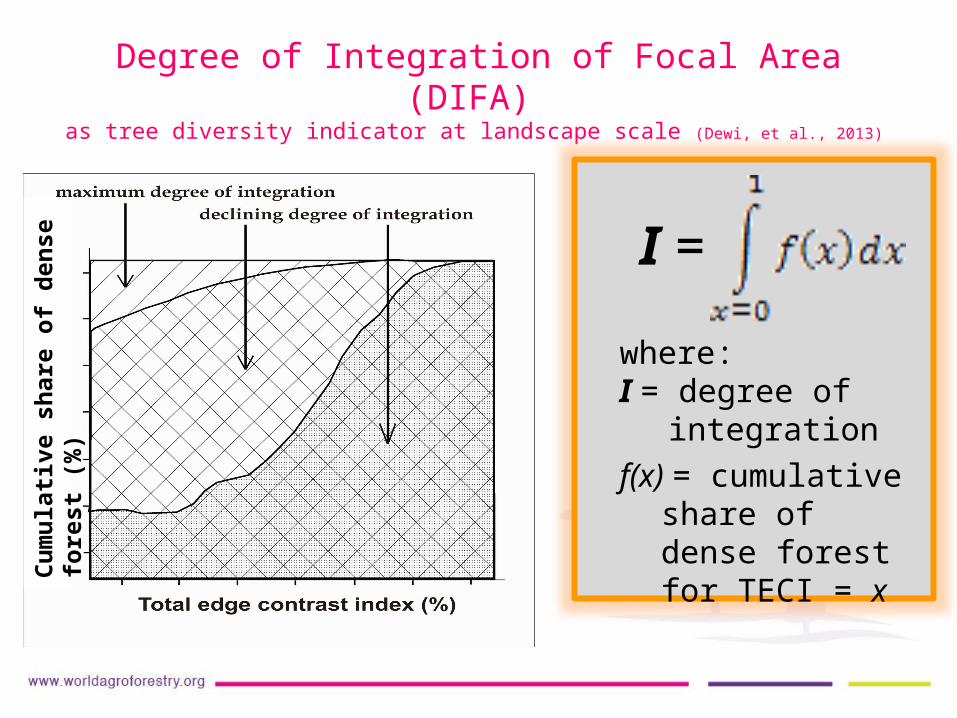
Degree of Integration of Focal Area (DIFA) as tree diversity indicator at landscape scale (Dewi, et al., 2013)
Cum
ulati
ve s
hare
of d
ense
fore
st (%
)
I =
where:I = degree of
integration
f(x) = cumulative share of dense forest for TECI = x
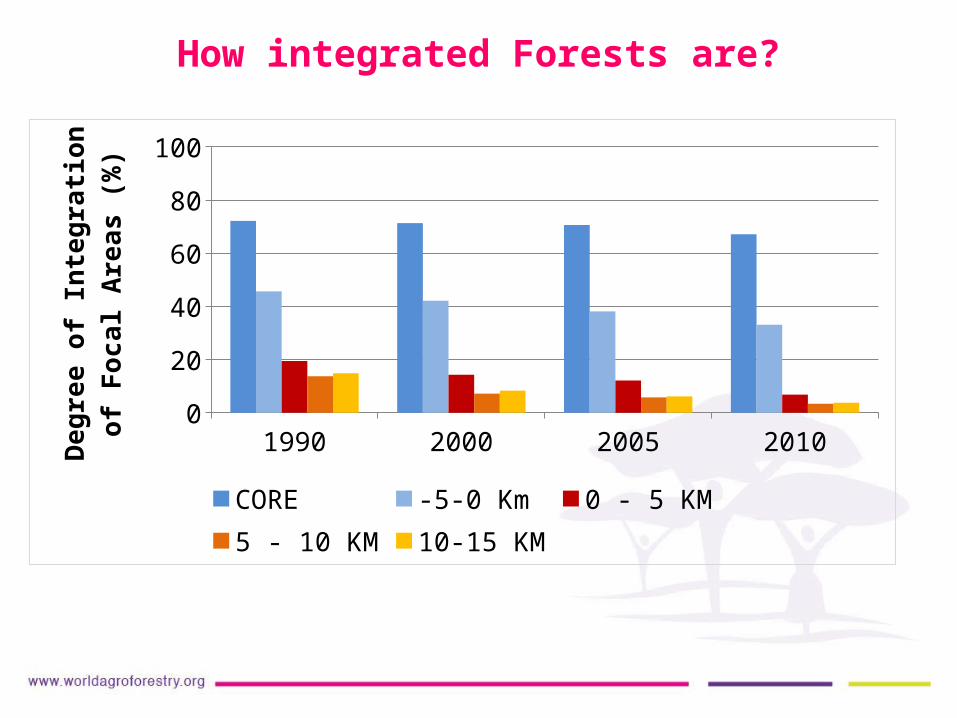
How integrated Forests are?
1990 2000 2005 20100
102030405060708090
100
CORE -5-0 Km 0 - 5 KM 5 - 10 KM 10-15 KM
Deg
ree
of In
tegr
ation
of F
ocal
Ar
eas
(%)
APPLICATION OF LANDSCAPE APPROACH IN MERANGIN DISTRICT
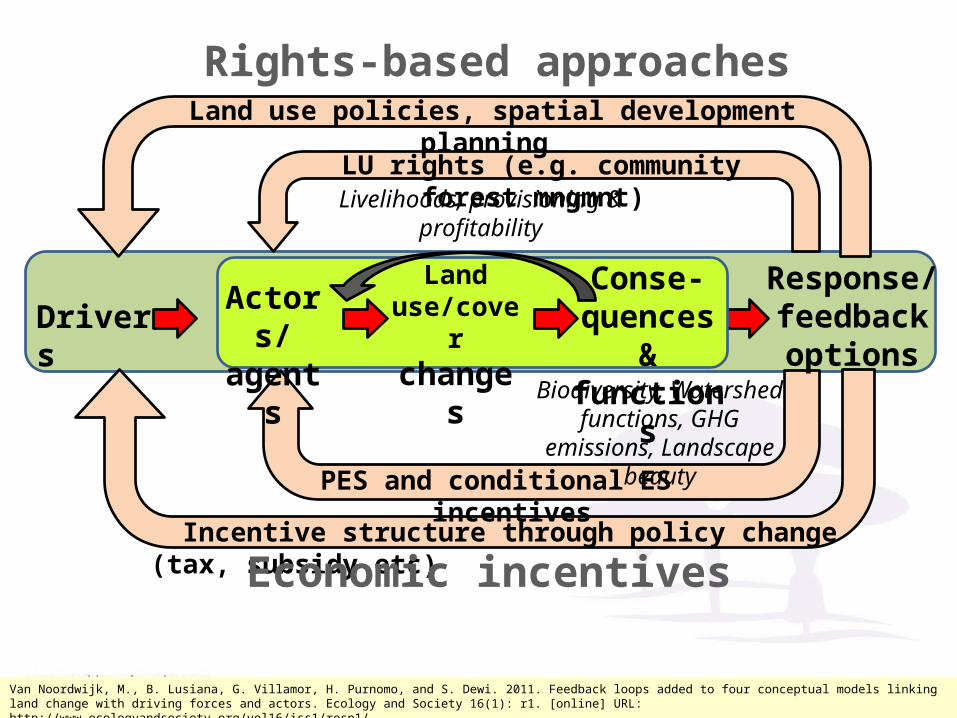
Drivers
Incentive structure through policy change (tax, subsidy etc)
LU rights (e.g. community forest mngmnt)
PES and conditional ES incentives
Response/ feedback options
Biodiversity, Watershed functions, GHG emissions,
Landscape beauty
Actors/ agents
Land use/coverchanges
Conse-quences &functions
Livelihoods, provisioning & profitability
Land use policies, spatial development planning
Rights-based approaches
Economic incentives
Van Noordwijk, M., B. Lusiana, G. Villamor, H. Purnomo, and S. Dewi. 2011. Feedback loops added to four conceptual models linking land change with driving forces and actors. Ecology and Society 16(1): r1. [online] URL: http://www.ecologyandsociety.org/vol16/iss1/resp1/
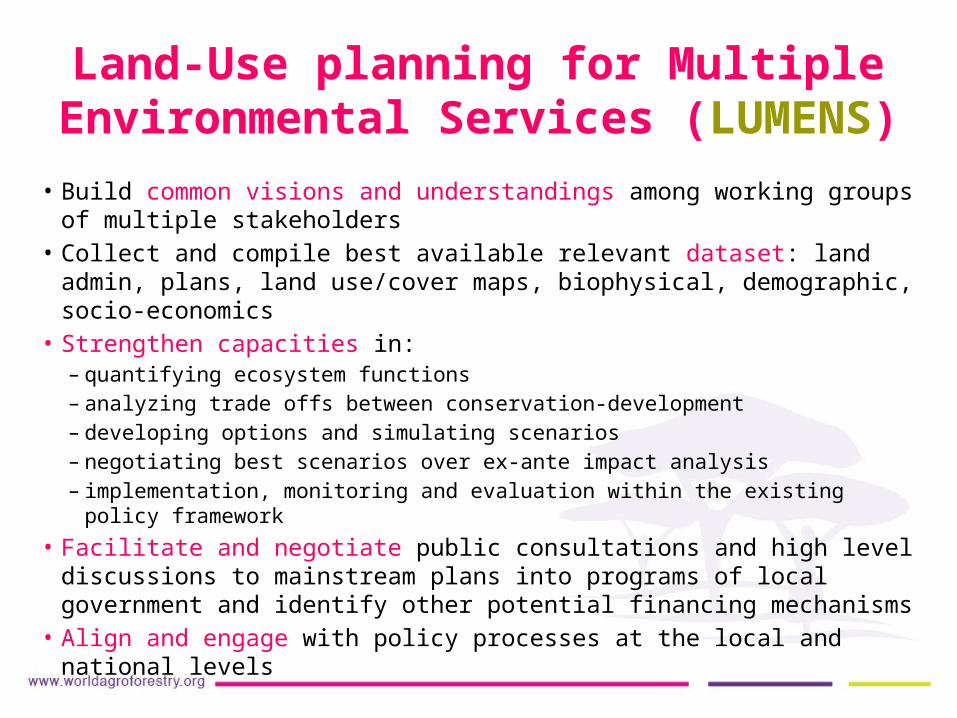
Land-Use planning for Multiple Environmental Services (LUMENS)
• Build common visions and understandings among working groups of multiple stakeholders
• Collect and compile best available relevant dataset: land admin, plans, land use/cover maps, biophysical, demographic, socio-economics
• Strengthen capacities in:– quantifying ecosystem functions– analyzing trade offs between conservation-development– developing options and simulating scenarios– negotiating best scenarios over ex-ante impact analysis– implementation, monitoring and evaluation within the existing policy
framework• Facilitate and negotiate public consultations and high level discussions
to mainstream plans into programs of local government and identify other potential financing mechanisms
• Align and engage with policy processes at the local and national levels
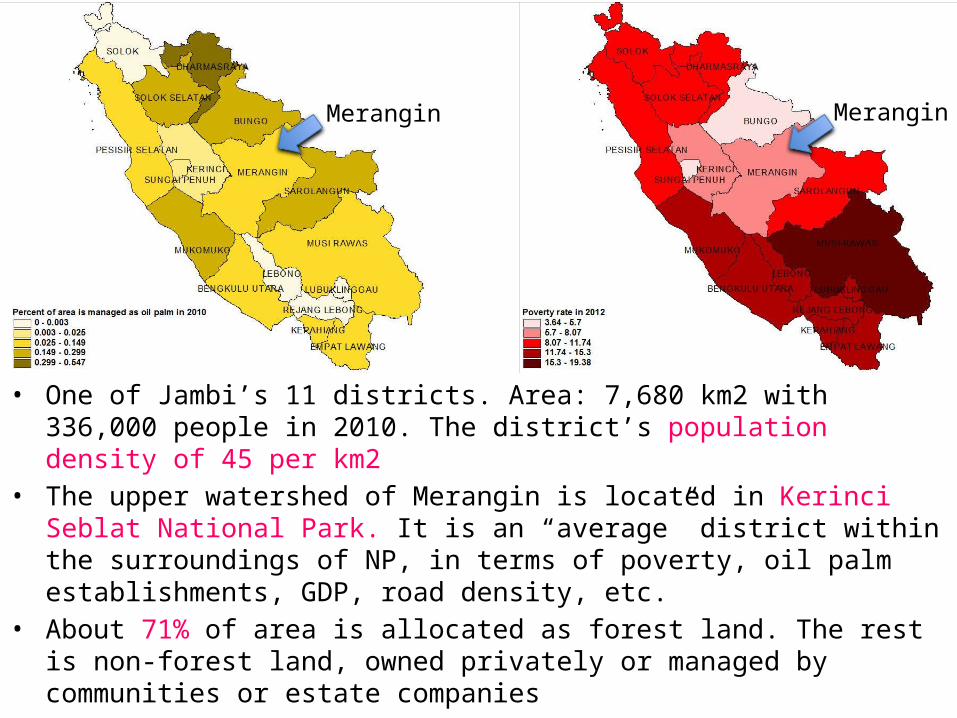
• One of Jambi’s 11 districts. Area: 7,680 km2 with 336,000 people in 2010. The district’s population density of 45 per km2
• The upper watershed of Merangin is located in Kerinci Seblat National Park. It is an “average” district within the surroundings of NP, in terms of poverty, oil palm establishments, GDP, road density, etc.
• About 71% of area is allocated as forest land. The rest is non-forest land, owned privately or managed by communities or estate companies
• In 2011, ICRAF facilitated the establishment of a working group in Merangin that included various stakeholders in land-use planning: the District planning and Development agency, Forestry office, researchers and NGOs
Merangin Merangin
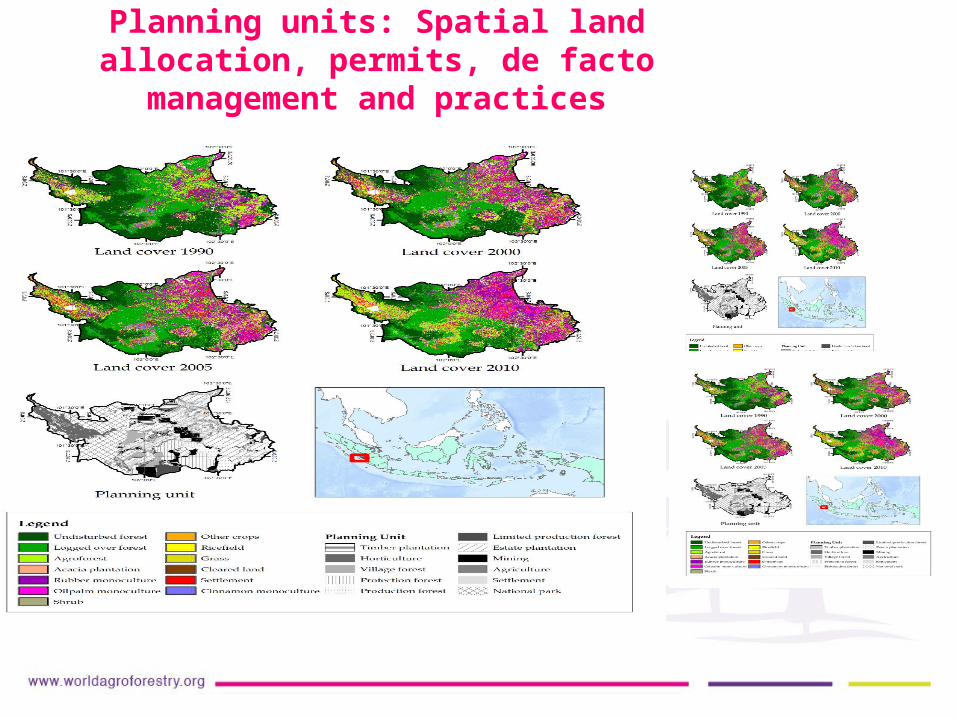
Planning units: Spatial land allocation, permits, de facto management and practices


•Understanding drivers•Where are likely changes will happen
based on the driver modelling •Changes in drivers can be
accommodated, i.e., new road. •Projected conversion areas can be
resulted from: (i) Exogenous process, perhaps from
regional or global models, (ii) Historical LULCC rates in each PU, (iii) Forward-looking scenario, with
considering future needs for lands to improve economics and social performance
2005
2010
Driving factors
2025
Business As Usual Scenario
Scenario development
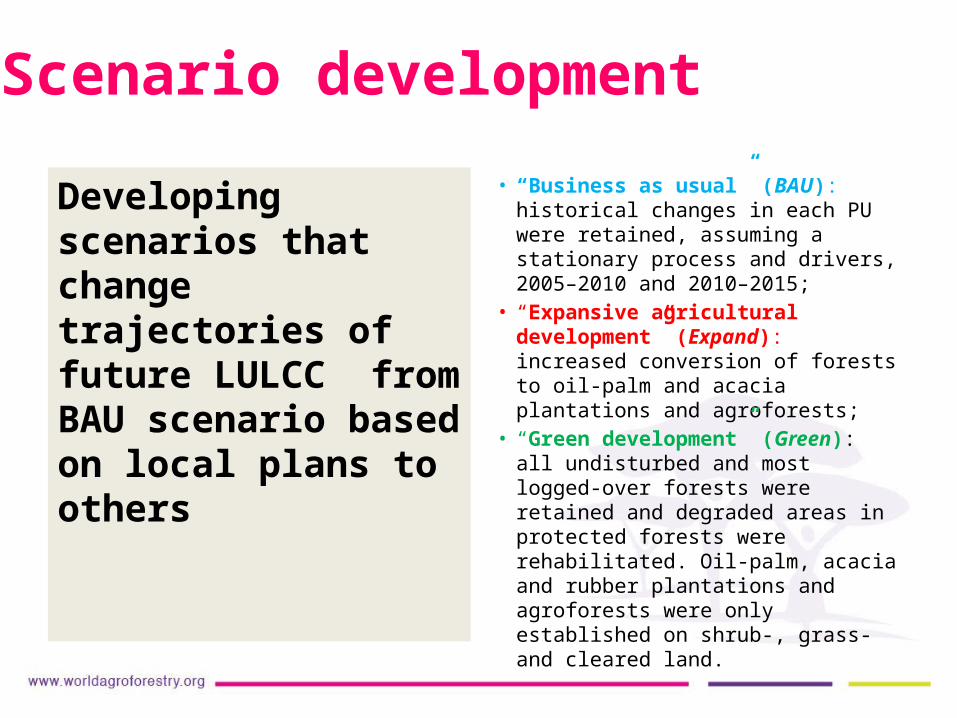
Developing scenarios that change trajectories of future LULCC from BAU scenario based on local plans to others
Scenario development
• “Business as usual” (BAU): historical changes in each PU were retained, assuming a stationary process and drivers, 2005–2010 and 2010–2015;
• “Expansive agricultural development” (Expand): increased conversion of forests to oil-palm and acacia plantations and agroforests;
• “Green development” (Green): all undisturbed and most logged-over forests were retained and degraded areas in protected forests were rehabilitated. Oil-palm, acacia and rubber plantations and agroforests were only established on shrub-, grass- and cleared land.
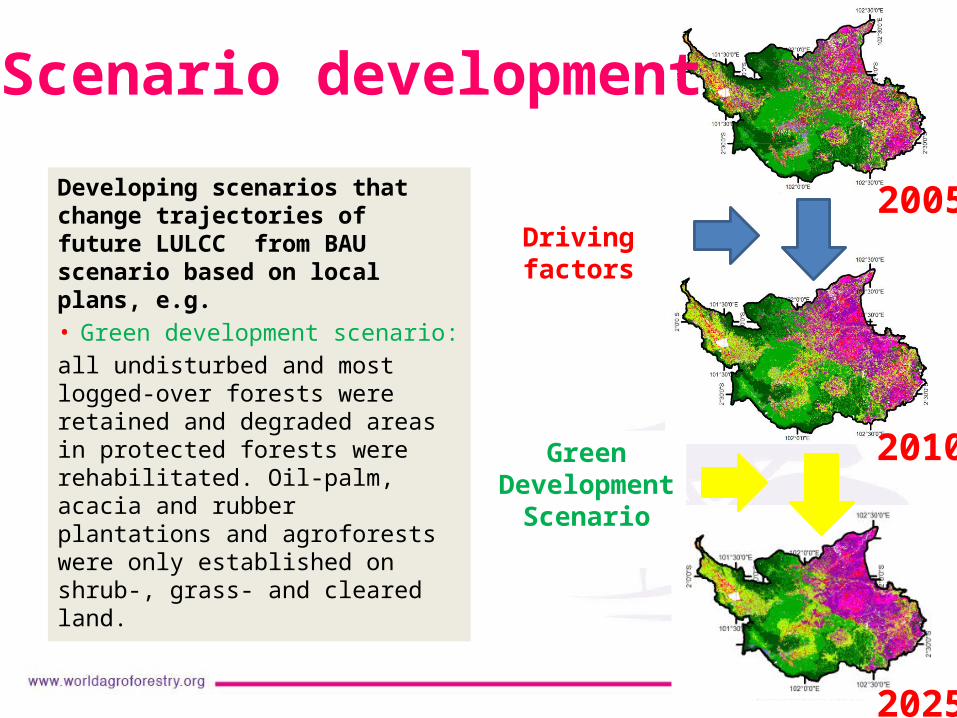
Developing scenarios that change trajectories of future LULCC from BAU scenario based on local plans, e.g.• Green development scenario:all undisturbed and most logged-over forests were retained and degraded areas in protected forests were rehabilitated. Oil-palm, acacia and rubber plantations and agroforests were only established on shrub-, grass- and cleared land.
Green Development
Scenario
Driving factors2005
2010
2025
Scenario development
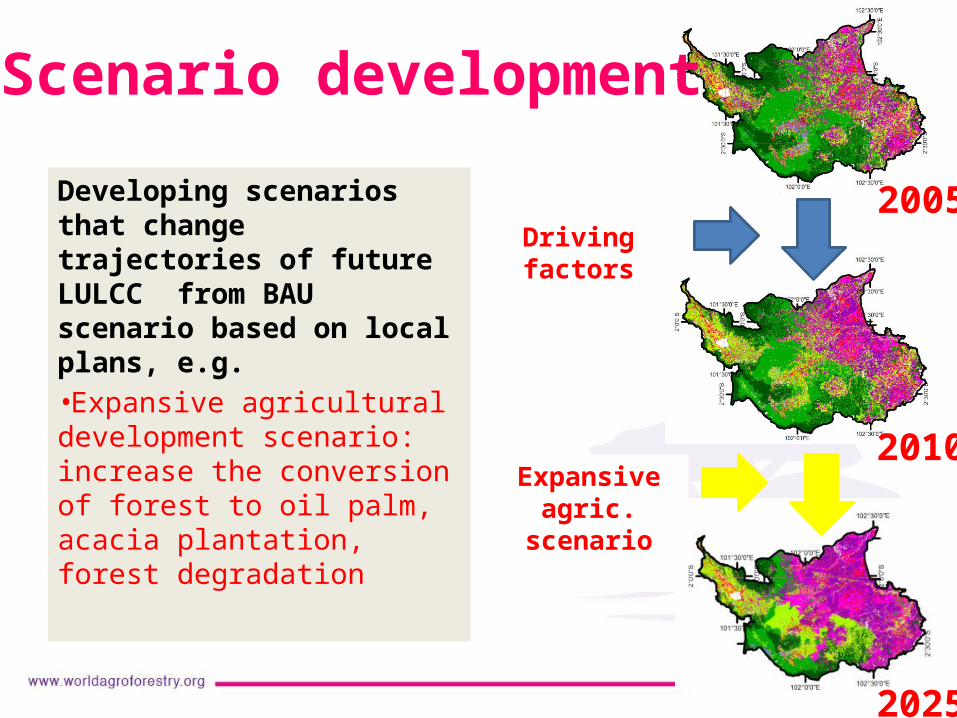
Developing scenarios that change trajectories of future LULCC from BAU scenario based on local plans, e.g.•Expansive agricultural development scenario: increase the conversion of forest to oil palm, acacia plantation, forest degradation
Faktor pemicuDriving factors
Expansive agric. scenario
2005
2010
2025
Scenario development
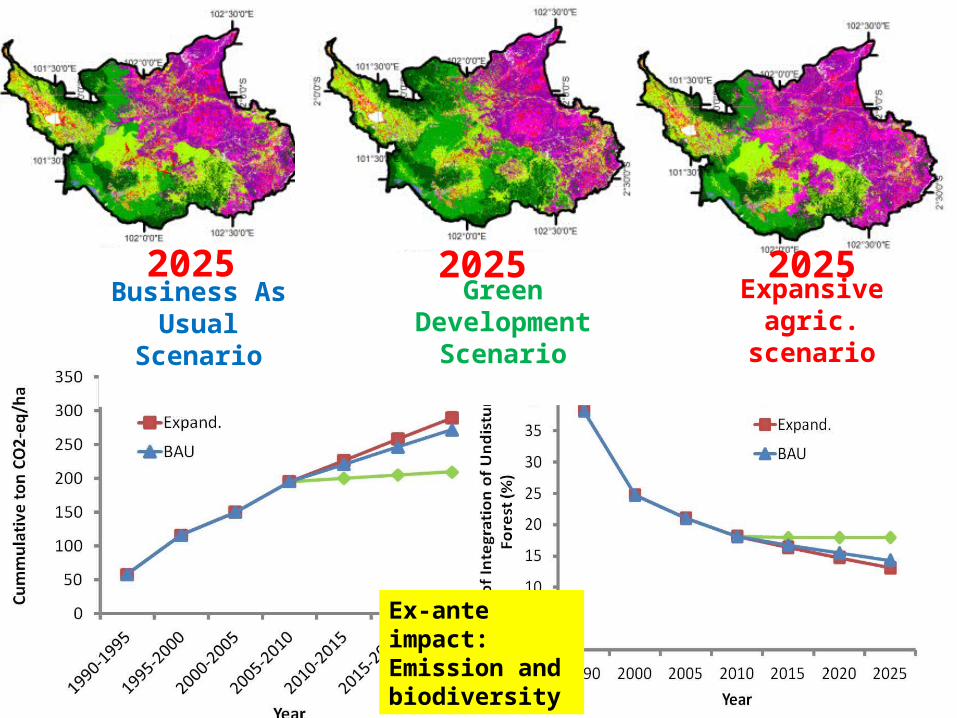
Ex-ante impact:Emission and biodiversity
Expansive agric. scenario
Business As Usual Scenario
Green Development Scenario
2025 20252025
Expansive agric. scenario
Business As Usual Scenario
Green Development Scenario
2025 2025
2010 2015 2020 202517800000.0
18000000.0
18200000.0
18400000.0
18600000.0
18800000.0
19000000.0
19200000.0
19400000.0
BAU EXP GREEN
GDP
in U
SD
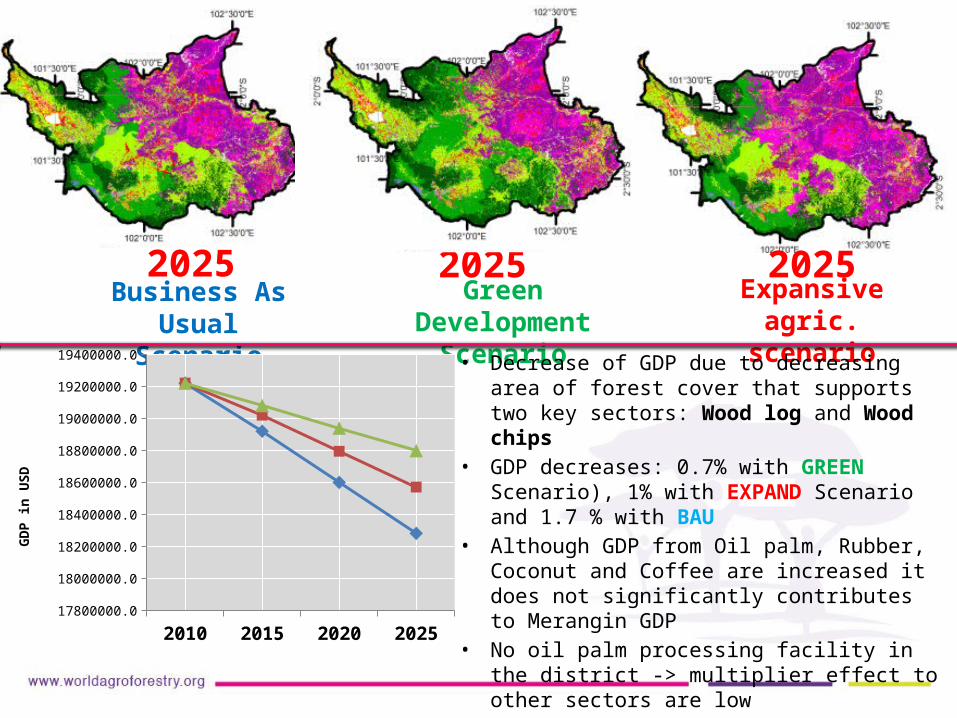
• Decrease of GDP due to decreasing area of forest cover that supports two key sectors: Wood log and Wood chips
• GDP decreases: 0.7% with GREEN Scenario), 1% with EXPAND Scenario and 1.7 % with BAU
• Although GDP from Oil palm, Rubber, Coconut and Coffee are increased it does not significantly contributes to Merangin GDP
• No oil palm processing facility in the district -> multiplier effect to other sectors are low
2025
Expansive agric. scenario
Business As Usual Scenario
Green Development Scenario
2025 20252025
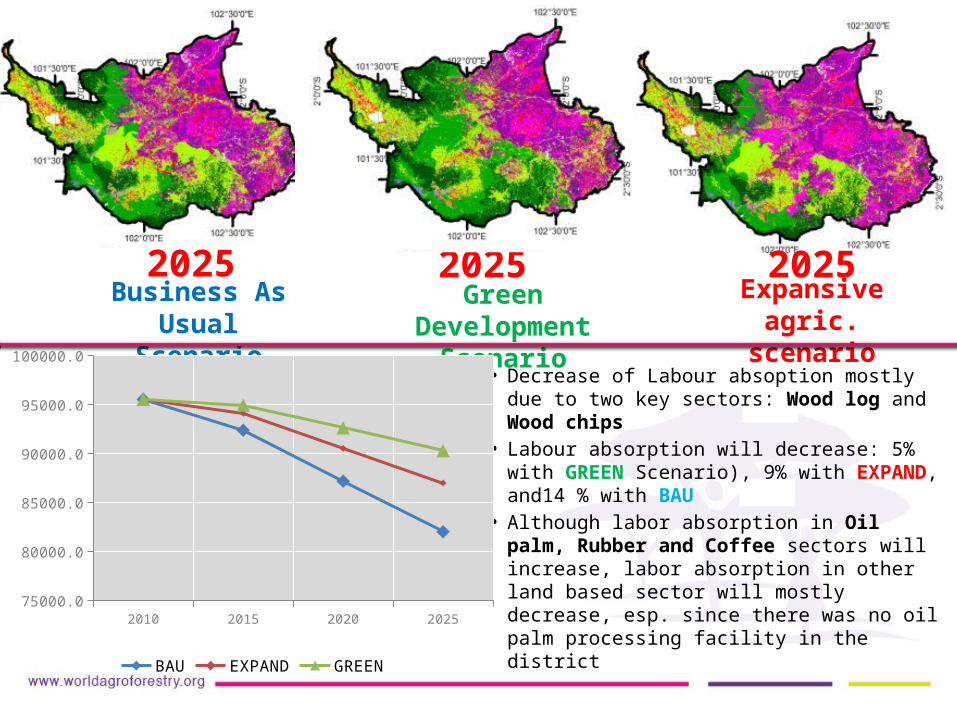
• Decrease of Labour absoption mostly due to two key sectors: Wood log and Wood chips
• Labour absorption will decrease: 5% with GREEN Scenario), 9% with EXPAND, and14 % with BAU
• Although labor absorption in Oil palm, Rubber and Coffee sectors will increase, labor absorption in other land based sector will mostly decrease, esp. since there was no oil palm processing facility in the district
2010 2015 2020 202575000.0
80000.0
85000.0
90000.0
95000.0
100000.0
BAU EXPAND GREEN

Fine-tuning scenarios• Modified Green Scenario by maintaining SFM, high
economic value and labor intensive cropland and tree crop (paddy rice and cinnamon)
2010 2015 2020 202517600000.0
17800000.0
18000000.0
18200000.0
18400000.0
18600000.0
18800000.0
19000000.0
19200000.0
19400000.0
BAU
EXP
GREEN
Modi-fied-GREEN
GD
P in
USD
2010 2015 2020 202580000.0
82000.0
84000.0
86000.0
88000.0
90000.0
92000.0
94000.0
96000.0
98000.0
100000.0
BAU
EXPAND
GREEN
Modi-fied-GREEN
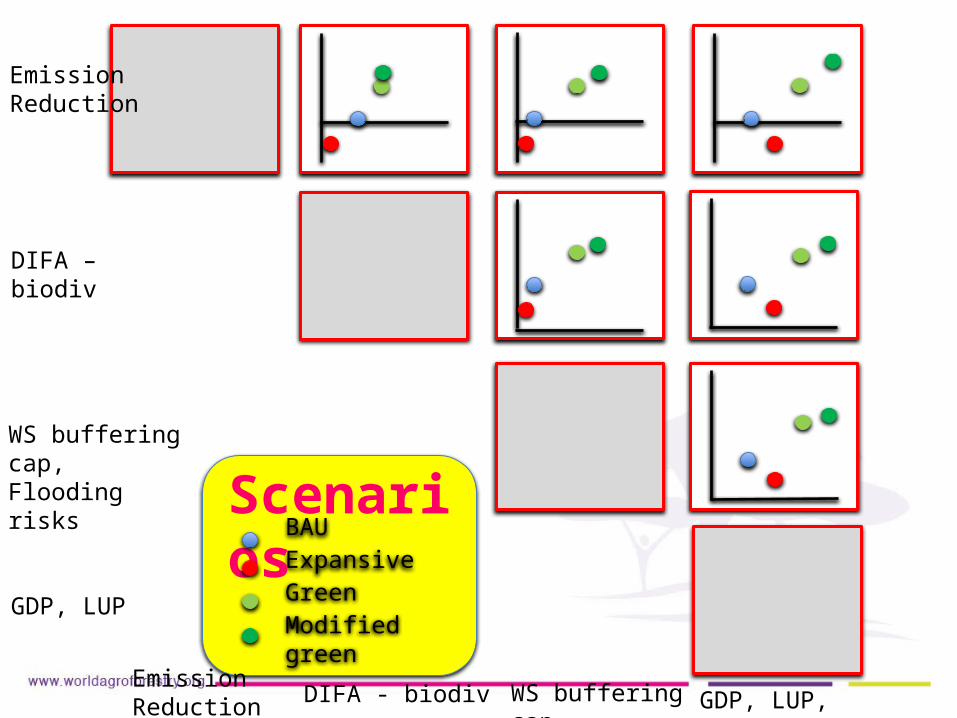
BAU Expansive Green Modified green
Emission Reduction DIFA - biodiv WS buffering cap GDP, LUP, Labor
Emission Reduction
DIFA – biodiv
WS buffering cap, Flooding risks
GDP, LUP
Scenarios
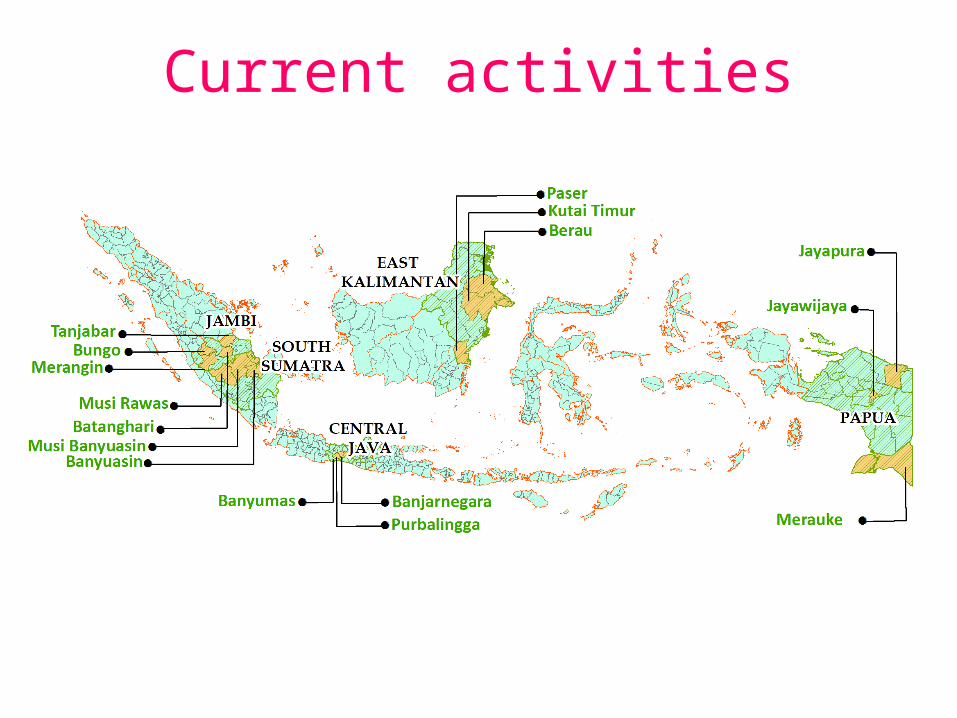
Current activities
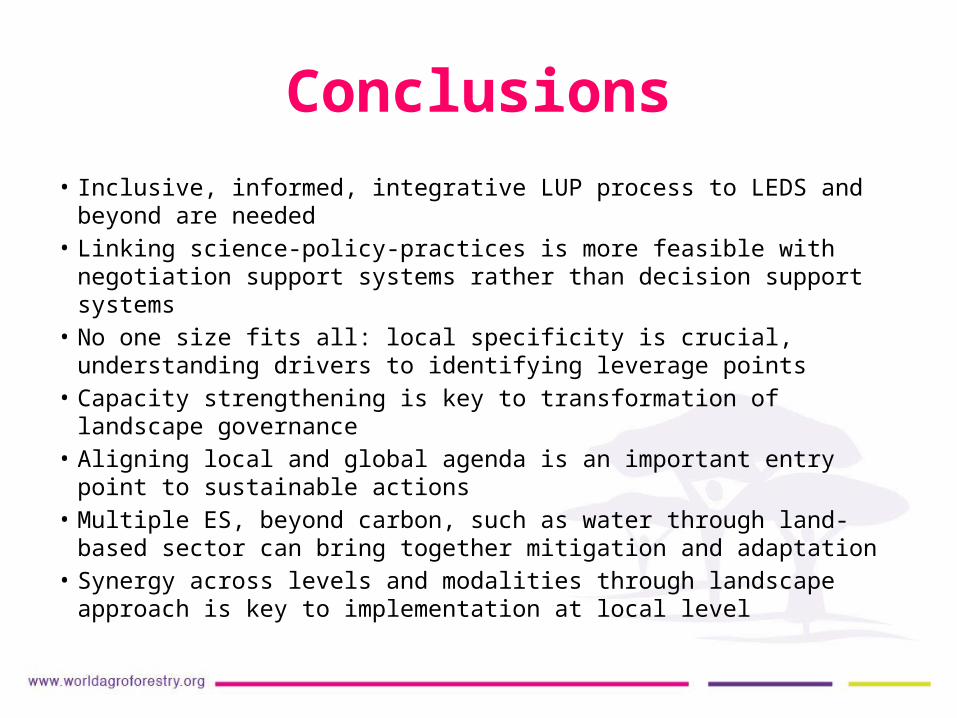
Conclusions• Inclusive, informed, integrative LUP process to LEDS and beyond are
needed• Linking science-policy-practices is more feasible with negotiation
support systems rather than decision support systems• No one size fits all: local specificity is crucial, understanding drivers to
identifying leverage points• Capacity strengthening is key to transformation of landscape governance • Aligning local and global agenda is an important entry point to
sustainable actions• Multiple ES, beyond carbon, such as water through land-based sector
can bring together mitigation and adaptation• Synergy across levels and modalities through landscape approach is key
to implementation at local level

MAHALO!THANK YOU! TERIMA KASIH!