Embed Size (px)
Citation preview


POTENTIAL OF ENVIRONMENTAL SERVICES IN THE COMMON
PROPERTY IN MEXICO

4

5
Credits
Authors:Juan Antonio Reyes González
José Pablo Gómez BarrónRene Osaland Muis
Rafael Zavala Gómez del Campo
Collaborators:Santiago Ruy Sánchez de Orellana
María José Sarmiento AguirreJosé Javier Ochoa Covarrubias
Liliana Mena Alonso
Design:Andrea González Espinosa
Ignacio Carlos Álvarez Orozco
Photographs:RAN-IICA Project
Ancuta Caracuda
Summary for the English version:Iris Jimenez
Translation:Keith MacMillan
Rene Osaland Muis
Citation format:Reyes, J.A., J.P. Gómez, R.O. Muis. and R. Zavala 2012. Potential of
Environmental Services in the Social Property of Mexico. (English summary). National Agrarian Registry (RAN) – Inter-American Institute of Cooperation on
Agriculture (IICA) Project. Mexico, D.F. Mexico 2012

6

7
Index
Acronyms 9
Message from the Director in Chief of the National Agrarian Registry 10
Message from the Chief Representative of the Inter-American Institute for
Cooperation on Agriculture in Mexico11
Presentation 12
Summary 13
I. Context 16
Common property in Mexico 17
Environmental services 20
II. Importance of common property in the aspect of environmental services 22
Carbon content in natural vegetation 24
Biodiversity conservation 29
Water reserves 34
III. Environmental services with emphasis on Reducing Emissions from Deforestation
and Forest Degradation (REDD)37
Multicriteria evaluation 38
Funding for REDD in Mexico 50
General project model 56
IV. Conclusions 60
References 64
Annexes 66
Annex 1. Ecosystems and vegetation types 67
Annex 2. Allocation of scores to the criteria with categories 69
8
DirectorySECRETARIA DE LA REFORMA AGRARIA (SRA)
Agr. Abelardo Escobar Prieto
Secretario de la Reforma AgrariaAv. H. Escuela Naval Militar # 669, Col. Presidentes Ejidales, 2a Sección.
Del. Coyoacán, C.P. 04470, México D.F. Tel. 5624-0000
REGISTRO AGRARIO NACIONAL (RAN)
Ing. Juan Manuel Emilio Cedrún Vázquez
Director en Jefe del Registro Agrario Nacional
Dirección General de RegistroLic. Sofía Imelda Sosa Casas
Dirección General de Catastro RuralIng. Eusebio Arnaldo Arreola Semadeni
Coordinación InterinstitucionalLic. Francisco Barrera Mendoza
Av. 20 de Noviembre # 195, Col. Centro.Del. Cuauhtémoc, C.P. 06080, México D.F. Tel. 5062-1400
INSTITUTO INTERAMERICANO DE COOPERACIÓN PARA LA AGRICULTURA (IICA)
Dr. Víctor Villalobos Arámbula
Director General600 m Norte del Cruce Ipís-Coronado Apartado 55-2200 San Isidro de
CoronadoSan José, Costa Rica. Tel: (506) 2216-0222
IICA México
Ing. Gino Buzzetti Irribarra
RepresentanteDr. Rafael Zavala Gómez del Campo
Coordinador General del Proyecto IICA-RANSan Francisco No 1514, Col. Tlacoquemécatl del Valle
Del. Benito Juárez, C.P. 03200, México, D.F.

9
Acronyms
CONABIOComisión Nacional para el Conocimiento y Uso de la Biodiversidad (National Commission for the Knowledge and Use of the Biodiversity)
CONAFOR Comisión Nacional Forestal (National Forestry Commission)
CONAGUA Comisión Nacional del Agua (National Water Commission)
ENAREDD Estrategia Nacional de Reducción de Emisiones por Deforestación y Degradación (National REDD strategy)
FANAR Fondo de Apoyo para Núcleos Agrarios sin Regularizar (Supporting Fund For Non-Regularized Agrarian Nucleuses)
FAO Food and Agriculture Organization of the United Nations
FIFONAFE Fideicomiso Fondo Nacional de Fomento Ejidal (National Trust Fund for Communal Lands Encouragement)
FIRA Fideicomisos Instituidos en Relación con la Agricultura (Trust Fund for Rural Development)
GHG Green House Gases
IICA Inter-American Institute for Cooperation on Agriculture
INE Instituto Nacional de Ecología (National Institute of Ecology)
INEGIInstituto Nacional de Estadística y Geografía (National Institute for Statistics and Geographic Information)
MRV Monitoring, Reporting y Verification
NA Núcleo Agrario (Agrarian Nuclei)
PA Procuraduría Agraria (Agrarian Attorney’s Office)
PES Payment for Environmental Services
PHINA Padrón e Historial de Núcleos Agrarios (Historical Census of Agrarian Nuclei)
PROCEDE Programa de Certificación de Derechos Ejidales y Titulación de Solares Urbanos (Program for the Certification of Ejido Land Rights and the Titling of Urban House Plots)
RAN Registro Agrario Nacional (National Agrarian Registry)
REDD Reducing Emissions from Deforestation and Forest Degradation
SAGARPA Secretaría de Agricultura, Ganadería, Desarrollo Rural, Pesca y Alimentación (Ministry of Agriculture, Livestock, Rural Development, Fisheries and Food)
SEMARNAT Secretaría de Medio Ambiente y Recursos Naturales (The Ministry of Environment and Natural Resources)
SRA Secretaría de la Reforma Agraria (Agrarian Reform Secretariat)

10
Message from the Director in Chief of the National Agrarian Registry
Message from the Director in Chief of the National Agrarian Registry
Ejidos1 and communities occupy 53% of the national territory. The common property in Mexico is formed by more than 31,700 agrarian nucleuses , these are territorial units with specific environmental, social, economic and politic attributes, therefore each ejido and community has different needs.
In this context, a fundamental part of the work undertaken by the Agrarian Reform Secretariat is to identify economic opportunities and fortify the development of the rural sector.The Support Fund for Agrarian Nuclei without Regularization (FANAR, by its Spanish acronym) aims to facilitate this task, and in 2011 the National Agrarian Registry (RAN, by its Spanish acronym) signed a technical cooperation agreement with the Inter-American Institute for Cooperation on Agriculture (IICA).
A significant part of this agreement is the implementation of programs and projects in agrarian nucleuses regularized and certified by FANAR, it also offers an opportunity to propose different options of development for each regularized ejido or community, depending on its specific characteristics.One of the lines of work included in the agreement is the formulation of a strategy aimed to enhance the participation of regularized agrarian nucleuses in payment for environmental services schemes. This is an innovation in four ways:
(i) It includes other activities, a part from the traditional agriculture and livestock, giving new economic options for the rural population;
(ii) It focuses on the dominant property regime in the country, involving stakeholders in a national environmental service initiative;
(iii) The conservation and improvement of environmental services does not only represent a source of income, but also has the potential of generating direct local benefits; and
(iv) It propitiates an active participation of the common property in environmental services schemes, which internationally, have been orientated more and more to maximize the social benefits.
This document presents the findings in the first stage of the Strategy for Environmental Services and Common Property, which analyzes the relative importance of the environmental services in the agrarian nucleuses, such as: forest carbon, biodiversity and hydrological cycles. An important conclusion of this analysis is that none of the three themes can be efficiently developed without the integration of the common property.
As part of the findings, 115 ejidos and communities were identified with the highest potential to contribute in the provision of the three environmental services: carbon storage and capture, biodiversity conservation and maintenance of the hydrological cycle. In the next stage, these agrarian nucleuses will be analyzed for its feasibility in order to be included in payment for environmental services schemes.In this way, the Secretariat gives the agrarian sector a new profile, contributing to the national development with a territorial focus and integrating its policies in environmental, social and market orientated aspects in order to provide different development alternatives for the rural population.
Director in Chief
Juan Manuel Emilio Cedrún Vázquez

11
Message from the Chief Representative of the Inter-American Institute for Cooperation on Agriculture in MexicoIn IICAs 2010-2014 Medium-Term Plan, it is outlined that its main strategic objectives are: enhancing the contribution of the agriculture in territorial development and rural wellbeing, improve agricultural adaptation to climate change, and enhance the efficient use of natural resources, amongst others.
All these are central elements in this publication, called “Potential of environmental services in Mexico’s common property”, one of the products of the collaboration between IICA and RAN, a decentralized agency of the Agrarian Reform Secretariat, and which is inserted in the framework of the technical Convention signed in 2011.
For our Institute it is an honor to participate in investigations that generate knowledge about the socio-economic realities of the Mexican farmers, and that specifically involves sustainable development on one hand, and improves livelihoods, on the other.
The shared vision of a territorial development involves a multi-sectorial approach; in this case it involves the agrarian and environmental sectors. We are convinced that the agricultural challenges we see nowadays do not only depend on one sector and it is necessary to cooperate between different sectors and disciplines to promote a territorial vision.
This publication represents the first “priority sites” exercise for environmental services in common property ever to be published in Mexico. This property regime, which covers 104 million hectares, involves more than 32,000 ejidos and communities and represents 53% of the national territory, is of great importance for agriculture, livestock and forestry activities in the country, but it also has a huge social relevance for rural development.
Focusing on the environmental potential in Mexico’s common property is an innovative process, which requires technological transfers that IICA puts at the disposal of all the Americas, generating technical hubs that define strategies, increases capacities and implements territorial projects with high stakeholder´s participation, not only in the common property, but also in the rest of the agricultural sector and in different countries on our continent. The challenge for the technical staff is to generate public policies that have an impact on the regional development at medium and long term.
We are convinced that this document will be an important contribution for the development of the agricultural sector in Mexico. We invite other actors to develop joint strategies, in which IICA is willing to collaborate.
IICA’s chief representative in Mexico
Gino Buzzetti Irribarra

12
PresentationThis document is one of the results of a collaboration agreement between the National Agrarian Registry (RAN, by its Spanish acronym) —a decentralized agency of the Secretariat of Agrarian Reform— and the Inter-American Institute for Cooperation on Agriculture (IICA) —a specialized agency of the Organization of American States promoting agricultural and rural well-being in the Americas. The IICA’s purpose is to provide assistance to the Mexican government in areas such as capacity building, agricultural planning and development in ejidos and communities throughout the country.
As part of the agreement, the IICA analyzed the possibilities of implementing environmental services strategies in the common property, within the ejidos and communities (both called agrarian nucleuses in English). This analysis is important, due to the fact that environmental services are increasingly recognized worldwide, and they can offer dual benefits to the agrarian nuclei (AN): it promotes the conservation of natural resources, while it generates financial income for the inhabitants, whom often are living in poor rural areas.In addition, it is difficult to think of environmental services schemes in Mexico without taking the common property (which represents more than half of the national territory) into account. However, regulation of these AN is necessary in order to facilitate their access to payment for environmental services schemes.
An innovative evaluation is presented in this document, which integrates geospatial information from different sources, and generates a database that combines agrarian and environmental information, making it useful for a variety of purposes. Through processing and analyzing this database, a prioritization of environmental services was determined for each of the more than 30,000 AN in Mexico. This analysis sets a precedent; it is the first exercise of prioritization for environmental services with the focus on AN on a national and regional level to be published in Mexico.
The full document (which can be downloaded from the IICA’s website: www.iica.org.mx) is composed of three chapters. The first presents the main characteristics of the common property in Mexico and provides a definition of environmental services. The second chapter describes the analyses conducted in order to estimate the potential of each AN to provide environmental services. Finally, a prioritization exercise of the AN with potential for development of environmental service projects is presented, with an emphasis on REDD+ (Reduction of Emissions from Deforestation and forest Degradation) and recommendations are made in terms of funding and project formulation.

13
SummaryIn order to identify environmental services potential as an economic alternative for ejido and community development, a team of specialists from the RAN-IICA Technical Cooperation Project carried out a prioritization analysis based on numerous variables. Through this analysis, considering almost 30,000 ejidos and communities in Mexico, the AN with the greatest potential for being incorporated into environmental services schemes were identified.
The environmental services analyzed were related to vegetation type, species richness and the hydrological attributes of the AN: (i) carbon capture and storage (vegetation carbon content calculated with data from CONAFOR); (ii) biodiversity conservation (Priority regions, CONABIO); and (iii) maintenance of the hydrological cycle (Water reserves, CONAGUA).
First, the relative importance of common property in relation to environmental services was calculated. Carbon density (tonnes/ha) was used for 47 different vegetation types —grouped into temperate forests, tropical forests and scrublands— as well as the total carbon per AN. The analyzed AN contained 1,434 million tonnes (Mt) of carbon, equivalent to seven times Mexico’s annual greenhouse gas emissions. Of all the analyzed AN, twelve were classified as very high concentration (4.3 - 19.2 Mt of carbon) and 115 as high (1.2 – 4.2 Mt). It should be noted that these carbon values represent an estimated minimum, since neither the content of carbon in soil, nor the carbon in other vegetation types are included.
Regarding the importance of biodiversity conservation: 6,592 AN have part or all of their territory within one or more terrestrial priority regions (TPR) proposed by CONABIO and they are present in all of the 152 TRP, representing 50% of their surface. Also all of the hydrological priority regions (HPR) have a certain amount of their surface within 12,717 ejidos or communities (38.7 million hectares, equivalent to 48% of the total surface of HPR).
Finally, the hydrological services: 99% of the 189 potential water reserves (PWR) proposed by CONAGUA have part of their surface within common property. This involves 7,452 AN representing 23.4 million hectares, equivalent to 52% of the PWR surface.
According to those figures, the common property accounts for half of the environmental services “provision” in Mexico, this clearly means that no national strategy can be successful without the active participation of the inhabitants of ejidos and communities. In the following table, the importance of common property regarding biodiversity conservation and hydrological services is highlighted.

14
*Priority sites featuring some area within Social Propety**Area within Social Property
Importance of Social Property in national strategies of environmental services
Environmental ServiceBiodiversity
Terrestrial Aquatic Hydrological
Priority units
Spatial coincidence*
Agrarian nuclei (No.)
Relative importance**
Area (Mha)
152 TPR
100%
6,592
50%
25.7
110 HPR
100%
12,717
48%
38.7
189 PWR
99%
7,452
52%
23.4
The above information, along with other variables, was utilized in a prioritization exercise that comprised two elements: (i) Potential for environmental services (Risk, Recorded forest loss, Carbon content, Biodiversity and Hydrology); and (ii) Feasibility of implementation of environmental services projects (Organization of the ejidatarios or comuneros: Certification of the property, Area status, Internal regulation and Elected representatives).

15
The prior information, along with other variables, was used in a prioritization exercise that comprised two elements: (i) Potential of environmental services, including information about: risk, calculated forest loss, carbon content, and biodiversity and hydrology relevance; (ii) Implementation feasibility of environmental services projects, which analyzes the organization of the AN, such as: land property certification, internal regulation, etc.
To identify those ejidos and communities with the highest potential for incorporation into environmental services schemes, a multi criteria evaluation (MCE) methodology was applied. Scores and scales were assigned to generate an index, which, incorporated into a geographical information system, permitted an initial identification of the potential candidates.
Using the MCE methodology, 115 AN of Very High priority were identified (Brown color in the map); these were distributed throughout 17 States, with most presence in Quintana Roo (38 AN and 1,066,172 ha), followed by Chiapas (10 AN and 553,247
ha), Oaxaca (9 AN and 199,310 ha) and Campeche (8 AN and 244,982 ha). Although all of these are southern states, there were also representatives from the north, such as: Chihuahua, Durango, Sinaloa and Nayarit.
This prioritization exercise can be distinguished from others in two aspects: (i) it focuses on the ejidos and communities; (ii) scrublands are included in the analysis (usually only temperate and tropical forests are analyzed).
At the moment we are elaborating the institucionality index, that includes aspects such as existence, knowledge and application of internal regulation; active participation (in assemblies and external committees); transparency and accountability, as well as the mechanisms of dialogue and decision making within each AN, among others. Together with the criteria analyzed in the first stage, this will define the feasibility of implementation of an environmental service scheme.

I. Context

Common property in Mexico

18
I. Context
Common property in Mexico
The Political Constitution of the United States of Mexico recognizes three types of property regimes: Public, Private and Common. The common property is divided into: Ejidos, Communities and others.Mexico has a surface of 196.7 Mha, of which common property represents 103.98 Mha (53%). The ejidos accounts for 82% of the common property, equivalent to 43% of the total national surface. The common property is divided between 31,634 AN, of which 92% are ejidos and 8% are communities (Box I).
While environmental services can be obtained from small properties (less than 100 ha), the relationship between these services and ecological processes requires large areas (ranging from hundreds to thousands of hectares) or locations within priority sites. In addition, the requirements of participation in government programs dictate specific property conditions.
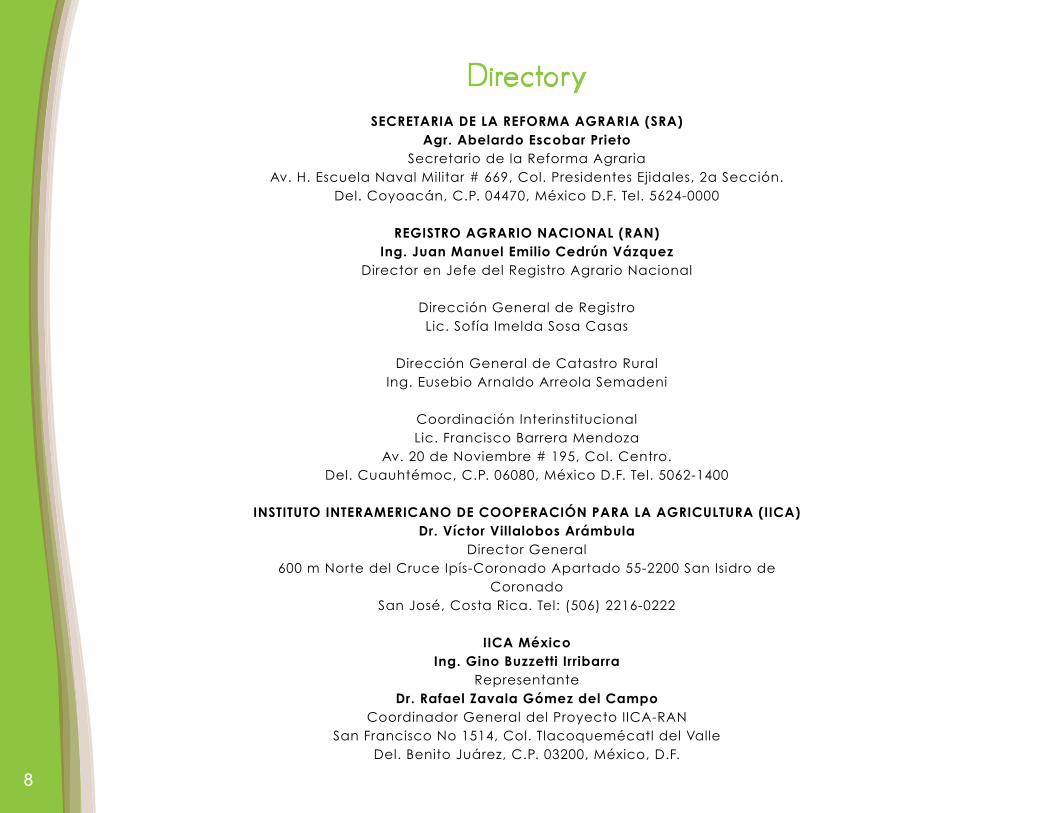
Figure 2 shows the distribution of the size of the AN: 13% are less than 200 ha (the three first groups), followed by 18% between 201 and 500 ha, and 19% between 501 and 1,000 hectares. For AN larger than 1,000 ha, the frequencies are below 2%, with the exception of the 5,001 to 6,000 ha (2.4%) and the 10,001 to 20,000 ha (3.7%). A small group of about 200 AN (0.7% of the total) has polygons that are larger than 40,000 ha.
Box I. Definitions of social property in Mexico
Ejido: Is constituted as part of an agrarian action of land distribution, enlargement and creation of new population centers. It functions as an owner society with different comities for decision-making (Asamblea), representation (Comisariado) and control (Consejo de vigilancia). Those in possession of tenure rights within the ejido are known as ejidatarios.
Community: Created as part of an agrarian action of recognition and entitlement to common goods or land restitution, based upon colonial titles or ancestral possession. It also has an Asamblea, representatives and an órgano de vigilancia. Its members are known as comuneros.
Source: SRA (2007)
19
(data from RAN, 2011)
Common property presents both advantages and challenges in regard to environmental services, since it differs from other types of properties in various aspects. The AN is simultaneously a territory, a collective of agrarian subjects with a specific internal organization (Asamblea, Comisariado and Consejo de vigilancia).
The relationships that the AN establishes with other entities is constituted by different comities –such as the Asamblea— where it is important to establish effective mechanisms of transparent ruling and decision-making.
Fortunately, in many ejidos and communities there is already experience of collective projects and the sustainable management of ecosystems and natural resources. This constitutes a social capital that is very valuable, facilitating the participation and implementation of environmental services projects.
Figure 2. Size of Agrarian Nuclei per group.

Environmental services
21
Environmental services can be defined as benefits obtained by humans from ecosystems, whether in a natural form or through sustainable management (Balvera and Cotler, 2009).
According to the Millennium Ecosystem Assessment (2005), there are four types of environmental service:
• Provision. Tangible goods: food, wood, fibers etc.• Regulation. Processes: climatic regulation, erosion control etc.• Cultural. Intangible goods: associated with aesthetic or religious
values. • Support. Based on the above: Primary productivity and
biodiversity conservation.
Environmental services can be defined as benefits obtained by humans from ecosystems, whether in a natural form or through sustainable management (Balvera and Cotler, 2009).
According to the Millennium Ecosystem Assessment (2005), there are four types of environmental service:
• Provision. Tangible goods: food, wood, fibers etc.
• Regulation. Processes: climatic regulation, erosion control etc.
• Cultural. Intangible goods: associated with aesthetic or religious values.
• Support. Based on the above: Primary productivity and biodiversity conservation.
Environmental services
This definition and classification is incorporated into Mexican law, through the General Law of Sustainable Forest Development (Gobierno de México, 2008). In this way, concepts such as the preservation or enhancement of environmental services have been explicitly included in the development plans, policies and instruments of the government, and are established as a key condition for sustainable development.
In this section, we analyze the importance of common property related to carbon in vegetation, biodiversity conservation and hydrological services. The analysis establish the “minimum value” of the environmental services found in common property, as it does not include the other services such as those of provision and culture1 . It is an attempt to establish new frameworks for land use negotiation and to promote the capacities of local stakeholders in order to improve their living conditions through the sustainable management of their natural resources.
Payment for environmental services can represent an alternative for the ejidos and communities by allowing:
• The establishment of an economic activity that is complementary to other sources of income.
• The incorporation of the areas of common use. • The generation of long term internal agreements
regarding decisions over the use of land within the AN. • Channeling of the legal attributes of the ejido or
community in relation to activities that generate social benefits (internal and external).
1 Different local stakeholders utilize products obtained from ecosystems to cover different needs such as nutrition, construction, medicine etc. In addition, some groups attribute religious values and meaning to sites that depend on specific environmental conditions. While the former example would be a service of provision, the latter is a cultural one. Both have points of interest that must be explored.

Importance of common property in the aspect of environmental services
II.

23
Importance of common property in the aspect of environmental services
II. Importance of common property in the aspect of environmental services
Table I. Environmental services considered in the analysis
With more than 30,000 ejidos and communities and the need to implement environmental services schemes at a national level, a prioritization analysis was carried out in two stages: (i) importance of common property analysis in the environmental services context, and (ii) selection of ejidos and communities to initiate a second phase of feasibility assessment.
While the analysis presented here is based upon these three environmental services, it is recognized that ecosystems (natural or sustainably managed) generate other services.
In accordance with this, the following findings can be considered an approximation of the “minimum value” the environmental services in common property in Mexico.
For the first stage of the prioritization analysis, the relative importance of common property was analyzed in terms of three aspects that have been indicated as being of greatest importance in relation to environmental services (Pagiola et al. 2002): potential to capture and store carbon, biodiversity conservation and regulation of the hydrological cycle.
The following table relates each one of these themes to a specific environmental service.
Theme Environmental service Type of serviceNational strategy to which
the service relatesSource of information
Forest carbon Potential capture and storage of carbon on temperate forests, tropical forests and scrublands
Regulation Reducing Emissions from Deforestation and Forest
Degradation (REDD)
Produced with data from CONAFOR and INEGI
Biodiversity Biodiversity conservation Support Priority regions for conservation CONABIO
Hydrology Regulation of the hydrological cycle
Regulation Water reserves CONAGUA

Carbon content in natural vegetation

25
Carbon content in natural vegetation
An index of carbon content in agrarian nucleuses (CCAN) was generated to calculate the relative importance of the capture and storage of carbon in common property, through the following process:
Data from different governmental institutions was integrated with a geographical information system (GIS):
• The National Rural Land Registry of Common Property in Mexico, with information generated by PROCEDE, FANAR and PHINA.
• The land registry of the General Direction of Rural Land Registry (RAN) with input from PROCEDE and INEGI.
• The Land Use and Vegetation Map, Series IV of INEGI (1:250,000 Scale).
Processing and combination of this data generated more than 200,000 registries, each one associated to a polygon with a particular vegetation type (following the INEGI nomenclature) in a specific ejido or community. This corresponds to the information of 29,011 AN (99.8% of the certified AN), comprising a total area of 89.84 Mha, equivalent to 46% of the national surface.
Carbon content (t/ha) per vegetation type was obtained from a report produced by CONAFOR, following the FAO methodology in the “State of the World´s Forests 2011” (FAO, 2010 report). The values used for each vegetation type in the present document included above- and belowground biomass; i.e. the tree and its roots. For the vegetation types where carbon content was not reported, the average value of the ecosystem to which the vegetation type corresponded was assigned (following the classification of Annex 1).
Figure 1. Carbon density per vegetation type, grouped into three ecosystems
(Produced with data from FAO, 2010)
Temperate forests (11 types) Scrublands (16 types) Tropical forests (20 types)
Maximum/minimumAverage
Car
bon
cont
ent (
tonn
es/h
a)
26
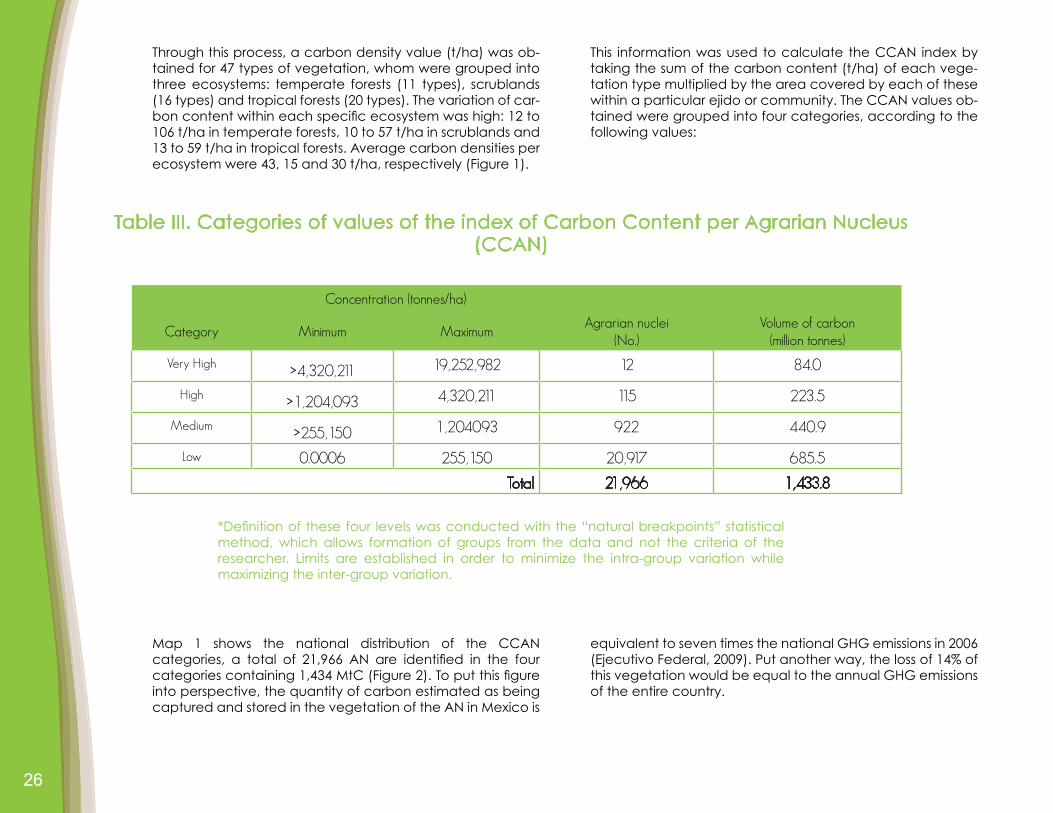
Table III. Categories of values of the index of Carbon Content per Agrarian Nucleus (CCAN)
*Definition of these four levels was conducted with the “natural breakpoints” statistical method, which allows formation of groups from the data and not the criteria of the researcher. Limits are established in order to minimize the intra-group variation while maximizing the inter-group variation.
Through this process, a carbon density value (t/ha) was ob-tained for 47 types of vegetation, whom were grouped into three ecosystems: temperate forests (11 types), scrublands (16 types) and tropical forests (20 types). The variation of car-bon content within each specific ecosystem was high: 12 to 106 t/ha in temperate forests, 10 to 57 t/ha in scrublands and 13 to 59 t/ha in tropical forests. Average carbon densities per ecosystem were 43, 15 and 30 t/ha, respectively (Figure 1).
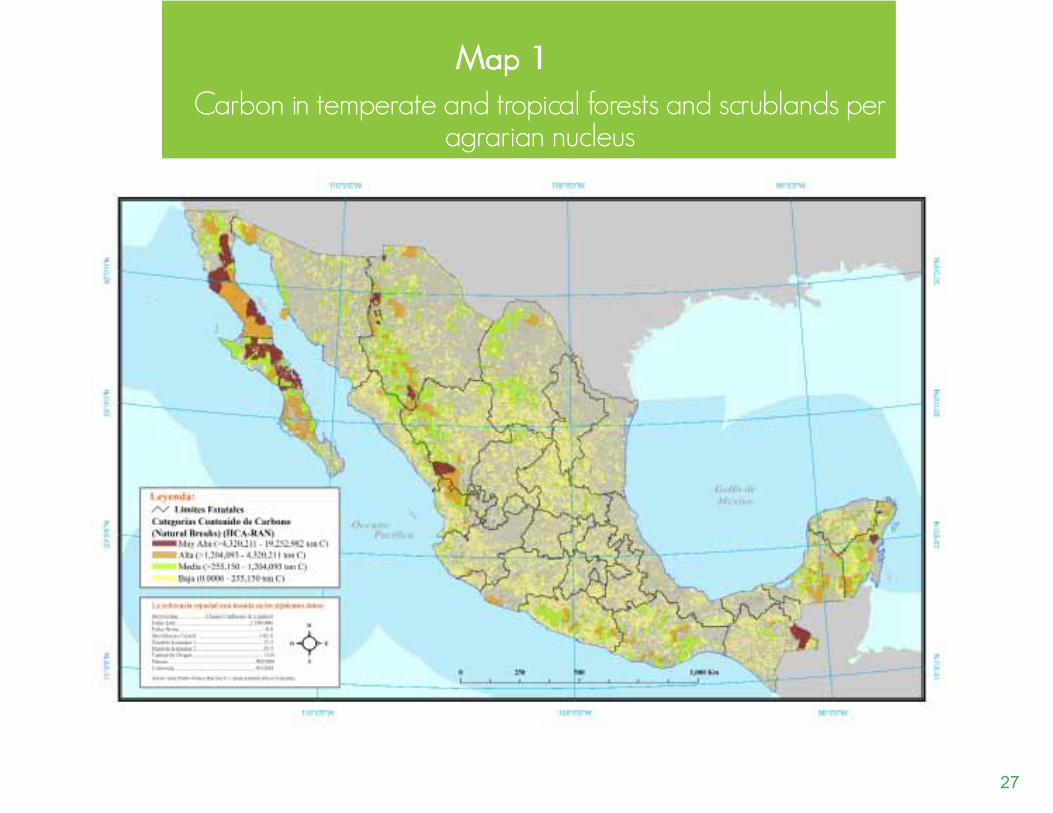
Map 1 shows the national distribution of the CCAN categories, a total of 21,966 AN are identified in the four categories containing 1,434 MtC (Figure 2). To put this figure into perspective, the quantity of carbon estimated as being captured and stored in the vegetation of the AN in Mexico is
This information was used to calculate the CCAN index by taking the sum of the carbon content (t/ha) of each vege-tation type multiplied by the area covered by each of these within a particular ejido or community. The CCAN values ob-tained were grouped into four categories, according to the following values:
Concentration (tonnes/ha)
Category Minimum MaximumAgrarian nuclei
(No.)Volume of carbon
(million tonnes)
Very High >4,320,211 19,252,982 12 84.0
High >1,204,093 4,320,211 115 223.5
Medium >255,150 1,204093 922 440.9
Low 0.0006 255,150 20,917 685.5
Total 21,966 1,433.8
equivalent to seven times the national GHG emissions in 2006 (Ejecutivo Federal, 2009). Put another way, the loss of 14% of this vegetation would be equal to the annual GHG emissions of the entire country.
27
Carbon in temperate and tropical forests and scrublands per agrarian nucleus
Map 1

28
Figure 2. Agrarian Nucleus Carbon Content per category
(Calculated with data from CONAFOR and FAO)
Agr
aria
n N
ucle
i (N
o.)
Car
bon
(milli
on to
nnes
)
Agrarian Nuclei
Carbon
The results demonstrates that activities which reduce deforestation, conserve vegetation coverage and improve the conditions of the temperate, tropical forests and scrublands (increasing biomass per unit area) in the common property are of great importance to the national GHG inventory.
It is worth noting that these carbon calculations do not include all the types of natural vegetation, nor areas dedicated to agriculture, livestock production or other productive activities related to the AN. For example, a study carried out in the region of Purépecha, Michoacán (Ordoñez et al., 2008)
showed comparable results between the density of carbon in agricultural areas and others with shrub vegetation, as well as between avocado plantations and degraded temperate forests. This suggests that merely measuring the carbon within the natural vegetation in a AN will only give a minimum value. Furthermore, due to the lack of a national database2, the calculations carried out in this study did not consider soil carbon content. Depending on the type of vegetation and conditions, soil can have a carbon density even greater that of the vegetation (Mckinley et al., 2011).
2 Within the activities related to the National REDD Strategy and other governmental commitments, CONAFOR, in coordination with other agencies and with funding from various international sources, is working to produce carbon inventories and methodologies for monitoring and evaluation that include the edaphic portion of the national vegetation. The information regarding carbon densities of different vegetation and soil types will be available in the near future.
Biodiversity conservation

30
Biodiversity conservation
Efforts to conserve the biodiversity in Mexico have been increasing the last two decades; with the creation of instruments such as Natural Protected Areas (NPA), Management Units for the Protection of Wildlife (UMA, by its Spanish acronym) and Payments for Environmental Services (PES). The promotion of these and other instruments designed for biodiversity conservation require the identification of priority zones.
Different prioritization exercises have already been carried out in Mexico (Ceballos et al., 2009); the most important exercise (coordinated by CONABIO) is used to identify new NPA and other conservation areas, such as the Terrestrial Priority Regions (TPR) and Hydrological Priority Regions (HPR).

31
Priority conservation regions are defined by a high value of biodiversity (terrestrial, freshwater or marine) that dictates the conservation strategy in Mexico. The HPR are areas of high biodiversity value in freshwater environments, identified through criteria that estimate the environmental value of biotic and abiotic resources, the economic value, the risks and the threats to which these areas are exposed (Arriaga et al., 2009).
The information regarding the AN polygons of the entire country is combined with those of the TPR and HPR, generating two maps that show the coincidence of common property with the priorities regions of conservation. The results showed that all of the 152 TPR have areas within ejidos and communities: 6,592 AN with 25.7 Mha, equivalent to 50% of the total area of TPR (Map 2). Furthermore, all of the 110 HPR have areas within common property: 12,717 AN with 38.7 Mha, equivalent to 48% of the total area of HPR (Map 3).
Looking at these results, we can say that common property comprises half of the “provision” of biodiversity conservation, which makes it clear that any conservation strategy which does not take the ejidos and communities into consideration will not be successful in Mexico.
Priority regions for conservation

32
Social Property and terrestrial biodiversity
Map 2

33
MAPA 3Social Property and freshwater biodiversity
Map 3

Water reserves

35
Water reserves
Many international experts agree that the hydrological cycle will be drastically affected by climate change (Dooge et al., 2011); in some countries these effects are already a reality (CONAGUA, 2010). Facing this scenario, strategies and instruments that allow the adaptation of water management to new hydrological patterns are required (Matthews and Le Quesne, 2009). One such instrument of management is used in Mexico, and it is called potential water reserves (PWR).
According to Article 3 LXIV of the National Water Law, the areas defined as Water Reserves are: “Those specific areas of aquifers, hydrological basins or hydrological regions, where limitations are established in terms of the exploitation or use of all or some of the available water in order to provide a public service, implement a program of restoration, conservation or reservation, or when the State decides to exploit the water resources for public utility” (Gobierno de Mexico, 2011).
Thus, PWR are defined quantities of water in order to guarantee the flow of ecological protection and the maintenance of the environmental services up on which we all depend.
In 2011, CONAGUA and the World Wildlife Fund, identified zones with available water resources, of biological and ecological importance and low demand for water, in order to define a national network of PWR. This network, which consists of 189 management units, can be considered a measure of adaptation to climate change, since it guarantees the functionality of the hydrological cycle as a source of water and support for ecological processes (CONAGUA, 2011).
The available information of the 189 water management units was integrated into a GIS (CONAGUA, 2011) and categorized by decree as PWR into three feasibility levels: Very high (19), High (54) and Medium (116). This information was combined with the data of the AN polygons in order to calculate the geospatial coincidence of the two components.
According to this calculation, 99% of the PWR coincide with one or more AN. This includes 7,452 AN with 23.4 million hectares, meaning that 52% of the total PWR surface is located in common property. Map 4 shows the relative importance of the ejidos and communities in the PWR network.

36
MAPA 3Social Property and potential water reserves
Map 4

Environmental services with emphasis on Reducing Emissions from Deforestation and Forest Degradation (REDD)
III.

38
III. Environmental services with emphasis on Reducing Emissions from Deforestation and Forest Degradation (REDD)
Multicriteria evaluationREDD+ stands for countries efforts to Reduce Emissions from Deforestation and forest Degradation, and foster conservation, sustainable management of forests, and enhancement of forest carbon stocks. The implementation of REDD activities is supposed to lead to a substantial reduction of GHG emissions.
In Mexico, the GHG emission reduction targets of the Special Programme on Climate Change (SPCC) consider REDD an important alternative. By 2012 it is estimated that 21% of the reductions associated with improvements in activities that affect soil and vegetation, will be attributable to REDD projects (Ejecutivo Federal, 2009).
To orientate national action relating to REDD, the Secretariat of Environment and Natural Resources (SEMARNAT, by its Spanish acronym), through CONAFOR, has coordinated the development of the National REDD Strategy (ENAREDD, by its Spanish acronym). An initial document, “Mexico´s Vision on REDD”, was produced with the collaboration of civil organizations, various stakeholders and different governmental institutions (CONAFOR, 2010). The document was presented at the Conference of the Parties of the United Nations Framework Convention on Climate Change in 2010 (COP16).
The “Mexico´s Vision on REDD” is an innovative document that define four key aspects: (i) International co-responsibility (ii) Preservation of environmental services and risk reduction, (iii) Quality of life and sustainability, and (iv) Guiding principles. These principles, which shaped the development of ENAREDD, are:
• Inclusion and equality (territorial, cultural, social and gender).
• Plurality and citizen participation.• Transparency and legality. • Transversality, integration, coordination and
complementarity (both sectorial and between orders of government).
• Equitable distribution of benefits.• Obligation towards, and respect for, the right of
ownership for the inhabitants and landowners, and the sustainable use of natural resources.
• Free and informed consent of the communities.• Promotion of competitivity in the rural economies
associated with the forest, including community forestry enterprises.
With these key aspects the ENAREDD strategy is supposed to be an instrument of development, derived from an environmental service but strongly related to the generation of positive impacts on biodiversity and social benefits, especially for the participating rural areas. The strategy goes beyond the conservation and sustainable management of temperate forests, achieving the definition of strategic actions with a territorial focus.

39
This document therefore analyses the potential of ejidos and communities to participate in ENAREDD, on the following basis:
A multi-criteria evaluation (MCE) was conducted in order to generate a prioritization based on common property. This methodology is utilized in order to incorporate various criteria in the discussion and to generate a hierarchical arrangement of alternatives that help solve problems related to territorial development (Aceves et al., 2006). In this case, the MCE was used to identify the AN with the greatest potential for participation in REDD activities, as this is an environmental service conservation programme undergoing rapid development.
The MCE used in this study was based on five principles:
• Integration of environmental, economic and social themes. • Distinction between Potential (interest or relative importance
from the environmental services perspective) and Feasibility (related to the social characteristics of each ejido or community).
• Inclusion of criteria derived from accessible information or which can be produced in a simple manner.
• Allocation of values to each criterion that can be expressed for each territorial unit, in this case ejidos or communities.
• Flexibility in the early stages, a criterion can be included or eliminated and values modified.
With these principles, an index of prioritization with a maximum of 100 points was created and divided into two components: Potential (60 points) and Feasibility (40 points). These components integrate three criteria that are vital for environmental services with an emphasis on REDD: Deforestation and Environmental services in the Potential component, and Social aspects of the AN in the Feasibility component (Figure 3).

40
Figure 3. Structure of the components and criteria for the Prioritization Index
Figure 4. Criteria and scores for the the Potential component.
Social aspects of the agrarian
nucleus
Criteria
Environmental services (Carbon, Hydrology
and Biodiversity)
Deforestation
II. Feasibility (40)
I. Potential(60)
Priority index 100 points
Each of the three criteria was divided into sub-criterion to which points were assigned. Thus, the Potential component has five sub-criterions: Risk (20 points), Recorded loss of forest (10 points), Carbon (20 points), Biodiversity (5 points) divided into Terrestrial Priority Regions and Hydrological Priority Regions, and Potential Water Reserves (5 points).
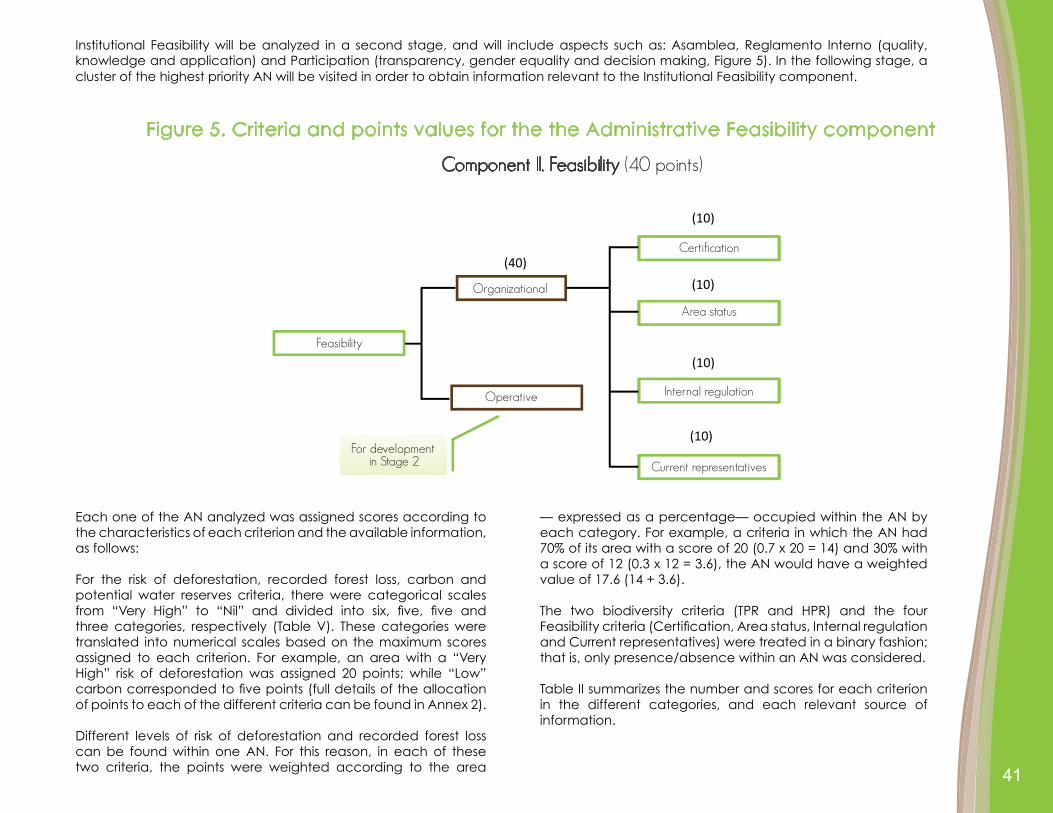
The Feasibility component, which involves the social and organizational aspects of the AN, was divided into two criteria: Fundamental organizational feasibility and Institutional feasibility.
The first of these two criterion, which is the only one considered at this stage of the analysis, is based on information from desk studies and has four sub-criterion related to the administrative status: Certification of the property (10 points), Area status (10 points), Reglamento Interno (document which dictate the internal regulation,10 points) and Elected authorities (10 points).
41
Each one of the AN analyzed was assigned scores according to the characteristics of each criterion and the available information, as follows:
For the risk of deforestation, recorded forest loss, carbon and potential water reserves criteria, there were categorical scales from “Very High” to “Nil” and divided into six, five, five and three categories, respectively (Table V). These categories were translated into numerical scales based on the maximum scores assigned to each criterion. For example, an area with a “Very High” risk of deforestation was assigned 20 points; while “Low” carbon corresponded to five points (full details of the allocation of points to each of the different criteria can be found in Annex 2).
Different levels of risk of deforestation and recorded forest loss can be found within one AN. For this reason, in each of these two criteria, the points were weighted according to the area
Figure 5. Criteria and points values for the the Administrative Feasibility component
Component II. Feasibility (40 points)
— expressed as a percentage— occupied within the AN by each category. For example, a criteria in which the AN had 70% of its area with a score of 20 (0.7 x 20 = 14) and 30% with a score of 12 (0.3 x 12 = 3.6), the AN would have a weighted value of 17.6 (14 + 3.6).
The two biodiversity criteria (TPR and HPR) and the four Feasibility criteria (Certification, Area status, Internal regulation and Current representatives) were treated in a binary fashion; that is, only presence/absence within an AN was considered.
Table II summarizes the number and scores for each criterion in the different categories, and each relevant source of information.
Institutional Feasibility will be analyzed in a second stage, and will include aspects such as: Asamblea, Reglamento Interno (quality, knowledge and application) and Participation (transparency, gender equality and decision making, Figure 5). In the following stage, a cluster of the highest priority AN will be visited in order to obtain information relevant to the Institutional Feasibility component.

42
Table II. Criterias and scores assigned for the Multicriteria Evaluation of the Pri-ority Index (details of score allocation available in Annex 3)
Evaluation of the Priority Index (details of score allocation available in Annex 3)
Component Criterion Points Levels (score) Source
Potential
DeforestationRisk 20 6 (20, 16, 12, 8, 4, 0) INE (2011)
Recorded loss 10 5 (10, 5, 3, 1, 0)RAN-IICA (elaborado con datos de INEGI)
Environmental services
Carbon 10 5 (20, 15, 10, 5, 0)RAN-IICA (elaborado con datos de FAO)
Biodiversity Terrestrial Aquatic
3 2
2 (3, 0)2 (2, 0)
CONABIO (2004)Arriaga et al. (2002)
Hydrology (Water reserves) 5 4 (5, 3, 1, 0) CONAGUA (2011)
Subtotal (points) 60
Feasibility
Fundamental organizational
Certification 10 2 (10, 0) RAN-IICA
Area status 10 2 (10, 0) RAN-IICA
Presence of internal regulation 10 2 (10, 0) RAN-IICA
Current representatives 10 2 (10, 0) RAN-IICA
Subtotal (points) 40
InstitutionalAsembalea, Internal regulation and Participation
To be defined in the second stage
Total (Points) 100
The results of the multicriteria evaluation (MCE) applied to prioritization are presented below.

43
Potential
* The minimum area can be a remnant of an AN within urbanized land.** The largest ejido in Mexico: Reforma Agraria Integral, Ensenada, Baja California
Table III. Prioritization of Potential of environmental services in Agrarian Nuclei through multicriteria
CategoryAgrarian Nuclei
(No.)Total area
(thousand ha)Average AN area
(ha)Minimum area
(ha)Maximum area
(ha)
Very High 7 994.1 142,114 32,260 498,792
High 2,530 21,930 8,668 15 672,901**
Medium 11,263 43,590 3,870 9 386,731
Low 15,211 29,453 1,936 3 652,569
Table III shows the number of ejidos and communities, with their respective areas (total and average), divided in four categories of Potential: Very high, High, Medium and Low. The distribution of these properties within the national territory can be seen in map 5. The location of the seven AN of Very High priority can be observed in five States: Campeche (two), Chiapas (one), Chihuahua (one), Michoacán (one) and Quintana Roo (two).

44
MAPA 3Priority of agrarian nuclei in environmental services (Potential)
Map 5

45
Organizational Feasibility
Table IV. Prioritization of Feasibility (Fundamental organizational) for environmental services in Agrarian Nuclei through multicriteria evaluation.
Table IV reports the number of AN and the areas (total and average) for each category of the Feasibility component (Organizational). In this case, within the Very High priority, there are 8,797 ejidos and communities, distributed throughout Mexico (Map 6). If the High priority AN are added (14,495), 80% of the total analyzed AN would be within these two categories. This is due to the fact that the Feasibility evaluation is still incomplete: it is merely a first approximation, derived from desk studies (Organizational Feasibility). This “filter” will be complemented with fieldwork, permitting the allocation of values to the criteria of Institutional Feasibility and adjustment of the prioritization based on the internal organization of the agrarian nuclei. The intention is to focus upon a smaller group of ejidos and communities with greater implementation possibilities of an environmental services project.
CategoryAgrarian Nuclei
(No.)Total area
(thousand ha)Average AN area
(ha)Minimum area
(ha)Maximum area
(ha)
Very High 8,797 44,031 5,005 13 672,901
High 14,495 40,133 2,769 3 652,569
Medium 5,718 11,803 2,064 3 422,156
Low 1 0.858 858 858 858
46
MAPA 3Priority of agrarian nuclei in environmental services (Feasibility)
Mapa 6

47
Total prioritization
Table V. Prioritization for environmental services in Agrarian Nuclei through multicriteria evaluation ( Potential + Fundamental
Organizational Feasibility)
Integration of the two components and their weighting (maximum observed value = 1.0) produced the following results:
CategoryAgrarian Nuclei
(No.)Total area
(thousand ha)Average AN area
(ha)Minimum area
(ha)Maximum area
(ha)
Very High 115 4,535 39,438 80 498,792
High 11,847 57,775 4,877 9 672,901
Medium 16,424 32,917 2,004 3 652,569
Low 625 740,677 1,185 5 422,156

48
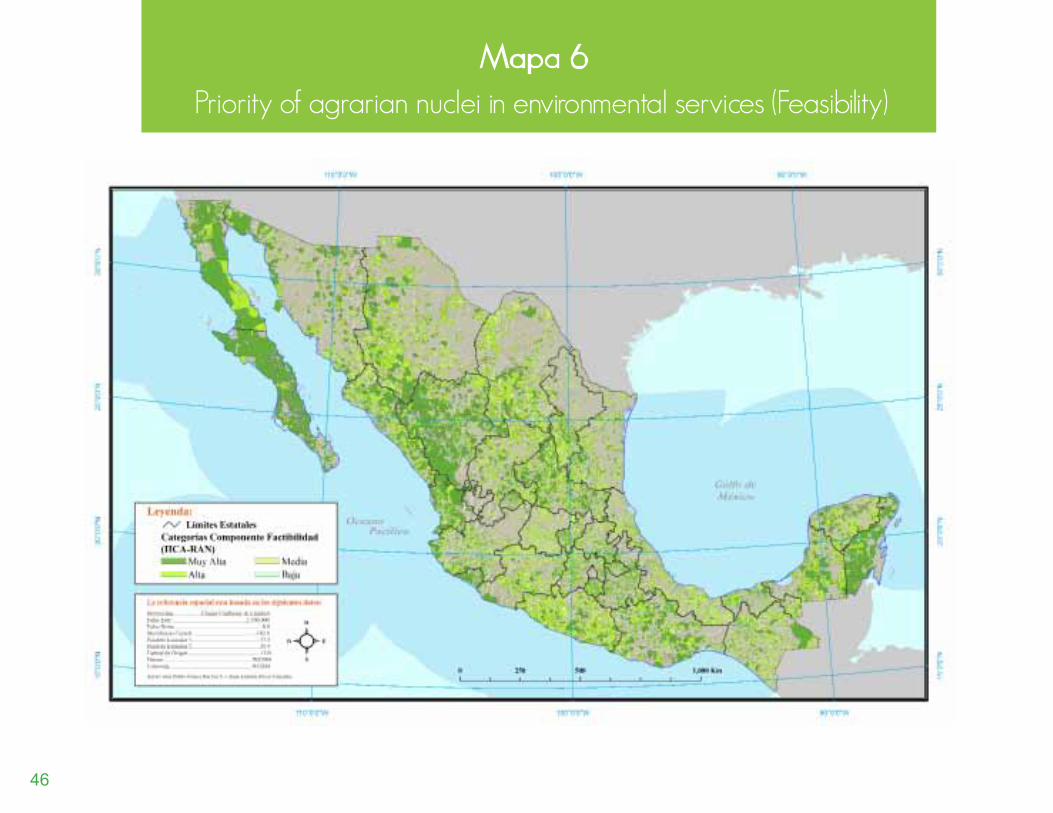
In this case, the AN of Very High priority totaled 115, distributed throughout 17 States (Map 7), principally Quintana Roo (38 AN and one million hectares), Chiapas (10 AN and 553,247 ha), Oaxaca (nine AN and 199,310 ha) and Campeche (eight AN and 244,982 ha). Figure 6 shows the number of Very High priority AN and the total surface per State3.
Figure 6. Distribution of the Very High priority ejidos and communities (Potential + Fundamental Organizational Feasibility) for environmental services
Relationship of ejidos and communities in Annex 4
Agr
aria
n N
ucle
i (N
o.)
Are
a (th
ousa
nd h
a)
Agrarian nuclei
Area
3 The numbers and location (Municipality and State) of the 85 ejidos (74%) and the 30 communities (26%) of “Very High” priority can be consulted in the Spanish language version of this document, available at: www.iica.org.mx

49
Priority of agrarian nuclei in environmental services (Potential + Feasibility)
Mapa 7

Funding for REDDin Mexico

51
Funding for REDD in Mexico Box II. Vision of REDD in Mexico
“Sustainable rural development constitutes the
best approach to consolidate REDD in Mexico,
considering that only from a holistic perspective
will it be possible to remove the pressures of
deforestation and forestry degradation, as well
as promote the management and conservation
of the forests and improve the quality of life in the
communities within these areas”.
Source: CONAFOR (2010)
In this section, we present a summary of the different funding alternatives that exists for REDD in Mexico. It is a programme that receives international attention, especially due to its connection to climate change and the commitments of Mexico and other countries to reduce global GHG emissions.

52
The REDD process and demand for environmental service
In Mexico, the REDD process is divided into three stages:
• Stage1:Preparationofthenationalstrategy,developmentandstrengtheningof capacities.
• Stage2: Implementationofthestrategy(executionofmitigationpoliciesandmeasures) and “Early actions”.
• Stage3:Payment for results,whichmustbemeasuredandverified througha transparent and rigid process. Large-scale funding is expected with the participation of different stakeholders.
A central principle at each stage is that the financial incentive must increase in proportion to the permanent and quantifiable emission reductions (Meridian Institute, 2009).
Currently, Mexico is entering stage 2, while the National Strategy (ENAREDD) is in preparation and work is progressing on various aspects through “Early actions” in specific regions of Jalisco (coastal basins), Chiapas (Lacandon tropical forest) and the Yucatán peninsula within a defined forested zone between the three states of Yucatán, Quintana Roo and Campeche (FIP, 2011).
It is important to highlight that none of the financial support received by Mexico as part of bilateral and multilateral cooperation agreements is being directed towards payment for results; this funding is for conducting studies, testing methodologies, creating capacities and conducting consultations, as well as for certain investments in the implementation of REDD (Meridian Institute, 2009).
The development of REDD has generally been financed by the public sector, through bilateral and multilateral funds, with a focus on the creation of capacities for a strategic development leading to the implementation of specific projects directed towards the compliancy markets.
Public sector involvement may lead to increased demand for verified emission reductions (credits) alongside private-sector demand, if and when compliance markets for REDD emerge (Scneck et al., 2011). According to a Point Carbon study (Reuters, 2011), it is very likely that an international market for REDD credits will be operational in 2016.

53
Funding and recommendations
Table VI. Bilateral or multilateral funding of REDD actions worldwide
Fuentes: PwC (2011) y TFG (2010).
Table VI lists the governments that are funding REDD activities or have had environmental projects in Mexico, and thereby could finance the national REDD strategy.
Government Region of interestStage of Redd for
funding
Annual total up to 2012 (Million US
dollars)
Norway Global 1, 2 y 3 500
United States of America Latin America and Asia 1 y 2 333
Australia Asia 1 y 2 208
United Kingdom Global 1 150
Japan Global 1 135
European Union Latin America 1 y 2 127
France Amazon Region 1 110
Germany South America 1 100
Spain Latin America 1 50
Canada Mexico 1 35
Sweden Central America and Asia 1 35
Total 1,783

54
To date, the private sector is the biggest buyer of carbon credits in the voluntary carbon offset market, and will continue to be an important source of financing for REDD projects in the future. According to a study on Corporate Social Responsibility, climate change and environmental friendly branding has become important factors for companies worldwide, in the aspect of funding environmental and social development projects (The Economist, 2008).
Civil Society Organizations are not funding many REDD activities, but because of their knowledge and experience, they will play a central role in the management and development of projects.
It is important to emphasize that the most important factors for a buyer interested in REDD projects are: (i) the credits must be certified with a recognized standard, and (ii) the forest carbon project must deliver co-benefits in terms of biodiversity conservation and the local community development. Regarding the first factor, different standards exist, such as: Carbon Fix (Carbon Fix, 2011), Plan Vivo (Scolel Té, 2011) and the Voluntary Carbon Standard (VCS, 2011), among others. The VCS is the most common standard in the voluntary market, and could serve as a benchmark for REDD projects in Mexico.
If the project includes a standard that measures the environmental and social impact, buyers are willing to pay a premium price. The Climate, Community and Biodiversity standard (CCB, 2011) is one of the most common in forest carbon projects. Other factors of great importance to the buyers are: project location, experience and credibility of the responsible organization and, of course, price per tonne of carbon (EcoSecurities, 2010).
It is important to find potential investors and financing for the project; there are four options (Sneck et al., 2011):
• Cooperation funds (bilateral and multilateral). These will be funding all the stages, although probably the developed countries will not be able to finance all the REDD activities, especially in view of the current crisis in Europe and the United States of America.
• Carbon market. This is the most simple and transparent option, because the commodity will have a market price. The challenge will be to minimize the chain of intermediaries in order for the sellers (forest owners) to keep most of the profits.
• Sale of specific projects. Directed to companies whom are interested in buying credits in the voluntary market. In this case, a better price may be obtained, but it is more difficult to find a buyer and projects would have to be unique.
• National development trusts, such as the Mexican Fideicomisos Instituidos en Relación con la Agricultura (FIRA), which finances companies from the agricultural, livestock, forestry and fishery sectors.
There are different markets for carbon credits, such as the European Union, New Zealand, the Kyoto Primary CDM Market and the OTC Voluntary Market, to name a few. However, the only international market that currently accepts REDD credits is the OTC Voluntary Market. In 2010, the volume of carbon credits traded was 131 MtC, at an average price of US $6 per tonne (Forest Trends, 2011).
The California carbon market (as part of The Western Climate Initiative) will probably be launched in 2013. In this market it will be possible to trade up to 74.3 MtC of international REDD credits until 2020 (Scneck et al., 2011).
The anticipated price in the Western Climate Initiative (WCI) market (2011) is between 10 and 15 USD per tonne of carbon. However, another projection of carbon prices, generated by interviewing projection experts, the majority (60%) estimates that by 2020 the average global carbon price will be 35 USD per tonne (Reuters, 2011).

55
The potential for REDD in Mexico has the following competitive advantages (relative to other countries): (i) its biodiversity (number of species and levels of endemism); (ii) a technological and institutional capacity that, while it requires strengthening for REDD, is sufficient to begin with; (iii) the social impact REDD actions could have on the ejidos and communities —which as we have seen are the owners of the majority of the national forest; and (iv) the close commercial and cultural relationship with the United States of America. The State of California has made important progress in the definition of a carbon credit marketplace and considers Mexico as a potential partner.
Mexico could request funding from countries that are supporting stages 2 or 3 (Norway, United States of America and Australia) or from countries that have supported environmental projects in Mexico, such as Japan or Germany. Such requests for bilateral funding should lead to the implementation of projects that demonstrate the capacity and potential that exists to generate environmental and social benefits, especially in the common property.
Another way to obtain funding is to negotiate with the national and international companies that are large emitters of carbon at a national scale, or are seeking a more environmental friendly image. Many of these companies are found in the infrastructure, mining and energy sectors; such as: Carso Infrastructure and Construction (of the Carso Group), Villacero Group, Met-Mex Peñoles, Lamosa and Cemex, to name a few.
It is important to choose a site to develop a pilot project that can be demonstrated to potential buyers and interested collaborators. The site may be within the regions where the REDD “Early actions” are in progress, such as in the States of Jalisco, Chiapas, Campeche, Yucatán and Quintana Roo (CONAFOR, 2011a). Even though environmental service projects are few, especially those of REDD, it is important to study projects that have been operational for a while. Here are four interesting cases in Mexico:
• Servicios ambientales de Oaxaca (SAO, 2011) and AMBIO de Chiapas (AMBIO, 2011). These initiatives are promoted by civil organizations that have experience in monitoring, verification and sale of carbon credits in the voluntary market. They know the potential, costs and challenges etc. of a carbon forest project.
• Sierra Gorda (Querétaro and San Luis Potosí). This is the only project in Mexico that is certified under the CCB standards (verification of social and environmental impacts). Moreover, this project is directly linked to a Biosphere Reserve (Sierra Gorda, 2011).
• Amigos de Sian Ka’an en la Península de Yucatán (ASK, 2011). This is an NGO collaborating with companies, scientists, technicians and members of civil society that are working with a project that offers a range of environmental services. It seeks diversification of funding from a variety of sources, such as: donations from hotel guests and development businesses, concurrent funds from CONAFOR and State resources.

General project model

57
General project model
Figure 7 shows the most important components in the preparation of an AN for participation in environmental service projects.
In the local context, the potential and need for an environmental service project linked to the conservation and sustainable management of the natural resources within the AN is determined. The potential of each AN will depend on different factors, such as: area (total, common use and individual parcels), vegetation type, agricultural activities, biodiversity, basins and forestry activities (timber and non-timber).
This is linked to the safeguards of REDD activities: a forest carbon project must provide social and environmental safeguards; understood as mechanisms to secure the rights of the local stakeholders, and the conservation of forests and biodiversity. Before initiating a project of this type, it is recommended to elaborate a Strategic Environmental and Social Assessment (SESA) document. The SESA takes into consideration the main concerns and perceptions of the
stakeholders in terms of the risks they associate with a program of environmental services, as well as the expected benefits (CONAFOR, 2011b).
In the international context, it is expected that a project orientated towards REDD will respect and conserve the rights of the community, culture and local life. For this reason, it is necessary to focus on obtaining the effective and voluntary participation of the involved stakeholders.
In addition, there is a need to invest in education and empowerment of the stakeholders, creating structures of local governability that ensure: (i) free and informed consent, (ii) compliance with safeguards (social and biodiversity), (iii) equal distribution of benefits, and (iv) defining guidelines on how to resolve conflicts. In this aspect the Asamblea and the Reglamento Interno will play a leading role, since they define the regulation of resource management in the areas of common use, as well as the rights and obligations of the members.

58
AgrarianNucleus
Figure 7. Components for the integration of an environmental services project.

59
Technical advice and organizational assistance are key factors for the planning and implementation of a project. It is necessary to include different stakeholders, such as: government, civil organizations, private sector and research institutes. Such assistance should facilitate the process for the community in the identification of pressure factors on the forest, how to reduce the negative impacts upon the environmental services etc.
Each project must be planned, developed and implemented with the active and voluntary participation of the AN. This will be fundamental to the Monitoring, Reporting and Verification (MRV) activities, which will be impossible without the voluntary participation of the local stakeholders and the application of remote sensing technology and statistical analysis.
The AN must be included in the whole process in order to acquire knowledge and give feedback. MRV is very important, generating transparency and credibility to projects with complex methodologies and long-term targets, such as the capture and storage of carbon in forests. Employment could be generated by MRV activities at the local scale, thereby reducing these costs (Angelsen, 2009).
The AN must comply with various conditions in order to enter a payment for environmental services scheme, especially one linked to the international market. Therefore the internal organization of the AN must have a high level of participation, equity and cooperation. The agrarian subjects (common property owners) and inhabitants that utilize the areas of common use must reach an agreement, in order for the project to be successful. Land tenure, obligations, rights and all the factors that form part of the legal framework, must be well defined.
The participating ejido or community must establish a strong institutional link with the government, civil society and the companies interested in environmental services; ensuring cooperation, technical assistance and governance throughout the process. In these terms, good governance includes and improves the participation of both the public and the government in the objective of formulation and implementation of policies.
The Payments for Environmental Services (PES) component is defined as the valuation and associated economic compensation of biodiversity and its environmental services (Álvarez and Muñóz, 2008), considering five elements:
• A voluntary transaction.• At least one buyer.• A well-defined environmental service or a land use that could
provide that service.• At least one provider that effectively controls the provision of
the service. • Conditionality (the service provider guarantees provision of
the service).
The different types of environmental services (support, provision, regulation and cultural) are normally funded through an agreement with the government or private company with a presence within a particular geographical location or that presents a “green” profile. A typical PES project would include: (i) a sizeable area or of priority because of certain characteristic (depending on the scale, context and the objectives of the support initiative), (ii) a combination of services, and (iii) coverage of various objectives, such as alleviation of poverty, and rural development, among others (Wunder, 2005).
Carbon is likely to become the most important and biggest PES market, but there are also schemes are, such for hydrological services, biodiversity and landscape (i.e. scenic beauty related to tourism).
The final component is funding, like any project this includes the preparation stage (initial investment) and the operating costs. As mentioned earlier, the funds may be obtained from: governmental programs, cooperation funds, private sector, civil organizations, the carbon market or development banks. The funding will also have to be incorporated into an MRV system, reducing the risk of corruption and mismanagement of the projects (Angelsen, 2009).
REDD projects incur high costs during the development stage and they require a lot of upfront funding in order to progress. Moreover, for projects that depend on the growth of forest biomass —and of accumulated carbon in soil, (if that is included)—, the financial breakeven point can extend to more than ten years. It is obvious that specialized sources of funding are required for projects of this financial nature.

IV. Conclusions
61
IV. Conclusions
The importance of the ejidos and communities as providers of environmental services in Mexico is indisputable. The three environmental services analyzed in this document (carbon capture and storage, biodiversity conservation and regulation of the hydrological cycle), shows that approximately half of the surface of the relevant sites lies within common property and 90% of the priority regions coincide with one or more AN.
In order to be effective, all strategies of conservation, sustainable development and adaptation to climate change, require that the owners and direct users of the common property need to participate in the implementation.
The prioritization analysis presented in this study differs from other exercises by focusing on the common property. Another innovation is that scrubland vegetation is included in the calculation of forest carbon. This permitted the inclusion of the northern States of Mexico, and allowed these to “compete” with regions of temperate and tropical forest located in the mountains and in the southern parts of the country.
Moreover, the multi-criteria evaluation included environmental and social variables applied to all the AN in Mexico. This means that sites —in this case, ejidos and communities— classified as being of Very High priority could include States in the Yucatán peninsula, southern Pacific and the north of the country. This approach is not used in other analyses, which tend to favor the southern region.

62
This suggests that, while national strategies of identification of environmental services are essential, the promotion and implementation in ejidos and communities requires a “personalized” analysis directed towards the local stakeholders. In other words, the success of such strategies depends more on the strength of social participation than on the physical and biological elements utilized in the prioritization exercise.
There are high expectations that REDD will be an innovative mechanism which will lead to improved management of the rural territory (mainly temperate forests and agricultural land). This is reflected in the economic and technical aid that governments and companies are giving to Mexico in order to design the national strategy (ENAREDD) and support specific projects.
The results presented here reiterate the fact that implementation of these strategies will require an intense effort of technology transfer and management in themes that are new to the agricultural, forestry or biodiversity conservation sectors. The need to strengthen technical agencies with the formation of a “New Rural Extensionism” is obvious: this is the development of strategies and implementation of territorial projects —with a high participation of common property— rather than simply the promotion of sectorial actions, as such, it represents a huge challenge for the development of the national territory.

References
64
ReferencesAceves, F. et al. (2006). “Determinación de peligros
volcánicos aplicando técnicas de evaluación multicriterio y SIG en el área del Nevado de Toluca, centro de México”, en Revista Mexicana de Ciencias Geológicas, 23(2), pp. 113-124.
Álvarez, P. y C. Muñoz (2008). “Instrumentos territoriales y económicos que favorecen la conservación y el uso sustentable de la biodiversidad”, en Capital natural de México, vol. III: Políticas públicas y perspectivas de sustentabilidad, CONABIO, México, pp. 229-258.
AMBIO (2011). (http://www.ambio.org.mx/site/).Angelsen, A. (2009). Realizing REDD+ National strategy and
policy options (http://www.cifor.org/publications/pdf_files/Books/BAngelsen0902.pdf).
Arriaga, L., V. Aguilar y J. Alcocer (2002). Aguas Continentales y diversidad biológica de México. Escala 1:4000000, Comisión Nacional para el Conocimiento y Uso de la Biodiversidad (CONABIO), México.
Arriaga, L. et al. (2009). “Regiones prioritarias y planeación para la conservación de la biodiversidad”, en Capital natural de México, Vol. II: Estado de conservación y tendencias de cambio, CONABIO, México, pp. 433-457.
ASK (2011). Amigos de Sian Ka’an (http://www.amigosdesiankaan.org/).
Balvera, C. y H. Cotler (2009). “Estado y tendencias de los servicios ecosistémicos”, en Capital natural de México, vol. II: Estado de conservación y tendencias de cambio, CONABIO, México, pp. 185-245.
Carbon Fix (2011) (http://www.carbonfix.info/)CCB (2011). Climate, Community and Biodiversity (http://
www.climate-standards.org/)Ceballos, G. et al. (2009). “Zonas críticas y de alto riesgo
para la conservación de la biodiversidad de México”, en Capital natural de México, vol. II: Estado de conservación y tendencias de cambio, CONABIO, México, pp. 575-600.
CONABIO (2004). Regiones Terrestres Prioritarias. Escala 1:1000000, Comisión Nacional para el Conocimiento y Uso de la Biodiversidad (CONABIO), México.
CONAFOR (2010). Visión de México sobre REDD+ Hacia una Estrategia Nacional, Comisión Nacional Forestal (CONAFOR), Secretaría de Medio Ambiente y Recursos Naturales (SEMARNAT), México.
CONAFOR (2011a). La estrategia REDD en México, Presentación Institucional, Roma, Italia, 15 de marzo de 2011 (http://www.slideshare.net/ifad/conafor-presentation-on-redd-in-mexico).
CONAFOR (2011b). Proyecto: bosques y cambio climático SIL, Informe de evaluación social, México (http://www.conafor.gob.mx:8080/documentos/docs/35/2615Informe%20de%20Evaluaci%c3%b3n%20Social%20M%c3%a9xico.pdf ).
CONAGUA (2010). Diálogos por el agua y el cambio climático: llamado a la acción, Comisión Nacional del Agua (CONAGUA), México.
CONAGUA (2011). Identificación de reservas potenciales de agua para el medio ambiente en México, Comisión Nacional del Agua (CONAGUA), México.
Dooge et al. (2011). Algunos expertos internacionales que señalan los temas hídricos como los más importantes para el cambio climático: James Dooge, University College Dublin (http://www.iabm.org/climate_change3.htm); E. Davies y S. Simonovic, University of Western Ontario (http://publish.uwo.ca/~edavies7/Conferences/edmonton2005.pdf); NASA (http://earthobservatory.nasa.gov/Features/Water/page3.php).
EcoSecurities (2010). The Forest Carbon Offsetting Report 2010.
EPA (2011). Greenhouse Gas Equivalencies Calculator. Environmental Protection Agency (http://www.epa.gov/cleanenergy/energy-resources/calculator.html.)

65
FAO (2010). Evaluación de los recursos forestales mundiales 2010. Informe nacional–México, Organización de las Naciones Unidas para la Agricultura y la Alimentación (FAO), Departamento Forestal, Roma (http://www.fao.org/docrep/013/i2000s/i2000s00.htm).
FIP (2011). Plan de Inversión Forestal (Forest Investment Plan), México, CONAFOR.
Forest Trends (2011). Back to the future. State of the Voluntary Carbon Markets 2011.
Gobierno de México (2008). Ley General de Desarrollo Forestal Sustentable (última modificación de la Ley publicada en 2003), Diario Oficial de la Federación, 24-11-08.
Gobierno de México (2011). Ley de Aguas Nacionales (última modificación de la publicada en 1992), Diario Oficial de la Federación, 20-06-11.
INE (2012). Índice de presión económica (riesgo) de la deforestación (INE-IRDEF-2.0.1), Instituto Nacional de Ecología (INE), enero de 2012 (http://www.ine.gob.mx/irdef).
Matthews, J. y T. Le Quesne (2009). Cómo adaptar la gestión hídrica. Guía para hacer frente al cambio climático, Serie Seguridad Hídrica WWF.
McKinley et al. (2011). A synthesis of current knowledge on forests and carbon storage in the United States. Ecological Applications, Vol. 21, núm. 6, pp. 1902-1924.
Meridian Institute (2009). Reducción de Emisiones de la deforestación y la degradación de bosques. Reporte de Evaluación de Opciones.
Millennium Ecosystem Assessment (2005). Ecosystems and human well-being: current state and trends. Washington, D. C., Island Press (http://www.millenniumassessment.org/en/index.html).
Ordoñez, A. et al. (2008). “Carbon content in vegetation, litter, and soil under 10 different land-use and land-cover classes in the Central Highlands of Michoacan, Mexico”, en Forest Ecology and Management (2008), doi:10.1016/j.foreco.2007.12.024.
Pagiola, S., J. Bishop y N. Landell-Mills (Eds.) (2002). “Selling forests environmental services. Market-based mechanisms for conservation and development”, Earthscan, Reino Unido, 299 pp.
Poder Ejecutivo Federal (2009). Programa Especial de Cambio Climático 2009-2012, Comisión Intersecretarial de Cambio Climático, Diario Oficial de la Federación, 28 de agosto de 2009, México.
Reuters, T. (2011). Point Carbon, Carbon 2011.SAO (2011). Servicios Ambientales de Oaxaca ( http://www.
sao.org.mx/).Scneck, J. et al. (2011). Demand for REDD Carbon Credits. A
Primer on Buyers, Markets, and Factors Impacting Prices, Nicholas Institute for Environmental Policy Solutions, Working Paper.
Scolel Té (2011). Plan Vivo (Scolel Té) (http://www.planvivo.org/).
Sierra Gorda (2011) (http://sierragorda.net/).The Economist (2008). “Just Good Business: A special report
on corporate social responsibility”, enero 2008. VCS (2011). Voluntary Carbon Stantard (http://www.v-c-s.
org/).WCI (2011). The Western Climate Initiative (http://www.
westernclimateinitiative.org/).Wunder, S. (2005). Payments for environmental services:
Some nuts and bolts, CIFOR Occasional Paper No. 42, Center for International Forestry Research, Indonesia.
Annexes

67
Annex 1. Ecosystems and vegetation types
ECOSYSTEM VEGETATION TYPE
TROPICAL FORESTS (20 types)
Cultivated forest
Induced forest
Mangrove
Induced palm
Natural palm
Savannah
Sabanoide
High evergreen forest
High subevergreen forest
Low deciduous forest
Low spiny deciduous forest
Low spiny subevergreen forest
Low evergreen forest
Low subdeciduous forest
Tropical gallery forest
Medium deciduous forest
Medium evergreen forest
Medium subdeciduous forest
Medium subevergreen forest
Peten vegetation
Source: Vegetation types from INEGI, and grouping per ecosystem from CONAFOR (information from the National Forest and Soil Inventory)

68Source: Vegetation types from INEGI, and grouping per ecosystem from CONAFOR (information from the National Forest and Soil Inventory)
ECOSYSTEM VEGETATION TYPE
SCRUBLANDS (16 types)
Mezquite forest
Chaparral
Crasicaule scrub
Microphyllous desert scrub
Rosetophyllous desert scrub
Tamaulipas scrub
Rosetophyllous coastal scrub
Sarcocaule scrub
Sarcocrasicaule scrub
Fog sarcocrasicaule scrub
Submontane scrub
Subtropical scrub
Desert mezquital
Tropical mezquital
Sandy desert vegetation
Gallery vegetation
TEMPERATE FORESTS (11 types)
Ayarin forest
Cedar forest
Oak forest
Oak-pine forest
Temperate gallery forest
Oyamel forest
Pine forest
Pine-oak forest
Tascate forest
Montane cloud forest
Coniferous scrub

69
Annex 2. Allocation of scores to the criteria with categories
In this criterion, the index of economic pressure (risk) of deforestation is utilized, developed by the National Institute of Ecology (INE, 2012). This index is a value that indicates, through physical, biological and economic variables, the relative risk of deforestation in each forested property of the country, in “plots” of 9 ha per pixel.
The database incorporated in the GIS of the present analysis has each pixel (9 ha) classified into five categories (level of deforestation risk): Very High, High, Medium, Low and Very Low. Considering the maximum score for this criterion to be 20 points, the following scale was utilized:
Risk of deforestation
Table 1. Scores assigned to the categories of deforestation risk
INE Category (2012) Assigned score
Very high 20
High 16
Medium 12
Low 8
Very low 4
Nil 0

70
Table 2. Scores assigned to the categories of Recorded loss
Table 3. Scores assigned per vegetation type in observed Deforestation
Recorded forest lossFor this criterion, change in area per vegetation type (temperate forests, tropical forests and scrublands) was analyzed in the land use maps of INEGI, considering a period of 14 years: from 1993 (Series II) to 2007 (Series IV). Categories and a numerical scale were assigned in accordance with the percentages of vegetation loss in this period (Table 2).
Following this, scores for the criterion Recorded loss were assigned in the following manner:
Category Area lost (1993-2007) Assigned score
Very high > 25% 10
High 10 - 25% 5
Medium 5 – 10% 3
Low <5% 1
Nil No change, increase and invalid categories for this analysis
0
Land use and vegetation type (INEGI) Types (No.)Assigned
score
Medium evergreen tropical forest, gypsophyllous vegetation, savannah, tropical gallery forest and low evergreen tropical forest.
5 10
Medium deciduous tropical forest, temperate gallery forest, cedar forest, Gallery vegetation, mezquital 1,* gypsophyllous pasture, low spiny tropical forest, high subevergreen tropical forest and popal vegetation.
9 5
Medium subdeciduous tropical forest, medium subevergreen tropical forest, mezquital 2, mezquital 3, high evergreen tropical forest, low deciduous tropical forest, halophyllous pasture, coastal dune vegetation, halophyllous vegetation, halophyllous hydrophyllous vegetation, Tamaulipas scrub, montane cloud forest
12 3
Crasicaule scrub, low subevergreen tropical forest, rosetophyllous coastal scrub, natural pasture, high montane prairie, temperate pine forest, mangrove, temperate pine-oak forest, water bodies, tropical induced palm, temperate oak forest, temperate oak-pine forest, Temperate oyamel forest, microphyllous desert scrub, temperate tascate forest, submontane scrub, fog sarcocrasicaule scrub, sarcocrasicaule scrub, chaparral, subtropical scrub, secondary herbaceous vegetation, sandy desert vegetation, sarcocaule scrub, temperate ayarin forest, rosetophyllous desert scrub, coniferous scrub.
26 1
Urban zone, peten, tular, no apparent vegetation, low subdeciduous tropical forest, induced pasture, sabanoide vegetation, agricultural forestry information, induced forest, natural palm, area devoid of vegetation, human settlement and cultivated forest.
13 0
* INEGI has various types of mezquital registered; here they are identified by number.

71
Carbon contentFor the criterion of carbon, first the density of carbon (tonnes/ha) was calculated for each type of vegetation in temperate and tropical forests and in scrublands (in total, 47 vegetation types, see Annex 1). This was carried out using information generated by CONAFOR for the FAO (2010)4 regarding the condition of the temperate forests in Mexico. The calculated values were combined with the layer of Land Use and Vegetation information from INEGI Series IV (2007, 1:250,000 scale), such that each AN had values of carbon density (tonnes/ha) and area (ha) for each vegetation type. The summation of these
CategoryCarbon content within agrarian
nucleus (tonnes)*Assigned score
Very high >4,320,211 - 19,252,982 20
High >1,204,093 - 4,320,211 10
Medium >255,150 - 1,204093 15
Low 0.0006 - 255,150 5
Nil Without tropical or temperate forest or scrubland
0
Table 4 – Scores assigned per carbon content within an agrarian nucleus
*Includes temperate forests, tropical forests and scrublands (see Annex 1).
In this case, the score does not require weighting since the total carbon is calculated through the summation of values within the AN.
It is worth noting that the carbon content values calculated here do not represent the total inventory of carbon per AN, since they do not include all the land uses and vegetation types that also contain carbon.
4 Evaluation of global forest resources 2010. National Report, Mexico, FAO, Rome, 2010.
values provided the carbon content per AN (tonnes). Applying the “Natural breakpoints” method allowed the formation —from a numerical variable— of groups that minimize intragroup differences while maximizing intergroup differences. Thus we generated four categories of carbon content per AN (Very High, High, Medium and Low). Each of these was subsequently assigned a score based on the weighting of the Carbon content criterion (Table 4).