Embed Size (px)
Citation preview
© Copyright 2016 TRL Ltd
Dr Kevin TurpinOctober 2016
Development of Remote Sensors for Vehicle Emissions Detection

© Copyright 2016 TRL Ltd
Contents
2
• Background
• Idea
• Objectives
• Approach
• Results
• Conclusions
• Applications
• Follow on research
© Copyright 2016 TRL Ltd
Background
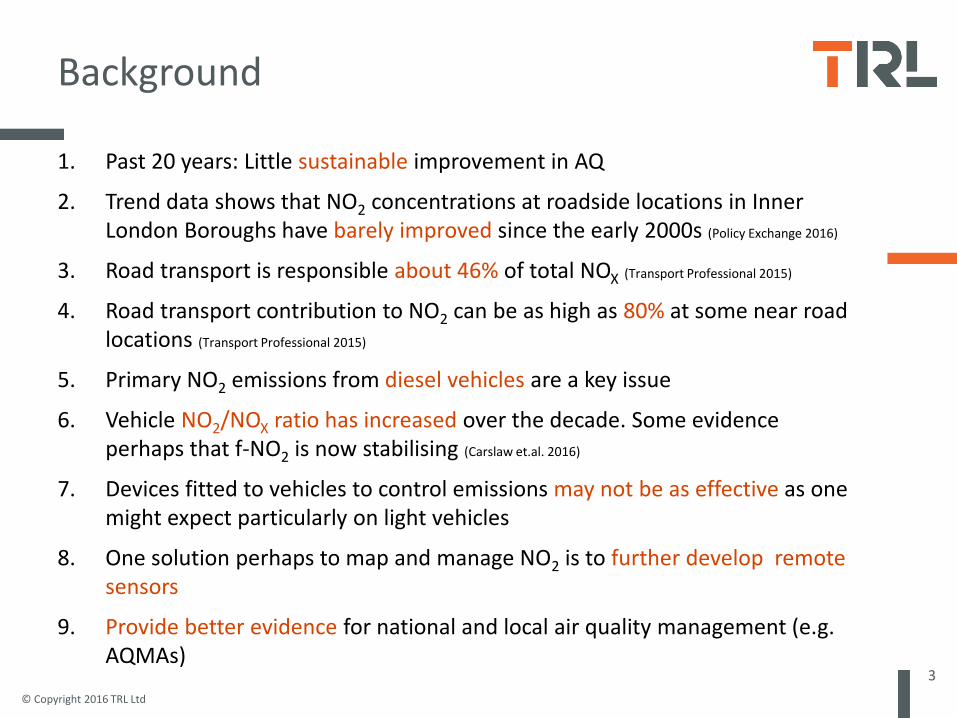
1. Past 20 years: Little sustainable improvement in AQ
2. Trend data shows that NO2 concentrations at roadside locations in Inner London Boroughs have barely improved since the early 2000s (Policy Exchange 2016)
3. Road transport is responsible about 46% of total NOX (Transport Professional 2015)
4. Road transport contribution to NO2 can be as high as 80% at some near road locations (Transport Professional 2015)
5. Primary NO2 emissions from diesel vehicles are a key issue
6. Vehicle NO2/NOX ratio has increased over the decade. Some evidence perhaps that f-NO2 is now stabilising (Carslaw et.al. 2016)
7. Devices fitted to vehicles to control emissions may not be as effective as one might expect particularly on light vehicles
8. One solution perhaps to map and manage NO2 is to further develop remote sensors
9. Provide better evidence for national and local air quality management (e.g. AQMAs)
3
© Copyright 2016 TRL Ltd
Initial Idea
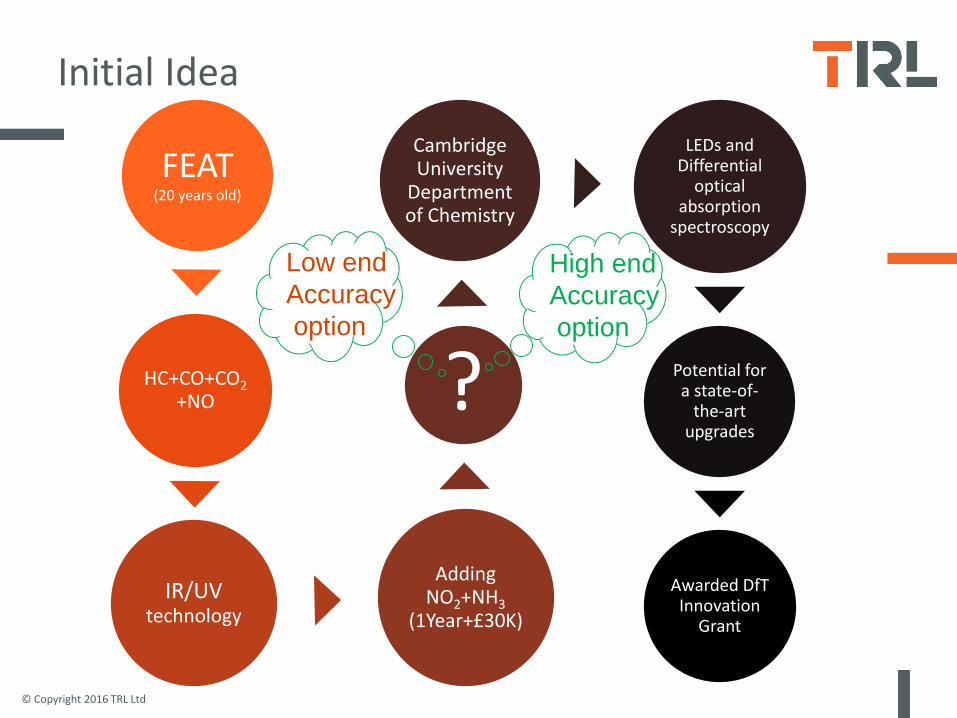
FEAT (20 years old)
HC+CO+CO2
+NO
IR/UV technology
Adding NO2+NH3
(1Year+£30K)
?
Cambridge University
Department of Chemistry
LEDs and Differential
optical absorption
spectroscopy
Potential for a state-of-
the-art upgrades
Awarded DfT Innovation
Grant
Low end
Accuracy
option
High end
Accuracy
option
© Copyright 2016 TRL Ltd
Objectives
1. Construct a prototype lab based NO2 DOAS measurement system at Cambridge University;
2. Carry out laboratory sensitivity tests of the NO2 system;
3. Calibrate FEAT to measure CO, HC and CO2 concentrations in controlled conditions at TRL;
4. Undertake field trials of the NO2 DOAS system alongside FEAT under controlled conditions at TRL;
5. Analyse NO2 results from the DOAS system with fast response CO2
measurements measured by FEAT;
6. Provide recommendations for future commercial evolution of the system including potential developmental funding opportunities.
© Copyright 2016 TRL Ltd
Approach
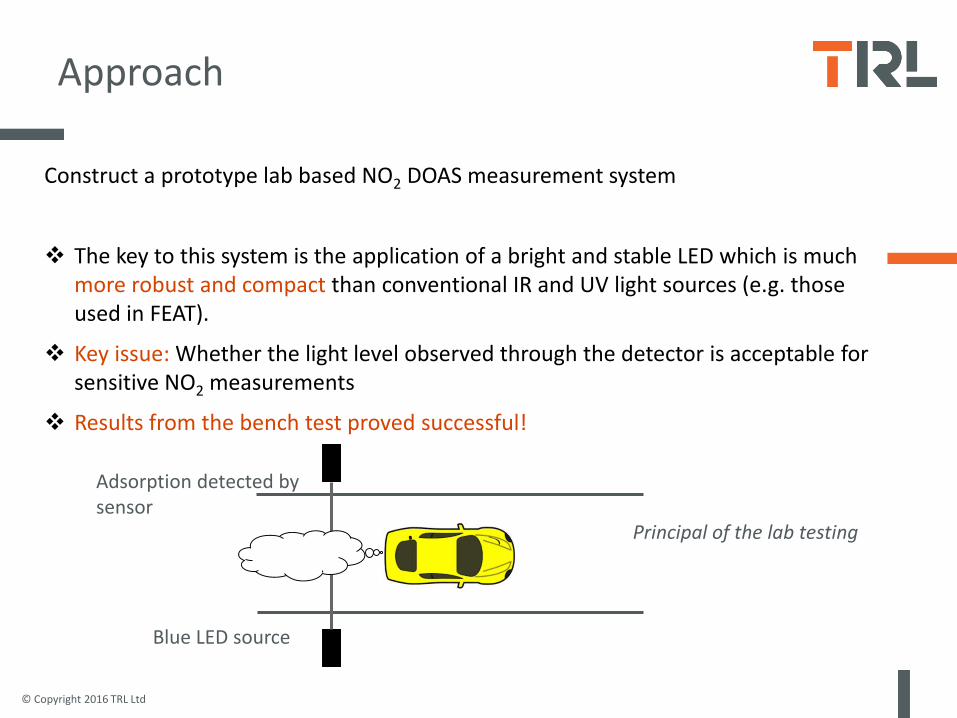
Construct a prototype lab based NO2 DOAS measurement system
The key to this system is the application of a bright and stable LED which is much more robust and compact than conventional IR and UV light sources (e.g. those used in FEAT).
Key issue: Whether the light level observed through the detector is acceptable for sensitive NO2 measurements
Results from the bench test proved successful!
Blue LED source
Adsorption detected by sensor
Principal of the lab testing
© Copyright 2016 TRL Ltd
Approach
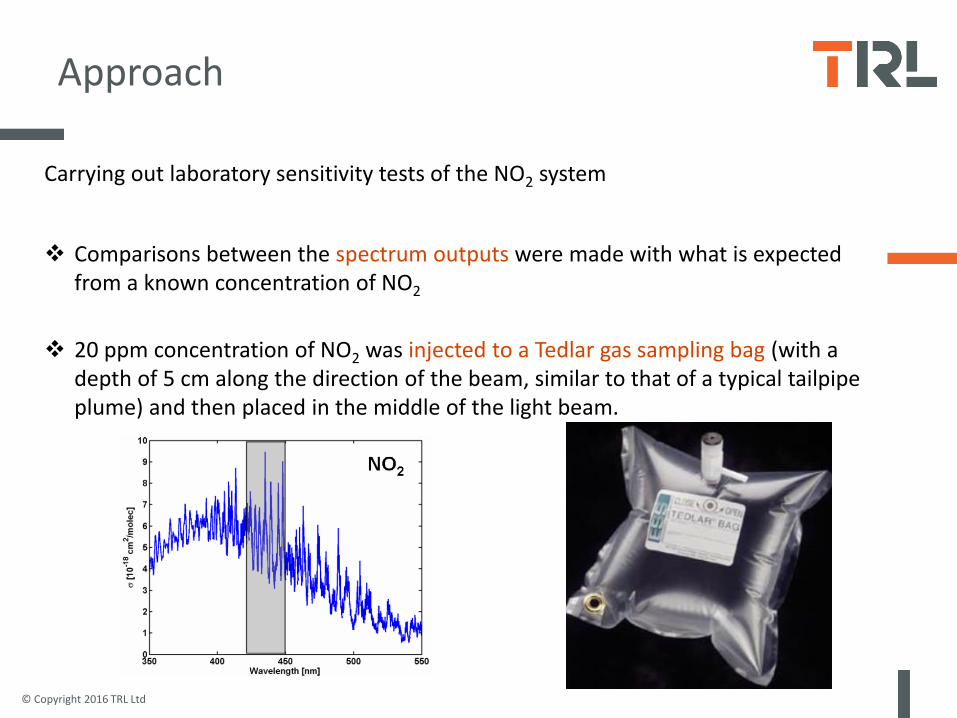
Carrying out laboratory sensitivity tests of the NO2 system
Comparisons between the spectrum outputs were made with what is expected from a known concentration of NO2
20 ppm concentration of NO2 was injected to a Tedlar gas sampling bag (with a depth of 5 cm along the direction of the beam, similar to that of a typical tailpipe plume) and then placed in the middle of the light beam.
© Copyright 2016 TRL Ltd
Approach
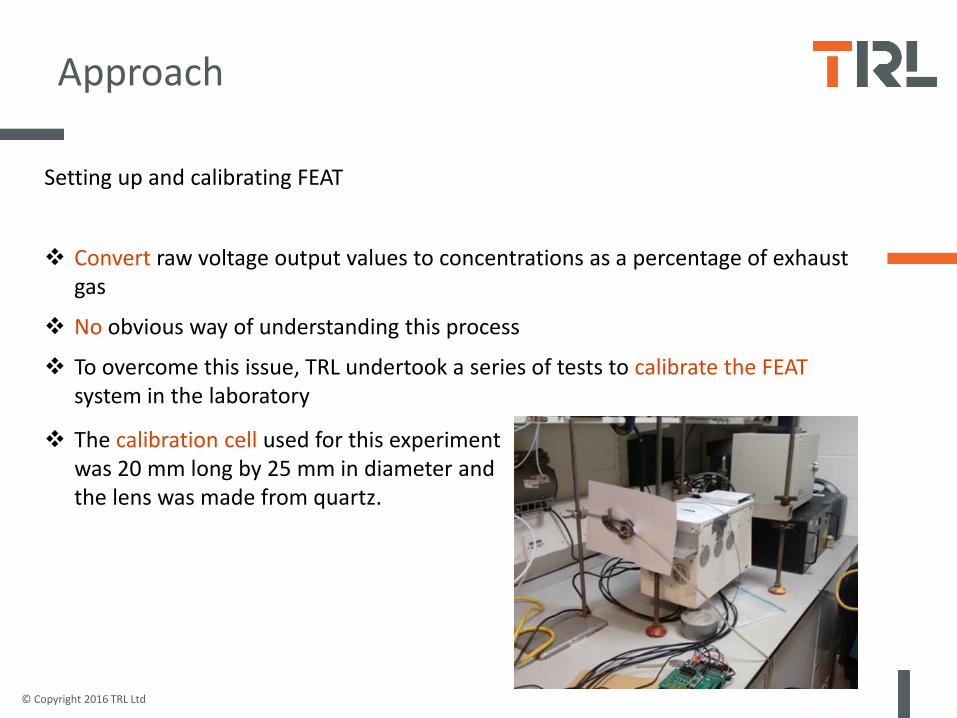
Setting up and calibrating FEAT
Convert raw voltage output values to concentrations as a percentage of exhaust gas
No obvious way of understanding this process
To overcome this issue, TRL undertook a series of tests to calibrate the FEAT system in the laboratory
The calibration cell used for this experiment was 20 mm long by 25 mm in diameter and the lens was made from quartz.
© Copyright 2016 TRL Ltd
Approach
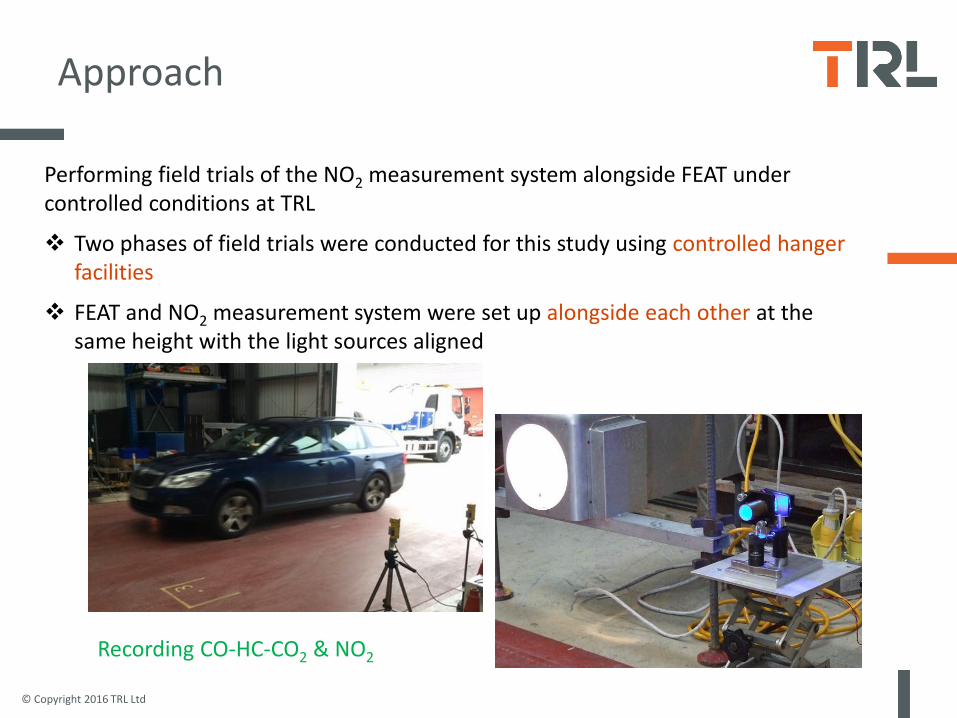
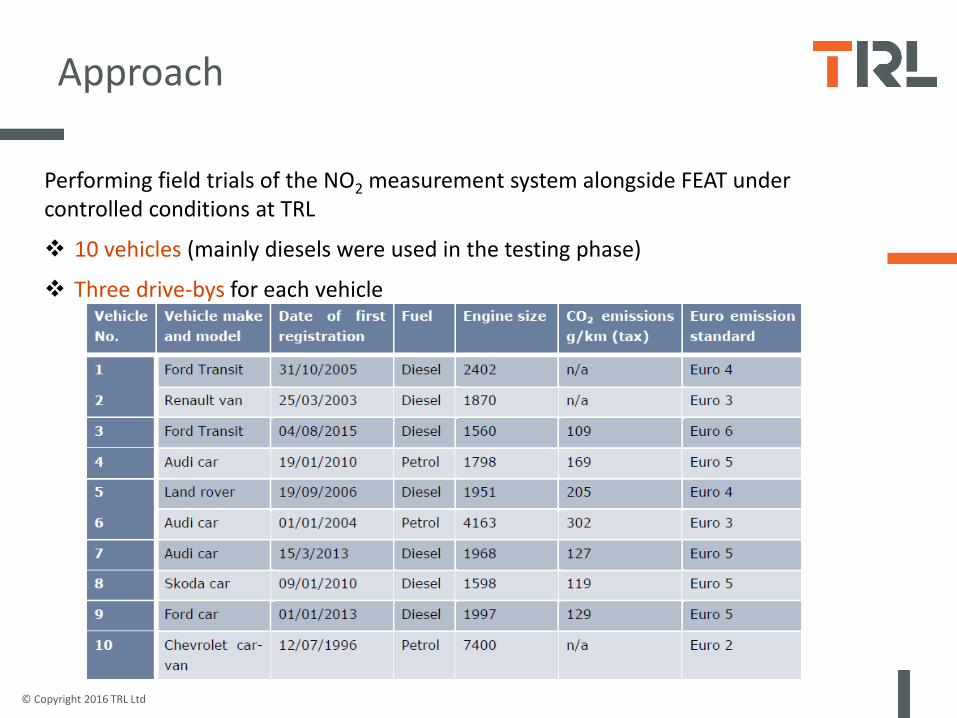
Performing field trials of the NO2 measurement system alongside FEAT under controlled conditions at TRL
Two phases of field trials were conducted for this study using controlled hanger facilities
FEAT and NO2 measurement system were set up alongside each other at the same height with the light sources aligned
Recording CO-HC-CO2 & NO2
© Copyright 2016 TRL Ltd
Approach
Performing field trials of the NO2 measurement system alongside FEAT under controlled conditions at TRL
10 vehicles (mainly diesels were used in the testing phase)
Three drive-bys for each vehicle
© Copyright 2016 TRL Ltd
Results
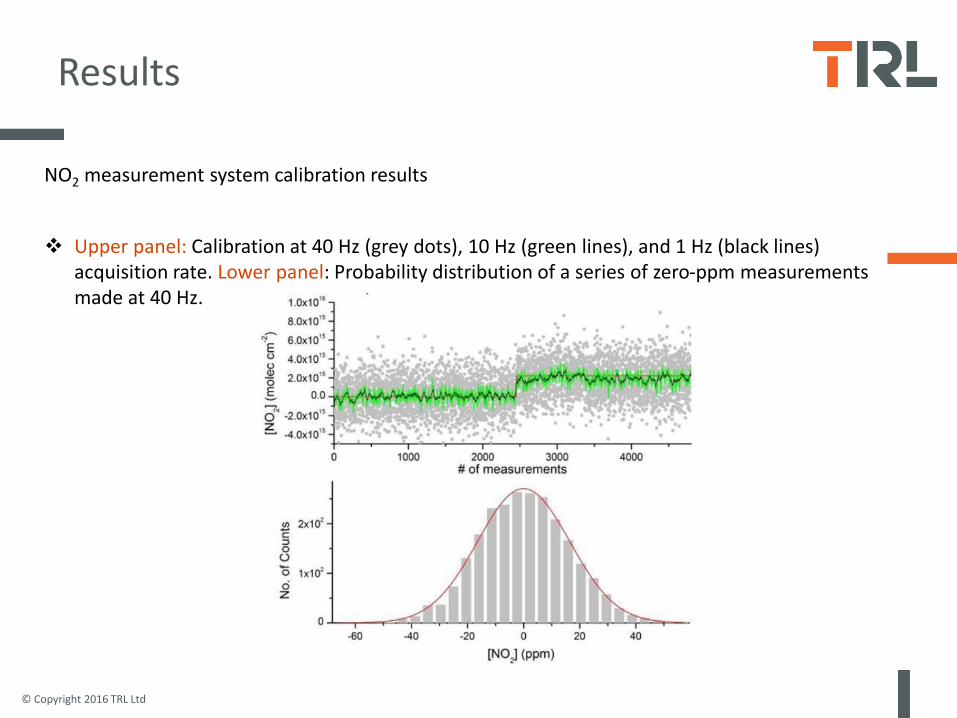
NO2 measurement system calibration results
Upper panel: Calibration at 40 Hz (grey dots), 10 Hz (green lines), and 1 Hz (black lines) acquisition rate. Lower panel: Probability distribution of a series of zero-ppm measurements made at 40 Hz.
© Copyright 2016 TRL Ltd
Results
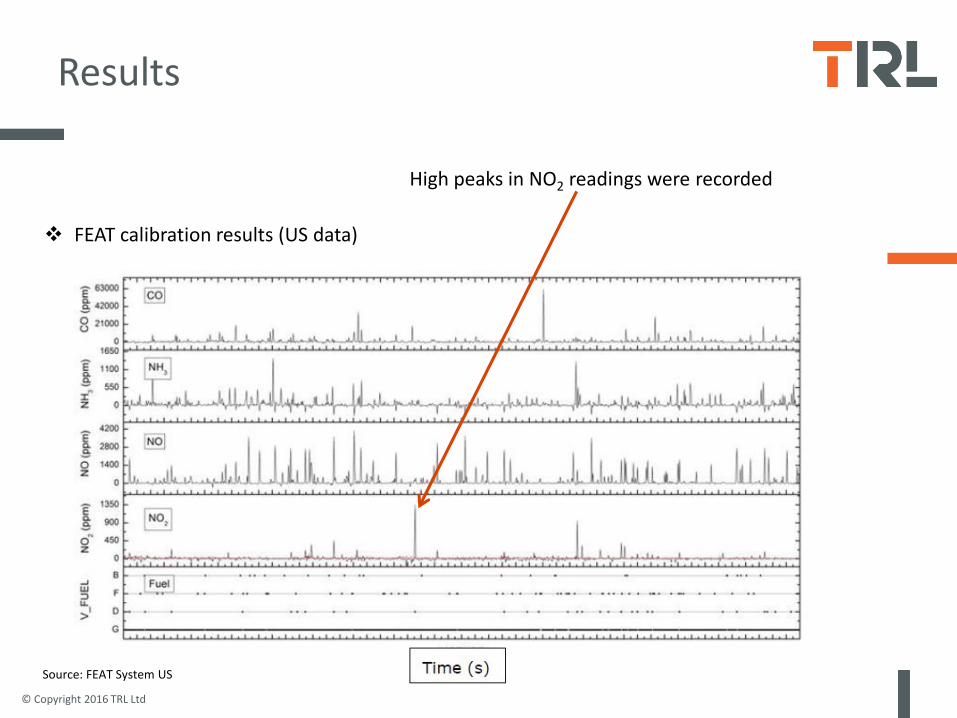
FEAT calibration results (US data)
High peaks in NO2 readings were recorded
Source: FEAT System US
© Copyright 2016 TRL Ltd
Results
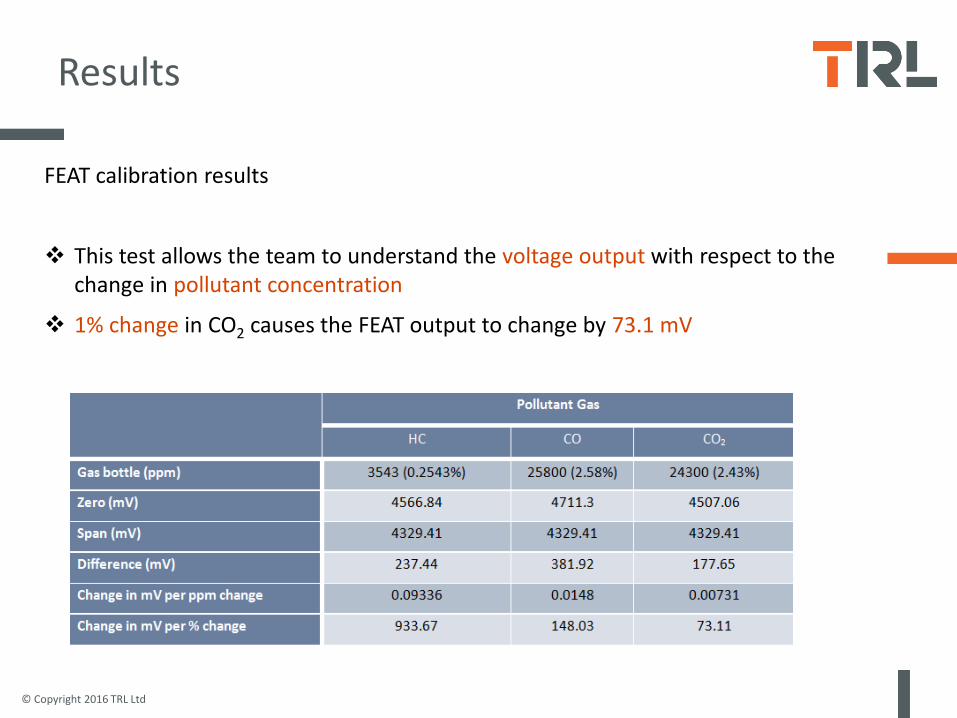
FEAT calibration results
This test allows the team to understand the voltage output with respect to the change in pollutant concentration
1% change in CO2 causes the FEAT output to change by 73.1 mV
© Copyright 2016 TRL Ltd
Results
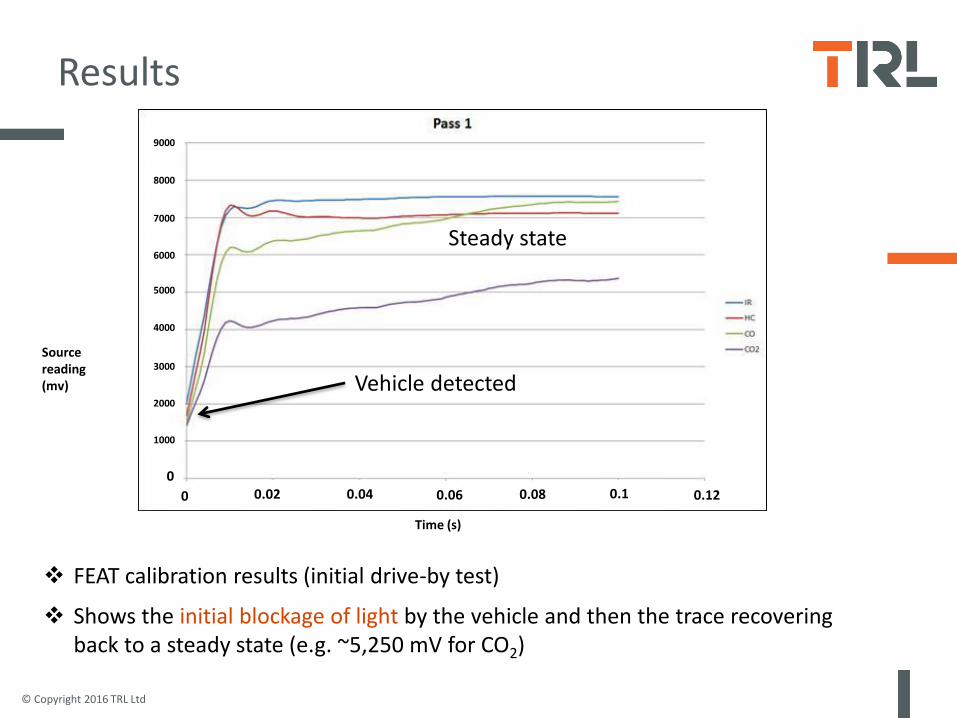
FEAT calibration results (initial drive-by test)
Shows the initial blockage of light by the vehicle and then the trace recovering back to a steady state (e.g. ~5,250 mV for CO2)
Steady state
0 0.120.04 0.06 0.08 0.10.020
1000
2000
3000
4000
5000
6000
7000
8000
9000
Time (s)
Source reading (mv) Vehicle detected
© Copyright 2016 TRL Ltd
Results
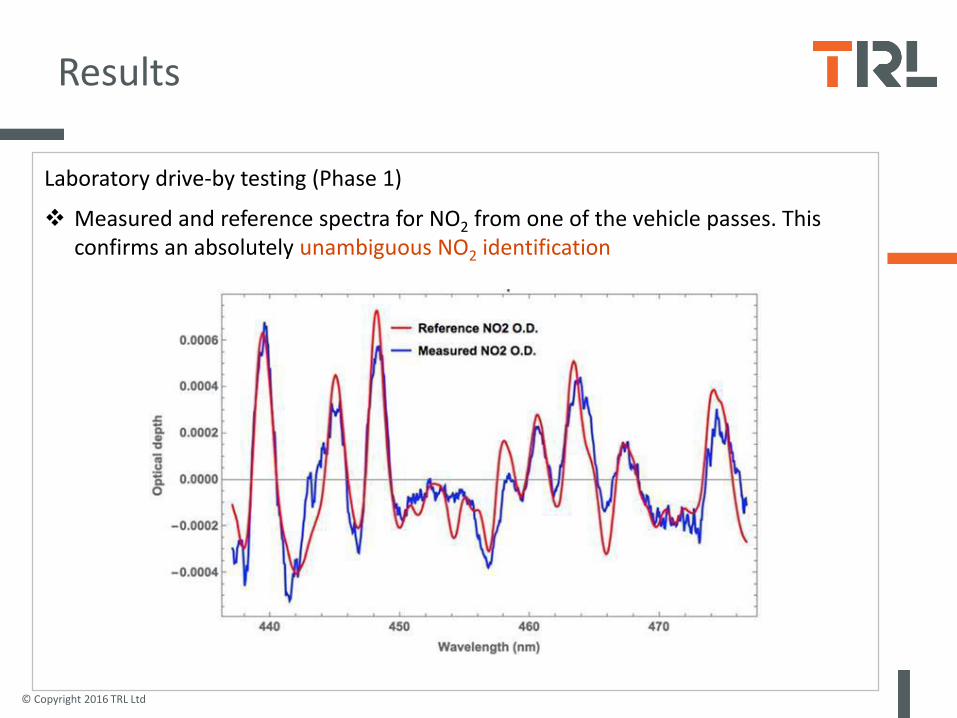
Laboratory drive-by testing (Phase 1)
Measured and reference spectra for NO2 from one of the vehicle passes. This confirms an absolutely unambiguous NO2 identification
© Copyright 2016 TRL Ltd
Results
Laboratory drive-by testing (Phase 1)
The observed NO2 from a 2005 diesel van and a 2010 eco-diesel passenger car are presented.
The FEAT system recorded % CO, HC and CO2
Conclusions from the NO2 measurement system:
The two vehicles have similar NO2 emissivity;
The same vehicle can show significantly different particle emissivity (e.g. Pass 1 and 3, for the older 2005 van);
Diesel Eco was no better in terms of NO2 emissivity, but it seems that fewer particles were emitted during its two passes;
© Copyright 2016 TRL Ltd
Results
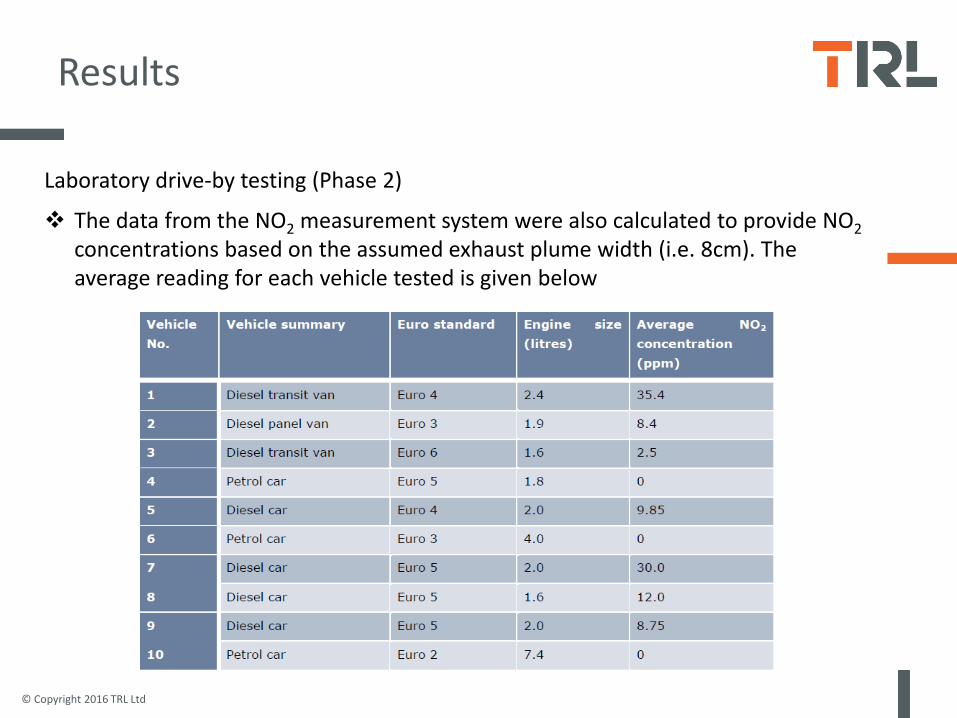
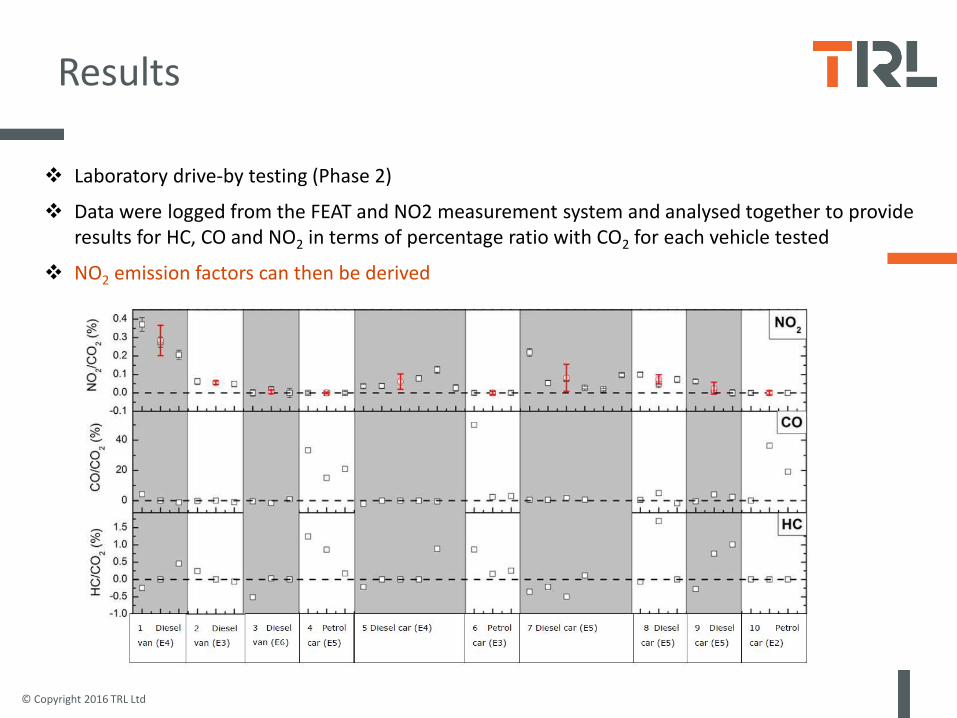
Laboratory drive-by testing (Phase 2)
The data from the NO2 measurement system were also calculated to provide NO2
concentrations based on the assumed exhaust plume width (i.e. 8cm). The average reading for each vehicle tested is given below
© Copyright 2016 TRL Ltd
Results
Laboratory drive-by testing (Phase 2)
Data were logged from the FEAT and NO2 measurement system and analysed together to provide results for HC, CO and NO2 in terms of percentage ratio with CO2 for each vehicle tested
NO2 emission factors can then be derived

© Copyright 2016 TRL Ltd
Conclusions
Unequivocal detection of NO2, identified by its unique spectral signature as demonstrated clearly in this presentation against data reported in the literature.
Demonstrating from laboratory tests that the sensitivity level required for the project has been achieved
Controlled field trials that have demonstrated real world detection of NO2 using the optical sensor alongside the existing proven FEAT technology from a range of different moving vehicles
Integration of fast response (40Hz) DOAS NO2 measurements with those from the FEAT system enabling NO2 emission factors to be derived for a range of vehicles
Demonstrates the DfT’s priorities to better characterise emissions from vehicles in real-time and goes a step further in developing a measurement system that has the potential to better characterise the primary NO2 fraction from vehicle exhausts.

© Copyright 2016 TRL Ltd
Applications
There are a number of potential applications;
Identifying high emitters on the road so that they can be rectified
Apportionment of the NO2 emissions to difference vehicle types (car, taxi, LGV, HGV, bus etc.) so that the higher contributors can be targeted
Checking the performance of a fleet of vehicles – e.g. bus emissions measured at the depot
Identifying new vehicle models which have suspicious NO2 emissions, which could be selected for the type approval market surveillance testing
Conducting ad hoc on-road emission testing, of fleets or individual vehicles, e.g. at ports or off slip roads
With the addition of a NO channel, the NO2 proportion of NOx (f-NO2) could be investigated at different locations
© Copyright 2016 TRL Ltd
Follow on research
DfT T-TRIG Grant;
Demonstration of proof of concept of a prototype low cost optical pollution sensor
Why do we need these devices?
Because existing monitoring using real-time or passive methods are often not sufficient to adequately assess emission impacts and existing optical NO2
measuring devices are expensive, bulky and require mains power supplies.
The aim of the research:
Provide proof of concept of an optical measuring device that uses the same principles but is low cost, potentially smaller and battery powered.
© Copyright 2016 TRL Ltd
Follow on research: challenges
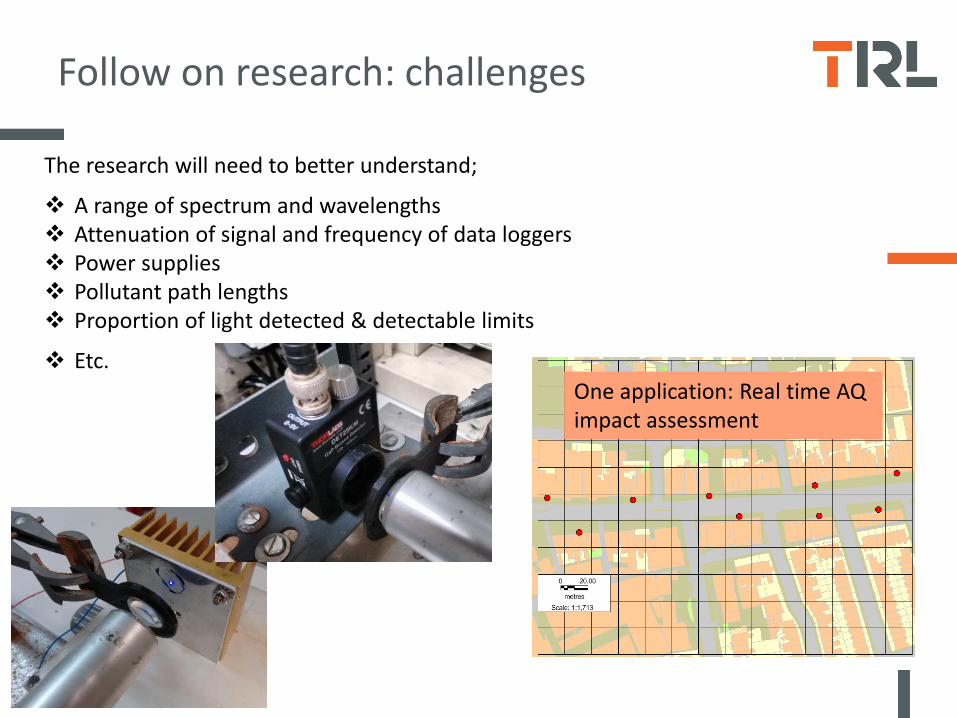
The research will need to better understand;
A range of spectrum and wavelengths Attenuation of signal and frequency of data loggers Power supplies Pollutant path lengths Proportion of light detected & detectable limits
Etc.
One application: Real time AQ impact assessment