Embed Size (px)
Citation preview
Status, constraint and security
of cane supply for the rattan
industry in China
Li Rong Sheng
Research Institute of Tropical Forestry
Chinese Academy of Forestry
Brief introduction to the rattan
industry in China
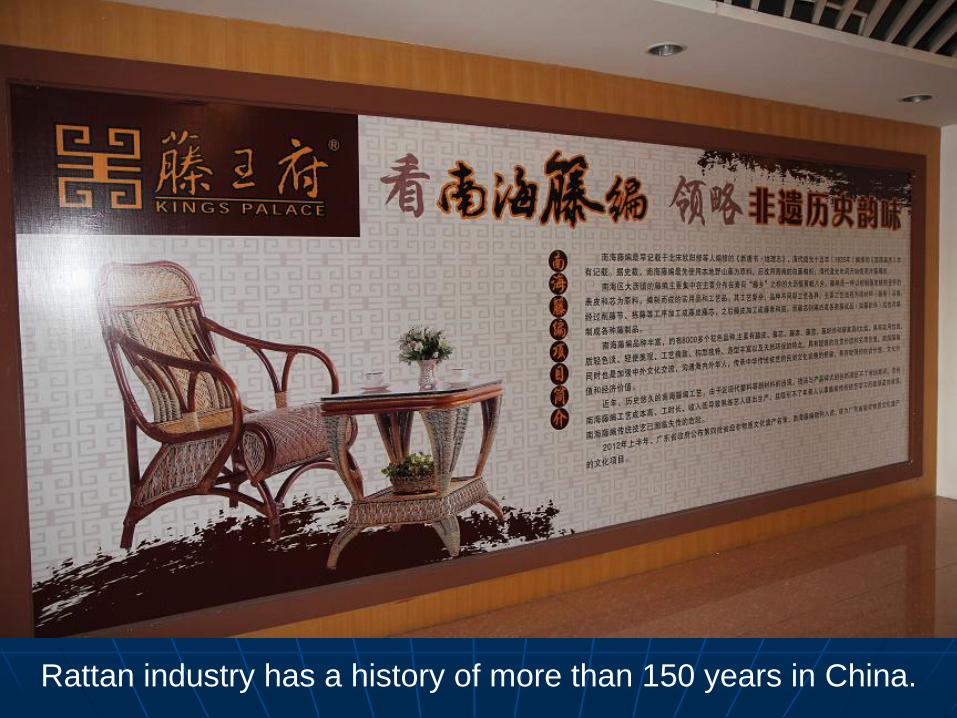
Rattan industry has a history of more than 150 years in China.
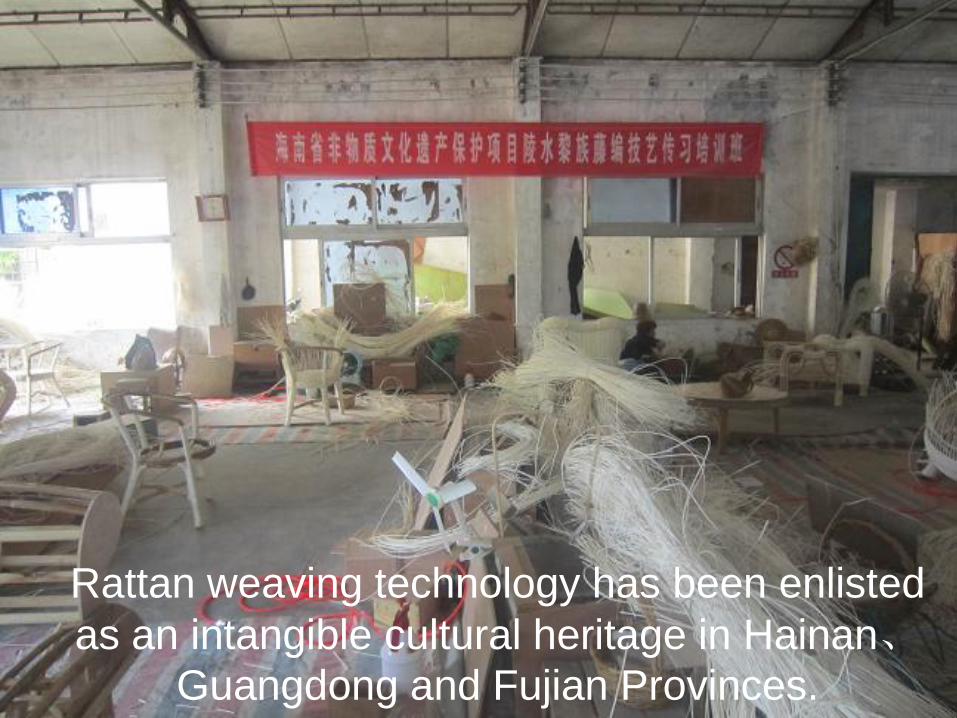
Rattan weaving technology has been enlisted
as an intangible cultural heritage in Hainan、Guangdong and Fujian Provinces.
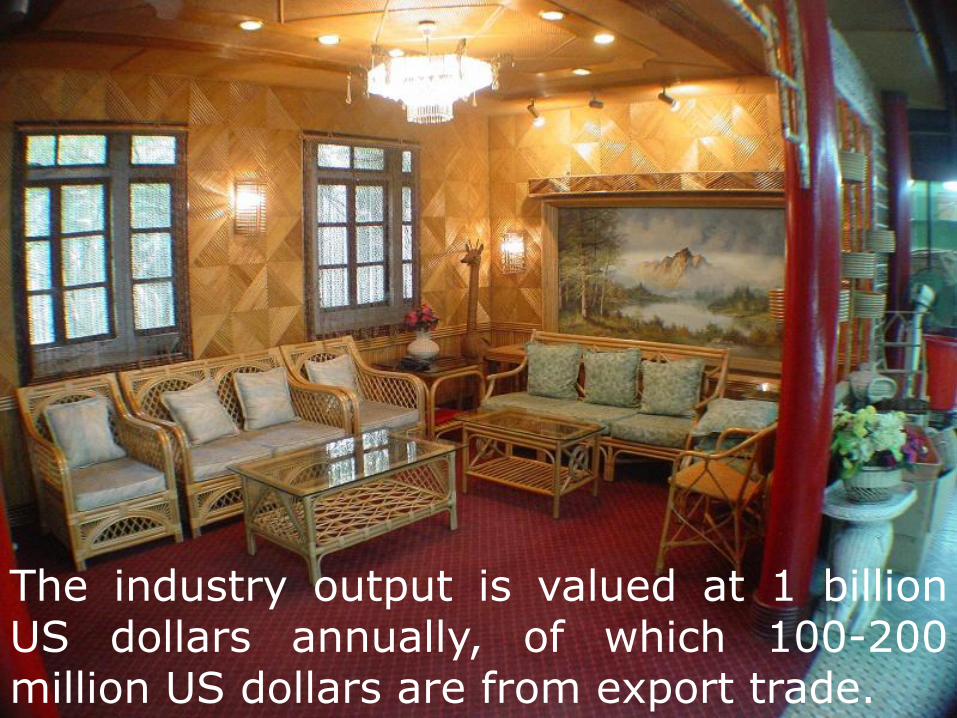
The industry output is valued at 1 billion US dollars annually, of which 100-200 million US dollars are from export trade.
Status of cane supply for the
rattan industry in China
Domestic canes
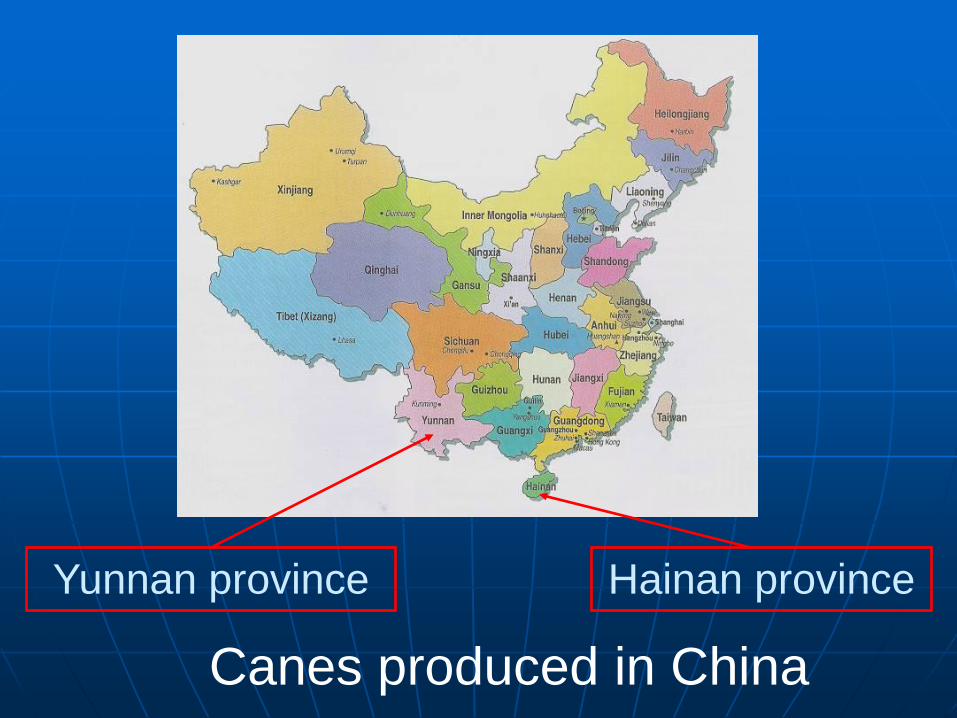
Canes produced in China
Hainan province Yunnan province
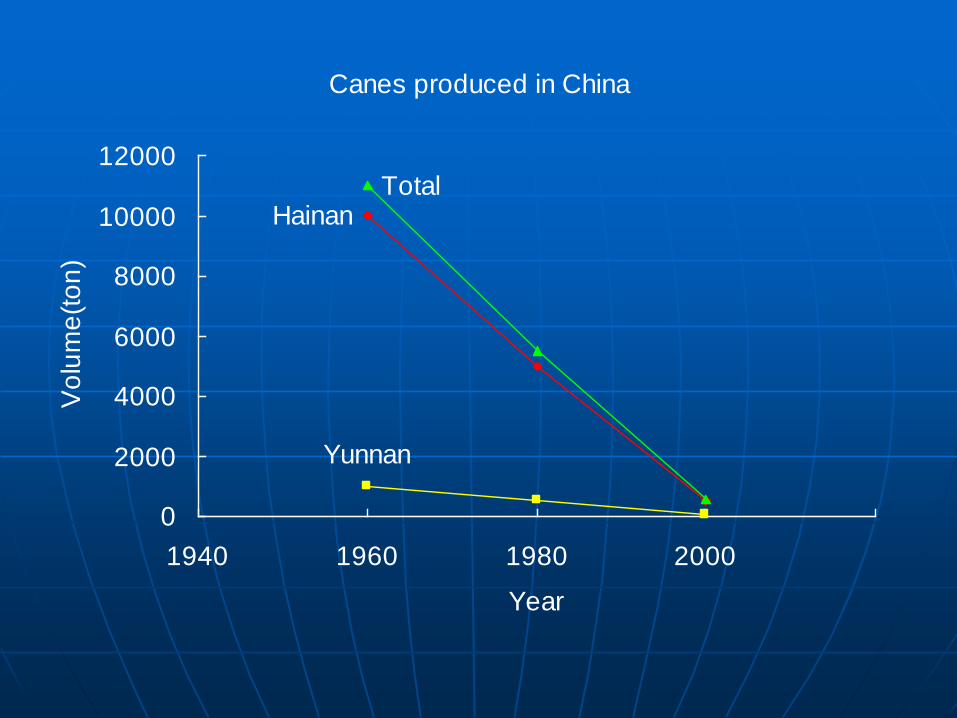
Canes produced in China
Hainan
Yunnan
Total
0
2000
4000
6000
8000
10000
12000
1940 1960 1980 2000
Year
Vo
lum
e(t
on
)
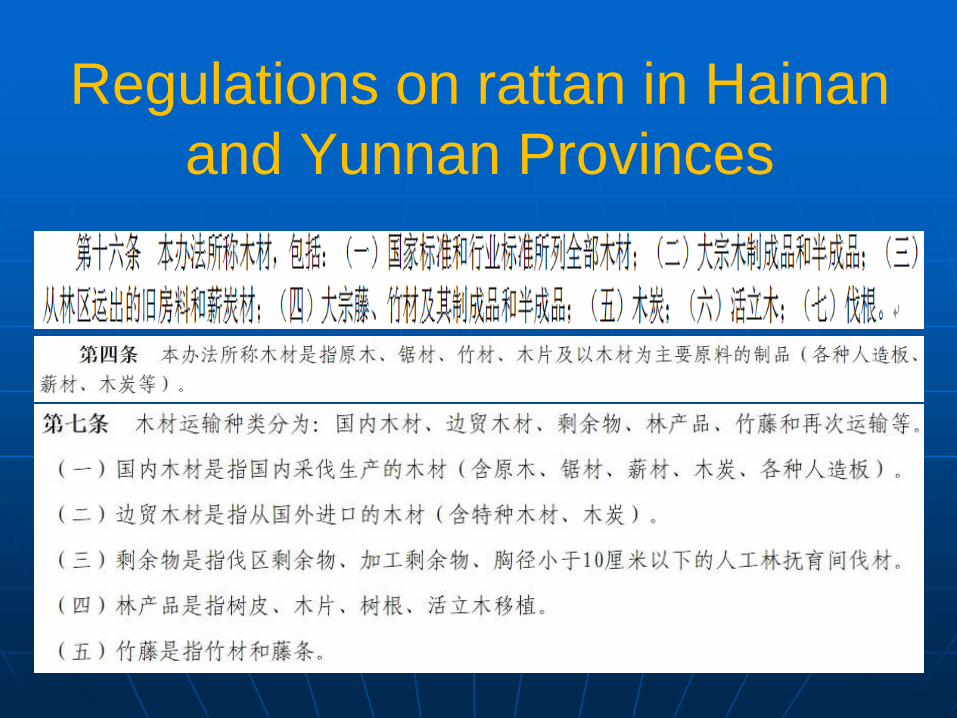
Regulations on rattan in Hainan
and Yunnan Provinces
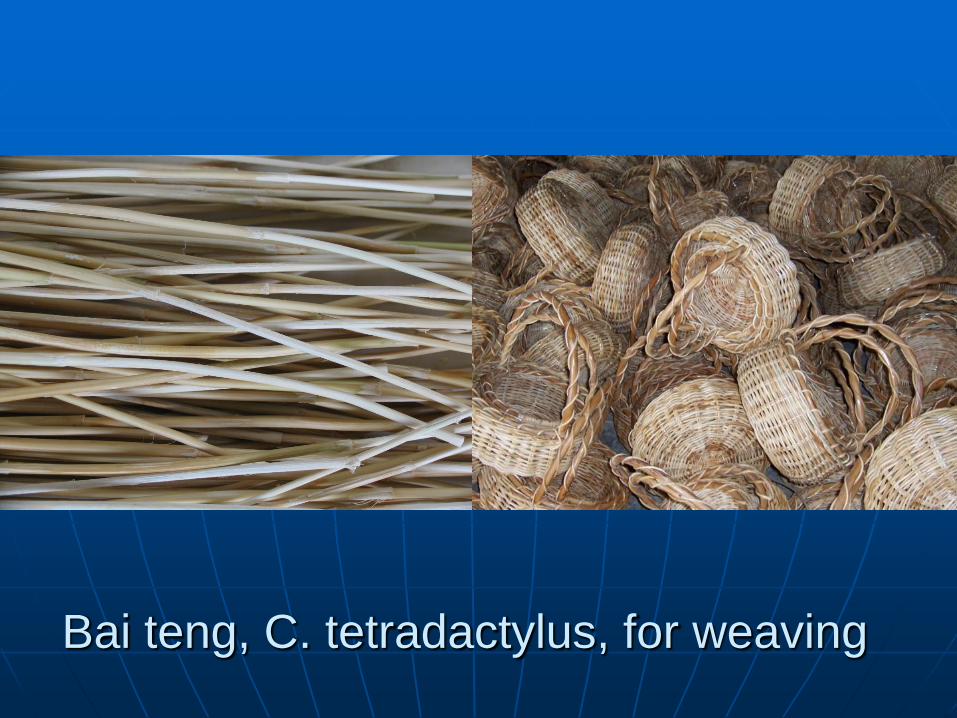
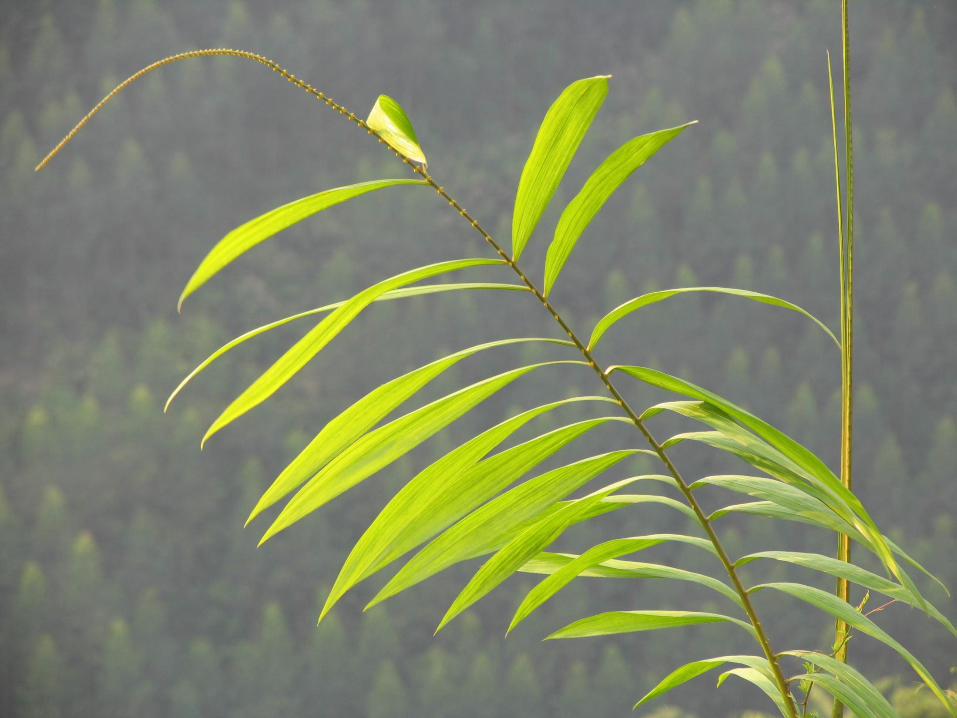
Bai teng, C. tetradactylus, for weaving
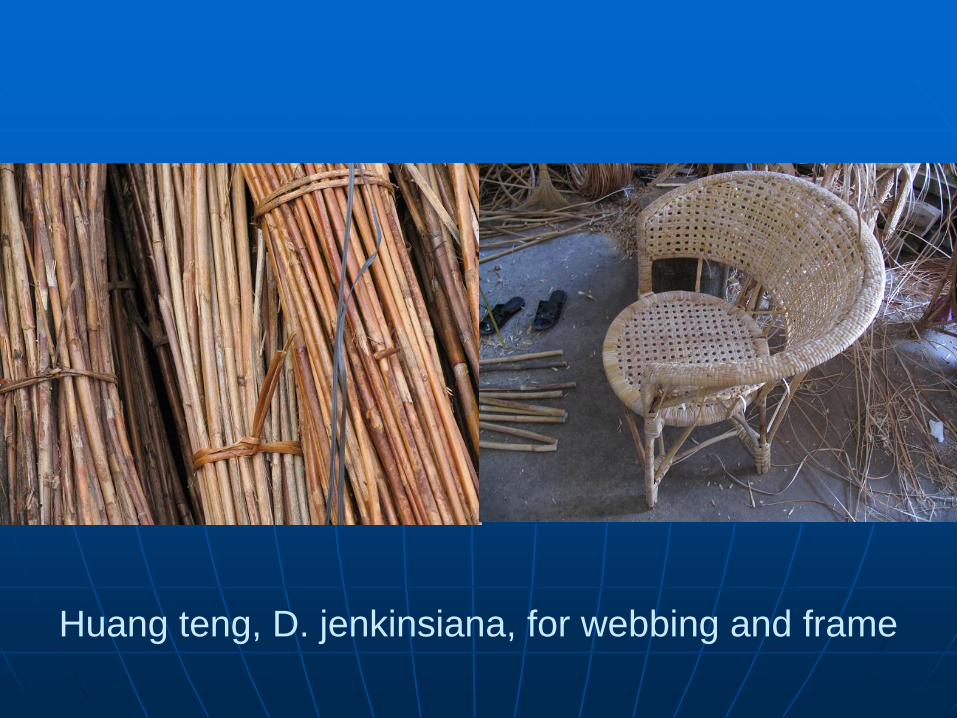
Huang teng, D. jenkinsiana, for webbing and frame
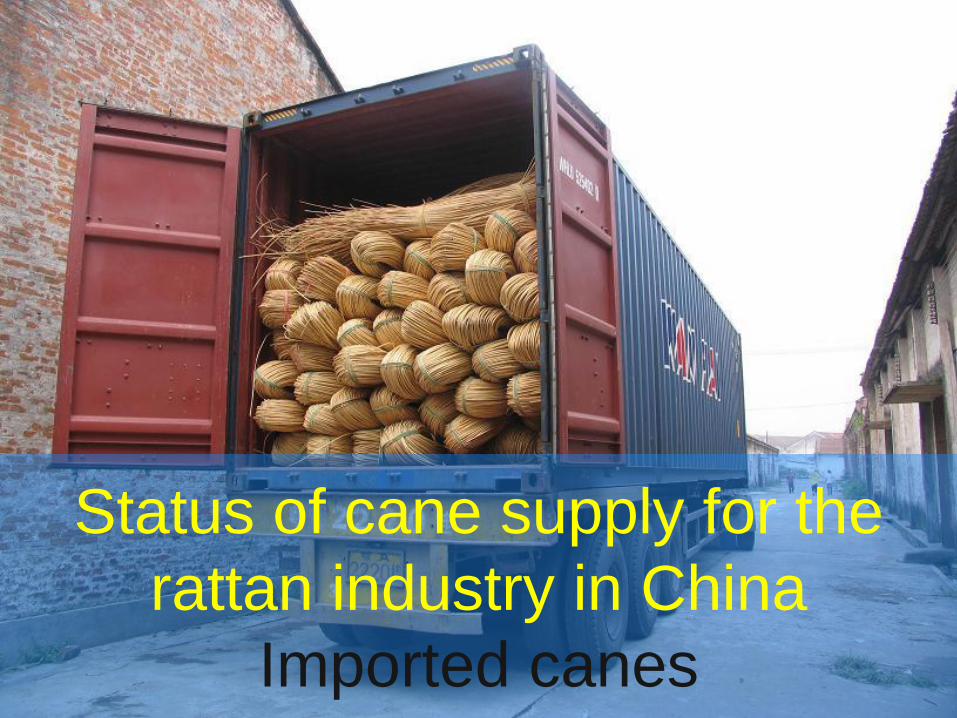
Status of cane supply for the
rattan industry in China
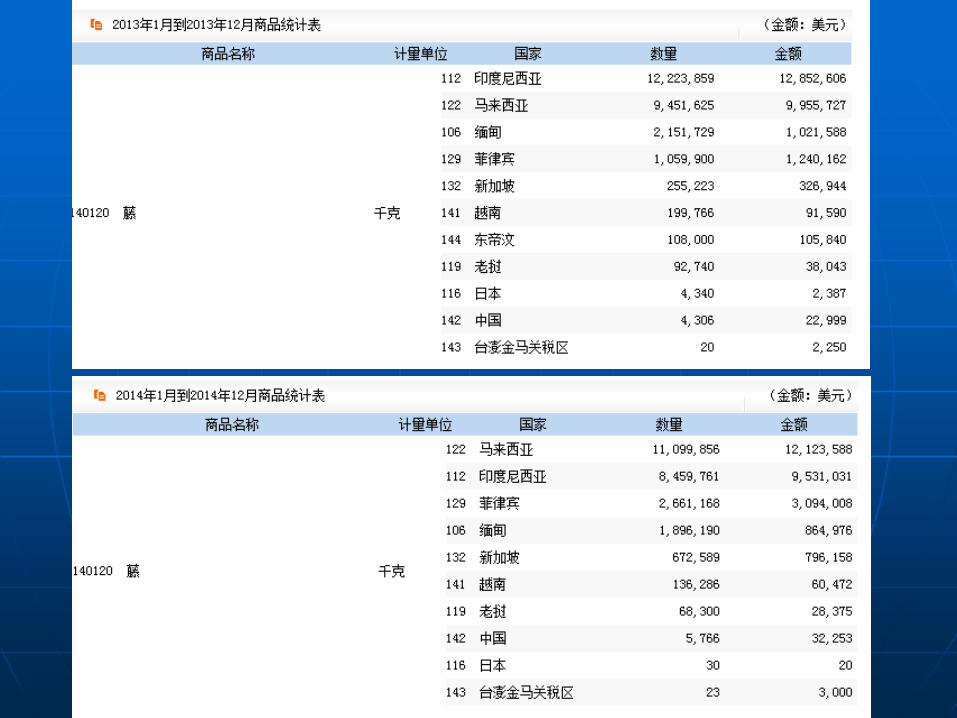
Imported canes
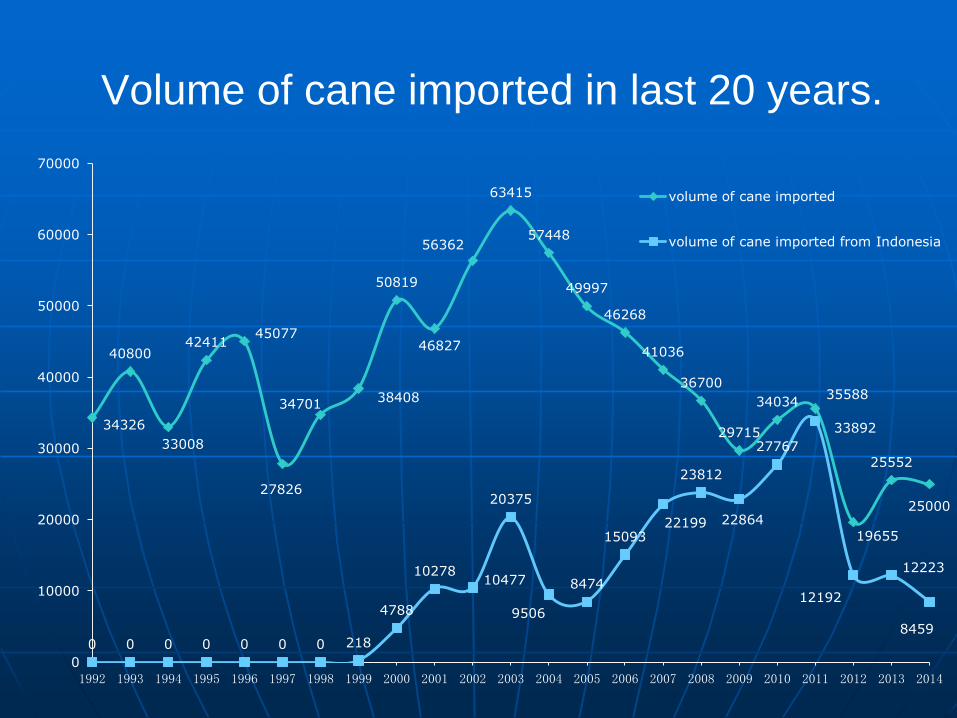
Volume of cane imported in last 20 years.
34326
40800
33008
42411 45077
27826
34701 38408
50819
46827
56362
63415
57448
49997
46268
41036
36700
29715
34034 35588
19655
25552
25000
0 0 0 0 0 0 0 218
4788
10278 10477
20375
9506
8474
15093 22199
23812
22864
27767
33892
12192
12223
8459
0
10000
20000
30000
40000
50000
60000
70000
1992 1993 1994 1995 1996 1997 1998 1999 2000 2001 2002 2003 2004 2005 2006 2007 2008 2009 2010 2011 2012 2013 2014
volume of cane imported
volume of cane imported from Indonesia
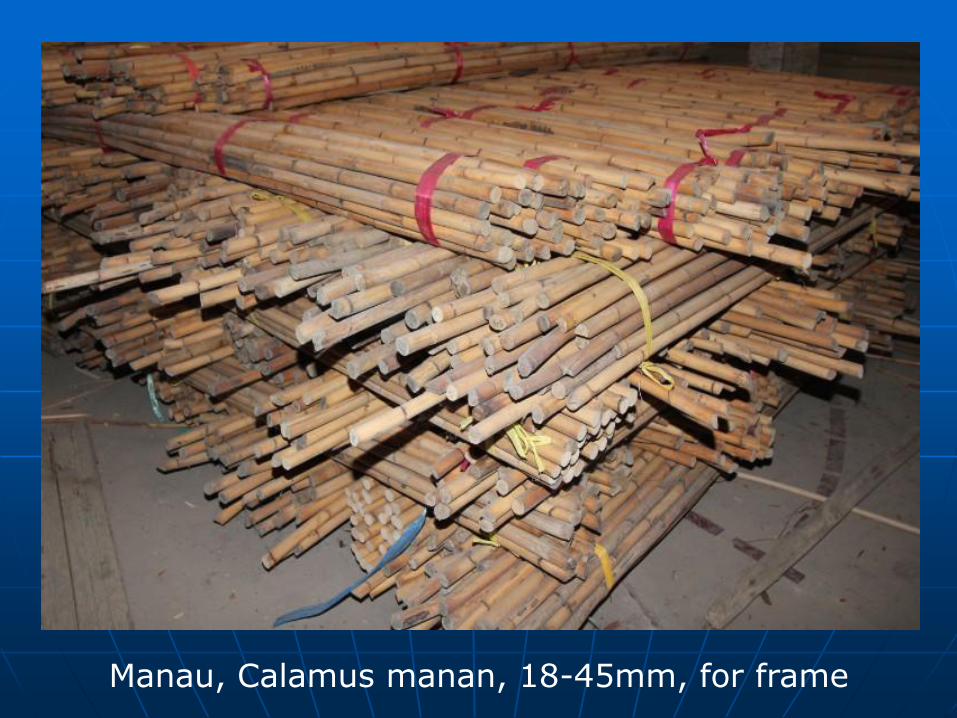
Manau, Calamus manan, 18-45mm, for frame
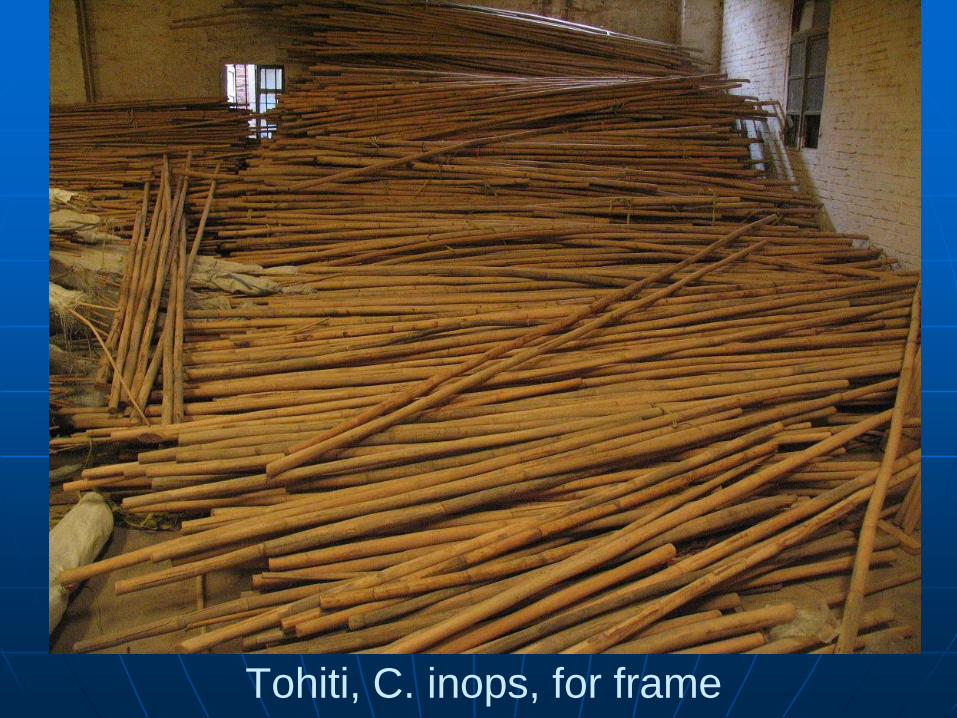
Tohiti, C. inops, for frame
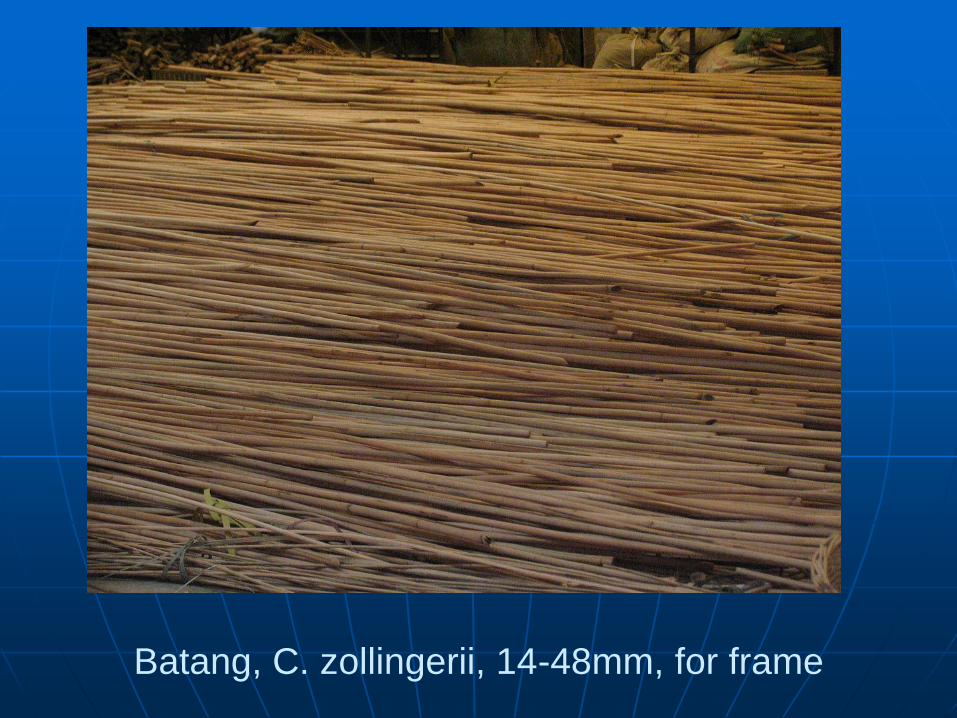
Batang, C. zollingerii, 14-48mm, for frame
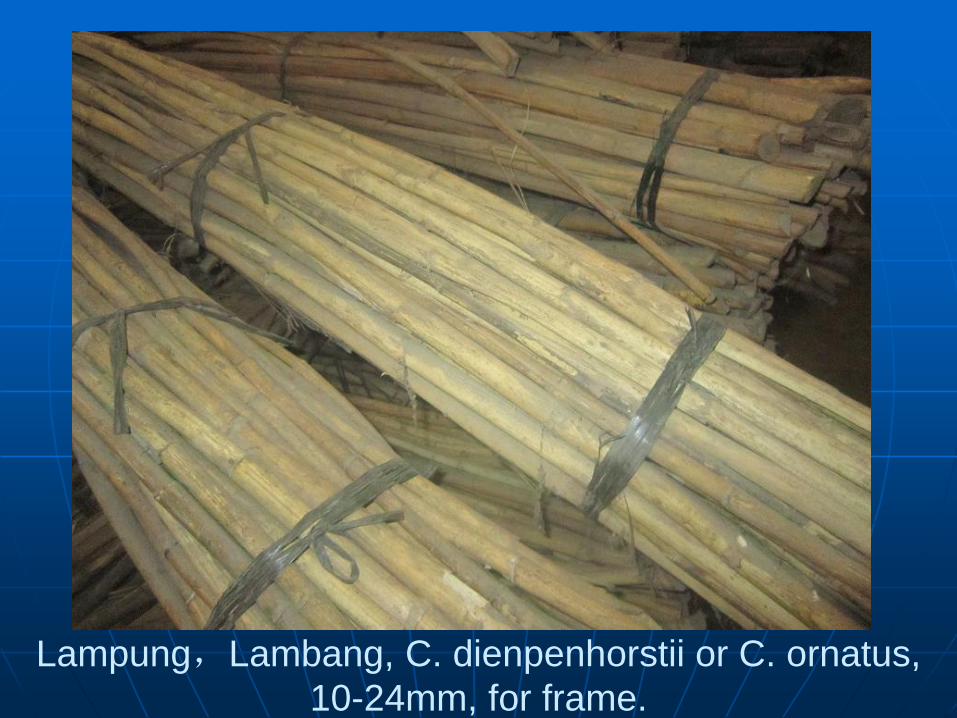
Lampung,Lambang, C. dienpenhorstii or C. ornatus,
10-24mm, for frame.
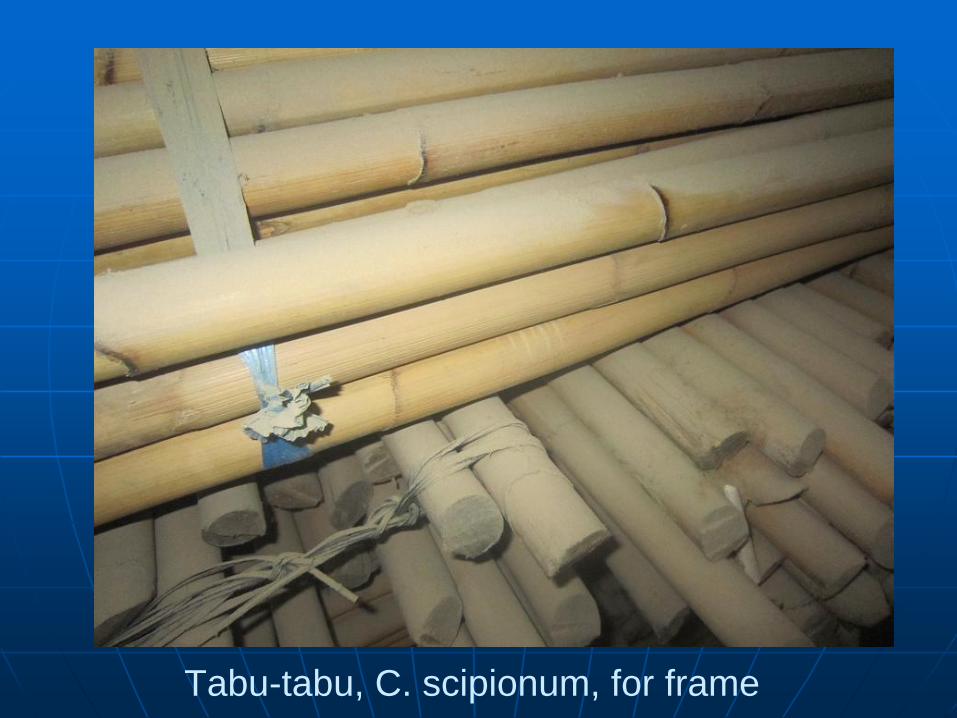
Tabu-tabu, C. scipionum, for frame
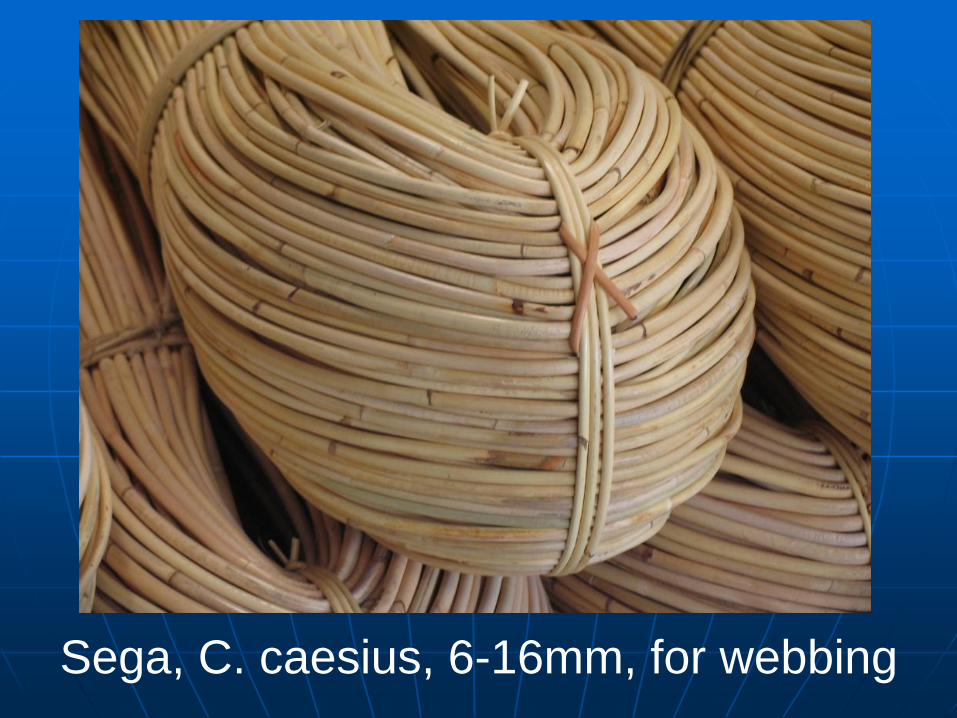
Sega, C. caesius, 6-16mm, for webbing
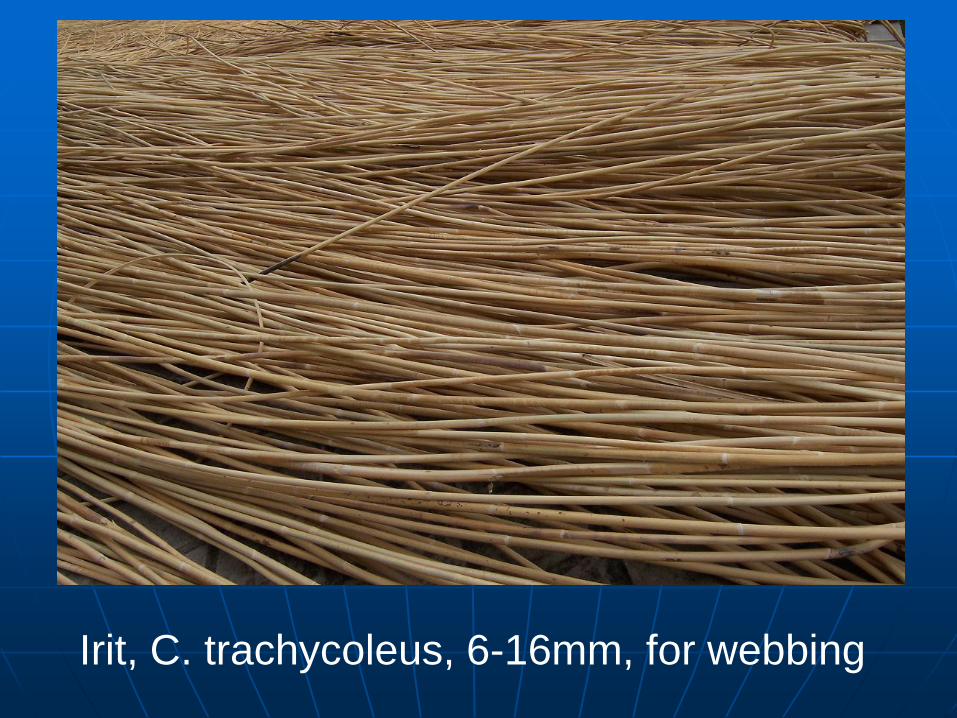
Irit, C. trachycoleus, 6-16mm, for webbing
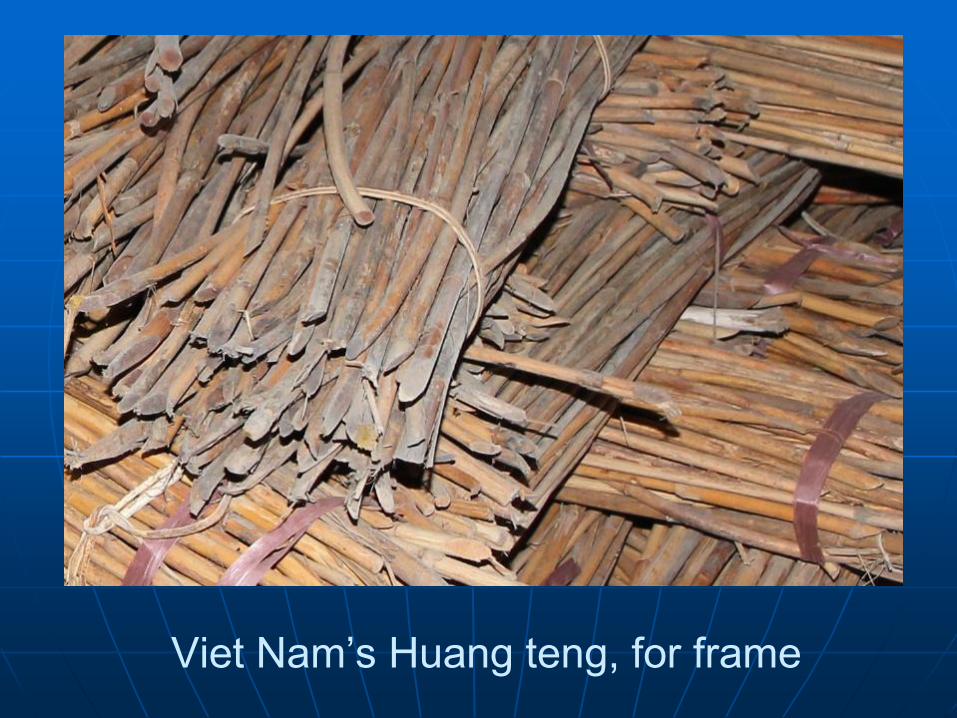
Viet Nam’s Huang teng, for frame
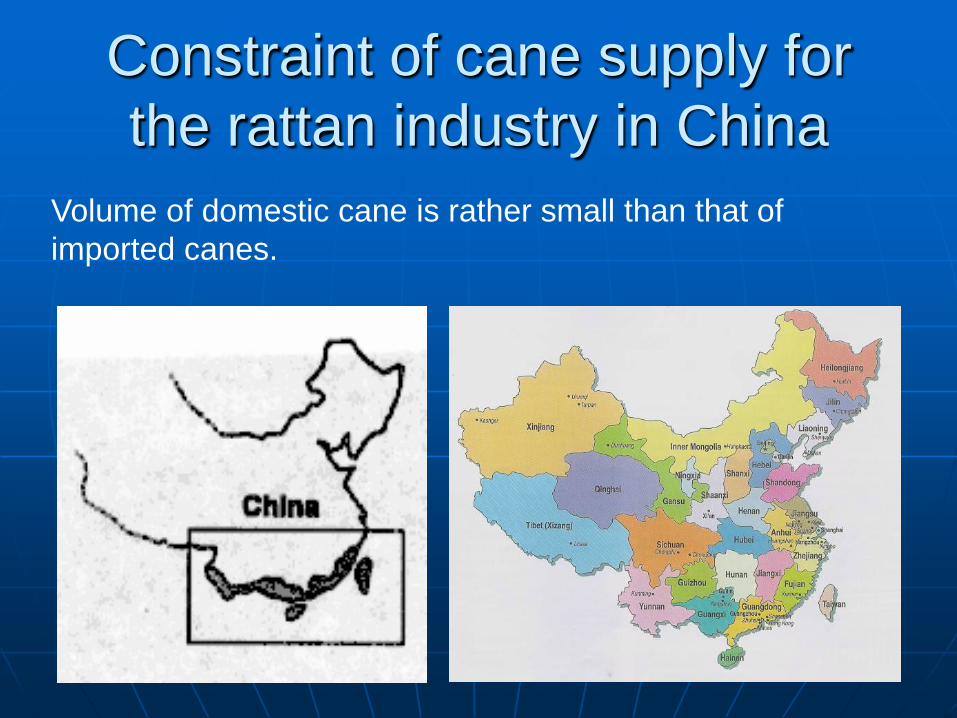
Constraint of cane supply for
the rattan industry in China
Volume of domestic cane is rather small than that of
imported canes.
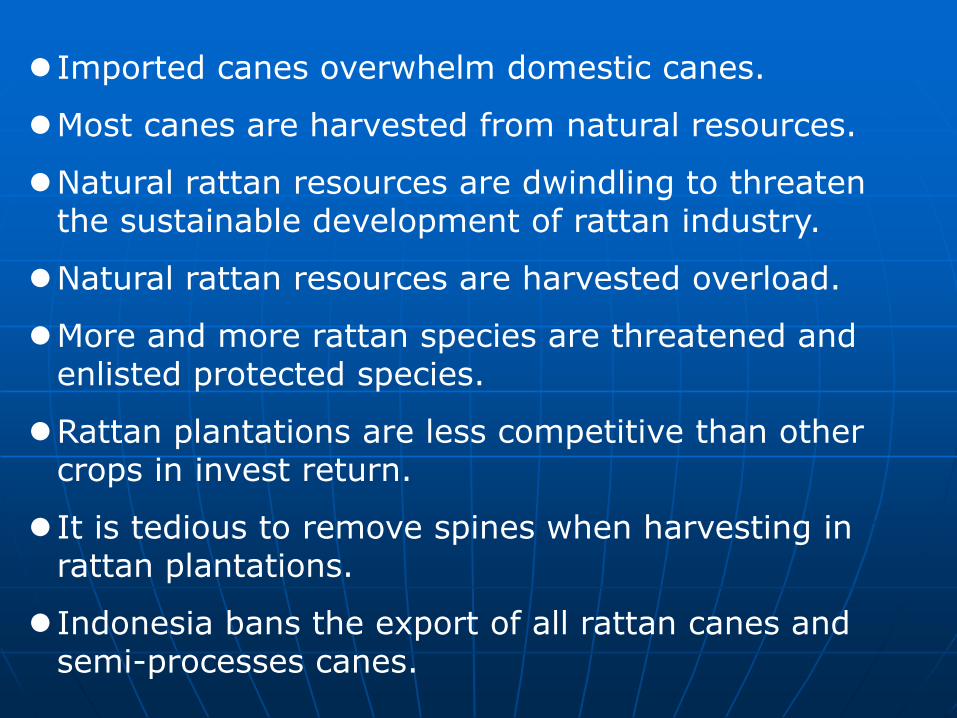
Imported canes overwhelm domestic canes.
Most canes are harvested from natural resources.
Natural rattan resources are dwindling to threaten the sustainable development of rattan industry.
Natural rattan resources are harvested overload.
More and more rattan species are threatened and enlisted protected species.
Rattan plantations are less competitive than other crops in invest return.
It is tedious to remove spines when harvesting in rattan plantations.
Indonesia bans the export of all rattan canes and semi-processes canes.
Security of cane supply for the
rattan industry in China
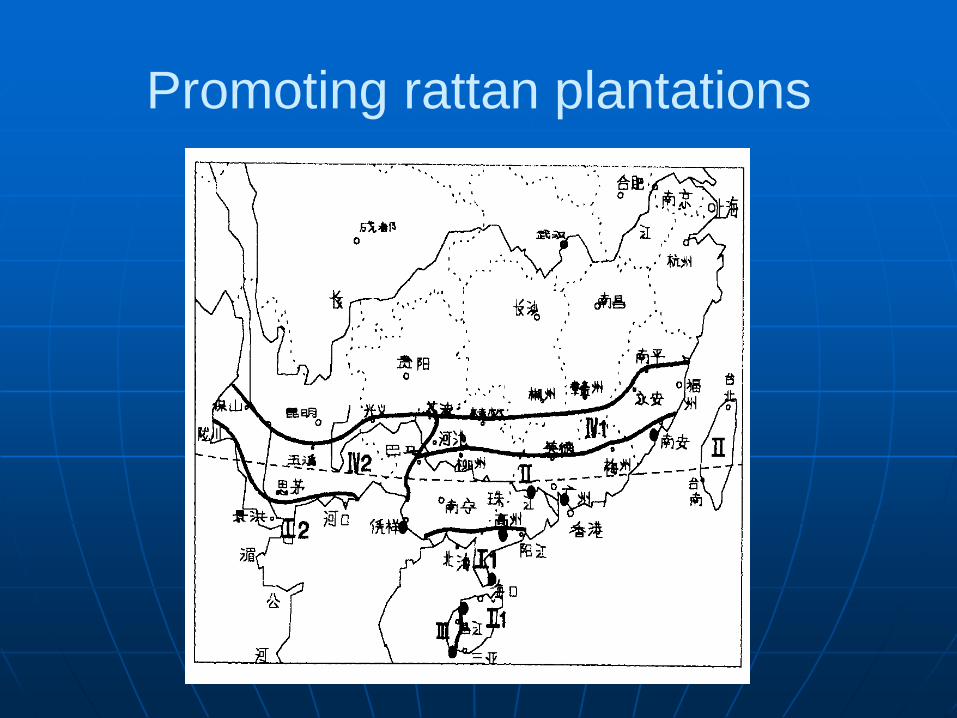
Promoting rattan plantations
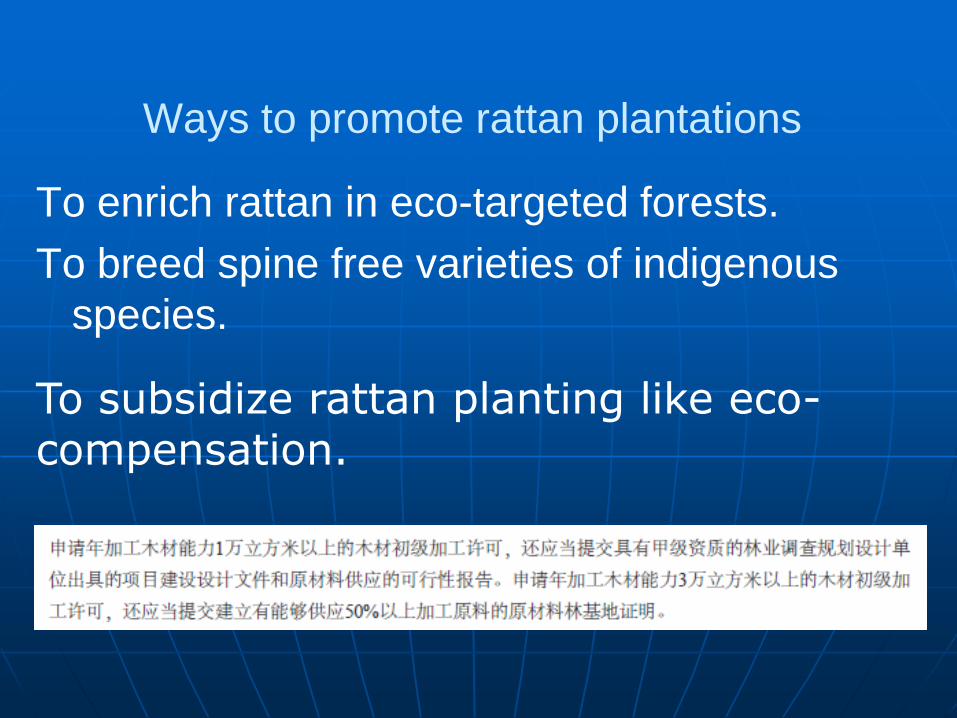
Ways to promote rattan plantations
To subsidize rattan planting like eco-compensation.
To enrich rattan in eco-targeted forests.
To breed spine free varieties of indigenous
species.
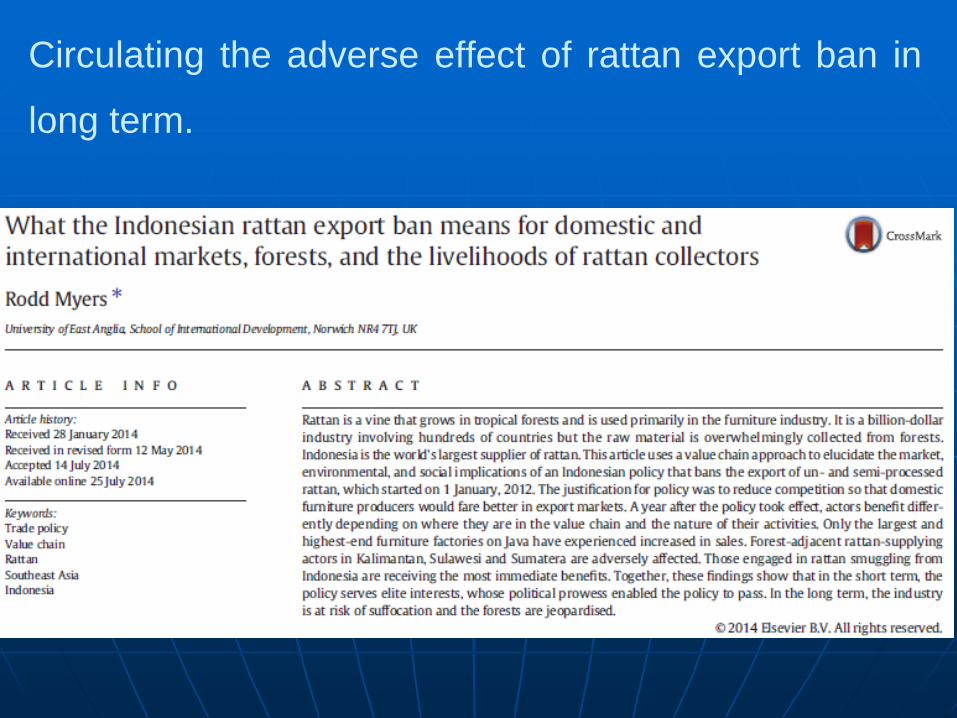
Circulating the adverse effect of rattan export ban in
long term.
To explore rattan source from ASEAN
countries other than Indonesia
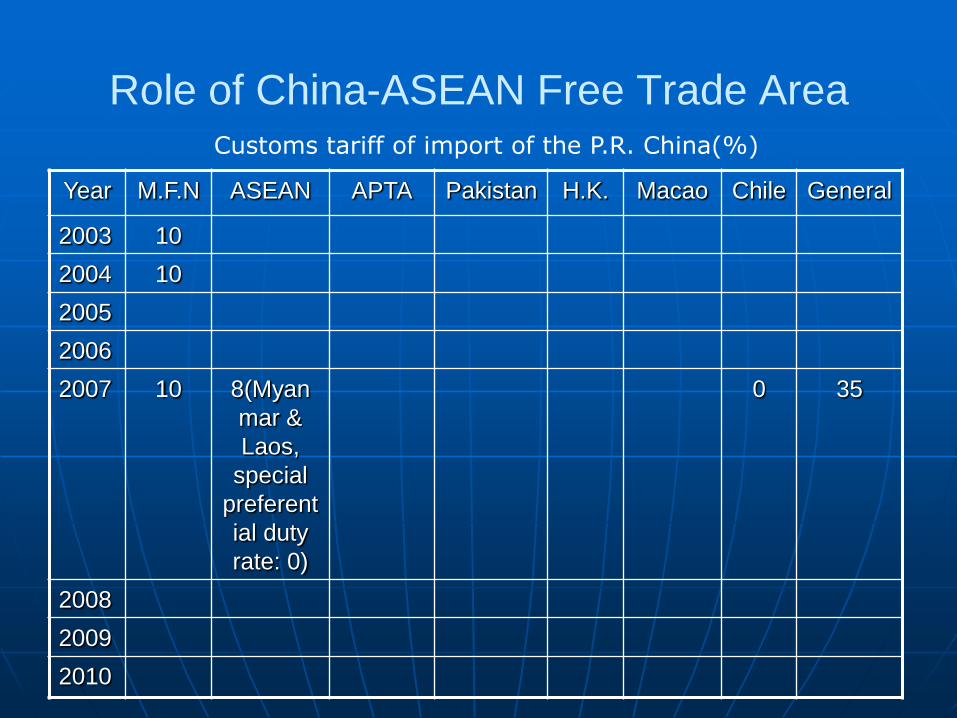
Role of China-ASEAN Free Trade Area
Year M.F.N ASEAN APTA Pakistan H.K. Macao Chile General
2003 10
2004 10
2005
2006
2007 10 8(Myan
mar &
Laos,
special
preferent
ial duty
rate: 0)
0 35
2008
2009
2010
Customs tariff of import of the P.R. China(%)
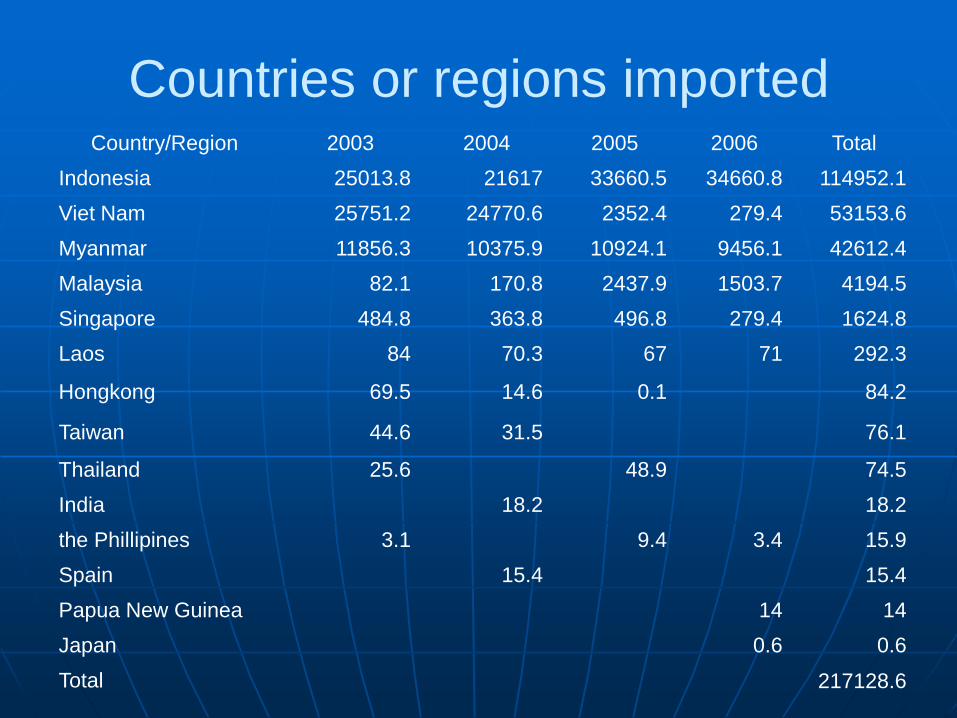
Countries or regions imported Country/Region 2003 2004 2005 2006 Total
Indonesia 25013.8 21617 33660.5 34660.8 114952.1
Viet Nam 25751.2 24770.6 2352.4 279.4 53153.6
Myanmar 11856.3 10375.9 10924.1 9456.1 42612.4
Malaysia 82.1 170.8 2437.9 1503.7 4194.5
Singapore 484.8 363.8 496.8 279.4 1624.8
Laos 84 70.3 67 71 292.3
Hongkong 69.5 14.6 0.1 84.2
Taiwan 44.6 31.5 76.1
Thailand 25.6 48.9 74.5
India 18.2 18.2
the Phillipines 3.1 9.4 3.4 15.9
Spain 15.4 15.4
Papua New Guinea 14 14
Japan 0.6 0.6
Total 217128.6