Embed Size (px)
Citation preview
Webinar Agenda:1. Welcome & Introductions
2. Treatment of CHP in Clean Power Plan
3. Potential for Ohio to use CHP in its State Plan
4. Q & A
December 17, 2015
Trish Demeter – Ohio Environmental
Council/Ohio Coalition for CHP
Jennifer Kefer – David Gardiner &
Associates/Alliance for Industrial Efficiency
Meegan Kelly – American Council for an Energy
Efficient Economy (ACEEE)
CHP in the Clean Power Plan
Jennifer KeferVice President
December 17, 2015
Ohio Environmental Council
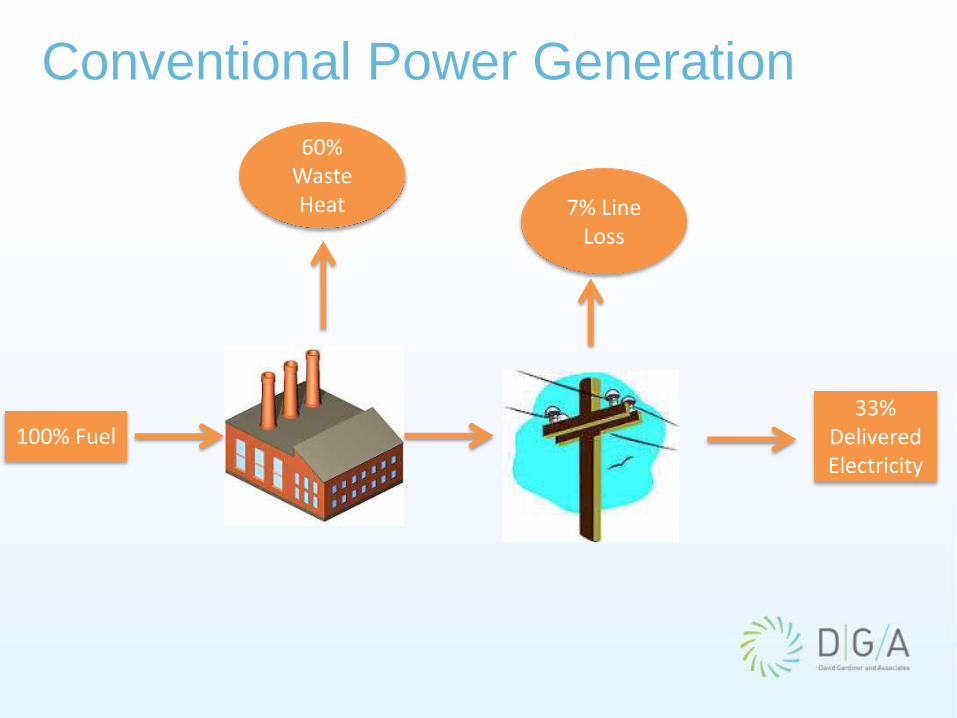
Conventional Power Generation
60% Waste Heat 7% Line
Loss
100% Fuel33%
Delivered Electricity
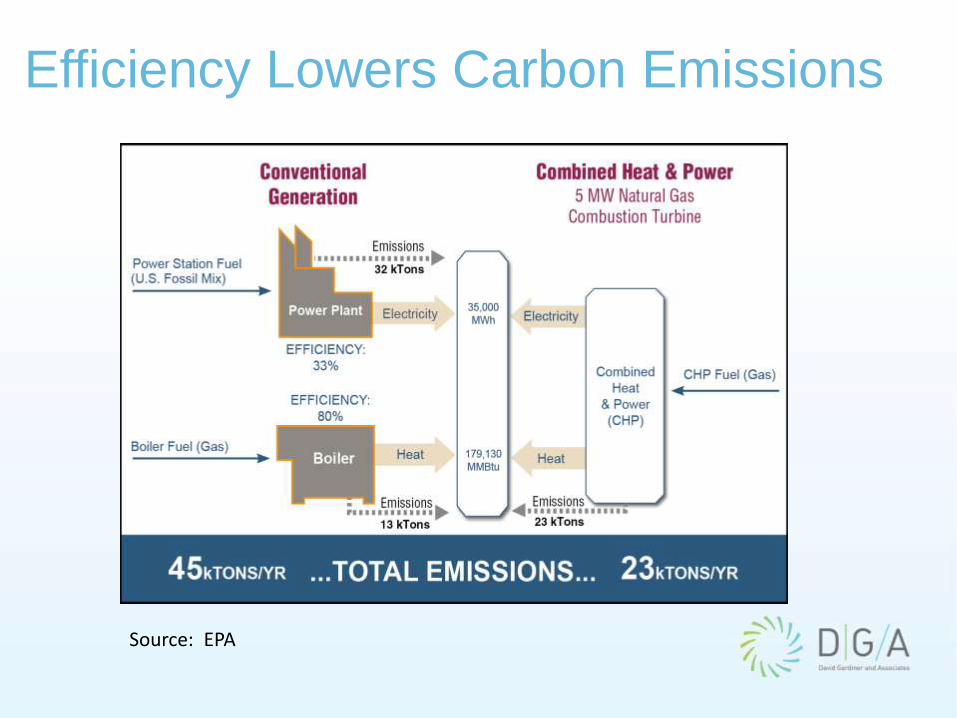
Efficiency Lowers Carbon Emissions
Source: EPA

CHP Is Cost-Effective
Levelized Costs of Energy across Power Generation Technologies, Q4 2013 ($/MWh)
Source: BCSE 2014
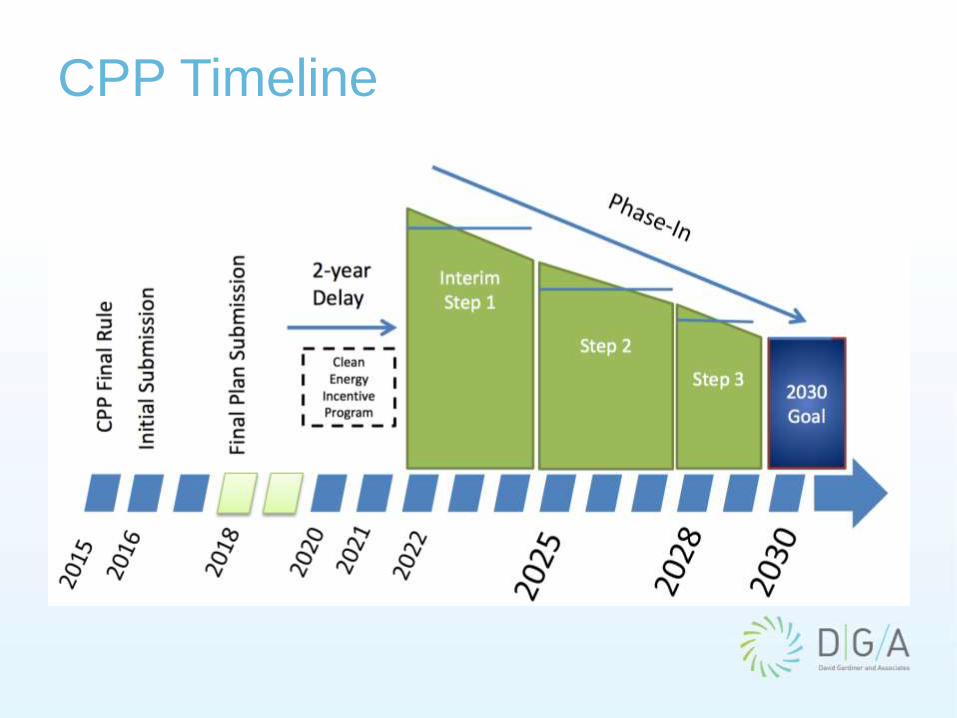
CPP Timeline

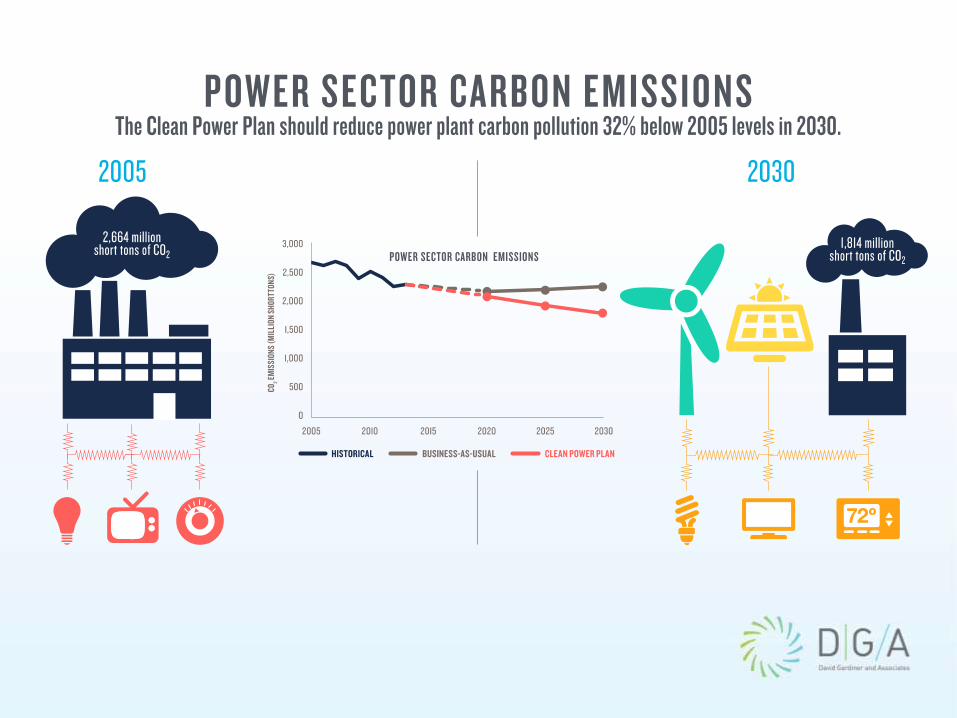
Changes in Final Rule
More ambitious target
Shift in compliance timeline
Early action program introduced
Changes to the building blocks
Clarifies allowable energy efficiency
Greater emphasis on trading programs
Addresses federal enforceability
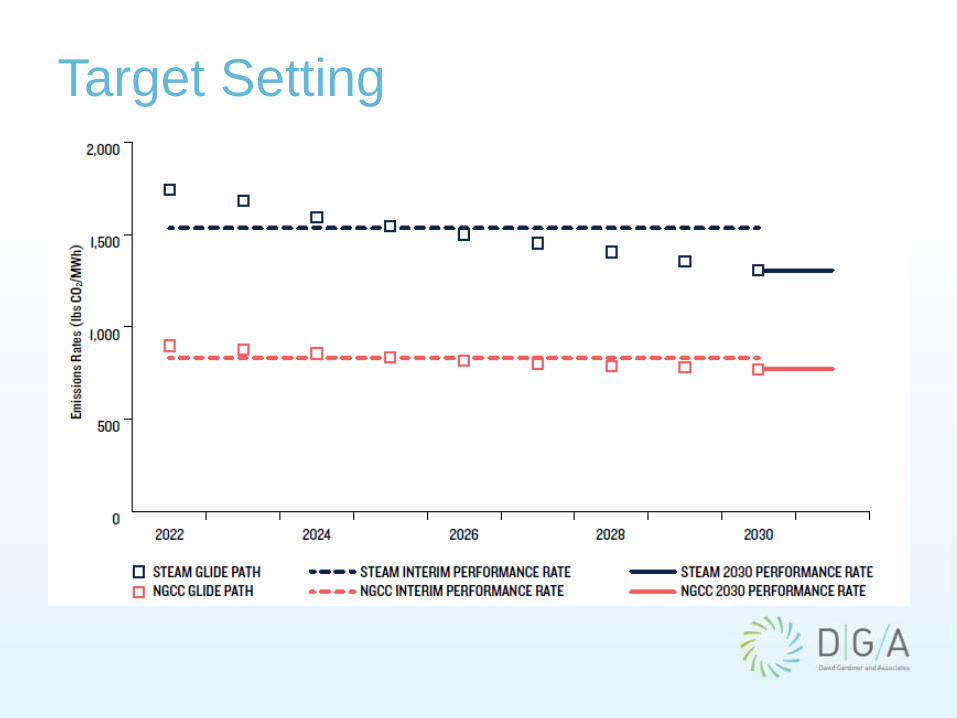
Target Setting
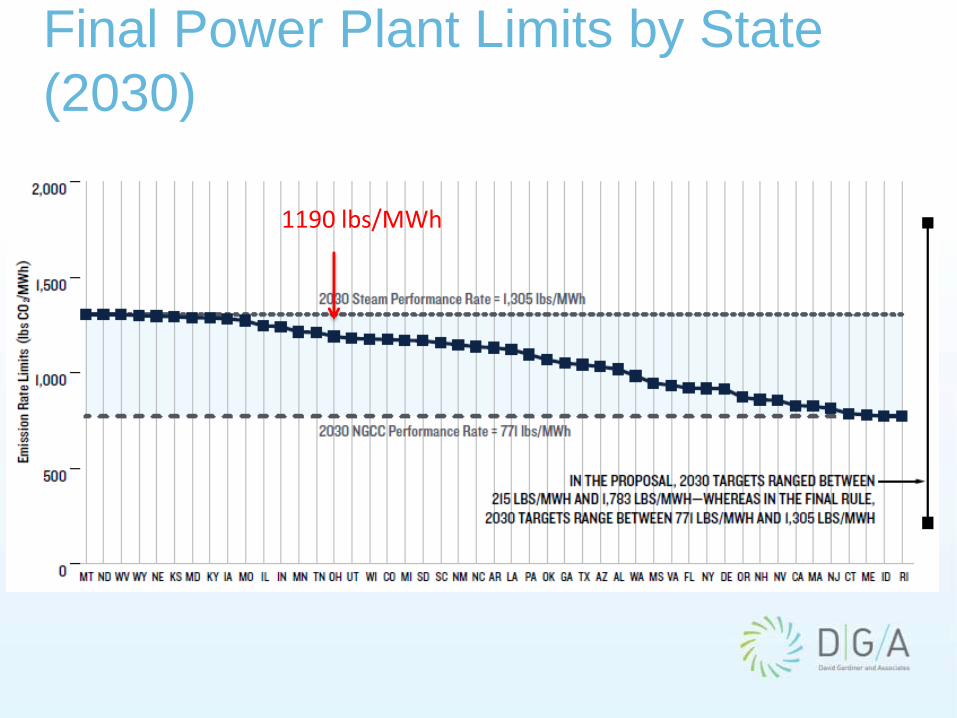
Final Power Plant Limits by State
(2030)
1190 lbs/MWh

Current CHP Projects
CHP Installation Database. ICF International. 2014.
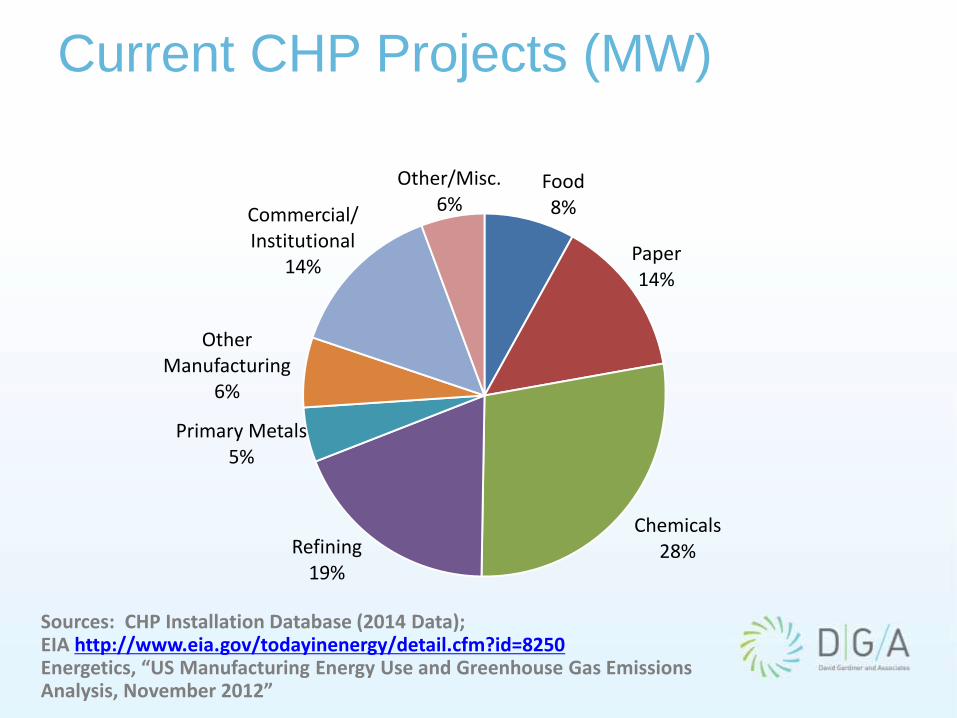
Current CHP Projects (MW)
Sources: CHP Installation Database (2014 Data); EIA http://www.eia.gov/todayinenergy/detail.cfm?id=8250Energetics, “US Manufacturing Energy Use and Greenhouse Gas Emissions Analysis, November 2012”
Food8%
Paper14%
Chemicals28%Refining
19%
Primary Metals5%
Other Manufacturing
6%
Commercial/Institutional
14%
Other/Misc.6%
Affected Units
• Constructed before 2014
• Sell more than 25 MW to the grid
• Excludes units that sell < 25 MW or < 1/3
power to the grid
• Excludes units which have historically limited
fossil fuel use to < 10% capacity factor
• Excludes units that are not connected to
natural gas pipelines
• Excludes highly efficient units

CHP Technical Potential
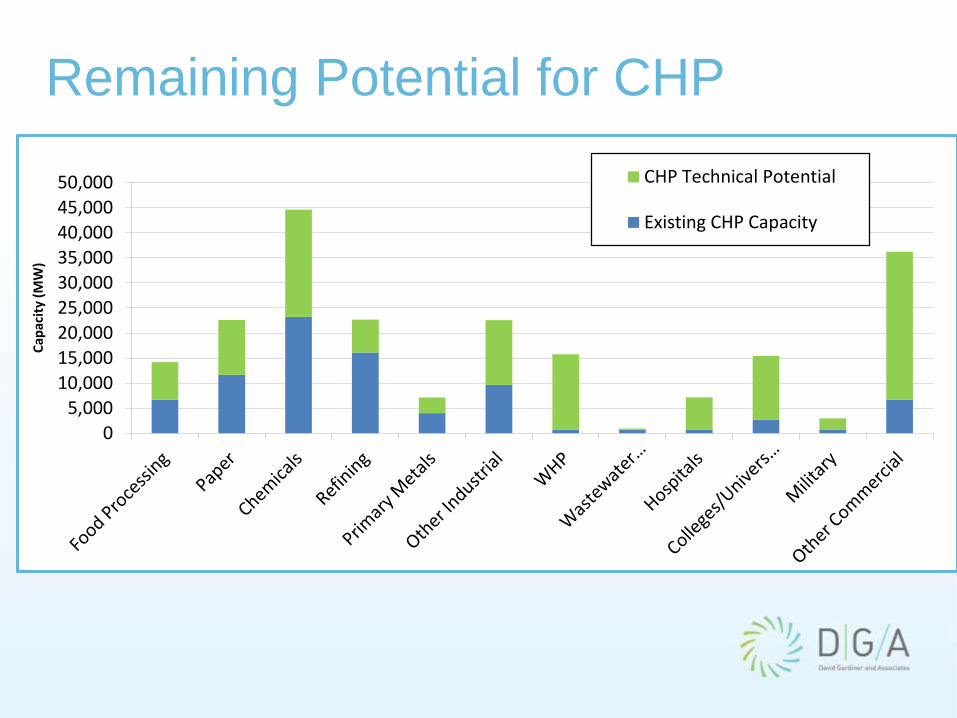
Remaining Potential for CHP
0
5,000
10,000
15,000
20,000
25,000
30,000
35,000
40,000
45,000
50,000
Cap
acit
y (M
W)
CHP Technical Potential
Existing CHP Capacity
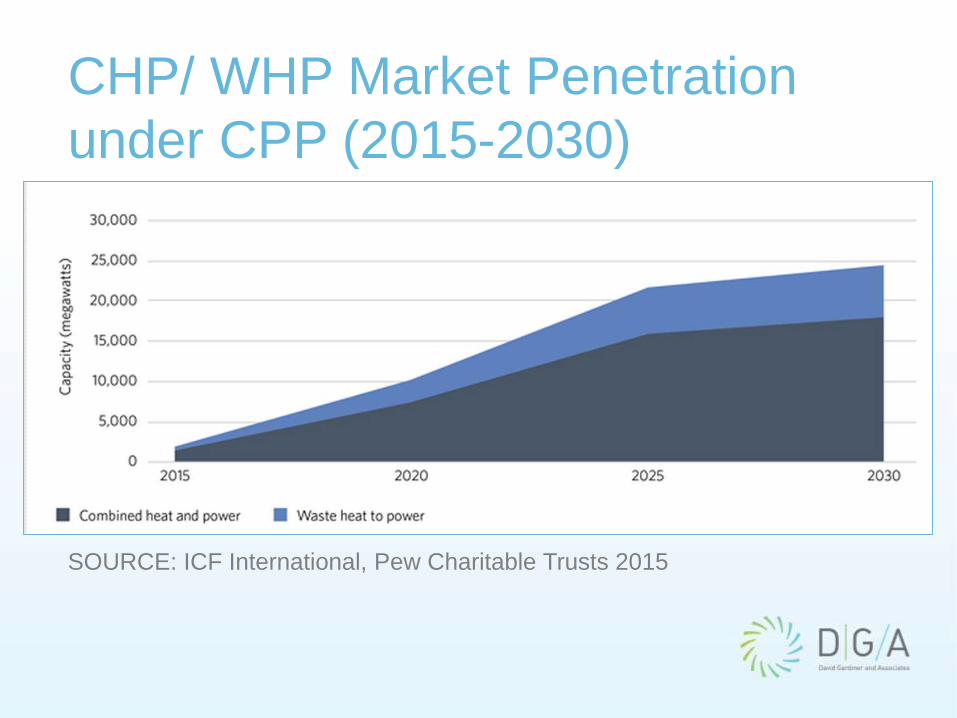
CHP/ WHP Market Penetration
under CPP (2015-2030)
SOURCE: ICF International, Pew Charitable Trusts 2015
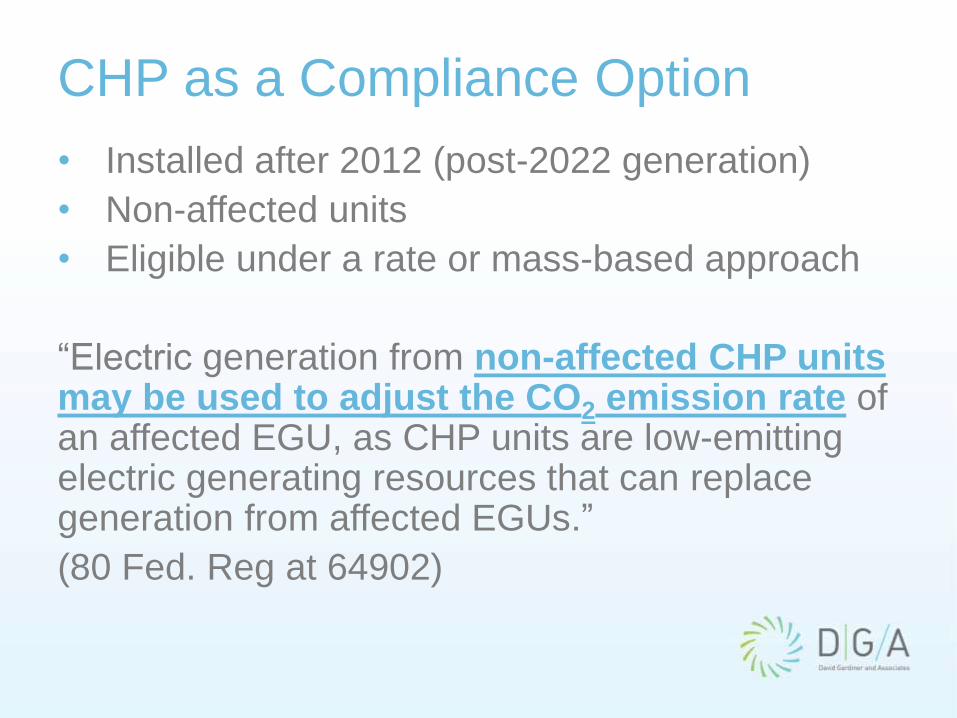
CHP as a Compliance Option
• Installed after 2012 (post-2022 generation)
• Non-affected units
• Eligible under a rate or mass-based approach
“Electric generation from non-affected CHP units may be used to adjust the CO2 emission rate of an affected EGU, as CHP units are low-emitting electric generating resources that can replace generation from affected EGUs.”
(80 Fed. Reg at 64902)
CHP in the Clean Power Plan
How combined heat and power can help
Ohio achieve CO2 reduction goals
Presented by Meegan Kelly
Senior Research Analyst, Industry
The American Council for an Energy-
Efficient Economy (ACEEE)
• ACEEE is a 501(c)(3) nonprofit that acts as a catalyst
to advance energy efficiency policies, programs,
technologies, investments, & behaviors
• About 50 staff; headquarters in Washington, D.C.
• Focus on end-use efficiency in industry, buildings, &
transportation
• Other research in economic analysis; behavior; energy
efficiency programs; & national, state, & local policy
• Funding:
◦ Foundation Grants (52%)
◦ Contract Work & Gov’t. Grants (20%)
◦ Conferences & Publications (20%)
◦ Contributions & Other (8%)
www.aceee.org/@ACEEEdc
Overview
• How does CHP count?
• Rate-based approach
• Mass-based approach
• How much can CHP help in Ohio?
• Potential impact of CHP on CPP goal
• Main takeaways and next steps…
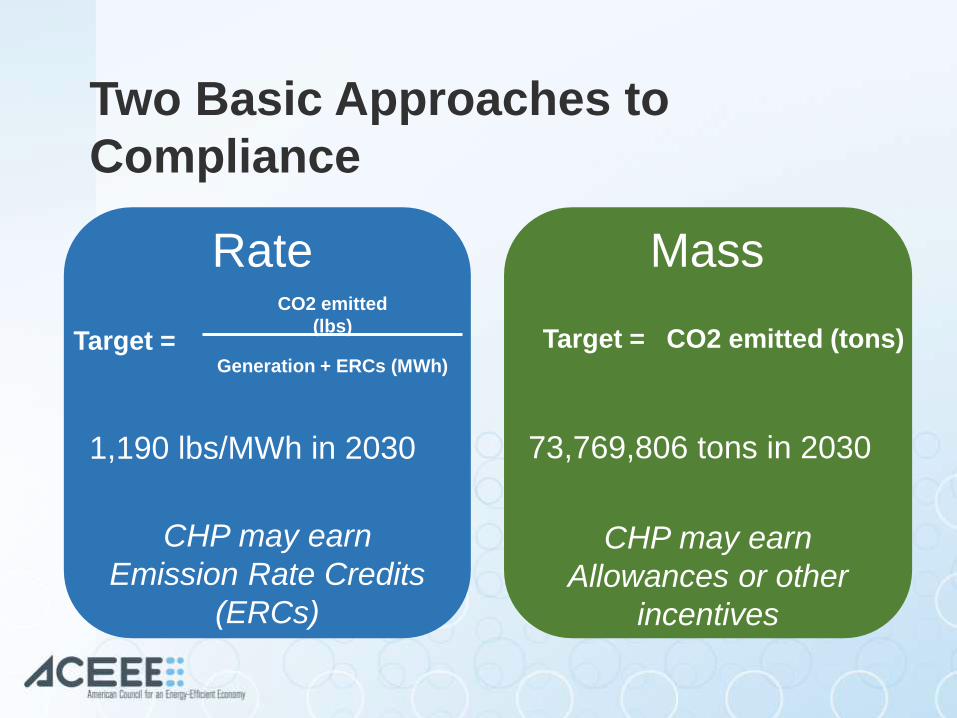
Two Basic Approaches to
Compliance
Target = CO2 emitted (tons)
Mass
Target =
CO2 emitted
(lbs)
Generation + ERCs (MWh)
Rate
CHP may earn
Emission Rate Credits
(ERCs)
CHP may earn
Allowances or other
incentives
73,769,806 tons in 20301,190 lbs/MWh in 2030
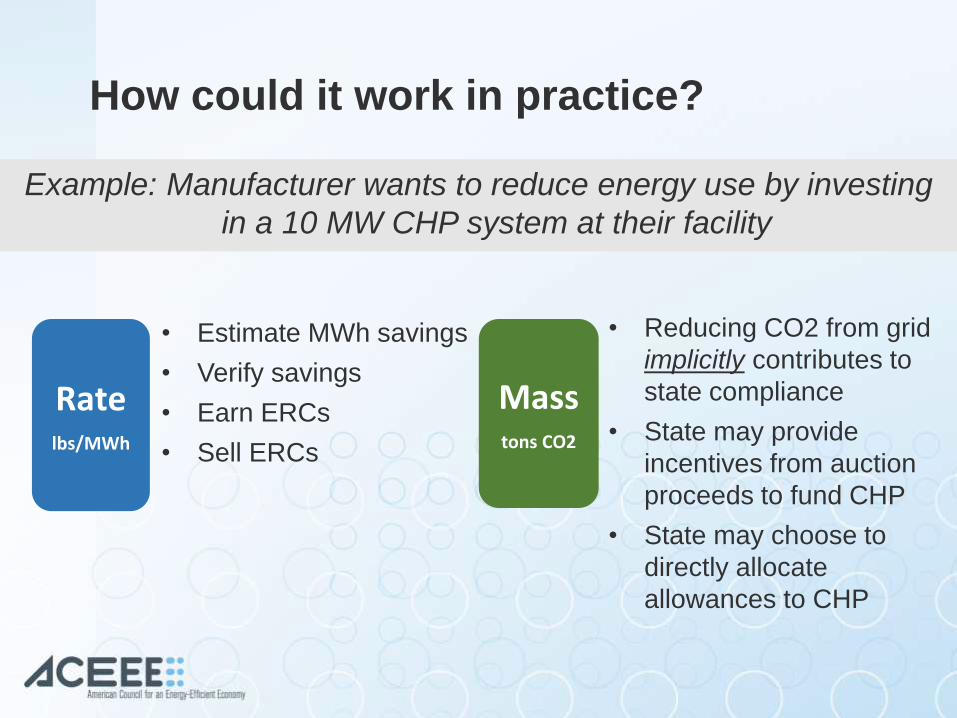
How could it work in practice?
Example: Manufacturer wants to reduce energy use by investing
in a 10 MW CHP system at their facility
Ratelbs/MWh
Masstons CO2
• Estimate MWh savings
• Verify savings
• Earn ERCs
• Sell ERCs
• Reducing CO2 from grid
implicitly contributes to
state compliance
• State may provide
incentives from auction
proceeds to fund CHP
• State may choose to
directly allocate
allowances to CHP

Two options to credit CHP in a mass-
based approach
• Set-aside some portion
of allowances for CHP
• Preferentially award
allowances to EE
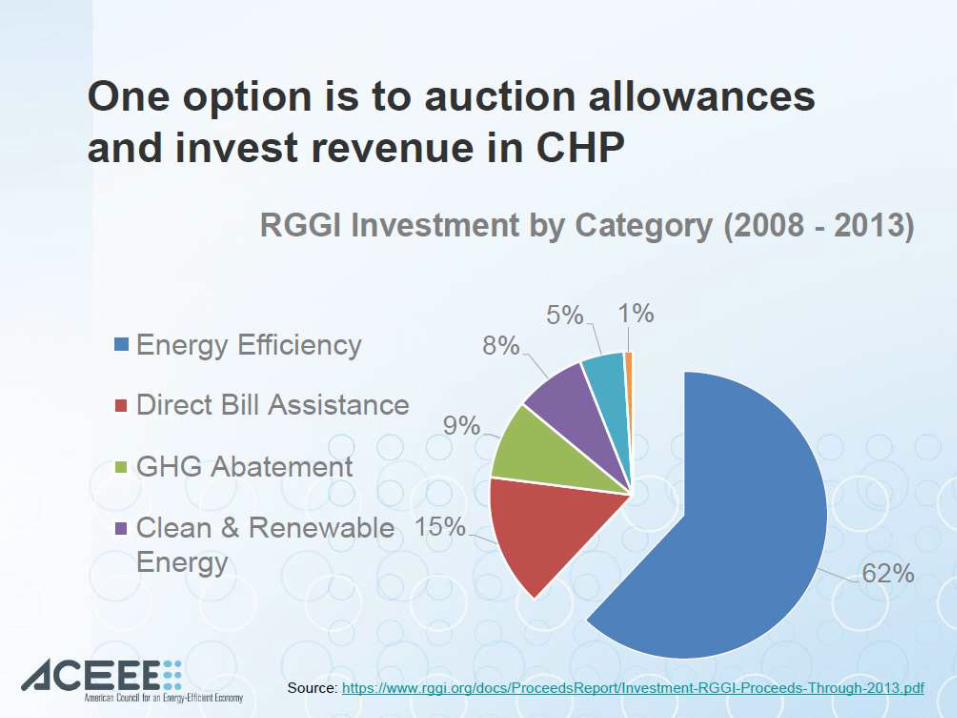
Auction Revenue to
CHP
• State conducts an auction
and sells allowances
• Revenue from auction
can be reinvested in CHP
• RGGI model is valuable
example
Direct Allocation
to CHP
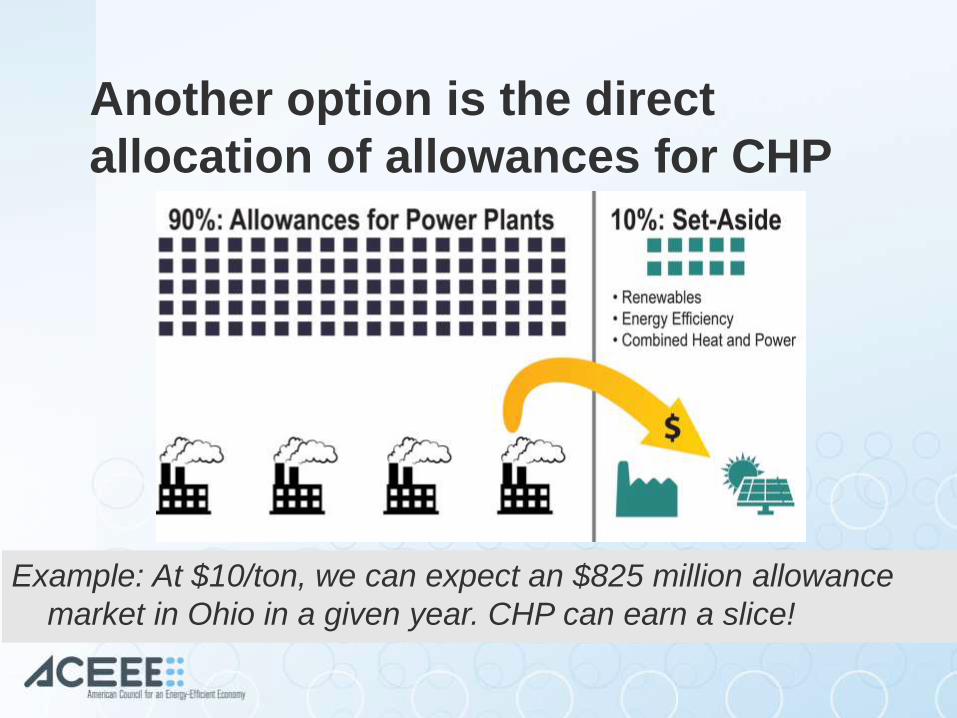
Another option is the direct
allocation of allowances for CHP
Example: At $10/ton, we can expect an $825 million allowance
market in Ohio in a given year. CHP can earn a slice!
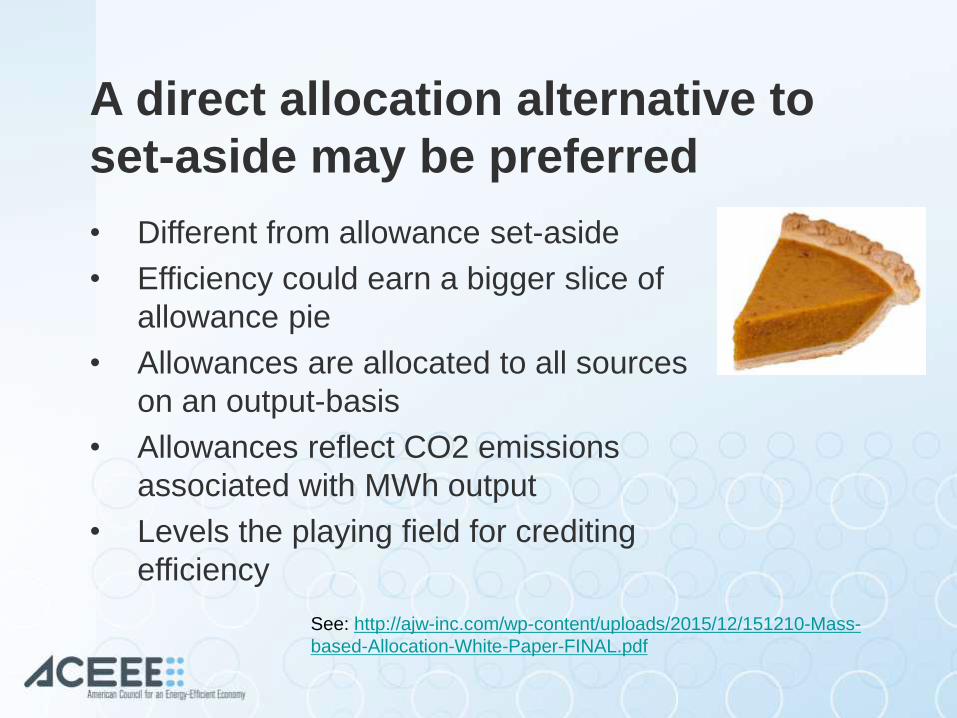
A direct allocation alternative to
set-aside may be preferred
• Different from allowance set-aside
• Efficiency could earn a bigger slice of
allowance pie
• Allowances are allocated to all sources
on an output-basis
• Allowances reflect CO2 emissions
associated with MWh output
• Levels the playing field for crediting
efficiency
See: http://ajw-inc.com/wp-content/uploads/2015/12/151210-Mass-
based-Allocation-White-Paper-FINAL.pdf

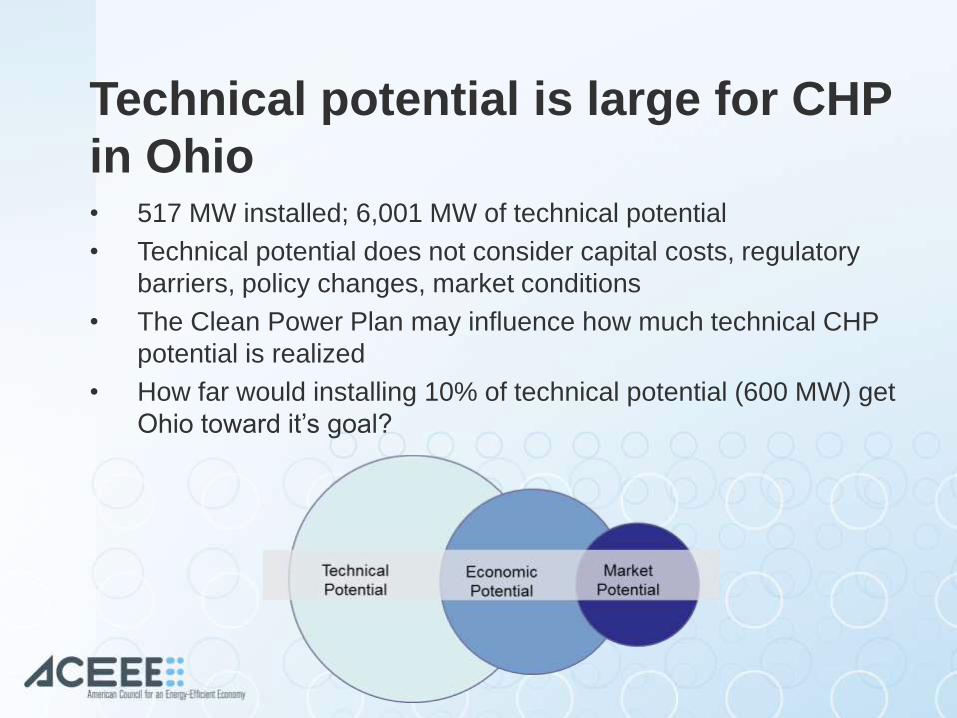
Technical potential is large for CHP
in Ohio• 517 MW installed; 6,001 MW of technical potential
• Technical potential does not consider capital costs, regulatory
barriers, policy changes, market conditions
• The Clean Power Plan may influence how much technical CHP
potential is realized
• How far would installing 10% of technical potential (600 MW) get
Ohio toward it’s goal?
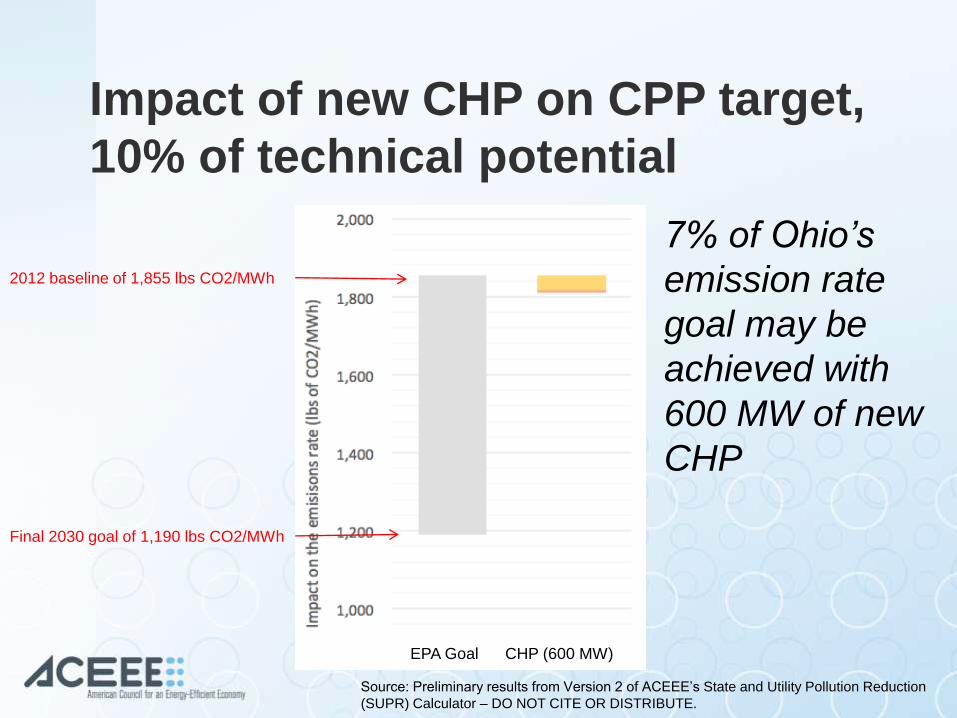
Impact of new CHP on CPP target,
10% of technical potential
EPA Goal CHP (600 MW)
7% of Ohio’s
emission rate
goal may be
achieved with
600 MW of new
CHP
2012 baseline of 1,855 lbs CO2/MWh
Final 2030 goal of 1,190 lbs CO2/MWh
Source: Preliminary results from Version 2 of ACEEE’s State and Utility Pollution Reduction
(SUPR) Calculator – DO NOT CITE OR DISTRIBUTE.
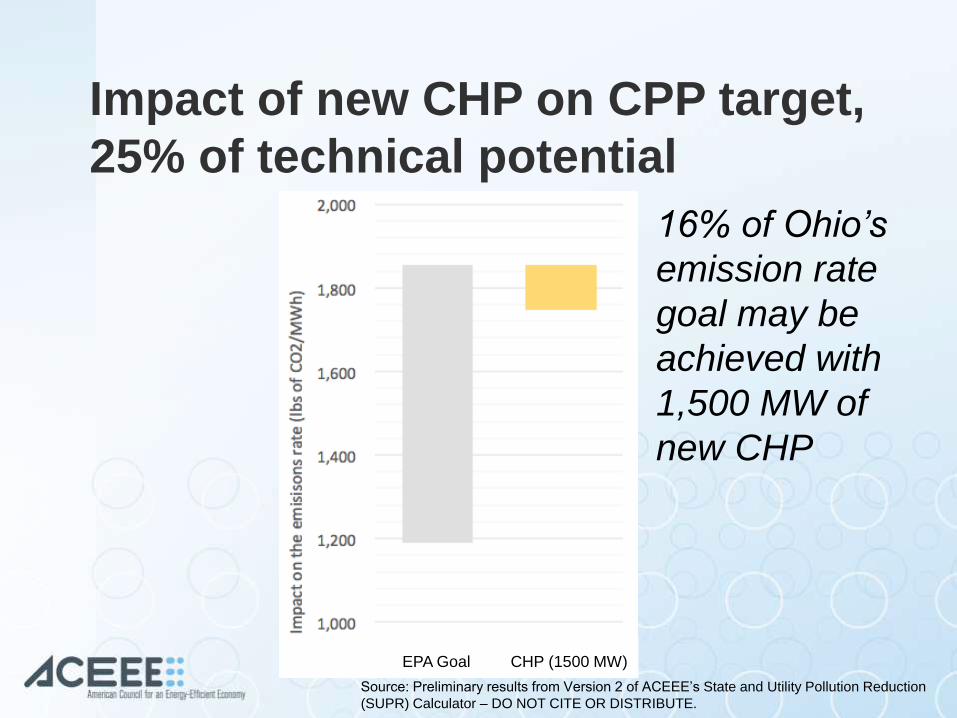
Impact of new CHP on CPP target,
25% of technical potential
EPA Goal CHP (1500 MW)
16% of Ohio’s
emission rate
goal may be
achieved with
1,500 MW of
new CHP
Source: Preliminary results from Version 2 of ACEEE’s State and Utility Pollution Reduction
(SUPR) Calculator – DO NOT CITE OR DISTRIBUTE.

Impact of new CHP on CPP target,
50% of technical potential
27% of Ohio’s
emission rate
goal may be
achieved with
3,000 MW of
new CHP
EPA Goal CHP (3000 MW)
Source: Preliminary results from Version 2 of ACEEE’s State and Utility Pollution Reduction
(SUPR) Calculator – DO NOT CITE OR DISTRIBUTE.

Main takeaways and next steps
• CHP can make a significant dent in Ohio’s target
• CHP can count, but a clear path for inclusion
must be included in Ohio’s compliance plan
• 5 Regional Listening Sessions in early 2016
• Submit comments to Ohio EPA at
• Contact us for assistance
33
Meegan Kelly
Senior Research Analyst
ACEEE
202-507-4008
Jennifer Kefer
Vice President
David Gardiner & Associates
202-365-2194
Thank you!
Questions? Comments?

Please Type Your Question into the
GoToMeeting Chat Box
Trish DemeterManaging Director, Energy &
Clean Air Programs
@tademeter
614-487-5829