Embed Size (px)
Citation preview
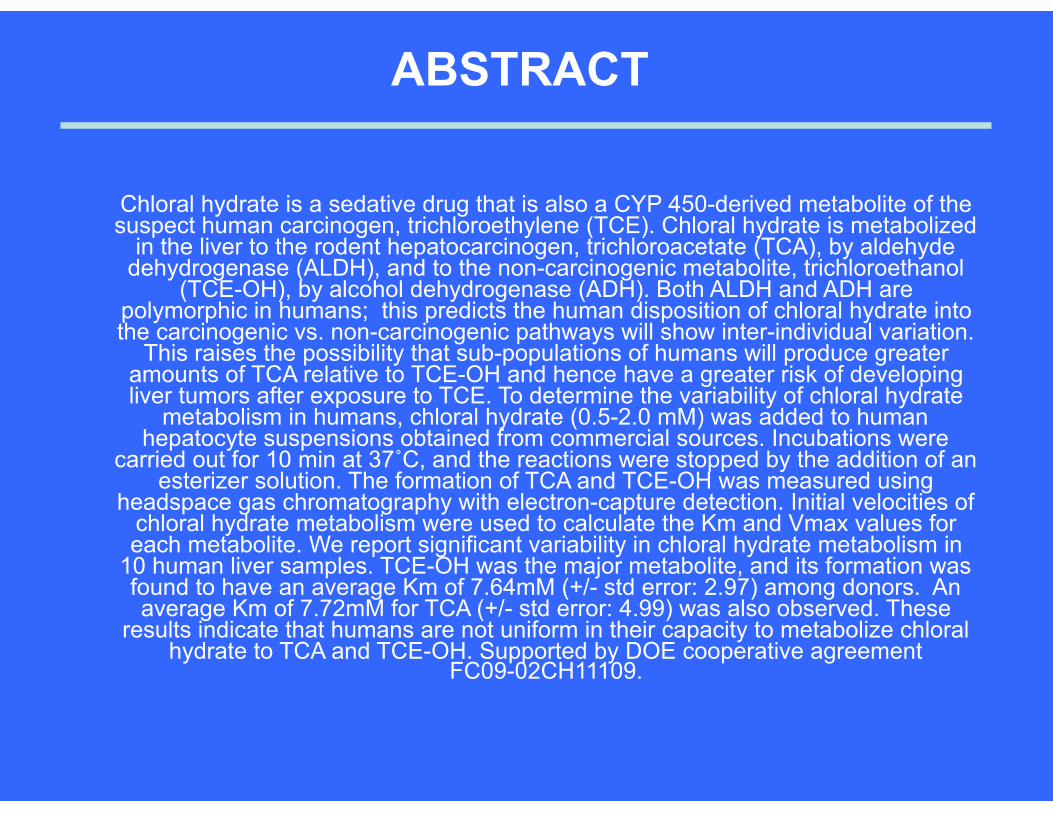
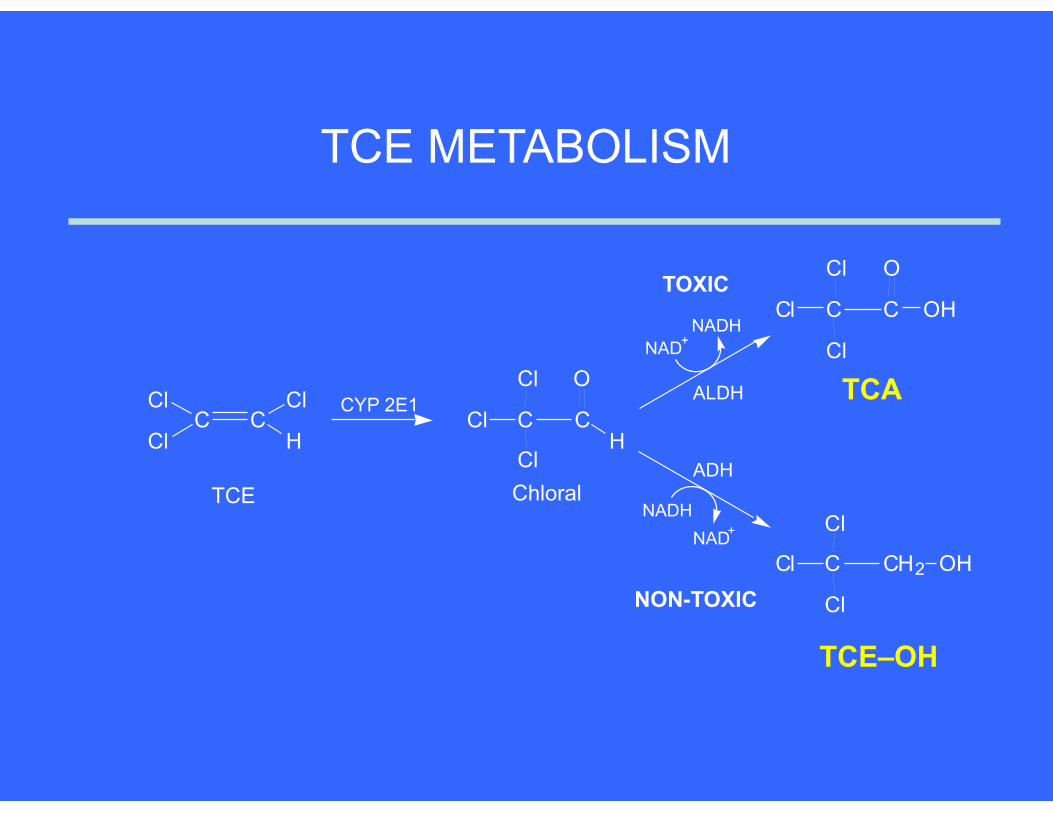
Chloral hydrate is a sedative drug that is also a CYP 450-derived metabolite of the suspect human carcinogen, trichloroethylene (TCE). Chloral hydrate is metabolized
in the liver to the rodent hepatocarcinogen, trichloroacetate (TCA), by aldehyde dehydrogenase (ALDH), and to the non-carcinogenic metabolite, trichloroethanol
(TCE-OH), by alcohol dehydrogenase (ADH). Both ALDH and ADH are polymorphic in humans; this predicts the human disposition of chloral hydrate into the carcinogenic vs. non-carcinogenic pathways will show inter-individual variation.
This raises the possibility that sub-populations of humans will produce greater amounts of TCA relative to TCE-OH and hence have a greater risk of developing liver tumors after exposure to TCE. To determine the variability of chloral hydrate
metabolism in humans, chloral hydrate (0.5-2.0 mM) was added to human hepatocyte suspensions obtained from commercial sources. Incubations were
carried out for 10 min at 37˚C, and the reactions were stopped by the addition of an esterizer solution. The formation of TCA and TCE-OH was measured using
headspace gas chromatography with electron-capture detection. Initial velocities of chloral hydrate metabolism were used to calculate the Km and Vmax values for each metabolite. We report significant variability in chloral hydrate metabolism in
10 human liver samples. TCE-OH was the major metabolite, and its formation was found to have an average Km of 7.64mM (+/- std error: 2.97) among donors. An average Km of 7.72mM for TCA (+/- std error: 4.99) was also observed. These
results indicate that humans are not uniform in their capacity to metabolize chloral hydrate to TCA and TCE-OH. Supported by DOE cooperative agreement
FC09-02CH11109.
ABSTRACT
TCE METABOLISM
C CCl
Cl
Cl
HC C
H
OCl
Cl
Cl
C C
OCl
Cl
Cl OH
C CH2
Cl
Cl
Cl
CYP 2E1
NADHNAD+
NADHNAD+
TCE Chloral
TCA
TCE–OH
ALDH
ADH
TOXIC
NON-TOXICOH
OBJECTIVE
To estimate human variability in chloral hydrate metabolism using human
hepatocytes
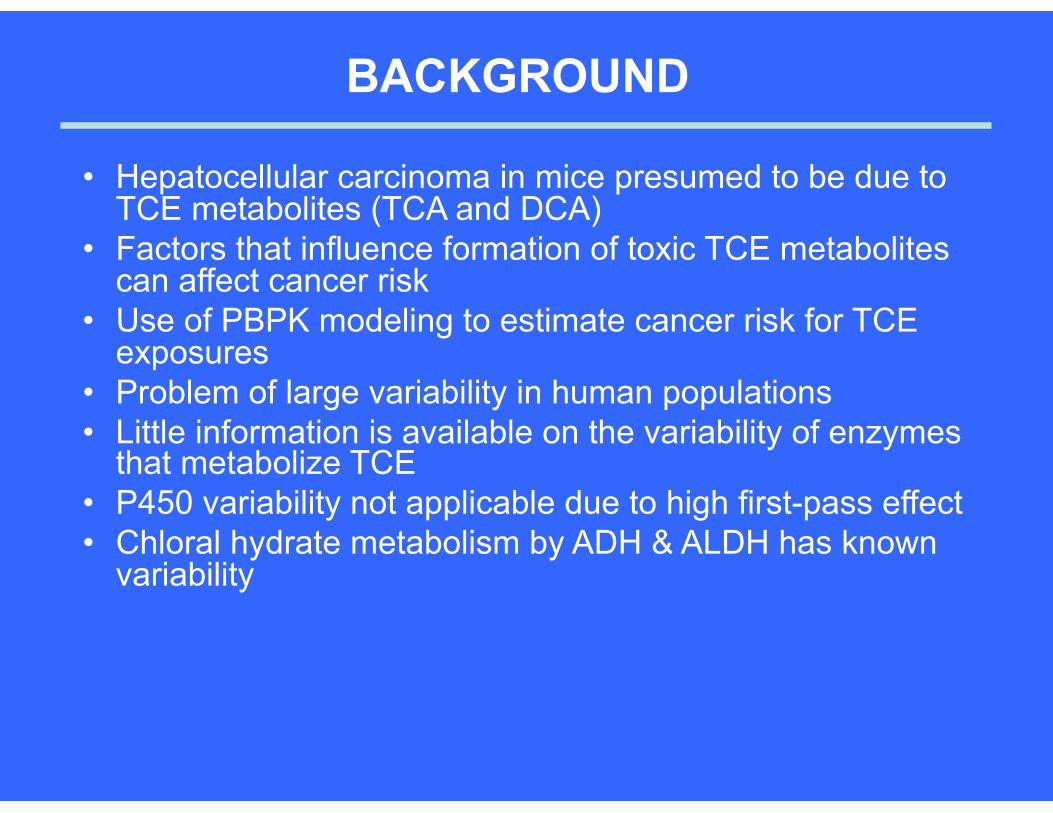
BACKGROUND
• Hepatocellular carcinoma in mice presumed to be due to TCE metabolites (TCA and DCA)
• Factors that influence formation of toxic TCE metabolites can affect cancer risk
• Use of PBPK modeling to estimate cancer risk for TCE exposures
• Problem of large variability in human populations • Little information is available on the variability of enzymes
that metabolize TCE • P450 variability not applicable due to high first-pass effect • Chloral hydrate metabolism by ADH & ALDH has known
variability
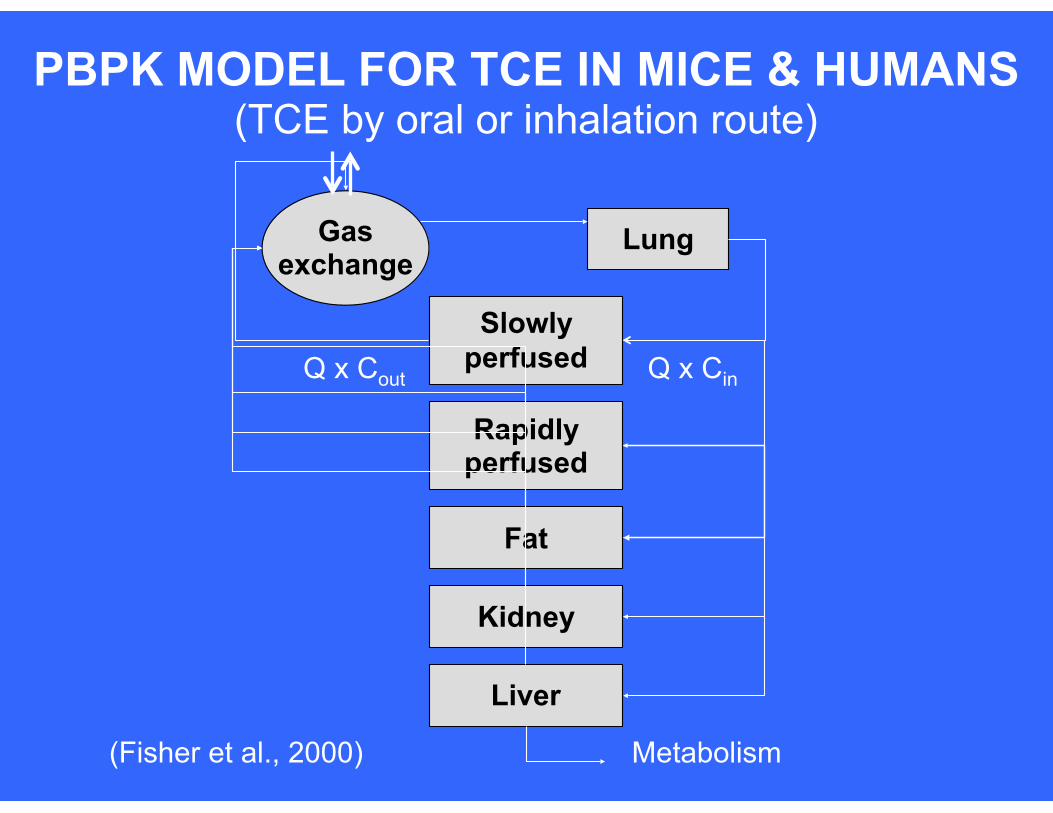
Metabolism
Rapidly perfused
Kidney
Slowly perfused
Lung
Fat
Liver
Gas exchange
Q x CinQ x Cout
PBPK MODEL FOR TCE IN MICE & HUMANS(TCE by oral or inhalation route)
(Fisher et al., 2000)
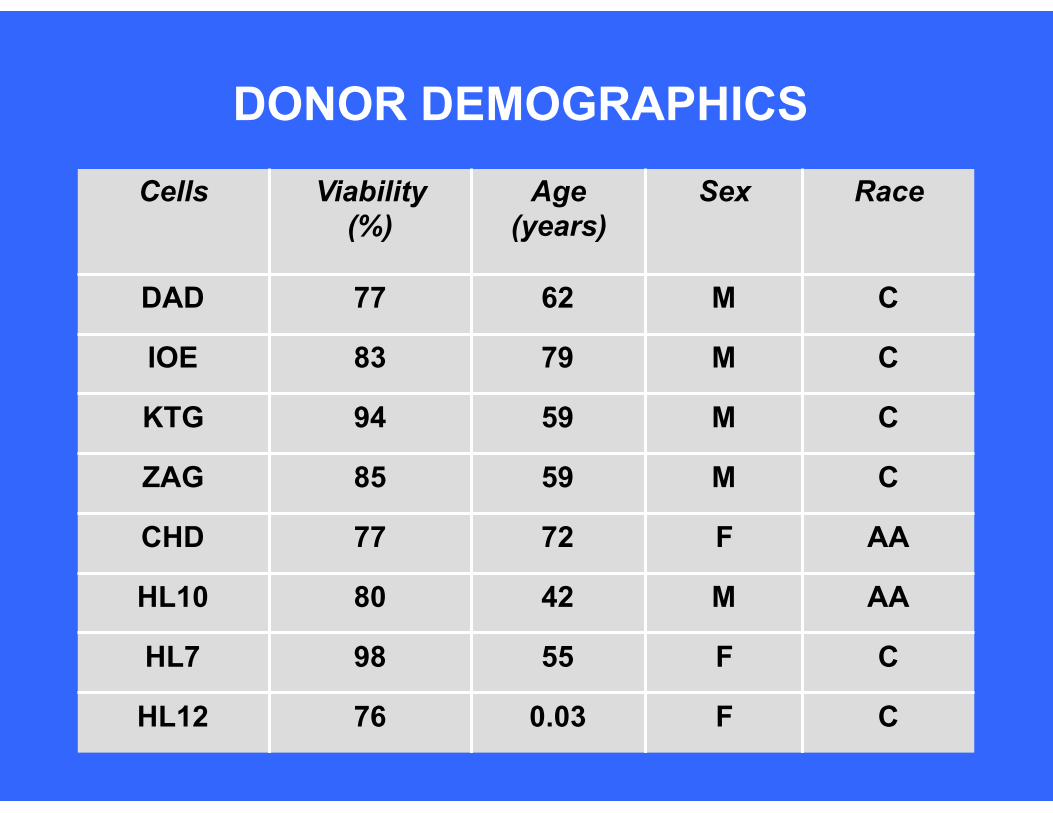
Cells Viability (%)
Age (years)
Sex Race
DAD 77 62 M C
IOE 83 79 M C
KTG 94 59 M C
ZAG 85 59 M C
CHD 77 72 F AA
HL10 80 42 M AA
HL7 98 55 F C
HL12 76 0.03 F C
DONOR DEMOGRAPHICS
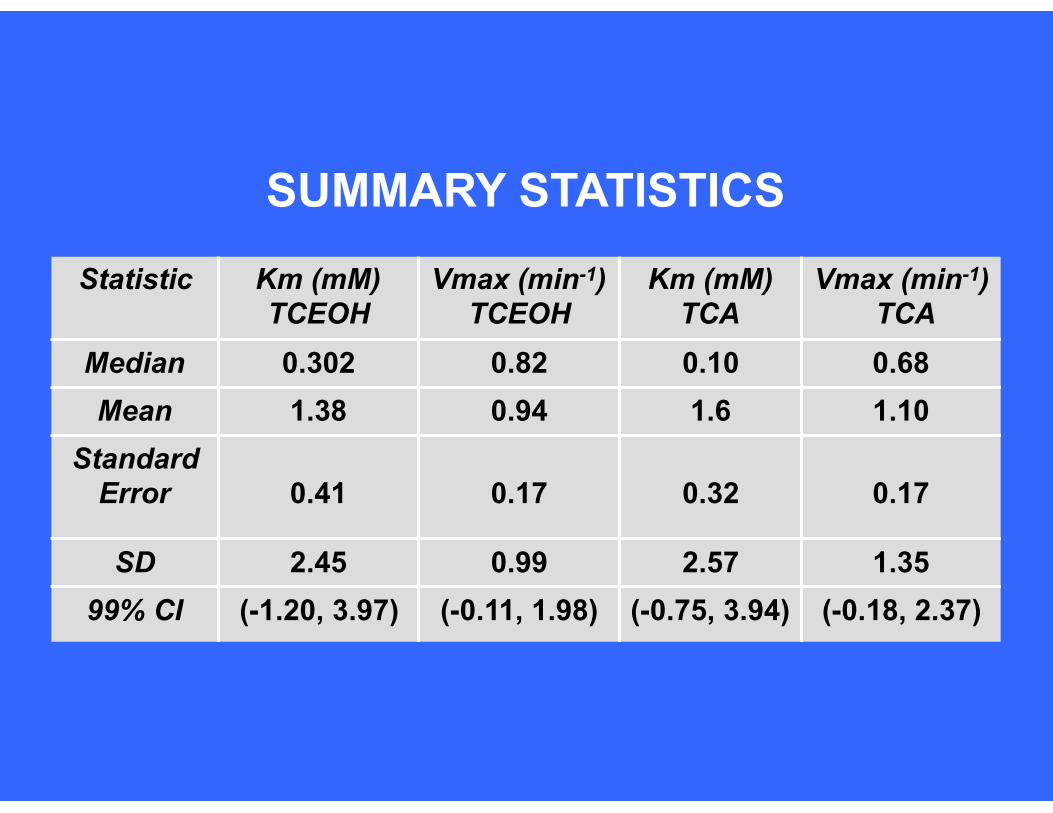
SUMMARY STATISTICS
Statistic Km (mM) TCEOH
Vmax (min-1) TCEOH
Km (mM) TCA
Vmax (min-1) TCA
Median 0.302 0.82 0.10 0.68Mean 1.38 0.94 1.6 1.10
Standard Error 0.41 0.17 0.32 0.17
SD 2.45 0.99 2.57 1.3599% CI (-1.20, 3.97) (-0.11, 1.98) (-0.75, 3.94) (-0.18, 2.37)
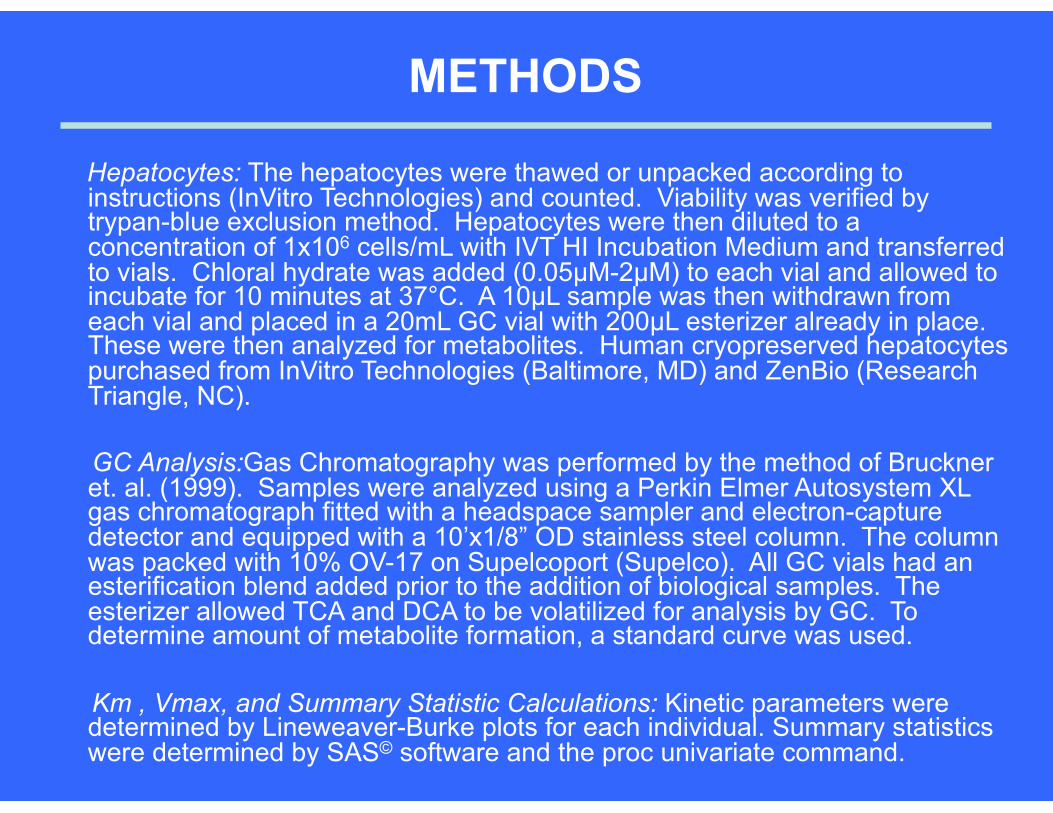
METHODS
Hepatocytes: The hepatocytes were thawed or unpacked according to instructions (InVitro Technologies) and counted. Viability was verified by trypan-blue exclusion method. Hepatocytes were then diluted to a concentration of 1x10⁶ cells/mL with IVT HI Incubation Medium and transferred to vials. Chloral hydrate was added (0.05µM-2µM) to each vial and allowed to incubate for 10 minutes at 37°C. A 10µL sample was then withdrawn from each vial and placed in a 20mL GC vial with 200µL esterizer already in place. These were then analyzed for metabolites. Human cryopreserved hepatocytes purchased from InVitro Technologies (Baltimore, MD) and ZenBio (Research Triangle, NC).
GC Analysis:Gas Chromatography was performed by the method of Bruckner et. al. (1999). Samples were analyzed using a Perkin Elmer Autosystem XL gas chromatograph fitted with a headspace sampler and electron-capture detector and equipped with a 10’x1/8” OD stainless steel column. The column was packed with 10% OV-17 on Supelcoport (Supelco). All GC vials had an esterification blend added prior to the addition of biological samples. The esterizer allowed TCA and DCA to be volatilized for analysis by GC. To determine amount of metabolite formation, a standard curve was used.
Km , Vmax, and Summary Statistic Calculations: Kinetic parameters were determined by Lineweaver-Burke plots for each individual. Summary statistics were determined by SAS© software and the proc univariate command.
REFERENCES• Environmental Health Perspectives Supplements. 2000. Trichloroethylene Health Risks. Volume 8,
supplement 2. NIEHS, Research Triangle Park, NC • Trichloroethylene Health Risk Assessment: Synthesis and Characterization. April 2002. Draft. US EPA.
National Center for Environmental Assessment, Washington, DC. • Fisher, JW. Physiologically Based Pharamacokinetic Models for Trichloroethylene and its Oxidative
Metabolites. Environ. Health Perspect. 108:265-273, 2000. • Davidson IF and Beliles RP. Consideration of the target organ toxicity of trichloroethylene in terms of
metabolite toxicity and pharmacokinetics. Drug Metab. Rev. 23:493-599. 1991. • Ehrig T. Bosron WF. And Ting-kai L. Alcohol and aldehyde dehydrogenase. Alcohol and Alcoholism
25:105-116. 1990. • Hines LM. Meir SM. Stampfer J. Ma J. Gaziano MJ. Ridker PM. Hankinson SE. Sacks F. Rimm EB. And
Hunter DJ. Genetic variation in alcohol dehydrogenase and the beneficial effect of moderate alcohol consumption on myocardial infarction. New Eng. J. Med. 344: 549-555. 2001.
• Casarett & Doull’s Toxicology: The Basic Science of Poisions, 6th Ed. 2001. C. D. Klasseen, Ed. McGraw-Hill. New York. 153-156.
• Spence JP. Liang T. Eriksson CJ. Taylor RE. Wall TL. Ehlers CL. Carr LG. Evaluation of aldehyde dehydrogenase 1 promoter polymorphisms identified in human populations. Allcohol Clin Exp Res. 27(9):1389-94. 2003
• Konishi t. Smith JL. Lin K. Wan YY. Influence of genetic admixture on polymorphisms of alcohol-metabolizing enzymes: analyses of mutations on the CYP2E1, ADH2, ADH3, and ALDH2 genes in Mexican-American population living in the Los Angeles area. Alcohol & Alcoholism. 38(1): 93-94. 2003
• Muralidhara S and Bruckner JV. Simple method for rapid measurement of trichloroethylene and its major metabolites in biological samples. J. Chromatog. B732:145-153. 1999.
• Lipscomb JC. Teuschler LK. Swartout J. Popken D. Cox T. and Kedderis GL. The impact of cytochrome P450 2E1-dependent metabolic variance on a risk-relevant pharmacokinetic outcome in humans. Risk Anal. 23:1221-1238, 2003.
• Lipscomb JC. Mahle DA, Brashear WT, and Garrett CM. A species comparison of chloral hydrate metabolism in blood and liver. Biochem. Biophys. Res. Commun. 227:340-350. 1996.
• McMillan DC. Bronley-DeLancey AY. And Bain NL. Chloral Hydrate Metabolism in Human and Rodent Livers. Proceedings of Trichloroethylene: The Scientific Basis of Risk Assessment. MUSC Press. 2004.
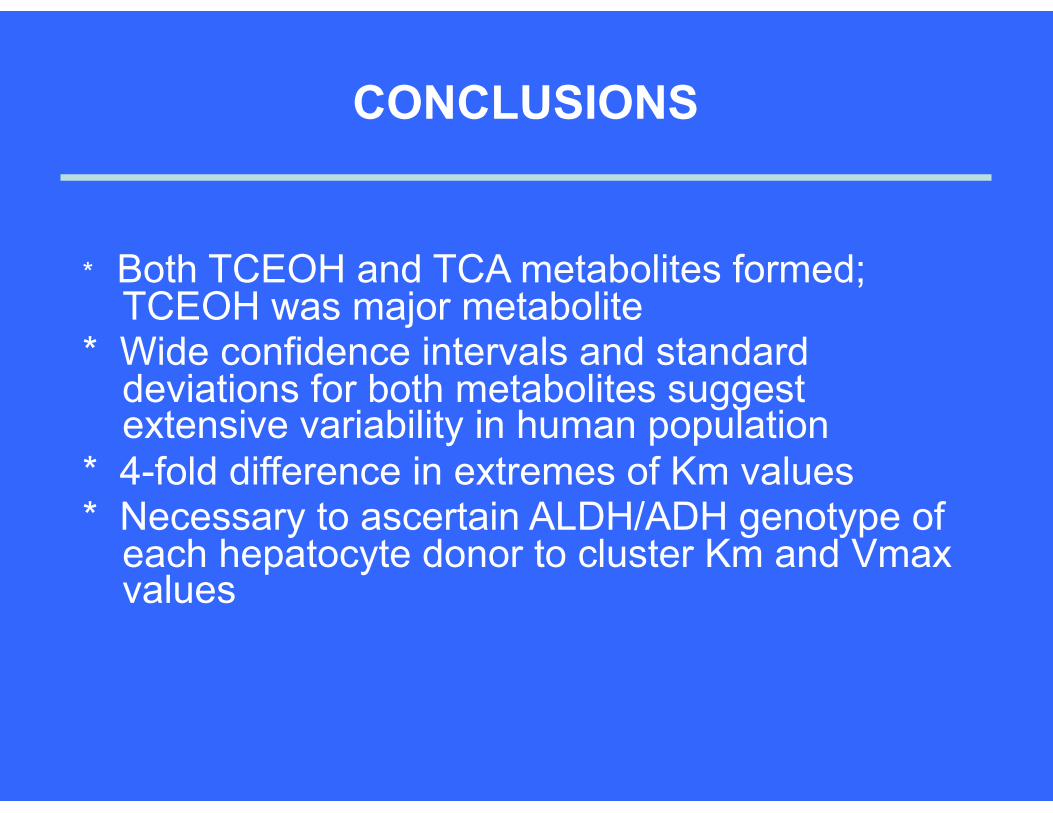
CONCLUSIONS
* Both TCEOH and TCA metabolites formed; TCEOH was major metabolite
* Wide confidence intervals and standard deviations for both metabolites suggest extensive variability in human population
* 4-fold difference in extremes of Km values * Necessary to ascertain ALDH/ADH genotype of
each hepatocyte donor to cluster Km and Vmax values
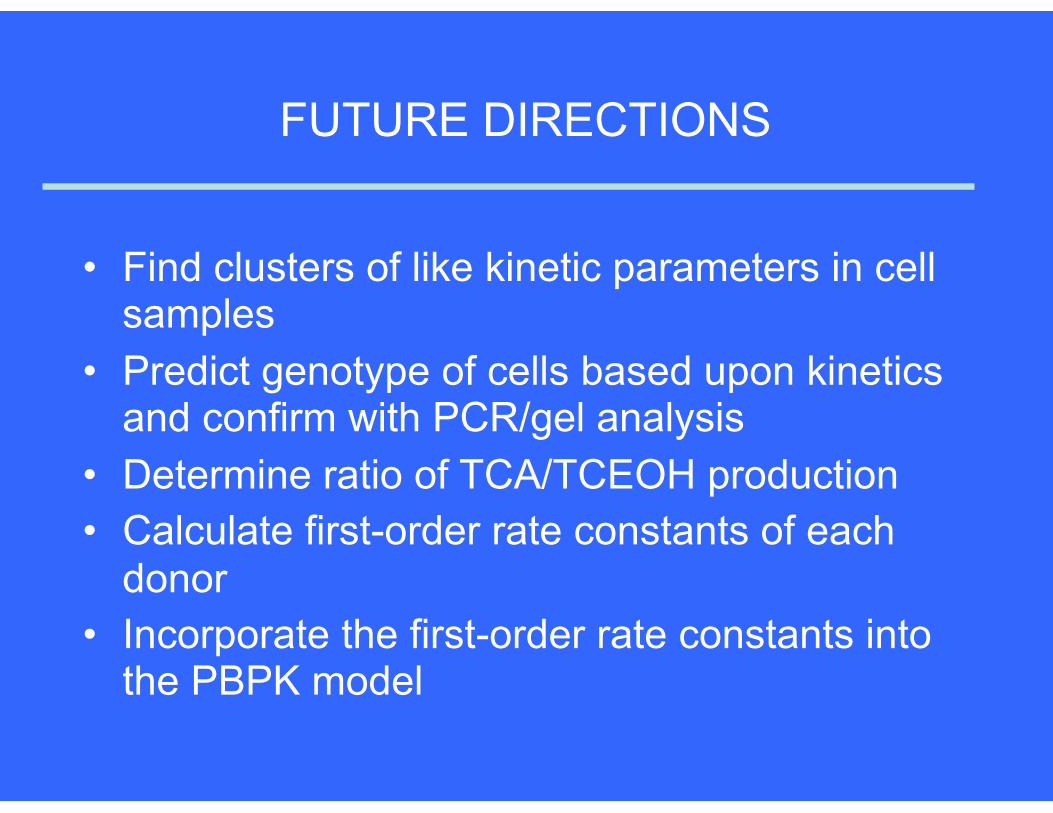
FUTURE DIRECTIONS
• Find clusters of like kinetic parameters in cell samples
• Predict genotype of cells based upon kinetics and confirm with PCR/gel analysis
• Determine ratio of TCA/TCEOH production • Calculate first-order rate constants of each
donor • Incorporate the first-order rate constants into
the PBPK model
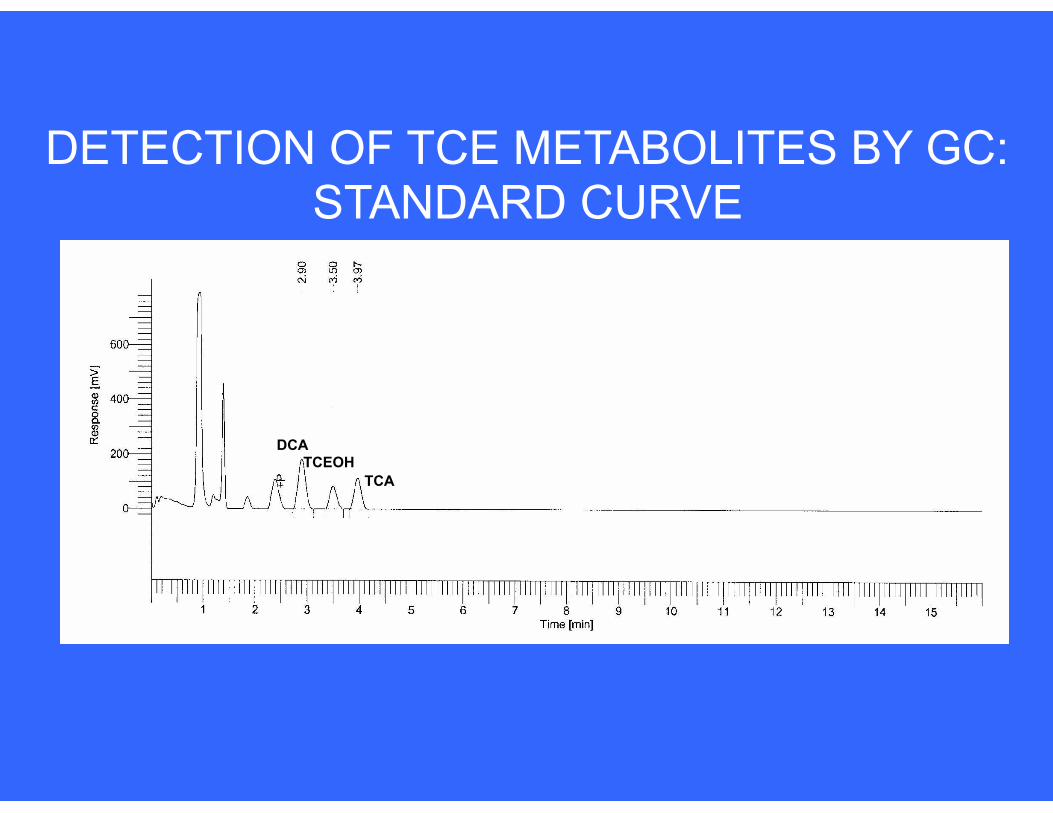
DCATCEOH
TCA
DETECTION OF TCE METABOLITES BY GC: STANDARD CURVE
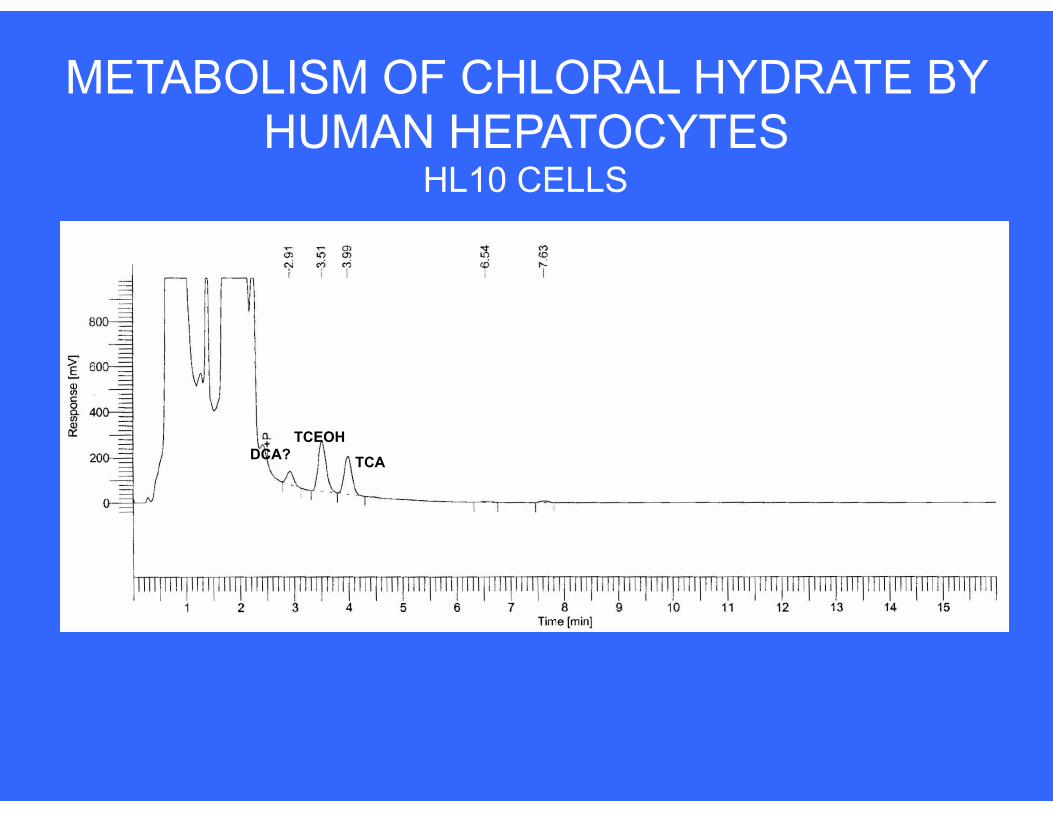
DCA?TCEOH
TCA
METABOLISM OF CHLORAL HYDRATE BY HUMAN HEPATOCYTES
HL10 CELLS
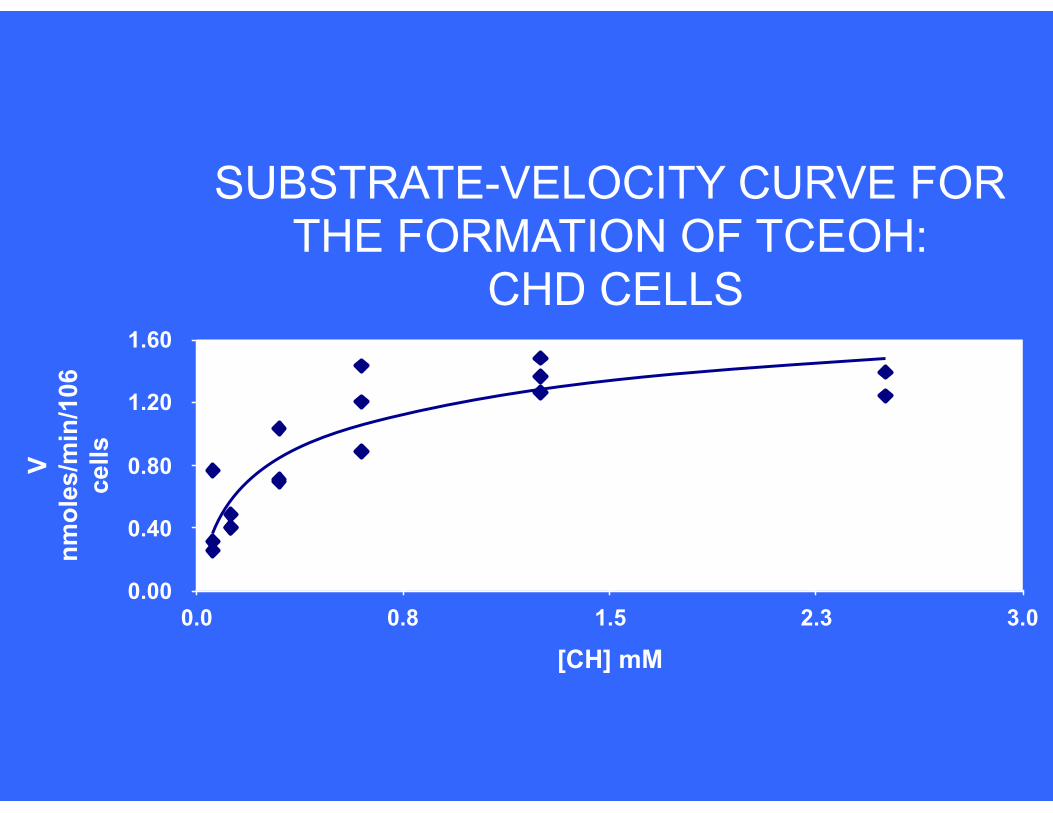
SUBSTRATE-VELOCITY CURVE FOR THE FORMATION OF TCEOH:
CHD CELLS
V nm
oles
/min
/106
ce
lls
0.00
0.40
0.80
1.20
1.60
[CH] mM0.0 0.8 1.5 2.3 3.0
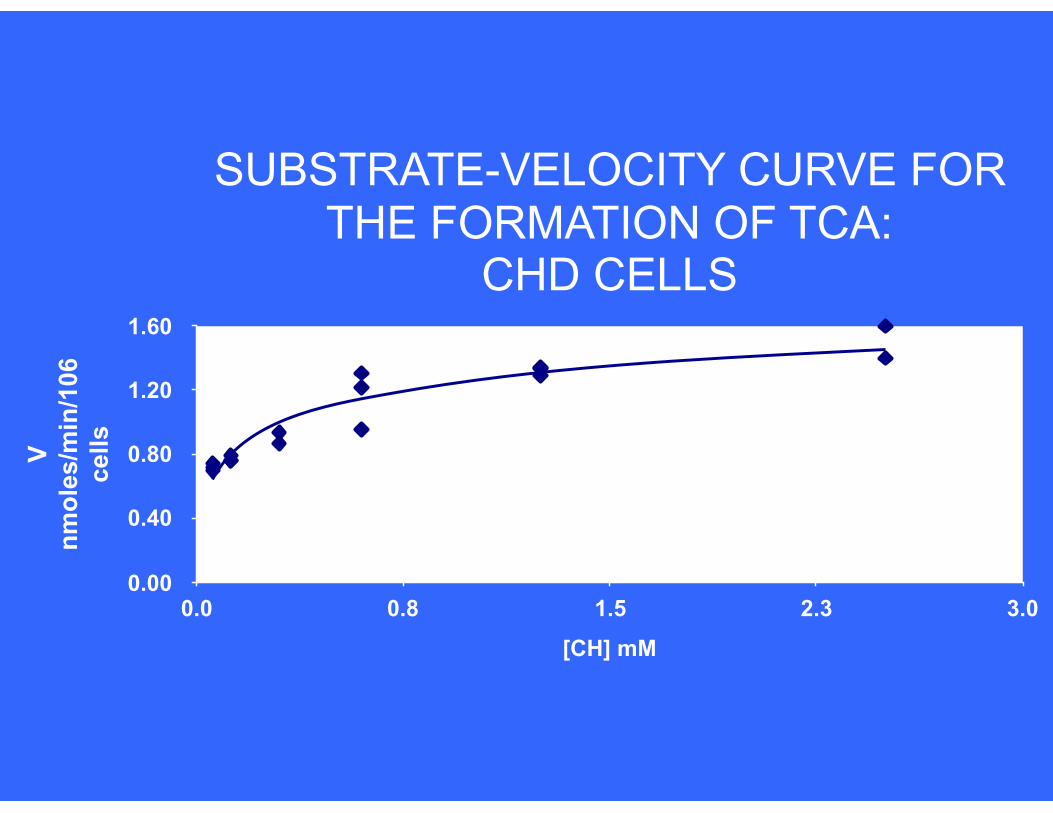
SUBSTRATE-VELOCITY CURVE FOR THE FORMATION OF TCA:
CHD CELLS
V nm
oles
/min
/106
ce
lls
0.00
0.40
0.80
1.20
1.60
[CH] mM
0.0 0.8 1.5 2.3 3.0
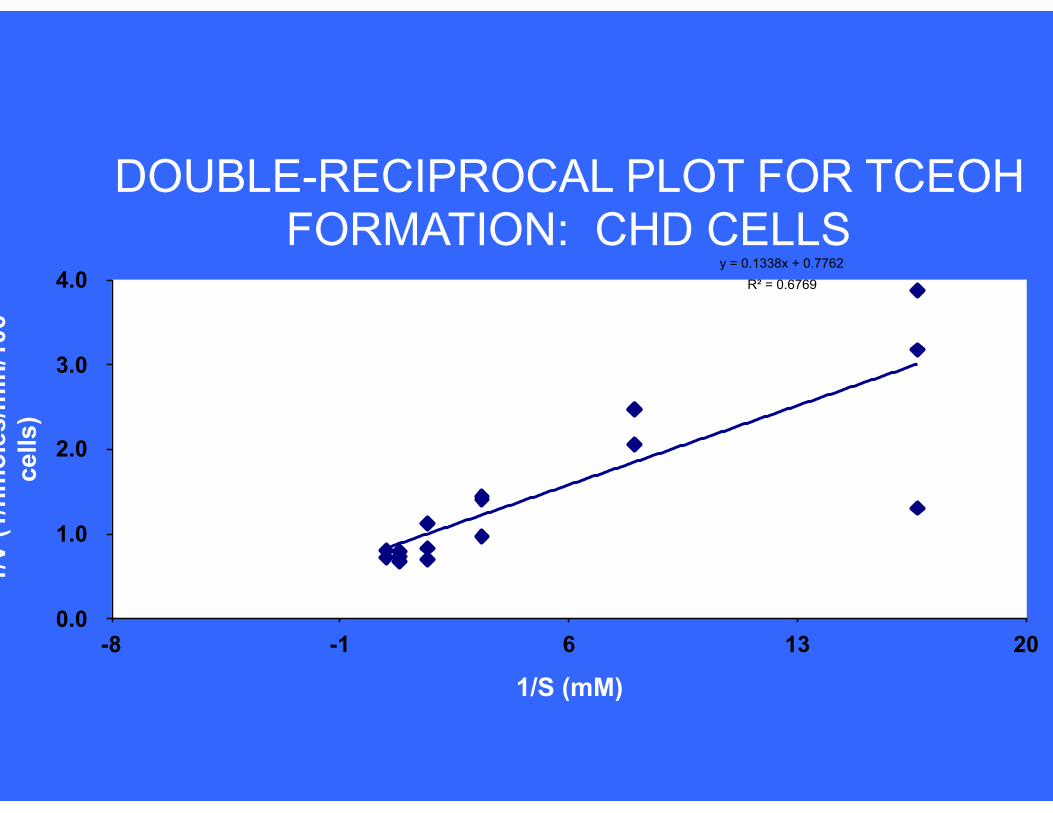
DOUBLE-RECIPROCAL PLOT FOR TCEOH FORMATION: CHD CELLS
1/V
(1/n
mol
es/m
in/1
06
cells
)
0.0
1.0
2.0
3.0
4.0
1/S (mM)-8 -1 6 13 20
y = 0.1338x + 0.7762R² = 0.6769
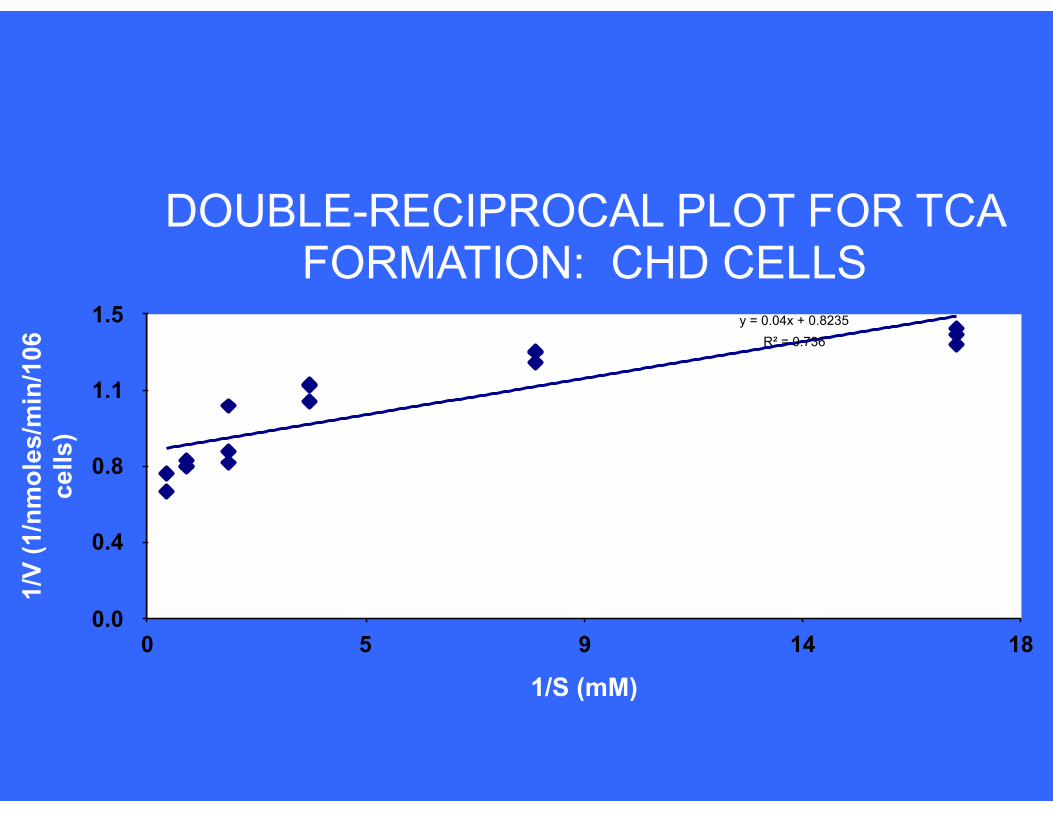
DOUBLE-RECIPROCAL PLOT FOR TCA FORMATION: CHD CELLS
1/V
(1/n
mol
es/m
in/1
06
cells
)
0.0
0.4
0.8
1.1
1.5
1/S (mM)0 5 9 14 18
y = 0.04x + 0.8235R² = 0.736