Embed Size (px)
Citation preview
SOCIAL IMPACT
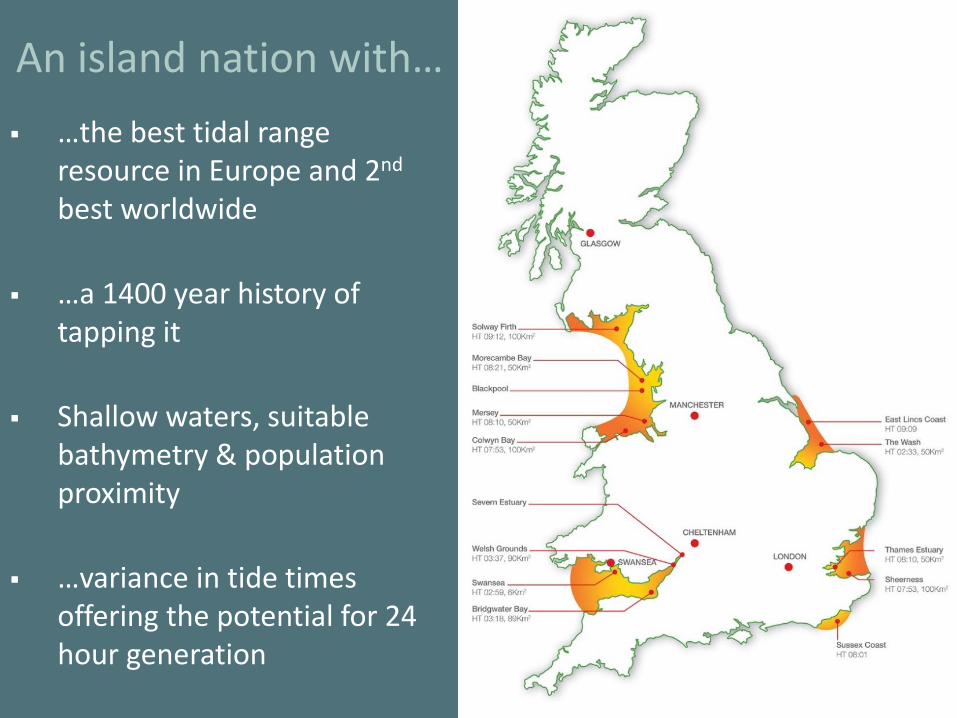
An island nation with…
…the best tidal range resource in Europe and 2nd
best worldwide
…a 1400 year history of tapping it
Shallow waters, suitable bathymetry & population proximity
…variance in tide times offering the potential for 24 hour generation
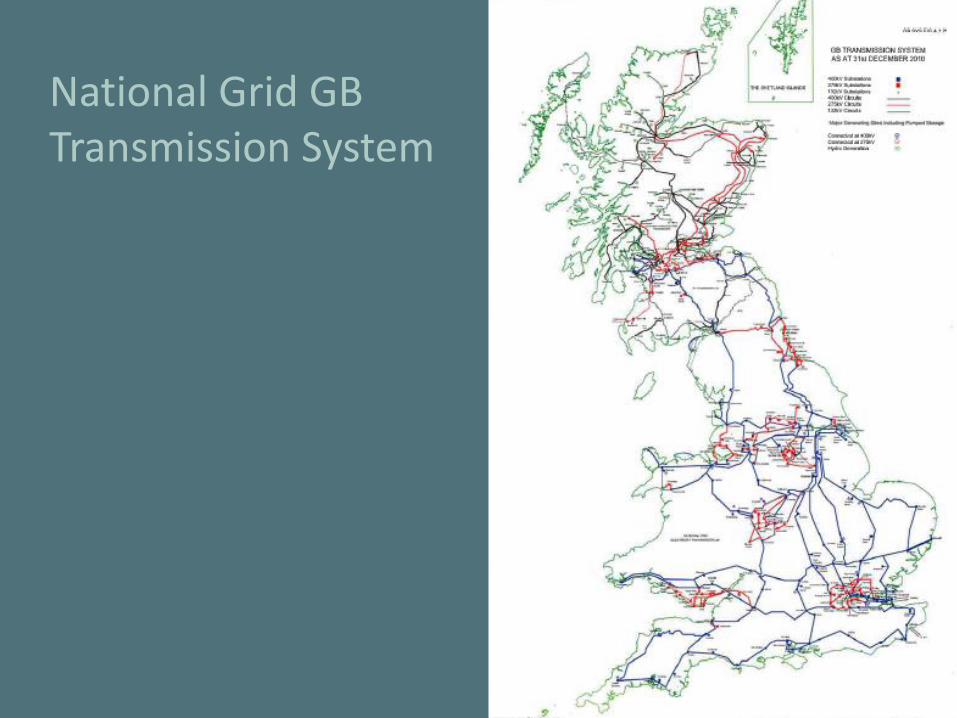
National Grid GB Transmission System
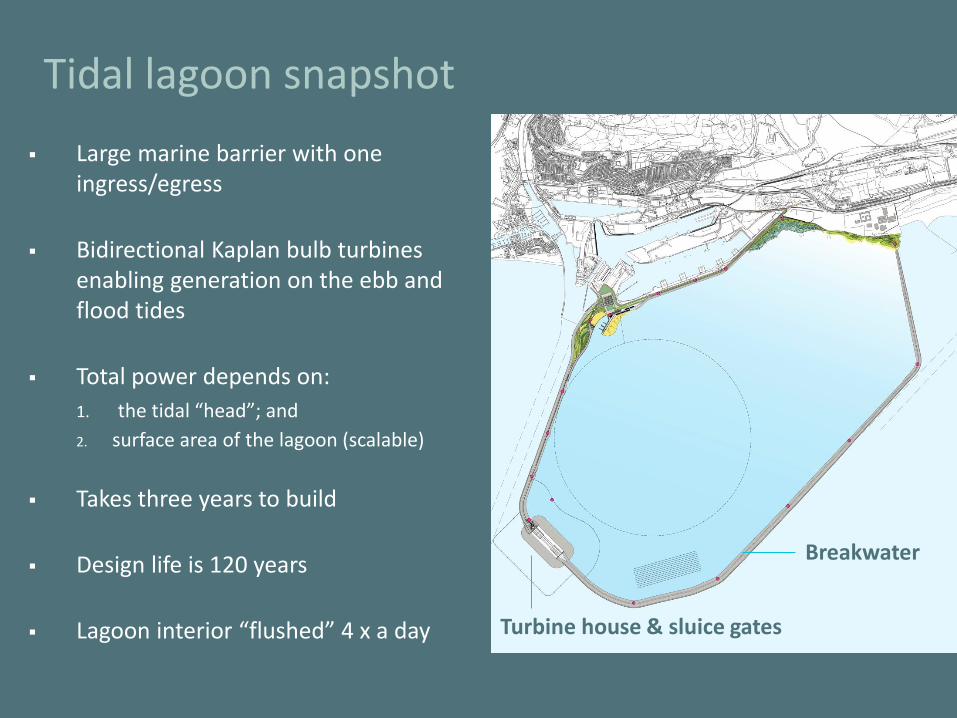
Tidal lagoon snapshot
Large marine barrier with one ingress/egress
Bidirectional Kaplan bulb turbines enabling generation on the ebb and flood tides
Total power depends on:
1. the tidal “head”; and
2. surface area of the lagoon (scalable)
Takes three years to build
Design life is 120 years
Lagoon interior “flushed” 4 x a day
4Turbine house & sluice gates
Breakwater
Breakwater
Turbine house & sluice gates
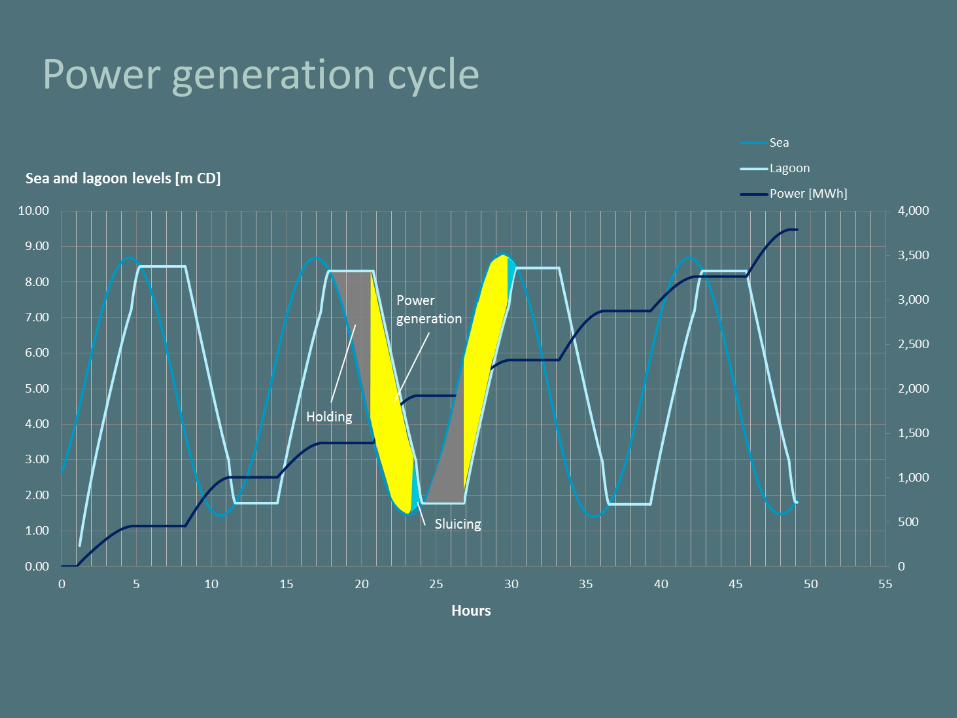
Power generation cycle
“We believe that Wales has the potential to be a world-leader
in the marine energy market –as a significant generator and, just as importantly,
as an exporter of marine energy knowledge, technologies and services.”
Energy Wales: A Low Carbon TransitionMarch 2012
Welsh Government
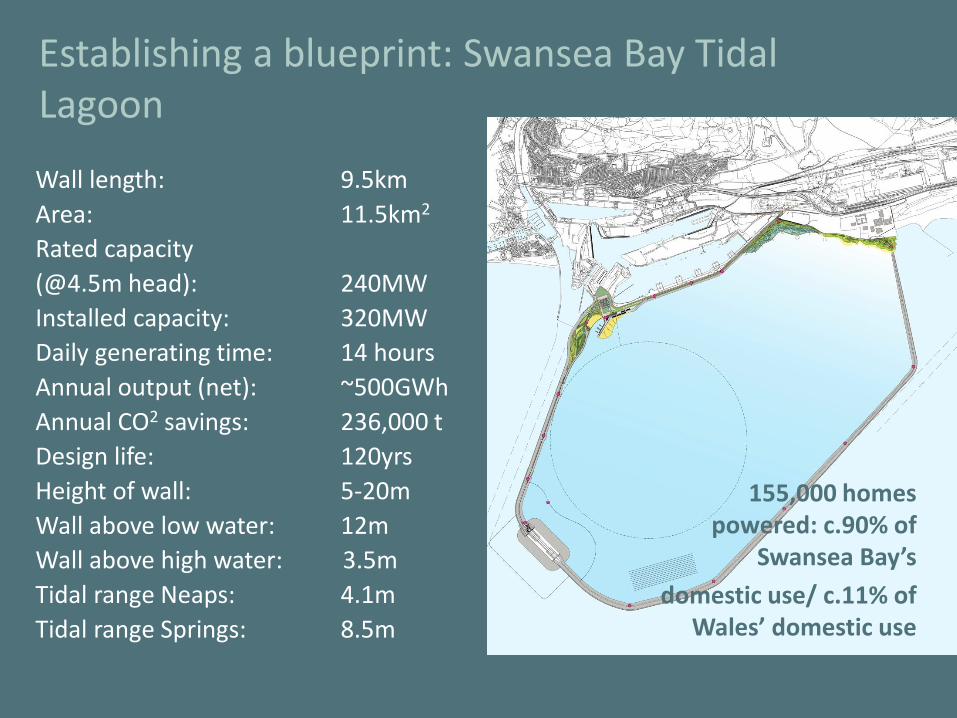
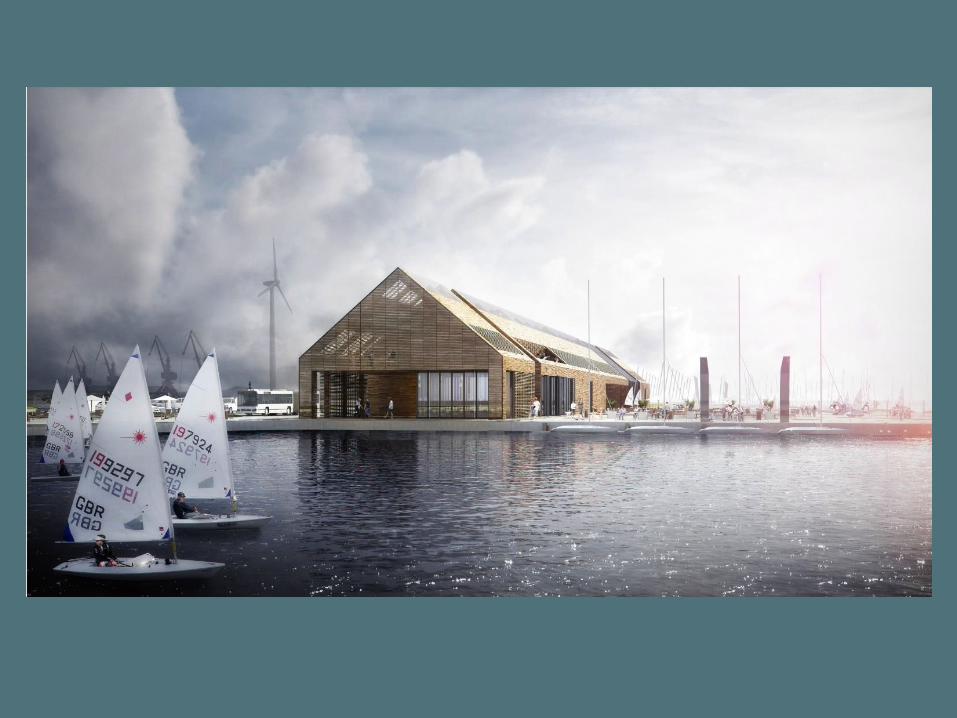
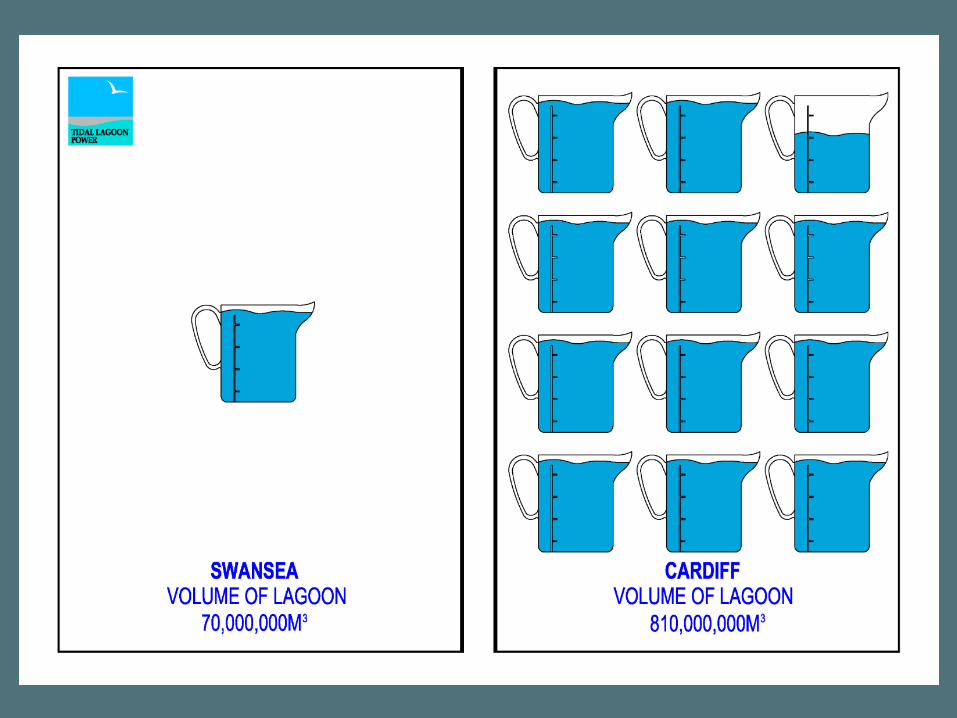
Establishing a blueprint: Swansea Bay Tidal Lagoon
Wall length: 9.5km
Area: 11.5km2
Rated capacity
(@4.5m head): 240MW
Installed capacity: 320MW
Daily generating time: 14 hours
Annual output (net): ~500GWh
Annual CO2 savings: 236,000 t
Design life: 120yrs
Height of wall: 5-20m
Wall above low water: 12m
Wall above high water: 3.5m
Tidal range Neaps: 4.1m
Tidal range Springs: 8.5m
155,000 homes powered: c.90% of Swansea Bay’s
domestic use/ c.11% of Wales’ domestic use
24
155,000 homes powered: c.90% of
Swansea Bay’s
domestic use/ c.11% of Wales’ domestic use
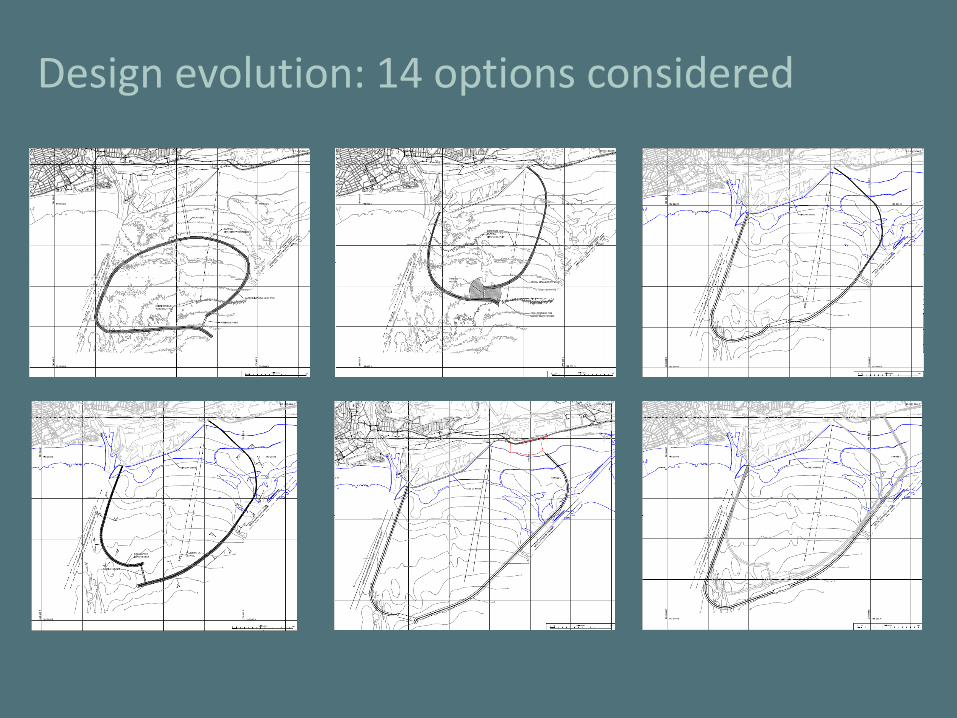
Design evolution: 14 options considered
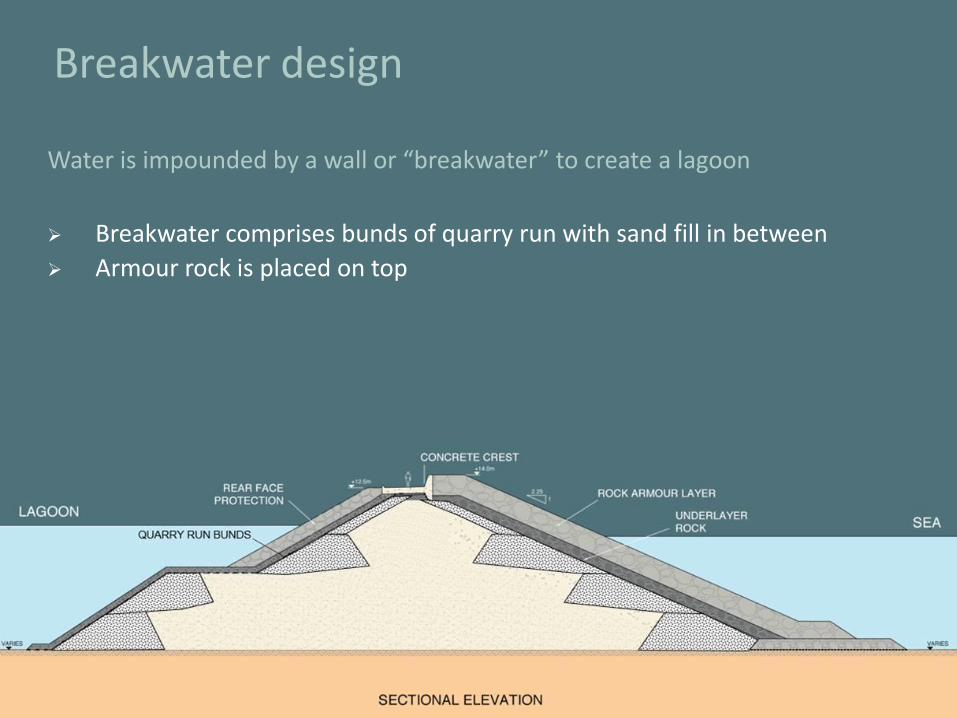
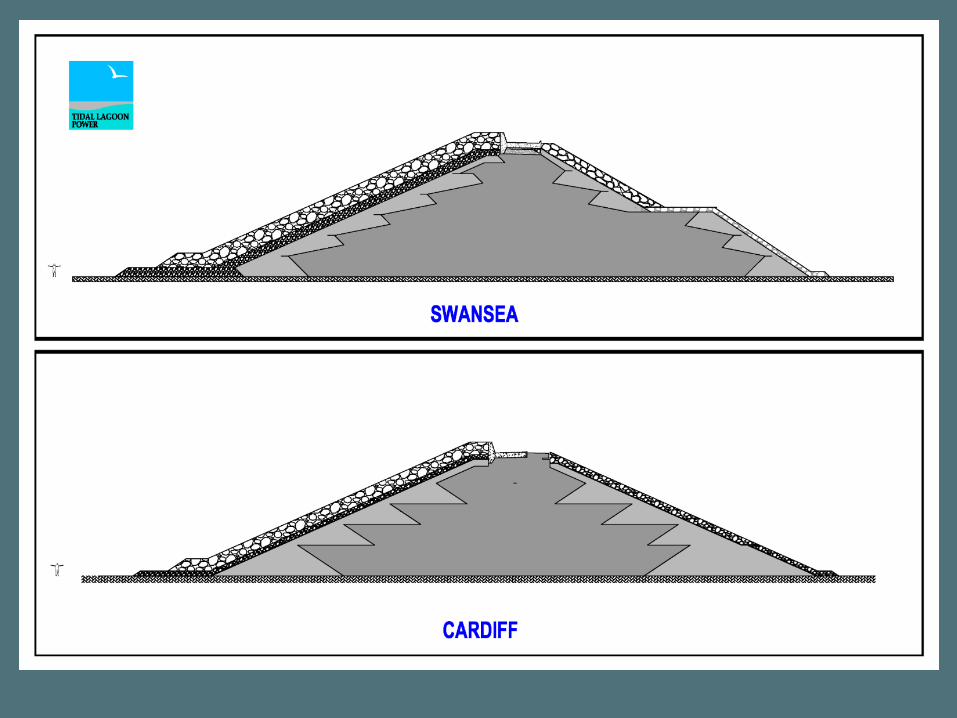
Breakwater design
Water is impounded by a wall or “breakwater” to create a lagoon
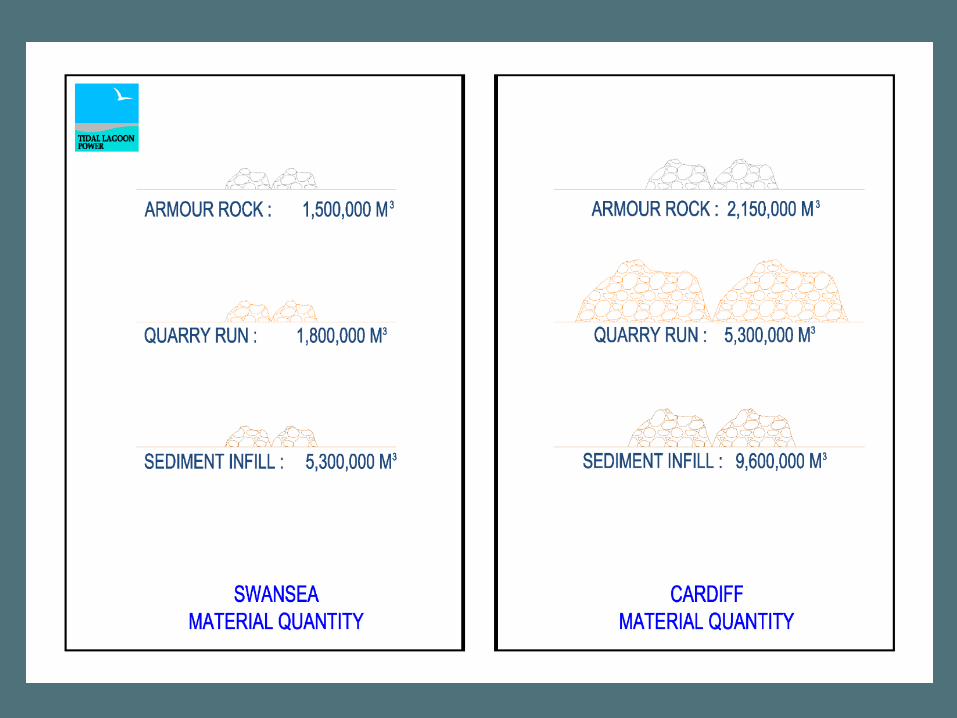
Breakwater comprises bunds of quarry run with sand fill in between
Armour rock is placed on top
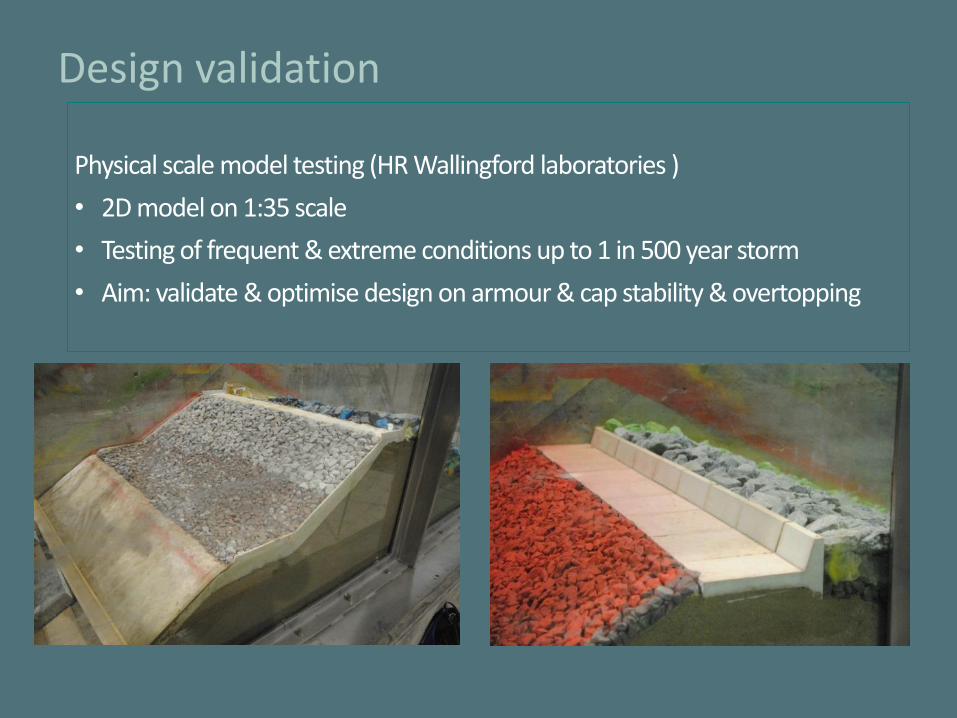
Design validation
Physical scale model testing (HR Wallingford laboratories )
• 2D model on 1:35 scale
• Testing of frequent & extreme conditions up to 1 in 500 year storm
• Aim: validate & optimise design on armour & cap stability & overtopping

Construction sequence – 1st season
Construction sequence:
Construct temporary bund – team 1
Construct western bund starting from shore and working out – team 2
Remove ABP breakwater
Construct Phase 1 eastern bund starting from shore – team 2
Installed capacity: 250MW
Annual output:
400GWh (equivalent to
Swansea’s annual dom. electricity
use)
Western Bund 2.5 km
Temporary Bund
Phase 1 of Eastern Bund 2.3 km
Removal of ABP breakwater

Construction sequence – 2nd season
Construction sequence:
Extend DCWW outfall by 1500m
Realignment of Neath Port training wall
Construct phase 2 of the Eastern Bund
Installed capacity: 250MW
Annual output:
400GWh (equivalent to
Swansea’s annual dom. electricity
use)
Phase 2 of Eastern Bund 3.1 km total
Extension of DCWW outfall
Realignment of Neath Port training wall

Construction sequence – 3rd season
Construction sequence:
Remove temporary bund – team 1
Construct final section of Eastern Bund – team 2
Note materials from temporary bund will be re-used where possible in closing the eastern bund.
Installed capacity: 250MW
Annual output:
400GWh (equivalent to
Swansea’s annual dom. electricity
use)
Phase 3 of Eastern Bund 1.5 km total
Remove temporary bund
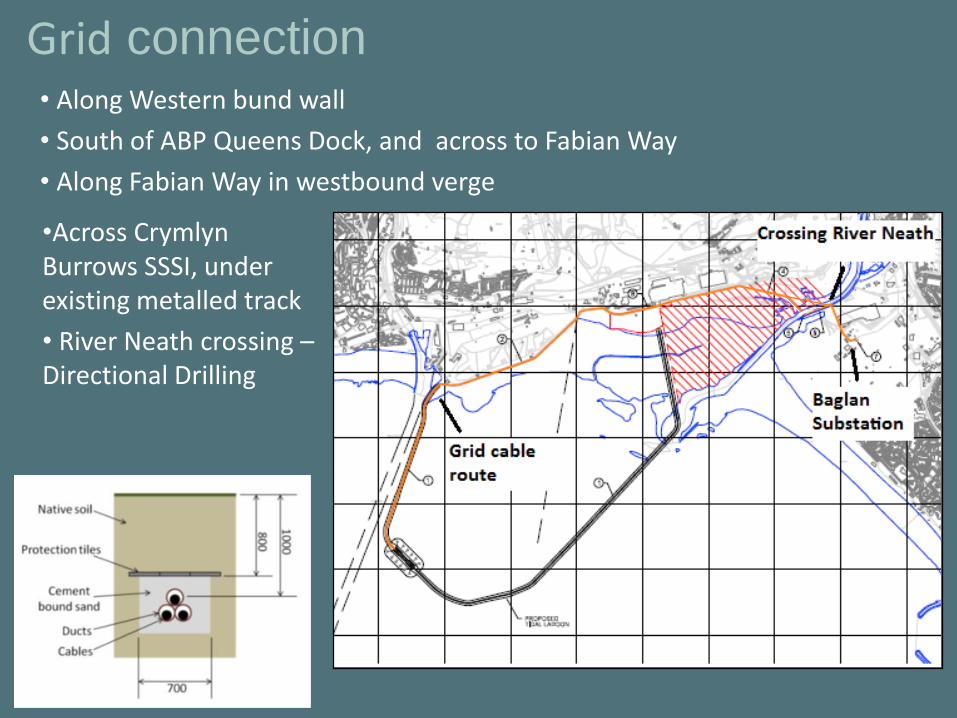
Grid connection• Along Western bund wall
• South of ABP Queens Dock, and across to Fabian Way
• Along Fabian Way in westbound verge
•Across Crymlyn Burrows SSSI, under existing metalled track
• River Neath crossing –Directional Drilling
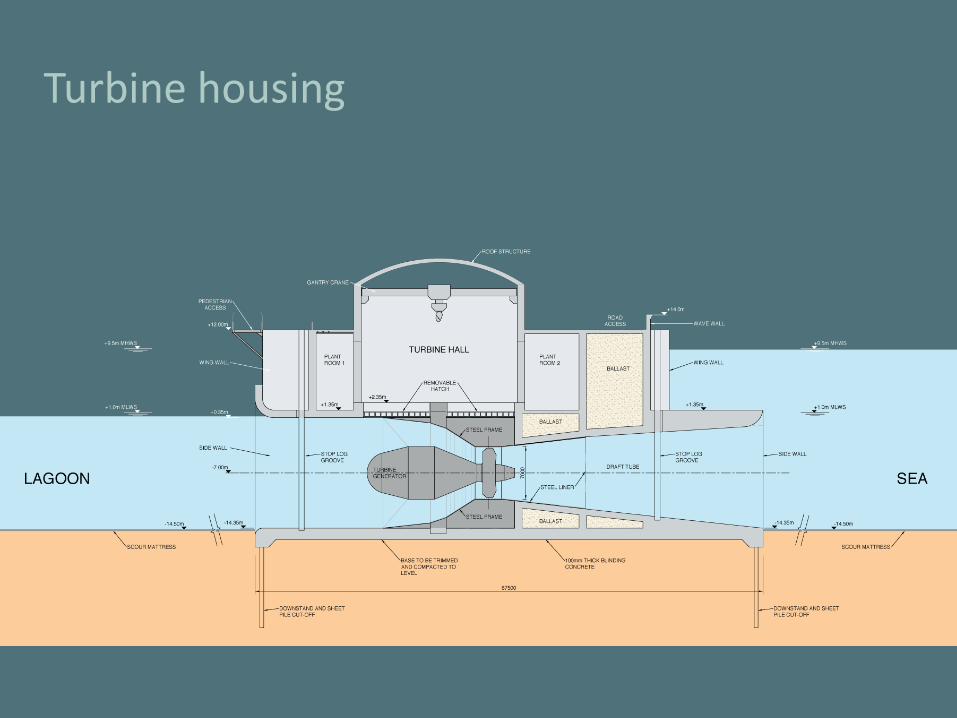
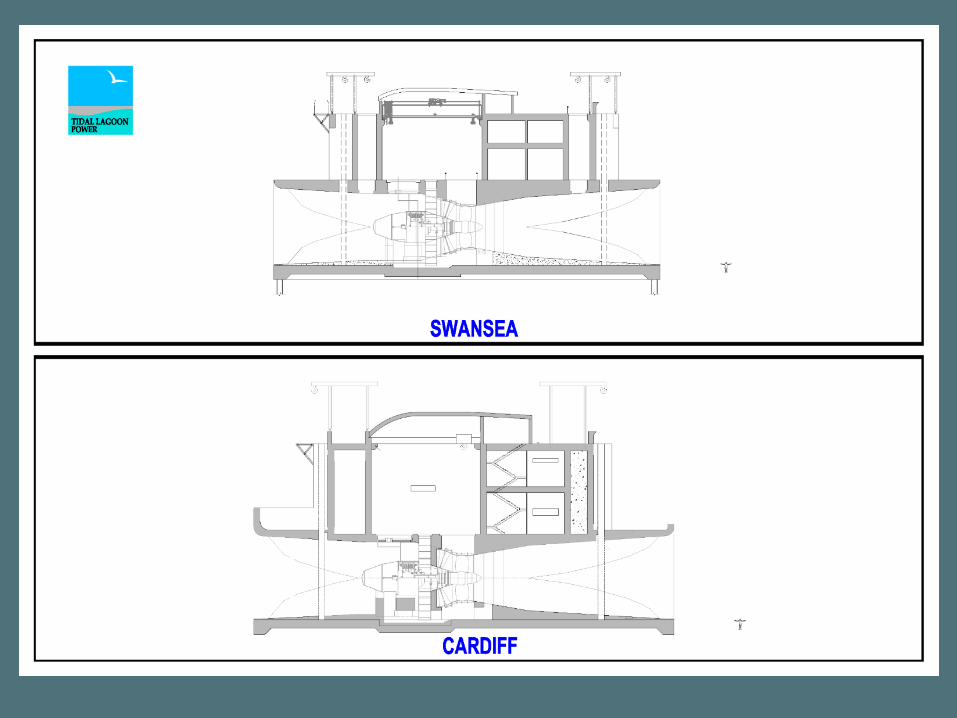
Turbine housing
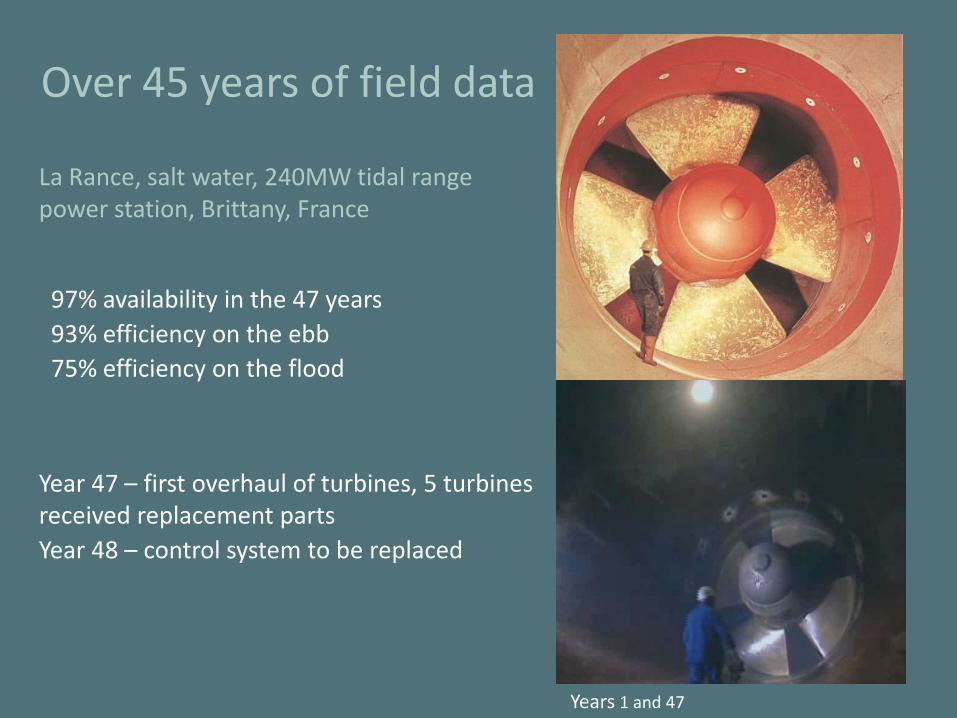
97% availability in the 47 years
93% efficiency on the ebb
75% efficiency on the flood
Year 47 – first overhaul of turbines, 5 turbines received replacement parts
Year 48 – control system to be replaced
Years 1 and 47
Over 45 years of field data
La Rance, salt water, 240MW tidal range power station, Brittany, France
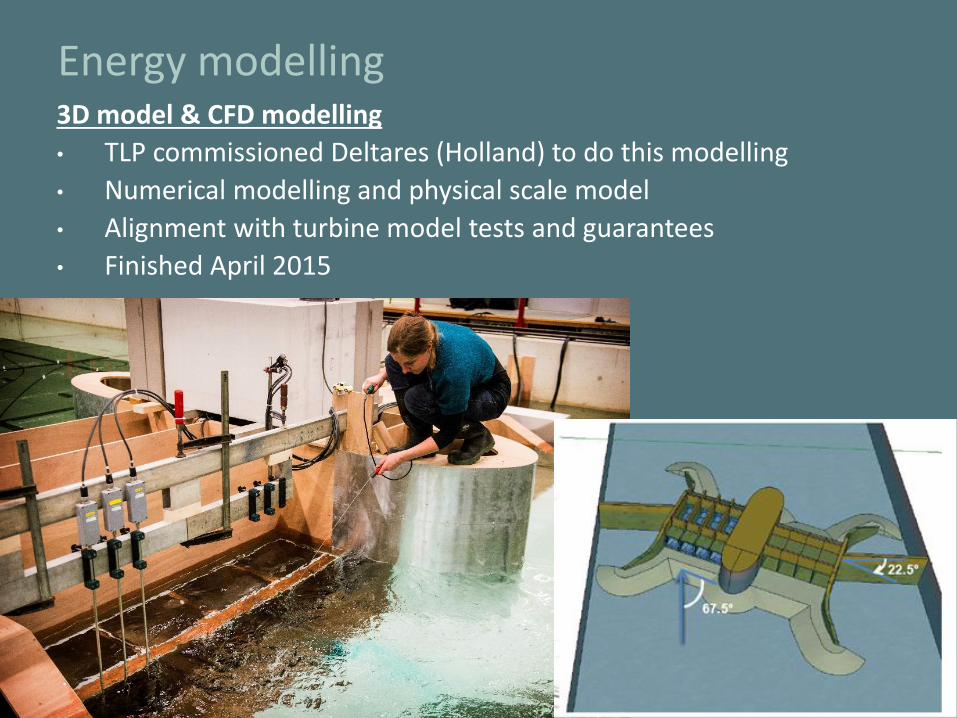
3D model & CFD modelling
• TLP commissioned Deltares (Holland) to do this modelling
• Numerical modelling and physical scale model
• Alignment with turbine model tests and guarantees
• Finished April 2015
Energy modelling
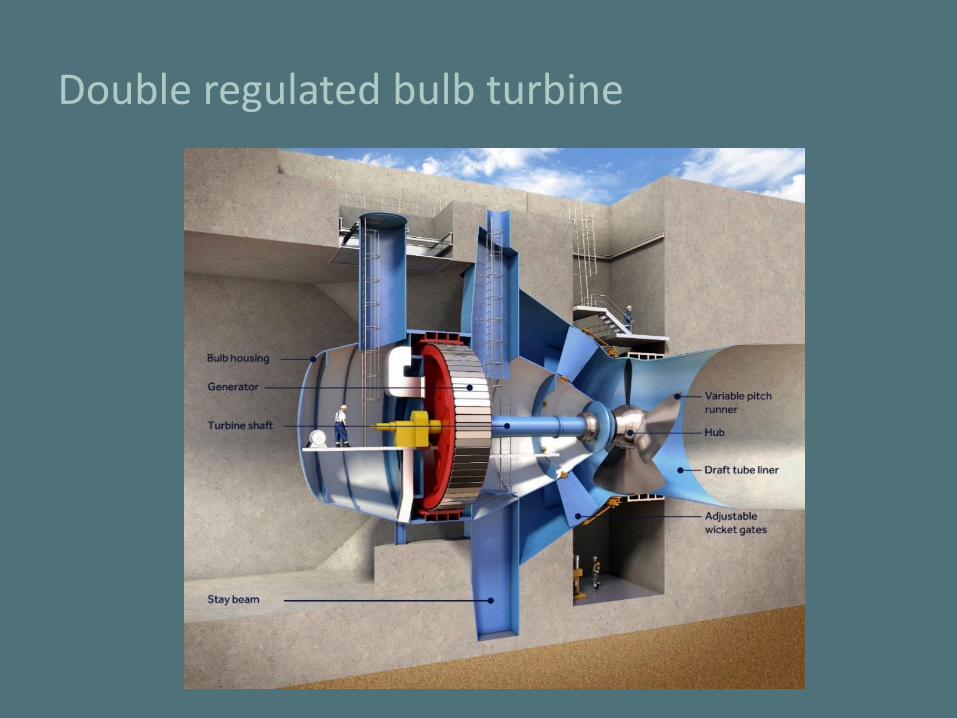
Double regulated bulb turbine
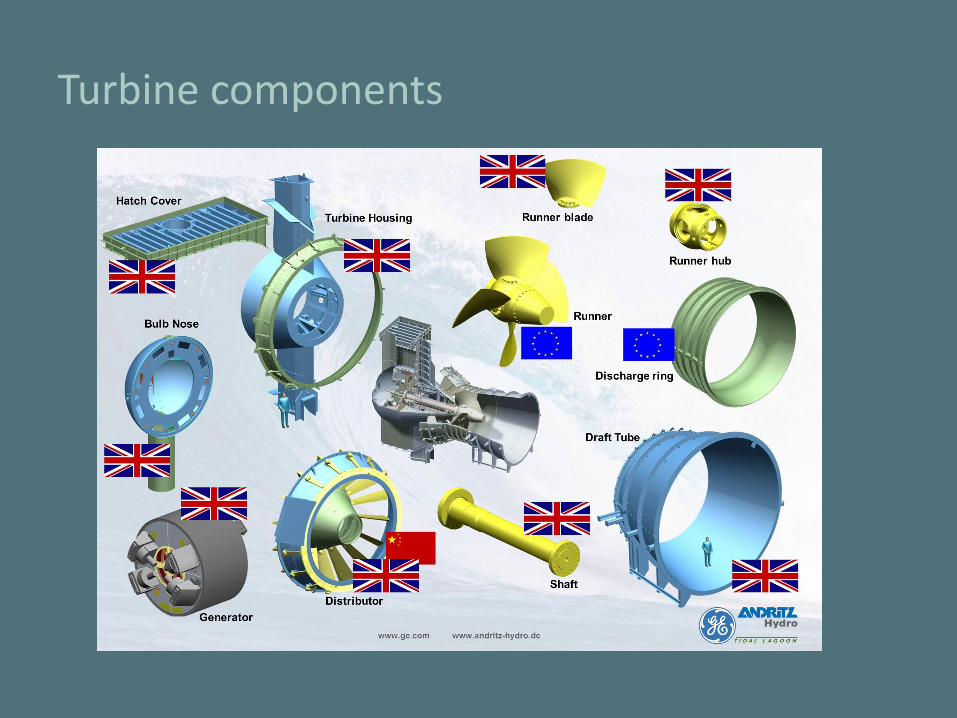
Turbine components
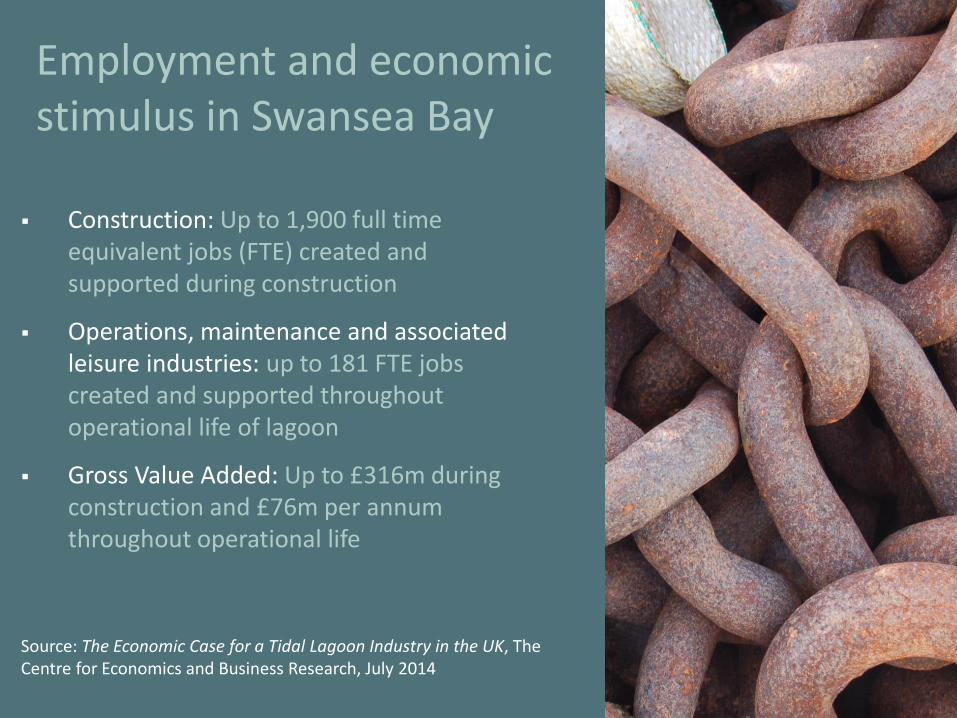
Employment and economic stimulus in Swansea Bay
Construction: Up to 1,900 full time equivalent jobs (FTE) created and supported during construction
Operations, maintenance and associated leisure industries: up to 181 FTE jobs created and supported throughout operational life of lagoon
Gross Value Added: Up to £316m during construction and £76m per annum throughout operational life
Source: The Economic Case for a Tidal Lagoon Industry in the UK, The Centre for Economics and Business Research, July 2014 22
Project delivery
The project’s major delivery partnerships announced so far are:
2426
Turbines Client’s Engineer
Turbines
Equity Partner
Equity Partner
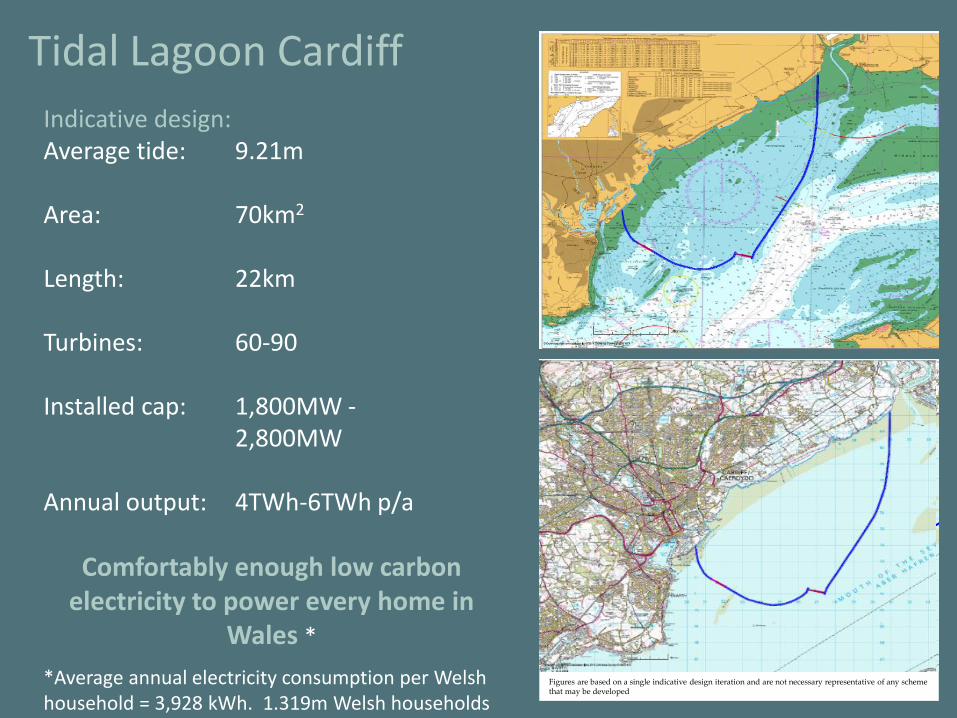
Tidal Lagoon Cardiff
Indicative design:Average tide: 9.21m
Area: 70km2
Length: 22km
Turbines: 60-90
Installed cap: 1,800MW -2,800MW
Annual output: 4TWh-6TWh p/a
Comfortably enough low carbon electricity to power every home in
Wales *
*Average annual electricity consumption per Welsh household = 3,928 kWh. 1.319m Welsh households
Figures are based on a single indicative design iteration and are not necessary representative of any scheme that may be developed
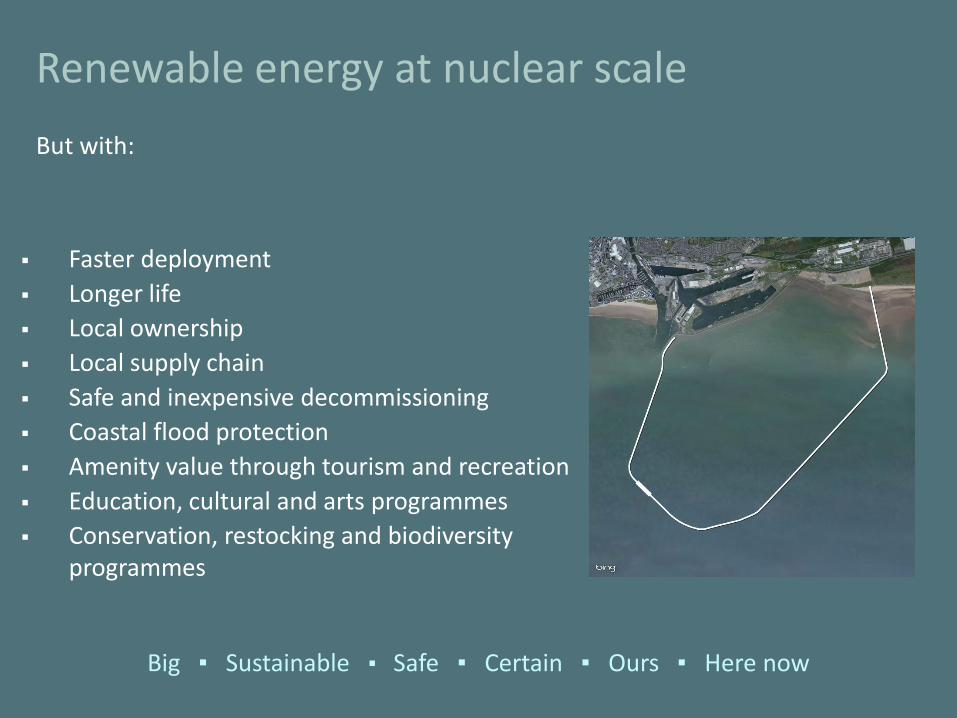
Renewable energy at nuclear scale
But with:
Faster deployment
Longer life
Local ownership
Local supply chain
Safe and inexpensive decommissioning
Coastal flood protection
Amenity value through tourism and recreation
Education, cultural and arts programmes
Conservation, restocking and biodiversity programmes
Big ▪ Sustainable ▪ Safe ▪ Certain ▪ Ours ▪ Here now
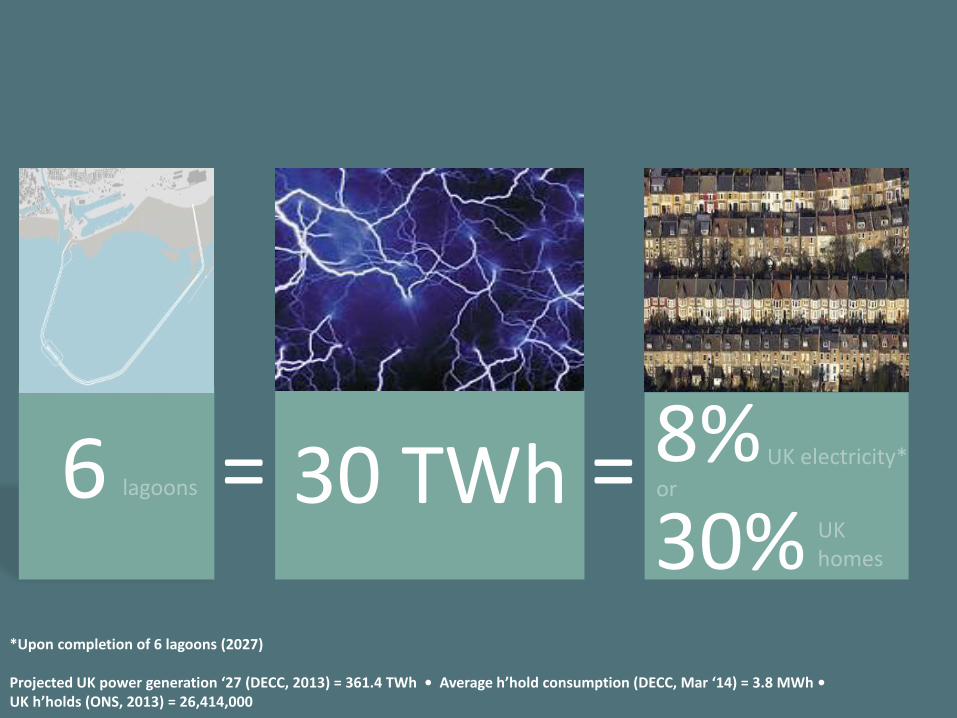
6 lagoons 30 TWh 8%30%
UK electricity*= =UK homes
or
*Upon completion of 6 lagoons (2027)
Projected UK power generation ‘27 (DECC, 2013) = 361.4 TWh • Average h’hold consumption (DECC, Mar ‘14) = 3.8 MWh • UK h’holds (ONS, 2013) = 26,414,000

‘The Economic Case for a UK Tidal Lagoon Industry’, Centre for Economics and Business Research, July 2014
1) A national fleet of 6 lagoons would contribute £27bn to UK GDP during 12 years of construction
2) Creating or sustaining 35,800 jobs on average and 70,900 jobs at its peak3) In operation, the fleet would contribute £3.1bn per annum to UK GDP4) Creating or sustaining as many as 6,400 jobs5) Potential to increase net exports by £3.7bn per year – equivalent to 13% of the
current trade deficit
Key findings:
-
50,000
100,000
150,000
200,000
250,000
300,000
350,000
400,000
20
08
20
09
20
10
20
11
20
12
20
13
20
14
20
15
20
16
20
17
20
18
20
19
20
20
20
21
20
22
20
23
20
24
20
25
20
26
20
27
20
28
20
29
20
30
Biomass
Tidal lagoon
Hydro
Wind, solar, wave, tidalstreamNuclear
Gas
Oil
Coal and gas CCS
Coal
Source: DECC Updated Energy & Emissions Projections - September 2013, Cebr projections for 6 UK tidal lagoons
GWh
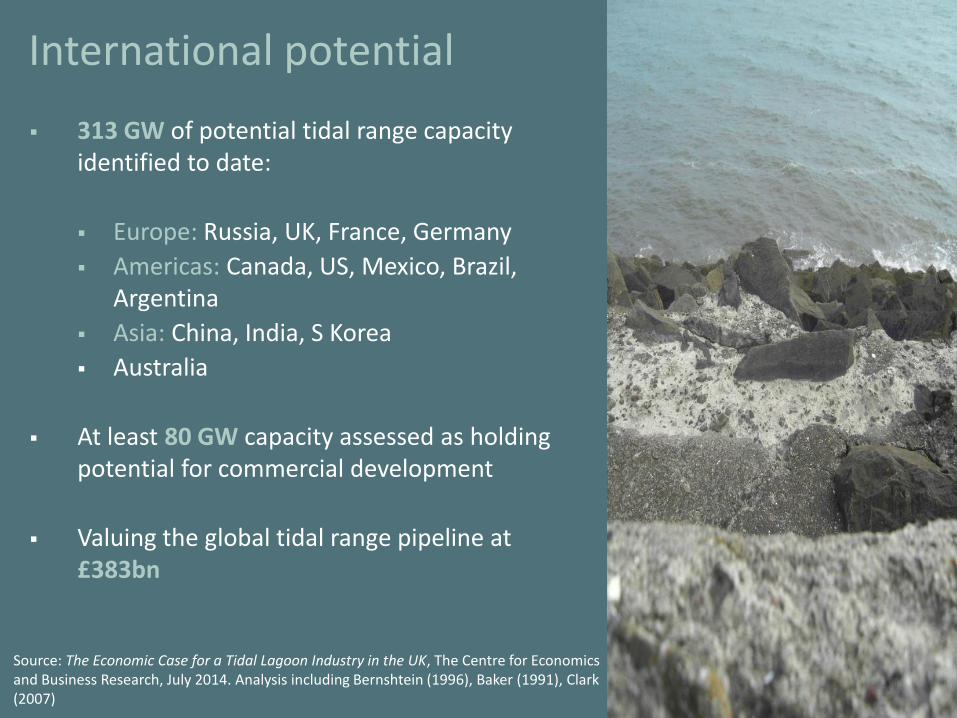
International potential
313 GW of potential tidal range capacity identified to date:
Europe: Russia, UK, France, Germany
Americas: Canada, US, Mexico, Brazil, Argentina
Asia: China, India, S Korea
Australia
At least 80 GW capacity assessed as holding potential for commercial development
Valuing the global tidal range pipeline at £383bn
1914
Source: The Economic Case for a Tidal Lagoon Industry in the UK, The Centre for Economics and Business Research, July 2014. Analysis including Bernshtein (1996), Baker (1991), Clark (2007)


![A systematic review of transferable solution options for ... · Swansea Bay Tidal Lagoon from TLP [7,15,16]. The lagoon was awarded a Development Consent Order (DCO) in 2015, but](https://img.pdfslide.net/doc/110x75/5d49124c88c993391e8bd4eb/a-systematic-review-of-transferable-solution-options-for-swansea-bay-tidal.jpg)