Embed Size (px)
Citation preview

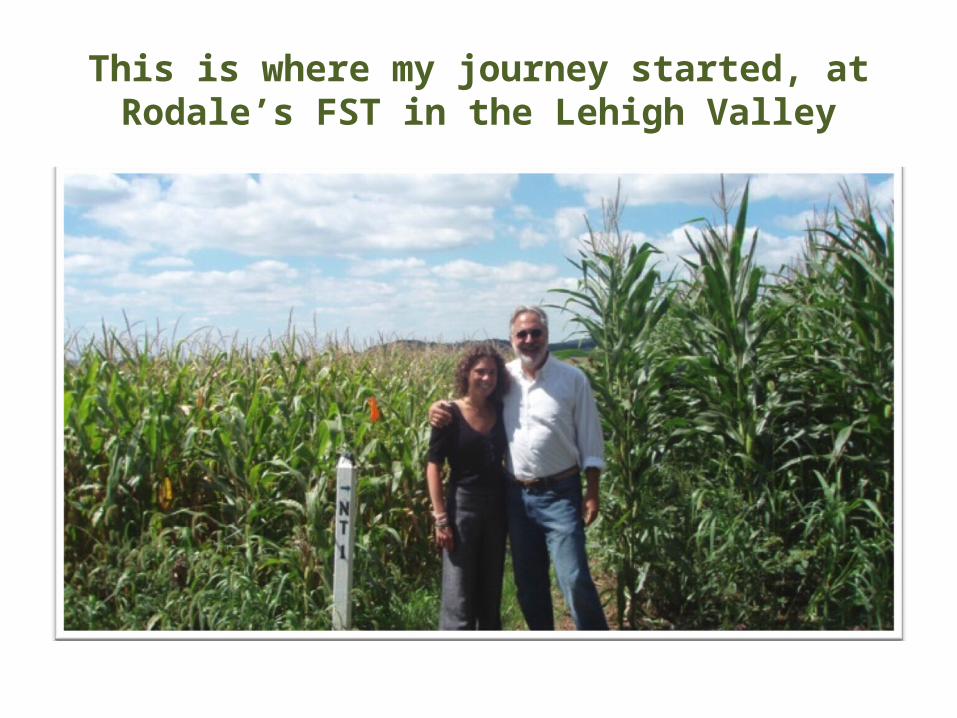
This is where my journey started, at Rodale’s FST in the Lehigh Valley
40% of the world’s population and 55% of children under the age of 5
live in the tropics. We need to demonstrate that regenerative
agricultural practices work in the tropics.
The Carbon Underground Tropical Farming Systems Trial
Trial Design
Same cassava starter cuttings, same farmers, same sun, same
starter soil, same water
Then a drought happened….
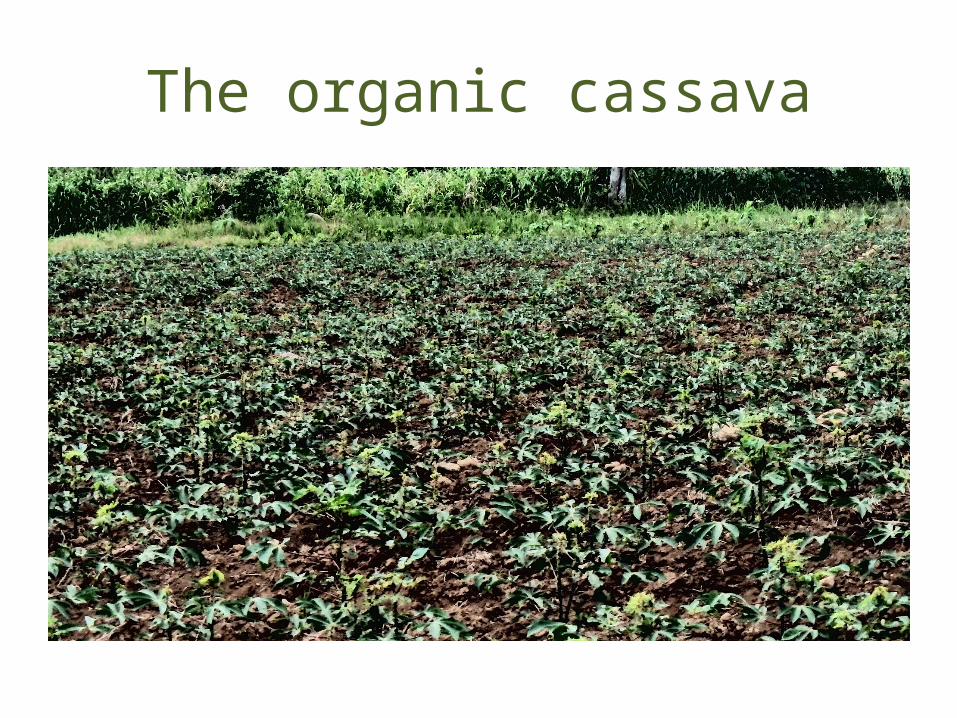
The organic cassava
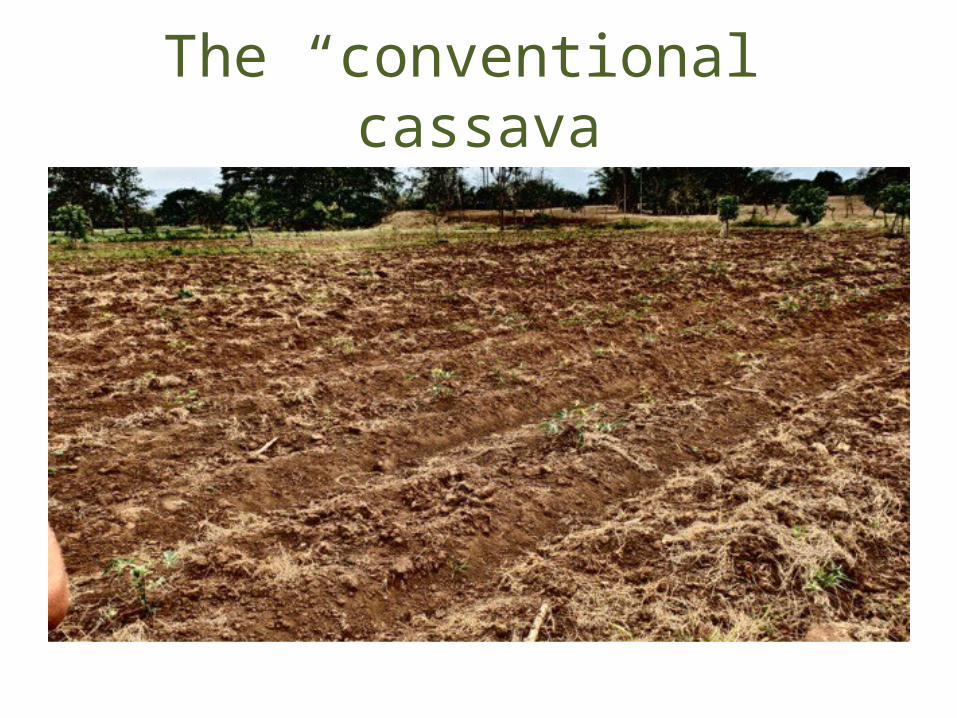
The “conventional” cassava
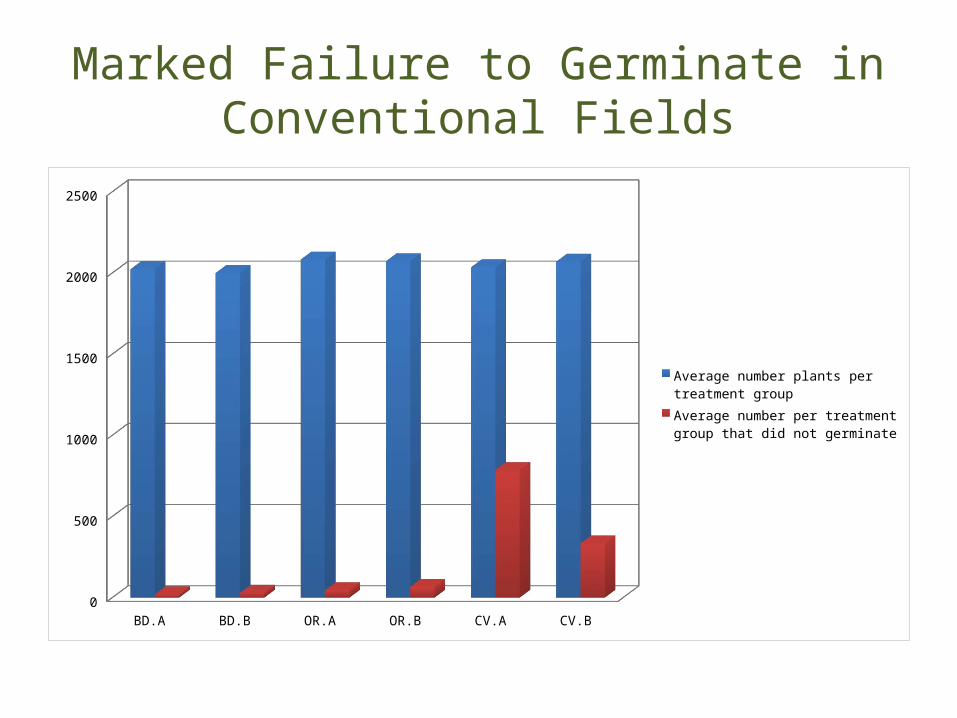
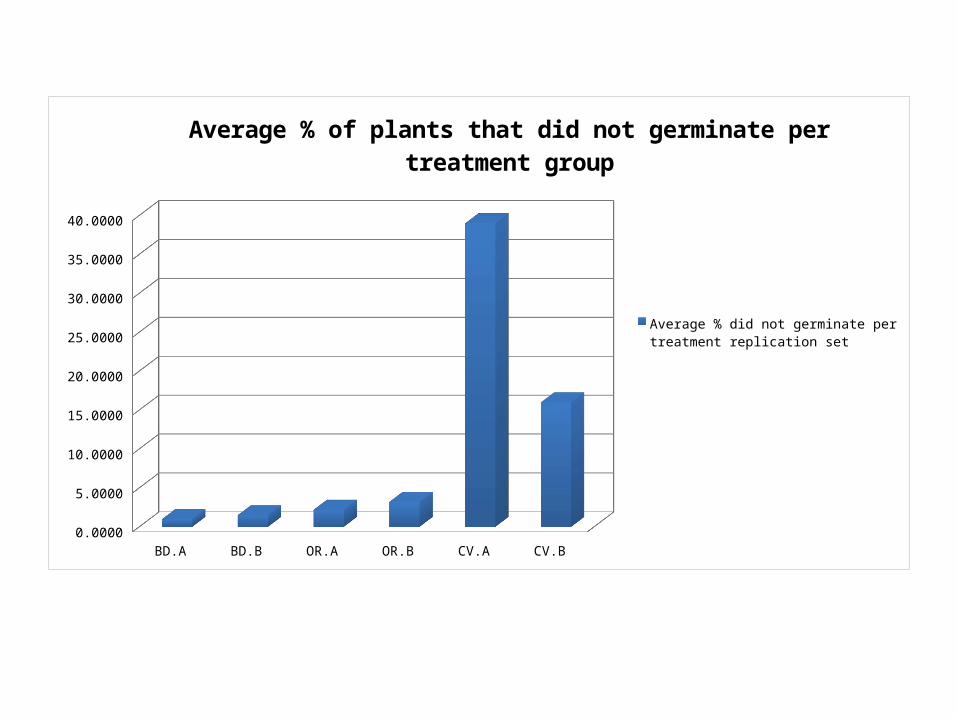
Marked Failure to Germinate in Conventional Fields
BD.A BD.B OR.A OR.B CV.A CV.B0
500
1000
1500
2000
2500
Average number plants per treatment groupAverage number per treatment group that did not germinate
BD.A BD.B OR.A OR.B CV.A CV.B0.0000
5.0000
10.0000
15.0000
20.0000
25.0000
30.0000
35.0000
40.0000
Average % of plants that did not germinate per treatment group
Average % did not germinate per treatment replication set
We then replicated germination conditions in a more controlled environment, taking soil from each of the six farming systems and
replicating the drought conditions by planting under greenhouse plastic.
We found that the germination results under greenhouse plastic
were the same as in the field. Here are two photos to show the
differences between regenerative organic and conventional
treatments.
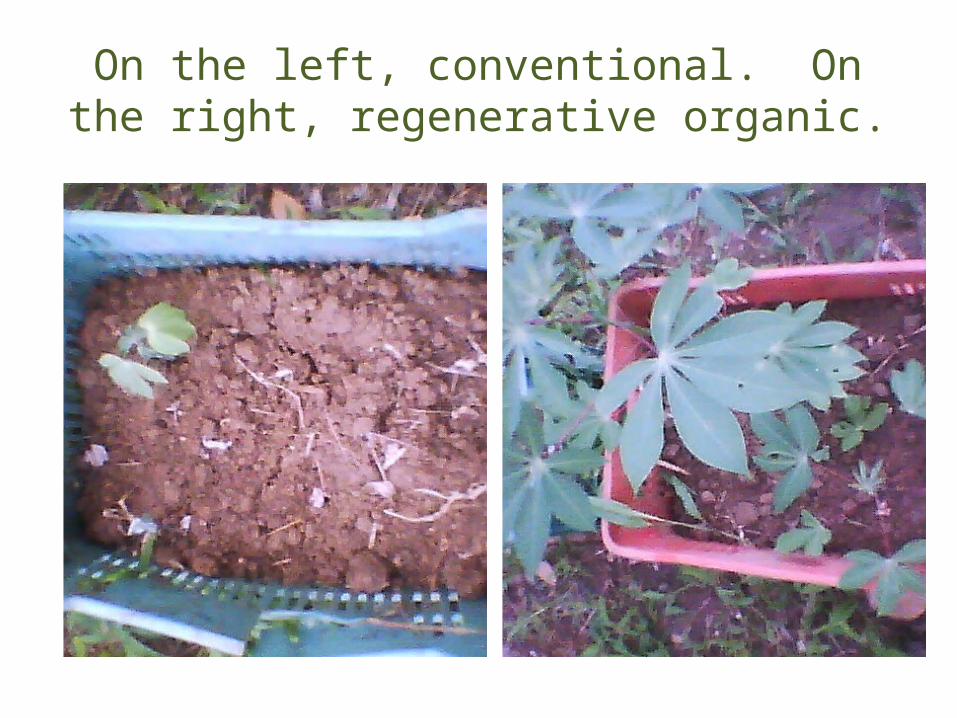
On the left, conventional. On the right, regenerative organic.
Seeking explanations for the organic success vs. the
conventional failure
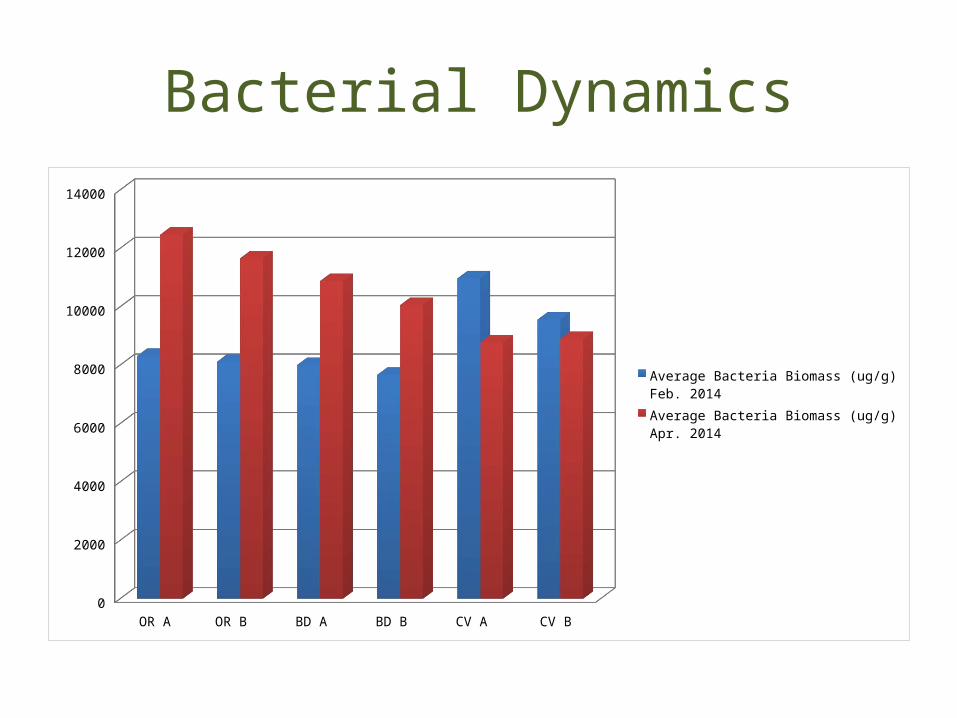
Bacterial Dynamics
OR A OR B BD A BD B CV A CV B0
2000
4000
6000
8000
10000
12000
14000
Average Bacteria Biomass (ug/g) Feb. 2014Average Bacteria Biomass (ug/g) Apr. 2014
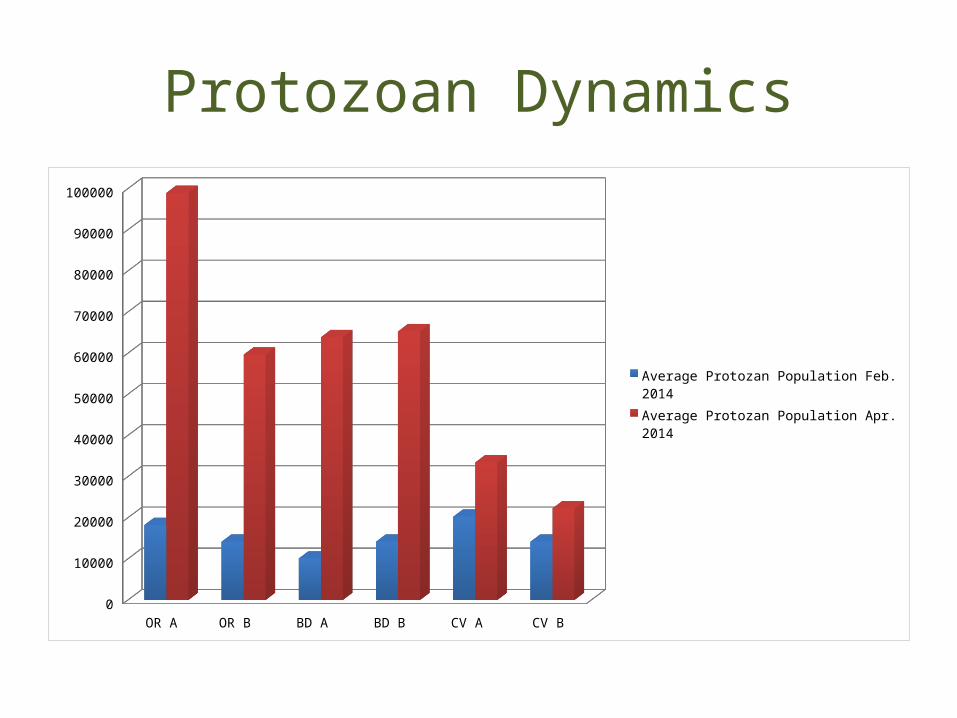
Protozoan Dynamics
OR A OR B BD A BD B CV A CV B0
10000
20000
30000
40000
50000
60000
70000
80000
90000
100000
Average Protozan Population Feb. 2014Average Protozan Population Apr. 2014
Could there be a deeper cause? Recall that soil organic carbon can
retain up to 40X its weight in water….
So we dug down for information. More precisely, we took 810 soil
samples down to 80 cm, with 135 samples per farming system
And a note on determining carbon sequestration: we use the The
Earth Partners’ soil carbon methodology, approved as a
Verified Carbon Standard
And now we have 9 months of data. Remember: the organic farming systems all used compost tea,
compost mulch (applied at a rate of approximately 7 tonnes per hectare, of which approximately 2 tonnes is organic C), and only had an initial tilling. The conventional systems
used herbicides, pesticides, and had two tillings.
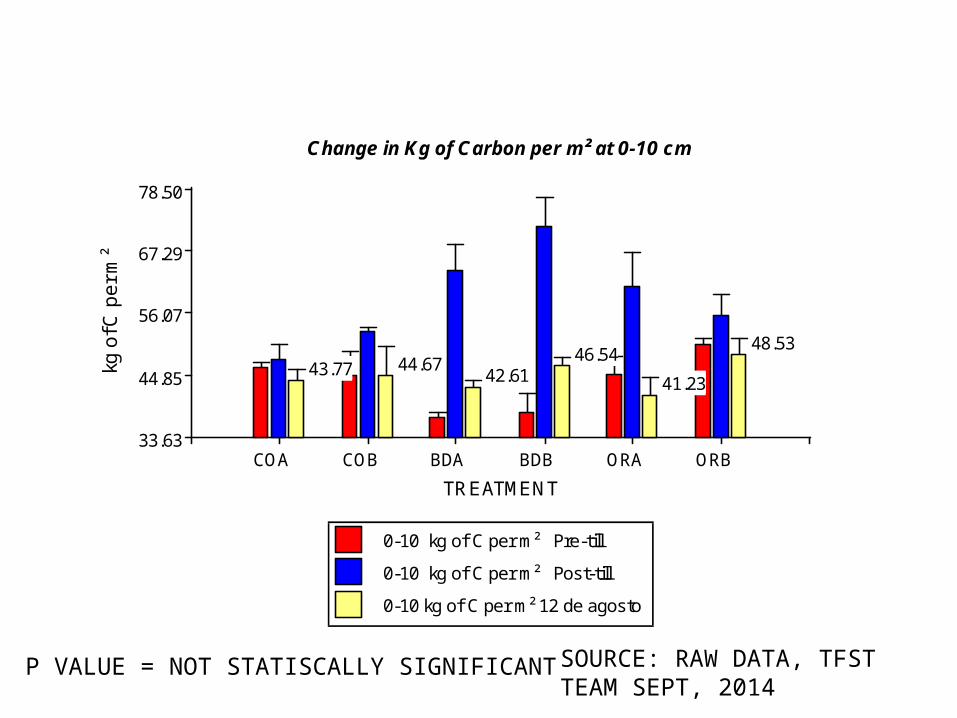
As you’ll see, after the initial tilling, where a decades-old weed
mat was ploughed under, we introduced a significant amount of
“labile” or unstable carbon over baseline.
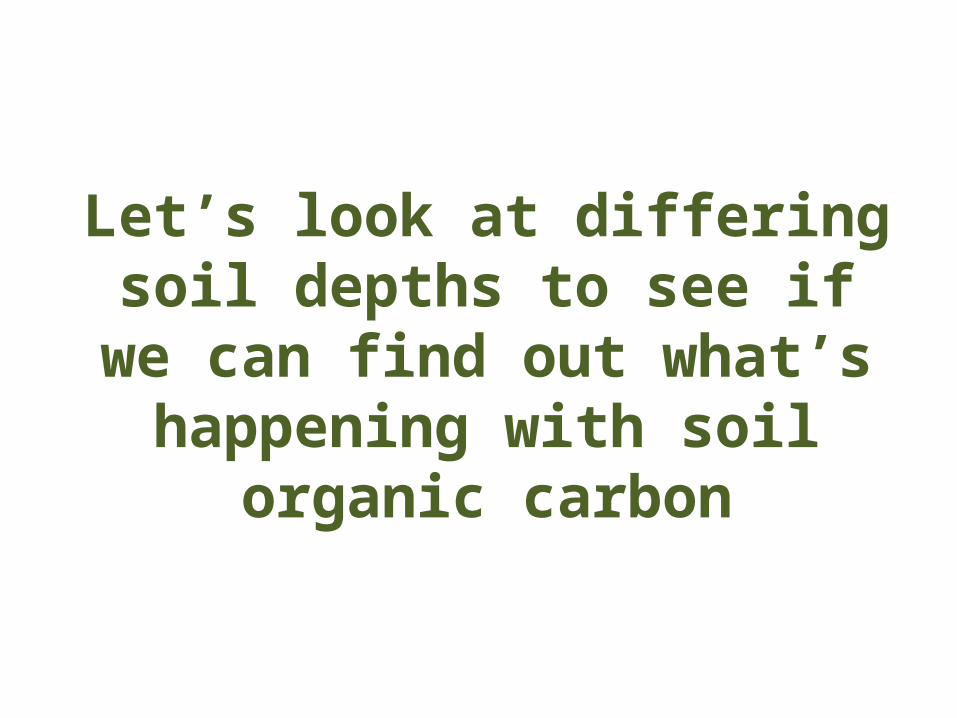
Let’s look at differing soil depths to see if we can find out what’s
happening with soil organic carbon
0-10 kg of C per m² Pre-till
0-10 kg of C per m² Post-till
0-10 kg of C per m² 12 de agosto
COA COB BDA BDB ORA ORB
TREATMENT
33.63
44.85
56.07
67.29
78.50
kg o
f C p
er
m²
43.77 44.6742.61
46.54
41.23
48.53
43.77 44.6742.61
46.54
41.23
48.53
Change in Kg of Carbon per m² at 0-10 cm
0-10 kg of C per m² Pre-till
0-10 kg of C per m² Post-till
0-10 kg of C per m² 12 de agosto
SOURCE: RAW DATA, TFST TEAM SEPT, 2014
P VALUE = NOT STATISCALLY SIGNIFICANT
10-20kg of C per m² Pre-till
10-20 kg of C per Post-till
10-20 kg of C per m² 12 de agosto
COA COB BDA BDB ORA ORB
TREATMENT
26.10
34.00
41.90
49.80
57.70
kg o
f C p
er
m²
32.57 32.72
36.42 36.95
33.5736.28
32.57 32.72
36.42 36.95
33.5736.28
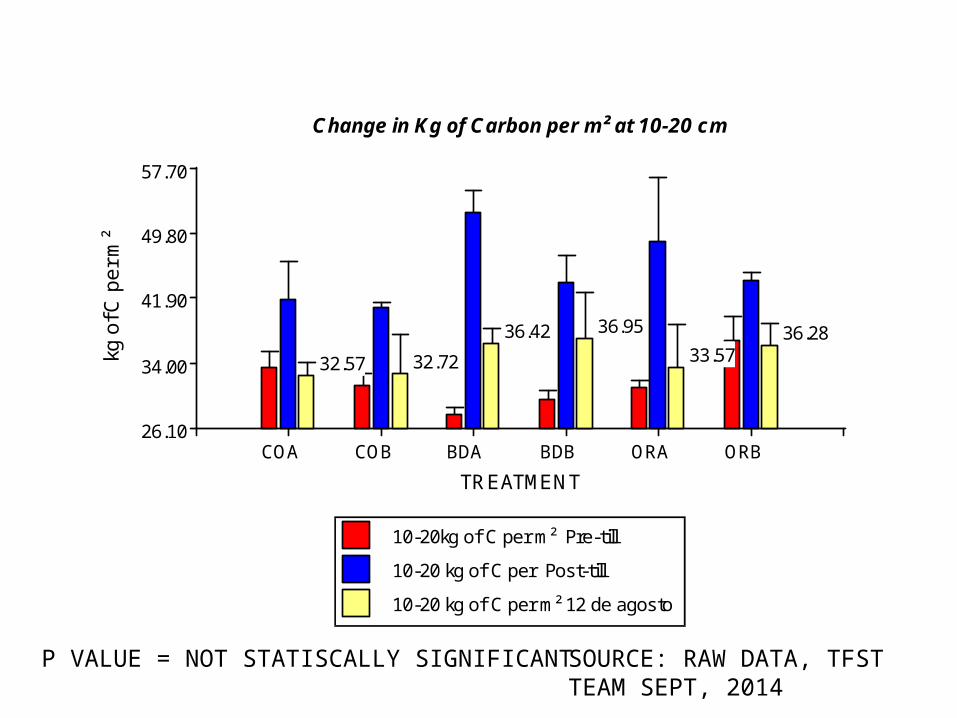
Change in Kg of Carbon per m² at 10-20 cm
10-20kg of C per m² Pre-till
10-20 kg of C per Post-till
10-20 kg of C per m² 12 de agosto
SOURCE: RAW DATA, TFST TEAM SEPT, 2014
P VALUE = NOT STATISCALLY SIGNIFICANT
20-40 kg of C per m² Pre-till
20-40 kg of C per m² Post-till
20-40 kg of C per m² 12 de agosto
COA COB BDA BDB ORA ORB
TREATMENT
31.55
40.73
49.91
59.09
68.26
kg o
f ca
rbo
n p
er
m²
47.83 47.42 48.84 47.4244.75
50.1247.83 47.42 48.84 47.42
44.75
50.12
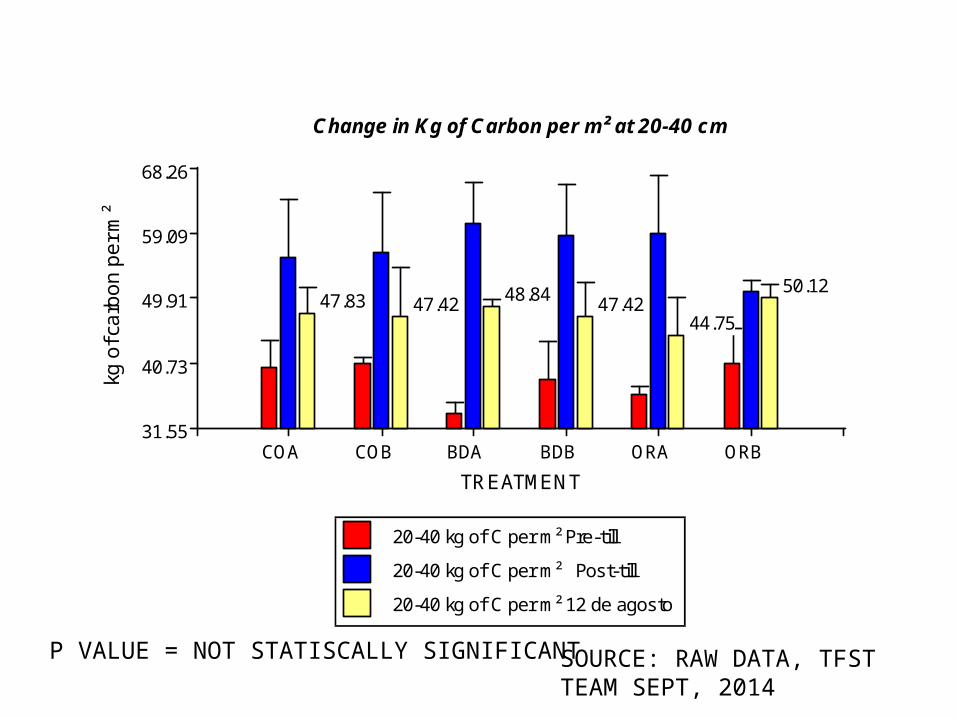
Change in Kg of Carbon per m² at 20-40 cm
20-40 kg of C per m² Pre-till
20-40 kg of C per m² Post-till
20-40 kg of C per m² 12 de agosto
SOURCE: RAW DATA, TFST TEAM SEPT, 2014
P VALUE = NOT STATISCALLY SIGNIFICANT
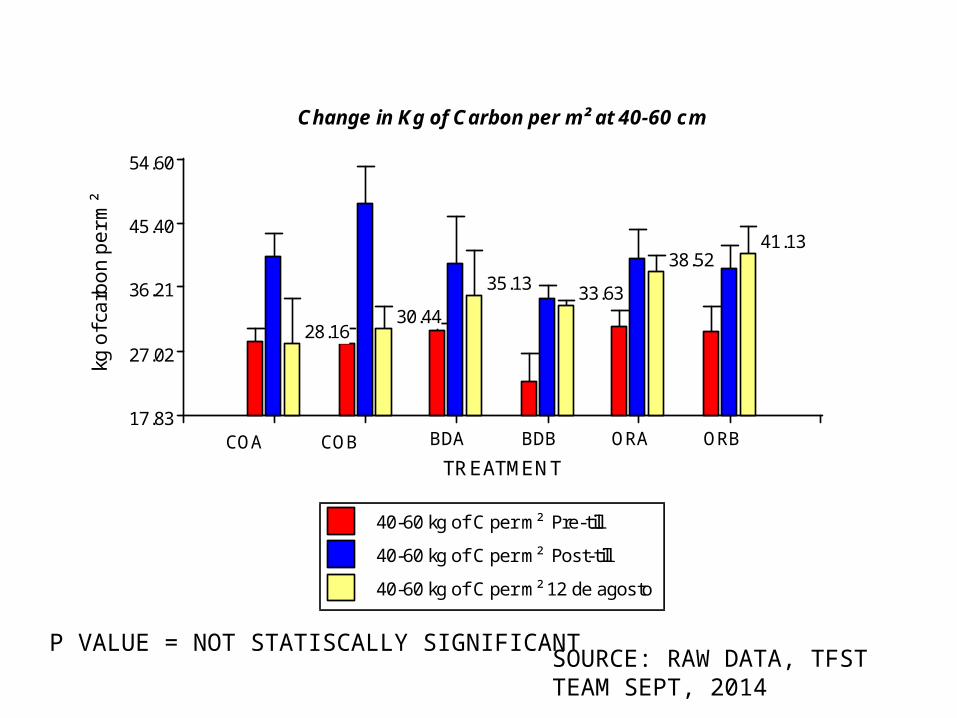
40-60 kg of C per m² Pre-till
40-60 kg of C per m² Post-till
40-60 kg of C per m² 12 de agosto
COA COB BDA BDB ORA ORB
TREATMENT
17.83
27.02
36.21
45.40
54.60
kg o
f ca
rbo
n p
er
m²
28.1630.44
35.13 33.63
38.5241.13
28.1630.44
35.13 33.63
38.5241.13
Change in Kg of Carbon per m² at 40-60 cm
40-60 kg of C per m² Pre-till
40-60 kg of C per m² Post-till
40-60 kg of C per m² 12 de agosto
SOURCE: RAW DATA, TFST TEAM SEPT, 2014
P VALUE = NOT STATISCALLY SIGNIFICANT
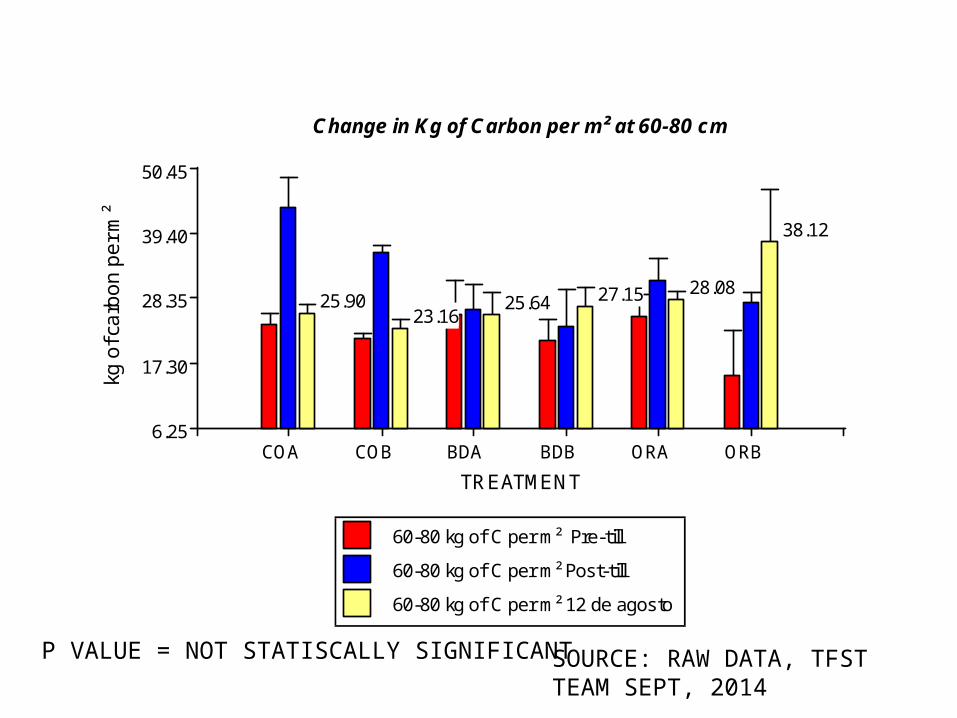
60-80 kg of C per m² Pre-till
60-80 kg of C per m² Post-till
60-80 kg of C per m² 12 de agosto
COA COB BDA BDB ORA ORB
TREATMENT
6.25
17.30
28.35
39.40
50.45
kg o
f ca
rbo
n p
er
m²
25.9023.16
25.64 27.15 28.08
38.12
25.9023.16
25.64 27.15 28.08
38.12
Change in Kg of Carbon per m² at 60-80 cm
60-80 kg of C per m² Pre-till
60-80 kg of C per m² Post-till
60-80 kg of C per m² 12 de agosto
SOURCE: RAW DATA, TFST TEAM SEPT, 2014
P VALUE = NOT STATISCALLY SIGNIFICANT

So let’s focus on the trends at the 60-80 cm
depth
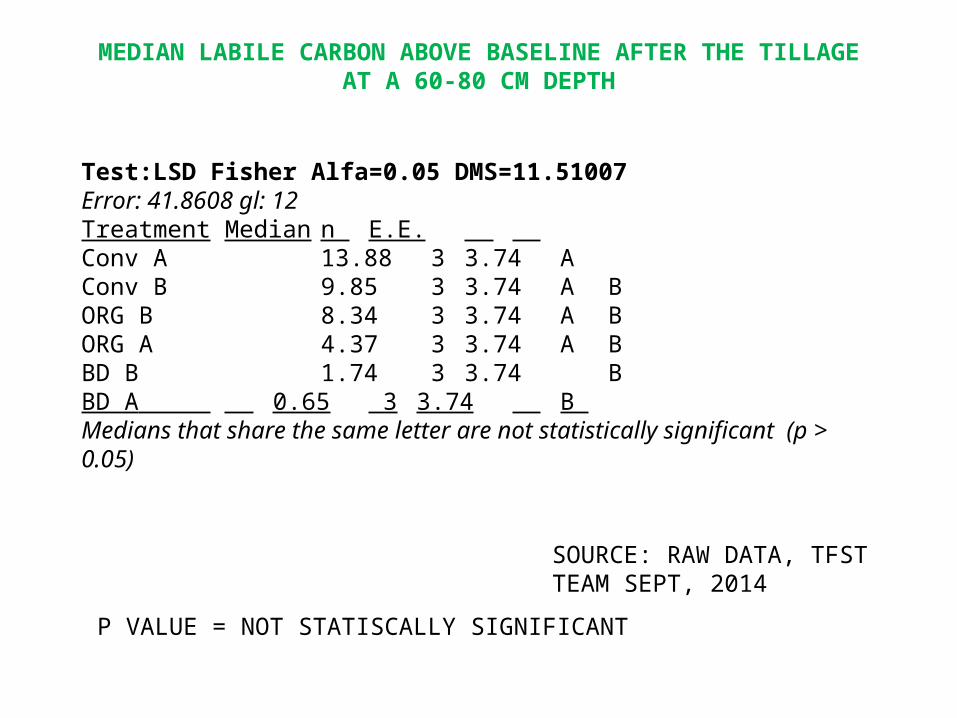
MEDIAN LABILE CARBON ABOVE BASELINE AFTER THE TILLAGE
AT A 60-80 CM DEPTH
SOURCE: RAW DATA, TFST TEAM SEPT, 2014
P VALUE = NOT STATISCALLY SIGNIFICANT
Test:LSD Fisher Alfa=0.05 DMS=11.51007Error: 41.8608 gl: 12Treatment Median n E.E. Conv A 13.88 3 3.74 A Conv B 9.85 3 3.74 A B ORG B 8.34 3 3.74 A B ORG A 4.37 3 3.74 A B BD B 1.74 3 3.74 B BD A 0.65 3 3.74 B Medians that share the same letter are not statistically significant (p > 0.05)
SOURCE: RAW DATA, TFST TEAM SEPT, 2014
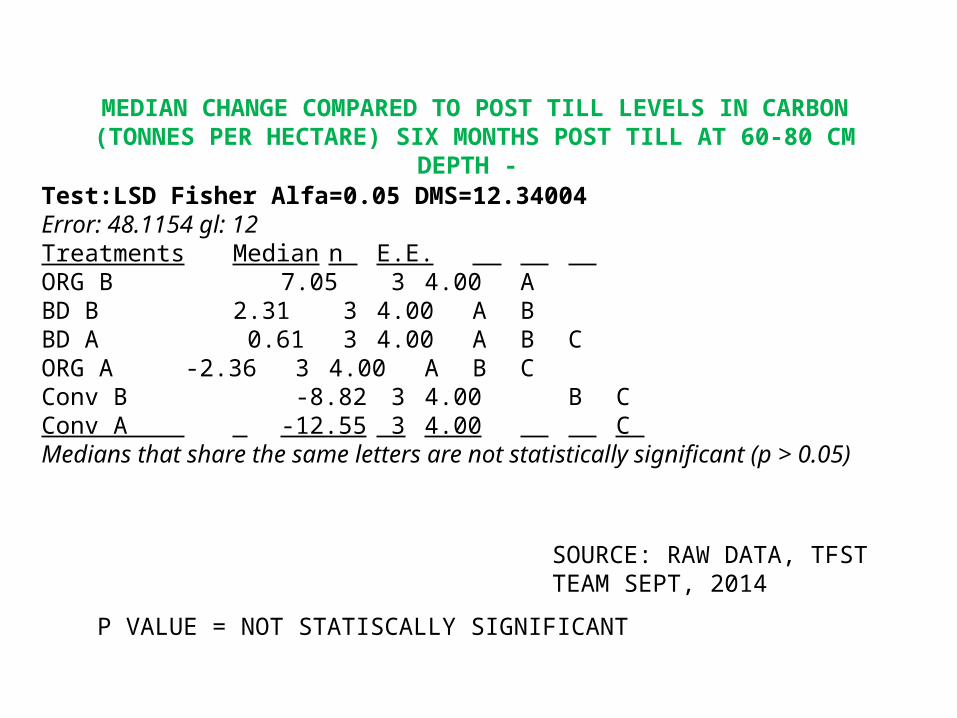
Test:LSD Fisher Alfa=0.05 DMS=12.34004Error: 48.1154 gl: 12Treatments Median n E.E. ORG B 7.05 3 4.00 A BD B 2.31 3 4.00 A B BD A 0.61 3 4.00 A B C ORG A -2.36 3 4.00 A B C Conv B -8.82 3 4.00 B C Conv A -12.55 3 4.00 C Medians that share the same letters are not statistically significant (p > 0.05)
MEDIAN CHANGE COMPARED TO POST TILL LEVELS IN CARBON (TONNES PER HECTARE) SIX MONTHS POST TILL AT
60-80 CM DEPTH -
P VALUE = NOT STATISCALLY SIGNIFICANT
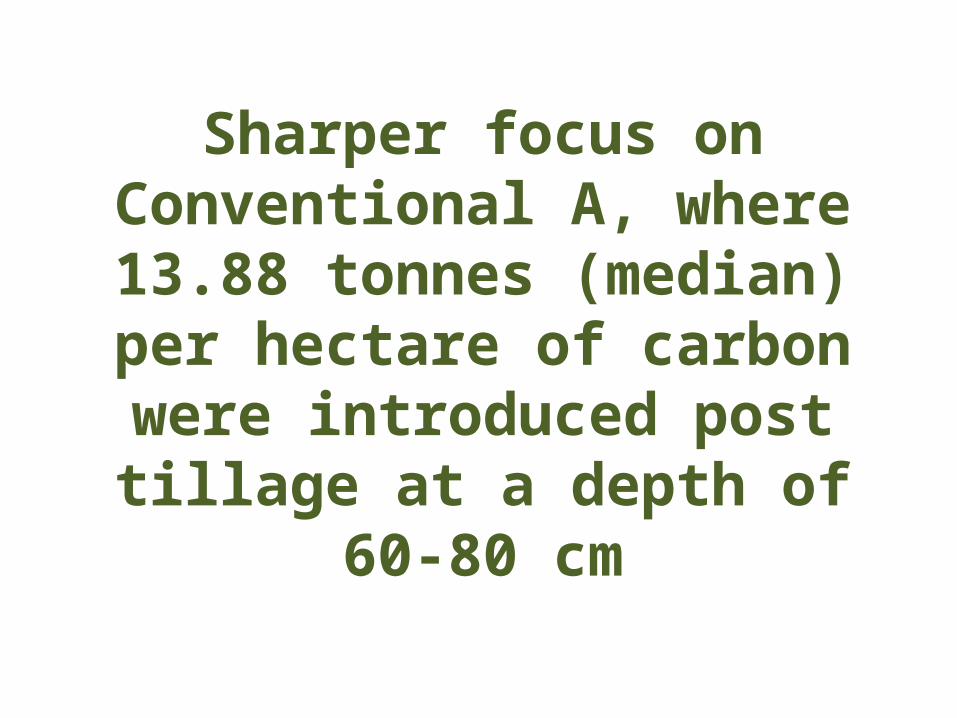
Sharper focus on Conventional A, where 13.88 tonnes (median) per
hectare of carbon were introduced post tillage at a depth
of 60-80 cm
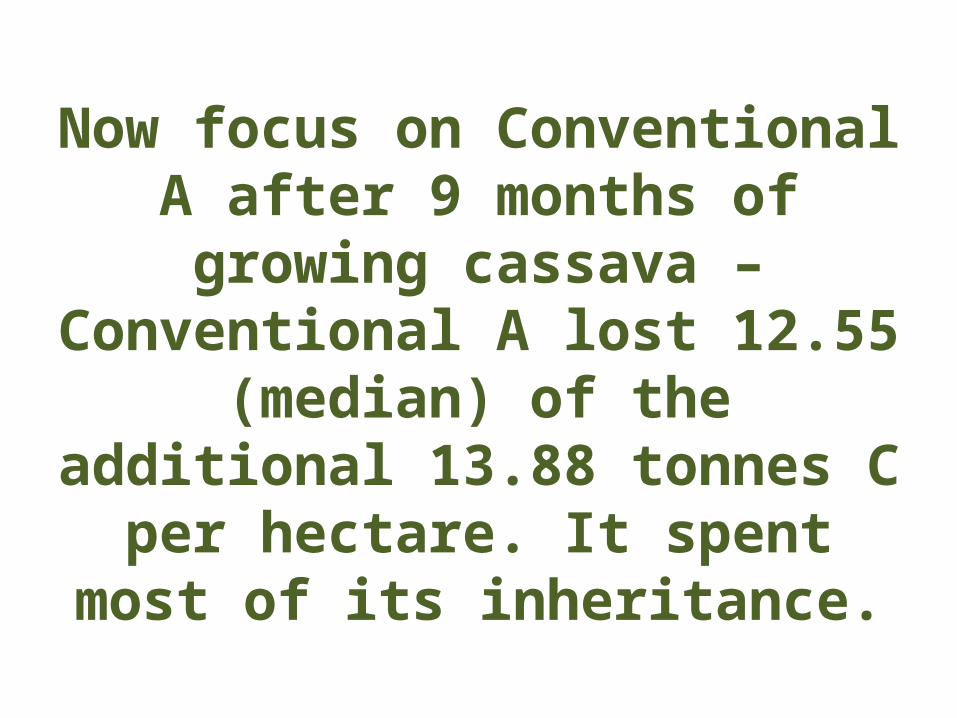
Now focus on Conventional A after 9 months of growing cassava
–Conventional A lost 12.55
(median) of the additional 13.88 tonnes C per hectare. It spent
most of its inheritance.
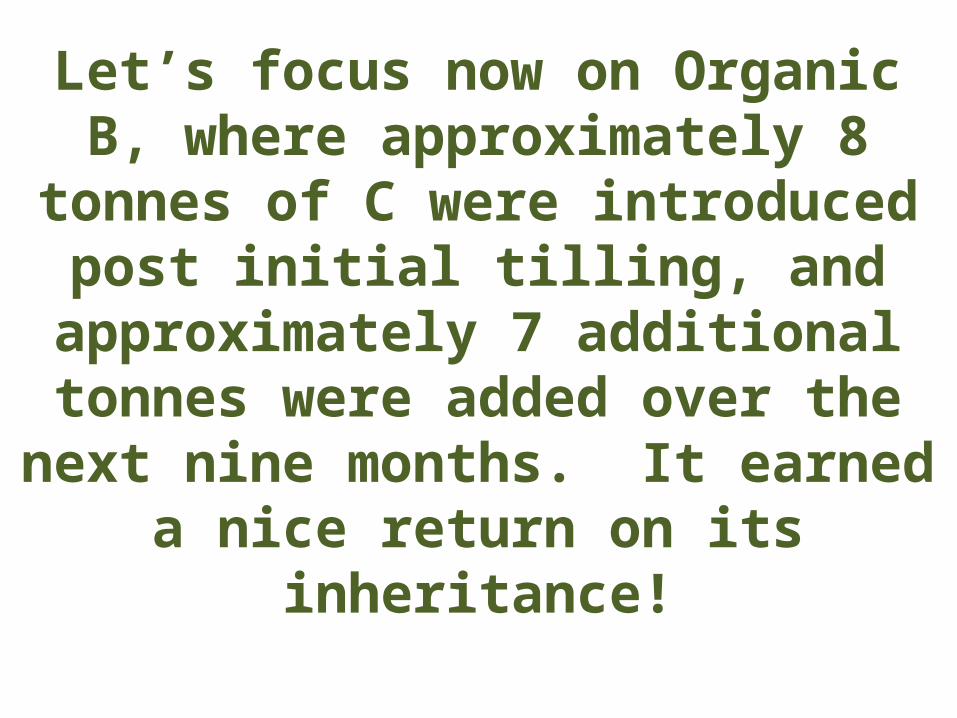
Let’s focus now on Organic B, where approximately 8 tonnes of C were introduced post initial tilling, and
approximately 7 additional tonnes were added over the next nine
months. It earned a nice return on its inheritance!
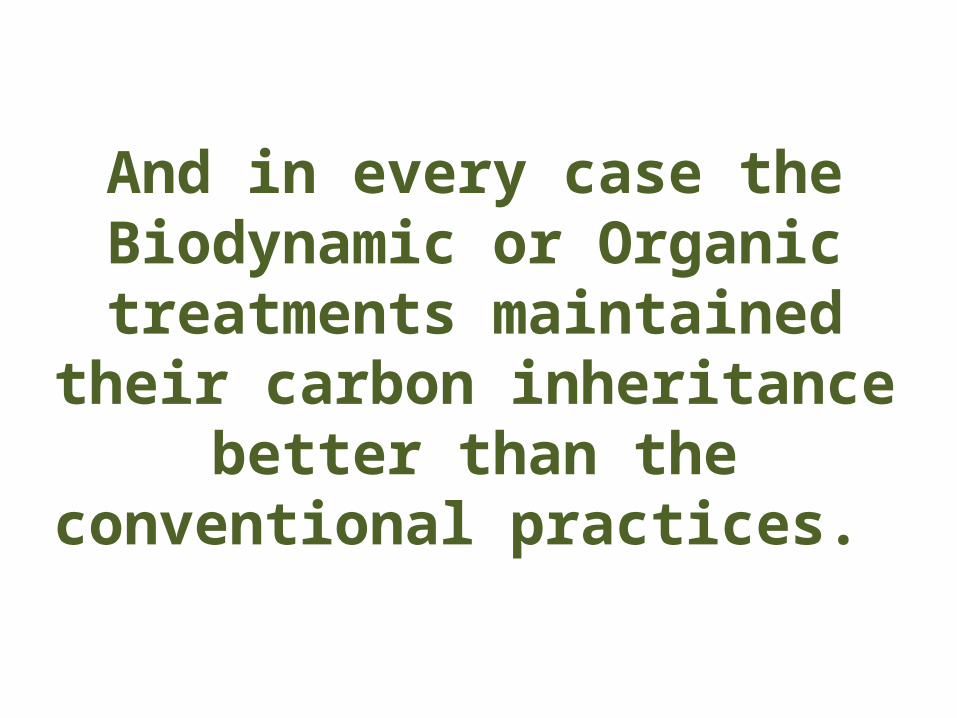
And in every case the Biodynamic or Organic treatments maintained
their carbon inheritance better than the conventional practices.
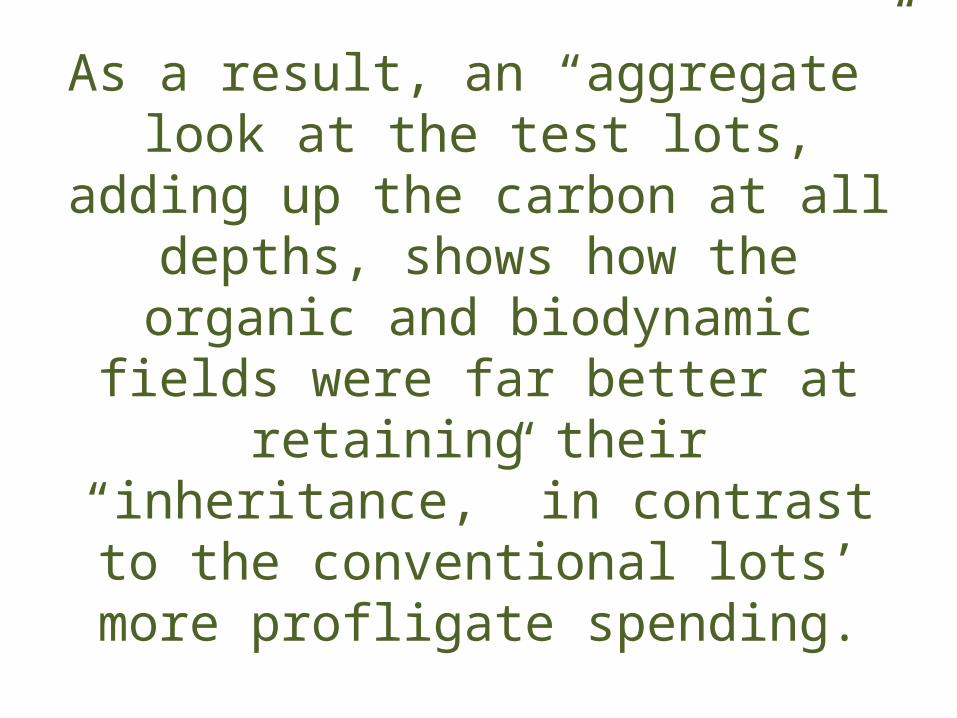
As a result, an “aggregate” look at the test lots, adding up the carbon
at all depths, shows how the organic and biodynamic fields were
far better at retaining their “inheritance,” in contrast to the
conventional lots’ more profligate spending.
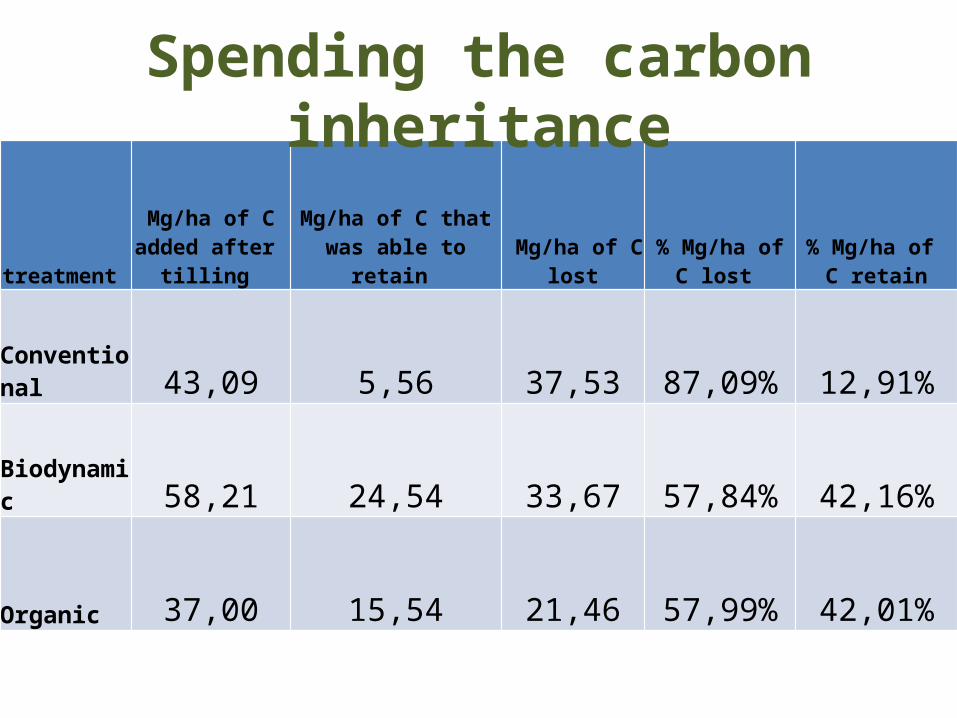
treatment
Mg/ha of C added after
tilling Mg/ha of C that was
able to retain Mg/ha of C
lost % Mg/ha of C
lost % Mg/ha of C
retain
Conventional 43,09 5,56 37,53 87,09% 12,91%
Biodynamic 58,21 24,54 33,67 57,84% 42,16%
Organic 37,00 15,54 21,46 57,99% 42,01%
Spending the carbon inheritance
These data do not achieve statistical significance with 95%
confidence. But they paint a picture of what is happening real time in a field that is transitioning
from being overgrazed for 65+ years to productive farming. This transitional moment is of critical
importance.

Join us!www.thecarbonunderground.org