Embed Size (px)
Citation preview

VISION AND INITIAL FEASIBILITY
ANALYSIS OF A RECARBONISED
FINNISH ENERGY SYSTEM
Michael Child & Christian Breyer
Lappeenranta, 07.06.2015
Results for EnergyPLAN simulations of 2050 Finland
Recarbonised Finnish Energy System
Christian Breyer► [email protected]
Michael Child► [email protected]
Agenda
Introduction to study
Methods
Main results
Interpretation of results
Questions and discussion
Recarbonised Finnish Energy System
Christian Breyer► [email protected]
Michael Child► [email protected]
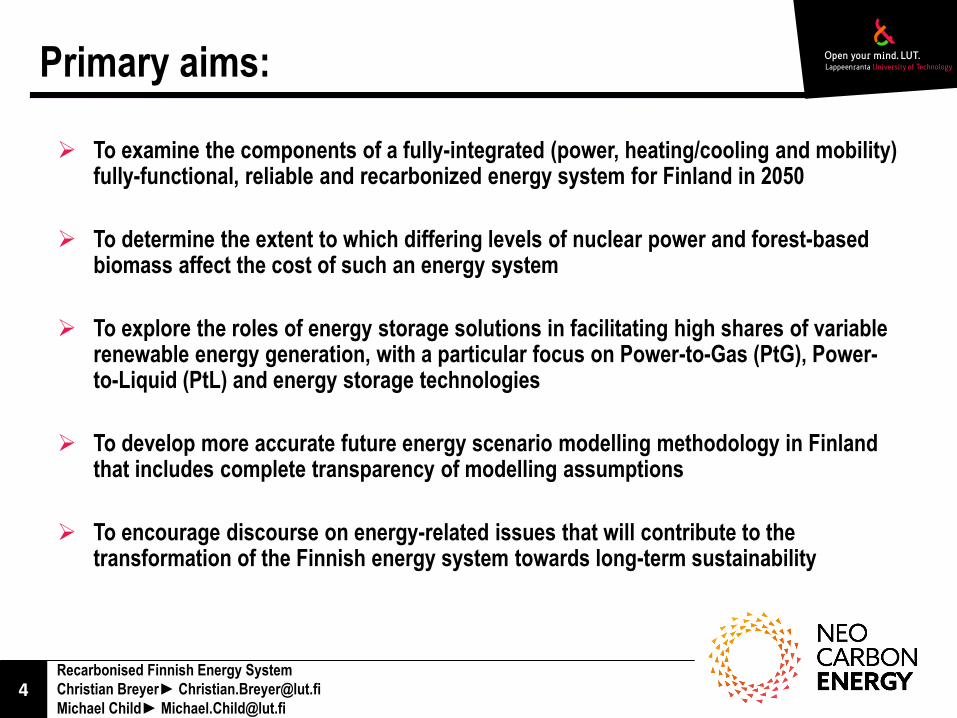
Primary aims:
To examine the components of a fully-integrated (power, heating/cooling and mobility) fully-functional, reliable and recarbonized energy system for Finland in 2050
To determine the extent to which differing levels of nuclear power and forest-based biomass affect the cost of such an energy system
To explore the roles of energy storage solutions in facilitating high shares of variable renewable energy generation, with a particular focus on Power-to-Gas (PtG), Power-to-Liquid (PtL) and energy storage technologies
To develop more accurate future energy scenario modelling methodology in Finland that includes complete transparency of modelling assumptions
To encourage discourse on energy-related issues that will contribute to the transformation of the Finnish energy system towards long-term sustainability
5Recarbonised Finnish Energy System
Christian Breyer► [email protected]
Michael Child► [email protected]
The uniqueness of our work
Only research to consider 100% RE scenarios for Finland
Only research to seek a virtually carbon-free energy system by 2050
Full integration of power, heating/cooling and mobility sectors
Greatly expanded roles for wind and solar energy
First study to explore large-scale energy storage solutions and Power-to-Gas (PtG)
System modelled on an hourly resolution using historical data for a calendar year
Full transparency of technical and economic assumptions
Results suggest that a 100% RE scenario is a highly competitive cost solution
compared to other test scenarios with increasing shares of nuclear power and a
Business As Usual (BAU) scenario

Recarbonised Finnish Energy System
Christian Breyer► [email protected]
Michael Child► [email protected]
Agenda
Introduction to study
Methods
Main results
Interpretation of results
Questions and discussion
Recarbonised Finnish Energy System
Christian Breyer► [email protected]
Michael Child► [email protected]
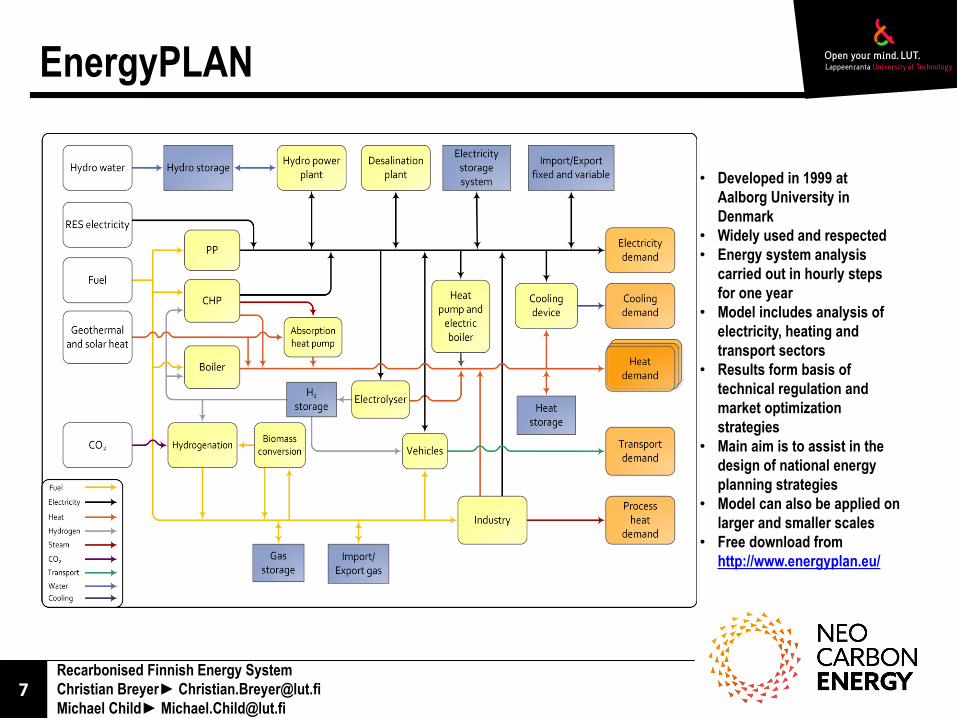
EnergyPLAN
• Developed in 1999 at
Aalborg University in
Denmark
• Widely used and respected
• Energy system analysis
carried out in hourly steps
for one year
• Model includes analysis of
electricity, heating and
transport sectors
• Results form basis of
technical regulation and
market optimization
strategies
• Main aim is to assist in the
design of national energy
planning strategies
• Model can also be applied on
larger and smaller scales
• Free download from
http://www.energyplan.eu/
Recarbonised Finnish Energy System
Christian Breyer► [email protected]
Michael Child► [email protected]
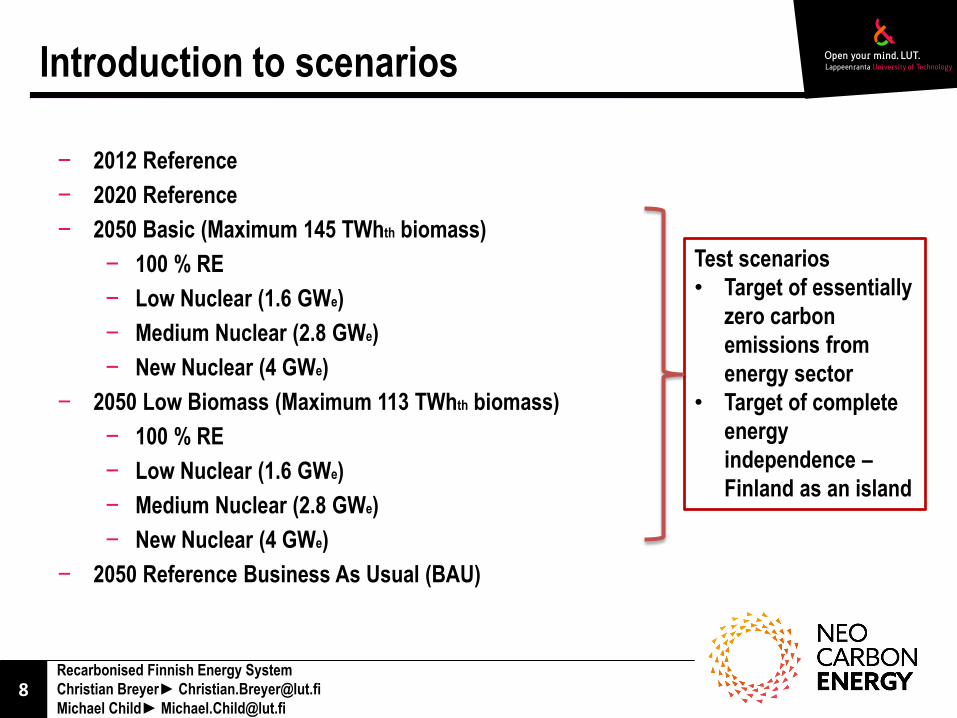
Introduction to scenarios
− 2012 Reference
− 2020 Reference
− 2050 Basic (Maximum 145 TWhth biomass)
− 100 % RE
− Low Nuclear (1.6 GWe)
− Medium Nuclear (2.8 GWe)
− New Nuclear (4 GWe)
− 2050 Low Biomass (Maximum 113 TWhth biomass)
− 100 % RE
− Low Nuclear (1.6 GWe)
− Medium Nuclear (2.8 GWe)
− New Nuclear (4 GWe)
− 2050 Reference Business As Usual (BAU)
Test scenarios
• Target of essentially
zero carbon
emissions from
energy sector
• Target of complete
energy
independence –
Finland as an island
Recarbonised Finnish Energy System
Christian Breyer► [email protected]
Michael Child► [email protected]
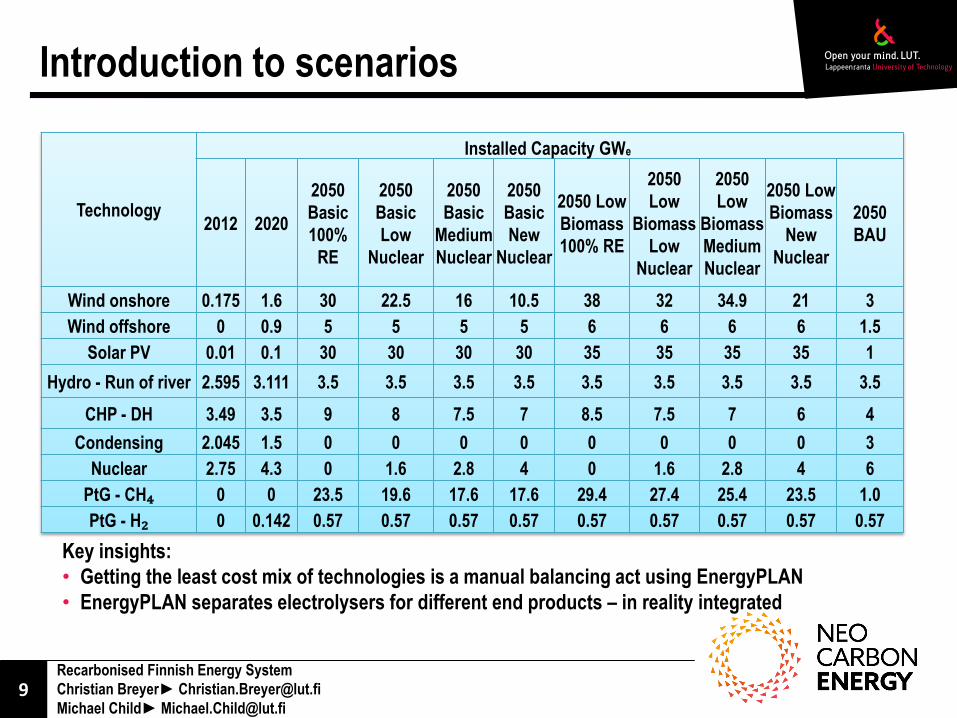
Introduction to scenarios
Key insights:
• Getting the least cost mix of technologies is a manual balancing act using EnergyPLAN
• EnergyPLAN separates electrolysers for different end products – in reality integrated
Technology
Installed Capacity GWe
2012 2020
2050
Basic
100%
RE
2050
Basic
Low
Nuclear
2050
Basic
Medium
Nuclear
2050
Basic
New
Nuclear
2050 Low
Biomass
100% RE
2050
Low
Biomass
Low
Nuclear
2050
Low
Biomass
Medium
Nuclear
2050 Low
Biomass
New
Nuclear
2050
BAU
Wind onshore 0.175 1.6 30 22.5 16 10.5 38 32 34.9 21 3
Wind offshore 0 0.9 5 5 5 5 6 6 6 6 1.5
Solar PV 0.01 0.1 30 30 30 30 35 35 35 35 1
Hydro - Run of river 2.595 3.111 3.5 3.5 3.5 3.5 3.5 3.5 3.5 3.5 3.5
CHP - DH 3.49 3.5 9 8 7.5 7 8.5 7.5 7 6 4
Condensing 2.045 1.5 0 0 0 0 0 0 0 0 3
Nuclear 2.75 4.3 0 1.6 2.8 4 0 1.6 2.8 4 6
PtG - CH₄ 0 0 23.5 19.6 17.6 17.6 29.4 27.4 25.4 23.5 1.0
PtG - H₂ 0 0.142 0.57 0.57 0.57 0.57 0.57 0.57 0.57 0.57 0.57
Recarbonised Finnish Energy System
Christian Breyer► [email protected]
Michael Child► [email protected]
Agenda
Introduction to study
Methods
Main results
Interpretation of results
Questions and discussion
Recarbonised Finnish Energy System
Christian Breyer► [email protected]
Michael Child► [email protected]
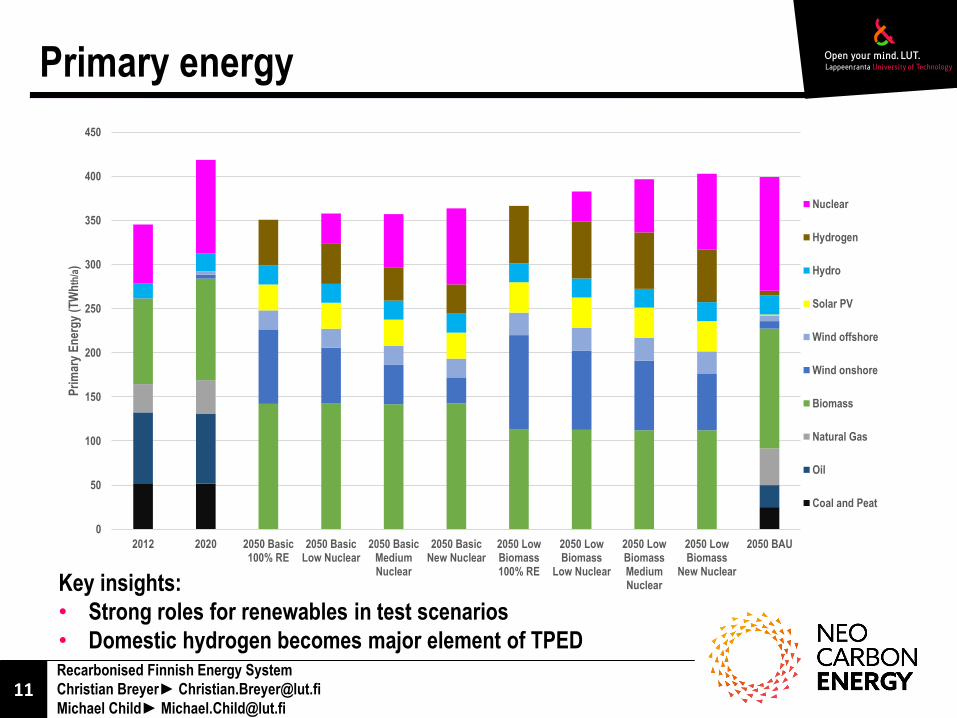
Primary energy
Key insights:
• Strong roles for renewables in test scenarios
• Domestic hydrogen becomes major element of TPED
0
50
100
150
200
250
300
350
400
450
2012 2020 2050 Basic100% RE
2050 BasicLow Nuclear
2050 BasicMediumNuclear
2050 BasicNew Nuclear
2050 LowBiomass100% RE
2050 LowBiomass
Low Nuclear
2050 LowBiomassMediumNuclear
2050 LowBiomass
New Nuclear
2050 BAU
Pri
mar
y E
ner
gy
(TW
hth
/a)
Nuclear
Hydrogen
Hydro
Solar PV
Wind offshore
Wind onshore
Biomass
Natural Gas
Oil
Coal and Peat

Recarbonised Finnish Energy System
Christian Breyer► [email protected]
Michael Child► [email protected]
Electricity production
Key insights:
• Electricity has increased role in energy system due to its flexibility
• Electricity from wind and solar PV become backbone of system
-10
40
90
140
190
240
2012 2020 2050 Basic100% RE
2050 BasicLow
Nuclear
2050 BasicMediumNuclear
2050 BasicNew
Nuclear
2050 LowBiomass100% RE
2050 LowBiomass
LowNuclear
2050 LowBiomassMediumNuclear
2050 LowBiomass
NewNuclear
2050 BAU
Ele
ctri
city
Pro
du
ctio
n (
TW
he/
a)
Nuclear
Condensing
CHP-Industry
CHP-District Heating
Hydro - Run of river
Solar PV
Wind onshore
Wind offshore
Net import/export orcurtailment
Recarbonised Finnish Energy System
Christian Breyer► [email protected]
Michael Child► [email protected]
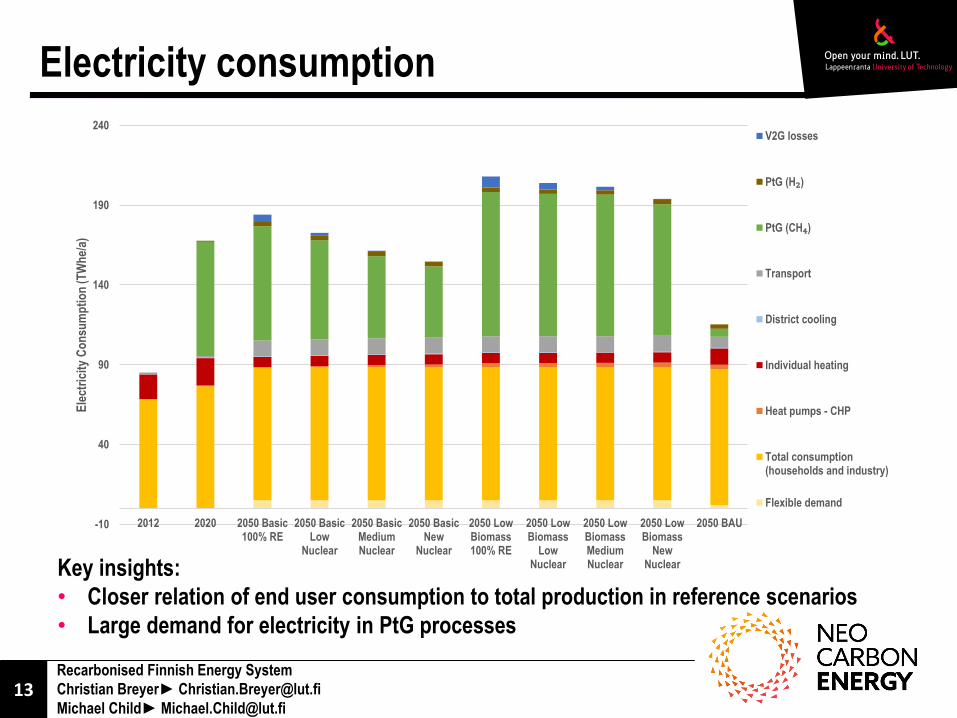
Electricity consumption
Key insights:
• Closer relation of end user consumption to total production in reference scenarios
• Large demand for electricity in PtG processes
-10
40
90
140
190
240
2012 2020 2050 Basic100% RE
2050 BasicLow
Nuclear
2050 BasicMediumNuclear
2050 BasicNew
Nuclear
2050 LowBiomass100% RE
2050 LowBiomass
LowNuclear
2050 LowBiomassMediumNuclear
2050 LowBiomass
NewNuclear
2050 BAU
Ele
ctri
city
Co
nsu
mp
tio
n (
TW
he/
a)
V2G losses
PtG (H₂)
PtG (CH₄)
Transport
District cooling
Individual heating
Heat pumps - CHP
Total consumption(households and industry)
Flexible demand

Recarbonised Finnish Energy System
Christian Breyer► [email protected]
Michael Child► [email protected]
Total annual costs
Key insights:
• Stranded investments in nuclear/ coal power stations not accounted (higher WACC?*)
• Test scenarios have high level of investment
• Reference scenarios have high level of fuel and CO₂ costs (risk of high CO2 price**)
* WACC 7% ► 15%
BAU: + 3 b€
New Nuclear: + 2 b€
** CO2 price 75 ► 150 €/t
BAU: + 1.9 b€
rather likely according to Luderer G. et al.,
Environ.Res.Lett., 8, 034033, 2013
0
5000
10000
15000
20000
25000
30000
2012 2020 2050Basic
100% RE
2050BasicLow
Nuclear
2050Basic
MediumNuclear
2050BasicNew
Nuclear
2050 LowBiomass100% RE
2050 LowBiomass
LowNuclear
2050 LowBiomassMediumNuclear
2050 LowBiomass
NewNuclear
2050 BAU
To
tal a
nn
ual
co
sts
(M€/
a)
Variable costs - other
Variable costs - CO₂
Variable costs - fuel
Fixed operation costs
Annualized investment costs

Recarbonised Finnish Energy System
Christian Breyer► [email protected]
Michael Child► [email protected]
Levelized cost of electricity
* Includes 40% electrical efficiency + 50% thermal efficiency; ** final value is levelized cost of energy (incl. heat)
Key insights:
• Despite higher LCOE, offshore wind distribution favourable to energy system and may lead to overall cost
reduction in new simulations
• Low full load hours in thermal plants lead to high LCOE
For 2050
Basic
Medium
Nuclear
Scenario
UnitsWind -
onshore
Wind -
offshore
Solar PV
- ground
mounted
Solar PV -
rooftop
Hydropower
- Run of the
river
CHP
plants
Nuclear
plants
PtG
Methane
Capex €/kWe 900 1800 300 400 3060 820 6500 870
Opex_fixed % of capex 4.51 % 4.55 % 2.00 % 1.00 % 4.00 % 3.66 % 3.50 % 3.30 %
Opex-var €/MWhe 0 0 0 0 0 2.7 0 0
Fuel €/MWhe 0 0 0 0 0 27.288 5.4 40
Efficiency % - - - - - 90 %* 37 % 51 %
Lifetime Years 30 30 40 40 50 25 40 30
Full load
hoursHours 2816 4280 982 982 6123 1124 7963 2667
WACC % 7 % 7 % 7 % 7 % 7 % 7 % 7 % 7 %
crf %year¯¹ 8.06 % 8.06 % 7.50 % 7.50 % 7.25 % 8.58 % 7.50 % 8.06 %
LCOE € cents/kWhe 4.0 5.3 2.9 3.5 5.6 12.2** 10.4 11.5**
16Recarbonised Finnish Energy System
Christian Breyer► [email protected]
Michael Child► [email protected]
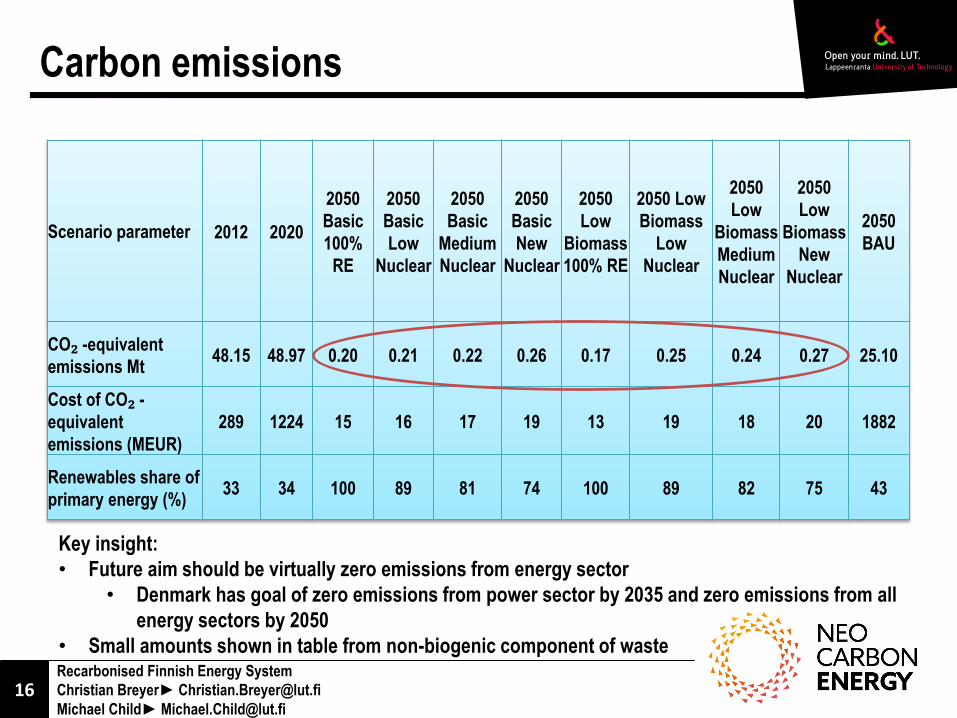
Carbon emissions
Scenario parameter 2012 2020
2050
Basic
100%
RE
2050
Basic
Low
Nuclear
2050
Basic
Medium
Nuclear
2050
Basic
New
Nuclear
2050
Low
Biomass
100% RE
2050 Low
Biomass
Low
Nuclear
2050
Low
Biomass
Medium
Nuclear
2050
Low
Biomass
New
Nuclear
2050
BAU
CO₂ -equivalent
emissions Mt48.15 48.97 0.20 0.21 0.22 0.26 0.17 0.25 0.24 0.27 25.10
Cost of CO₂ -
equivalent
emissions (MEUR)
289 1224 15 16 17 19 13 19 18 20 1882
Renewables share of
primary energy (%)33 34 100 89 81 74 100 89 82 75 43
Key insight:
• Future aim should be virtually zero emissions from energy sector
• Denmark has goal of zero emissions from power sector by 2035 and zero emissions from all
energy sectors by 2050
• Small amounts shown in table from non-biogenic component of waste

Recarbonised Finnish Energy System
Christian Breyer► [email protected]
Michael Child► [email protected]
Agenda
Introduction to study
Methods
Main results
Interpretation of results
Questions and discussion

Recarbonised Finnish Energy System
Christian Breyer► [email protected]
Michael Child► [email protected]
Interpretation of results
A 100% renewable energy system seems possible for Finland, given the assumptions made in this study
The 100% RE scenarios are highly cost competitive
High level of energy independence seems achievable
Prominent roles of renewable energy and energy storage solutions should be considered in all future modelling
Opportunities exist for increased domestic investment and RE-based employment
Flexibility should be a defining feature of future energy systems
100% RE should be an equal partner in all future discourse regarding the Finnish energy system
Further study is needed related to how people will choose to live, how they will perceive risk and the role of energy in their lives (Futures Research) in order to hone the technical requirements of the energy system used in modelling
Recarbonised Finnish Energy System
Christian Breyer► [email protected]
Michael Child► [email protected]
Agenda
Introduction to study
Methods
Main results
Interpretation of results
Questions and discussion
20Recarbonised Finnish Energy System
Christian Breyer► [email protected]
Michael Child► [email protected]
Questions of comments?
NEO-CARBON Energy project is one of the Tekes strategy research openings
and the project is carried out in cooperation with Technical Research Centre of
Finland VTT Ltd, Lappeenranta University of Technology (LUT) and University
of Turku, Finland Futures Research Centre.
Thank you
FURTHER INFORMATION
Recarbonised Finnish Energy System
Christian Breyer► [email protected]
Michael Child► [email protected]
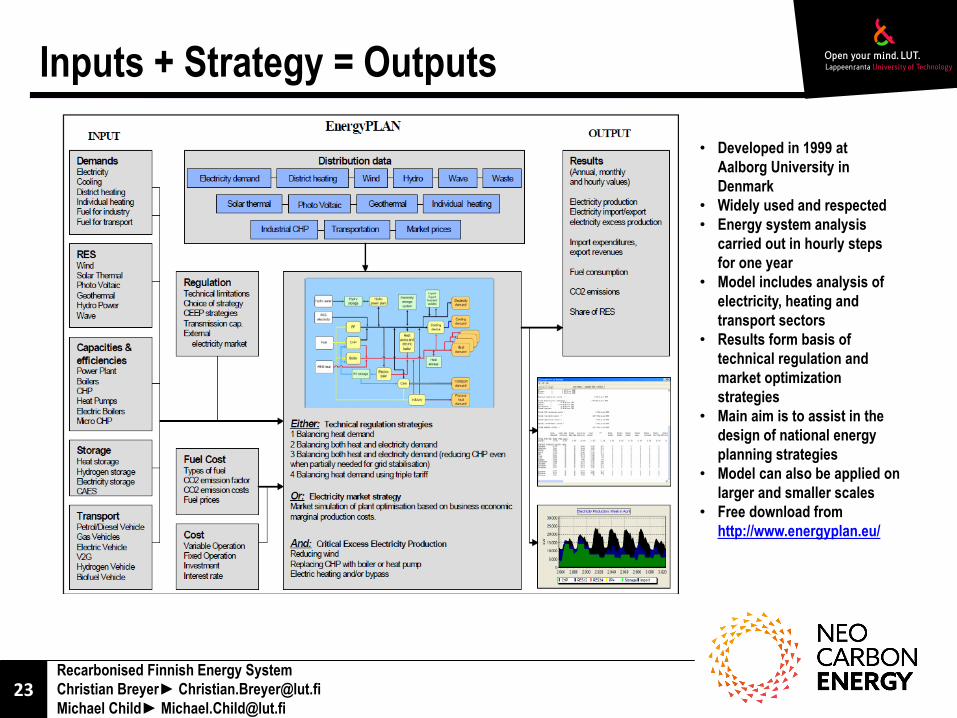
Inputs + Strategy = Outputs
• Developed in 1999 at
Aalborg University in
Denmark
• Widely used and respected
• Energy system analysis
carried out in hourly steps
for one year
• Model includes analysis of
electricity, heating and
transport sectors
• Results form basis of
technical regulation and
market optimization
strategies
• Main aim is to assist in the
design of national energy
planning strategies
• Model can also be applied on
larger and smaller scales
• Free download from
http://www.energyplan.eu/
Recarbonised Finnish Energy System
Christian Breyer► [email protected]
Michael Child► [email protected]
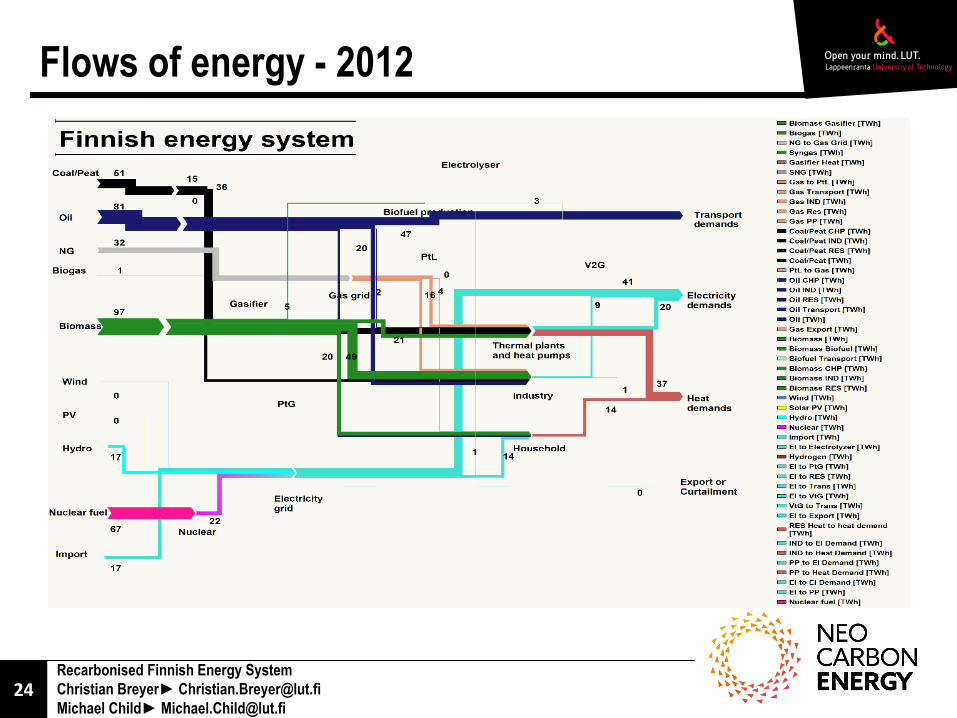
Flows of energy - 2012
Recarbonised Finnish Energy System
Christian Breyer► [email protected]
Michael Child► [email protected]
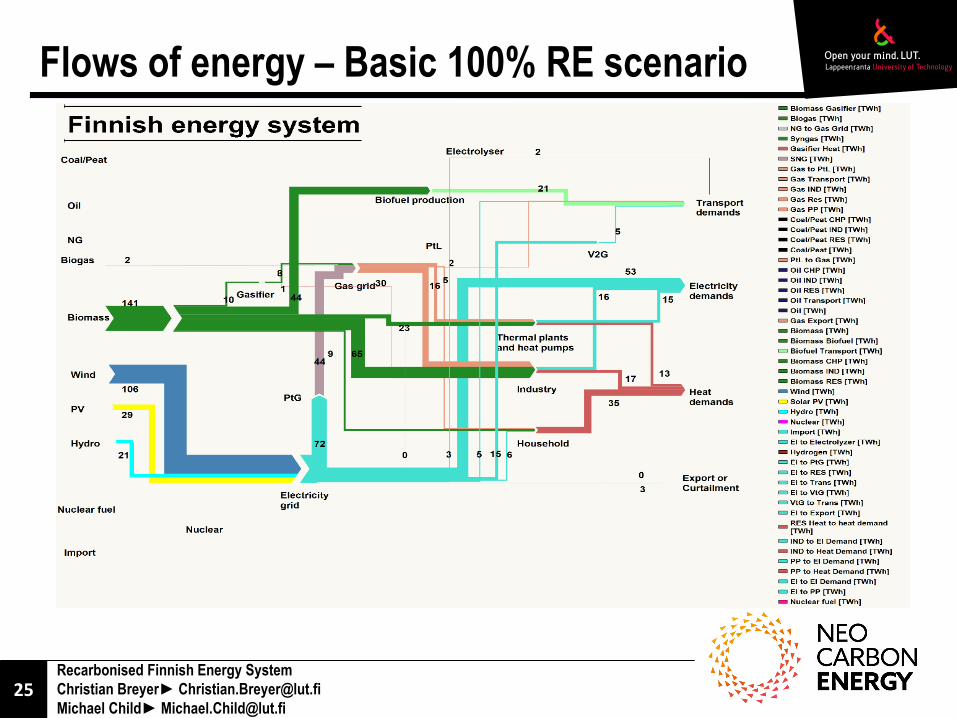
Flows of energy – Basic 100% RE scenario

Recarbonised Finnish Energy System
Christian Breyer► [email protected]
Michael Child► [email protected]
Flows of energy – Low Biomass 100% RE scenario
Recarbonised Finnish Energy System
Christian Breyer► [email protected]
Michael Child► [email protected]
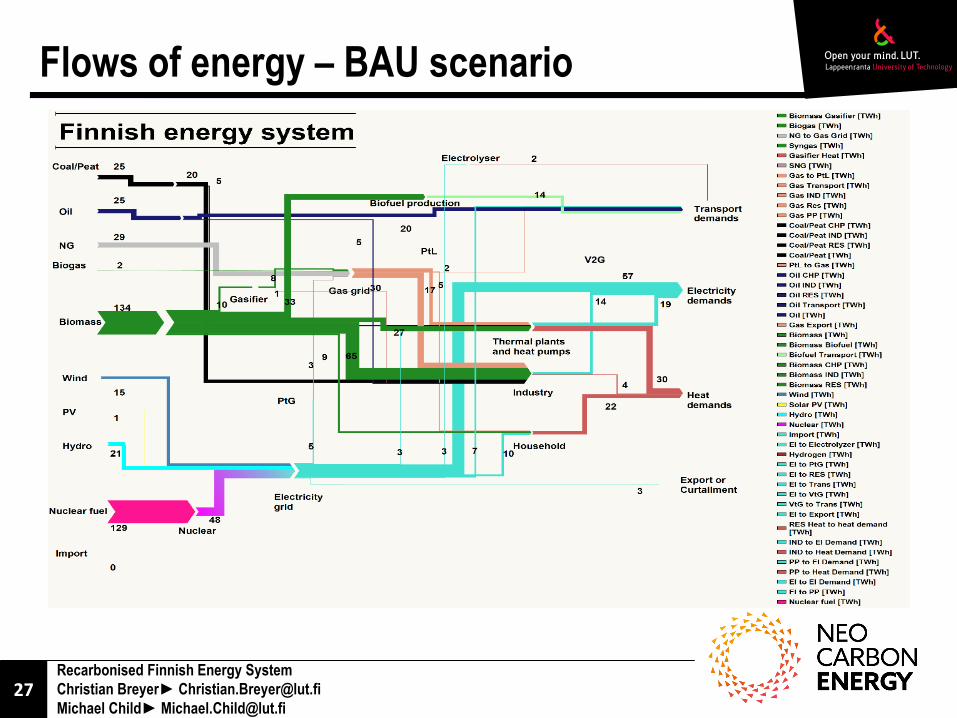
Flows of energy – BAU scenario

28Recarbonised Finnish Energy System
Christian Breyer► [email protected]
Michael Child► [email protected]
Breakdown of annualized investment costs
0
2000
4000
6000
8000
10000
12000
14000
16000
18000
2012 2020 2050 Basic100% RE
2050 Basic LowNuclear
2050 BasicMediumNuclear
2050 Basic NewNuclear
2050 LowBiomass 100%
RE
2050 LowBiomass Low
Nuclear
2050 LowBiomassMediumNuclear
2050 LowBiomass New
Nuclear
2050 BAU
Small CHP units Large CHP units Large Power Plants Wind Wind offshore Photovoltaic
River of hydro Nuclear BioJPPlant CO2Hydrogenation Chemical Sythesis Electricity grid
District heating grid District heating substations EV batteries EV charging station Individual oil boilers Individual NG boilers
Individual biomass boilers Inidividual heat pumps Individual electric heat Gas grid Other
29Recarbonised Finnish Energy System
Christian Breyer► [email protected]
Michael Child► [email protected]
Introduction to scenarios
Category
Full load hours
2012 2020
2050
Basic
100%
RE
2050
Basic
Low
Nuclear
2050 Basic
Medium
Nuclear
2050
Basic
New
Nuclear
2050 Low
Biomass
100% RE
2050
Low
Biomass
Low
Nuclear
2050 Low
Biomass
Medium
Nuclear
2050 Low
Biomass
New
Nuclear
2050 BAU
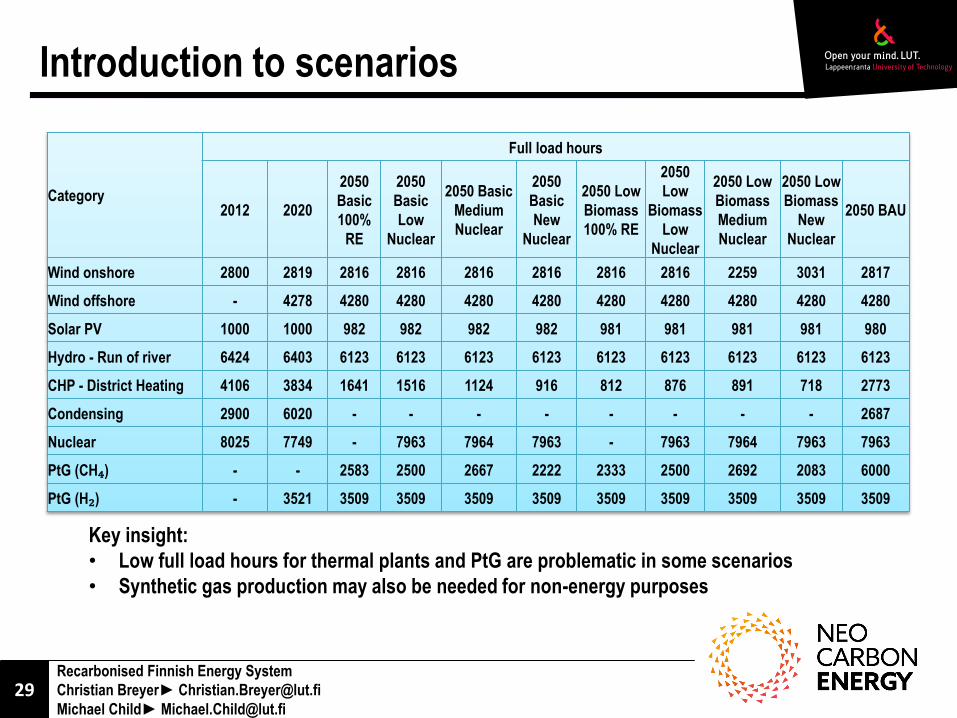
Wind onshore 2800 2819 2816 2816 2816 2816 2816 2816 2259 3031 2817
Wind offshore - 4278 4280 4280 4280 4280 4280 4280 4280 4280 4280
Solar PV 1000 1000 982 982 982 982 981 981 981 981 980
Hydro - Run of river 6424 6403 6123 6123 6123 6123 6123 6123 6123 6123 6123
CHP - District Heating 4106 3834 1641 1516 1124 916 812 876 891 718 2773
Condensing 2900 6020 - - - - - - - - 2687
Nuclear 8025 7749 - 7963 7964 7963 - 7963 7964 7963 7963
PtG (CH₄) - - 2583 2500 2667 2222 2333 2500 2692 2083 6000
PtG (H₂) - 3521 3509 3509 3509 3509 3509 3509 3509 3509 3509
Key insight:
• Low full load hours for thermal plants and PtG are problematic in some scenarios
• Synthetic gas production may also be needed for non-energy purposes
30Recarbonised Finnish Energy System
Christian Breyer► [email protected]
Michael Child► [email protected]
Introduction to scenarios
− Cost of bioenergy is dependent on the form
− Waste is assumed to be free
− Agricultural residues have little market value currently and will likely remain half
the price of energy wood
− Estimated biomass price is 22 €/MWh in 2050 (plus 5-11 €/MWh handling)
− Stumpage price currently 2 €/MWh
− Price to customer currently 9-23 €/MWh*
− Stricter sustainability criteria could raise this to about 50 €/MWh*
− Energy wood price highly unlikely to exceed 50 €/MWh in 2050
− Likely to be convergence between the price of energy wood and the price of
pulpwood (stumpage price currently about 12 €/MWh)
*Sikkema et al. Mobilization of biomass for energy from boreal forests in Finland & Russia under present sustainable forest management certification and new sustainability requirements for solid biofuels. Biomass and Bioenergy 71 (2014) 23-26

31Recarbonised Finnish Energy System
Christian Breyer► [email protected]
Michael Child► [email protected]
Introduction to scenarios
2012 (TWhth)
2050(TWhth)
Biomass for heat and power 36 68
Biomass for small-scale housing 18 18
Industrial liquors for energy generation
38 38
Agricultural residues for energy generation
n.a. 21
Total biomass 92 145
• 2050 assumptions based on 88 Mm³ annual
harvesting –i.e., less than current annual
increment
• Low biomass scenarios developed which utilize
less than current amount of forest biomass
1 Mm³ = 2 TWh = 7.2 PJ
32Recarbonised Finnish Energy System
Christian Breyer► [email protected]
Michael Child► [email protected]
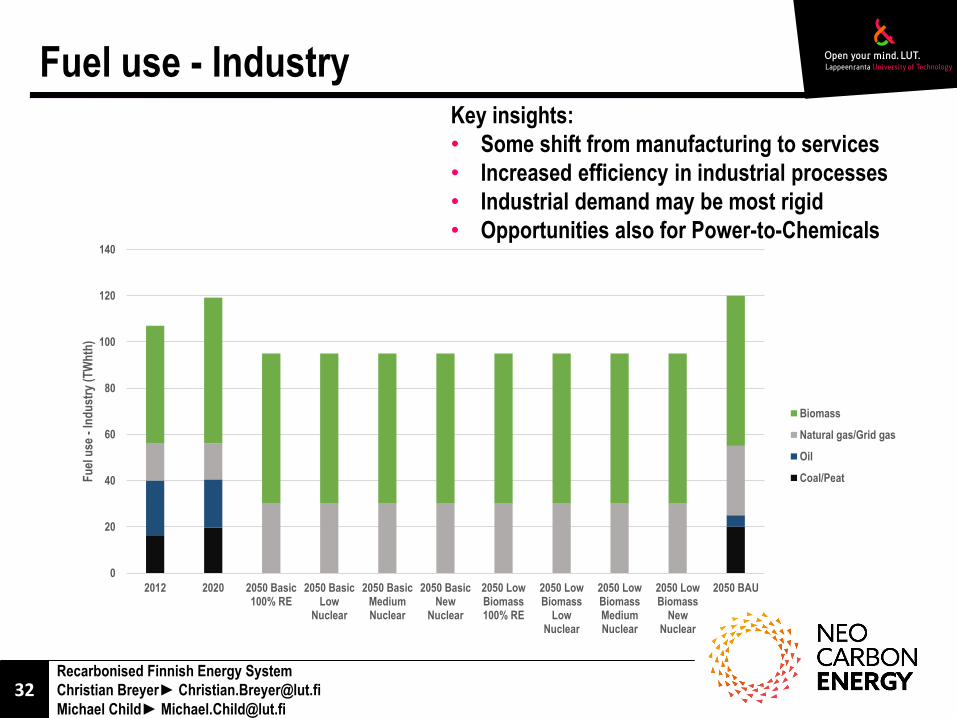
Fuel use - IndustryKey insights:
• Some shift from manufacturing to services
• Increased efficiency in industrial processes
• Industrial demand may be most rigid
• Opportunities also for Power-to-Chemicals
0
20
40
60
80
100
120
140
2012 2020 2050 Basic100% RE
2050 BasicLow
Nuclear
2050 BasicMediumNuclear
2050 BasicNew
Nuclear
2050 LowBiomass100% RE
2050 LowBiomass
LowNuclear
2050 LowBiomassMediumNuclear
2050 LowBiomass
NewNuclear
2050 BAU
Fu
el u
se -
Ind
ust
ry (
TW
hth
)
Biomass
Natural gas/Grid gas
Oil
Coal/Peat
33Recarbonised Finnish Energy System
Christian Breyer► [email protected]
Michael Child► [email protected]
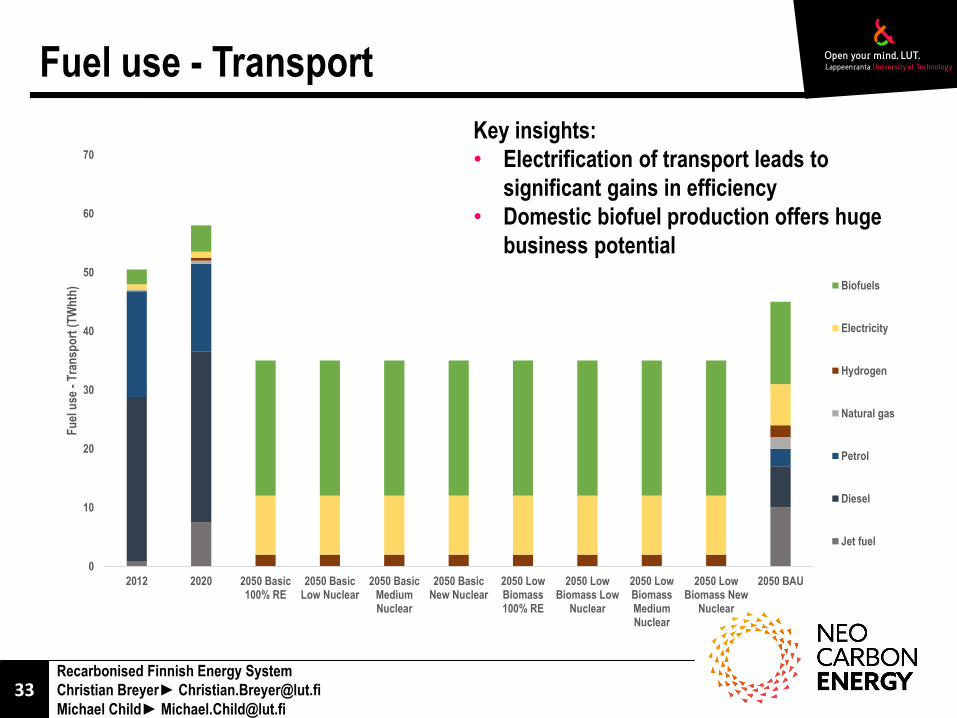
Fuel use - Transport
Key insights:
• Electrification of transport leads to
significant gains in efficiency
• Domestic biofuel production offers huge
business potential
0
10
20
30
40
50
60
70
2012 2020 2050 Basic100% RE
2050 BasicLow Nuclear
2050 BasicMediumNuclear
2050 BasicNew Nuclear
2050 LowBiomass100% RE
2050 LowBiomass Low
Nuclear
2050 LowBiomassMediumNuclear
2050 LowBiomass New
Nuclear
2050 BAU
Fu
el u
se -
Tra
nsp
ort
(T
Wh
th) Biofuels
Electricity
Hydrogen
Natural gas
Petrol
Diesel
Jet fuel
35Recarbonised Finnish Energy System
Christian Breyer► [email protected]
Michael Child► [email protected]
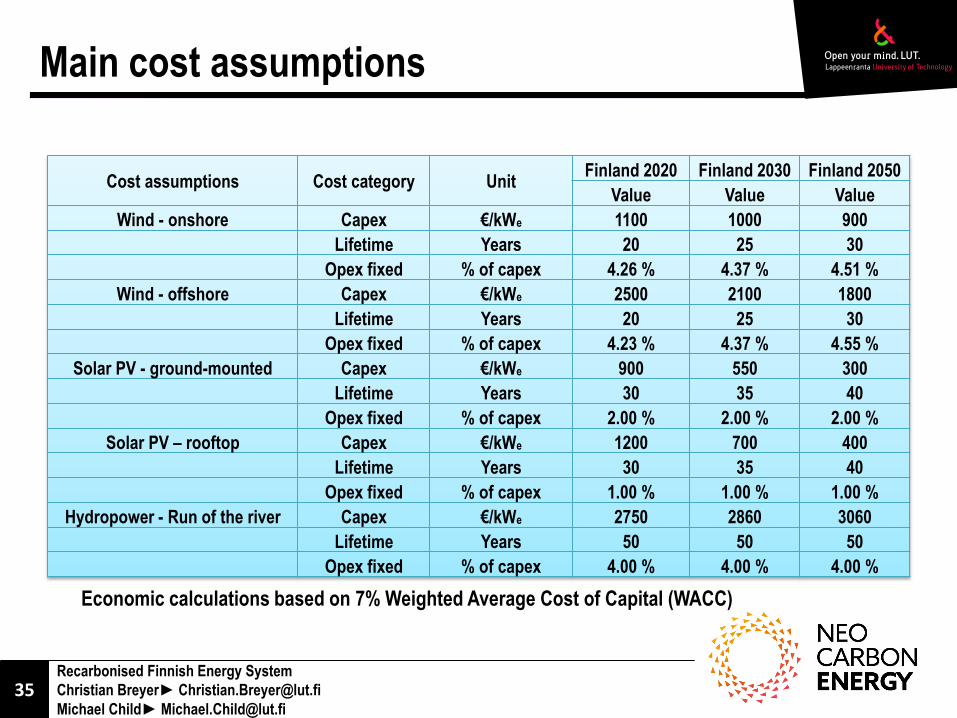
Main cost assumptions
Cost assumptions Cost category UnitFinland 2020 Finland 2030 Finland 2050
Value Value Value
Wind - onshore Capex €/kWe 1100 1000 900
Lifetime Years 20 25 30
Opex fixed % of capex 4.26 % 4.37 % 4.51 %
Wind - offshore Capex €/kWe 2500 2100 1800
Lifetime Years 20 25 30
Opex fixed % of capex 4.23 % 4.37 % 4.55 %
Solar PV - ground-mounted Capex €/kWe 900 550 300
Lifetime Years 30 35 40
Opex fixed % of capex 2.00 % 2.00 % 2.00 %
Solar PV – rooftop Capex €/kWe 1200 700 400
Lifetime Years 30 35 40
Opex fixed % of capex 1.00 % 1.00 % 1.00 %
Hydropower - Run of the river Capex €/kWe 2750 2860 3060
Lifetime Years 50 50 50
Opex fixed % of capex 4.00 % 4.00 % 4.00 %
Economic calculations based on 7% Weighted Average Cost of Capital (WACC)

36Recarbonised Finnish Energy System
Christian Breyer► [email protected]
Michael Child► [email protected]
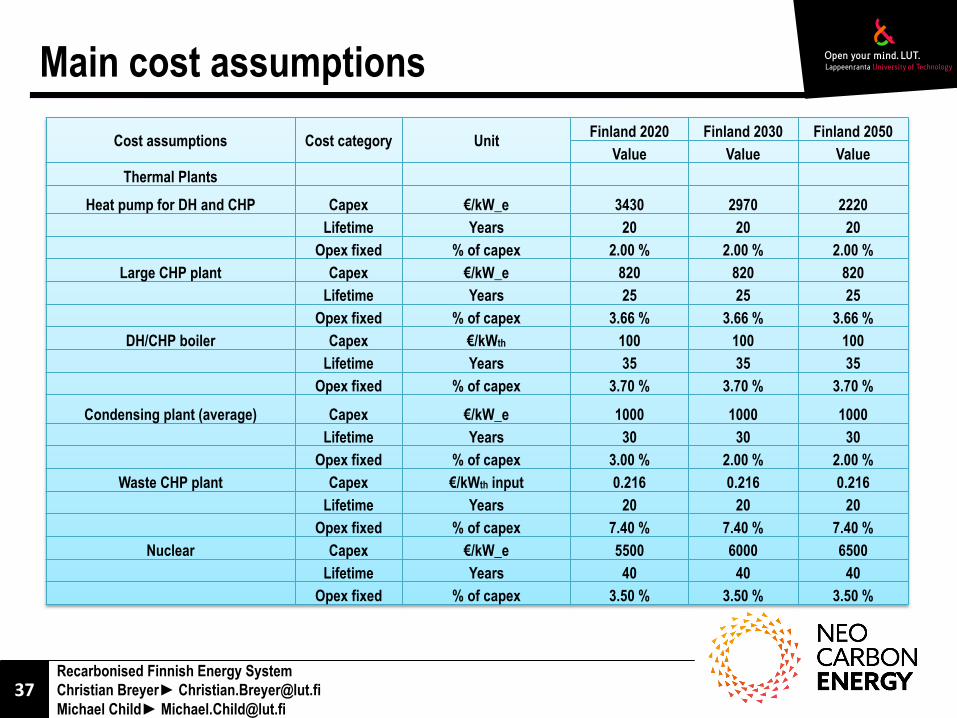
Main cost assumptions
Cost assumptions Cost category UnitFinland 2020 Finland 2030 Finland 2050
Value Value Value
Renewable Energy
Biomass gasification plant Capex €/kWth 420 420 300
Lifetime Years 25 25 25
Opex fixed % of capex 5.30 % 5.30 % 4.00 %
Biodiesel plant Capex €/kWth 3420 3080 2770
Lifetime Years 20 25 30
Opex fixed % of capex 3.00 % 3.00 % 3.00 %
Biopetrol plant Capex €/kWth 790 710 640
Lifetime Years 20 25 30
Opex fixed % of capex 7.70 % 7.70 % 7.70 %
CO₂ Hydrogenation plant (P2G) Capex €/kWth 1750 970 870
Lifetime Years 30 30 30
Opex fixed % of capex 4.00 % 3.30 % 3.30 %
Biogas plant Capex €/kWth input 240 216 194
Lifetime Years 20 25 30
Opex fixed % of capex 7.00 % 7.00 % 7.00 %
Biogas upgrading Capex €/kWth 300 270 240
Lifetime Years 15 20 25
Opex fixed % of capex 15.80 % 15.80 % 15.80 %
Gasification gas upgrading Capex €/kWth 300 270 240
Lifetime Years 15 20 25
Opex fixed % of capex 15.80 % 15.80 % 15.80 %
37Recarbonised Finnish Energy System
Christian Breyer► [email protected]
Michael Child► [email protected]
Main cost assumptions
Cost assumptions Cost category UnitFinland 2020 Finland 2030 Finland 2050
Value Value Value
Thermal Plants
Heat pump for DH and CHP Capex €/kW_e 3430 2970 2220
Lifetime Years 20 20 20
Opex fixed % of capex 2.00 % 2.00 % 2.00 %
Large CHP plant Capex €/kW_e 820 820 820
Lifetime Years 25 25 25
Opex fixed % of capex 3.66 % 3.66 % 3.66 %
DH/CHP boiler Capex €/kWth 100 100 100
Lifetime Years 35 35 35
Opex fixed % of capex 3.70 % 3.70 % 3.70 %
Condensing plant (average) Capex €/kW_e 1000 1000 1000
Lifetime Years 30 30 30
Opex fixed % of capex 3.00 % 2.00 % 2.00 %
Waste CHP plant Capex €/kWth input 0.216 0.216 0.216
Lifetime Years 20 20 20
Opex fixed % of capex 7.40 % 7.40 % 7.40 %
Nuclear Capex €/kW_e 5500 6000 6500
Lifetime Years 40 40 40
Opex fixed % of capex 3.50 % 3.50 % 3.50 %
38Recarbonised Finnish Energy System
Christian Breyer► [email protected]
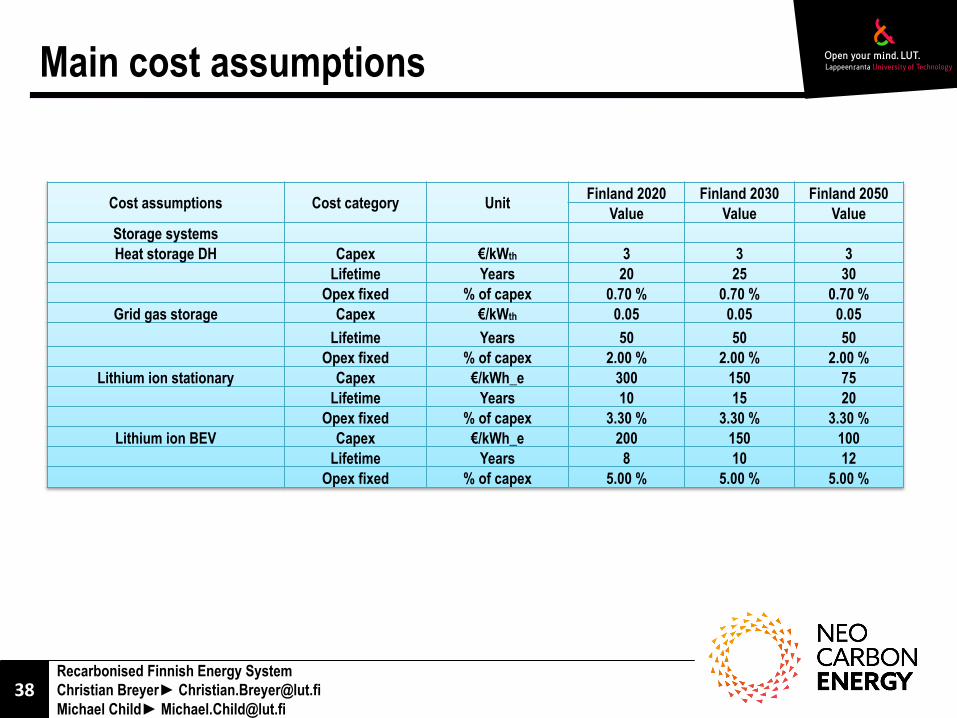
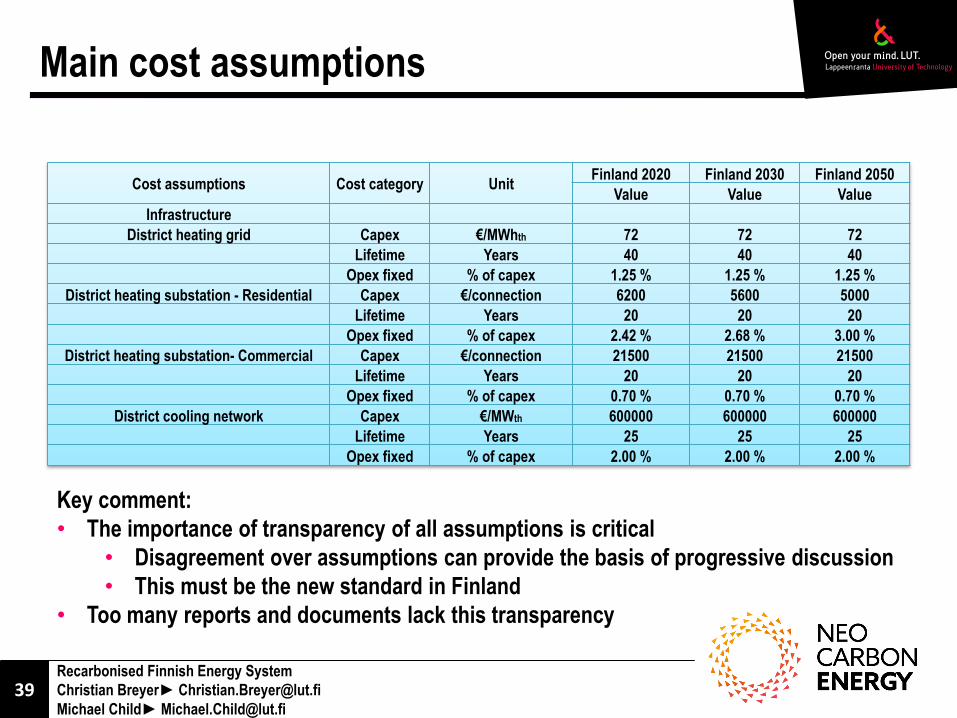
Michael Child► [email protected]
Main cost assumptions
Cost assumptions Cost category UnitFinland 2020 Finland 2030 Finland 2050
Value Value Value
Storage systems
Heat storage DH Capex €/kWth 3 3 3
Lifetime Years 20 25 30
Opex fixed % of capex 0.70 % 0.70 % 0.70 %
Grid gas storage Capex €/kWth 0.05 0.05 0.05
Lifetime Years 50 50 50
Opex fixed % of capex 2.00 % 2.00 % 2.00 %
Lithium ion stationary Capex €/kWh_e 300 150 75
Lifetime Years 10 15 20
Opex fixed % of capex 3.30 % 3.30 % 3.30 %
Lithium ion BEV Capex €/kWh_e 200 150 100
Lifetime Years 8 10 12
Opex fixed % of capex 5.00 % 5.00 % 5.00 %
39Recarbonised Finnish Energy System
Christian Breyer► [email protected]
Michael Child► [email protected]
Main cost assumptions
Cost assumptions Cost category UnitFinland 2020 Finland 2030 Finland 2050
Value Value Value
Infrastructure
District heating grid Capex €/MWhth 72 72 72
Lifetime Years 40 40 40
Opex fixed % of capex 1.25 % 1.25 % 1.25 %
District heating substation - Residential Capex €/connection 6200 5600 5000
Lifetime Years 20 20 20
Opex fixed % of capex 2.42 % 2.68 % 3.00 %
District heating substation- Commercial Capex €/connection 21500 21500 21500
Lifetime Years 20 20 20
Opex fixed % of capex 0.70 % 0.70 % 0.70 %
District cooling network Capex €/MWth 600000 600000 600000
Lifetime Years 25 25 25
Opex fixed % of capex 2.00 % 2.00 % 2.00 %
Key comment:
• The importance of transparency of all assumptions is critical
• Disagreement over assumptions can provide the basis of progressive discussion
• This must be the new standard in Finland
• Too many reports and documents lack this transparency
40Recarbonised Finnish Energy System
Christian Breyer► [email protected]
Michael Child► [email protected]
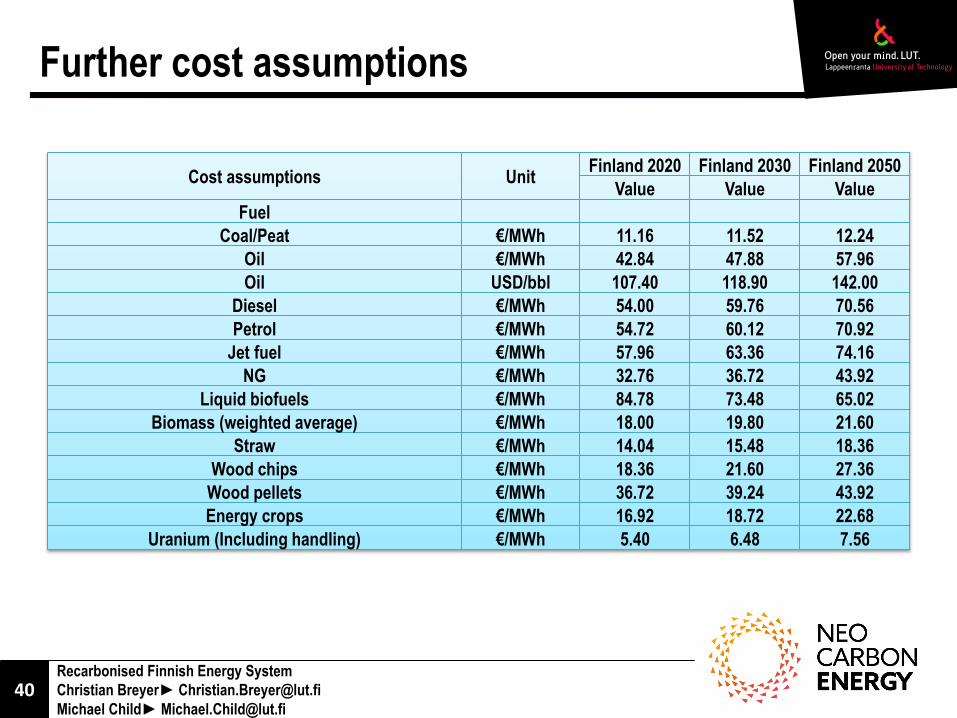
Further cost assumptions
Cost assumptions UnitFinland 2020 Finland 2030 Finland 2050
Value Value Value
Fuel
Coal/Peat €/MWh 11.16 11.52 12.24
Oil €/MWh 42.84 47.88 57.96
Oil USD/bbl 107.40 118.90 142.00
Diesel €/MWh 54.00 59.76 70.56
Petrol €/MWh 54.72 60.12 70.92
Jet fuel €/MWh 57.96 63.36 74.16
NG €/MWh 32.76 36.72 43.92
Liquid biofuels €/MWh 84.78 73.48 65.02
Biomass (weighted average) €/MWh 18.00 19.80 21.60
Straw €/MWh 14.04 15.48 18.36
Wood chips €/MWh 18.36 21.60 27.36
Wood pellets €/MWh 36.72 39.24 43.92
Energy crops €/MWh 16.92 18.72 22.68
Uranium (Including handling) €/MWh 5.40 6.48 7.56
41Recarbonised Finnish Energy System
Christian Breyer► [email protected]
Michael Child► [email protected]
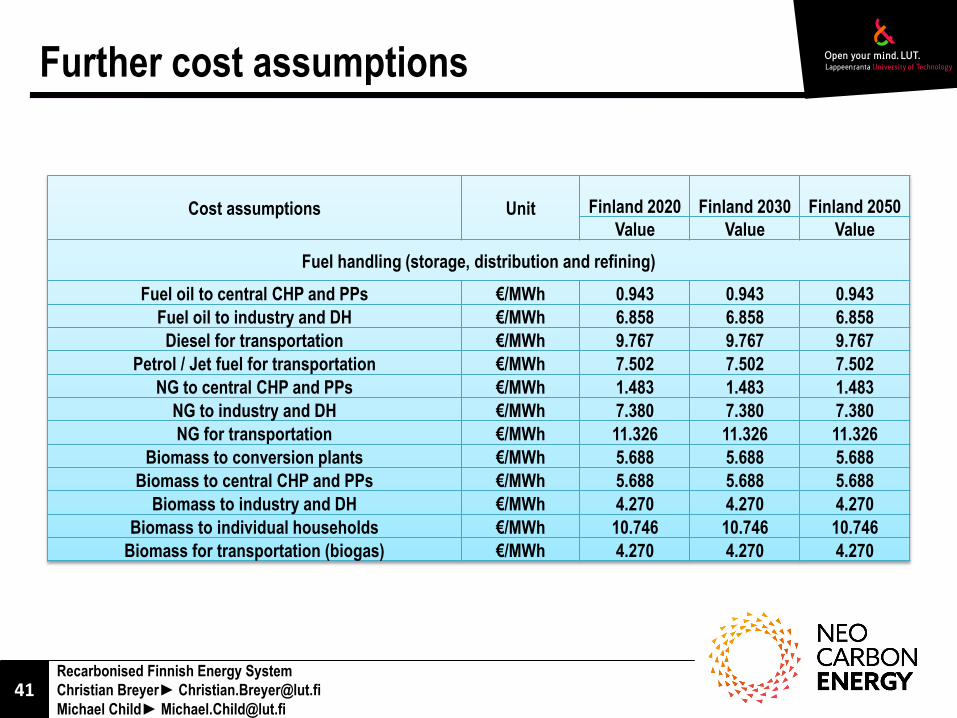
Further cost assumptions
Cost assumptions Unit Finland 2020 Finland 2030 Finland 2050
Value Value Value
Fuel handling (storage, distribution and refining)
Fuel oil to central CHP and PPs €/MWh 0.943 0.943 0.943
Fuel oil to industry and DH €/MWh 6.858 6.858 6.858
Diesel for transportation €/MWh 9.767 9.767 9.767
Petrol / Jet fuel for transportation €/MWh 7.502 7.502 7.502
NG to central CHP and PPs €/MWh 1.483 1.483 1.483
NG to industry and DH €/MWh 7.380 7.380 7.380
NG for transportation €/MWh 11.326 11.326 11.326
Biomass to conversion plants €/MWh 5.688 5.688 5.688
Biomass to central CHP and PPs €/MWh 5.688 5.688 5.688
Biomass to industry and DH €/MWh 4.270 4.270 4.270
Biomass to individual households €/MWh 10.746 10.746 10.746
Biomass for transportation (biogas) €/MWh 4.270 4.270 4.270
42Recarbonised Finnish Energy System
Christian Breyer► [email protected]
Michael Child► [email protected]
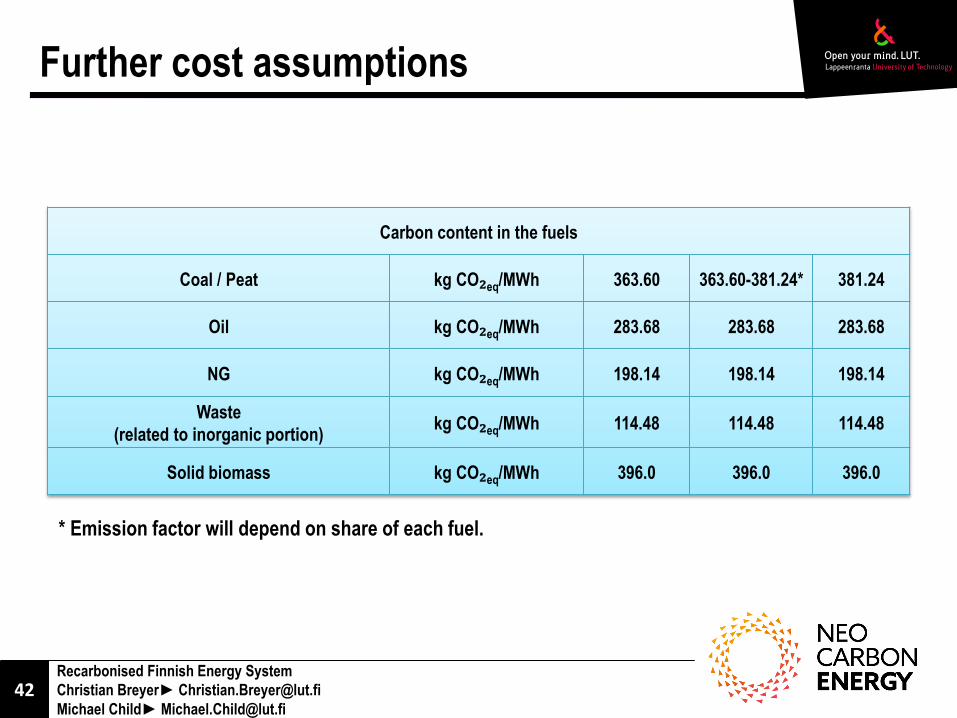
Further cost assumptions
Carbon content in the fuels
Coal / Peat kg CO₂eq/MWh 363.60 363.60-381.24* 381.24
Oil kg CO₂eq/MWh 283.68 283.68 283.68
NG kg CO₂eq/MWh 198.14 198.14 198.14
Waste
(related to inorganic portion)kg CO₂eq/MWh 114.48 114.48 114.48
Solid biomass kg CO₂eq/MWh 396.0 396.0 396.0
* Emission factor will depend on share of each fuel.