Embed Size (px)
Citation preview

Weak links in communication contribute to harmful algal
blooms in Lake Erie
Laura Johnson, Rem Confesor, Dave Baker, Ken Krieger

Algal blooms in Lake Erie have been increasing
May 2013 issue of National Geographic
2011 harmful algal bloom
6 largest algal blooms since mid-1990s have occurred over the past 7 years
Primarily Microcystis aeruginosa
Ohio P Taskforce 1
Toxins from the 2014 bloom shut down Toledo’s (pop 400,000) drinking water

2015 Seasonal HAB forecast

Current 2015 bloom on July 24
Photo: Darren Bade

Why are algal blooms returning to Lake Erie?

Heidelberg Tributary Loading Program

• Samples collected 3x a day• Analyzed for all major nutrients and
suspended sediments
Colorimetry for TP, DRP, TKN, NH4, Si
Ion chromatography for NO3, NO2, Cl, Fl, SO4
Suspended Sediments

Long-term trends in discharge and phosphorus

Annual discharge
• 5 year running average shows a marked increase since 2000
1975 1980 1985 1990 1995 2000 2005 2010
Ann
ual
Dis
char
ge (
km3)
0
2
4
6
8
10
Maumee River
1975 1980 1985 1990 1995 2000 2005 20100.0
0.5
1.0
1.5
2.0
2.5
Sandusky River
1975 1980 1985 1990 1995 2000 2005 20100.0
0.2
0.4
0.6
0.8
1.0
1.2
1.4
1.6
Cuyahoga River

1975 1980 1985 1990 1995 2000 2005 20100.0
0.2
0.4
0.6
0.8
1975 1980 1985 1990 1995 2000 2005 2010
An
nual
FW
MC
(m
g/L)
0.0
0.2
0.4
0.6
0.8
1975 1980 1985 1990 1995 2000 2005 20100.0
0.2
0.4
0.6
0.8
1975 1980 1985 1990 1995 2000 2005 20100
200
400
600
800
1000
Sandusky River
r2 = 0.02P = 0.40
r2 = 0.04P = 0.29
r2 = 0.02P = 0.37
Annual total particulate P
1975 1980 1985 1990 1995 2000 2005 2010
An
nual
Loa
d (m
etric
to
ns)
0
1000
2000
3000
4000
Maumee River
r2 = 0.25P = 0.002
r2 = 0.20P = 0.01
1975 1980 1985 1990 1995 2000 2005 20100
100
200
300
400
500
600Cuyahoga River
5 yr running mean
LOAD CONCENTRATION

Suspended Sediments
• Sediments suspended in the water has decreased!
• Patterns are more apparent when corrected for weather variability
1975 1980 1985 1990 1995 2000 2005 2010TS
S lo
ad (
1000
met
ric to
ns)
0
500
1000
1500
2000
2500
1975 1980 1985 1990 1995 2000 2005 2010
TS
S F
WM
C (
mg/
L)
0
100
200
300
400
500
1975 1980 1985 1990 1995 2000 2005 2010D
isch
arge
(km
3)
0
2
4
6
8
10
1975 1980 1985 1990 1995 2000 2005 2010TS
S lo
ad (
1000
met
ric to
ns)
0
100
200
300
400
500
600
700
1975 1980 1985 1990 1995 2000 2005 2010
TS
S F
WM
C (
mg/
L)
0
100
200
300
400
500
600
1975 1980 1985 1990 1995 2000 2005 2010
Dis
char
ge (
km3)
0.0
0.5
1.0
1.5
2.0
2.5
r2=0.11, p=0.04
r2=0.24, p=0.003Maumee
Sandusky
CONCENTRATION
Richards et al., 2009 JSWC
1975 1980 1985 1990 1995 2000 2005 20100
50
100
150
200
250
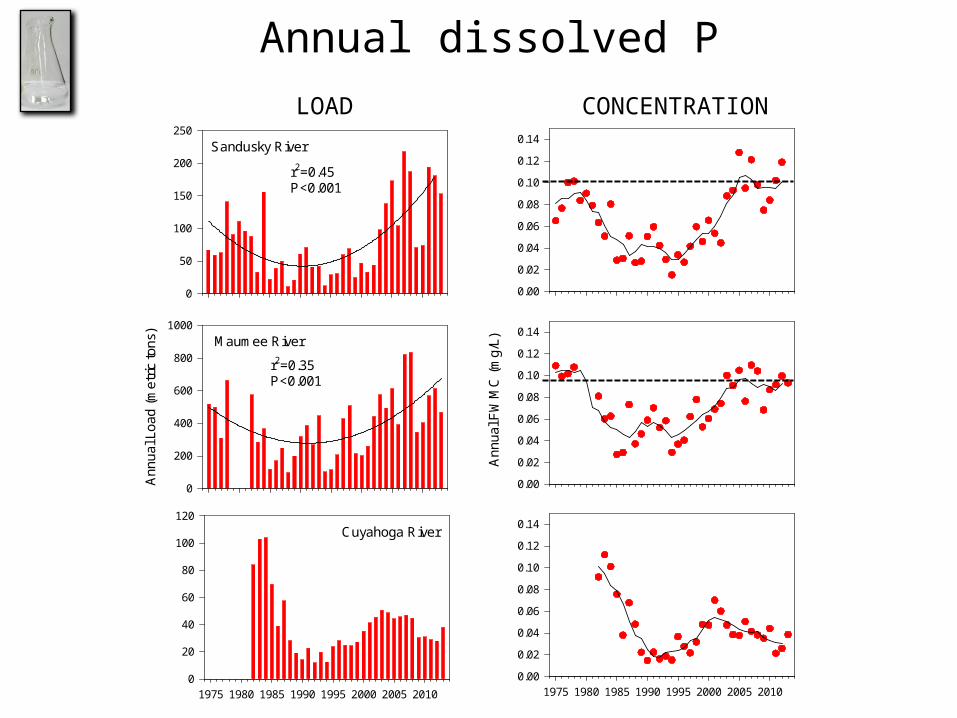
Sandusky River
r2=0.45P<0.001
1975 1980 1985 1990 1995 2000 2005 20100.00
0.02
0.04
0.06
0.08
0.10
0.12
0.14
1975 1980 1985 1990 1995 2000 2005 2010
Ann
ual
Lo
ad (
me
tric
ton
s)
0
200
400
600
800
1000
Maumee River
r2=0.35P<0.001
1975 1980 1985 1990 1995 2000 2005 2010A
nnu
al F
WM
C (
mg/
L)
0.00
0.02
0.04
0.06
0.08
0.10
0.12
0.14
1975 1980 1985 1990 1995 2000 2005 20100
20
40
60
80
100
120
Cuyahoga River
1975 1980 1985 1990 1995 2000 2005 20100.00
0.02
0.04
0.06
0.08
0.10
0.12
0.14
Annual dissolved P
LOAD CONCENTRATION

Why did dissolved phosphorus increase?

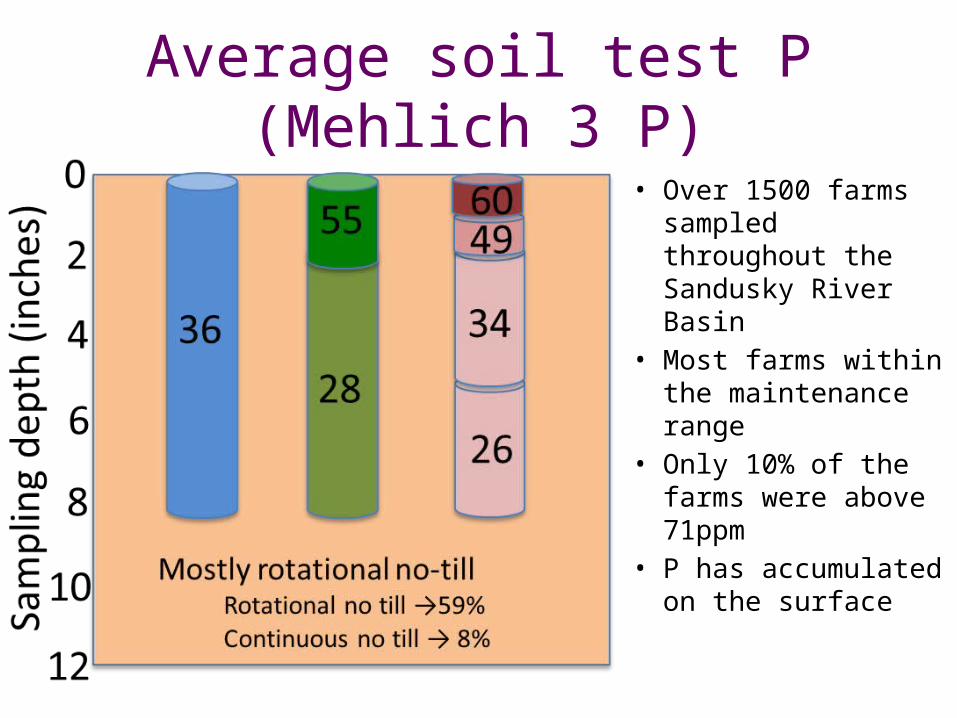
Average soil test P (Mehlich 3 P)
• Over 1500 farms sampled throughout the Sandusky River Basin
• Most farms within the maintenance range
• Only 10% of the farms were above 71ppm
• P has accumulated on the surface

Evidence of macropore tile drain flow
Photos: Kevin King, USDA-ARS Edge of Field Research

Evidence of macropore tile drain flowData from Doug Smith, USDA-ARS
St. Joseph River watershed
14 May 2011
• Tile drain flow peaked with surface flow at in a May 2011 storm • Data from Kevin King, USDA-ARS around the basin shows 50-80% of the dissolved P
loading is from tile drains
Smith et al. 2014, JEQ

Intense precipitation (2”+) is increasing
8 Events in 16 Years!
20 Events in 16 Years
Data from Kevin King, USDA-ARS


Common misconceptions
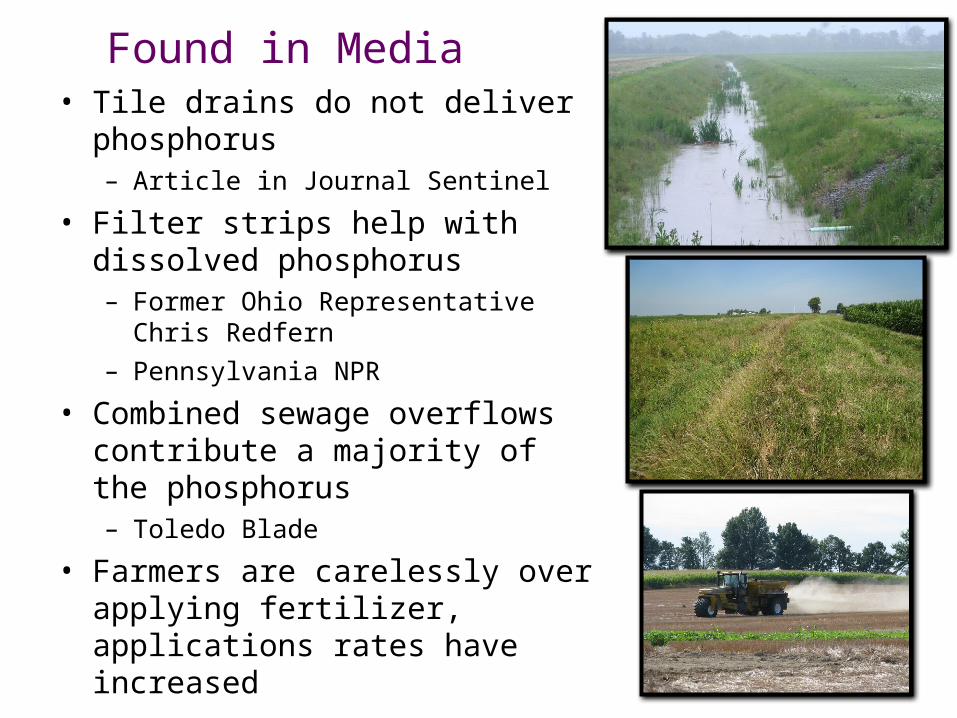
Found in Media• Tile drains do not deliver
phosphorus– Article in Journal Sentinel
• Filter strips help with dissolved phosphorus– Former Ohio Representative Chris
Redfern
– Pennsylvania NPR
• Combined sewage overflows contribute a majority of the phosphorus– Toledo Blade
• Farmers are carelessly over applying fertilizer, applications rates have increased

Weak links in communication contribute to harmful algal
blooms in Lake Erie
• Concern over the link between increasing dissolved P exports and HABs in Lake Erie have been discussed since 2007
• Studies in the 1970s showed P loss in tile drains• A report in 1980 warned of the potential tradeoffs in
the Lake Erie watershed of switching to conservation no till
• Yet misconceptions on P runoff are still prevalent• How can we expect a solution?

How can we expedite knowledge transfer?Can we make progress without a disaster?
• WLEB 4R retailer certification program– 16 certified nutrient service providers that cover ~1000 farmers,
50 applications, nearly 10% of the basin covered already
• Ohio fertilizer application training– Required for all who apply nutrients to over 50 acres
– 6586 people have attended training sessions since last fall
• WLEB tri-state RCPP– $17.5 million to the WLEB for incentives
• County SWCDs and NRCS• Webpages
– LakeErieAlgae.com just launched
• Field days, lab tours, media interviews

Questions?
For more information visit: http://www.heidelberg.edu/NCWQR
Or contact me at [email protected]
http://www.facebook.com/NCWQR

Maumee River spring 2015

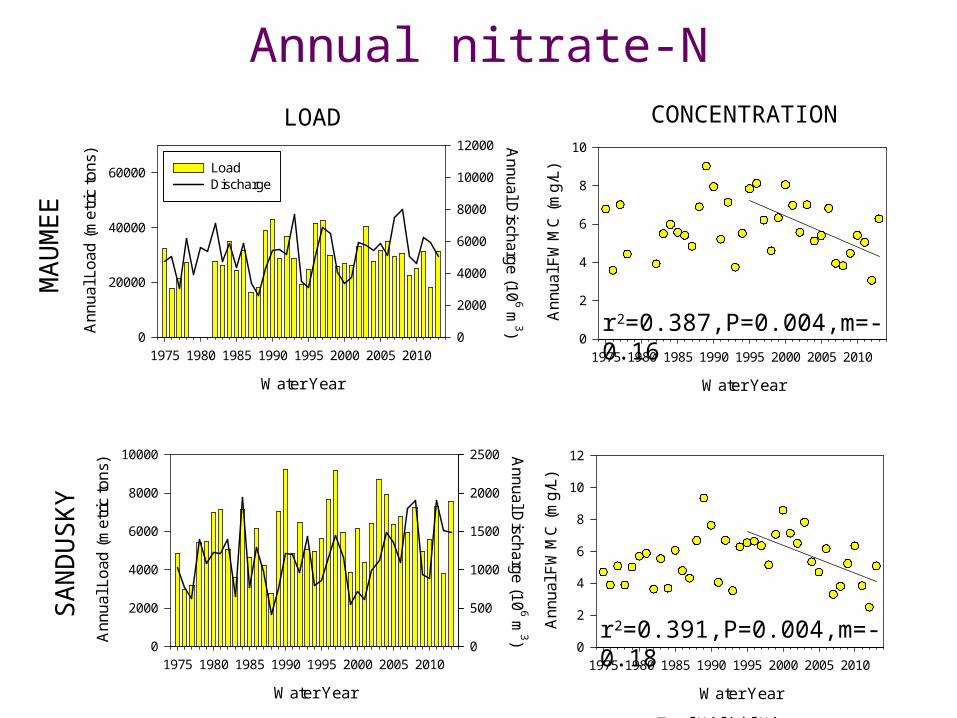
Annual nitrate-NNitrate-N
Annual Flow-Weighted Mean Concentration
Water Year
1975 1980 1985 1990 1995 2000 2005 2010
Ann
ual
FW
MC
(m
g/L
)
0
2
4
6
8
10
Total Kjeldahl NitrogenAnnual Flow-Weighted Mean Concentration
Water Year
1975 1980 1985 1990 1995 2000 2005 2010
Ann
ual
FW
MC
(m
g/L
)
0
1
2
3
Annual Nitrate-N Load
Water Year
1975 1980 1985 1990 1995 2000 2005 2010
Ann
ua
l Lo
ad (
met
ric t
ons)
0
20000
40000
60000
Ann
ual D
ischarge
(10
6 m3)
0
2000
4000
6000
8000
10000
12000
LoadDischarge
Annual Total Kjeldahl Nitrogen Load
Water Year
1975 1980 1985 1990 1995 2000 2005 2010
An
nu
al L
oad
(m
etric
ton
s)
0
5000
10000
15000
20000 Ann
ual D
ischarge
(10
6 m3)
0
2000
4000
6000
8000
10000
12000
LoadDischarge
5y running average
Nitrate-NAnnual Flow-Weighted Mean Concentration
Water Year
1975 1980 1985 1990 1995 2000 2005 2010
Ann
ual
FW
MC
(m
g/L
)
0
2
4
6
8
10
12
Total Kjeldahl NitrogenAnnual Flow-Weighted Mean Concentration
Water Year
1975 1980 1985 1990 1995 2000 2005 2010
Ann
ual
FW
MC
(m
g/L
)
0.0
0.5
1.0
1.5
2.0
2.5
Annual Nitrate-N Load
Water Year
1975 1980 1985 1990 1995 2000 2005 2010
Ann
ual
Lo
ad (
met
ric t
ons)
0
2000
4000
6000
8000
10000 Ann
ual D
ischarge
(10
6 m3)
0
500
1000
1500
2000
2500
Annual Total Kjeldahl Nitrogen Load
Water Year
1975 1980 1985 1990 1995 2000 2005 2010
Ann
ual
Lo
ad (
met
ric t
ons)
0
500
1000
1500
2000
2500
3000
3500 Ann
ual D
ischarge
(10
6 m3)
0
500
1000
1500
2000
2500
LOAD CONCENTRATION
MA
UM
EE
SA
ND
US
KY
Nitrate-NAnnual Flow-Weighted Mean Concentration
Water Year
1975 1980 1985 1990 1995 2000 2005 2010
Ann
ual
FW
MC
(m
g/L
)
0
2
4
6
8
10
Total Kjeldahl NitrogenAnnual Flow-Weighted Mean Concentration
Water Year
1975 1980 1985 1990 1995 2000 2005 2010
Ann
ual
FW
MC
(m
g/L
)
0
1
2
3
Annual Nitrate-N Load
Water Year
1975 1980 1985 1990 1995 2000 2005 2010
Ann
ua
l Lo
ad (
met
ric t
ons)
0
20000
40000
60000
Ann
ual D
ischarge
(10
6 m3)
0
2000
4000
6000
8000
10000
12000
LoadDischarge
Annual Total Kjeldahl Nitrogen Load
Water Year
1975 1980 1985 1990 1995 2000 2005 2010
An
nu
al L
oad
(m
etric
ton
s)
0
5000
10000
15000
20000 Ann
ual D
ischarge
(10
6 m3)
0
2000
4000
6000
8000
10000
12000
LoadDischarge
Nitrate-NAnnual Flow-Weighted Mean Concentration
Water Year
1975 1980 1985 1990 1995 2000 2005 2010
Ann
ual
FW
MC
(m
g/L
)
0
2
4
6
8
10
12
Total Kjeldahl NitrogenAnnual Flow-Weighted Mean Concentration
Water Year
1975 1980 1985 1990 1995 2000 2005 2010
Ann
ual
FW
MC
(m
g/L
)
0.0
0.5
1.0
1.5
2.0
2.5
Annual Nitrate-N Load
Water Year
1975 1980 1985 1990 1995 2000 2005 2010
Ann
ual
Lo
ad (
met
ric t
ons)
0
2000
4000
6000
8000
10000 Ann
ual D
ischarge
(10
6 m3)
0
500
1000
1500
2000
2500
Annual Total Kjeldahl Nitrogen Load
Water Year
1975 1980 1985 1990 1995 2000 2005 2010
Ann
ual
Lo
ad (
met
ric t
ons)
0
500
1000
1500
2000
2500
3000
3500 Ann
ual D
ischarge
(10
6 m3)
0
500
1000
1500
2000
2500
Nitrate-NAnnual Flow-Weighted Mean Concentration
Water Year
1975 1980 1985 1990 1995 2000 2005 2010
An
nu
al F
WM
C (
mg/
L)
0
2
4
6
8
10
r2=0.387,P=0.004,m=-0.16
Nitrate-NAnnual Flow-Weighted Mean Concentration
Water Year
1975 1980 1985 1990 1995 2000 2005 2010
An
nu
al F
WM
C (
mg/
L)
0
2
4
6
8
10
12
r2=0.391,P=0.004,m=-0.18
Annual nitrate-NLOAD CONCENTRATION
MA
UM
EE
SA
ND
US
KY

Toledo drinking water crisis• Over 400,000 people had no drinking water for 3 days (Aug 4-6)• Microcystin toxin was above World Health Organization’s limit of 1 mg/L
31 July 2014 3 Aug 2014

• Journal Sentinel http://www.jsonline.com/news/wisconsin/toxic-algae-cocktail-brews-in-lake-erie-b99344890z1-274542731.html
Journal Sentinel Thorbahn says the pipe he's laying actually alleviates the phosphorus problem because it allows water that hits the crops to first be filtered through the soil. He says water coming straight off the surface of the fields, instead of flowing down to the tiles, is more likely to be contaminated with excess fertilizer
"It's surface runoff," he says, referring to how agriculture contributes to the phosphorus problem in the lake. "It's not the tile system."
http://www.alleghenyfront.org/story/ohio-farmers-point-algae-law-loopholeThe Allegheny Front, Radio show
Bouncing along the edge of head-high corn fields in an electric golf cart, 65-year-old, fourth-generation Ohio farmer Roger Wise is showing off grass-covered filter strips that wind for miles along Wolf Creek, a small tributary of the Sandusky River less than 10 miles from Lake Erie.
"We have a buffer between the corn and the crick over there," says Wise. "There's a lot of wildlife back here. It's primarily wildlife and water retention and conservation.
Filter strips, paid for by federal conservation programs, are just one way to help curb phosphorous runoff.
http://www.toledonewsnow.com/story/26263076/sewage-overflow-during-monday-storms-can-intensify-algae-problemWTOL August 2014
A gentle rain would have been great, because it has been very dry, but the downpour like we had creates sewage overflows," explained Lake Erie Waterkeeper Sandy Bihn.
http://www.npr.org/sections/thesalt/2014/08/08/338936920/lake-eries-toxic-bloom-has-ohio-famers-on-the-defensive
Harmful algal blooms (HABs) in the western Lake Erie basin (WLEB) garnered national attention in August 2014 when microcystin toxins exceeded World Health Organization limits in Toledo’s drinking water resulting in a 3-day ban on drinking tap water. Yet the recurrence of HABs in the WLEB have been an on-going problem for many years– the first Ohio Lake Erie Phosphorus Task Force was formed in 2007. Increases in HAB intensity and extent over the past decade correspond closely to increasing dissolved phosphorus (DP) loads to Lake Erie from the agricultural Maumee River. The uptick in DP exports followed a period of intense land management change in the 1980s aimed at reducing soil erosion through conservation tillage and reserves. While this program succeeded in decreasing both suspended sediment and particulate P concentrations in the Maumee River, it encouraged use of broadcast P fertilizer and enhanced soil P stratification. Thus, increased DP runoff is the product of these unintended consequences in combination with intensified subsurface drainage installation, increased soil compaction, and increasing extreme spring weather events. Although other sources (wastewater inputs, residential fertilizer use, failing septic tanks) are acknowledged as minor contributors of P, producers are largely blamed for the events in Toledo. Based on the media coverage following Toledo’s drinking water incident, there appears to be a knowledge gap among producers regarding how and what form of P is entering Lake Erie, which influences how producers reduce P loss. Thus the current state of the lake is partly due to weak or slow communication among researchers/educators and the agricultural community. Our biggest challenge is to better disseminate accurate information to the agricultural community that results in implementation of practices focused on DP runoff and to foster flexibility in adopting new practices as our understanding improves or the pollutant of concern evolves.