A NOTE ON TRAFFIC PERFORMANCE GAIN FOR OPTICAL BURST/PACKET SWITCHING
Ragnar Andreassen1, Bjarne E Helvik2 1Telenor R&D 2Norwegian University of Science and Technology
Abstract: The question considered is how much extra capacity will be required in an optical circuit based core network infrastructure compared to an optical packet based core network infrastructure, when producing the same service volume at the same quality. We study this question on the basis of link-level performance gain from the statistical multiplexing of �fluid flow� variable bit-rate traffic streams. We consider effects of source variability, source bit-rates, quality requirements and network sizes. Conclusions are that extra gain from statistical link sharing in packet switched optical links relative to circuit switched optical links is modest when considering common source types currently observed in networks. In smaller core networks, with number of nodes less than 40, the gain observed can be described as insignificant for this type of traffic. Considering future scenarios, the crucial question is whether traffic increases are mainly due to a larger number of sources behaving approximately as today, or whether increases are mainly due to an increase in capacity requirements of single sources.
Key words: optical networks, circuit switching, packet switching, network performance
1. INTRODUCTION
Much research effort has been invested in the later years on the development of optical packet switched networks. Motivations for this development are the success of the inherently packet switched Internet, and the technological developments of optical communication components such as switching matrices and tunable lasers. A packet switched optical network

2 Ragnar Andreassen, Bjarne E Helvik will have a superior flexibility at the optical level compared to current circuit switched alternatives.
A later development is the notion of optical burst switching, where several packets are aggregated into �bursts�. These bursts are then treated as atomic units within the optical network. Burst switching will reduce the requirements for optical processing at the expense of increased electrical processing, storage and delay at the network ingress.
Even if improved flexibility at the optical level is undoubtedly desirable, an operator considering whether to upgrade its network infrastructure must have some idea on the overall performance improvements to expect. A requirement will be that the performance improvements to expect will justify upgrade costs.
A relevant question is therefore which properties of optical packet switching (OPS)/optical burst switching (OBS) will give the higher performance, and under which circumstances this higher performance will become more pronounced. The alternative to packet/burst switching will presumably be λ�switching, which is a form of optical circuit switching (OCS) where the circuit is constituted by a given wavelength-region in the optical spectrum.
Comparing these two alternatives, OPS/OBS may give performance/cost gain by giving higher statistic multiplexing gain on each link, and better overall network utilization. The first effect is due to the sharing of a larger common resource by statistically fluctuating traffic streams, while the second effect results from the visibility of finer granularity traffic streams at the optical network level, providing a potential for more efficient load sharing by routing throughout the network.
We will consider the former effect, the possible gain at the link level from statistical sharing of a larger common resource. We make comparisons on the basis of transfer of streams of variable bit-rates. The analysis will be focused on OPS, but will be relevant to OBS to the extent it can be said that these two technologies in certain cases have comparable traffic performance.
It should be noted that while we in this motivation has focused on the question of OPS/OBS versus OCS, the fundamental question posed is relevant for all cases where there is a choice between packet and circuit switching infrastructures, such as e.g. an IP/MPLS based core versus an SDH/GMPLS based core.
As the choice of future core network technology is a highly relevant and important question for network operators, one should expect that cost/utility evaluations of alternatives were abounding in the literature. Surprisingly, this is not so. As there is a high momentum towards optical packet switching in the optical networking community, it is the hope of the authors that this work will spur the debate and incite further results in this area.

A note on traffic performance gain for optical burst/packet switching 3
The further development of our analysis is to present the exact problem under consideration. We delay the review of related work until after this presentation, in order to provide the right perspective. The network and traffic performance models used in the analysis are then presented, followed by the results obtained. Lastly, we take a closer look at the assumptions made in the analysis, and discuss their significance for the conclusions drawn.
2. FRAMEWORK FOR COMPARISONS
The two alternatives corresponding to OCS and OPS are depicted below. In OCS a structure of λ�circuits is created that routes traffic in the desired directions. The circuits are transparent within the network, although wavelength conversion may be applied. In the OPS/OBS case, the λ�circuits existing on the fiber are terminated in a packet switch that routes all packets in all directions.
Figure 1 Optical circuit-switching (left) versus optical packet switching (right). As a
simplification, each bi-directional switched circuit is represented by a single drawn line in the left figure.
Even if in a practical realisation of OPS there need to be several
simultaneous frequencies present on a fiber, we assume that the capacities of these frequencies can be shared dynamically between the packet streams entering the fiber. The fiber can thus be considered as a single fully available resource in the OPS case.
DWDM techniques can typically accommodate a number in the range of 100 wavelengths on a fiber. As the number of distinct destinations from an edge node in a core network is often much less than this number, we shall consider that λ�circuits in the OCS case can be bundled together into a fully available end-to-end multi-link resource. This resource will in the following
Fiber
λ-circuit
Packet switch λ-switch

4 Ragnar Andreassen, Bjarne E Helvik be referred to as a sub-link, and it will be assumed that the number of sub-links can take on any number in the range up to ~150. This is of course a simplification compared to the potentials of a given system.
A packet in a given direction must thus select the given sub-link in that direction in the OCS case, whereas a packet in a given direction can select any available λ�circuit in the OPS case.
Figure 2 multiplexing models: an intermediate circuit switched level (left side) versus full
statistical sharing (right side), where the former represent optical circuit switching (OCS) and the latter optical packet switching (OPS)
The two cases we consider is depicted in more detail in Figure 2 above,
where the load
��= =
=k
i
n
jji
i
tXtX1 1
, )()( (1)
from a number
�=
=k
iinn
1
(2)
of traffic streams is either fed directly into a link-resource of capacity C or fed into a number k of sub-link-resources each taking a number ni of traffic streams. The individual sub-links have capacities Ci, summing up such that
1 2
n1
C1
1 2
n2
C2
1 2
nk
Ck
κC
12
n1
12
n2
12
nk
C
circuit switching packet switching

A note on traffic performance gain for optical burst/packet switching 5
CCk
ii
1κ=�
=
(2)
for some constant κ > 1. We compare the situations with the same quality objective, i.e. if Q(C) is a quality metric dependent on the capacity C, we demand
) ()( CQCQ OCSOPS κ= . (3)
A customer will in the two cases observe either the quality on the complete resource or the quality on a given sub-link respectively. Equating the quality requirements with respect to the complete resource to the same quality requirement on the given sub-link, using the factor κ as the free variable, will therefore produce the increase in overall capacity required to retain the quality objective when comparing OCS to OPS.
3. RELATED WORK
The discussion of packet switching versus circuit switching is as old as the invention of data networks. The excellent early work of Kleinrock (see e.g. [1], ch 5), and similar contributions (e.g. [2]) documented the benefits of packet switching over end-to-end circuit switching, and influenced the development of Internet a we know it. A fundamental assumption in this work was that comparisons were made between circuit switched end-to-end services and packet switched end-to-end services as carriers for variable bitrate traffic. Later work (e.g. [3], [4]), and even a fairly recent discussion [5] maintained this assumption. The setting in these analyses is thus different than the one we are interested in here, where all end-to-end network services are inherently packet switched, and where the main difference between packet switched and circuit switched network infrastructures is the level of aggregation. Results under the end-to-end circuit switched service assumption are not directly relevant for the question under consideration here.
A recent work that has the relevant framework is an analysis of the benefits of a hybrid circuit switched/packet switched network architecture [6]. The authors use the marginal distribution of the rate function to compute admissible load on links, the same approach that will be used here. The main differences are the way this marginal distribution is obtained and how the traffic characteristics depend on the scale of the transmission capacity of the links. The authors of [6] fit normal distributions to empirically based predictions of traffic in a future scenario. The empirical material used is

6 Ragnar Andreassen, Bjarne E Helvik time-traces of aggregate traffic, typically with sample periods of some minutes. Furthermore, they maintain a special model for the relation between variability and mean in the distribution of the rate. Using this model, they extrapolate distributions for future traffic characteristics (with averages in the order of 35 Gb/s) from today�s measurements (with averages in the order of 100 Mb/s). Our approach will be to consider the flow-micro level, and relate network performance to the properties of flows. Hence, we do not have to make a normal-distribution approximation, and we can also account for the effect of a very large number of flows on a link in DWDM networks.
4. NETWORK ASPECTS
We are interested in relating multiplexing performance to network size, as the size of the network determines how many distinct destinations there are and thus the potential for bundling λ-circuits into sub-links. For packet switching, the service performance will also depend on the number of nodes to traverse from source to destination. As we are interested in a qualitative understanding rather than specific cases, we assume a symmetrical case where all sub-links of the network have the same capacity serving the same number of traffic streams, which again are identical traffic processes. To get a notion of how many sub-links may be required in a OCS-based core network of a given size, we will consider completely symmetrical networks. Such a networks can be drawn as regular µµ × networks on a torus as illustrated below.
∆
µ
Figure 3 Symmetrical µµ × torus network topology. The diameter ∆∆∆∆ is the largest distance
(in link hops) between any node pair. Each line in the figure represents two oppositely directed unidirectional links.
Consistent with the assumptions above, all nodes send the same amount
of traffic a to every other node, and all links are identical in capacity and number of wavelengths. In such a network, the overall network dimensioning is only dependent on the identical traffic performance of each

A note on traffic performance gain for optical burst/packet switching 7 node/link in the network. The following notation is introduced: the number of nodes in the network, M, its diameter, ∆, and number of unidirectional links in the network, L. To shorten the arguments, µ is assumed to be odd. For the network considered, it is well known that
2µ=M , 1−=∆ µ and ML 4= . (4)
Under the above symmetry assumptions, the traffic from one node to all other nodes incurs a total link load of a Γ, where [8]
( ) 2/)1()1(4 22/
1 12/2 −=+−∆+=Γ � �
∆
=
∆
+∆=µµ
i iiii (5)
can be understood as the total number of �hops� from one node. In the summation, the factors 4i and 4(∆-i+1) are the number of nodes with distance i from a given node in the cases i ≤ ∆/2 and i > ∆/2 respectively. Assuming routing symmetry, the number of sub-links on a link is now given as the total number of hops from all nodes divided by the number of links:
( ) 8/1/ −=Γ= MMLMk . (6)
Corresponding numbers of µ, M and k are listed in the table below.
µ 3 5 7 9 11M 9 25 49 81 121k 3 15 42 90 165
Table 1 Number of sub-links k as a function of network width µ or number of nodes M in an OCS-based symmetrical core network
5. MULTIPLEXING OF VARIABLE BIT-RATE STREAMS
We consider the case of continuous variable bit-rate streams, where we for individual streams have known peak-rates of h and mean-rates of m. The streams are assumed independent of each other. As a further simplification, we consider that the streams are of type on/off, i.e. they are either silent or send at the peak rate h. The probability for a single source to be in the active state is hmhtXP i /))(( == . Besides being a reasonable model for some sources at a given abstraction level (e.g. variable bit-rate voice, web-browsing), this type of model will suffice to give us the understanding we seek.
8 Ragnar Andreassen, Bjarne E Helvik
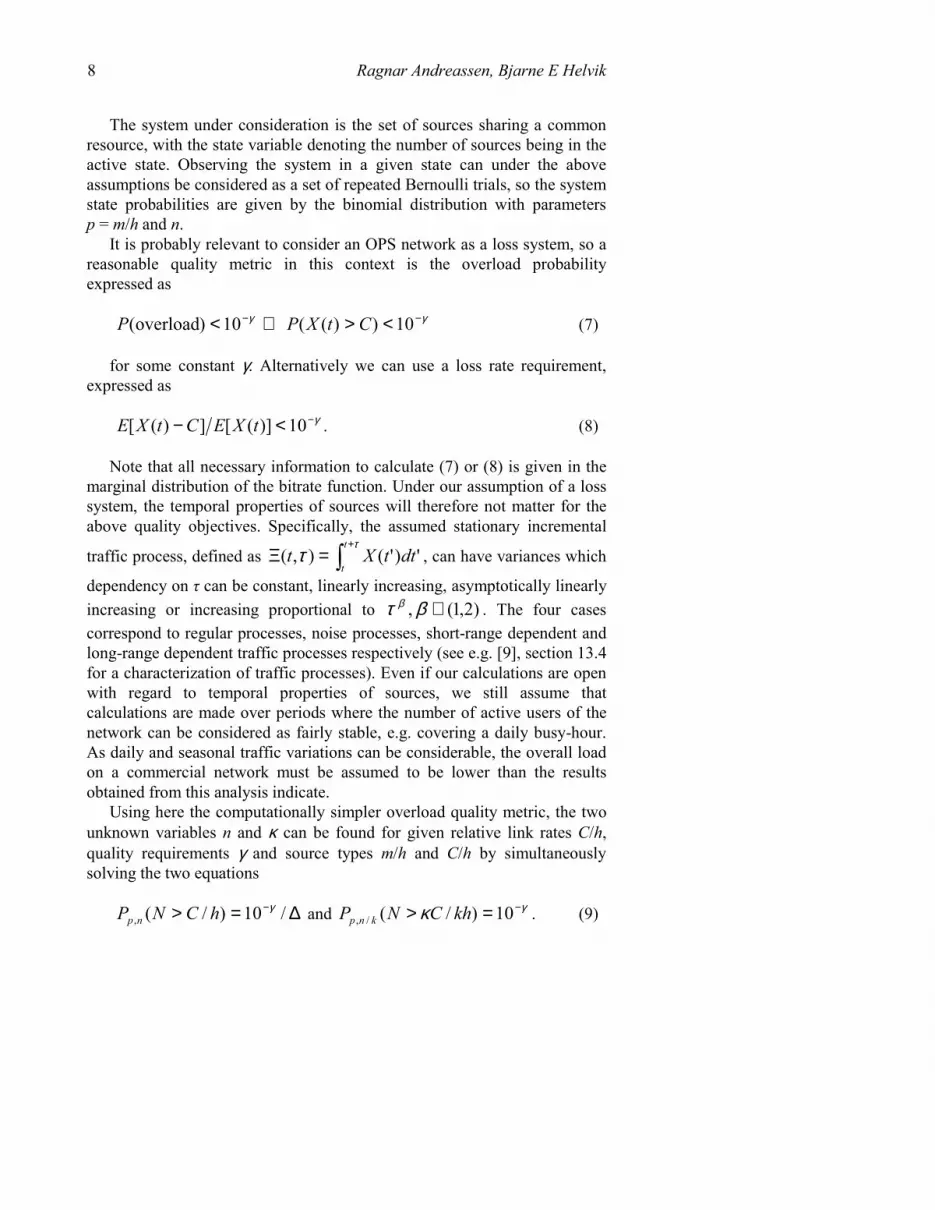
The system under consideration is the set of sources sharing a common resource, with the state variable denoting the number of sources being in the active state. Observing the system in a given state can under the above assumptions be considered as a set of repeated Bernoulli trials, so the system state probabilities are given by the binomial distribution with parameters p = m/h and n.
It is probably relevant to consider an OPS network as a loss system, so a reasonable quality metric in this context is the overload probability expressed as
γγ −− <>⇔< 10))((10)overload( CtXPP (7)
for some constant γ. Alternatively we can use a loss rate requirement, expressed as
γ−<− 10)]([])([ tXECtXE . (8)
Note that all necessary information to calculate (7) or (8) is given in the marginal distribution of the bitrate function. Under our assumption of a loss system, the temporal properties of sources will therefore not matter for the above quality objectives. Specifically, the assumed stationary incremental
traffic process, defined as �+
=Ξτ
τt
tdttXt
')'(),( , can have variances which
dependency on τ can be constant, linearly increasing, asymptotically linearly increasing or increasing proportional to )2,1(, ∈βτ β . The four cases correspond to regular processes, noise processes, short-range dependent and long-range dependent traffic processes respectively (see e.g. [9], section 13.4 for a characterization of traffic processes). Even if our calculations are open with regard to temporal properties of sources, we still assume that calculations are made over periods where the number of active users of the network can be considered as fairly stable, e.g. covering a daily busy-hour. As daily and seasonal traffic variations can be considerable, the overall load on a commercial network must be assumed to be lower than the results obtained from this analysis indicate.
Using here the computationally simpler overload quality metric, the two unknown variables n and κ can be found for given relative link rates C/h, quality requirements γ and source types m/h and C/h by simultaneously solving the two equations
∆=> − /10)/(,γhCNP np and γκ −=> 10)/(/, khCNP knp . (9)

A note on traffic performance gain for optical burst/packet switching 9
Here Pp,n denotes the probabilities associated with a binomially distributed variable N of parameters p = m/h and n. N relates to bitrate through N = X/h. ∆ is the network diameter as explained in the previous section, and it is assumed that overload probabilities are independent and small on successive links. The scaling by ∆ in the leftmost equation above is due to the demand that communication will fulfill quality requirements even to the furthest part of the network. (Recall that ∆ is the largest distance from one node to any other node). A more moderate requirement would have been to impose the quality requirement on the average distance. We have tried both options, with negligible differences in results for the parameter ranges under consideration.
To obtain insight into circumstantial performance gains, one may then vary the network size M, and properties of the sources m/h and C/h. A finer point in the latter type of sensitivity analysis is that the loads on the system are not given as inputs, but is given (through n) as a result of the calculations for given sources and capacities. Instead of the relation C/h, one might want to lock the relation C/m, giving results for different load situations than in the former case. The corresponding set of equations to be solved are:
∆=⋅> − /10)(,γhmmCNP np and
γκ −=⋅⋅> 10)(/, khmmCNP knp . (10)
We come back to the implications of the shift in emphasis in the presentation of results below.
The above equations can be solved numerically using an appropriate tool (Mathematica in this case). In the computations it was necessary to use methods that assumed n and κ to be real numbers. This is a reasonable approximation when C >> k h. As relative rates of individual sources grow the effect of the approximation is however visible in the plots.
The use of a �fluid flow� on-off source model to analyze statistical multiplexing gains was proposed in [7], p. 151. We have here extended that proposal by including the case where the pivotal point in the analysis is the relation C/m instead of C/h, as explained above, and by bringing the network context into the analysis. The use of �fluid flow� approaches as such is well studied, and will produce good estimates when units are small compared to streams. One may say that even if the applied model is bufferless, there is an implicit assumption about the existence of enough buffering to smooth out packet-scale variations in using the �fluid flow� approach.

10 Ragnar Andreassen, Bjarne E Helvik 6. RESULTS AND DISCUSSION
Variations of parameters have been performed in the dimensions of source variability (m/h), relative bit-rate (C/h or C/m), network size (M) and quality requirement (P(overload)). In all calculations, the standard parameters when not varied were C/h = 105, C/m = 5⋅105, m/h = 0.2, M = 81 and P(overload) = 10-6. Results for some presumably interesting parameter ranges are depicted below.
0.2 0.4 0.6 0.8 1m�h
1.2
1.4
1.6
k
0.2 0.4 0.6 0.8 1m�h
0.92
0.94
0.96
0.98
1load
C/h = 3,333
C/h = 100,000
C/h = 10,000
C/h = 100,000
C/h = 3,333
C/h = 10,000
0.2 0.4 0.6 0.8 1m�h
1.2
1.4
1.6
k
0.2 0.4 0.6 0.8 1m�h
0.92
0.94
0.96
0.98
1load
C/h = 3,333
C/h = 100,000
C/h = 10,000
C/h = 3,333
C/h = 100,000
C/h = 10,000
C/h = 3,333
C/h = 100,000
C/h = 10,000
C/h = 100,000
C/h = 3,333
C/h = 10,000
C/h = 100,000
C/h = 3,333
C/h = 10,000
Figure 4 Link capacity increase factor (κ) for OCS versus OPS as a function of stream
variability m/h for C/h values of 100.000, 10.000 and 3.333 (left) and the corresponding OPS loads (right). In the calculations are used M = 81 and P(overload) = 10-6.
0.2 0.4 0.6 0.8 1m�h
0.7
0.75
0.8
0.85
0.9
0.95
1load
0.2 0.4 0.6 0.8 1m�h
1.5
2
2.5
3
k
C/m = 500,000
C/m = 16,667
C/m = 50,000
C/m = 16,667
C/m = 500,000
C/m = 50,000
0.2 0.4 0.6 0.8 1m�h
0.7
0.75
0.8
0.85
0.9
0.95
1load
0.2 0.4 0.6 0.8 1m�h
1.5
2
2.5
3
k
C/m = 500,000
C/m = 16,667
C/m = 50,000C/m = 500,000
C/m = 16,667
C/m = 50,000
C/m = 16,667
C/m = 500,000
C/m = 50,000C/m = 16,667
C/m = 500,000
C/m = 50,000C/m = 16,667
C/m = 500,000
C/m = 50,000
Figure 5 Link capacity increase factor (κ) for OCS versus OPS as a function of stream
variability m/h for C/m values of 500,000, 50,000 and 16,667 (left) and the corresponding OPS loads (right). In the calculations are used M = 81 and P(overload) = 10-6.
If one locks C/h and decreases m/h, the mean rate of each source will
decrease accordingly, and the adjustment of load necessary to approach the quality requirement restraint will happen by mainly increasing the number of sources. So high source variability corresponds to a situation with a very high number of low-bitrate sources. These high numbers of sources give the still very high utilization figures we can observe in Figure 4 for high-variability sources. The effects of difficult source behaviour and the law of large numbers compete, so to speak. This type of parameter variation is relevant if an absolute limit on the peak rate can be assumed, e.g. if the traffic origins at access networks with given capacities.

A note on traffic performance gain for optical burst/packet switching 11
If one on the other hand locks C/m in the source variability variations, increase of variability corresponds to an increase in peak-rate for individual sources. In order to comply with quality requirement, the number of sources must be decreased. Considering source properties and the law of large numbers, we have the opposite situation of above: these effects here pull in the same direction. The notable difference in performance behaviour between locking C/h and C/m can be observed by comparing Figure 4 and Figure 5 respectively. The C/m type of parameter variation is relevant when the limitations in source behaviour are not due to access network limitations, but rather by some inherent source property e.g. video coding.
We next look at the results appearing when making variations in the source bit-rate dimension.
3.5 4 4.5 5 5.5 6Lg�C�h�
1.2
1.4
1.6
1.8
2
2.2
2.4k
m /h = 0.05
m /h = 0.2m /h = 0.4
4.25 4.5 4.75 5 5.25 5.5 5.75 6Lg�C�m�
1.5
2
2.5
3
k
m /h = 0.05
m /h = 0.2m /h = 0.4
3.5 4 4.5 5 5.5 6Lg�C�h�
1.2
1.4
1.6
1.8
2
2.2
2.4k
m /h = 0.05
m /h = 0.2m /h = 0.4
3.5 4 4.5 5 5.5 6Lg�C�h�
1.2
1.4
1.6
1.8
2
2.2
2.4k
m /h = 0.05
m /h = 0.2m /h = 0.4
m /h = 0.05
m /h = 0.2m /h = 0.4
4.25 4.5 4.75 5 5.25 5.5 5.75 6Lg�C�m�
1.5
2
2.5
3
k
m /h = 0.05
m /h = 0.2m /h = 0.4
4.25 4.5 4.75 5 5.25 5.5 5.75 6Lg�C�m�
1.5
2
2.5
3
k
m /h = 0.05
m /h = 0.2m /h = 0.4
m /h = 0.05
m /h = 0.2m /h = 0.4
Figure 6 Link capacity increase factor (κ) for OCS versus OPS as a function of overall link capacity C/h or C/m for m/h-values of 0.05, 0.2 and 0.4. Left panel shows results for C/h variations while right panel shows results for C/m variations. In all calculation the quality
requirement was P(overload) = 10-6.
Comparisons are also made for varying network sizes, represented by the number of nodes, M, in toroidal networks as described in the previous section. Refer to Table 1 to see the corresponding number of sub-links on each fiber.
20 40 60 80 100 120M
1.05
1.1
1.15
1.2
1.25
1.3
1.35
k
m /h = 0.4m /h = 0.2m /h = 0.1
m /h = 0.05
20 40 60 80 100 120M
1.025
1.05
1.075
1.1
1.125
1.15
1.175k
m /h = 0.4
m /h = 0.1
m /h = 0.05
m /h = 0.2
20 40 60 80 100 120M
1.05
1.1
1.15
1.2
1.25
1.3
1.35
k
m /h = 0.4m /h = 0.2m /h = 0.1
m /h = 0.05
20 40 60 80 100 120M
1.05
1.1
1.15
1.2
1.25
1.3
1.35
k
m /h = 0.4m /h = 0.2m /h = 0.1
m /h = 0.05
m /h = 0.4m /h = 0.2m /h = 0.1
m /h = 0.05
20 40 60 80 100 120M
1.025
1.05
1.075
1.1
1.125
1.15
1.175k
m /h = 0.4
m /h = 0.1
m /h = 0.05
m /h = 0.2
20 40 60 80 100 120M
1.025
1.05
1.075
1.1
1.125
1.15
1.175k
m /h = 0.4
m /h = 0.1
m /h = 0.05
m /h = 0.2
m /h = 0.4
m /h = 0.1
m /h = 0.05
m /h = 0.2
Figure 7 Link capacity increase factor (κ) for OCS versus OPS as a function of network size
(# of nodes M) for m/h-values of 0.05, 0.1, 0.2 and 0.4. Left panel shows results for C/h fixed at 105 while right panel shows results for C/m fixed at 5⋅105. In all calculation the
quality requirement was P(overload) = 10-6.
The last results to be presented concern the service quality requirement, represented by the overload probability.

12 Ragnar Andreassen, Bjarne E Helvik
-7 -6 -5 -4 -3 -2Lg�q�
1.06
1.08
1.1
1.12
1.14
k
-7 -6 -5 -4 -3 -2Lg�q�
1.05
1.1
1.15
1.2
1.25
1.3
k
m /h = 0.4
m /h = 0.05
m /h = 0.2
m /h = 0.1
m /h = 0.4
m /h = 0.05
m /h = 0.2m /h = 0.1
-7 -6 -5 -4 -3 -2Lg�q�
1.06
1.08
1.1
1.12
1.14
k
-7 -6 -5 -4 -3 -2Lg�q�
1.05
1.1
1.15
1.2
1.25
1.3
k
m /h = 0.4
m /h = 0.05
m /h = 0.2
m /h = 0.1
m /h = 0.4
m /h = 0.05
m /h = 0.2
m /h = 0.1
m /h = 0.4
m /h = 0.05
m /h = 0.2m /h = 0.1
m /h = 0.4
m /h = 0.05
m /h = 0.2m /h = 0.1
Figure 8 Link capacity increase factor (κ) for OCS versus OPS as a function ofoverload
probabilities for m/h-values of 0.05, 0.1, 0.2 and 0.4. Left panel shows results for C/h fixed at 105 while right panel shows results for C/m fixed at 5⋅105. Note that Lg(q)=γ, see
eqs (9) and (10). (Beware that ordinate lower ranges in the plots are different from 1!)
The crucial assumptions in the analysis are the torus network topology, the simple on-off source model, statistical independence between sources and a bufferless network. We will firstly discuss each of these, and then turn to the significance of results with respect to evaluation of the alternatives.
To inspect the last assumption first, it is clear that the internals of an OPS network will contain very limited buffering, so the interesting question is whether we should have included the buffering at an electrical level that takes place at the ingress to the network in the analysis. We compare OPS to OCS, which will also have buffering at ingress to optical circuits. Adding buffering to the analysis would have improved efficiencies of both types of systems, so the question is in which relative proportion the improvements would be observed. This again depends on the relative capacities of buffers and the temporal properties of aggregate traffic. Considering the former question, one approach might have been to consider a constant total amount of storage for both types of systems. If one wanted to include the effect of a more expensive type of buffering for OPS due to more complicated scheduling, one might use a scaling factor on the total storage capacity in the same spirit as we did for the link capacities above.
The temporal properties of data traffic, and the performance consequences of these, have been intensely investigated over the last decade. It is by now commonly accepted that many types of traffic will have temporal dependencies over fairly large time scales, and that this applies to aggregated traffic as well. The performance implications of this fact is not a trivial question, but it is clear that the performance gain from adding buffering to this type of traffic is less than for traffic not having the long-range dependency property.
On the question on the bufferless assumption, we can from the above discussion only conclude that there are open questions with regard to how a comparative analysis should be organised in order to give relevant

A note on traffic performance gain for optical burst/packet switching 13 comparisons, and what would be the impact of the temporal properties of traffic. Note however that the achievable loads we can observe for OPS, as illustrated in Figure 4 and Figure 5, in many cases are very high, even without any kind of ingress buffering. This indicates that OCS performance might as well benefit more than OPS/OBS performance from the addition of ingress buffering in the analysis.
Considering then the on-off source model, it should be clear that the aggregation of these will have an adverse variance in comparison to other thinkable distributions. The assumption is thus conservative in that OPS performance gain for real sources will be less than indicated in the results presented. An interesting question is however what constitutes a source? Is it a single speech stream, a web-browsing session, traffic from one xDSL access, one local area network or even a higher capacity unit. The outcomes of the calculations critically depend on the answer to this question. One must however bear in mind that the questions of source model and what constitutes a source must be seen together. We have used a source model that is reasonably conservative for small sources, i.e. speech sources, web-sessions and perhaps even an ADSL access. If we use this same model on larger units, it might be too conservative to be interesting. We should then have to find models that in greater detail describe the source.
Cross-source statistical dependencies, such as cycling, have been observed in network studies. It seems however doubtful that we in the core of a transport network that carries traffic between a very large number of geographically dispersed end points will observe cycling effects. Other sources of correlation could be bad multicast implementation. If this kind of traffic becomes significant in the transport network, we shall have to reconsider the conclusions drawn.
The torus in not a minimum-diameter network topology; other regular networks such as e.g. hypercubes exist that have shorter diameters and thus better potentials for end-to-end resource bundling. It is also easy to think of irregular topologies that are more connected than a torus. We cannot claim the torus network topology to be representative; indeed the likely topology of future core optical networks is as yet unknown. The choice of a torus topology in the calculation of link-level statistical multiplexing gain seems however to be on the conservative side with respect to the current analysis.
A positive OPS performance effect not captured in the analysis is the OPS potentials for performing more fine-grained traffic engineering in asymmetrical and/or unbalanced networks. Effects of performing such traffic engineering will presumably be larger in networks of some size, i.e. where the number of destinations is comparable to the number of wavelengths in the fiber.
Another aspect that we have not covered is the need, in a commercial quality backbone network, to deploy strategies to ensure high service

14 Ragnar Andreassen, Bjarne E Helvik dependability. One such strategy is to dynamically re-establish end-to-end connections upon fall-outs. Another one is to statically establish disjoint connections and perform load-sharing. If the latter strategy is deployed, the number of sub-links will increase compared to what is used in the current calculations.
In the results presented, all k sub-links on a link in the OCS case are equally large, i.e., a symmetrical case is assumed. With respect to the overall overload probability this is the conservative case, at least for the parameter ranges we have investigated. To illustrate, regard the simplest case possible, where a link carries two sub-links. One sub-link carries nθ flows and the other n(1-θ) flows. These two sub-links are assigned fractions ϕ and (1-ϕ) of the capacity κC respectively. ϕ is chosen so as to minimize the overall overload qθ: qθ = minϕ(θ Pp,nθ (N>κCϕ/kh) + (1-θ) Pp,n(1-θ)(N>κC(1-ϕ)/kh). The overall overload qθ is obviously symmetrical, and numerical investigations show that it has its maximum for θ = 0.5. This is illustrated by an example in Figure 9. It can be seen by induction that for any k, the symmetrical case will be conservative. Fairness, i.e. whether there are other criteria than the overall overload probability to be considered when partitioning capacity, is not considered.
0.1 0.2 0.3 0.4 0.5�
-5.8
-5.6
-5.4
-5.2
-5
-4.8
-4.6
lg�qq�
Figure 9 Overload probability qθ! as a function of skew factor θ for n=5000 and p=m/h=0.5 in the asymmetrical case where one sub-link carries nθ flows and the other carries n(1-θ) flows.
Turning now to results of the analysis, if we consider current Internet
traffic, we can separate between �residential traffic� and �corporate traffic�. The former type will originate or terminate in access networks with capacity at most a few megabits per second, so the C/h type of analysis is relevant. For corporate traffic, bottlenecks will be in more high-capacity parts of the network, so a C/m type of analysis can be applied. For residential users we will typically have C/h values in the range 105 � 106, so we can see from Figure 6 that the OPS performance gain is modest irrespective of source variability. Considering �corporate� traffic, a sustained stream where C/m is

A note on traffic performance gain for optical burst/packet switching 15 in the range of 106 (~ 1 Mbit/s) is fairly high-capacity. As one can see from Figure 6, the OPS gain for this kind of traffic is in the range of 20% and less. These moderate gain values were obtained using the calculation default value for quality of P(overload) = 10-6. Many will consider such a quality requirement to be fairly strict, cf. for instance the 10-2 requirement of [6]. Using less strict quality requirements will give less packet switching gain, as illustrated in Figure 8.
The gain numbers mentioned so far are based on a core network with 81 nodes, corresponding to 90 simultaneous sub-links on each node-to-node link. Traffic demands will eventually grow such that networks of these dimensions are needed. Until then, the calculations shown in Figure 7 indicate that the statistical multiplexing gains in smaller networks are small even for �corporate� traffic.
7. CONCLUSION
We have performed a study using simple models in order to get a �first-order� impression of the statistical multiplexing gains achievable when employing packet/burst switching in optical core networks instead of establishing transparent optical circuits. We have argued that the analysis is conservative, i.e. the model design does not favour circuit switched performance. Our model, based on an on/off fluid-flow approach at the flow-micro level, addresses both cases where individual sources can be assumed to generate flows within given rate boundaries, and where this can not be assumed. The two cases produce significantly different results. The performance analyses for both options indicate however that OPS/OBS performance gain is probably not enough in itself to motivate a transition to a presumably more expensive optical packet switching technology, if one considers services that are widely used today. An essential factor in assessing this type of gain for future services will be the nature of traffic increase developments: if traffic increase is mainly due to a larger number of sources behaving approximately as we see now, link multiplexing performance gain will remain modest. If however traffic increase is related also to higher bandwidth requirements for single sources, the technology of optical packet switching becomes more attractive. We also saw that significant gains were only observed in networks of some size, some 80 nodes and more in a toroidal network topology.

16 Ragnar Andreassen, Bjarne E Helvik ACKNOWLEDGEMENTS
This work has been funded in part by the European Commission, IST project no. 2000-28557, STOLAS. Erik van Breusegem of IMEC/Belgium has read the manuscript and suggested several improvements. The authors also gratefully acknowledge the collaboration with Evi Zouganeli of Telenor, who considerably contributed to the precision of the exposition by being a critical counterpart in several discussions on OPS/OBS vs. OCS.
REFERENCES
[1] L. Kleinrock, �Queueing Systems, voloume II: Computer Applications�, John Wiley & Sons, New York, 1976, ISBN 0-471-49111-X
[2] K. Kummerle, H. Rudin, �Packet and Circuit Switching: Cost/Performance Boundaries�, Computer Networks, 2, 1978, (1), 3-17
[3] Z. Haas, D. R. Cheridon, �A Case for Packet Switching in High-Performance Wide-Area Networks�, Computer Communication Review, 17, 1987, (5), 402-409
[4] R. A. Thompson, �Operational Domains for Circuit and Packet Switching�, IEEE Journal on Selected Areas of Communication, 14, 1996, (2), 293-297
[5] G. R. Roberts, �Packet Switching or Optical Switching?�, IEEE Internet Computing, January-February 2000, 50-51
[6] E. Van Breusegem, J. Cheyns, D. Colle, M. Pickavet , P. Demeester, �Overspill Routing In Optical Networks: a new architecture for future-proof IP over WDM networks�, accepted for presentation at Opticomm 2003, Dallas, TX, USA, October 2003
[7] J. W. Roberts (Ed.), �Performance evaluation and design of multiservice networks�, ECS-EEC-EAEC, (Cost 224), Brussels, 1992, ISBN 92-826-3728-X

A note on traffic performance gain for optical burst/packet switching 17 [8] A. S. Acampora, R. A. Gholmieh, S. Krishnamurthy, �On
tolerating single link, double link, and nodal failures in symmetric grid networks�, Proc IEEE Wireless Communications and Networking Conference, Chicago, 2000
[9] J. Roberts, U. Mocci, J. Virtamo (Eds.), �Broadband network teletraffic�, Lecture notes in computer science, vol 1155, Springer, 1996
Recommended