
A RISK ANALYSIS METHOD FOR
SELECTING LOGISTIC PARTNERS TO
COMPOSE VIRTUAL ORGANIZATIONS
Omir Correia Alves Junior1, Ricardo J. Rabelo
2
1Dept. of Computer Science, State University of Santa Catarina
2Dept. of Automation and Systems Eng., Federal University of Santa Catarina
[email protected]; [email protected]
Abstract. Virtual Organizations (VO) have complex interactions between their
members, both industrial and logistics. Once industrial partners are selected, the
VO should be complemented with the logistics partners that will deliver the
produced goods between those partners. This paper presents a supporting
decision method for selecting the most suitable logistics partners that consider
not only capabilities, historical performance and availability, but also risks. In
general, a risk is characterized by the potential of each logistic partner to do not
fulfill VO’s business requirements and that can jeopardize its accomplishment.
The method firstly evaluate and measure risks per partner, and collectively
afterwards. Its formalization and examples are provided along the paper.
Discussions are presented in the end.
Keywords: virtual organization, logistics partners’ selection, KPI, risk analysis.
1 Introduction
Companies have increasingly been immersed in more dynamic and adaptive value
chain networks so favoring the expansion of logistic partners. New markets and new
products have been increasingly created all over the world and proper logistic partners
should be hired in order to cope with this need. The cleverer the hiring activity is
done, the greater visibility, improved customer service, better planning and cost
savings can be supported [1]. This cleverness can also be crucial for companies as a
support for reindustrialization and for facing current economic challenges. However,
when companies get involved in more volatile strategic networks, the difficulty of
selecting the most appropriate logistic partners is much higher.
This work focuses on the Virtual Organization (VO) type of strategic network. A
VO is a temporary and dynamic alliance of autonomous, heterogeneous and usually
geographically dispersed companies (often SMEs) created to attend to certain
demands [2], sharing costs, benefits and risks, acting as they were one single
enterprise [3]. A VO dismisses itself after ending all its legal obligations. Therefore,
part of that difficulty in terms of logistics is due to the VO intrinsic nature, that
industrial partners are only known after an analysis of the demand’s requirements.
Once industrial partners are selected and hence the VO is formed, it should then
be complemented with logistics partners (LP). By LP it is considered in this work the

logistics providers (of types 2LP and 3PL) which act at the ‘arc’ part of the network
(outbound) and that are totally responsible for delivering the produced goods between
VO’s industrial partners.
In a previous work authors conceived a model to select LPs [4]. It applied fifteen
key performance indicators (KPI) over the set of possible LPs to further select the
most adequate ones for each logistic leg considering the VO’s industrial partners and
the whole logistics path. This selection was based on the LPs’ historical performance
in past VOs, on their technical competence and temporal availability, and on the
demand’s requirements.
The problem is that, even considering such elements, there is a risk of failure.
Faults in some LP can affect other partners and lead the given VO to fail in its goals
[6]. Therefore, it is very important to measure them for further decision-making.
In this sense, this paper presents a complementary work to also take risks into
account. Considering a sort of potential sources of risks, the VO risk of each possible
composition of LPs is calculated so that the responsible stakeholders can select the
most qualified and less risky list of LPs for a given VO before it goes for operation.
Besides that, they can further act towards mitigating risks if it was the case.
This work presents results of an ongoing, applied and qualitative research which
basically look for answering how LPs for a given VO can be more properly measured
when considering risks. It is represented by a novel method for risk analysis in the
formation of VOs called MRALP (Multi criteria Risk Analysis method applied to
Logistic Partner). ETA and FTA risk analysis methods [7, 8] are the essential
theoretical basis for the proposed method.
In this work the current focus is only on LPs, not covering yet the VO as a whole,
i.e. the industrial partners as well. Besides that, it assumes that LPs are be members of
long-term alliances (like VBE [3]) so sharing some minimum and common
collaboration, working, quality and performance principles.
This paper is organized as follow: Section 1 has introduced the general problem
and paper’s goal. Section 2 addresses the problem of selection of LPs for VO and
contextualizes it within the risk analysis area. Section 3 presents the proposed
method. Section 4 shows an example of the method. Finally, Section 5 provides
preliminary conclusions about this research.
2 Risk Analysis in Virtual Organizations
There are many definitions of what risk means in the literature. In resume, risk can be
defined as the probability of an event to can occur and that causes a negative or
positive impact on the organization’s goals when it takes place. A risk can be viewed
as a composition of three basic elements: the general environment within it can
happen; its probability of occurrence; and the scope of its impact in the case of its
occurrence [7]. In the context of this research, a risk is characterized by the potential
of each LP does not cope with the given demand / collaboration opportunity’s (CO)
requirements and hence can jeopardize the VO accomplishment. Thus, it is necessary
to comprehensively identify and quantify the VO risks associated to the selected LPs.
In the research review a number of risk analysis methods has been identified as
potentially suitable for VOs, namely FMEA (Failure mode and effects analysis), FTA
(Fault Tree Analysis), ETA (Event Tree Analysis), Bayesian Networks, CNEA
(Causal Network Event Analysis) and Ishikawa Diagram [7,8,9,10,11,12]. Some
requirements can be pointed out for the tackled problem [5]: events can be treated as
independent from each other; the deterministic relation between events can be known;
events analysis can be both qualitative and quantitative; a risk can be globally
quantified after a succession of events. Regarding these requirements, ETA and FTA
techniques were selected to be used and combined in the proposed method.
In a review of the state-of-the-art some works related to risk analysis for VOs
failures have been identified. In [13,14] thirteen KPIs were identified as general risk
sources in VOs, further identifying the importance of each one. In [15] two sources of
risks were specified (external and internal) and risk occurrence likelihood in the life
span of a VO was calculated based on them. In [6] the problem of risk mitigation in
VO was discussed and four processes were identified to improve the level of VO
performance reliability. In spite of the value of their results and that some insights
have been taken from them to this work, none of them has neither somehow
formalized how the proposed KPIs should be used nor provided means to quantity VO
partners’ risks, both individually and collectively. Actually, it was not found out any
work in the literature that has tackled logistics issues and measured VO risks.
Considering the classical main phases of a VO life cycle (creation, operation,
evolution and dissolution phases) [3], risk analysis should ideally be done along the
entire process. The scope of this research is however focused on the creation phase,
i.e. to provide means to managers to evaluate the VO before its operation.
Within the creation phase, and respecting the reference framework for the VO
creation [3], it seems more natural that risk analysis be carried out in the Partners’
Search and Selection step, i.e. after the VO topology are defined and before selected
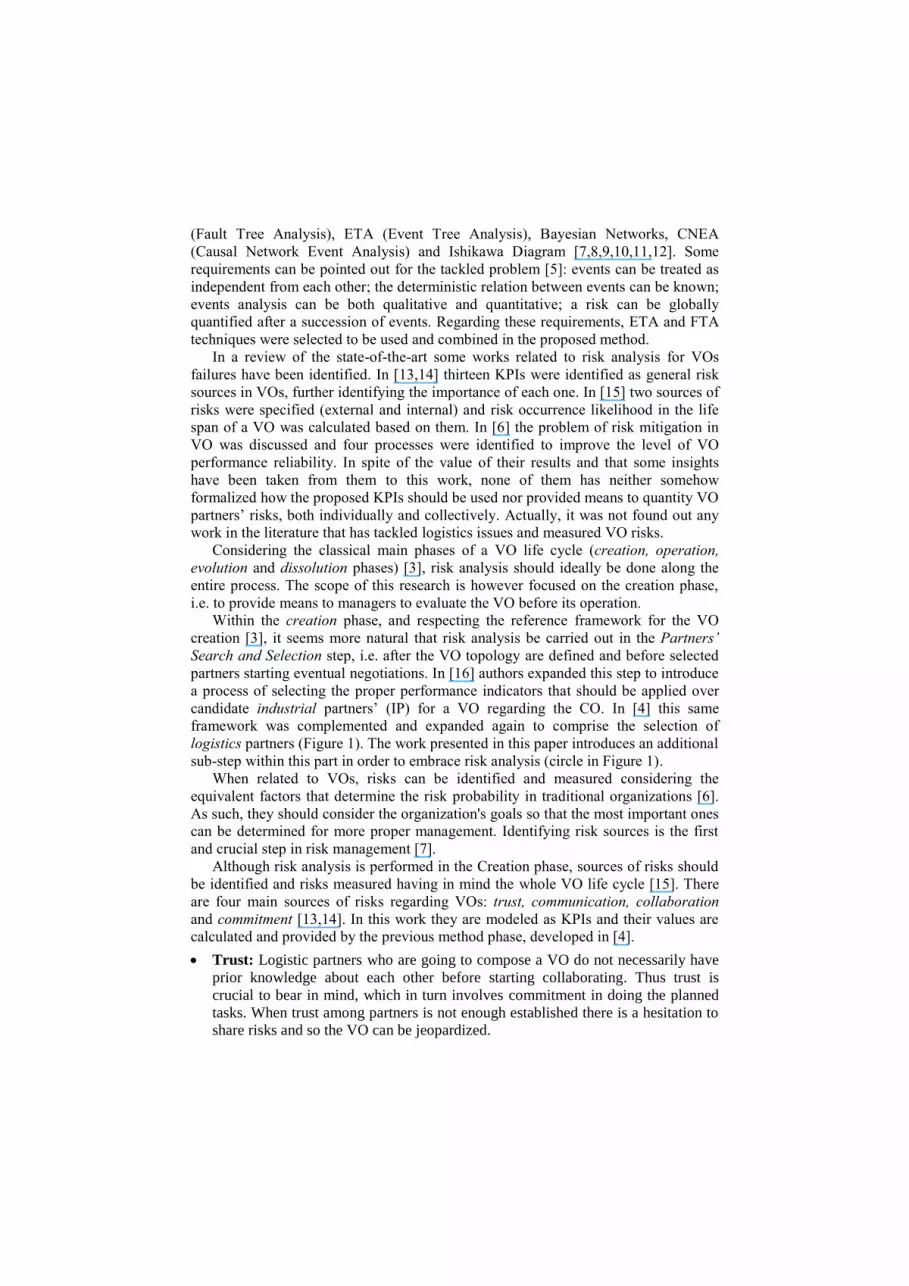
partners starting eventual negotiations. In [16] authors expanded this step to introduce
a process of selecting the proper performance indicators that should be applied over
candidate industrial partners’ (IP) for a VO regarding the CO. In [4] this same
framework was complemented and expanded again to comprise the selection of
logistics partners (Figure 1). The work presented in this paper introduces an additional
sub-step within this part in order to embrace risk analysis (circle in Figure 1).
When related to VOs, risks can be identified and measured considering the
equivalent factors that determine the risk probability in traditional organizations [6].
As such, they should consider the organization's goals so that the most important ones
can be determined for more proper management. Identifying risk sources is the first
and crucial step in risk management [7].
Although risk analysis is performed in the Creation phase, sources of risks should
be identified and risks measured having in mind the whole VO life cycle [15]. There
are four main sources of risks regarding VOs: trust, communication, collaboration
and commitment [13,14]. In this work they are modeled as KPIs and their values are
calculated and provided by the previous method phase, developed in [4].
Trust: Logistic partners who are going to compose a VO do not necessarily have
prior knowledge about each other before starting collaborating. Thus trust is
crucial to bear in mind, which in turn involves commitment in doing the planned
tasks. When trust among partners is not enough established there is a hesitation to
share risks and so the VO can be jeopardized.

Communication: Communication among VO’s LPs is a key factor for its proper
operation. They should provide correct information about parts, products and
services, collaborating in solving conflicts, sharing practices, etc. However, this
can be complicated by the fact that LPs are heterogeneous, independent,
geographically dispersed and usually have distinct working cultures. The
insufficient communication can put a VO on risk.
Collaboration: Collaboration is characterized when the sharing of risks, costs and
benefits of doing business are agreed and fairly distributed among partners.
However, when a collaboration agreement is not clearly defined, i.e., when there
is no clear definition of its main objectives, the risk of a VO increases.
Commitment: Commitment is related to the attitude of VO partners with each
other, i.e. it considers the contributions and agreements made by and among them
for a business. This is important as partners use to have complementary skills and
so it is important they feed the whole environment with the right and timely
information. The VO risk gets higher when partners fail in that attitude.
Figure 1. Extended framework for the VO creation [4].
3 The Proposed Risk Analysis Method
In general, the most important requirement for any method related to VOs is
transparency, which is a basis for trust building among partners. In this direction,
being a selection (or suggestion) process, this work helps in leaving clear the criteria
for that as well as in providing a more systematic process, i.e. a formal method.
The devised model for risk analysis starts having as input a pre-selected and
ranked list of most suitable LPs for each itinerary within the given VO. As mentioned
in the introduction, this pre-selection is performed by the previous phase of the
method [4] involving a set of elements. In this work, considering VO reference
foundations [3], the so-called VO Manager is seen as the main decision-maker.
VO preliminary
planning
Partner search andselection(PSS)
Negociation of IPs & LPs and VO composition
VO detailedplanning
VO launching
CO identification
Contract
KPIsselection
Suggestionof LPs to compose
VO
Selectioncriteria
IP analysis
Suggestionof possibleIPs to VO
Industrial partner selection Logistic partner selection
LPsselection
RISK Analysis
LP analysissemantic
search

The proposed method is generally presented in Figure 2. It splits the problem into
two stages. It starts measuring the risks individually, for each of pre-selected LP, and
after and based on that, collectively, for the entire LP team for the given VO. In this
context, VO manager has a fundamental role, which is to define (with some degree of
subjectivity) the minimal acceptable level (MAL) of risk for a LP to be member of a
VO regarding CO’s requirements and the strategic vision upon the VO. There is also a
risk specialist, who is in charge of auditing the LPs’ historical KPI values at the
VBE’s data repository.
Figure 2. Risk Analysis model
The MRALP method itself is illustrated in Figure 3. Inspired in [17], it divides the
problem into two phases: the first phase does the individual risk analysis and applies
ETA method for that. The second phase does the risk analysis taking the group of LPs
as a whole into account, applying FTA method.
3.1 Individual Risk Analysis
In the first phase of MRALP an individual risk analysis for pre-selected LPs is
performed. ETA is particularly suitable for risk analysis of systems where there are
interactions between several types of probabilistic events, whether dependent or
independent [8]. It uses a visual representation based on a logical binary tree
structure, known as Event Tree (ET), as shown in Figure 3 (Stage 1).
An ET is a probability tree which provides two possible conditions: success and
failure. It also has three basic components: initiating event; intermediary events; and
outcomes. The initiating event begins the ET creation process. In this work, the
initiating event corresponds to one pre-selected LP, and the assigned probability is
always 1 (or 100%) in the beginning [8]. Next step consists in specifying the (four)
intermediary events, which are represented by the (four) KPIs: trust, communication,
collaboration and commitment. These events are used to quantify the effectiveness of
a particular LP, i.e. if it is able or not to compose a VO.
These KPIs are used to generate an ET by assigning success and failure
probabilities to each of them, as shown in Figure 3 (Stage 1). Inspired in [18], the
criterion to assign the KPI success probability to each LP takes the historical values
analysis of the KPI that were assigned to it in past VOs. The proposed method gets
these KPI values and checks if they are greater than MPS (Minimum Probability of
SuggestedLPs
Risk analysis process
Individual riskanalysis
Collective RiskAnalysis
Level ofrisk
VO Manager
RiskSpecialist
Risktechniquesand criterias
Risk analysis flow
interactivity between the user and the method

Success). MPS is a value that is also set up by the VO manager and represents the
minimum probability of a KPI value to be within the considered acceptable range. For
instance, in Figure 4, the value of the MPS related to the (intermediate event ‘KPI_1’)
trust would have been set up as 0.3 (he also gives MPS values to the other three
KPIs). In this figure, the VO manager would be stating that he accepts a global risk of
0,4 (MAL) and that the minimum level (of fail) for trust is 0,3 and so 0.7 for success.
The setting up of MAL and MPS are a bit subjective, and basically tries to make a
trade-off between acceptable risk and effective performance situation of existing LPs.
In the same line, each VBE can adopt a particular way of calculating every KPI,
usually grouping a set of performance indicators at the operational level. In this case,
the following understanding would be used by the given VBE´s partners when
classifying their KPIs: [0.0 ; 0.2]: regrettable; [0.2 ; 0.4]: bad; [0.4 ; 0.6]: regular;
[0.6 ; 0.8]: good; [0.8 ; 1.0]: superior.
Applying Equation 1 (see below), the KPI success probability is calculated for the
current participation.
Figure 3. MRALP method general example
The values assigned to each KPI can vary from 0 to 1 and are associated with a
success rate between 0 and 1. Figure 4 shows a graph with hypothetic KPI values
about trust associated to a LP, assuming it has participated in past VOs. Since

represents the number of its previous participation in VOs and considering its
KPIs values greater than MPS (with an ‘*’), Equation 1 presents the KPI success rate.
( )
(1)
The failure rate for a given KPI is represented as ( ) by the following equation:
( ) ( ) (2)
That success and failure calculation procedure is repeated for all KPIs that
compose the ET for a LP. A set of probabilities representing the success and failure
probability for each KPI is obtained as a result, which are presented in Figure 3 by the
four intermediate (and independent from each other) events KPI_1:4 that populate the
ET. Event KPI_2, for instance, would be related to KPI communication, with fail and
success values of 0,4 and 0,6, respectively.
Figure 4. Trust KPI historic values for a given LP.
After assigning all probabilities for all ET branches, it is necessary to identify if
the LPs are minimally qualified to compose a VO. For this, a calculation is performed
to obtain the final probabilities for all event combinations composing the ET. They
are determined for each of the branches of ET and are got by multiplying the
probabilities of events that compose each path. The results greater than MAL are then
selected to be part of the Stage 2 of MRALP.
The above concepts can be formalized as follows:
Let { } be a set of LPs previously selected, where each
element in this set is associated with a different type of logistic activity that is being
requested in a business. Let { } be a set of KPIs associated to a
LP, and ( ) the probability function associated with each event in (as defined in
Equation 1). ETA events occur independently, i.e., where the occurrence of an event
does not affect the occurrence of other event. This situation can be represented by the
equalities defined in Equation (3) and Equation (4):
( ) ( ) (3)
( ) ( ) ( ) (4)
Now consider { }as a set of all possible outcomes from the
ET events combinations. The procedure for obtaining this set was performed

using a binary search tree [7], which travels different paths and assign a value to
each element of , as shown in Equation (5):
⋃[ ∏ ( )
]
( )
The function , as shown in Equation (6), corresponds to a 4-dimensional vector
which performs a binary search in the tree, returning a path element of each iteration.
Values and correspond to the beginning and ending of the search, and have initial
values of and . The value corresponds to the index of the sought
element (an element of ) and , the current level of the tree. The sequence of events
can be viewed in Figure 3 (Stage 1).
( ) { ( ) ( ) ( )
( ) ( ) ( ) (6)
After defined all possible outputs for a LP and calculated their probabilities, the
method applies a constraint variable , which checks if its value is greater than or
equal to MAL for each element of . Only the results that are greater than MAL are
considered, and the other are discarded. Thus, { } is a subset of P:
{ } (7)
The final probability values obtained through Equation (7) will be used to measure
and analyze the LP’s risk. Consider the risk level of a LP defined by a pair ⟨ ⟩. represents a condition of the LP to compose a VO (using boolean logic), while represents the success probability of the LP associated with the condition R. So
⟨ ⟩ for the i-th selected LP and the i-th is the score associated with the i-
th result . is calculated checking if set has some element (Equation (8)), i.e. if
there is at least one outcome value greater than MAL. A value 1 corresponds to the
presence of elements so enabling the to compose a VO. (Equation (9)) is
calculated summing all elements of , obtaining the success probability rate for a LP.
{
(8) ∑ ( )
3.2 Collective Risk Analysis
This second phase of the MRALP method aggregates the results provided by the first
phase (i.e. the risk level of each pre-selected LPs) to calculate the VO success
probability as a whole, i.e. if the VO formation can succeed or not.
This phase applies FTA (fault tree analysis) method [7]. FTA uses a logical
diagram- called Fault Tree (FT) – which is a graphical representation of failure events
logic that can occur in a system among all other possible event combinations. The
graphical model can be translated into boolean logic using logical gates to calculate
failures. Events are associated with input lines from the logic ports (0-failure, 1-
success) and must be analyzed to determine the logical connection between
underlying failure events that might cause them.

FTA method takes the boolean values from ETA (first phase) as input (see Figure
3). An OR logic gate with entries is associated to each LP, meaning that the
number of OR logic gates changes according to the number of LPs.
Resulting values from OR logic gates are aggregated to an AND logic gate, which
verifies if all LPs are able to compose the VO. This gate returns 1 on success and 0 on
failure, i.e., if at least one LP is not able to compose the VO, the VO formation
process is considered unfeasible. On the contrary, if all members are considered able
to, the VO as a whole is considered able to go for operation.
For this, it is necessary to perform a calculation with all elements of and, after
that, to set a , which corresponds to the success/failure value of the association
between the LPs (Equation 10).If then the VO formation is considered feasible
from the risk analysis point of view. If not, that VO is discarded and the procedure is
restarted with other LPs, i.e. with the other (possible) VO compositions.
⋀ ⟨ ⟩
( )
4 An Illustrative Example
This section presents an illustrative example to better show the proposed method.
Suppose that a CO was created and three LPs ({ }) were selected to link
four industrial partners (using the method developed in [4]. The goal is to measure the
risky of every selected possible LP coalition for the given VO. Following the
proposed method, for each LP coalition the individual risk of every LP is firstly
measured and the overall VO risk is calculated afterwards.
Considering size restrictions, the risk analysis that will be illustrated will only
consider , with the final values of and arbitrarily defined.
The assessment criteria of each LP are defined by a set of four KPIs: Trust ( ), Communication ( ), Collaboration ( ) and Commitment ( ). Table 1 shows
hypothetical historical values that would be assigned to s KPIs related to its
participation in the last seven VOs. Equation (1) calculates the success probability of
these KPIs applying a MPS=0.6.
Table 1. Quantitative values of KPIs according historical values of in VOs.
(*) KPI values greater than MPS = 0.6 are considered in the risk analysis.
In order to individually measure its risk level, is submitted to the first stage of
MRALP method, applying ETA method. It should also consider the success and
failure probabilities of each KPI that composes the intermediate events and then
adding them as parameters in the ET. The ET graphical representation can be viewed
in Figure 3 (Stage 1). According to Table 1, using Equations (1) and (2) and

considering, for example, MPS = 0.6, the success and failure probabilities associated
with each KPI are calculated (Table 2) and the respective ET is formed.
Table 2. Success and failure probabilities to LP1
Success Probabilities
( )
( )
( )
( )
Failure Probabilities
( )
( )
( )
( )
Let { } be a set of all combinations among , , , and,
for example, MAL = 0.1. Table 3 presents this result after applying Equation 5. It
represents the combinations of , corresponding to all the probabilities (sixteen)
associated with each event.
Next step consists in assigning a S score and a R boolean result for the
(Equations (8) and (9)). A constraint Q = {0.3, 0.15, 0.12} is defined (Equation
(7)), corresponding to the probabilities of values to be greater than MAL.
( )
Table 3.results from the event combinations
(*) values greater than MAL = 0.1
It can be seen that logistic partner is able to compose a VO as it has at least
one value greater than MAL. Now, (arbitrary) values of R and S are set to and
as shown in Table 4.
Table 4. Values of ⟨ ⟩ associated each logistic partner.
⟨ ⟩ ⟨ ⟩ ⟨ ⟩ ⟨ ⟩
(1) P1 = P(K1) * P(K2) * P(K3) * P(K4) = 0.71 * 0.86 * 0.86 * 0.57 = 0.3 (*)
(2) P2 = P(K1) * P(K2) * P(K3) * P(K'4) = 0.71 * 0.86 * 0.86 * 0.29 = 0.15 (*)
(3) P3 = P(K1) * P(K2) * P(K'3) * P(K4) = 0.71 * 0.86 * 0.14 * 0.57 = 0.05
(4) P4 = P(K1) * P(K2) * P(K'3) * P(K'4) = 0.71 * 0.86 * 0.14 * 0.29 = 0.02
(5) P5 = P(K1) * P(K'2) * P(K3) * P(K4) = 0.71 * 0.14 * 0.86 * 0.57 = 0.05
(6) P6 = P(K1) * P(K'2) * P(K3) * P(K'4) = 0.71 * 0.14 * 0.86 * 0.29 = 0.02
(7) P7 = P(K1) * P(K'2) * P(K'3) * P(K4) = 0.71 * 0.14 * 0.14 * 0.57 = 0.01
(8) P8 = P(K1) * P(K'2) * P(K'3) * P(K'4) = 0.71 * 0.14 * 0.14 * 0.29 = negligible
(9) P9 = P(K'1) * P(K2) * P(K3) * P(K4) = 0.29 * 0.86 * 0.86 * 0.57 = 0.12 (*)
(10) P10 = P(K'1) * P(K2) * P(K3) * P(K'4) = 0.29 * 0.86 * 0.86 * 0.29 = 0.06
(11) P11 = P(K'1) * P(K2) * P(K'3) * P(K4) = 0.29 * 0.86 * 0.14 * 0.57 = 0.02
(12) P12 = P(K'1) * P(K2) * P(K'3) * P(K'4) = 0.29 * 0.86 * 0.14 * 0.29 = 0.01
(13) P13 = P(K'1) * P(K'2) * P(K3) * P(K4) = 0.29 * 0.14 * 0.86 * 0.57 = 0.02
(14) P14 = P(K'1) * P(K'2) * P(K3) * P(K'4) = 0.29 * 0.14 * 0.86 * 0.29 = 0.01
(15) P15 = P(K'1) * P(K'2) * P(K'3) * P(K4) = 0.29 * 0.14 * 0.14 * 0.57 = negligible
(16) P16 = P(K'1) * P(K'2) * P(K'3) * P(K'4) = 0.29 * 0.14 * 0.14 * 0.29 = negligible

The second stage of the method consists in aggregating all the individual results
from the LP group and in analyzing them as a whole. This is done using FT results as
input to verify if that VO coalition, collectively, is feasible or not. Equation (9) is
applied considering the provided values (Table 4) using the ( ):
( ) ( ) ( )
As explained in Section 3, considering that = 1, this would mean that the
combination of those three logistic partners has an acceptable level of risk. Therefore,
they could become members of the VO and hence the VO could be created.
5 Conclusions
This paper has presented a supporting method to perform a risk analysis upon a set of
logistic partners (LP) that are going to compose – together with industrial partners – a
Virtual Organization (VO). It corresponds to an extension of a previous work, which
selected LPs but without considering risks. This method represents the result of an
ongoing research which aims at last to develop a comprehensive framework for VO
risk analysis.
The presented method, called MRALP, performs the risk analysis along two
stages, firstly evaluating risks individually, per partner, and secondly at a global level.
Four KPI are used as the essential basis for the selecting criteria, applying ETA
(Event Tree Analysis) method in the first stage and FTA (Fault Tree Analysis)
method in the second stage.
Although implemented in a controlled computing environment and with
hypothetical values, the achieved results seemed promising about the suitability of the
method regarding its purpose. Both ETA and FTA could model the required variables
as long as it was needed besides being not much complex to use them.
Considering the state-of-the-art, the presented method proposed a concrete way to
express to measure risks in a VO scenario when considering logistics. Yet, modeled
as a process, it represents a systematic way to analyze risks. This is important once
partners are autonomous and are members of long-term alliances so transparency in
the involved processes is crucial for trust building. Moreover, being a more organized
process, it has the potential to increase the agility in the VO formation process. On the
other hand, it is assumed that a VO manager is the one responsible for the decision
(i.e. the very final selection of LPs) as well as for actions aiming at mitigating risks,
both in the creation and operation phases of the VO life cycle.
The four chosen KPIs (communication, commitment, trust and collaboration) to
cope with risks in VO seem appropriate regarding literature. However, it is necessary
to assess them in near-real scenarios, not only in terms if they are suitable enough or
if more KPIs are required, but also to evaluate the complexity to implement them.
Companies are often very much variable and this implementation also depends on the
culture and working methods currently applied by the involved organizations.
Considering the combinatorial essence of the method, its computation can become
overwhelming when dealing with very large global logistics chains, composed of tens
of partners.

Although preliminary devoted to logistics and partners’ selection problem, the
method can be easily adapted to other application domains, basically changing the
group of selected KPIs and the way they are calculated.
Next main steps include testing the method in near real scenarios as well as to
extend it towards comprising the VO entirely, involving industrial partners. Besides
that, a more detailed categorization of types of LPs (inbound and outbound as well as
4 PL) will help in a more precise definition of the most suitable LPs.
Acknowledgements
This work has been supported by the Brazilian and German research funding agencies
Capes and DFG in the scope of the BRAGECRIM Program, project No. 2009/2. Also
by the Brazilian research funding agency CNPq.
References
1. Mentzer, J. T., Konrad, B.P.: An efficiency/effectiveness approach to logistics performance
analysis. Journal of Business Logistics, vol. 12, pp. 33-62 (2006).
2. Mowshowitz, A: Virtual Organization. ACM Communications,v.40, pp. 30-37 (1997).
3. Camarinha-Matos, L.M., Afsarmanesh, H.: On reference models for collaborative
networked organizations. Int. J. Production Research, vol. 46, pp. 2453-2469, (2008).
4. Alves Junior, O., Rabelo, R. J.: A KPI model for logistics partners´ search and suggestion
to create virtual organizations. International Journal of Networking and Virtual
Organisations, 2013, 12 (2): p. 149-177.
5. Ryclik, I; Ryden, J. Probability and risk analysis, Springer (2006).
6. Grabowski, M., Roberts, K.H.: Risk Mitigation in Virtual Organizations. Journal of
Computer-Mediated Communication, vol. 10, pp. 704-721 (1999).
7. Vose, D. Risk Analysis: A quantitative analysis. John Wiley & Sons, third Edition (2008).
8. Ericson, C. A.: Hazard Analysis Techniques for System Safety. John Wiley&Sons (2005).
9. Bentley, J.L. Multidimensional binary search trees used for associative searching.
Communications of ACM, vol. 18, pp. 509-517 (1975).
10. Rychlik, I., Rydén, J. Probability and risk analysis: an introduction for engineers. Springer-
Verlag, Berlin, 2006.
11. S. J. Rhee and K. Ishii, Using cost based FMEA to enhance reliability and serviceability.
Advanced Engineering Informatics, 2003. 17(3): p. 179-188
12. B. Bertsche, Reliability in automotive and mechanical engineering. 2008: Springer.
13. Alawamleh, M., Popplewell, K.: Risk Sources Identification in Virtual Organisation.
Enterprise Interoperability, pp. 265-277 (2010).
14. Alawamleh, M., Popplewell, K.: Analysing virtual organisation risk sources: An analytical
network process. Int. J. Networking and Virtual Organisations, 2012.v10, p.18-39.
15. Li, Y., Liao, X.: Decision support for risk analysis on dynamic alliance. Journal Decision
Support Systems, vol. 42, pp. 2043-2059 (2007).
16. Baldo, F., Rabelo, R. J., Vallejos, R. V.: A framework for selecting performance indicators
for virtual organisation partners' search and selection. International Journal of Production
Research, 2009. 27(17): p. 4737–4755
17. Mosleh, A., Dias, A., Eghbali, G., Fazen, K.: An integrated framework for identification,
classification and assessment of aviation system hazards. Proc. Int. Conf. on Probabilistic
Safety Assessment and Management, pp. 1-6, Berlin, Germany (1997).
18. Neely, A., Richards, H., Mills, J., Platts, K., Bourne, M.: Designing performance measures:
a structured approach. Int. J. Op. & Production Manag., vol. 17, pp. 1131-1152 (1997).
Recommended


