PROJECT REPORT ON
“A STUDY ON VIEWERS SATISFACTON TOWARDS SUVARNA NEWS CHANNEL
BENGALURU” (16MBAPR407)
BY
AKARSH M V
(1AY16MBA04)
Submitted to
VISVESVARAYA TECHNOLOGICAL UNIVERSITY,
BELGAUM
In partial fulfilment of the requirements for the award of the degree of
MASTER OF BUSINESS ADMINISTRATION
Under the guidance of
INTERNAL GUIDE EXTERNAL GUIDE
Prof. ARCHANA VIJAY Mr GirishC M
Assistant Professor Marketing Manager.
Department of MBA Suvarna News, Bengaluru.
Department of MBA
Acharya Institute of Technology
Acharya Dr. SarvepalliRadhakrishnan Road
Acharya PO, Soladevanahalli, Bangalore-560 107
May 2018
ACHARYA INSTITUTE OF TECHNOLOGY
(Affil iatedtoVisvesvaraya Technological University, Belagavi, Approved byAICTE, New Delhi and Accredited by NBA and NAAC)
Date: 18/05/2018
CERTIFICATE
This is to certify that Mr. Akarsh M V bearing USN 1AY16MBA04 is
a bonafide student of Master of Business Administration course of the
Institute 2016-18 batch, affiliated to Visvesvaraya Technological University,
Belagavi. Project report on "A Study on Viewer Satisfaction Towards
Suvarna News" at Bangalore is prepared by him under the guidance of
Prof. Archana Vijay in partial fulfillment of the requirements for the award
of the degree of Master of Business Administration, Visvesvaraya
Technological University, Belagavi, Karnataka.
Signature of Internal Guide
Y Signature of Principal
Suvarna News Asianet News Network Private Limited (CIN No.:U92100MH2008PTC181882J
Registered Office: Jay Chambers, Service Road, Vile Parle(East), Mumbai, Maharashtra - 400057 Tel: 022-26100084 Corporate Office: No.36, Crescent Road, Bengaluru -560001, Karnataka, India Tel: +91 80 30556300 www.suvarnanews.com
TO WHOMSOEVER IT MAY CONCERN
This is t0 certify that Mr AKARSH M V, studyir.g MBA at ACHARYA
INSTITUTE OF TECHNOLOGY USN bearing (IA Y16MBA04) has
successfully completed his internship at Suvarna news and completed the
project on "A STUDY ON VIEWERS SATISFACTJON TOWARDS SUVARNA
NEWS CHANNEL BENGALURU" for the period of l 5 January, 2018 to 24
March, 2018. At SUV ARNA NEWS, BENGALURL".
He has exhibited a high level of enthusiasm and commitment in his work.
We wish all the best for his future Endeavour's.
Bangalore.
/II, &F-: asianet news network
ltd,
Asianet News Media & Entertainment Pvt Ltd.
As1.inet News ,Suvarna Ncws, Rcpuolic TV '(anrada Prabha•lnd1go 919fm , As1anet Newsab e
ww,\ as,anet,iews.com/malayalam kan'lada. :elugu. tam I
DECLARATION
I, A.KARSH M V, hereby declare that the Internship report entitled "A STUDY ON
VIEWERS SATISFACTION TOWARDS SUVARNA NEWS CHANNEL
BENGALURU"prepared by me under the guidance of Prof. AR CHANA VIJA Y faculty of
M.B.A Department, Acharya Institute of Technology and external assistance Mr. Girish C M,
Marketing Manager, Suvarna News Bangalore
I also declare that this Internship work is towards the partial fulfilment of the university
regulations for the award of degree of Master of Business Administration by Visvesvaraya
Technological University, Belgaum.
I have undergone a summer project for a period of Ten weeks. I further declare that this project
is based on the original study undertaken by me and has not been submitted for the award of any
degree/diploma from any other University / Institution.
Place: Bengaluru Signature of the student
Date: ;)__8 / o S / I & A~ AKARSH MV
(I A YI 6MBA04)
ACKNOWLEDGEMENT
I deem it a privilege to thank our Principal, Dr. Sharanabasava C Pilli, Dr. Mahesh, Dean
Academics and our HOD Dr.Nijaguna G for having given me the opportunity to do the project,
which has been a very valuable learning experience
I am truly grateful to my external guide Mr.Girish C M, Marketing Manager, Suvarna news
Bangalore and my internal research Guide, Prof. Archana vijay, for their research guidance,
encouragement, and opportunities provided.
I wish to thank all the respondents from the firms who spent their valuable time in discussing
with me and giving valuable data by filling up the questionnaire.
My sincere and heartfelt thanks to all my teachers at the Department of MBA, Acharya Institute
of Technology for their valuable support and guidance.
Last, but not least, I want to express my deep appreciation to my parents for their unstinted
support.
AKARSH MV
(1AY16MBA04)
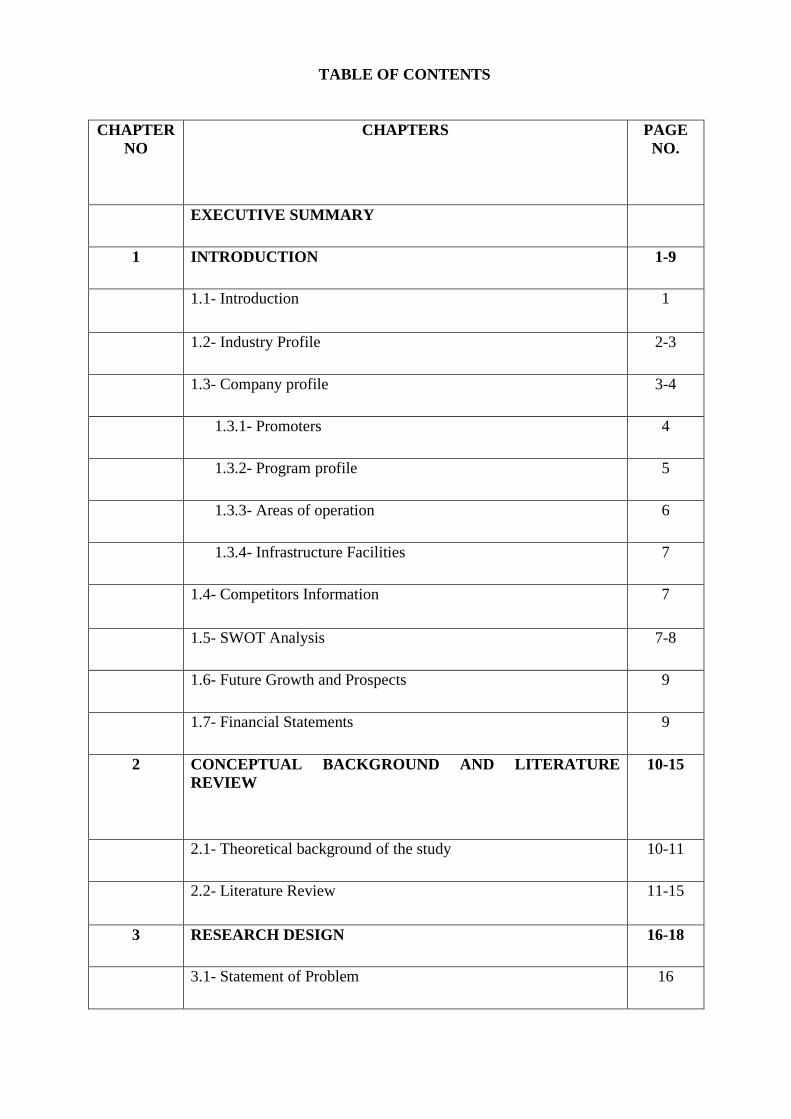
TABLE OF CONTENTS
CHAPTER
NO
CHAPTERS PAGE
NO.
EXECUTIVE SUMMARY
1 INTRODUCTION 1-9
1.1- Introduction 1
1.2- Industry Profile 2-3
1.3- Company profile 3-4
1.3.1- Promoters 4
1.3.2- Program profile 5
1.3.3- Areas of operation 6
1.3.4- Infrastructure Facilities 7
1.4- Competitors Information 7
1.5- SWOT Analysis 7-8
1.6- Future Growth and Prospects 9
1.7- Financial Statements 9
2 CONCEPTUAL BACKGROUND AND LITERATURE
REVIEW
10-15
2.1- Theoretical background of the study 10-11
2.2- Literature Review 11-15
3 RESEARCH DESIGN 16-18
3.1- Statement of Problem 16
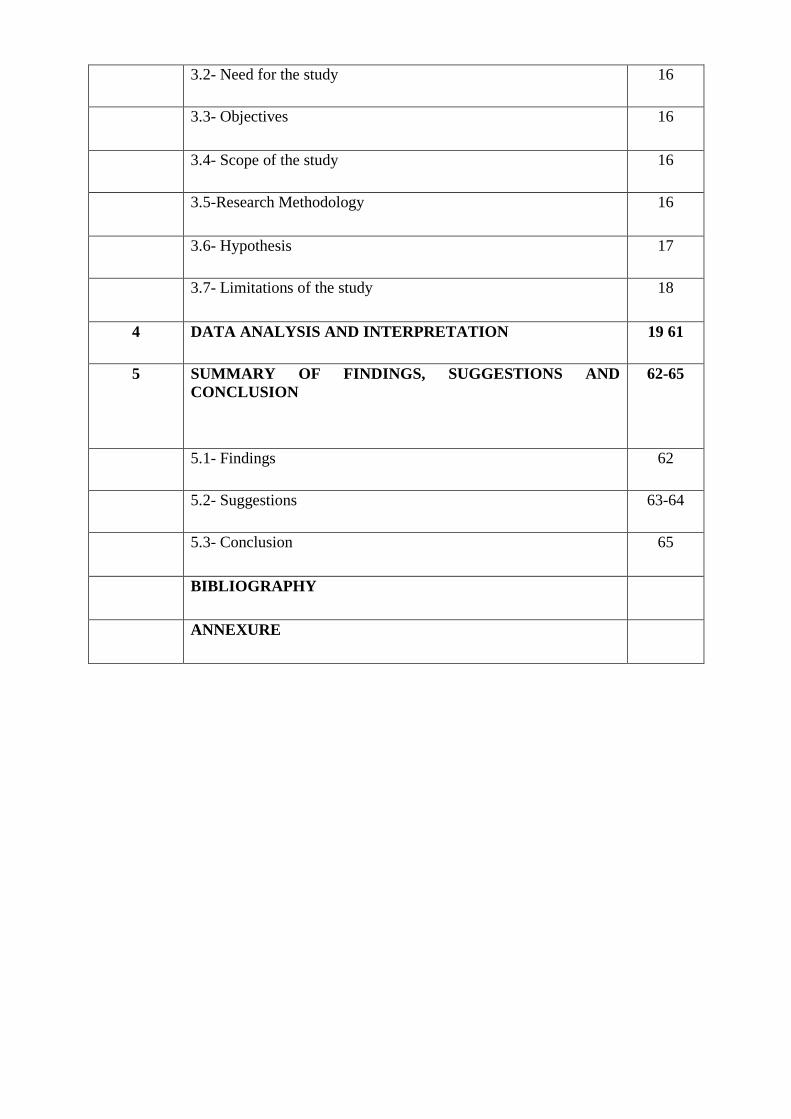
3.2- Need for the study 16
3.3- Objectives 16
3.4- Scope of the study 16
3.5-Research Methodology 16
3.6- Hypothesis 17
3.7- Limitations of the study 18
4 DATA ANALYSIS AND INTERPRETATION 19 61
5 SUMMARY OF FINDINGS, SUGGESTIONS AND
CONCLUSION
62-65
5.1- Findings 62
5.2- Suggestions 63-64
5.3- Conclusion 65
BIBLIOGRAPHY
ANNEXURE
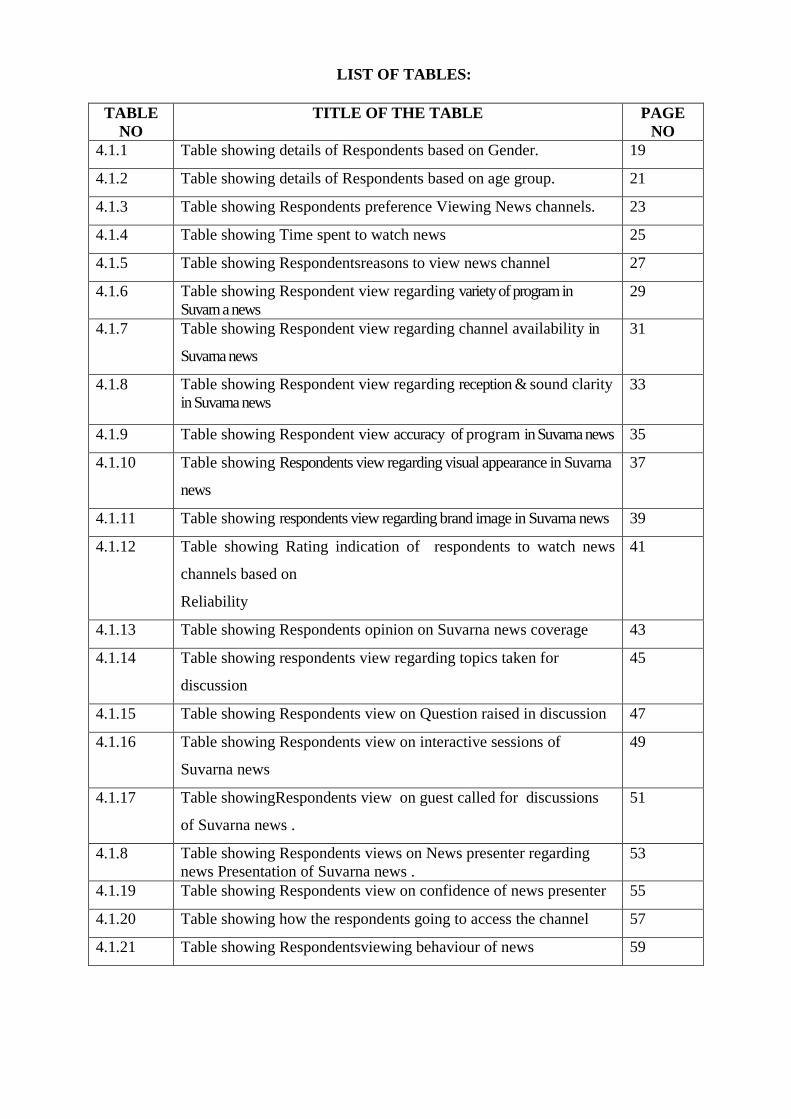
LIST OF TABLES:
TABLE
NO
TITLE OF THE TABLE PAGE
NO
4.1.1 Table showing details of Respondents based on Gender. 19
4.1.2 Table showing details of Respondents based on age group. 21
4.1.3 Table showing Respondents preference Viewing News channels. 23
4.1.4 Table showing Time spent to watch news 25
4.1.5 Table showing Respondentsreasons to view news channel 27
4.1.6 Table showing Respondent view regarding variety of program in
Suvarn a news
29
4.1.7 Table showing Respondent view regarding channel availability in
Suvarna news
31
4.1.8 Table showing Respondent view regarding reception & sound clarity
in Suvarna news
33
4.1.9 Table showing Respondent view accuracy of program in Suvarna news 35
4.1.10 Table showing Respondents view regarding visual appearance in Suvarna
news
37
4.1.11 Table showing respondents view regarding brand image in Suvarna news 39
4.1.12 Table showing Rating indication of respondents to watch news
channels based on
Reliability
41
4.1.13 Table showing Respondents opinion on Suvarna news coverage 43
4.1.14 Table showing respondents view regarding topics taken for
discussion
45
4.1.15 Table showing Respondents view on Question raised in discussion 47
4.1.16 Table showing Respondents view on interactive sessions of
Suvarna news
49
4.1.17 Table showingRespondents view on guest called for discussions
of Suvarna news .
51
4.1.8 Table showing Respondents views on News presenter regarding
news Presentation of Suvarna news .
53
4.1.19 Table showing Respondents view on confidence of news presenter 55
4.1.20 Table showing how the respondents going to access the channel 57
4.1.21 Table showing Respondentsviewing behaviour of news 59
LIST OF GRAPHS:
GRAPH
NO
TITLE OF THE GRAPH PAGE
NO
4.1.1 Graph showing details of Respondents based on Gender. 20
4.1.2 Graph showing details of Respondents based on age group. 22
4.1.3 Graph showing Respondents preference Viewing News channels. 24
4.1.4 Graph showing Time spent to watch news 26
4.1.5 Graph showing Respondentsreasons to view news channel 28
4.1.6 Graph showing Respondent view regarding variety of program in
Suvarna news
30
4.1.7 Graph showing Respondent view regarding channel availability in
Suvarna news
32
4.1.8 Graph showing Respondent view regarding reception & sound
clarity in Suvarna news
34
4.1.9 Graph showing Respondent view accuracy of program in Suvarna
news
36
4.1.10 Graph showing Respondents view regarding visual appearance in Suvarna
news
38
4.1.11 Graph showing respondents view regarding brand image in Suvarna news 40
4.1.12 Graph showing Rating indication of respondents to watch news
channels based onReliability
42
4.1.13 Graph showing Respondents opinion on Suvarna news coverage 44
4.1.14 Graph showing respondents view regarding topics taken for
discussion
46
4.1.15 Graph showing Respondents view on Question raised in discussion 48
4.1.16 Graph showing Respondents view on interactive sessions of
Suvarna news
50
4.1.17 Graph showingRespondents view on guest called for discussions
of Suvarna news .
52
4.1.18 Graph showing Respondents views on News presenter regarding
news Presentation of Suvarna news.
54
4.1.19 Graphshowing Respondents view on confidence of news presenter 56
4.1.20 Graphshowing how the respondents going to access the channel 58
4.1.21 Graphshowing Respondentsviewing behaviour of news 60
EXECUTIVE SUMMARY
Asianet News Pvt Ltd was propelled Suvarna news 24x7, Suvarna news 24x7 broadcasts
Kannada News in entire Karnataka. It communicate 24 hours of News tag lined as Neera Dhitta
Niranthara (In English Straight,Bold, Relentlessness). It broadcasts just regionally covers all
current issues all event corner to corner of Karnataka.
This study is about viewers satisfaction towards Suvarna news channel, that includes what
viewers expectation from Suvarna news channel, hence the study was calculated to know the
viewers satisfaction.
Here in this study descriptive research and sampling was done according to random sampling.
Sample of 100 respondents were used for collect primary data with the help of questionnaire,
questionnaire was designed to know level of satisfacti on viewers through different questions.
Secondaryidatawas gatheredIfrombooks, journals as well as sites to analyze the report simple
Correlations and percentage analysis were used to analyzethe data.
It was found that the Respondents concluded that the Suvarna news Channel as good quality
and choose to watch Suvarna news channel along with ETV Kannada News,Kasthuri News 24,
Raj Kannada News, Sudhi TV. various Respondents said that they wish to watch entertainment
news in Suvarna news as first choice.
The Suvarna news Channel should focus on communicating Social positioned angles which
cause a great change in the public and furthermore must be fully straightforward when
telecasting of news. These projects can be demonstrated much viably with solid data's and
further more it must be sincere. It can similarly focus on improving its Coverage of News across
the National matters and Entertainment News.
1
CHAPTER 1
INTRODUCTION
1.1. INTRODUCTION:
Entertainment and mediaiindustry in India has beated the Indianieconomy and is one of the
quickest expandingisectors in India.The viewer are consumer of media as well as consumers is
the establishment of each business and keeps it in presence He is doing a favor by tuning into the
channel. He is not wards on us. We are wards on him. A fruitful organization understands that a
satisfied client is the best publicist for their items. Benefits are created from the satisfaction of
viewers.
Consumer loyalty is moving goal where client needs and execution principles keep on changing
with the contenders additionally meeting or surpassing consumer necessities. As this definition
clears up, fulfillment is a element of saw execution and longings. If the process comes up short
with respect tocustomer, then customer is frustrated. If the execution is proper then the wishes
customer will be fulfilled. If the execution fails, the wishes of the customer is exceptionally
fulfilled
various associations are going for high accomplishment since customers who are as of late
fulfilled still imagine that it‟s easy to switch, when a major offer comes The people will be
significantly to switch. Providing a h high fulfillment will result in high standing quality
1.2 INDUSTRY PROFILE
Basis introduction of media
20th
century‟s is known for many great invention is Television media one among them , in India
TV has become one of the most influencing thing ,tv media is the platform where many
company advertise their product , this also broadcast information and entertainment and also it is
utilized for instructing and sharing learning even by promoting social values and morality
regardless of all age, gender , income and qualification.tv has gets ,more profit through
advertisements by selling its spots to their customers . In 1980, Doordarshan channel was owned
2
by the government, were media ere started in India. This channel telecasted tele-serials
Ramayana and Mahabharata serials, which many family to own a tv set
During starting ere of TV the transmission was in black and white where after liberalization tv
market got a boost in Indian market
When foreign channels like CNN , Star TV along with native network like G tv and Sun tv
entered into this trend was successfully taped by magi 2 min noodles by nestle and became
consumer product in India , by the advertisement carried by hum;long serial, this proved the
strength of tv media and opened a new marketing gateway for others companies .
The spark moment happened in TV industry when foreign players entered into Indian market by
early 90s network like CNN, Star TV and native network like ZEE TV and Sun TV, by the end
of 1990 Indian viewers had 40 private channels, the government of India imposed tax on cable
operators in a proposal to generate revenue, cable TV act, 1995 was passed to regulate the cable
business in India.
Evolution of News channels in Karnataka
In early 90s, Doordarshan was the only channel providing news to Karnataka by Chandana
vahini later Udaya channel and ETV gave news at prime time in Karnataka, but the 24/7 news
format was launched by TV9 in Karnataka on 22 June 2006 owned by sneha television network,
Suvarna news was launched on 31 march 2008, Udaya news by Sun network, Samaya channel
on 20 June 2010 owned by ravipathi broadcasters, Raj news owned by raj network, Kasturi news
24 was launched on 21 November by Kasturimediapvt.ltd, Public TV was launched on 26
January 2012, owned by Writemen media pvt.ltd, ETV news channels was launched on19 March
2014 by reliance network 18.
3
1.3COMPANY PROFILE
Asianet news network private ltd started Suvarna news 24X7 as Kannada News Channel. This
is a part of Jupiter Media Entertainment Ventures, headed by Rajeev Chandrashekhar. On 31st
march it was launched. The channel is tag lined has isNeraiDittaiNirantara (Straight, Bold,
Relentless).
Asianet news private.ltd, cable network Services Company of India situated in Kerala, which is
started in the year 1993, now the company is in service all over the nation with huge base of
viewers.
Suvarna news has emerged like a strong participant to empower the voice of public. It has
better reach over the Karnataka. The one and only aim of the Suvarna news channel is to
provide quality and fair news coverage to the people of Karnataka. In a limited time the channel
has become one of the main market players in Kannada regional news scenario.
Suvarna news 24x7 has devoted specialized all over division to ensure good news coverage and
best services.
In kerala Asianet is the largest cable network .Asianet is first company to introduce internet
over cable by its own gateway in India. Asianet news offers a wide choice of reasonable digital
TVwithanchoice of 144 channels. About on an around Asianet dateline has 35000 of establish
subscribersfor broadband internet services all over Kerala
Asia network entered to Karnataka marketplace through a channel called GEC which is named
as Suvarna along with tag line “24 carrot mhanoranjane”.
Suvarna news as launched its website (http://www.Suvarna news .tv) and Live TV on 2011. It
has major presence in Socialmedia, including other sites like Twitter, Facebook, Google Plus.
The the YouTube page of Suvarna news is performing well
A fresh team of professional has been lead to ensure the production values &made the shows are
of perfect standards.
4
1.3.1: Promoters
Asianet news network pvt ltd.
Republic TV
Kannada prabha
Reajeev Chandrashekar
Amith Guptha
Appachoo
Frank P Thomas
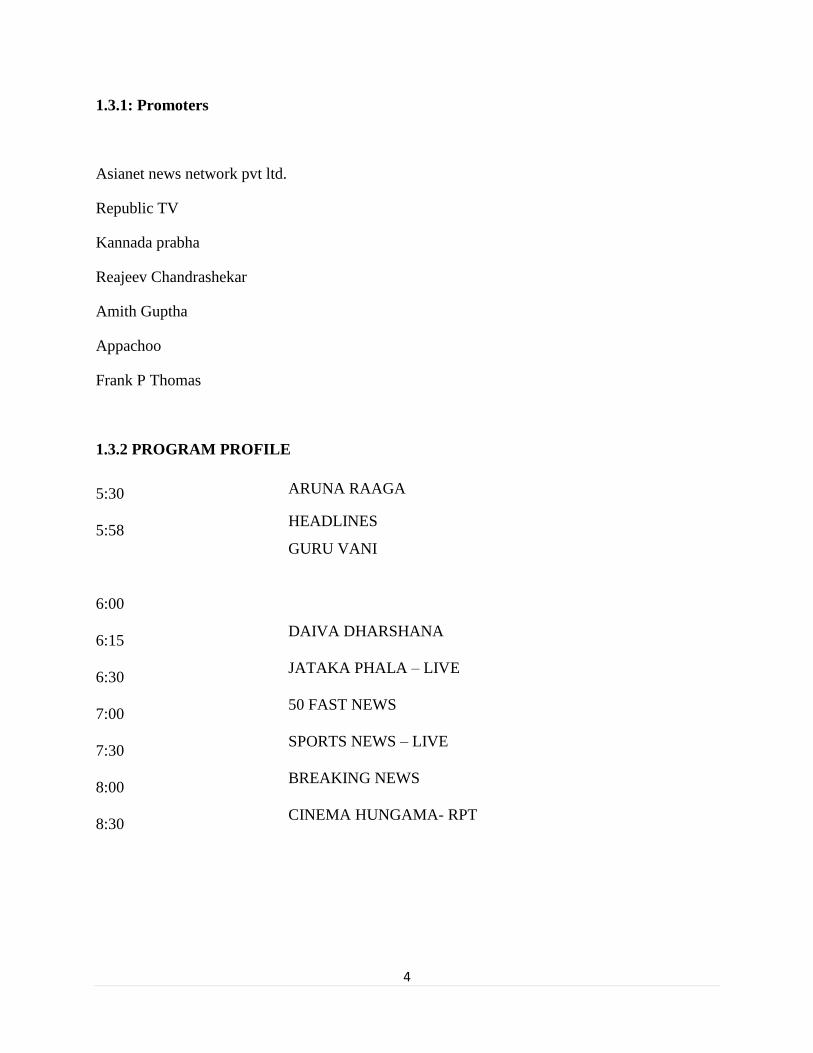
1.3.2 PROGRAM PROFILE
5:30 ARUNA RAAGA
5:58 HEADLINES
6:00
GURU VANI
6:15 DAIVA DHARSHANA
6:30 JATAKA PHALA – LIVE
7:00 50 FAST NEWS
7:30 SPORTS NEWS – LIVE
8:00 BREAKING NEWS
8:30 CINEMA HUNGAMA- RPT
5
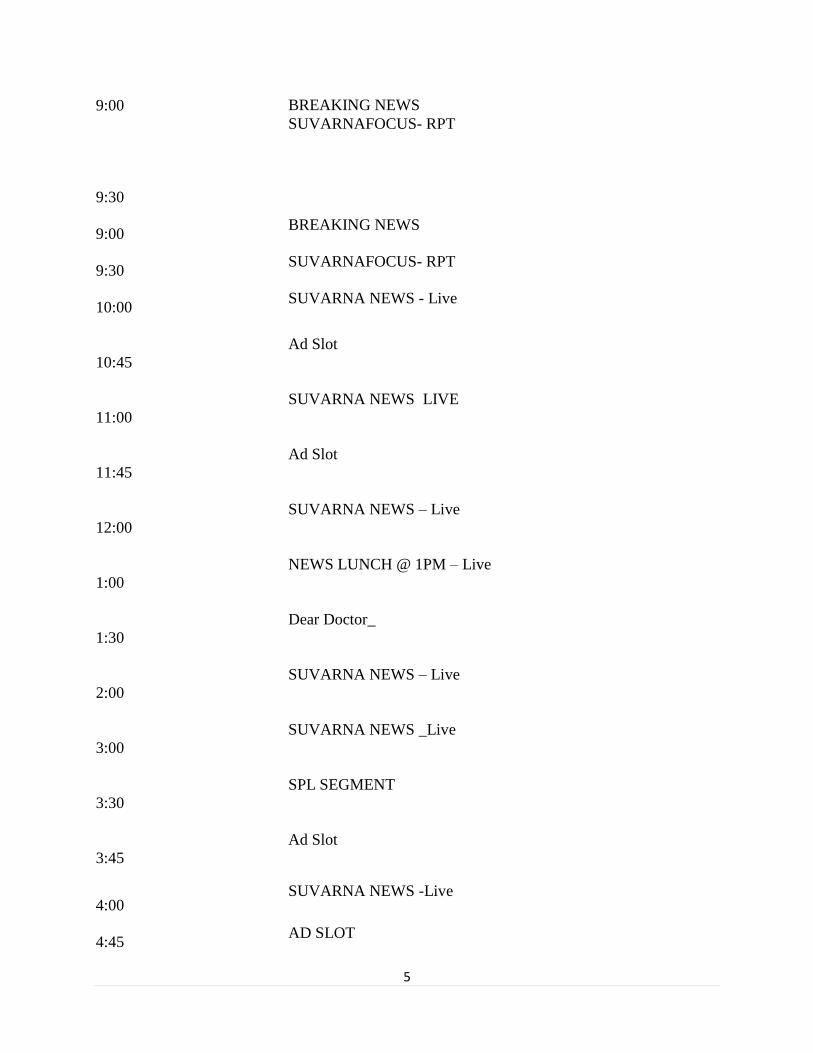
9:00 BREAKING NEWS
9:30
SUVARNAFOCUS- RPT
9:00 BREAKING NEWS
9:30 SUVARNAFOCUS- RPT
10:00 SUVARNA NEWS - Live
10:45
Ad Slot
11:00
SUVARNA NEWS LIVE
11:45
Ad Slot
12:00
SUVARNA NEWS – Live
1:00
NEWS LUNCH @ 1PM – Live
1:30
Dear Doctor_ Live
2:00
SUVARNA NEWS – Live
3:00
SUVARNA NEWS _Live
3:30
SPL SEGMENT
3:45
Ad Slot
4:00 SUVARNA NEWS -Live
4:45 AD SLOT
6
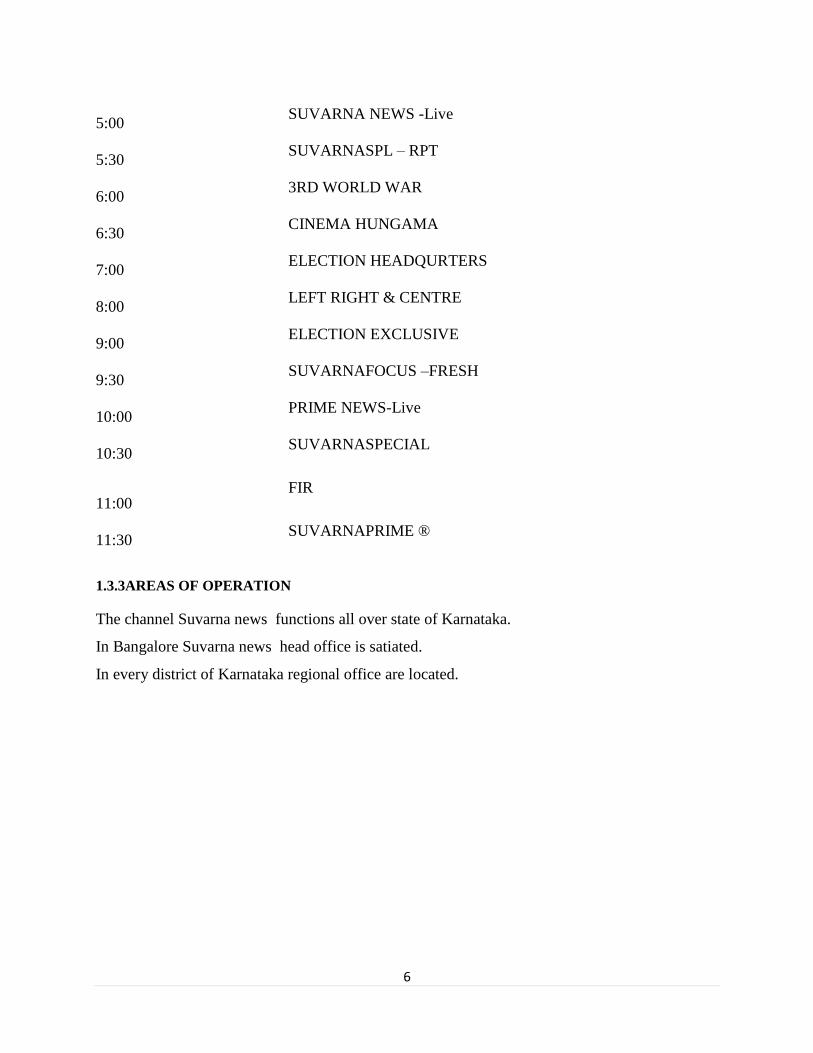
1.3.3AREAS OF OPERATION
The channel Suvarna news functions all over state of Karnataka.
In Bangalore Suvarna news head office is satiated.
In every district of Karnataka regional office are located.
5:00 SUVARNA NEWS -Live
5:30 SUVARNASPL – RPT
6:00 3RD WORLD WAR
6:30 CINEMA HUNGAMA
7:00 ELECTION HEADQURTERS
8:00 LEFT RIGHT & CENTRE
9:00 ELECTION EXCLUSIVE
9:30 SUVARNAFOCUS –FRESH
10:00 PRIME NEWS-Live
10:30 SUVARNASPECIAL
11:00 FIR
11:30 SUVARNAPRIME ®
7
1.3.4INFRASTRUCTURAL FACILITIES
In Banaglore city Suvarna news Channel media headquarters is located in, ASIANET NEWS
NETWORK PRIVATE.LIMITD #36,Cresent street, Bengaluru – 560001.Suvarna news office
as a range of 5000 sq.ft,and it has floor on 3 .In third floorstudio outfitted , second floor
examines all the news gathering and showing, first floor is kannada prabha office, ground floor
considers of utilitarian offices, for example, Marketing, Finance and Human Resources. The
place of work has certain facilities like AC, UPS move down, CC TV cameras fixed in all the
floors. The place of work has a parking facility where bikes and four wheelers can be parked.
1.4COMPETITORS OF SUVARNA NEWS
TV9: Hyderabad based sneha television network owns TVP, sneha television functions in other
state like Karnataka, Telangana, KeralaAndhra Pradesh,, Madhya Pradesh, UP .
Public TV:Writeman media private.ltd was started public tv on 26 January 2012 .a program
called Big bulletin hosted by H R Rangnath at 9p.m is showcase show of Public TV. currently
public tv only satiated in Karnataka and has vast viewers base.
NEWS 18 Kannada: ETV news is a piece of news l8 Network .earlierit was called as Etvnews .
It was owned news l8 media and 1nvestment 20l6. At first it started its work from hydarbad latter
they started their office in
1.5 SWOT ANALYSIS
Strength
1. Suvarna news provides quality services by providing accurate news which in
turn increases the TRP.
2. It provides accurate information which intern increases the goodwill the company.
3. Suvarna news has high TRP and is 3rd
highest in TRP which states the efficiency
and effectiveness of the news stated by them.
8
4. It also focuses on social responsibility by encouraging the youth to come forward
for the societal developments.
5. The company also conducts varies activities like Asamanya Kannadiga , Kiriya
Sampadaka,etc
Weakness
1. The company is lagging behind the TV9 channel which acts as a weakness to the
company.
2. As it is concerned with news aspects it lacks in providing the entertainment
towards the viewers.
3. As it‟s a media industry they end up with high expenses. Expenses like vehicle,
camera , television, control system etc.
4. Maintenance cost will be high for channel
5. Still they not came up with Hd channel ,
Opportunity
1. They can generate huge income from advertisement ,that can be used for other
purpose
2. There is a chance for growth of channel ,as their in 3rd
in TRP they have potential
to increase the no viewer
Threat
1. High competition from other news channels inn Karnataka like TV9 , Public tv
etc.
2. Increasing no news channels in Kannadalanguage .
9
1.6FUTURE GROWTH PROSPECTS
Currently as per TRP Suvarna news are in 3rd position in the Kannada media industry and
theygoingtooccupy the2nd
positiontacklewith tight rivalry from PUBLIC TV. Suvarna news has
the all chance to rise up to 1st place however TV9 is doing extremewell.
They are presently doing very good in industry by providing quality programs.they have a
hightoincrease their position.
1.7FINANCIAL STATEMENT
Company is not ready to disclose their balance sheet .I tried by best to get the balance sheet of
the company but company refused to give .and they are not even disclosed in website also
10
CHAPTER 2
CONCEPTUAL BACKGROUND AND LITERATURE REVIWE
2.1 VIEWERS SATISFACTION
Viewer is one who watches the TV or can be called as the follower of the programs telecasted on
on TV otherwise called observer. Viewer‟s satisfaction is public reaction of satisfaction on
something. He may be dependent on a specific sort of show in view of his inclinations and taste,
he sees just those projects which are pulled in to or else he would be not intrigued to keep
watching the shows. Viewers‟ satisfaction fluctuates on every individual gathering of people; it
relies on upon his own particular perspectives with reference to his method for conduct
fabricating his inclination on something.
Associations need to hold existing watchers whileifocusing on non-watchers.Evaluating
watcher's satisfaction provides a sign of how intense the channel is at giving its support of its
watcher's base.
The more the viewers are satisfied the more the viewership, a news channel gets more TRP when
the perspectives to it get higher or the perspectives is expanded. Viewers satisfaction relies on
upon the different variables and the elements are numerous which shifts and is minimal elusive
out. The level of satisfaction relies on upon different measurements fluctuating with that of time
and individual inclinations; chiefly Viewers satisfaction profoundly changes on every person as
every individual inclination have diverse conclusions, thinking way, way of life prompting the
adjustment in their inclinations.
Viewers satisfaction can be based on channel presentation, brand image, reliability, quality, facts
, information provided, accuracy, transparency, debates etc
11
Viewer satisfaction is an unclear and theoretical thought and the genuine appearance of state of
satisfactioniwill change fromiindividualtoiindividual and program to program. The satisfaction
of viewers dependson their mentaliand physical components.
Viewers satisfaction is a testing assignment to the news channels. The news channels viewership
varies from that of other general diversion channels in light of the fact that the nature and
substance of subjects totally vary from each other and thus it is a testing, hard assignment to look
for high viewership, it is an alternate viewership hypothesis for the news channels.
2.2 LITERATURE REVIEW
1. Cronin and Taylor (1992),Client fulfillmenthasibeen believed to built upion the
customers commitment on particularorganizationiencounter, it is according to the
mode that association quality is a determinantiof customer commitment, theiquality of
the association starts with the ultimate result of the association of the main group of
members
2. Fornell (1996); Spreng and Macky (1996), Regarding the association between
shopper reliability and organizationiqua1ity,iOliver (1993) at first prescribed that
organization qua1ity would be forerunner to purchaser unwaveringness payingilittle
regard to whetherithese assembles were joined or trade specific.
3. .Haywood (1988), The reason for providing qualityorganization is to fulfill
customers. Estimating organizationiqualityiis a better approach than oversee
whetherithe associations are amazing or appalling and whether the customer‟s willor
are content with it.
4. . Haywood-Farmer J (1988),Service qua1ity in the association and publicizing
forming is how much clients' viewpoint of association meet or possibly beat their
yearnings for instance as depicted by Thus advantage quality can want to be the path
in which clients serves as alliance which could be magnificent oripoor.
12
5. Kotler and Keller (2009), At the point when a buyer/client is appeased with either the
thing or associations it is named fulfillment. Fulfillment can in like way get it done
suppositions of satisfaction or disillusionment that outcomes from looking thing's
obvious execution or result with their objectives.
6. Kotler and Keller (2009), Paying little regard to whetherian organization provide
qualityiorganization or not will rely upon the customerspromise on the fulfillment they
got from utilizing things,since two more raised measuresiof noteworthy value incite
greater measures of buyer unwaveringness.
7. Kotler (2002),“Qualityican additionally be depicted as totalityiof parts and
characteristics of a thing or associations that bear on its capacity to fulfill conveyed or
induced requirements. Unmistakably quality is correspondingly noticed with the
estimation of offer, which could do fulfillment or dissatisfaction concerning
theclient.”
8. Kotler (2002),Mostiaffiliations are dealing with qualityiorganizational plans that are
designed to strengthen their ways of doing things and show shapes because they have
been proven that "quality particularly impacts thing execution, and in this manner on
buyer dependability" . The elucidation behind this is to fulfill the clients. Regardless,
are the clients fulfilled in light of the things or organizationiquality.
9. Kotler (2000 ),Depicted fulfillment as a man's thought rapture or disappointment
happening in perspective of looking things' apparent execution (or result) in
relationship with his or her desires. Right when clients bend up without a doubt
fulfilled about the respect that is offered and every once in a while his or her longing is
met and beated, can make numerous purposes of enthusiasm for a firm. Positive
easygoing exchange from existing and fulfilled clients as a not as much as trustworthy
lead can change over into all the more new clients to the firm.
13
10. Kotler (2002), Customers always want to getithe most important satisfaction from the
goods or organizationsithey purchase. Winning today‟s business focus includes the
need customer relationships rather than just sprouting things; establishing customer
relationships means pushing competitors to prioritize the motivation of their target
customers.
11. Levy (2009), Measuring purchaser faithfulness could be incredibly troublesome once
in a while in1lightiof theoifactiis an attempt to gage people‟s feelings. Itiwas along
these lines some expert showed that "the slightest troublesome way to1deal with knows
how client‟s feel, as well as what1they need is1to1ask them" this associated1with the
easygoing measures.
12. Parasuraman (1985); Parasuraman (1995);Saravana and Rao (2007), The audit,
proposediwhenseen advantage quality higherithen it will incite augment in purchaser
faithfulness. Some extraordinary makerigraspedwith the ideairaised by andthey
perceivedithat "Customer dependability is basediupon the levelof organization
qualityithat is given by the authority centers".
13. Peyton R.M. (2003),In theiworkingipaperisubmitted at the academicsiInternational
Conference of the Joint College, aicomprehensive review of the various proposed
customer satisfaction and dissatisfaction (CS / D) theories was conducted. These
works were especially before the 1990s. This study focuses on most of the preparatory
work for basic authority and focuses on solving related problems that are closely
related to the estimation
14. Scheifman L. G. Also, Lazarkanuk L. (2004), Customer satisfactioniportrayed as
"the individual'siirrespective of the execution of the things or organizations in
association with his or her yearnings". Prettyimuch, shopper devotion could be the joy
gained from using an offer.
14
15. Sivadas and Baker-Prewitt (2000), Su et al (2002), In understanding with the
disclosures of their examination ofcustomer devotion and organizationquality,
foundthat; these two components are associated, confirming implications, both
variables which have reliably been associated. The also coordinated that organization
qualityiis more extraordinary. Itmaybe affected by perspective of noteworthy worth or
byithe experiencesof othersthatmay not be so awesome, than buyer reliability
whichreflectscustomer's feelings about many encountersand experiences with
organization firm.
16. H.NareshRao and Dr. B.K Ravi (2015), The news is been gotten a handle on by the
general population through TV news channel. India has news directs in local dialects.
In view of the cosmopolitan way of urban communities like Bengaluru there is
numerous 24 hour news diverts in both English and Kannada from the city. The set up
speculation in the review tells that T.V news gathering of people will confide in
neighborhood channels more than that of the national news channels. The specialist
utilized poll to discover regardless of whether the theory is right with that of
profundity meetings of nearby news channels
17. Vavra T.G. (1997),Proposes particular projects to enhance the estimation of consumer
loyalty in an association. The creator depicts five basic abilities required for this
taskviz. Examining/client member choice, poll configuration, talking with/overview
organization, information examination, and qualityicapacity arrangement building
activity arranges.
15
18. . P. Sankar,(2015), This review depends on recognizing the watcher's inclination and
fulfillment to News directs in connection to a Tamil Nadu state. The opposition figure
the news channel is the highlight of the current circumstance. This paper has
attempted to investigate watcher' fulfillment and inclinations and their effects for the
different Tamil news channels and reposition impacts
19. Wilson et al (2008),Inrelations to buyers loyalty andiorganization quality,
departments greatness and estimationsiof satisfaction and organizations quality ae
more correct . satisfaction and organization quality have some similar things but all
thethings considered are a broader idea of satisfaction but the all the quality of
excellence is particularly focused on organizational assessment.
20. Zeithaml (2006), Although it communicated that diverse components,instance, cost
and thing qualityican impact buyer devotion, saw advantage qualityiis a fragment of
shopper steadfastness This speculation complies with the idea has been insisted by
thesignificance of buyer faithfulness showed by various authorities.
16
CHAPTER 3
RESEARCH DESIGN
3.1 STATEMENT OF PROBLEM
To know the viewers satisfaction towards Suvarna channel and what are the reason control them,
questionnaires were distributed individually to derive reliable data about the above mentioned
problem. Those data are very useful for development of programs
3.2 NEED FOR THE STUDY The necessity of the review to mainly to get whether viewer
satisfied or not for the news conveyed by the channel.which will be useful thing in improving
business of the channel. This review gives the results of viewer‟s recognition and satisfaction
which is the main factor for the improvement of channel.This study helps in knowing what is
needed and yet to deliver so that it will reach more and more no of viewers the purpose of
contrasts among watchers and serves to see what they need in connection to news
communicate.this will help in knowing the viewer satisfaction of people who watch Suvarna
news in Bangalore
3.3 OBJECTIVE OF THE STUDY
1. To find out the major factors that influences the viewer‟s in channel Selection.
2. To study the audience/viewer‟s preference towards channels..
3. With the viewer„s preferences how we can help in the Development of the products
3.4SCOPE OF THE STUDY
Scope of study is mainly concerned with Suvarna news only . This review is mainly useful in
making an attempt and concentrate on those area that are critical to be focused for viewers
satisfaction. This view point‟s helps in concentrating on the areas to upgrade viewers satisfaction
of news channel. This study will support Suvarna news 24x7 to improve their program
parameters which they have not considered.
17
RESEARCH METHODOLOGY
3.5.1 RESEARCH DESIGN:
Descriptive Research was done as the characteristics of consumers was studied pertaining to Suvarna
news channel
3.5.2SAMPLING TECHNIQUE:
The sample was collected using random Sampling Technique for the current research.
3.5.3SAMPLING UNITS
The sampling unit for the study was from the Bangalore region
3.5.4 SAMPLE SIZE
Sample size was taken to 100
3.5.5 RESEARCH INSTRUMENT
Questionnaire
3.5.6 DATA AND SOURCES OF DATA
Through sutured questionnaire Primary data was collected.
Through journals, books and websites Secondary data was collected.
3.6 Hypothesis:
H0: There is no relation between Brand Image and Variety of Program
Ha: There is a relation between Brand Image and Variety of Program
18
3.7LIMITATIONS OF THE STUDY
Subscriber‟smindset affects the accuracy of data.
The sample chosen comprises of more of students and home makers and less no business
respondents were taken
Only 100 Sample size was selected .so could not able to take response from many
viewers
As review was taken only by viewers in Bangalore city, could not reach other places .so
sample is limited to only one city
Most ofthe viewers of news channel are above 50 years of age but in this case, most of
the respondents were youths. Hence it might affect the results
As I got limited time to research .it is difficult to do the accurate research
19
CHAPTER 4
ANALYSIS AND INTERPRETATION OF DATA
4.1 DATA ANALYSIS AND INTERPRETATION
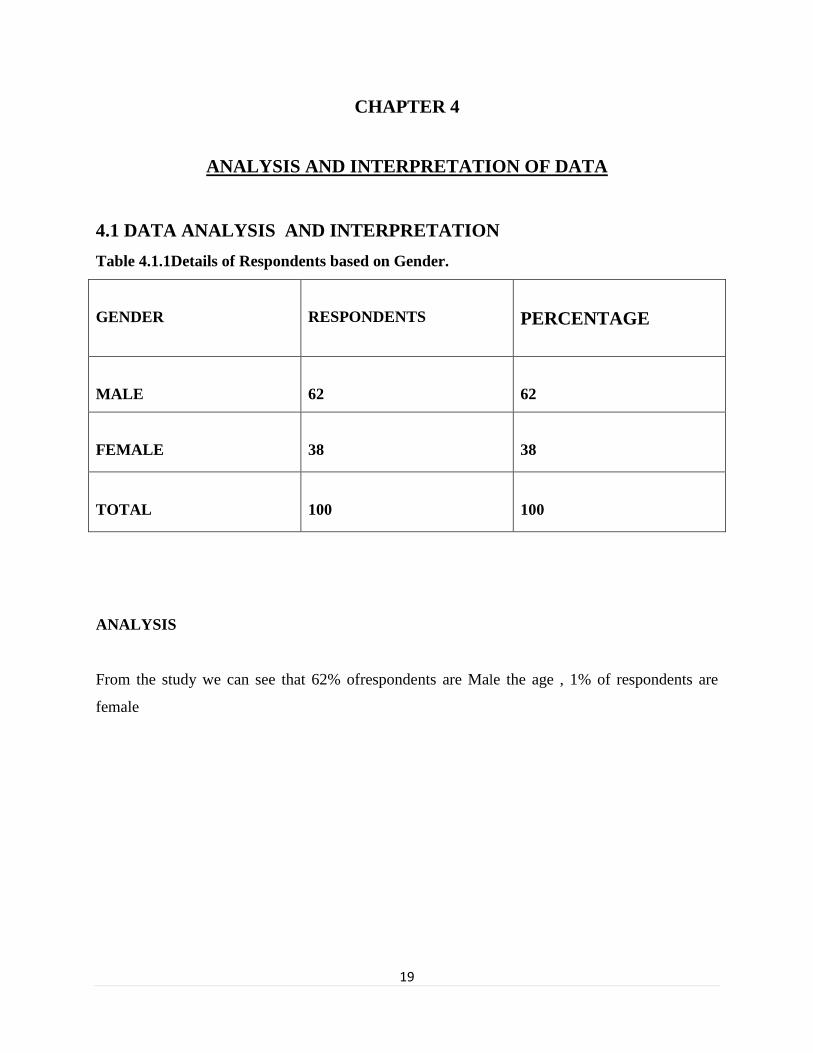
Table 4.1.1Details of Respondents based on Gender.
GENDER
RESPONDENTS
PERCENTAGE
MALE
62
62
FEMALE
38
38
TOTAL
100
100
ANALYSIS
From the study we can see that 62% ofrespondents are Male the age , 1% of respondents are
female
20
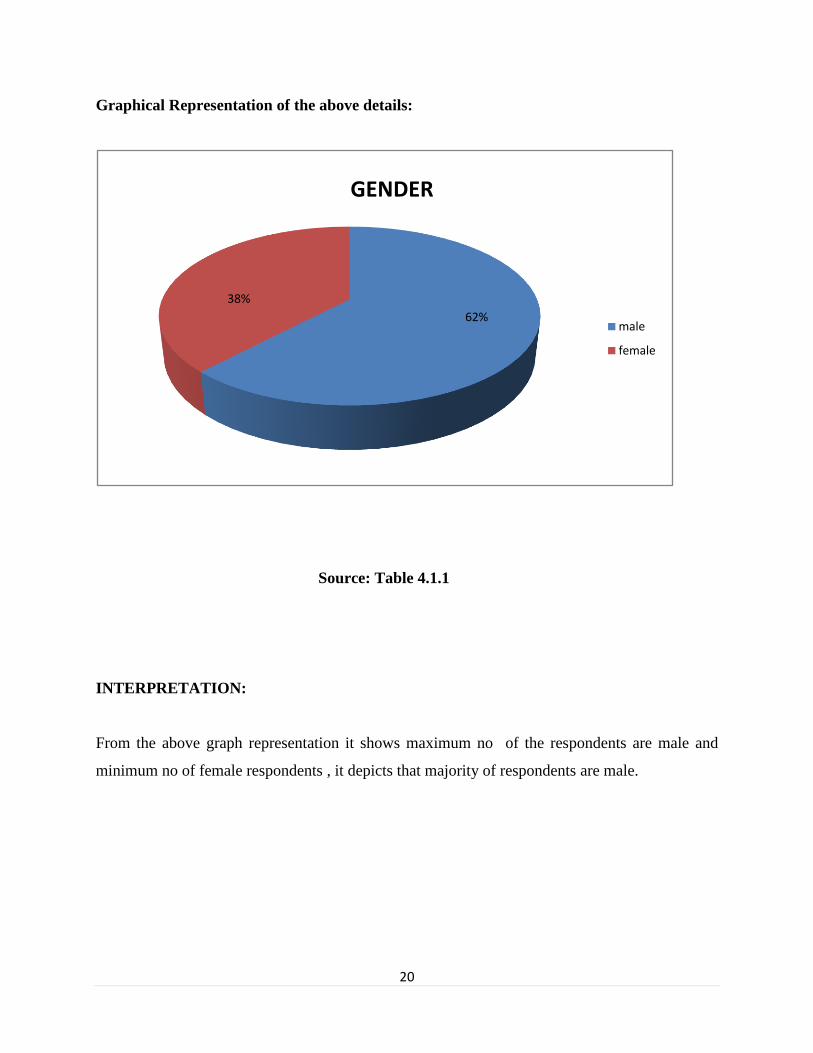
Graphical Representation of the above details:
Source: Table 4.1.1
INTERPRETATION:
From the above graph representation it shows maximum no of the respondents are male and
minimum no of female respondents , it depicts that majority of respondents are male.
62%
38%
GENDER
male
female
21
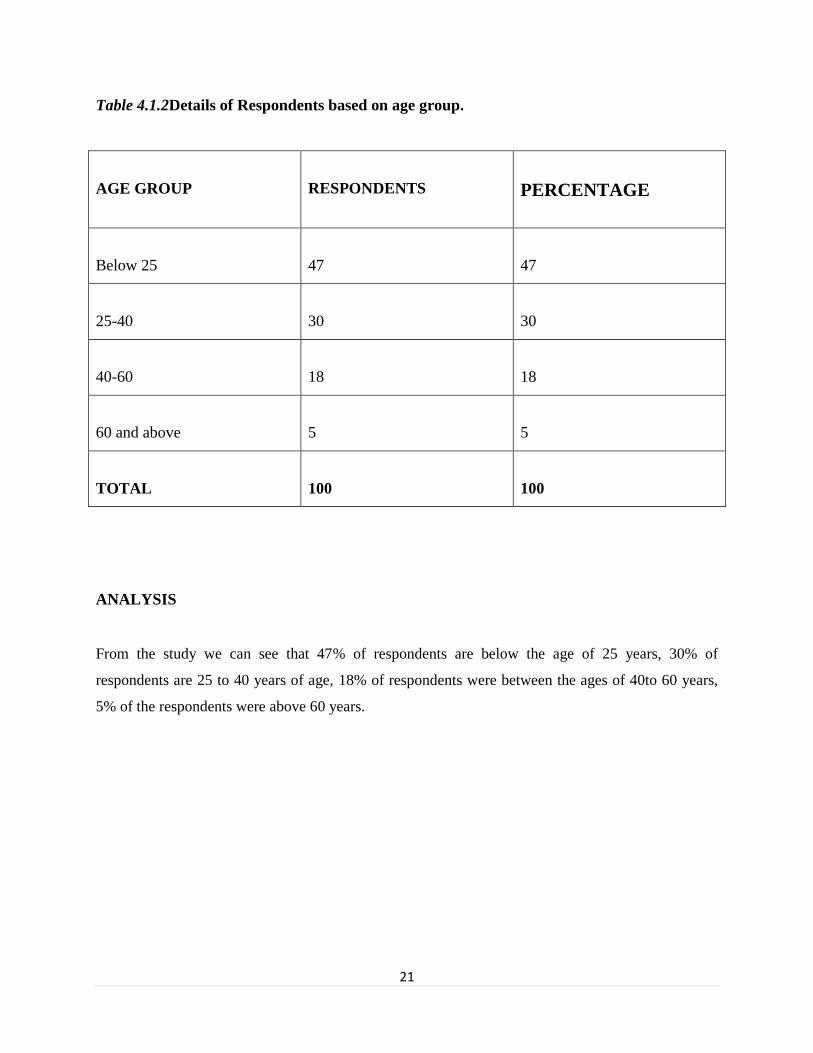
Table 4.1.2Details of Respondents based on age group.
AGE GROUP
RESPONDENTS
PERCENTAGE
Below 25
47
47
25-40
30
30
40-60
18
18
60 and above
5
5
TOTAL
100
100
ANALYSIS
From the study we can see that 47% of respondents are below the age of 25 years, 30% of
respondents are 25 to 40 years of age, 18% of respondents were between the ages of 40to 60 years,
5% of the respondents were above 60 years.
22
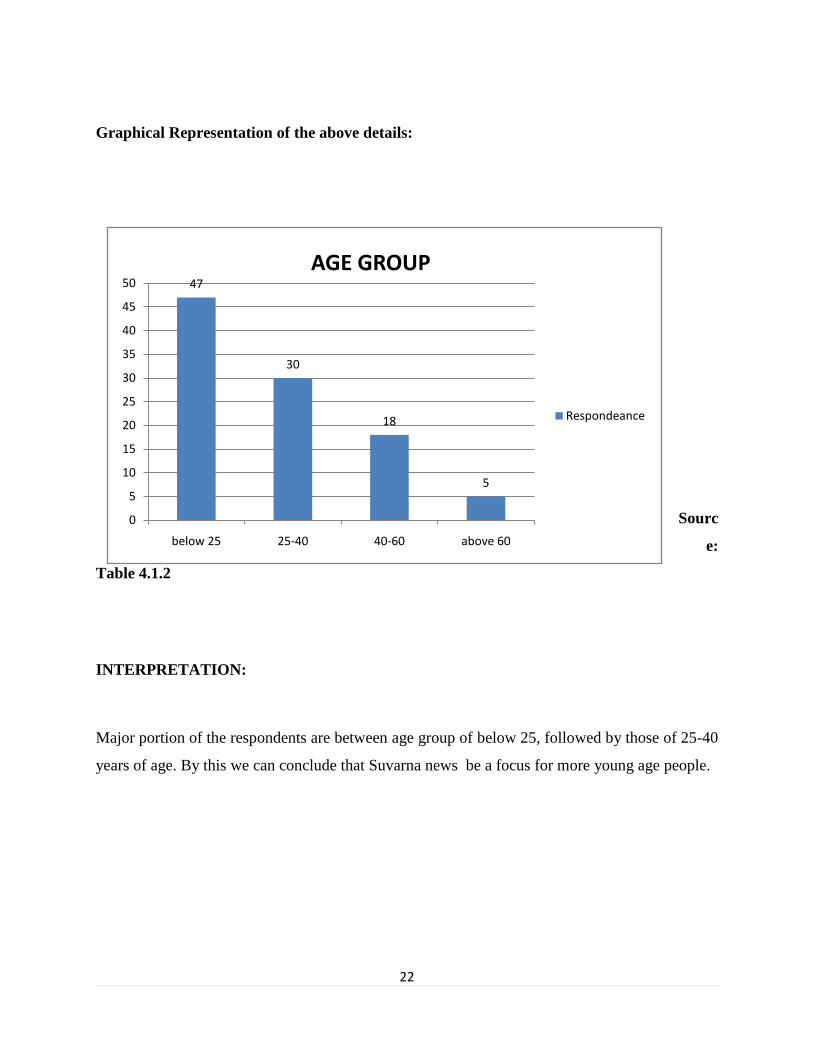
Graphical Representation of the above details:
Sourc
e:
Table 4.1.2
INTERPRETATION:
Major portion of the respondents are between age group of below 25, followed by those of 25-40
years of age. By this we can conclude that Suvarna news be a focus for more young age people.
47
30
18
5
0
5
10
15
20
25
30
35
40
45
50
below 25 25-40 40-60 above 60
AGE GROUP
Respondeance
23
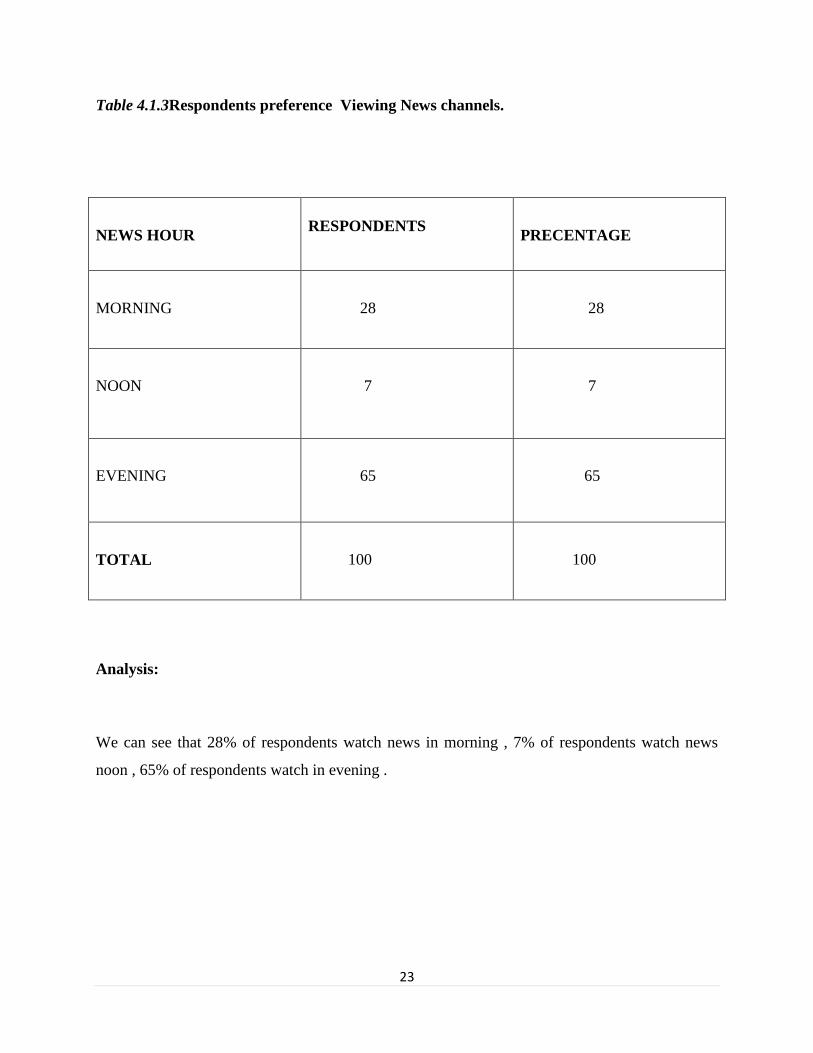
Table 4.1.3Respondents preference Viewing News channels.
NEWS HOUR
RESPONDENTS
PRECENTAGE
MORNING
28
28
NOON
7
7
EVENING
65
65
TOTAL
100
100
Analysis:
We can see that 28% of respondents watch news in morning , 7% of respondents watch news
noon , 65% of respondents watch in evening .
24
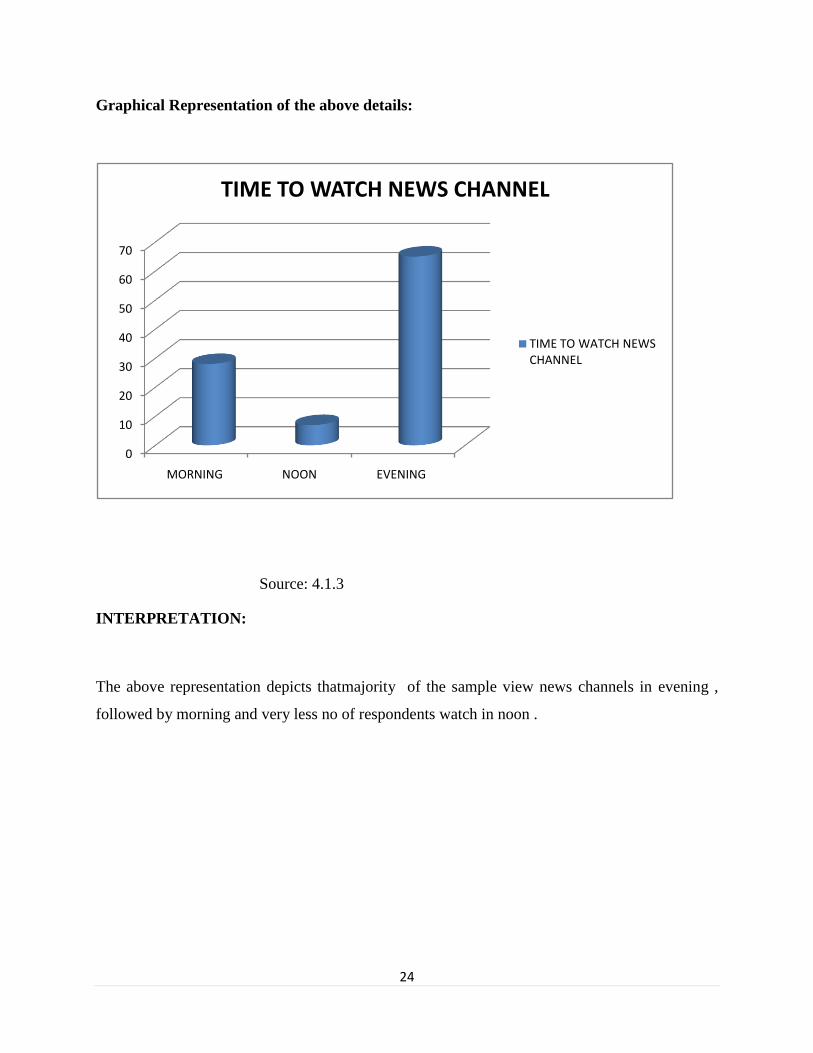
Graphical Representation of the above details:
Source: 4.1.3
INTERPRETATION:
The above representation depicts thatmajority of the sample view news channels in evening ,
followed by morning and very less no of respondents watch in noon .
0
10
20
30
40
50
60
70
MORNING NOON EVENING
TIME TO WATCH NEWS CHANNEL
TIME TO WATCH NEWS CHANNEL
25
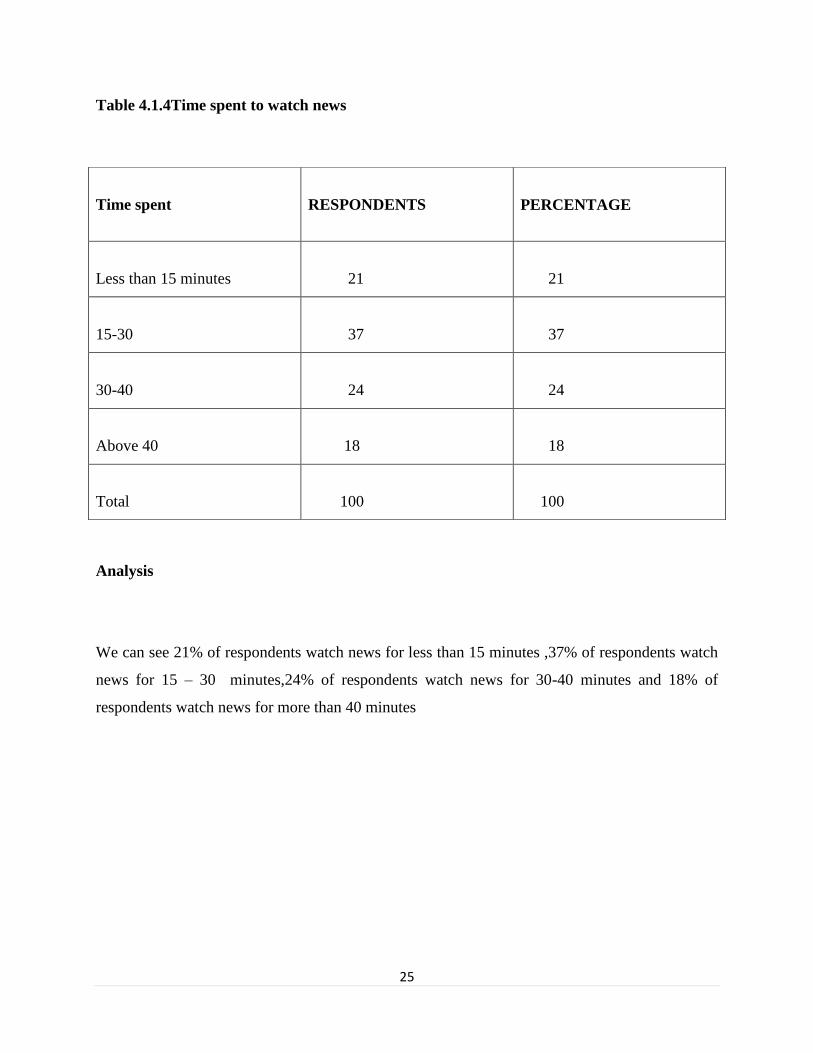
Table 4.1.4Time spent to watch news
Analysis
We can see 21% of respondents watch news for less than 15 minutes ,37% of respondents watch
news for 15 – 30 minutes,24% of respondents watch news for 30-40 minutes and 18% of
respondents watch news for more than 40 minutes
Time spent
RESPONDENTS
PERCENTAGE
Less than 15 minutes
21
21
15-30
37
37
30-40
24
24
Above 40
18
18
Total
100
100
26
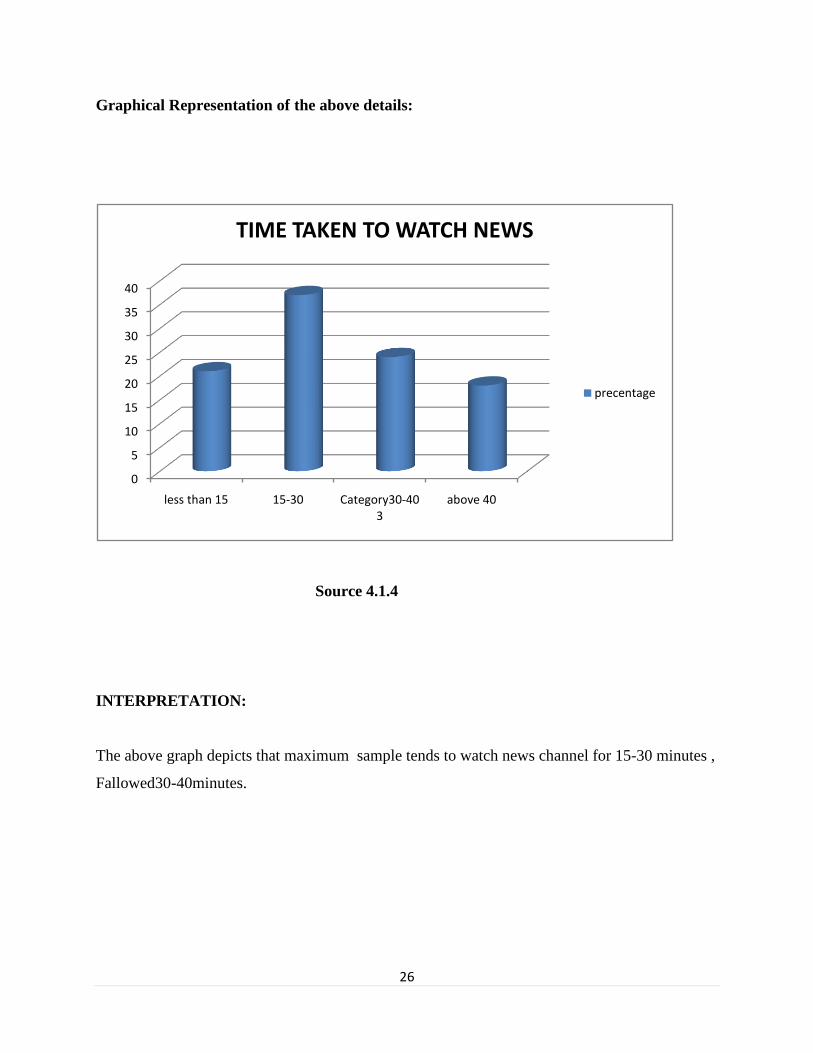
Graphical Representation of the above details:
Source 4.1.4
INTERPRETATION:
The above graph depicts that maximum sample tends to watch news channel for 15-30 minutes ,
Fallowed30-40minutes.
0
5
10
15
20
25
30
35
40
less than 15 15-30 Category30-40 3
above 40
TIME TAKEN TO WATCH NEWS
precentage
27
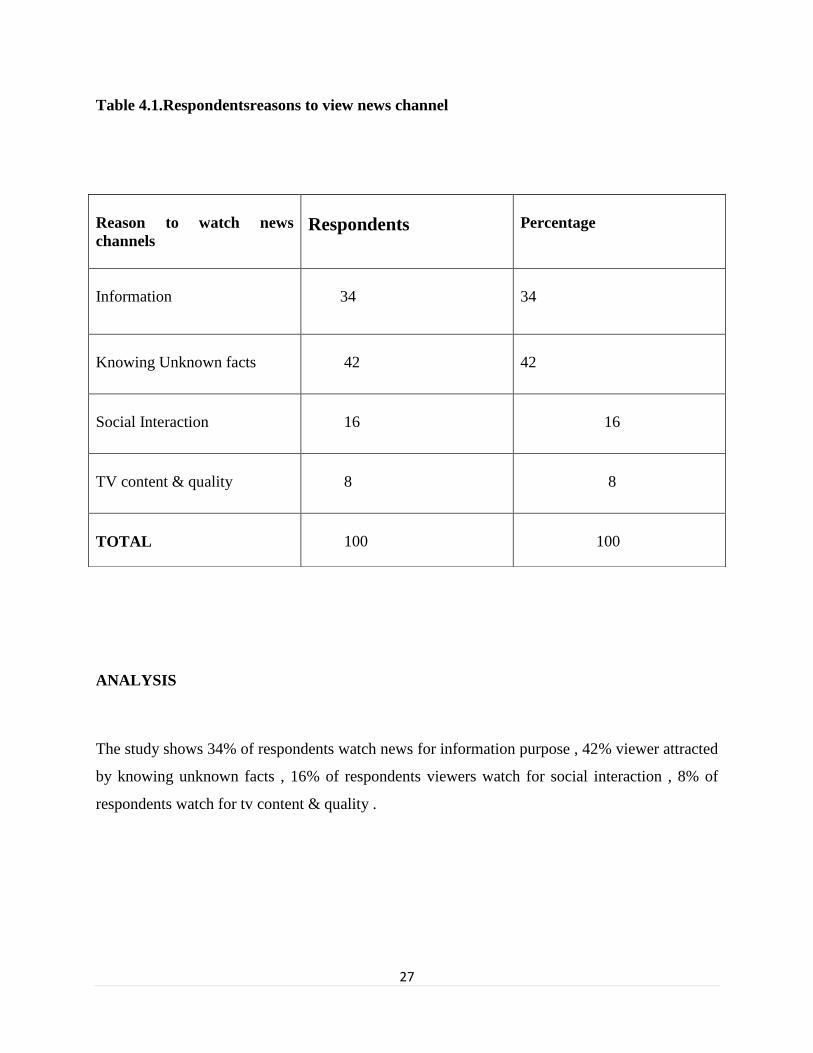
Table 4.1.Respondentsreasons to view news channel
ANALYSIS
The study shows 34% of respondents watch news for information purpose , 42% viewer attracted
by knowing unknown facts , 16% of respondents viewers watch for social interaction , 8% of
respondents watch for tv content & quality .
Reason to watch news
channels
Respondents
Percentage
Information
34
34
Knowing Unknown facts
42
42
Social Interaction
16
16
TV content & quality
8
8
TOTAL
100
100
28
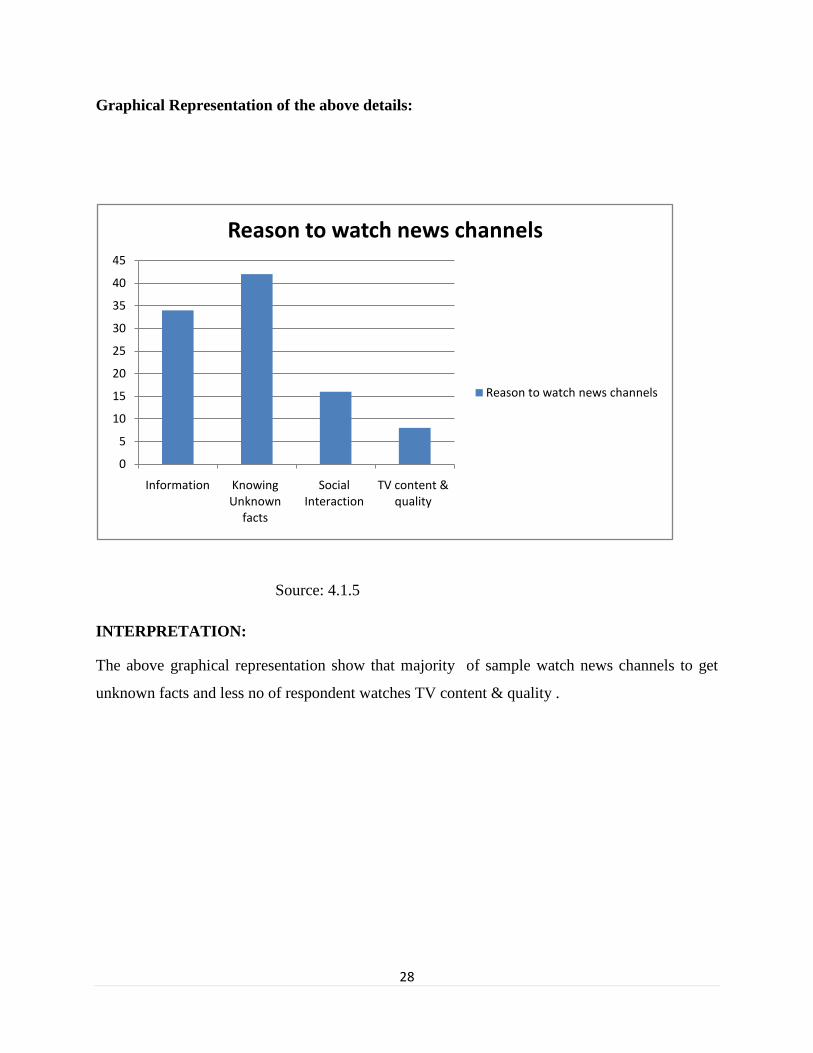
Graphical Representation of the above details:
Source: 4.1.5
INTERPRETATION:
The above graphical representation show that majority of sample watch news channels to get
unknown facts and less no of respondent watches TV content & quality .
0
5
10
15
20
25
30
35
40
45
Information Knowing Unknown
facts
Social Interaction
TV content & quality
Reason to watch news channels
Reason to watch news channels
29
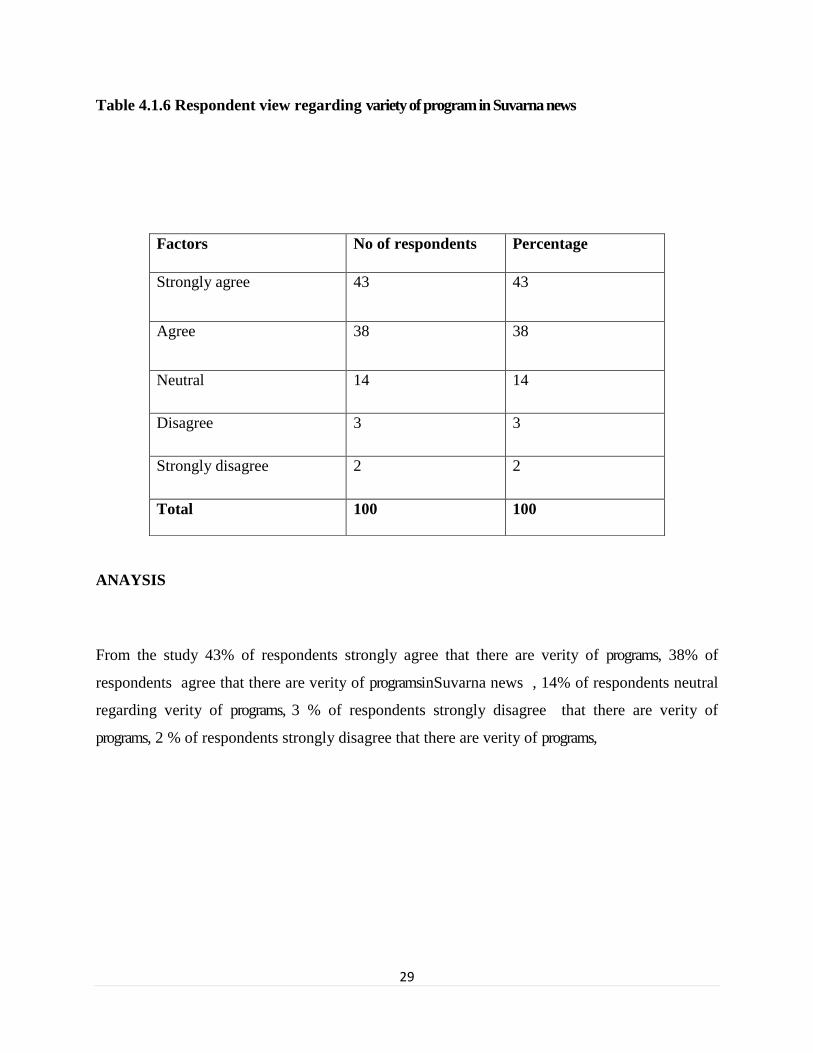
Table 4.1.6 Respondent view regarding variety of program in Suvarna news
ANAYSIS
From the study 43% of respondents strongly agree that there are verity of programs, 38% of
respondents agree that there are verity of programsinSuvarna news , 14% of respondents neutral
regarding verity of programs, 3 % of respondents strongly disagree that there are verity of
programs, 2 % of respondents strongly disagree that there are verity of programs,
Factors No of respondents Percentage
Strongly agree 43 43
Agree 38 38
Neutral 14 14
Disagree 3 3
Strongly disagree 2 2
Total 100 100
30
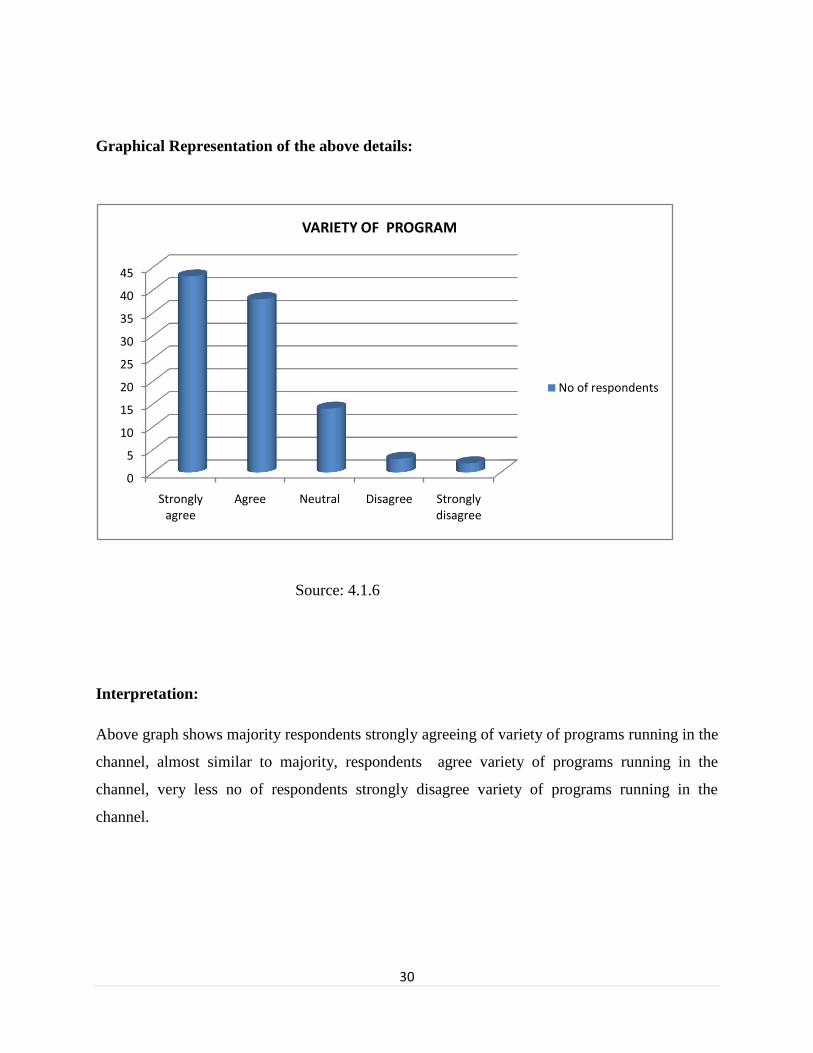
Graphical Representation of the above details:
Source: 4.1.6
Interpretation:
Above graph shows majority respondents strongly agreeing of variety of programs running in the
channel, almost similar to majority, respondents agree variety of programs running in the
channel, very less no of respondents strongly disagree variety of programs running in the
channel.
0
5
10
15
20
25
30
35
40
45
Strongly agree
Agree Neutral Disagree Strongly disagree
VARIETY OF PROGRAM
No of respondents
31
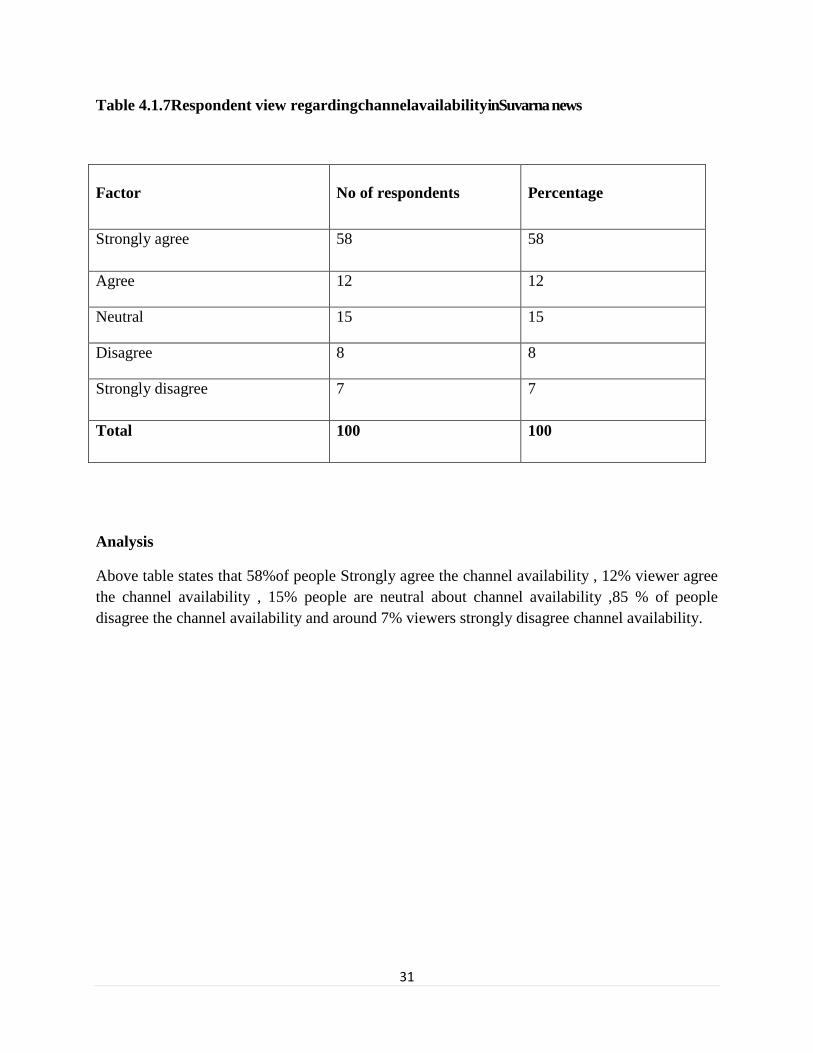
Table 4.1.7Respondent view regardingchannelavailabilityinSuvarna news
Factor
No of respondents
Percentage
Strongly agree 58 58
Agree 12 12
Neutral 15 15
Disagree 8 8
Strongly disagree 7 7
Total 100 100
Analysis
Above table states that 58%of people Strongly agree the channel availability , 12% viewer agree
the channel availability , 15% people are neutral about channel availability ,85 % of people
disagree the channel availability and around 7% viewers strongly disagree channel availability.
32
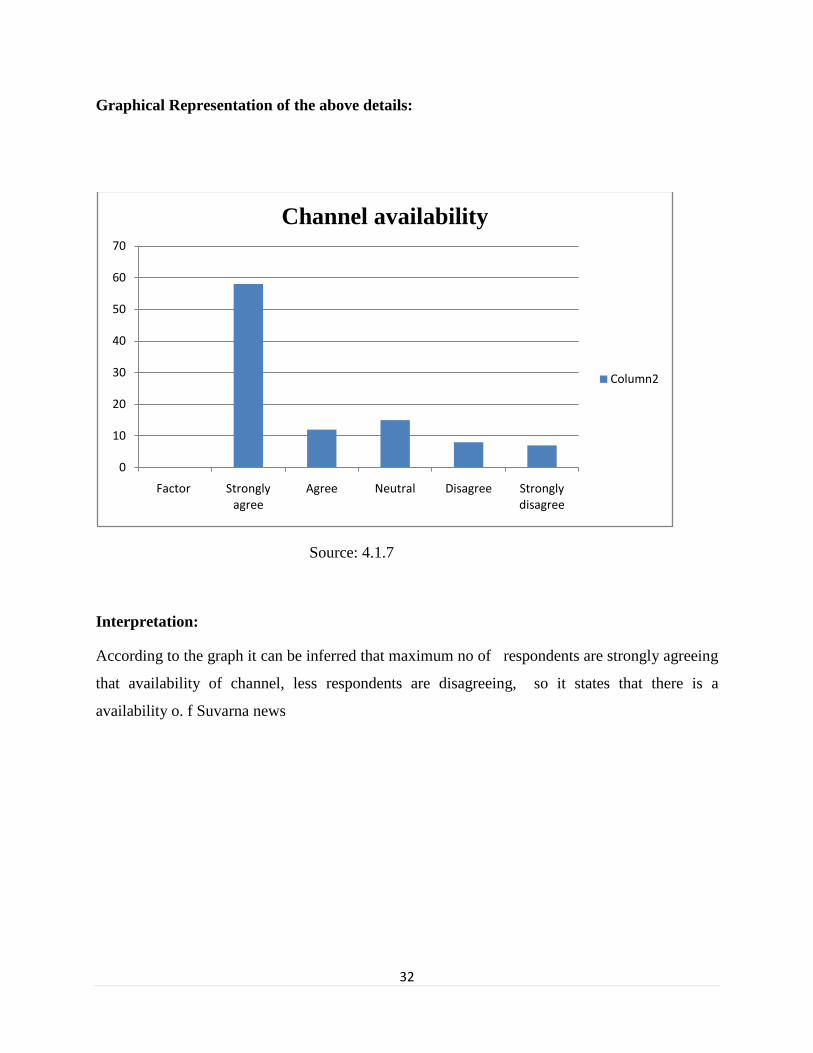
Graphical Representation of the above details:
Source: 4.1.7
Interpretation:
According to the graph it can be inferred that maximum no of respondents are strongly agreeing
that availability of channel, less respondents are disagreeing, so it states that there is a
availability o. f Suvarna news
0
10
20
30
40
50
60
70
Factor Strongly agree
Agree Neutral Disagree Strongly disagree
Channel availability
Column2
33
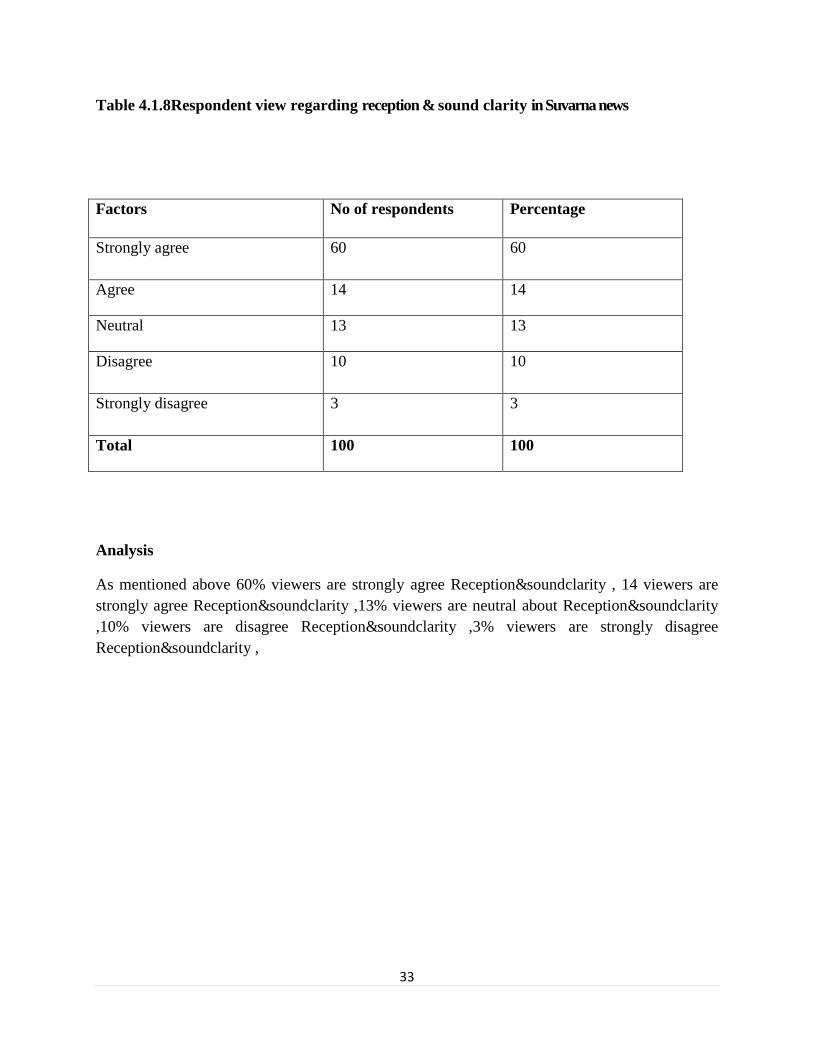
Table 4.1.8Respondent view regarding reception & sound clarity in Suvarna news
Factors No of respondents Percentage
Strongly agree 60 60
Agree 14 14
Neutral 13 13
Disagree 10 10
Strongly disagree 3 3
Total 100 100
Analysis
As mentioned above 60% viewers are strongly agree Reception&soundclarity , 14 viewers are
strongly agree Reception&soundclarity ,13% viewers are neutral about Reception&soundclarity
,10% viewers are disagree Reception&soundclarity ,3% viewers are strongly disagree
Reception&soundclarity ,
34
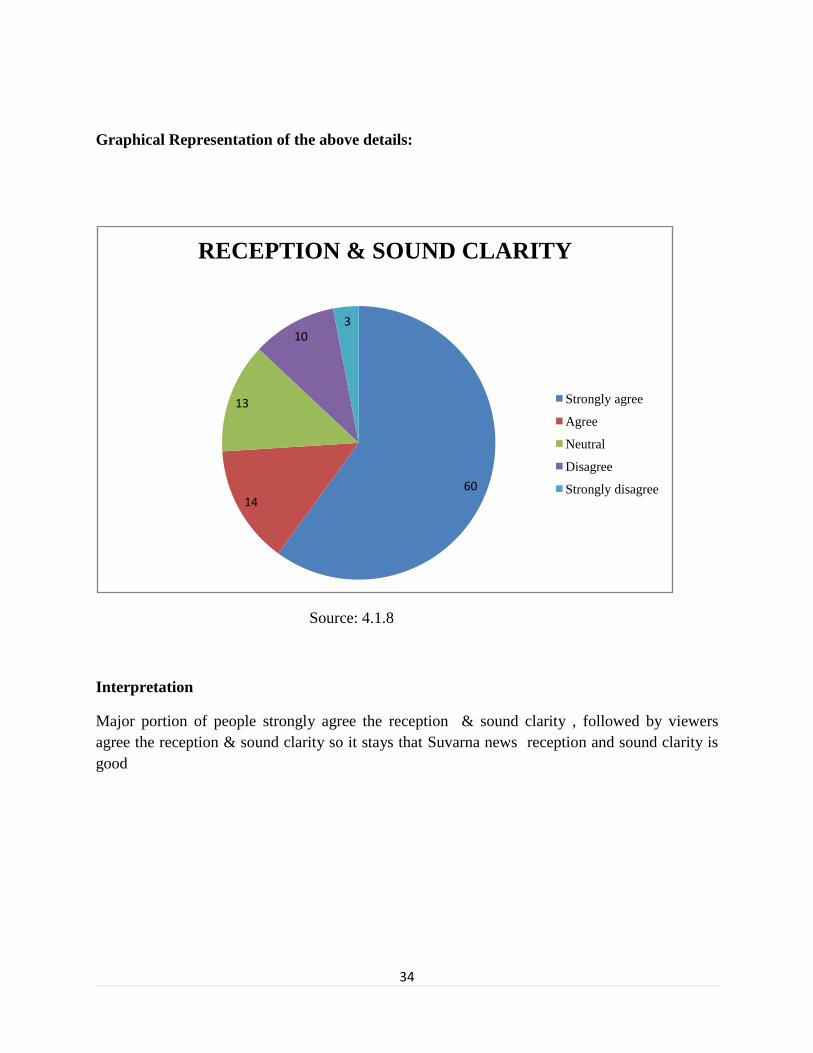
Graphical Representation of the above details:
Source: 4.1.8
Interpretation
Major portion of people strongly agree the reception & sound clarity , followed by viewers
agree the reception & sound clarity so it stays that Suvarna news reception and sound clarity is
good
6014
13
103
RECEPTION & SOUND CLARITY
Strongly agree
Agree
Neutral
Disagree
Strongly disagree
35
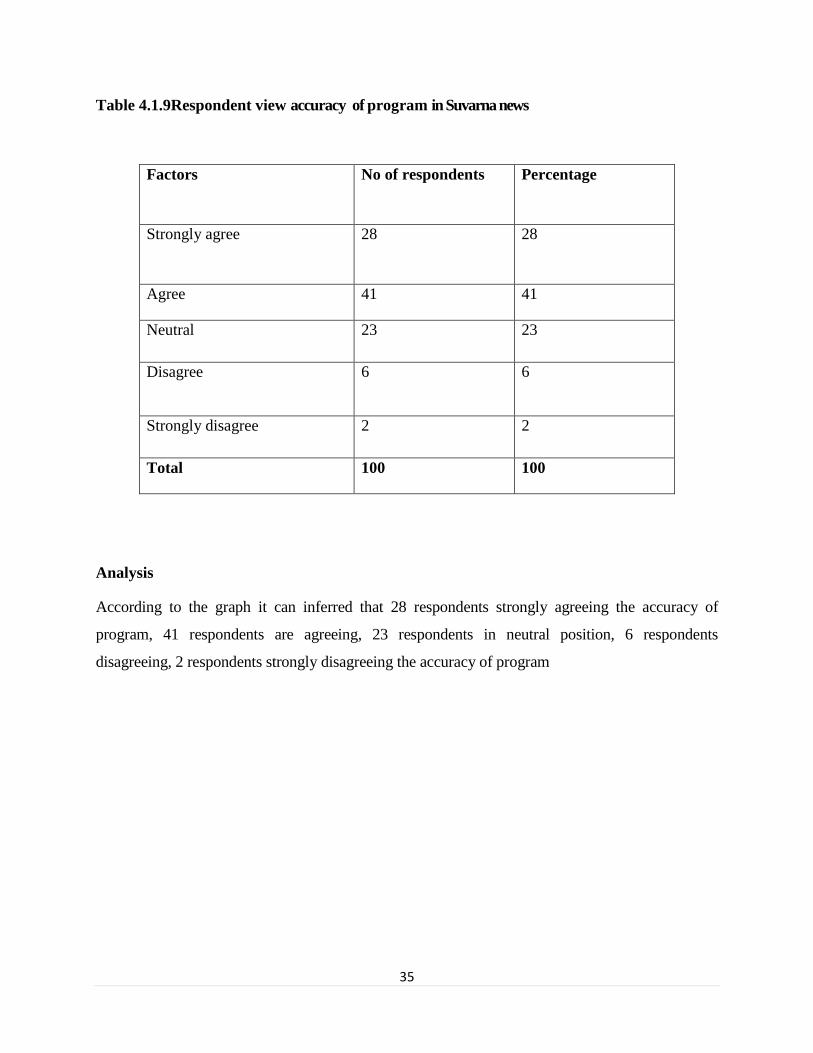
Table 4.1.9Respondent view accuracy of program in Suvarna news
Factors No of respondents Percentage
Strongly agree 28 28
Agree 41 41
Neutral 23 23
Disagree 6 6
Strongly disagree 2 2
Total 100 100
Analysis
According to the graph it can inferred that 28 respondents strongly agreeing the accuracy of
program, 41 respondents are agreeing, 23 respondents in neutral position, 6 respondents
disagreeing, 2 respondents strongly disagreeing the accuracy of program
36
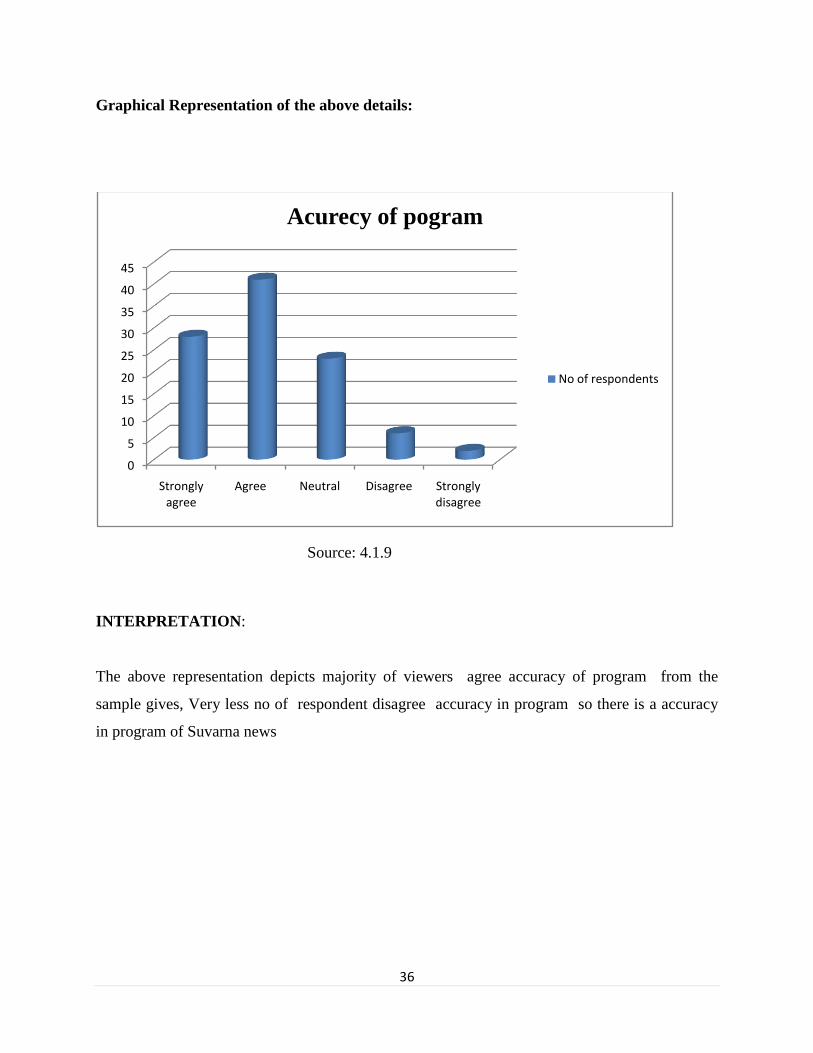
Graphical Representation of the above details:
Source: 4.1.9
INTERPRETATION:
The above representation depicts majority of viewers agree accuracy of program from the
sample gives, Very less no of respondent disagree accuracy in program so there is a accuracy
in program of Suvarna news
0
5
10
15
20
25
30
35
40
45
Strongly agree
Agree Neutral Disagree Strongly disagree
Acurecy of pogram
No of respondents
37
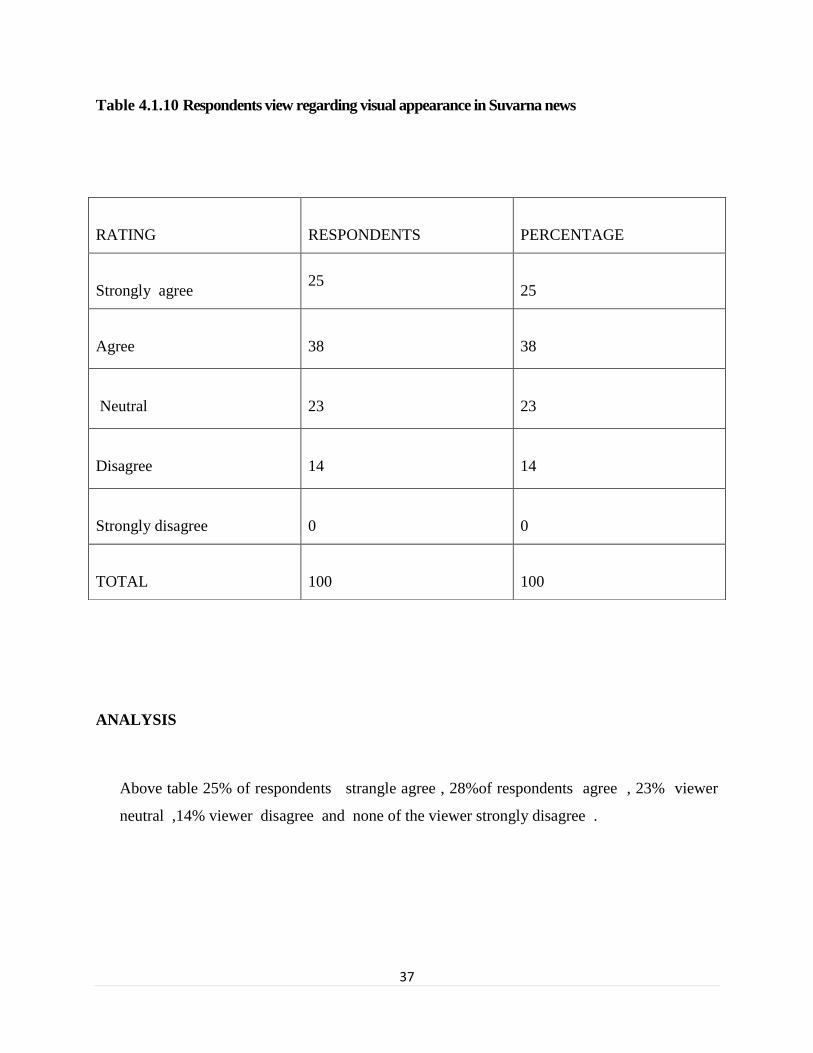
Table 4.1.10 Respondents view regarding visual appearance in Suvarna news
ANALYSIS
Above table 25% of respondents strangle agree , 28%of respondents agree , 23% viewer
neutral ,14% viewer disagree and none of the viewer strongly disagree .
RATING
RESPONDENTS
PERCENTAGE
Strongly agree
25
25
Agree
38
38
Neutral
23
23
Disagree
14
14
Strongly disagree
0
0
TOTAL
100
100
38
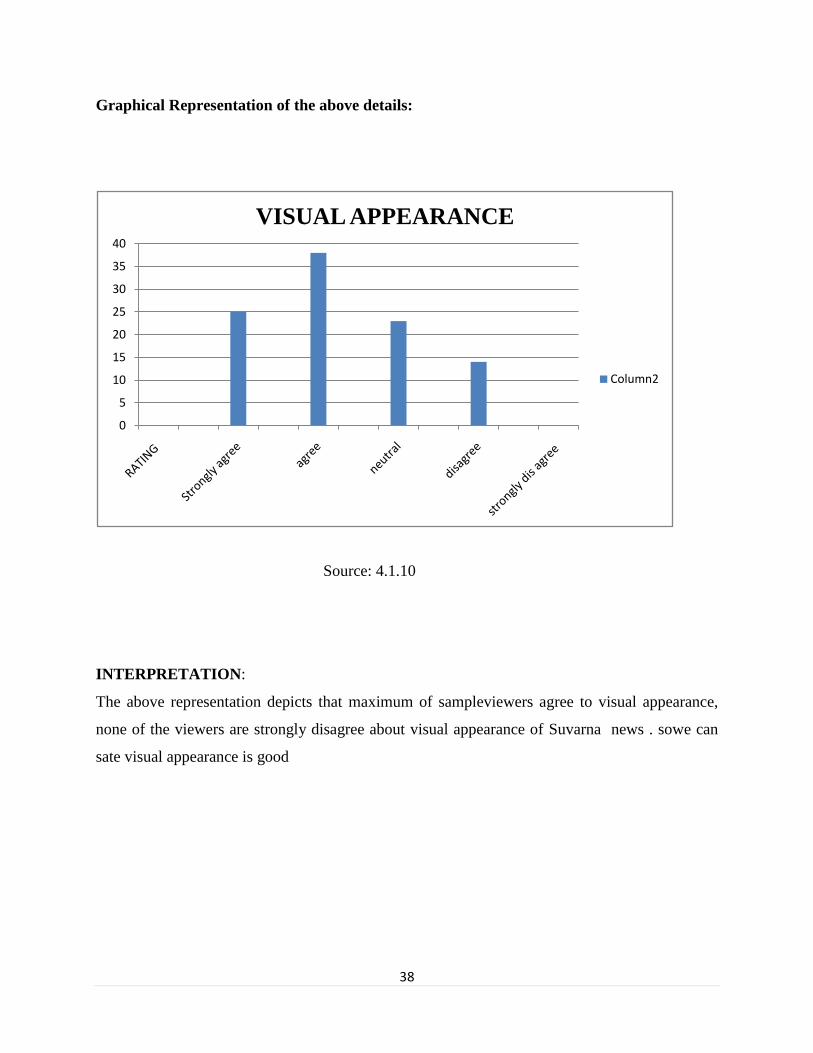
Graphical Representation of the above details:
Source: 4.1.10
INTERPRETATION:
The above representation depicts that maximum of sampleviewers agree to visual appearance,
none of the viewers are strongly disagree about visual appearance of Suvarna news . sowe can
sate visual appearance is good
0
5
10
15
20
25
30
35
40
VISUAL APPEARANCE
Column2
39
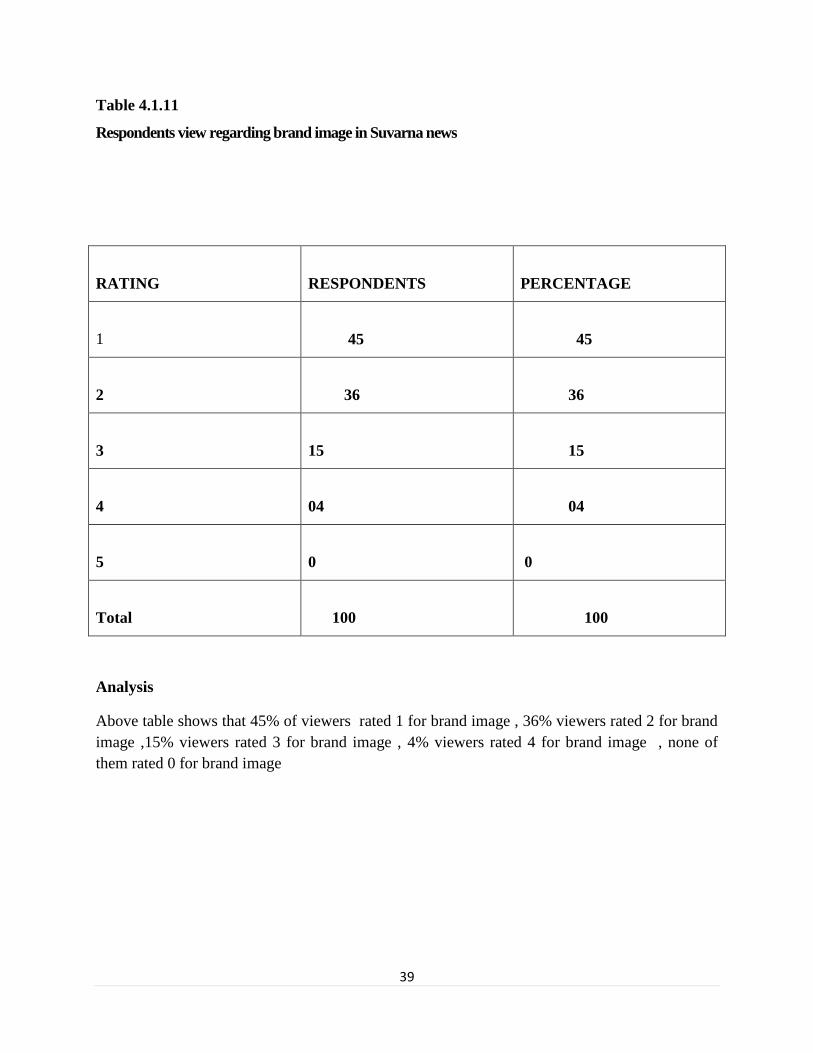
Table 4.1.11
Respondents view regarding brand image in Suvarna news
RATING
RESPONDENTS
PERCENTAGE
1
45
45
2
36
36
3
15
15
4
04
04
5
0
0
Total
100
100
Analysis
Above table shows that 45% of viewers rated 1 for brand image , 36% viewers rated 2 for brand
image ,15% viewers rated 3 for brand image , 4% viewers rated 4 for brand image , none of
them rated 0 for brand image
40
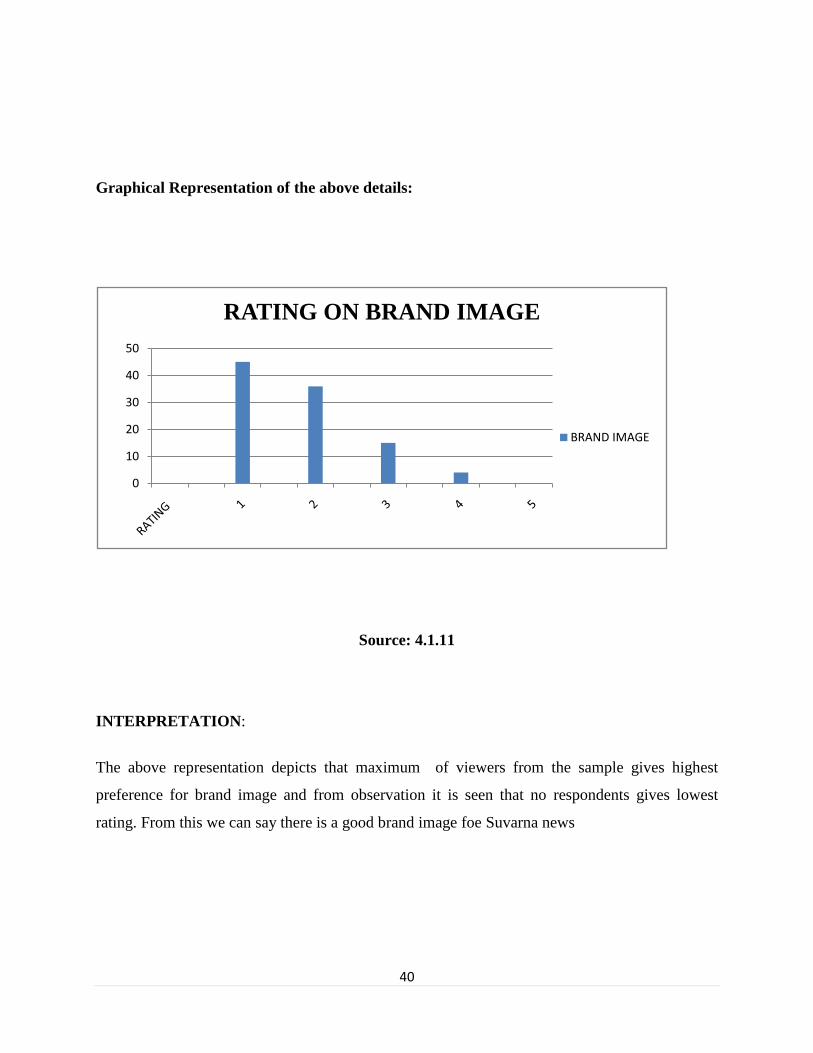
Graphical Representation of the above details:
Source: 4.1.11
INTERPRETATION:
The above representation depicts that maximum of viewers from the sample gives highest
preference for brand image and from observation it is seen that no respondents gives lowest
rating. From this we can say there is a good brand image foe Suvarna news
0
10
20
30
40
50
RATING ON BRAND IMAGE
BRAND IMAGE
41
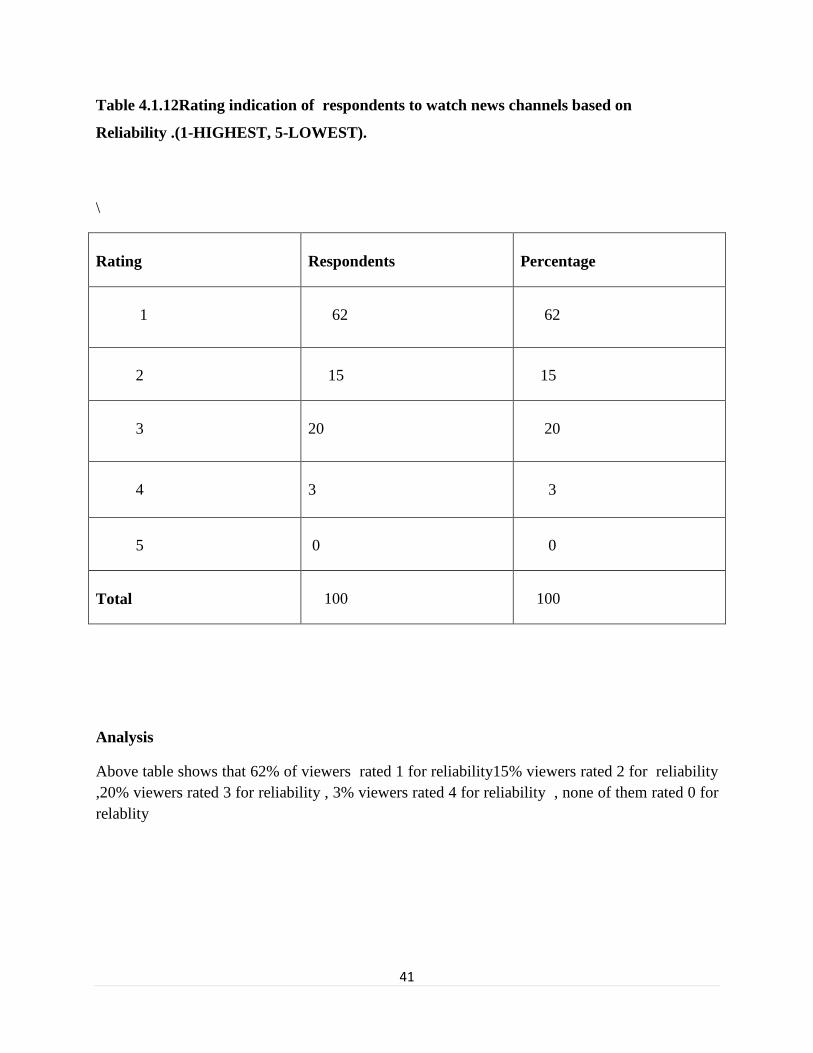
Table 4.1.12Rating indication of respondents to watch news channels based on
Reliability .(1-HIGHEST, 5-LOWEST).
\
Rating
Respondents
Percentage
1
62
62
2
15
15
3
20
20
4
3
3
5
0
0
Total
100
100
Analysis
Above table shows that 62% of viewers rated 1 for reliability15% viewers rated 2 for reliability
,20% viewers rated 3 for reliability , 3% viewers rated 4 for reliability , none of them rated 0 for
relablity
42
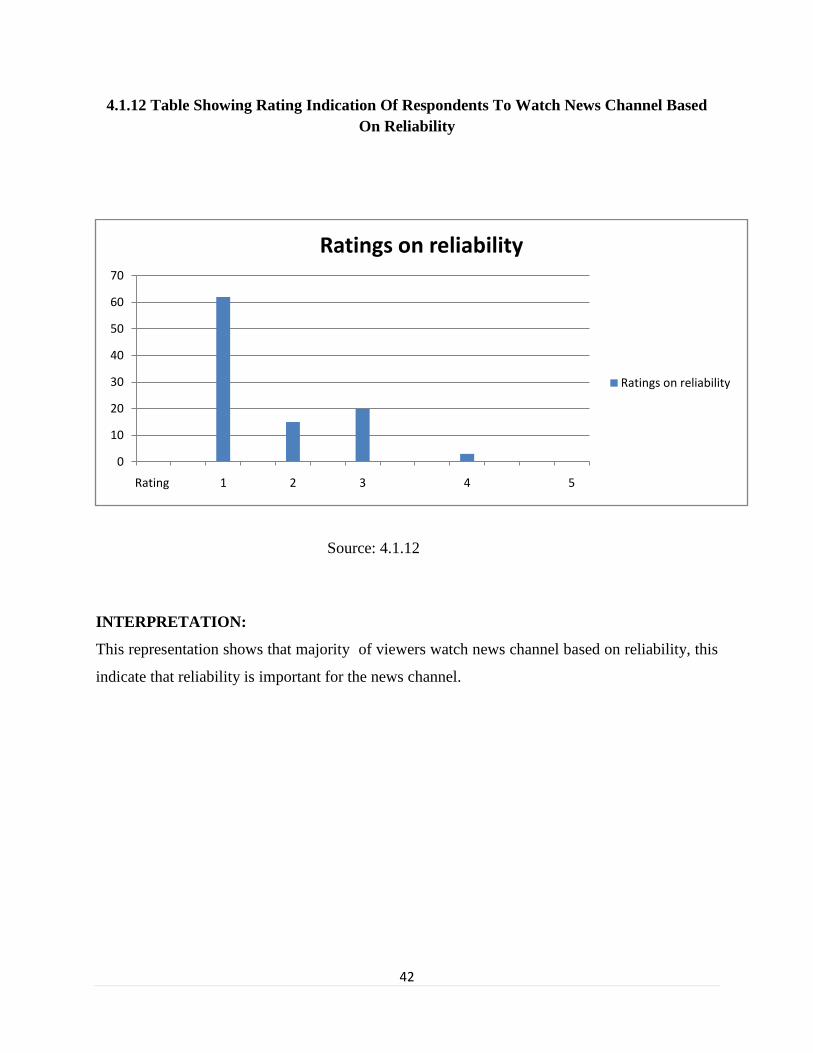
4.1.12 Table Showing Rating Indication Of Respondents To Watch News Channel Based
On Reliability
Source: 4.1.12
INTERPRETATION:
This representation shows that majority of viewers watch news channel based on reliability, this
indicate that reliability is important for the news channel.
0
10
20
30
40
50
60
70
Rating 1 2 3 4 5
Ratings on reliability
Ratings on reliability
43
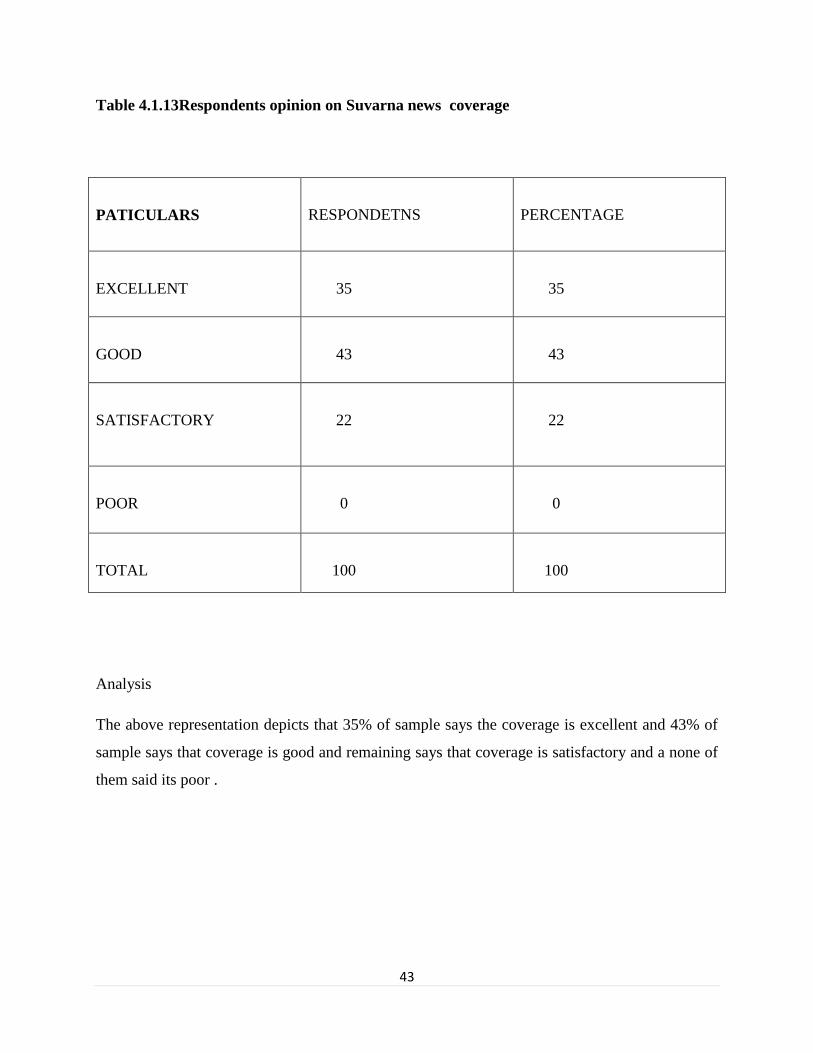
Table 4.1.13Respondents opinion on Suvarna news coverage
PATICULARS
RESPONDETNS
PERCENTAGE
EXCELLENT
35
35
GOOD
43
43
SATISFACTORY
22
22
POOR
0
0
TOTAL
100
100
Analysis
The above representation depicts that 35% of sample says the coverage is excellent and 43% of
sample says that coverage is good and remaining says that coverage is satisfactory and a none of
them said its poor .
44
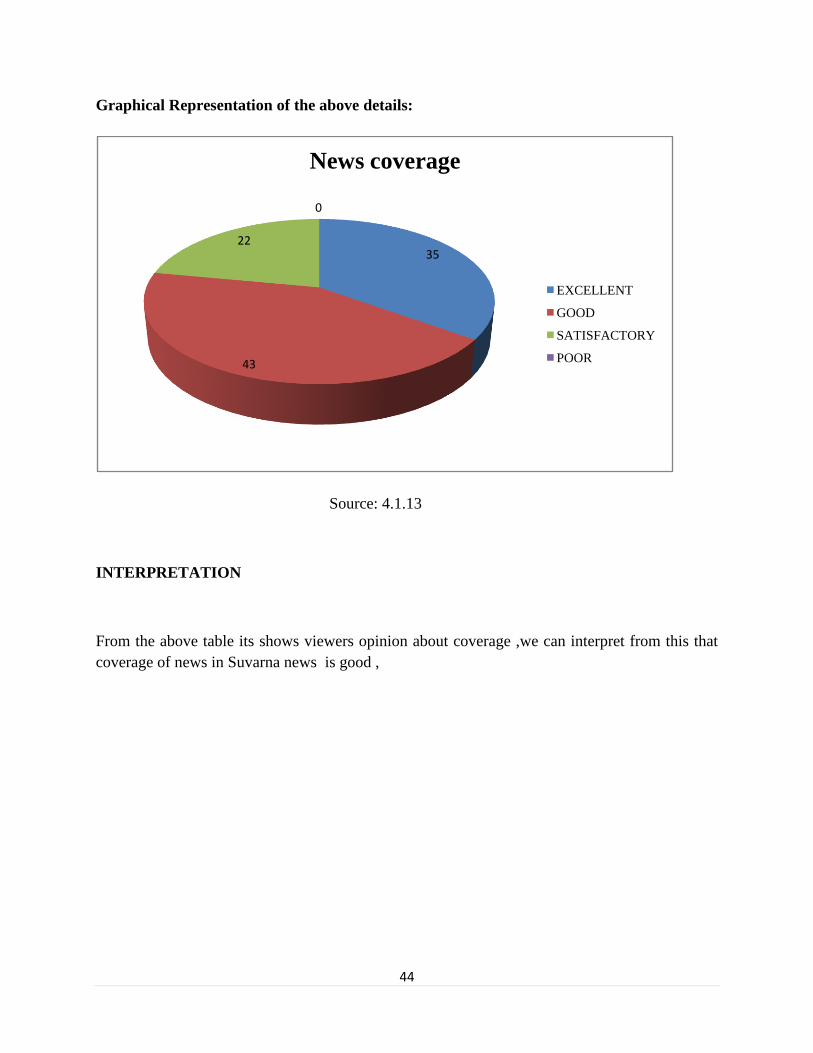
Graphical Representation of the above details:
Source: 4.1.13
INTERPRETATION
From the above table its shows viewers opinion about coverage ,we can interpret from this that
coverage of news in Suvarna news is good ,
35
43
22
0
News coverage
EXCELLENT
GOOD
SATISFACTORY
POOR
45
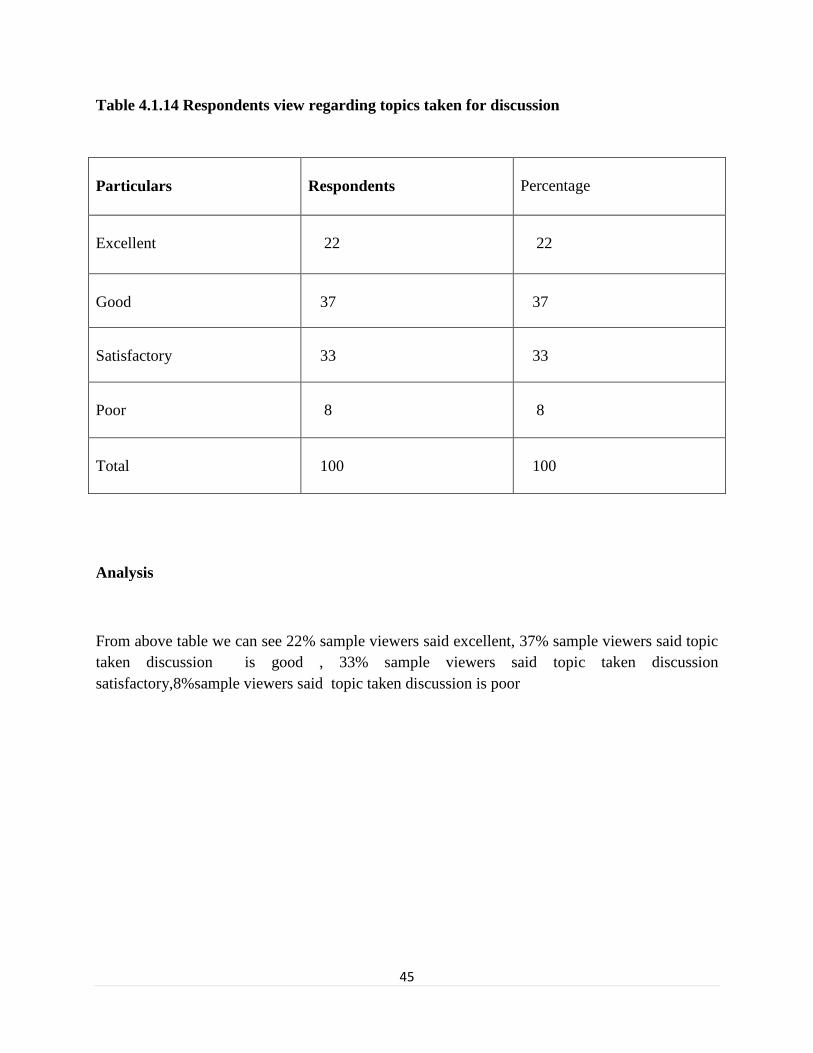
Table 4.1.14 Respondents view regarding topics taken for discussion
Particulars
Respondents
Percentage
Excellent
22
22
Good
37
37
Satisfactory
33
33
Poor
8
8
Total
100
100
Analysis
From above table we can see 22% sample viewers said excellent, 37% sample viewers said topic
taken discussion is good , 33% sample viewers said topic taken discussion
satisfactory,8%sample viewers said topic taken discussion is poor
46
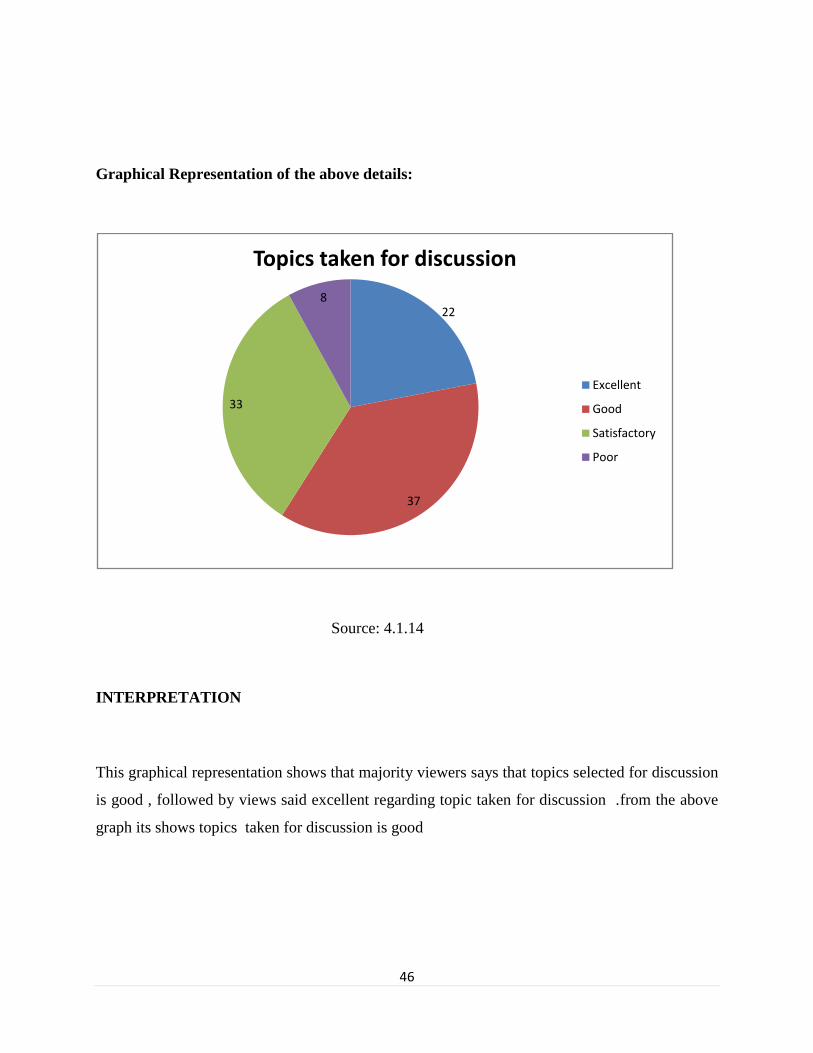
Graphical Representation of the above details:
Source: 4.1.14
INTERPRETATION
This graphical representation shows that majority viewers says that topics selected for discussion
is good , followed by views said excellent regarding topic taken for discussion .from the above
graph its shows topics taken for discussion is good
22
37
33
8
Topics taken for discussion
Excellent
Good
Satisfactory
Poor
47
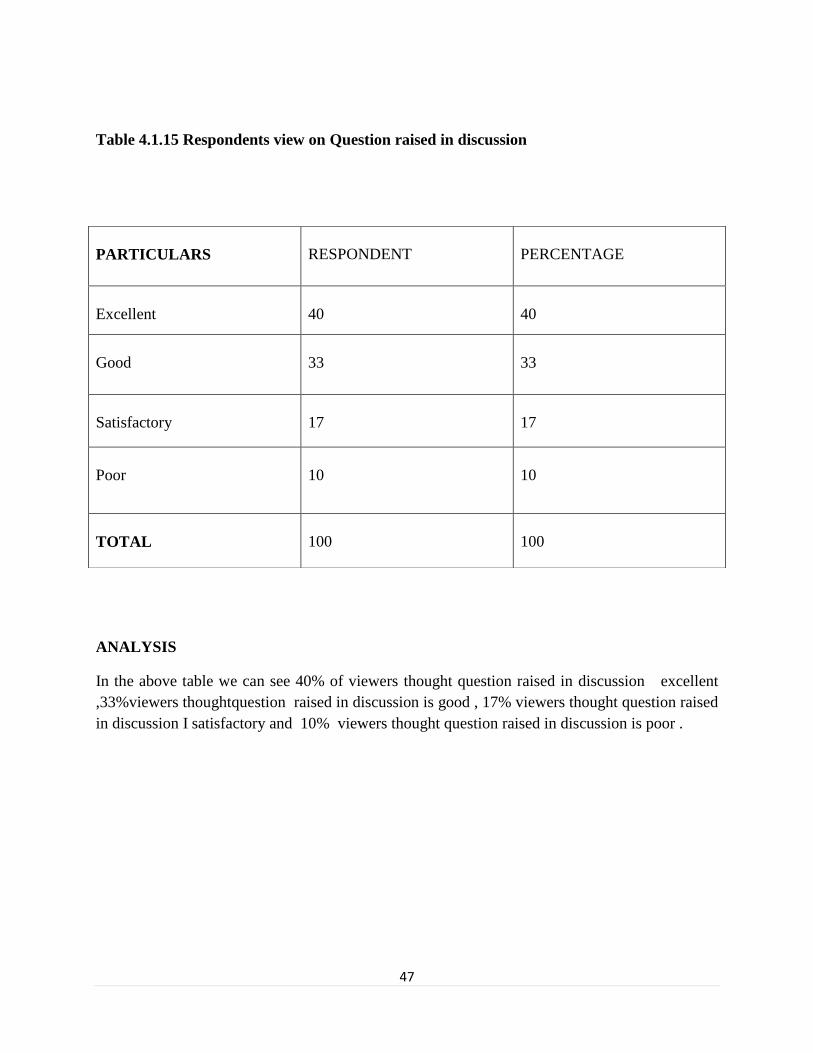
Table 4.1.15 Respondents view on Question raised in discussion
ANALYSIS
In the above table we can see 40% of viewers thought question raised in discussion excellent
,33%viewers thoughtquestion raised in discussion is good , 17% viewers thought question raised
in discussion I satisfactory and 10% viewers thought question raised in discussion is poor .
PARTICULARS
RESPONDENT
PERCENTAGE
Excellent
40
40
Good
33
33
Satisfactory
17
17
Poor
10
10
TOTAL
100
100
48
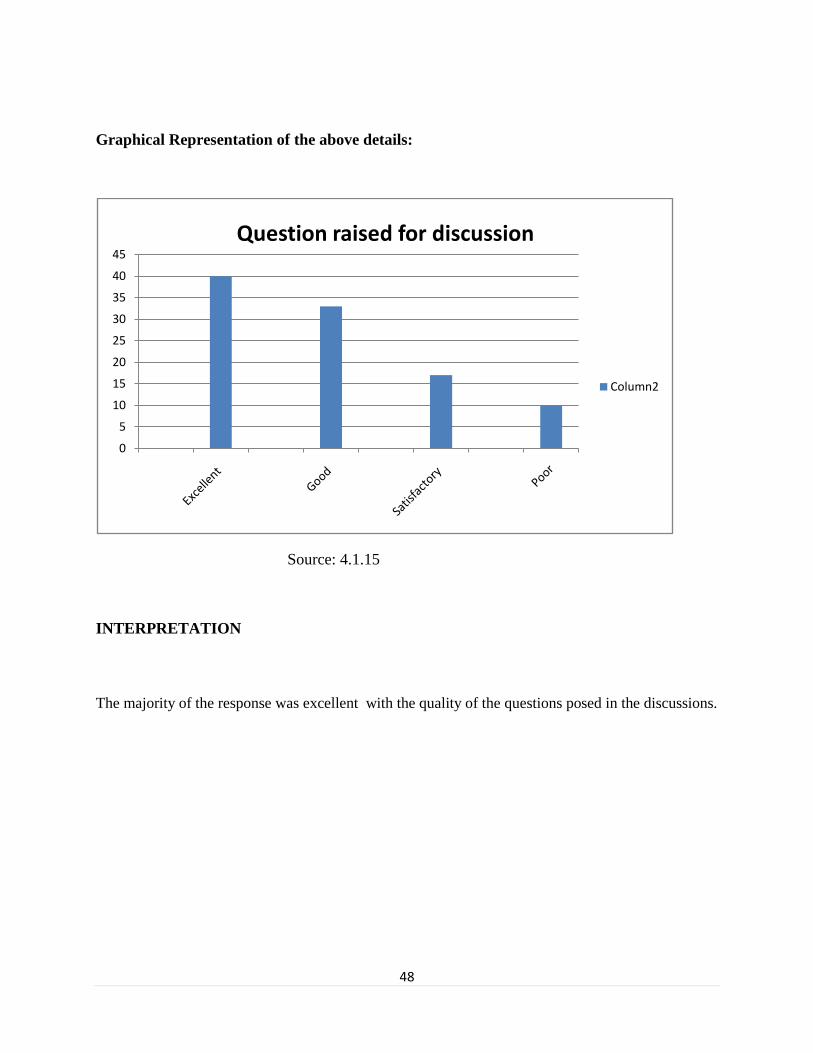
Graphical Representation of the above details:
Source: 4.1.15
INTERPRETATION
The majority of the response was excellent with the quality of the questions posed in the discussions.
0
5
10
15
20
25
30
35
40
45
Question raised for discussion
Column2
49
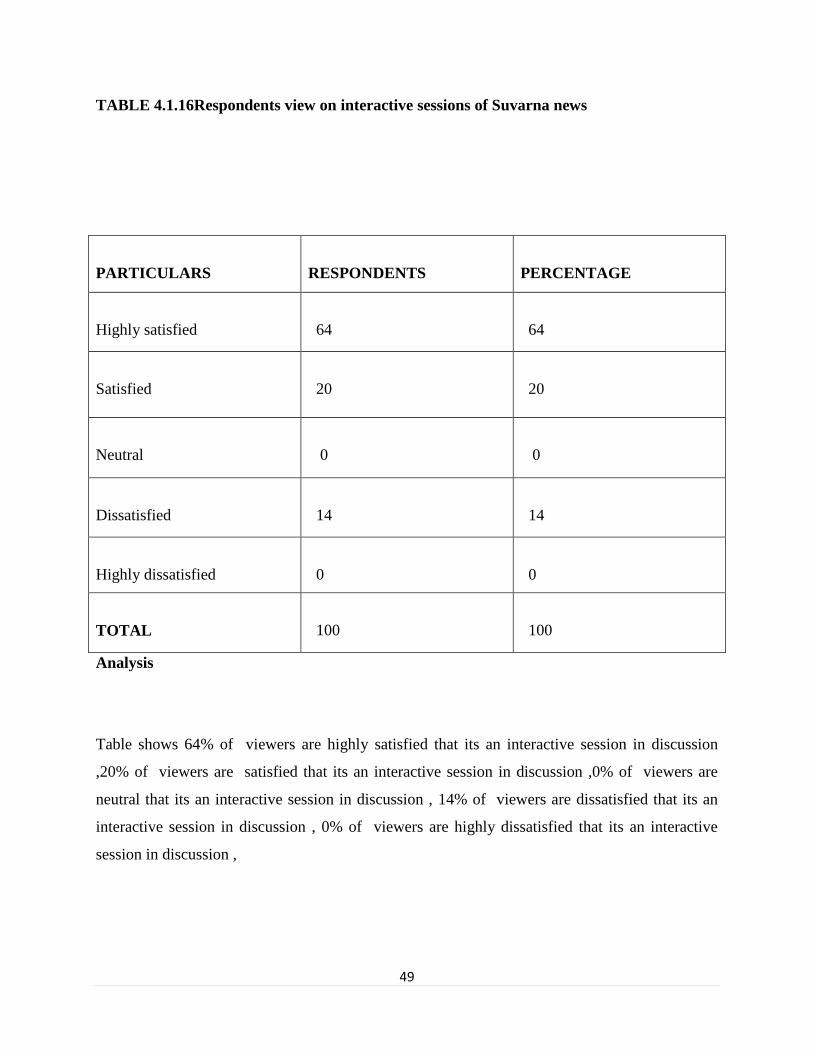
TABLE 4.1.16Respondents view on interactive sessions of Suvarna news
Analysis
Table shows 64% of viewers are highly satisfied that its an interactive session in discussion
,20% of viewers are satisfied that its an interactive session in discussion ,0% of viewers are
neutral that its an interactive session in discussion , 14% of viewers are dissatisfied that its an
interactive session in discussion , 0% of viewers are highly dissatisfied that its an interactive
session in discussion ,
PARTICULARS
RESPONDENTS
PERCENTAGE
Highly satisfied
64
64
Satisfied
20
20
Neutral
0
0
Dissatisfied
14
14
Highly dissatisfied
0
0
TOTAL
100
100
50
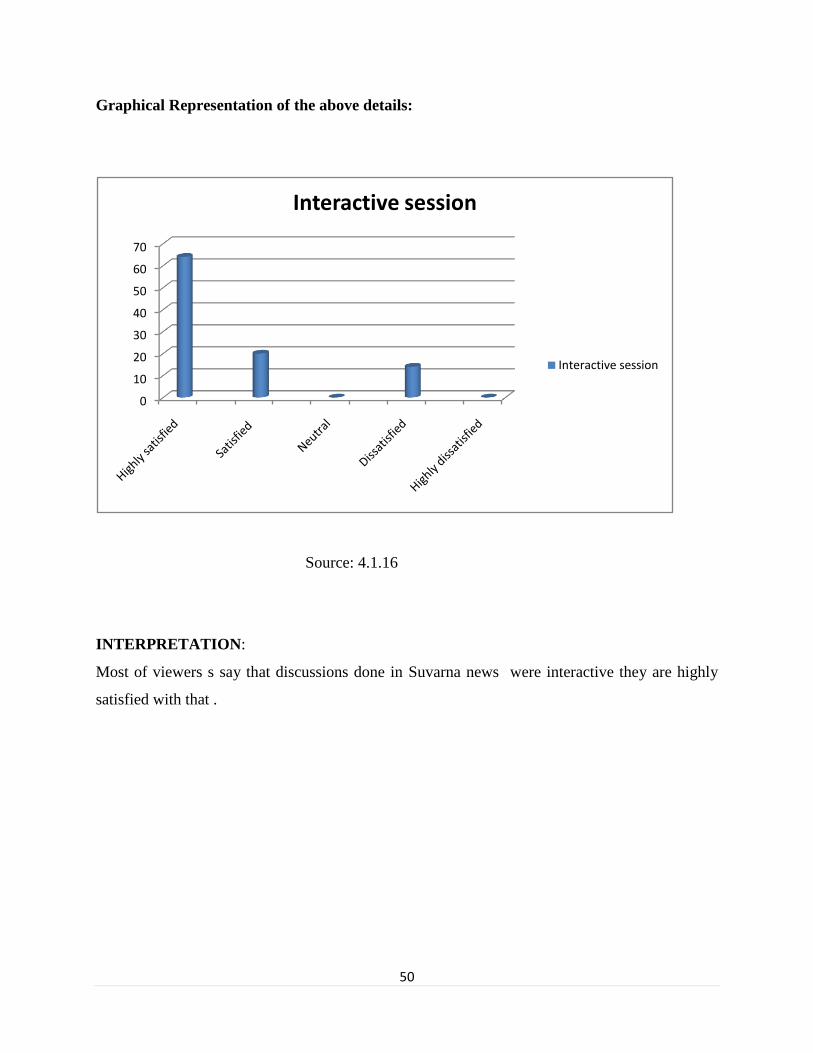
Graphical Representation of the above details:
Source: 4.1.16
INTERPRETATION:
Most of viewers s say that discussions done in Suvarna news were interactive they are highly
satisfied with that .
0
10
20
30
40
50
60
70
Interactive session
Interactive session
51
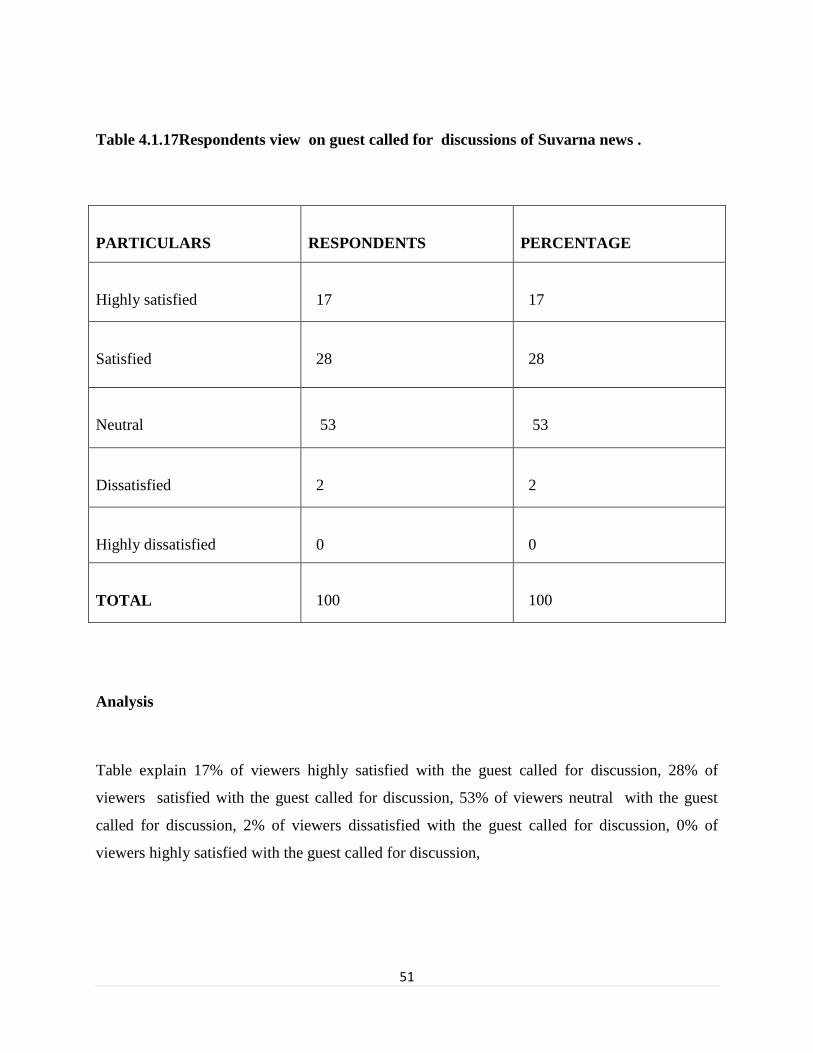
Table 4.1.17Respondents view on guest called for discussions of Suvarna news .
PARTICULARS
RESPONDENTS
PERCENTAGE
Highly satisfied
17
17
Satisfied
28
28
Neutral
53
53
Dissatisfied
2
2
Highly dissatisfied
0
0
TOTAL
100
100
Analysis
Table explain 17% of viewers highly satisfied with the guest called for discussion, 28% of
viewers satisfied with the guest called for discussion, 53% of viewers neutral with the guest
called for discussion, 2% of viewers dissatisfied with the guest called for discussion, 0% of
viewers highly satisfied with the guest called for discussion,
52
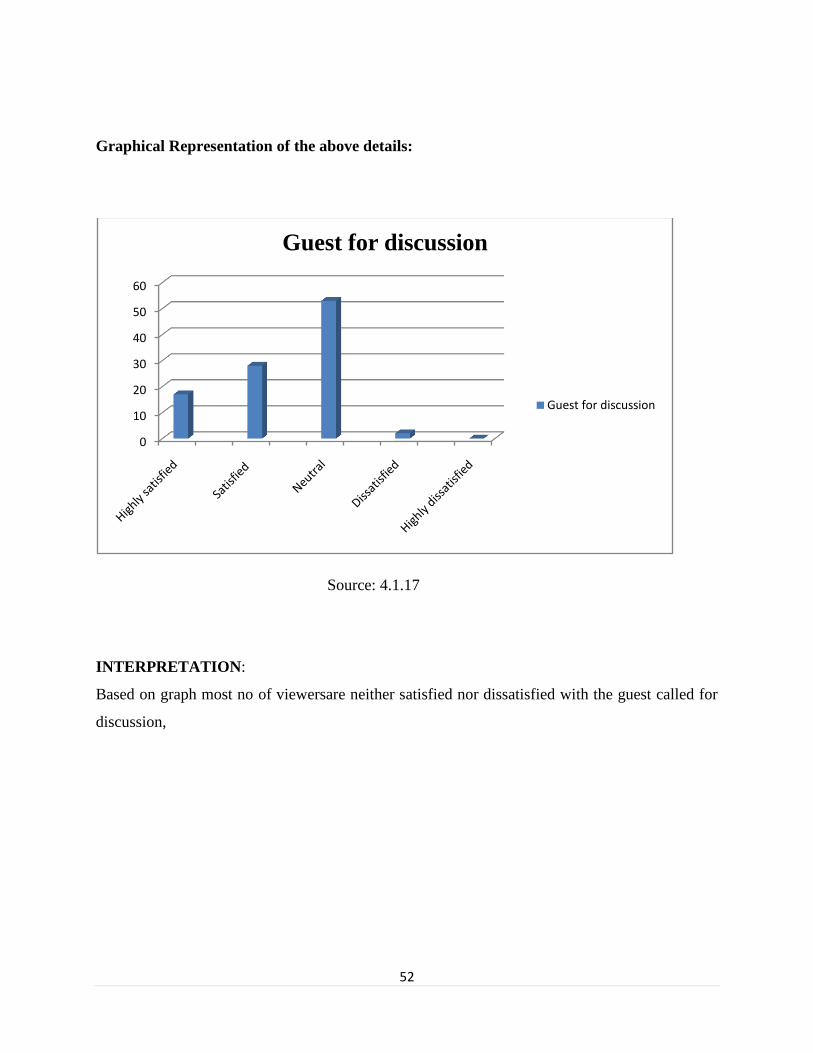
Graphical Representation of the above details:
Source: 4.1.17
INTERPRETATION:
Based on graph most no of viewersare neither satisfied nor dissatisfied with the guest called for
discussion,
0
10
20
30
40
50
60
Guest for discussion
Guest for discussion
53
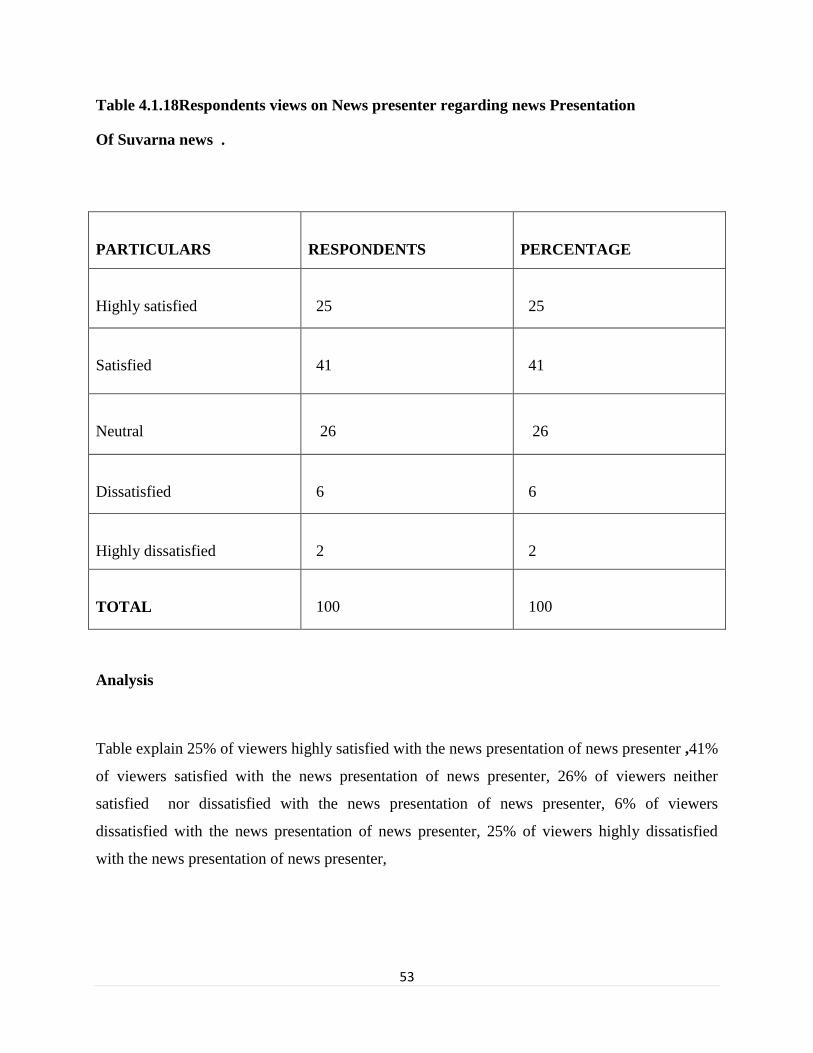
Table 4.1.18Respondents views on News presenter regarding news Presentation
Of Suvarna news .
PARTICULARS
RESPONDENTS
PERCENTAGE
Highly satisfied
25
25
Satisfied
41
41
Neutral
26
26
Dissatisfied
6
6
Highly dissatisfied
2
2
TOTAL
100
100
Analysis
Table explain 25% of viewers highly satisfied with the news presentation of news presenter ,41%
of viewers satisfied with the news presentation of news presenter, 26% of viewers neither
satisfied nor dissatisfied with the news presentation of news presenter, 6% of viewers
dissatisfied with the news presentation of news presenter, 25% of viewers highly dissatisfied
with the news presentation of news presenter,
54
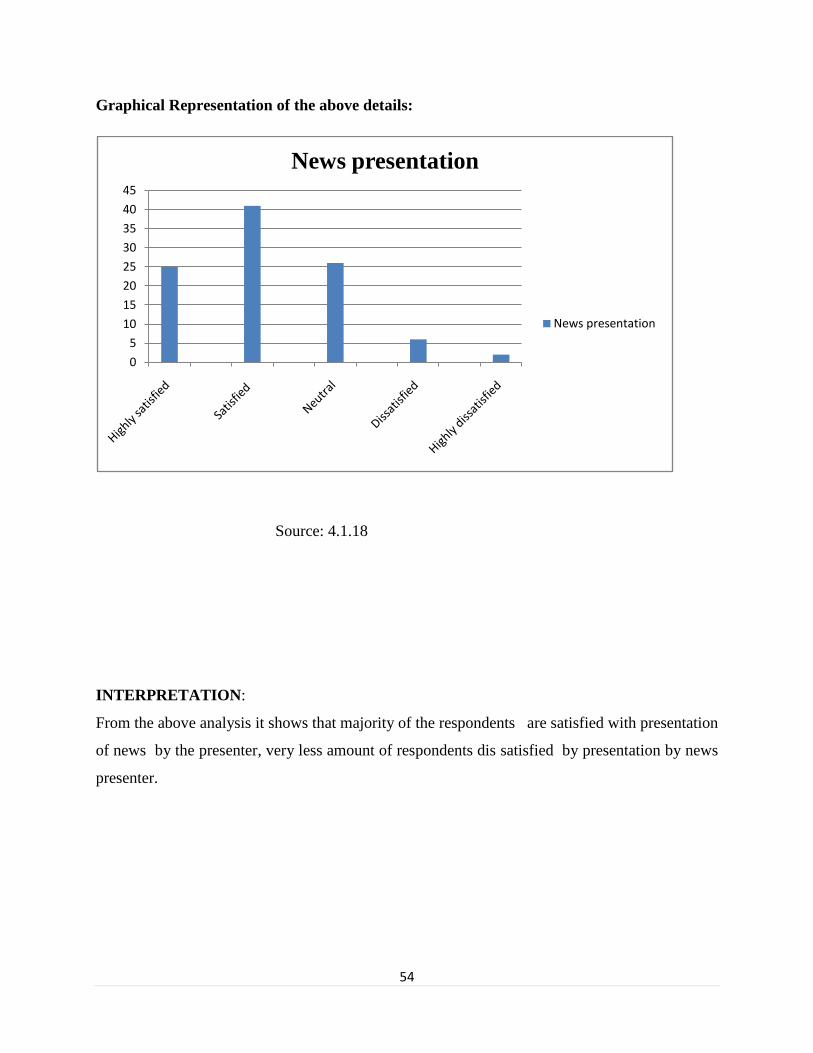
Graphical Representation of the above details:
Source: 4.1.18
INTERPRETATION:
From the above analysis it shows that majority of the respondents are satisfied with presentation
of news by the presenter, very less amount of respondents dis satisfied by presentation by news
presenter.
0
5
10
15
20
25
30
35
40
45
News presentation
News presentation
55
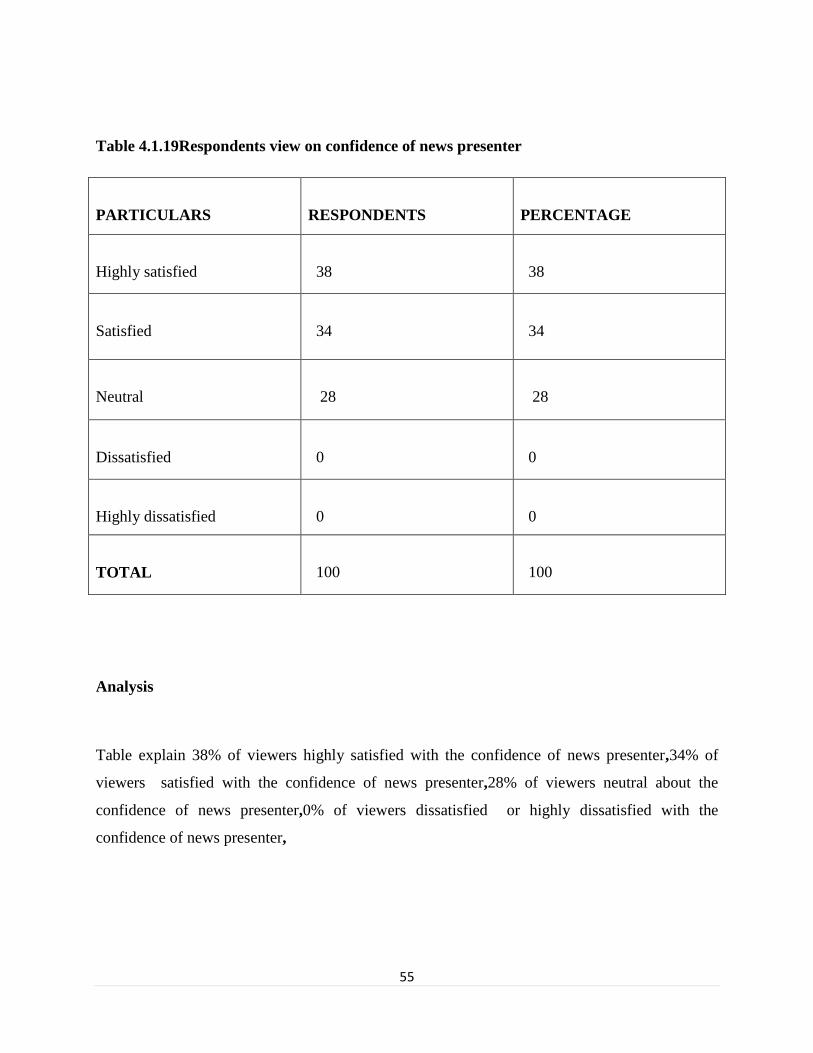
Table 4.1.19Respondents view on confidence of news presenter
PARTICULARS
RESPONDENTS
PERCENTAGE
Highly satisfied
38
38
Satisfied
34
34
Neutral
28
28
Dissatisfied
0
0
Highly dissatisfied
0
0
TOTAL
100
100
Analysis
Table explain 38% of viewers highly satisfied with the confidence of news presenter,34% of
viewers satisfied with the confidence of news presenter,28% of viewers neutral about the
confidence of news presenter,0% of viewers dissatisfied or highly dissatisfied with the
confidence of news presenter,
56
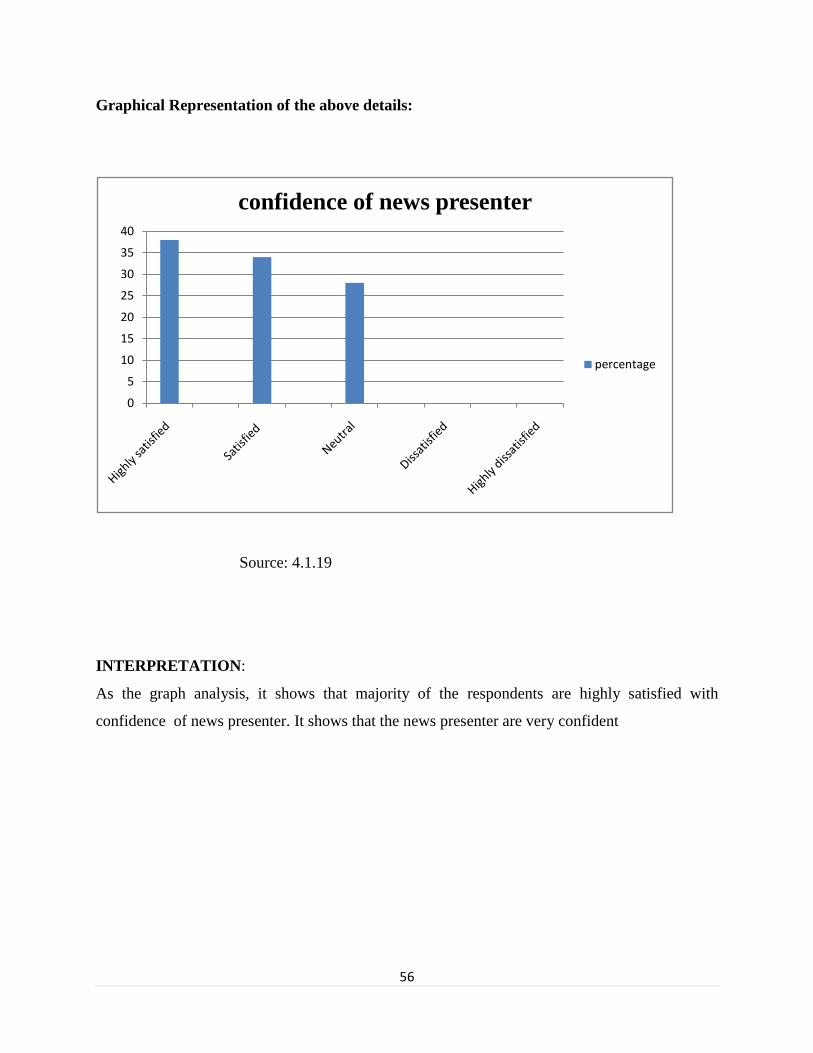
Graphical Representation of the above details:
Source: 4.1.19
INTERPRETATION:
As the graph analysis, it shows that majority of the respondents are highly satisfied with
confidence of news presenter. It shows that the news presenter are very confident
0
5
10
15
20
25
30
35
40
confidence of news presenter
percentage
57
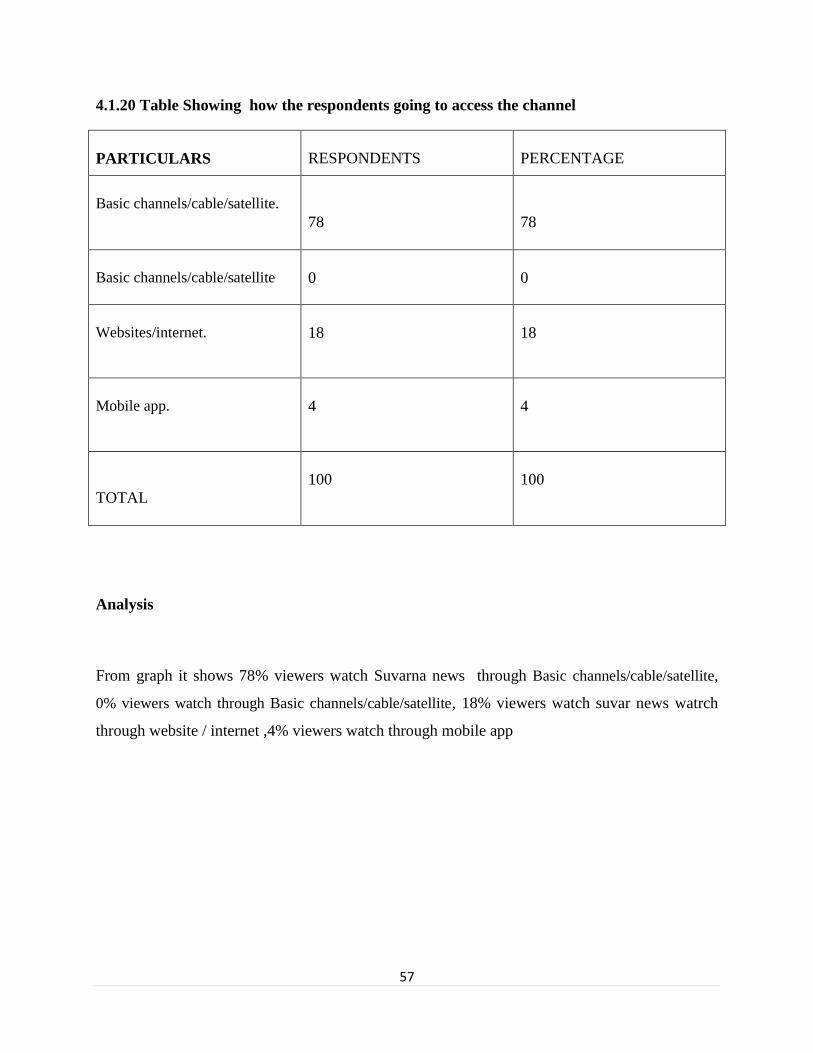
4.1.20 Table Showing how the respondents going to access the channel
PARTICULARS
RESPONDENTS
PERCENTAGE
Basic channels/cable/satellite.
78
78
Basic channels/cable/satellite
0
0
Websites/internet.
18
18
Mobile app.
4
4
TOTAL
100
100
Analysis
From graph it shows 78% viewers watch Suvarna news through Basic channels/cable/satellite,
0% viewers watch through Basic channels/cable/satellite, 18% viewers watch suvar news watrch
through website / internet ,4% viewers watch through mobile app
58
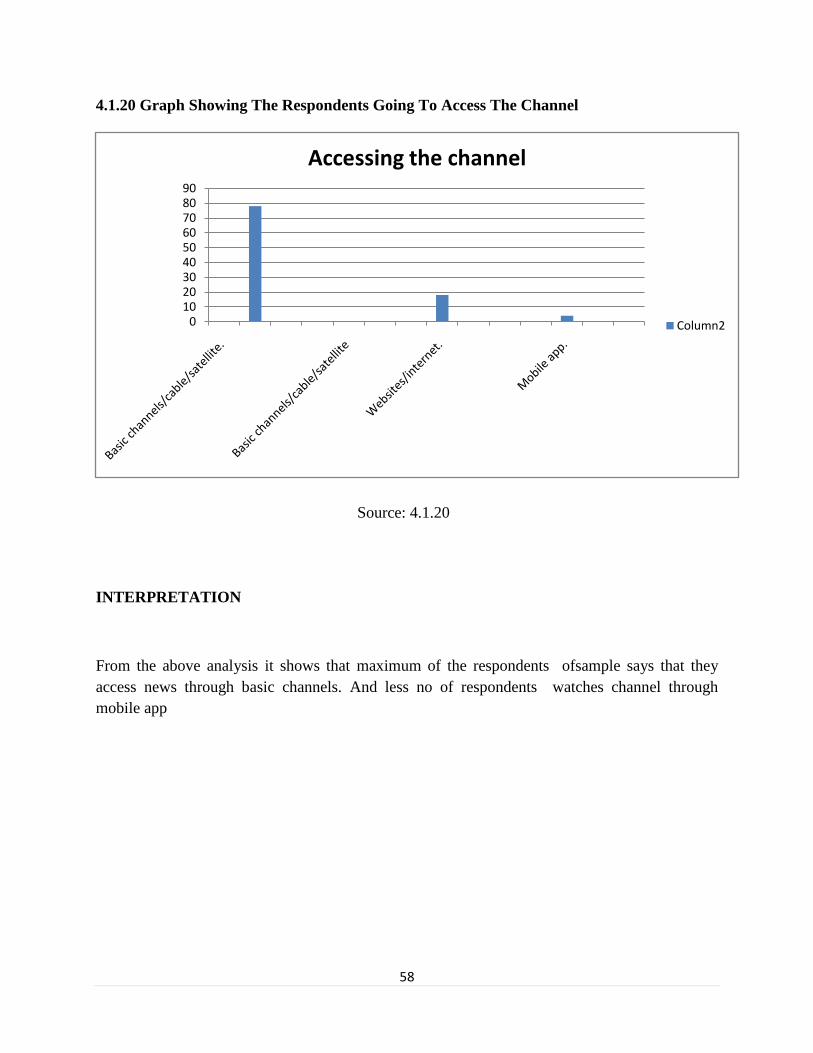
4.1.20 Graph Showing The Respondents Going To Access The Channel
Source: 4.1.20
INTERPRETATION
From the above analysis it shows that maximum of the respondents ofsample says that they
access news through basic channels. And less no of respondents watches channel through
mobile app
0102030405060708090
Accessing the channel
Column2
59
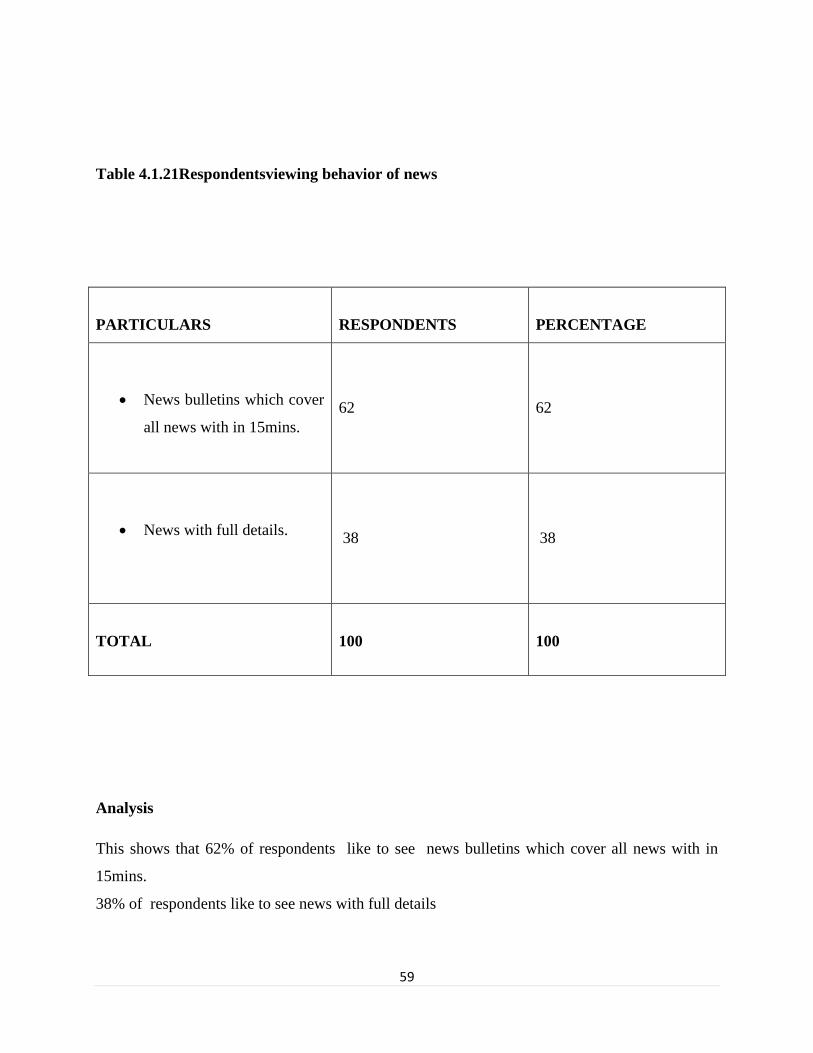
Table 4.1.21Respondentsviewing behavior of news
PARTICULARS
RESPONDENTS
PERCENTAGE
News bulletins which cover
all news with in 15mins.
62
62
News with full details.
38
38
TOTAL
100
100
Analysis
This shows that 62% of respondents like to see news bulletins which cover all news with in
15mins.
38% of respondents like to see news with full details
60
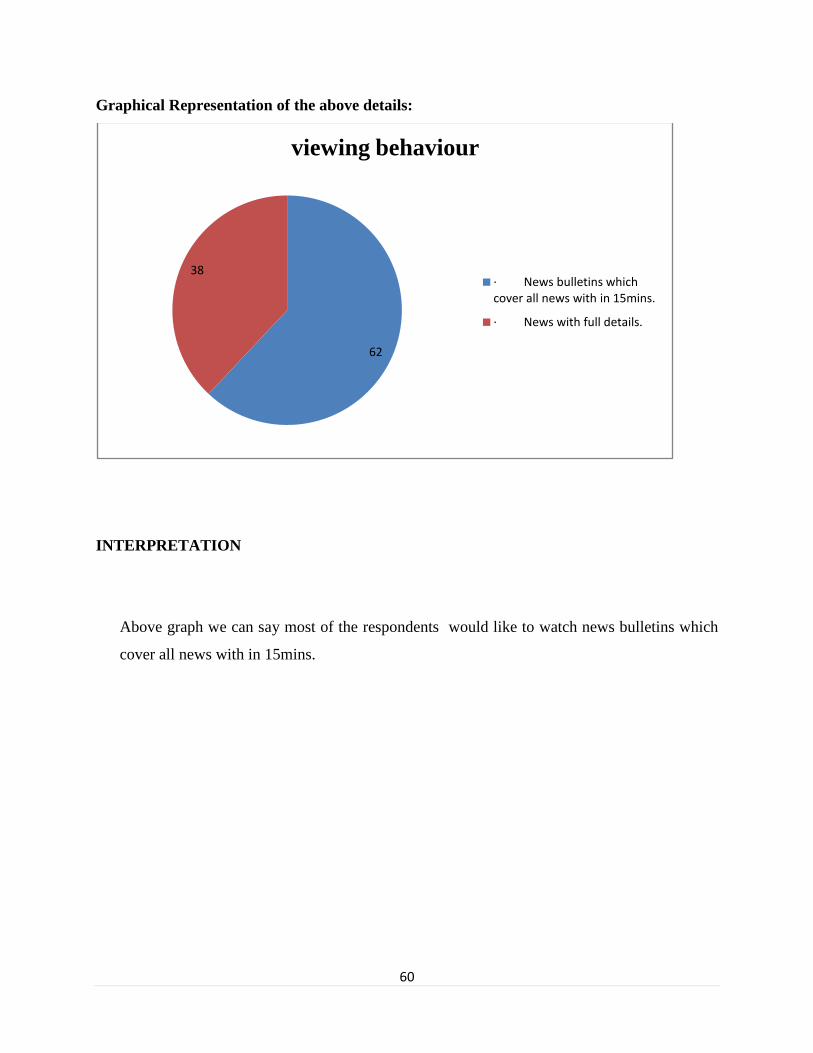
Graphical Representation of the above details:
INTERPRETATION
Above graph we can say most of the respondents would like to watch news bulletins which
cover all news with in 15mins.
62
38
viewing behaviour
· News bulletins which cover all news with in 15mins.
· News with full details.
61
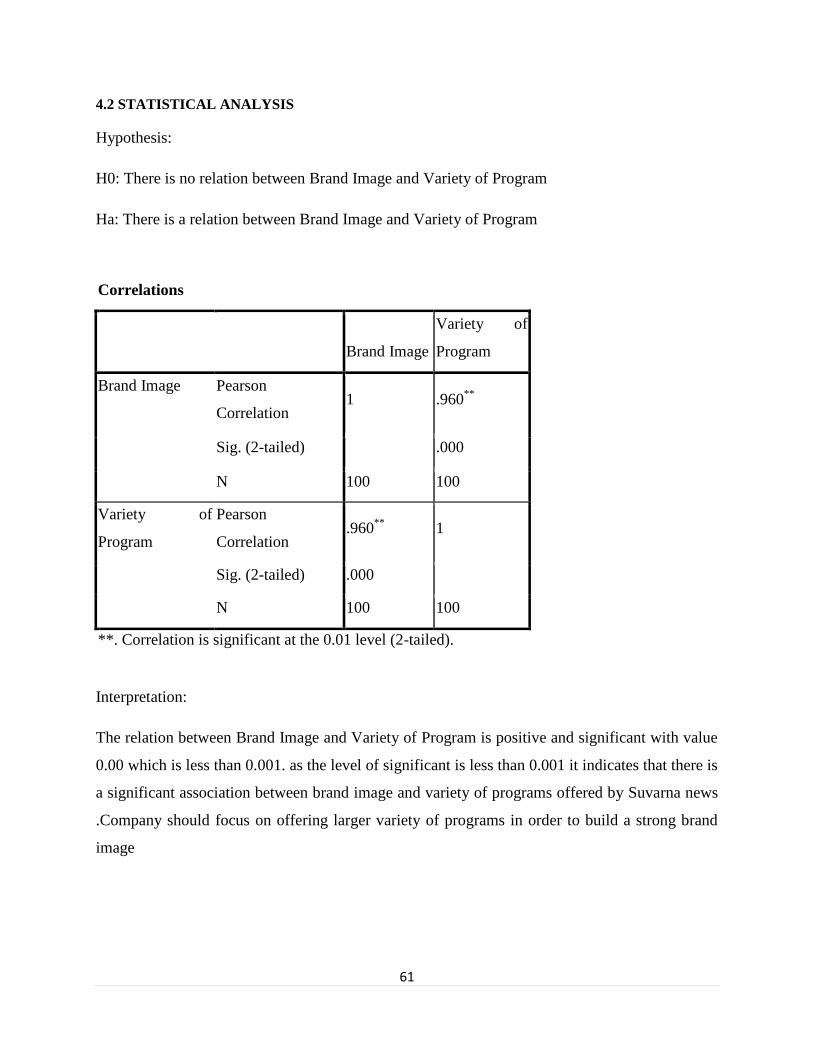
4.2 STATISTICAL ANALYSIS
Hypothesis:
H0: There is no relation between Brand Image and Variety of Program
Ha: There is a relation between Brand Image and Variety of Program
Correlations
Brand Image
Variety of
Program
Brand Image Pearson
Correlation 1 .960
**
Sig. (2-tailed) .000
N 100 100
Variety of
Program
Pearson
Correlation .960
** 1
Sig. (2-tailed) .000
N 100 100
**. Correlation is significant at the 0.01 level (2-tailed).
Interpretation:
The relation between Brand Image and Variety of Program is positive and significant with value
0.00 which is less than 0.001. as the level of significant is less than 0.001 it indicates that there is
a significant association between brand image and variety of programs offered by Suvarna news
.Company should focus on offering larger variety of programs in order to build a strong brand
image
62
CHAPTER 5
FINDINGS, SUGGESTIONSAND CONCLUSION
5.1. FINDINGS
Suvarna news has more number of male viewers
The majority of respondents watch Suvarna news channels for entertainment related updates.
The majority of respondents watch news channels in the evening
.
Suvarna news is positioned in 3rd
place.
Viewers prefer to watch news bulletins over detailed news
.
Viewers watch Suvarna news channel to get unknown facts.
Viewers give more importance to reliability other than brand image and appearance.
Suvarna news channels have been positioned among the viewers for its cinema hungama
program and for its best regional updates
.
Most of viewers agree that Suvarna news channel coverage is excellent.
Topics taken for discussion and presentation of topics are mostly agreed by viewers.
More numbers of viewers agree that content of channel decides the viewing behavior
.
Majority of the viewer‟s agree that they access to news channels through basic cable channels
63
5.2 SUGGESTIONS
Based on study and analysis the following inputs can be given as suggestions to Suvarna news .
News telecasted in Suvarna news should be more reliable, sharp and focused.
Suvarna news should give social awareness programs and educate the people of
Karnataka
.
Suvarna news should build a digital team to strongly penetrate among the youth of
Karnataka.
Suvarna news should concentrate on increasing female viewers
The news channel must adapt the success strategies of metro majestic program to be the
industry leader.
Suvarna news should increase their TRP to reach the No1 position by providing good
quality on news and programs
The news channel should build strong research team to get accurate information and
telecast it.
Channel has to build strong programs to increase number of viewers in the noon.
Company should focus on offering larger variety of programs in order to build a strong
brand image
64
Suvarna news should come up short news bulletins because most people will with hurry
they won‟t have time to watch full news
As the technology is updating daibyiday ,Suvarna news should also use those
technology for their growth
Suvarna news should introduce HD channel , any news channelin Karnataka has is not
introduced HD news channel itiisithe best idea to conquer the viewers
Suvarna news should start programs that gives information related to share market .
Suvarna news channel should be more active in social media in order to reach more no
viewers
65
5.3 CONCLUSION
It hasibeen concluded that Suvarna news is one of the trending news channel in Karnataka with
3rd
most TRP .Suvarna news secured 3rd
place in Karnataka by providing quality of news
content ,variety of programs with good reception & sound clarity. Suvarna news alsoisecured
good brand image for the continuous improvement and quality of news . Suvarna news apart
from telecasting news, Suvarna news also doing so many other programs like
AsamanyaKanadiga Awards , Kiriya sampadhaka awards ,Shourya awards ,Mahila sadhaki
awards etc. Most number viewers watch news channel for political updates ,sports updates and
movie updates .Suvarna news channel is meeting the desire of many viewers for their news
.Suvarna news channel is the most reliable and fair local news channel.
BIBLIOGRAPHY
CRONIN J. J & TAYLOR, S. A. (1992), Measuring service quality; a re-examination and
Extension. The Journal of Marketing, p-55-68.
FORNEL C, JOHNSON M.D, ANDERSON E.W, CHA J. AND BRYANT (1996), The
American customer satisfaction index: nature, purpose and findings, Journal of Business
Research, p 7-18.
FORNEL.C (1992), A National CustomerISatisfaction Barometer: The Swedish
Experience, Journal of Marketing, p. 6-21.
HAYWOOD-FARMER J (1988), A Conceptual Model of Service Quality, International
Journal of Operations & Production Management, p 9-29.
KOTLER P, IARMSTRONG G, SAUNDERS J.iWONG V. (2002), Principle of
Marketing, 3rd edition, Pretence Hall Europe, journal of marketing, p-33.
KOTLER, P. AND KELLER, K. L. (2009) journal Marketingimanagement (13th end)
NewiJersey: Pearson Education Inc, Upper SaddleiRiver, p- 789.
LEE, H., LEE, Y. & YOO, D. (2000), The determinants of perceived service quality and
its relationship with satisfaction, Journal of Service Marketing, p-217-231.
PARASURAMAN, A, ZEITHAML V. A & BERRY L. L. (1985), A conceptual model
of service quality and its implications for future research, Journal of Marketing, p.41-50.
PARASURAMAN, A., ZEITHAML V. A & BERRY L. L. (1988), SERVQUAL: A
multiple-item scale for measuring consumer perceptions of service quality, Journal of
Retailing, p.12-40
.
PEYTON, R.M. (2003), a study on management, International Journal of Management
and Commerce Innovations, p-55.
SARAVANAN, R. & RAO, K. S. P. (2007),Measurement of service quality from the
customer’s perspective – An empirical study, Total Quality Management, p.435-449.
SCHIFFMAN, L. G. AND LAZARKANUK. L. (2004) Consumer Behavior 8th edition.
New Jersey Pearson Education, journal of marketing, p.33.
SIVADAS, EUGENE, BAKER-PREWITT & JAMIE L (2000), an examination of the
relationship between service quality, customer satisfaction, and store loyalty, Journal of
Retail & Distribution Management, p.73-82.
P SANKAR . RAJENDRAN C, & ANANTHARAMAN R.N. (2015) the relationship
between service quality and customer satisfaction – a factor specific approach, Journal of
Services Marketing, p.363 – 379.
ZIETHAML (1990). A critical review of consumer satisfaction, in Review of Marketing,
Journal of American Marketing Association, p.68-123.
WEBSITES
www.aisanet.net
www.Suvarnatv.net
www.tv9bengaluru.net
www.mindtools.com
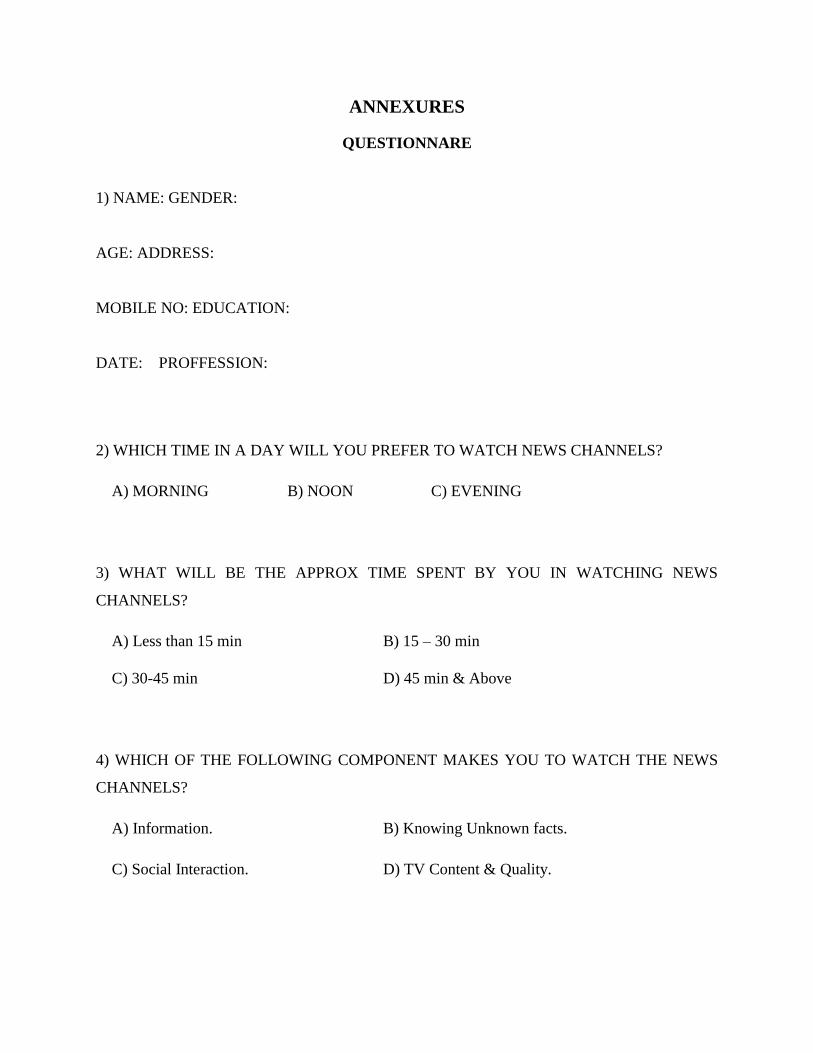
ANNEXURES
QUESTIONNARE
1) NAME: GENDER:
AGE: ADDRESS:
MOBILE NO: EDUCATION:
DATE: PROFFESSION:
2) WHICH TIME IN A DAY WILL YOU PREFER TO WATCH NEWS CHANNELS?
A) MORNING B) NOON C) EVENING
3) WHAT WILL BE THE APPROX TIME SPENT BY YOU IN WATCHING NEWS
CHANNELS?
A) Less than 15 min B) 15 – 30 min
C) 30-45 min D) 45 min & Above
4) WHICH OF THE FOLLOWING COMPONENT MAKES YOU TO WATCH THE NEWS
CHANNELS?
A) Information. B) Knowing Unknown facts.
C) Social Interaction. D) TV Content & Quality.
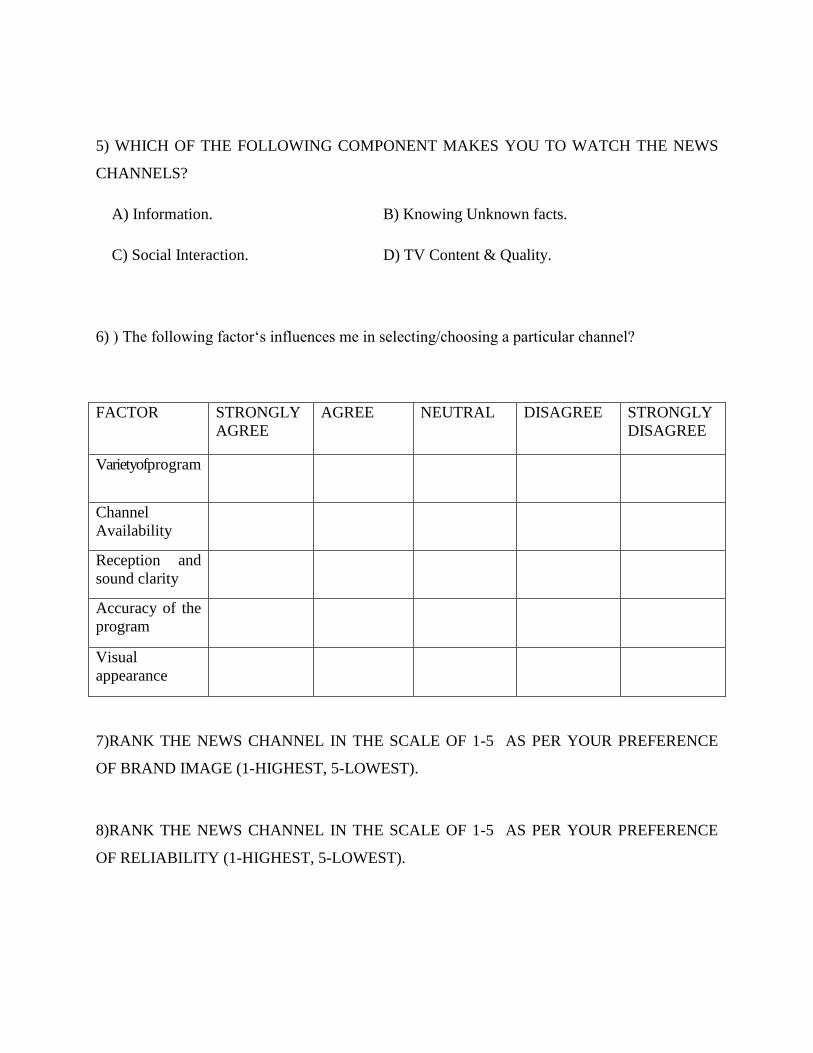
5) WHICH OF THE FOLLOWING COMPONENT MAKES YOU TO WATCH THE NEWS
CHANNELS?
A) Information. B) Knowing Unknown facts.
C) Social Interaction. D) TV Content & Quality.
6) ) The following factor‘s influences me in selecting/choosing a particular channel?
FACTOR STRONGLY
AGREE
AGREE NEUTRAL DISAGREE STRONGLY
DISAGREE
Varietyofprogram
Channel
Availability
Reception and
sound clarity
Accuracy of the
program
Visual
appearance
7)RANK THE NEWS CHANNEL IN THE SCALE OF 1-5 AS PER YOUR PREFERENCE
OF BRAND IMAGE (1-HIGHEST, 5-LOWEST).
8)RANK THE NEWS CHANNEL IN THE SCALE OF 1-5 AS PER YOUR PREFERENCE
OF RELIABILITY (1-HIGHEST, 5-LOWEST).
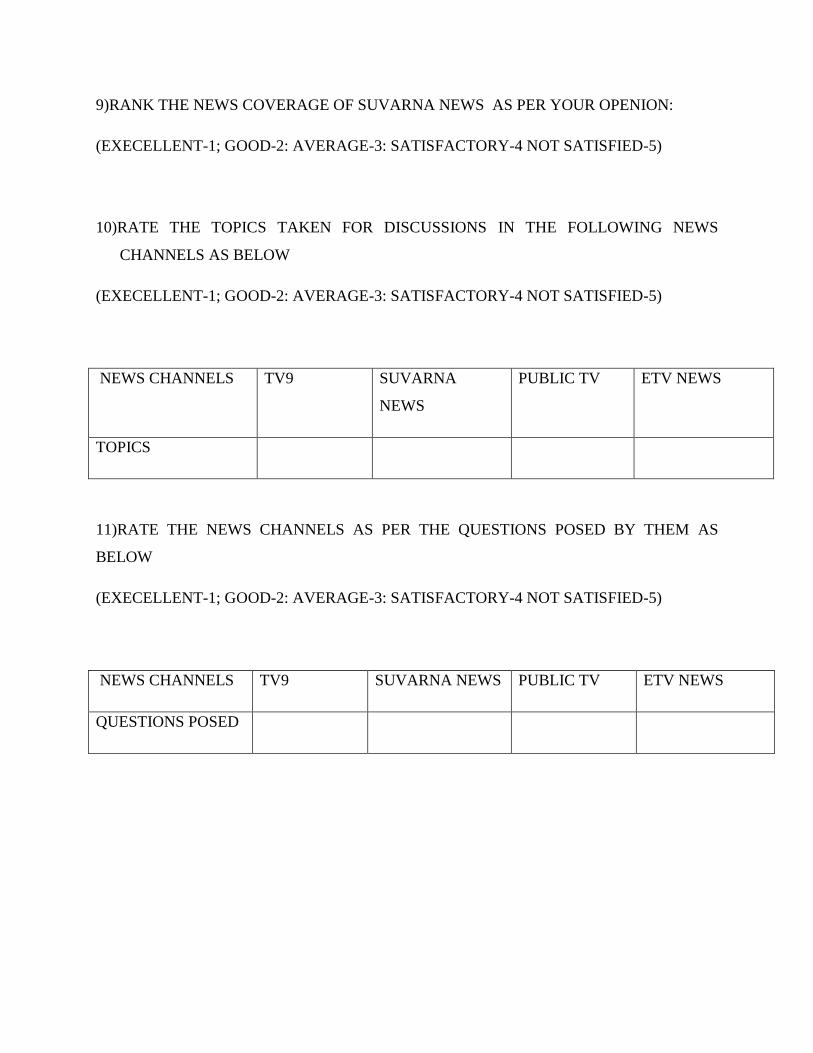
9)RANK THE NEWS COVERAGE OF SUVARNA NEWS AS PER YOUR OPENION:
(EXECELLENT-1; GOOD-2: AVERAGE-3: SATISFACTORY-4 NOT SATISFIED-5)
10)RATE THE TOPICS TAKEN FOR DISCUSSIONS IN THE FOLLOWING NEWS
CHANNELS AS BELOW
(EXECELLENT-1; GOOD-2: AVERAGE-3: SATISFACTORY-4 NOT SATISFIED-5)
NEWS CHANNELS TV9 SUVARNA
NEWS
PUBLIC TV ETV NEWS
TOPICS
11)RATE THE NEWS CHANNELS AS PER THE QUESTIONS POSED BY THEM AS
BELOW
(EXECELLENT-1; GOOD-2: AVERAGE-3: SATISFACTORY-4 NOT SATISFIED-5)
NEWS CHANNELS TV9 SUVARNA NEWS PUBLIC TV ETV NEWS
QUESTIONS POSED
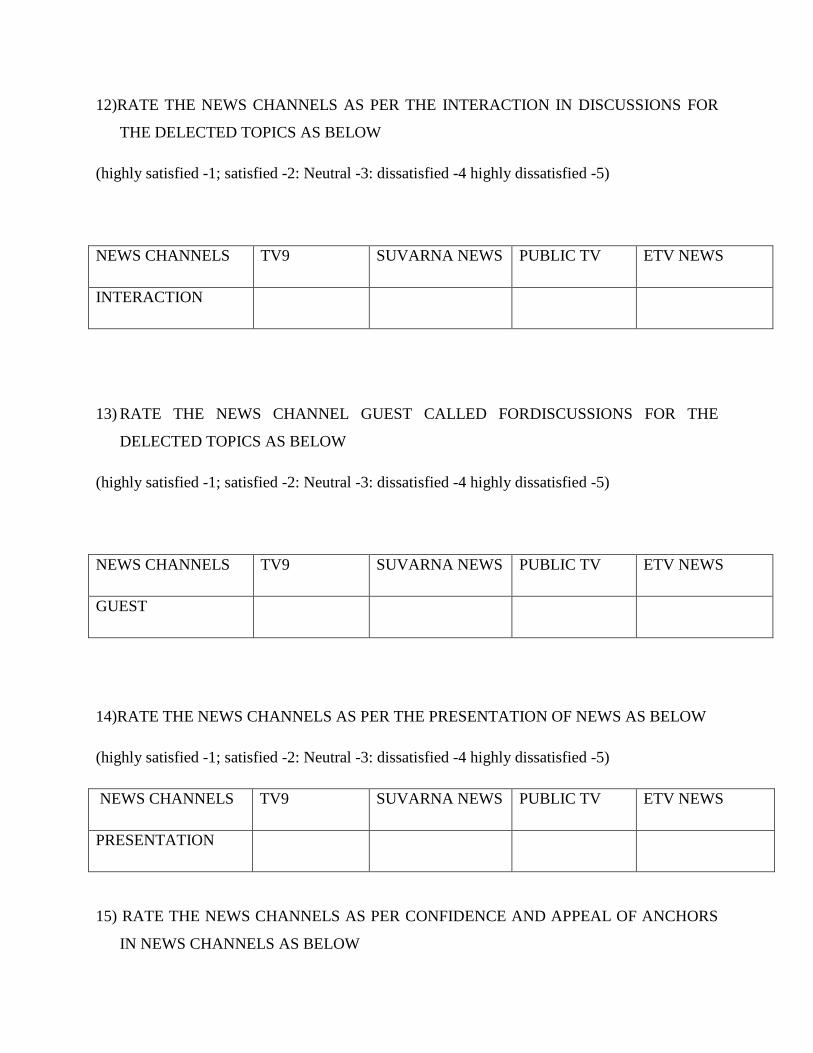
12)RATE THE NEWS CHANNELS AS PER THE INTERACTION IN DISCUSSIONS FOR
THE DELECTED TOPICS AS BELOW
(highly satisfied -1; satisfied -2: Neutral -3: dissatisfied -4 highly dissatisfied -5)
NEWS CHANNELS TV9 SUVARNA NEWS PUBLIC TV ETV NEWS
INTERACTION
13) RATE THE NEWS CHANNEL GUEST CALLED FORDISCUSSIONS FOR THE
DELECTED TOPICS AS BELOW
(highly satisfied -1; satisfied -2: Neutral -3: dissatisfied -4 highly dissatisfied -5)
NEWS CHANNELS TV9 SUVARNA NEWS PUBLIC TV ETV NEWS
GUEST
14)RATE THE NEWS CHANNELS AS PER THE PRESENTATION OF NEWS AS BELOW
(highly satisfied -1; satisfied -2: Neutral -3: dissatisfied -4 highly dissatisfied -5)
NEWS CHANNELS TV9 SUVARNA NEWS PUBLIC TV ETV NEWS
PRESENTATION
15) RATE THE NEWS CHANNELS AS PER CONFIDENCE AND APPEAL OF ANCHORS
IN NEWS CHANNELS AS BELOW
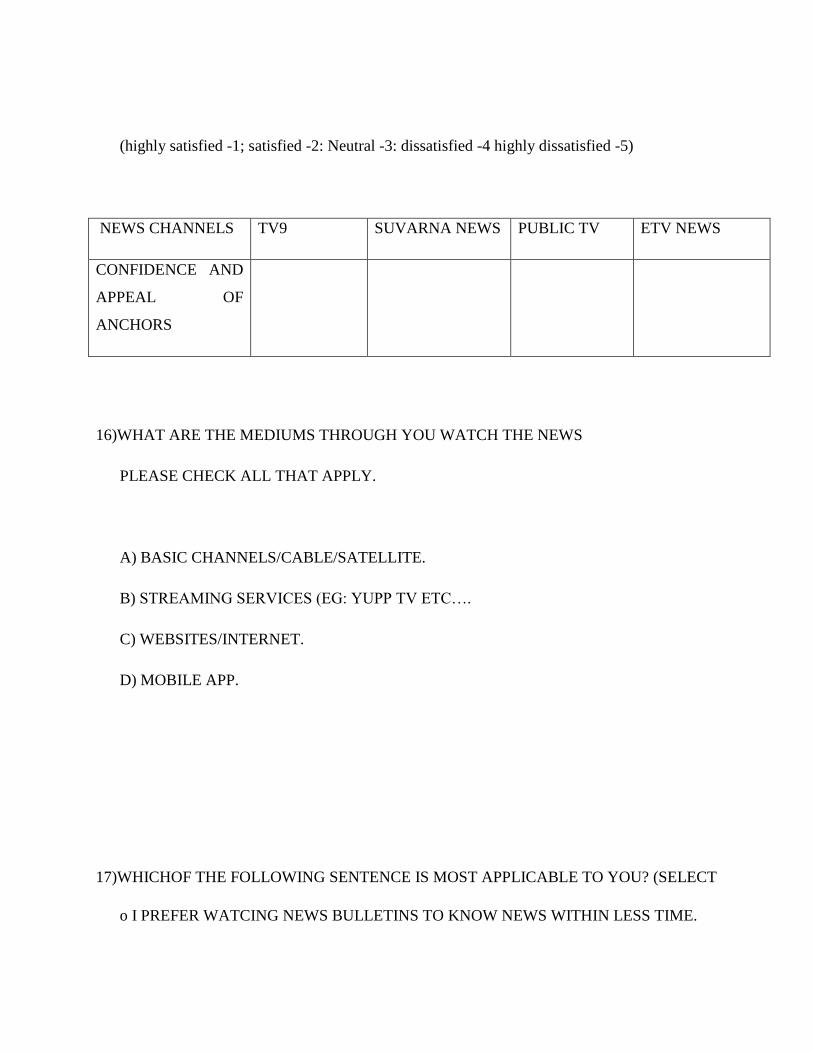
(highly satisfied -1; satisfied -2: Neutral -3: dissatisfied -4 highly dissatisfied -5)
NEWS CHANNELS TV9 SUVARNA NEWS PUBLIC TV ETV NEWS
CONFIDENCE AND
APPEAL OF
ANCHORS
16)WHAT ARE THE MEDIUMS THROUGH YOU WATCH THE NEWS
PLEASE CHECK ALL THAT APPLY.
A) BASIC CHANNELS/CABLE/SATELLITE.
B) STREAMING SERVICES (EG: YUPP TV ETC….
C) WEBSITES/INTERNET.
D) MOBILE APP.
17)WHICHOF THE FOLLOWING SENTENCE IS MOST APPLICABLE TO YOU? (SELECT
o I PREFER WATCING NEWS BULLETINS TO KNOW NEWS WITHIN LESS TIME.
o I PREFER TO WATCH NEWS IN FULL DETAILS.
18)PROVIDE YOUR VALUABLE SUGGESTIONS FOR THE INPROVEMENT OF THE
PROGRAMS IN OUR CHANNEL:
______________________________________________________________________________
______________________________________________________________________________
_______________________________________
,-\CH J\ 1 Z Y /\ l '-JS 1"11 l. ' 11 ':';
Spccialb:n.tiou
C t-mpa1\:v N; me
C<lmP.::\ny Afl{ln':~~
/\111/\1,Y/\ IN;-;TJTl iTl •: (\J, rl·TJ ( j\J() l,( )( ;y
I·, 1,: l'/\"'.Tl'vll I\IT f"I ~11;,\
INTU,N:·,1 Ill" W J•: 1 1\ 1 \ l~!T< 'l~-1
( I fiMI ~/\I 'I ~ 1<' / )
: l\ l'i:/\1,SI I M V
: l'rnl' /\ f;(' l 1/\N/\ \/1.1 /\Y
1 /\ Y 1 <iM 1 ~1\(), J
Vi11;111r'<' \~ M: 1rk c1 iti,•~
: Pini Nn. ~(, . Crc:.:;(·cn l l,c,;1cl. J ~l, ,1T - :_,(,000 I . ---·-- -------- --- ·--·----·-. --·- - --
\Vcck
I ___ , __________ _ I ! ) () I I ,',
i()
'. :p () l - 1 ~;
In
! (·;m1 1111: ;1 b0111 1hc dilTcre111 P J'n:1 11nn :111d pn,g r:1111s hy S tl\·;1rn;1 Nc\\·s
o 1 1 :--~ I 2~) () 1- 1 f~ ()nc111;1l1 p 11 and t::1l hlTlll! '. 111t.,n11;111P11 ahp11I 1lw
t n ' _1_:1pw1h ol' 1he c n11111;111\ .
I)~ 0 2 1 ~ I 1\ 11;1l y-, 111!:= 1lw \ l ;1rhc l p n s 1111111 " r lh\; \· ,,11111:111\
1n
I ] (\ ()~~ 1 ~
1--i 1 ~ 02 I ~
tn
1 7 0'.2 H~
l ·~xl cT11:11 1 t l I \ l , 1 I
r • 1 '-~ i 1 , l I 1 , 1 (
I n l:o l k c t 1011
'-?·(. (Y> ,;..J ' • ._,
• I l" t lH· -·t11d v - .1.1 ,1,, •• ,1 h ·1c k 1 · rn11, < 11 ·· .. I i'{ icon. , • ' ,.
!
tn
rn o~ 1 s
t);"; ( ):'\ I ~ l f ) :11:i l:oll n : ti <111 :111d :111:il y"i :-;
I P
10 0.~ I ( • , ,
1 :~-<n -1 0 f • <;111'\'C,' . 1· iht·1 ""lhl-r('( l d11n111: I ,, l11tcrprc tal1!'11 <' • , :..~
I n
17 O" . ' l k
1q n;~ I :,.:;
lo
~;.<l <n I (' l'
~ - ---·· ·----
~ '
I I ( ' l)
Recommended