An Improved Protein Decoy Set for Testing EnergyFunctions for Protein Structure PredictionJerry Tsai,1* Richard Bonneau,2 Alexandre V. Morozov,3 Brian Kuhlman,4 Carol A. Rohl,5 and David Baker6
1Department of Biochemistry and Biophysics, Texas A&M University, College Station, Texas2Institute for Systems Biology, Seattle, Washington3Department of Physics, University of Washington, Seattle4Department of Biochemistry, University of Washington, Seattle5Department of Biomolecular Engineering, University of California, Santa Cruz, California6Department of Biochemistry, University of Washington, Seattle
ABSTRACT We have improved the original Ro-setta centroid/backbone decoy set by increasing thenumber of proteins and frequency of near nativemodels and by building on sidechains and minimiz-ing clashes. The new set consists of 1,400 modelstructures for 78 different and diverse protein tar-gets and provides a challenging set for the testingand evaluation of scoring functions. We evaluatedthe extent to which a variety of all-atom energyfunctions could identify the native and close-to-native structures in the new decoy sets. Of variousimplicit solvent models, we found that a solvent-accessible surface area–based solvation providedthe best enrichment and discrimination of close-to-native decoys. The combination of this solvationtreatment with Lennard Jones terms and the origi-nal Rosetta energy provided better enrichment anddiscrimination than any of the individual terms.The results also highlight the differences in accu-racy of NMR and X-ray crystal structures: a largeenergy gap was observed between native and non-native conformations for X-ray structures but notfor NMR structures. Proteins 2003;53:76–87.© 2003 Wiley-Liss, Inc.
Key words: scoring functions; Rosetta method anddecoys; protein structure prediction
INTRODUCTION
The development and evaluation of new energy func-tions is critical to the accurate modeling of the propertiesof biological macromolecules. Because the native structureof a protein must be low in free energy relative to almostall other conformations of the chain in order to be almostexclusively populated in solution, a stringent test of en-ergy functions is the extent to which they attribute lowerenergies to native and near native conformations than tonon-native conformations. Indeed, “decoy discrimination”tests have become a widely used approach for testing andvalidating alternative energy models.1–3
An optimal decoy set should (1) contain conformationsfor a wide variety of different proteins to avoid over-fitting;(2) contain conformations close (�4Å) to the native struc-ture because structures more distant from the nativestructure may not be in the native structure’s energy basin
and thus impossible to recognize; (3) consist of conforma-tions that are at least near local minima of a reasonablescoring function, so they are not trivially excludable basedon obviously non protein like features; and (4) be producedby a relatively unbiased procedure that does not useinformation from the native structure during the conforma-tional search. If (4) is the case, then a method thatperforms well on the decoy set can immediately be used forstructure prediction.
The Rosetta algorithm developed by our group over thepast several years has shown a degree of success at de novostructure prediction.4,5 Reducing the representation of aprotein to only the main chain atoms and a side chaincentroid,6 Rosetta can generate reasonable low-resolutionstructures much of the time, but cannot reliably identifythe most native-like model.4 Here we use Rosetta togenerate a large and improved decoy set for testing energyfunctions that satisfies the four above criteria better thanpreviously described sets. In the development of thisaugmented decoy set, we add sidechains to the centroid/backbone models and refine the structures to remove stericclashes. Next, we evaluate the capability of differentenergy/scoring functions, including a number of differentimplicit solvent models, to recognize the near-native struc-tures in the decoy set. We then develop a combined scoringfunction that exhibits an enhanced performance over avariety of folds and assess the performance of this hybridscoring function in simulated as well as real tests ofstructure prediction.
RESULTSDecoy Set
We set out to create a decoy set that satisfied the fourcriteria listed in the introduction. To satisfy requirement
The Rosetta All-atom Decoy Set may be downloaded from http://depts.washington.edu/bakerpg/decoys/ using the link “Download theall atom decoys” used by Tsai et al. (pdbs).
Grant sponsor: Howard Hughes Medical Institute.*Correspondence to: Department of Biochemistry and Biophysics,
Texas A&M University, 2128 TAMU, Room 111, College Station, TX77843. E-mail: [email protected]
Received 18 November 2002; Accepted 18 February 2003
PROTEINS: Structure, Function, and Bioinformatics 53:76–87 (2003)
© 2003 WILEY-LISS, INC.
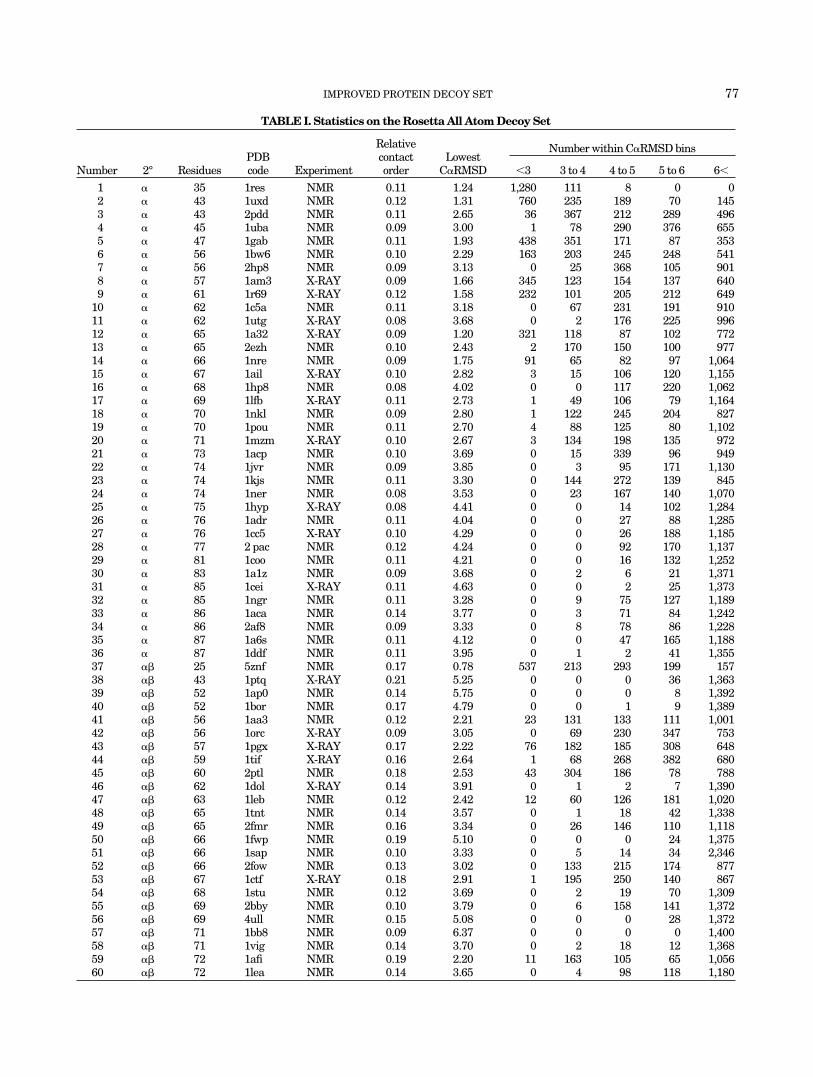
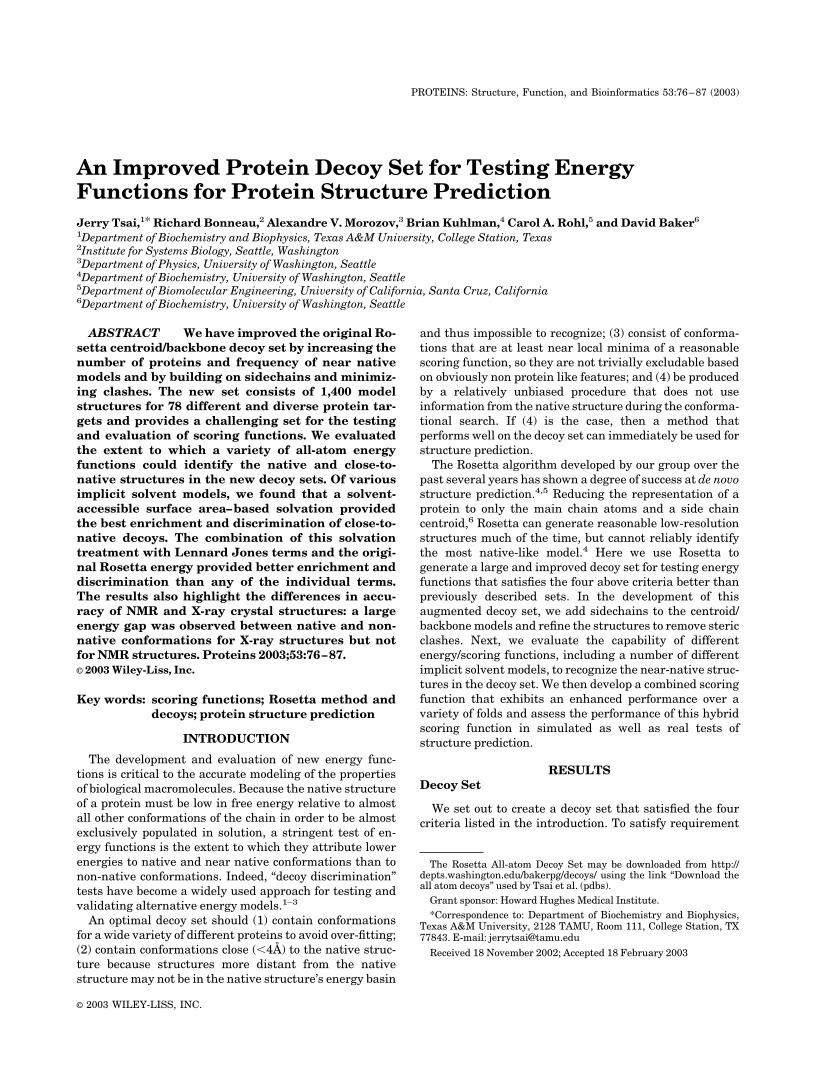
TABLE I. Statistics on the Rosetta All Atom Decoy Set
Number 2° ResiduesPDBcode Experiment
Relativecontactorder
LowestC�RMSD
Number within C�RMSD bins
�3 3 to 4 4 to 5 5 to 6 6�
1 � 35 1res NMR 0.11 1.24 1,280 111 8 0 02 � 43 1uxd NMR 0.12 1.31 760 235 189 70 1453 � 43 2pdd NMR 0.11 2.65 36 367 212 289 4964 � 45 1uba NMR 0.09 3.00 1 78 290 376 6555 � 47 1gab NMR 0.11 1.93 438 351 171 87 3536 � 56 1bw6 NMR 0.10 2.29 163 203 245 248 5417 � 56 2hp8 NMR 0.09 3.13 0 25 368 105 9018 � 57 1am3 X-RAY 0.09 1.66 345 123 154 137 6409 � 61 1r69 X-RAY 0.12 1.58 232 101 205 212 649
10 � 62 1c5a NMR 0.11 3.18 0 67 231 191 91011 � 62 1utg X-RAY 0.08 3.68 0 2 176 225 99612 � 65 1a32 X-RAY 0.09 1.20 321 118 87 102 77213 � 65 2ezh NMR 0.10 2.43 2 170 150 100 97714 � 66 1nre NMR 0.09 1.75 91 65 82 97 1,06415 � 67 1ail X-RAY 0.10 2.82 3 15 106 120 1,15516 � 68 1hp8 NMR 0.08 4.02 0 0 117 220 1,06217 � 69 1lfb X-RAY 0.11 2.73 1 49 106 79 1,16418 � 70 1nkl NMR 0.09 2.80 1 122 245 204 82719 � 70 1pou NMR 0.11 2.70 4 88 125 80 1,10220 � 71 1mzm X-RAY 0.10 2.67 3 134 198 135 97221 � 73 1acp NMR 0.10 3.69 0 15 339 96 94922 � 74 1jvr NMR 0.09 3.85 0 3 95 171 1,13023 � 74 1kjs NMR 0.11 3.30 0 144 272 139 84524 � 74 1ner NMR 0.08 3.53 0 23 167 140 1,07025 � 75 1hyp X-RAY 0.08 4.41 0 0 14 102 1,28426 � 76 1adr NMR 0.11 4.04 0 0 27 88 1,28527 � 76 1cc5 X-RAY 0.10 4.29 0 0 26 188 1,18528 � 77 2 pac NMR 0.12 4.24 0 0 92 170 1,13729 � 81 1coo NMR 0.11 4.21 0 0 16 132 1,25230 � 83 1a1z NMR 0.09 3.68 0 2 6 21 1,37131 � 85 1cei X-RAY 0.11 4.63 0 0 2 25 1,37332 � 85 1ngr NMR 0.11 3.28 0 9 75 127 1,18933 � 86 1aca NMR 0.14 3.77 0 3 71 84 1,24234 � 86 2af8 NMR 0.09 3.33 0 8 78 86 1,22835 � 87 1a6s NMR 0.11 4.12 0 0 47 165 1,18836 � 87 1ddf NMR 0.11 3.95 0 1 2 41 1,35537 �� 25 5znf NMR 0.17 0.78 537 213 293 199 15738 �� 43 1ptq X-RAY 0.21 5.25 0 0 0 36 1,36339 �� 52 1ap0 NMR 0.14 5.75 0 0 0 8 1,39240 �� 52 1bor NMR 0.17 4.79 0 0 1 9 1,38941 �� 56 1aa3 NMR 0.12 2.21 23 131 133 111 1,00142 �� 56 1orc X-RAY 0.09 3.05 0 69 230 347 75343 �� 57 1pgx X-RAY 0.17 2.22 76 182 185 308 64844 �� 59 1tif X-RAY 0.16 2.64 1 68 268 382 68045 �� 60 2ptl NMR 0.18 2.53 43 304 186 78 78846 �� 62 1dol X-RAY 0.14 3.91 0 1 2 7 1,39047 �� 63 1leb NMR 0.12 2.42 12 60 126 181 1,02048 �� 65 1tnt NMR 0.14 3.57 0 1 18 42 1,33849 �� 65 2fmr NMR 0.16 3.34 0 26 146 110 1,11850 �� 66 1fwp NMR 0.19 5.10 0 0 0 24 1,37551 �� 66 1sap NMR 0.10 3.33 0 5 14 34 2,34652 �� 66 2fow NMR 0.13 3.02 0 133 215 174 87753 �� 67 1ctf X-RAY 0.18 2.91 1 195 250 140 86754 �� 68 1stu NMR 0.12 3.69 0 2 19 70 1,30955 �� 69 2bby NMR 0.10 3.79 0 6 158 141 1,37256 �� 69 4ull NMR 0.15 5.08 0 0 0 28 1,37257 �� 71 1bb8 NMR 0.09 6.37 0 0 0 0 1,40058 �� 71 1vig NMR 0.14 3.70 0 2 18 12 1,36859 �� 72 1afi NMR 0.19 2.20 11 163 105 65 1,05660 �� 72 1lea NMR 0.14 3.65 0 4 98 118 1,180
IMPROVED PROTEIN DECOY SET 77
(1), we sought to produce a decoy set using Rosetta for aslarge a set of proteins as possible. We started with apreviously defined set7 and augmented it with proteinsfrom a set selected by another group.8 The final setcomprises 78 proteins, which are listed in Table I, andincludes proteins that range from 25 to 81 residues inlength and from 0.08 to 0.21 in relative contact order.9
Based on the native structures, we loosely group the setsinto one of three categories: 36 all �-helical, 29 mixed�-helical and �-sheet, and 13 all �-sheet (see Table I). Foreach of these proteins, Rosetta simulations were used toproduce 1,000 independent conformations following theoriginal protocol and using the energy functions describedpreviously (see Methods).7 Side chains were added to thesemodels using the energy function and Monte Carlo searchprocedure described in Kuhlman and Baker31. To satisfyrequirement (2) that the decoy set contain structureswithin the native energy basin, large numbers of addi-tional simulations were carried out and only conforma-tions close in C�RMSD to the native structure were saved.These structures totaled �400 per protein and were addedto the initial sets of 1,000 conformations. The averageC�RMSD of the most native-like decoys is 3.5 Å. Thenumber of structures within 3, 4, 5, and 6 Å C�RMSD foreach protein are listed in Table I. Requirement (3) issatisfied because all structures are the result of Rosettaconformational searches, which usually produce struc-tures with quite protein-like properties. Requirement (4) issatisfied for the initial sets of 1,000 conformations, but isbroken to some extent by the inclusion of the additionallow C�RMSD decoys. Each individual simulation wasignorant of the native structure, however, and thus thesets are quite different from previous sets such as thosegenerated using molecular dynamics starting from a na-tive structure10 or built up using information derived fromthe native structure.11 Rather than perturbing the nativestate, each simulation begins from an extended chain; the
native structure is only used in the selection of a subset ofthe decoys. These steps insure that the resulting modelspopulate minima spread throughout conformational space.The new, all-atom Rosetta decoy set is diverse, wellpopulated with near native conformations, and well suitedfor evaluation of scoring functions.
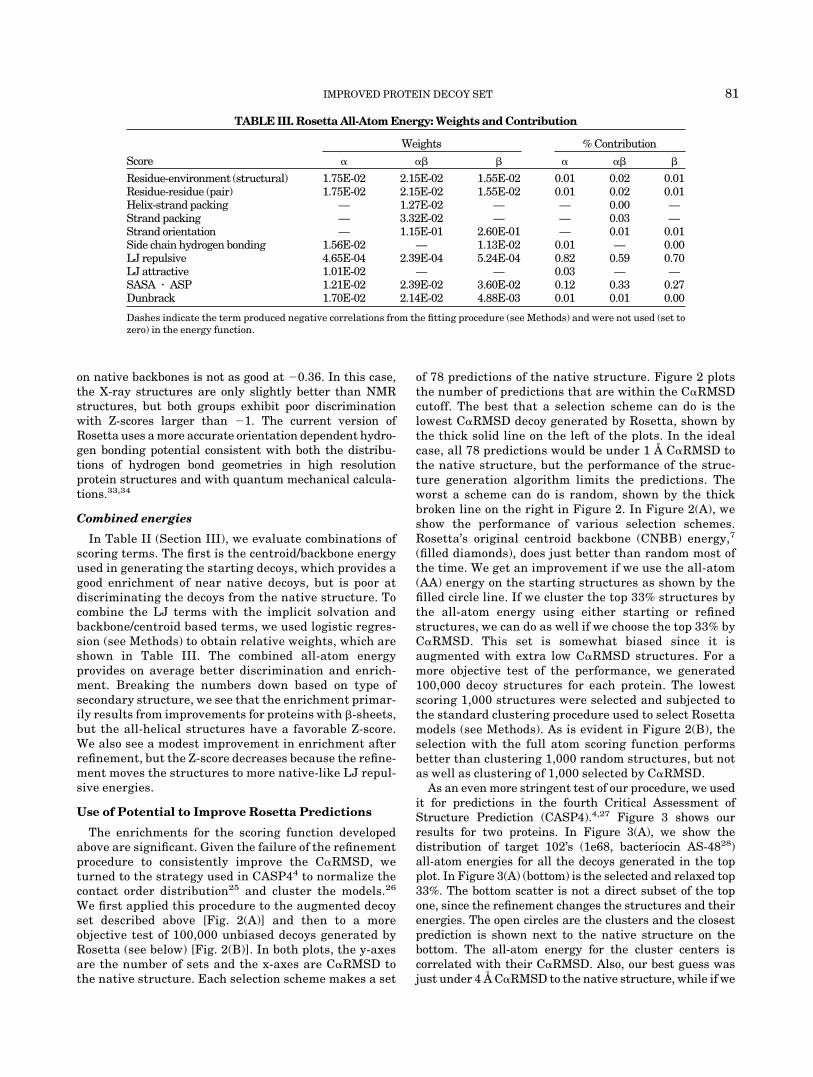
We attempted to relax structures following addition ofthe side chains by explicitly minimizing the all-atomenergy. Through this minimization, we hoped to push thestructures towards the native structure and to obtainbetter discrimination. Extensive testing of this approachusing a number of procedures for backbone relaxation andside chain selection did not prove fruitful (see Methods).We did find that we could improve structures whosebackbones were less than 2 Å C�RMSD to the native (Fig.1), which is similar to what was found to be the limit forside chain packing.12 Most of our starting models, how-ever, were well beyond 3 Å C�RMSD to the true structure(Table I). While the relaxation procedure did not make themodels more native-like as measured by C�RMSD, it doesmake the models more physically consistent by removingbad clashes, and hence the decoy set available for distribu-tion and used in the tests below consists of the relaxedstructures.
Evaluation of Scoring Functions
An accurate energy function should on average attributelower energies to native-like conformations than to non-native conformations. A useful measure that captures theextent to which a function has this property is the enrich-ment: the fraction of low C�RMSD models in a low-energysubset of the total decoy population, divided by the fractionof low C�RMSD models in the total population (seeMethods). Enrichment values greater than one indicatethat the function enriches for lower C�RMSD structures,and vice versa. An alternative measure is the native Zscore: the number of standard deviations separating the
TABLE I. (Continued)
Number 2° ResiduesPDBcode Experiment
Relativecontactorder
LowestC�RMSD
Number within C�RMSD bins
�3 3 to 4 4 to 5 5 to 6 6�
61 �� 72 5icb X-RAY 0.11 3.15 0 70 227 156 94662 �� 76 2ula NMR 0.17 4.16 0 0 7 13 1,38063 �� 77 1vcc X-RAY 0.11 3.76 0 1 4 57 1,33864 �� 78 1aoy NMR 0.11 4.17 0 0 39 103 1,25865 �� 81 2fxb X-RAY 0.16 5.50 0 0 0 9 1,39166 � 42 1qyp NMR 0.19 3.14 0 78 187 100 1,03467 � 48 1vif X-RAY 0.20 0.61 225 26 79 67 1,00268 � 53 1bq9 X-RAY 0.18 2.86 1 18 96 112 1,17369 � 54 2cdx NMR 0.18 6.77 0 0 0 0 1,39970 � 55 1ark NMR 0.19 3.25 0 12 129 134 1,12471 � 55 5pti X-RAY 0.17 4.05 0 0 19 149 1,23172 � 60 1msi X-RAY 0.19 5.59 0 0 0 12 1,38773 � 61 1tuc X-RAY 0.20 4.54 0 0 14 152 1,23474 � 62 1aiw NMR 0.15 6.56 0 0 0 0 1,40075 � 64 1csp X-RAY 0.16 3.35 0 33 196 102 1,06876 � 65 1kde NMR 0.17 5.92 0 0 0 2 1,39877 � 66 1sro NMR 0.14 2.60 2 103 198 112 98478 � 69 1pse NMR 0.17 5.81 0 0 0 1 1,399
78 J. TSAI ET AL.
native structure energy from the average energy of thedecoys. For each of the energies described below, wecalculated the enrichment of the decoys and the Z-score ofthe native structure. For those energies involving sidechains, we also calculated the Z-score for a native struc-ture with side chains repacked using the same protocol asthe decoys. We show the overall average for this repackedZ-score, as well as contrast the averages for structuressolved by X-ray crystallography vs. those solved by NMR.Negative Z-scores indicate the native structure is lower inenergy than the average value for decoys, whereas positiveZ-scores indicate the native energy is higher than thisaverage. We will break up our discussion loosely upontypes of energies as organized in Table II.
Original Rosetta energies
These energies are primarily knowledge-based, probabi-listic distribution functions used in the initial generationof the models. Since all of these energies use the reducedrepresentation, repacking the side chains has no effect.The decoys are heavily minimized on the residue-environ-ment and residue-residue energies and, as a result, theZ-scores of their native structures are poor. Even so, theenergies exhibit enrichment for more native-like decoys.
Van der Waals interactions
Close packing of side chains is a characteristic feature ofglobular proteins.13,14 We separately analyzed the attrac-tive and repulsive parts of the Lennard Jones (LJ) interac-tions. Two different repulsive terms were considered: onewith a truncated 1/r12 dependence, and one with a reducedlinear dependence (see Methods). Table II shows theenrichments and Z-scores for the attractive and repulsiveterms separately, and in combination. All the different LJterms exhibit good Z-scores to the native structure, which
decrease for the repacked native structure. A strikingresult is the much poorer repacked Z-score from both LJtotal terms for NMR structures compared to X-ray crystalstructures, which reflects the greater deviation of sidechianconformations in NMR structures from the canonicalrotamer conformations used in the repacking calculations.
Implicit solvent models
The large energy decrease associated with desolvatingnon-polar atoms provides much of the driving force forprotein folding. Explicit solvent models, which treat thesolvent in atomistic detail, clearly are the most physicallyrealistic, but are computationally prohibitive. Therefore,many groups have developed implicit solvent models,which can be readily tested using our decoy set. Thenear-native decoy enrichments and the native Z-scores arelisted in Table II.
The Generalized Born (GB) model is an implicitsolvent model that takes into account charge-chargeinteractions in vacuum screened by polarization on thesolvent-solute boundary, the desolvation penalty of bring-ing a charge inside a protein cavity (charge self-energy),and the cost of making a solute cavity in solvent.15 Weimplemented a version of the GB model compatible withthe AMBER force field16 developed previously by othergroups17–19 that is known to reproduce fairly well theelectrostatic energies obtained through a solution of thePoisson-Boltzman equation. The GB model uses onedielectric constant for the solvent and one for the solute(we used a dielectric constant of one for the proteininterior and 80 for the solvent surrounding the mole-cule), even though the dielectric constant is not welldefined in the protein interior where heterogeneous andnonuniform distributions of polar and nonpolar atomsmay have quite different mobilities depending on the
Fig. 1. Change in C�RMSD resulting from decoy refinement. The change in C�RMSD (final-starting) isbinned according to starting C�RMSD values. Negative values indicate models moved closer to the nativestructure after refinement. We only show the bins from 0 to 6 Å, although bins up to a 15 Å are populated.
IMPROVED PROTEIN DECOY SET 79
rigidity of the structural element/side chain to whichthey are attached. We found that Coulomb energies,screened Coulomb energies, and GB surface area (cav-ity) terms produce reasonable enrichments and Z-scores. The total GB energy is worse because the atomicdesolvation penalties (see GB Desolvation in Table II)tend to disfavor native structures. A more rigorousexamination of electrostatic models has been done re-cently using Rosetta.33
A scaled solvent accessible surface area term SASA-ASP20 exhibits the second best enrichment and a goodZ-score. Even for the repacked native structures, theZ-score is good and consistent between X-ray and NMRstructures. Exhibiting an enrichment less than one and apositive Z-score, the Lazaridis and Karplus effective solva-tion model21 does not work well in isolation, probablybecause relaxed decoys tend to have larger surface areasthan the native structures, and therefore the desolvationpenalty for burying polar atoms is smaller in decoys. Thisphenomenon also occurs when the GB model15 is used tocompute desolvation penalties (see Table II). On the otherhand, the GB SA term,22 which approximates the cost ofmaking an empty solute-sized cavity in the solvent, exhib-
its behavior similar to that of the SASA-ASP model. Thismodel’s relative success in discriminating native andnear-native structures likely results from larger decoysurface areas relative to native proteins. We also experi-mented with an SASA-based term that penalized buriedpolar atoms,23 but found that it did not actually help indiscrimination and in some cases caused the structures tounfold during the relaxation protocol in order to avoid thepenalty.
Hydrogen bonding
We used an empirical, orientation-dependent hydrogenbonding potential developed by Gordon and Mayo.24 Withenrichment values around one, no hydrogen bonding termshows enrichment for native-like decoys. As shown by theZ-score, main-chain hydrogen bonding distinguishes thenative structure from decoys, and as expected, the Z-scorefor the native repacked is the same because the backbonehas not changed. This good discrimination results primar-ily from X-ray structures with a Z-score of �3.11, whereasthe NMR structures have a poor Z-score of �0.24. For sidechain hydrogen bonds, native structures have a goodZ-score to decoys, but the Z-score from structures repacked
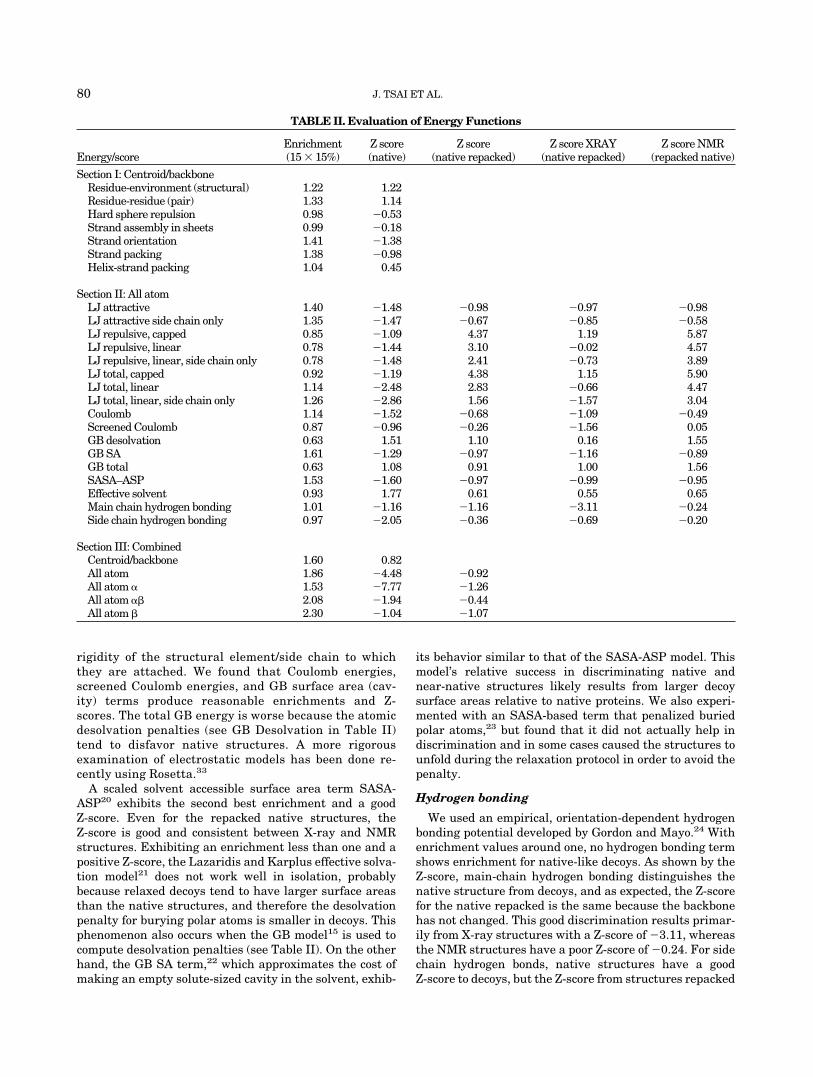
TABLE II. Evaluation of Energy Functions
Energy/scoreEnrichment(15 � 15%)
Z score(native)
Z score(native repacked)
Z score XRAY(native repacked)
Z score NMR(repacked native)
Section I: Centroid/backboneResidue-environment (structural) 1.22 1.22Residue-residue (pair) 1.33 1.14Hard sphere repulsion 0.98 �0.53Strand assembly in sheets 0.99 �0.18Strand orientation 1.41 �1.38Strand packing 1.38 �0.98Helix-strand packing 1.04 0.45
Section II: All atomLJ attractive 1.40 �1.48 �0.98 �0.97 �0.98LJ attractive side chain only 1.35 �1.47 �0.67 �0.85 �0.58LJ repulsive, capped 0.85 �1.09 4.37 1.19 5.87LJ repulsive, linear 0.78 �1.44 3.10 �0.02 4.57LJ repulsive, linear, side chain only 0.78 �1.48 2.41 �0.73 3.89LJ total, capped 0.92 �1.19 4.38 1.15 5.90LJ total, linear 1.14 �2.48 2.83 �0.66 4.47LJ total, linear, side chain only 1.26 �2.86 1.56 �1.57 3.04Coulomb 1.14 �1.52 �0.68 �1.09 �0.49Screened Coulomb 0.87 �0.96 �0.26 �1.56 0.05GB desolvation 0.63 1.51 1.10 0.16 1.55GB SA 1.61 �1.29 �0.97 �1.16 �0.89GB total 0.63 1.08 0.91 1.00 1.56SASA–ASP 1.53 �1.60 �0.97 �0.99 �0.95Effective solvent 0.93 1.77 0.61 0.55 0.65Main chain hydrogen bonding 1.01 �1.16 �1.16 �3.11 �0.24Side chain hydrogen bonding 0.97 �2.05 �0.36 �0.69 �0.20
Section III: CombinedCentroid/backbone 1.60 0.82All atom 1.86 �4.48 �0.92All atom � 1.53 �7.77 �1.26All atom �� 2.08 �1.94 �0.44All atom � 2.30 �1.04 �1.07
80 J. TSAI ET AL.
on native backbones is not as good at �0.36. In this case,the X-ray structures are only slightly better than NMRstructures, but both groups exhibit poor discriminationwith Z-scores larger than �1. The current version ofRosetta uses a more accurate orientation dependent hydro-gen bonding potential consistent with both the distribu-tions of hydrogen bond geometries in high resolutionprotein structures and with quantum mechanical calcula-tions.33,34
Combined energies
In Table II (Section III), we evaluate combinations ofscoring terms. The first is the centroid/backbone energyused in generating the starting decoys, which provides agood enrichment of near native decoys, but is poor atdiscriminating the decoys from the native structure. Tocombine the LJ terms with the implicit solvation andbackbone/centroid based terms, we used logistic regres-sion (see Methods) to obtain relative weights, which areshown in Table III. The combined all-atom energyprovides on average better discrimination and enrich-ment. Breaking the numbers down based on type ofsecondary structure, we see that the enrichment primar-ily results from improvements for proteins with �-sheets,but the all-helical structures have a favorable Z-score.We also see a modest improvement in enrichment afterrefinement, but the Z-score decreases because the refine-ment moves the structures to more native-like LJ repul-sive energies.
Use of Potential to Improve Rosetta Predictions
The enrichments for the scoring function developedabove are significant. Given the failure of the refinementprocedure to consistently improve the C�RMSD, weturned to the strategy used in CASP44 to normalize thecontact order distribution25 and cluster the models.26
We first applied this procedure to the augmented decoyset described above [Fig. 2(A)] and then to a moreobjective test of 100,000 unbiased decoys generated byRosetta (see below) [Fig. 2(B)]. In both plots, the y-axesare the number of sets and the x-axes are C�RMSD tothe native structure. Each selection scheme makes a set
of 78 predictions of the native structure. Figure 2 plotsthe number of predictions that are within the C�RMSDcutoff. The best that a selection scheme can do is thelowest C�RMSD decoy generated by Rosetta, shown bythe thick solid line on the left of the plots. In the idealcase, all 78 predictions would be under 1 Å C�RMSD tothe native structure, but the performance of the struc-ture generation algorithm limits the predictions. Theworst a scheme can do is random, shown by the thickbroken line on the right in Figure 2. In Figure 2(A), weshow the performance of various selection schemes.Rosetta’s original centroid backbone (CNBB) energy,7
(filled diamonds), does just better than random most ofthe time. We get an improvement if we use the all-atom(AA) energy on the starting structures as shown by thefilled circle line. If we cluster the top 33% structures bythe all-atom energy using either starting or refinedstructures, we can do as well if we choose the top 33% byC�RMSD. This set is somewhat biased since it isaugmented with extra low C�RMSD structures. For amore objective test of the performance, we generated100,000 decoy structures for each protein. The lowestscoring 1,000 structures were selected and subjected tothe standard clustering procedure used to select Rosettamodels (see Methods). As is evident in Figure 2(B), theselection with the full atom scoring function performsbetter than clustering 1,000 random structures, but notas well as clustering of 1,000 selected by C�RMSD.
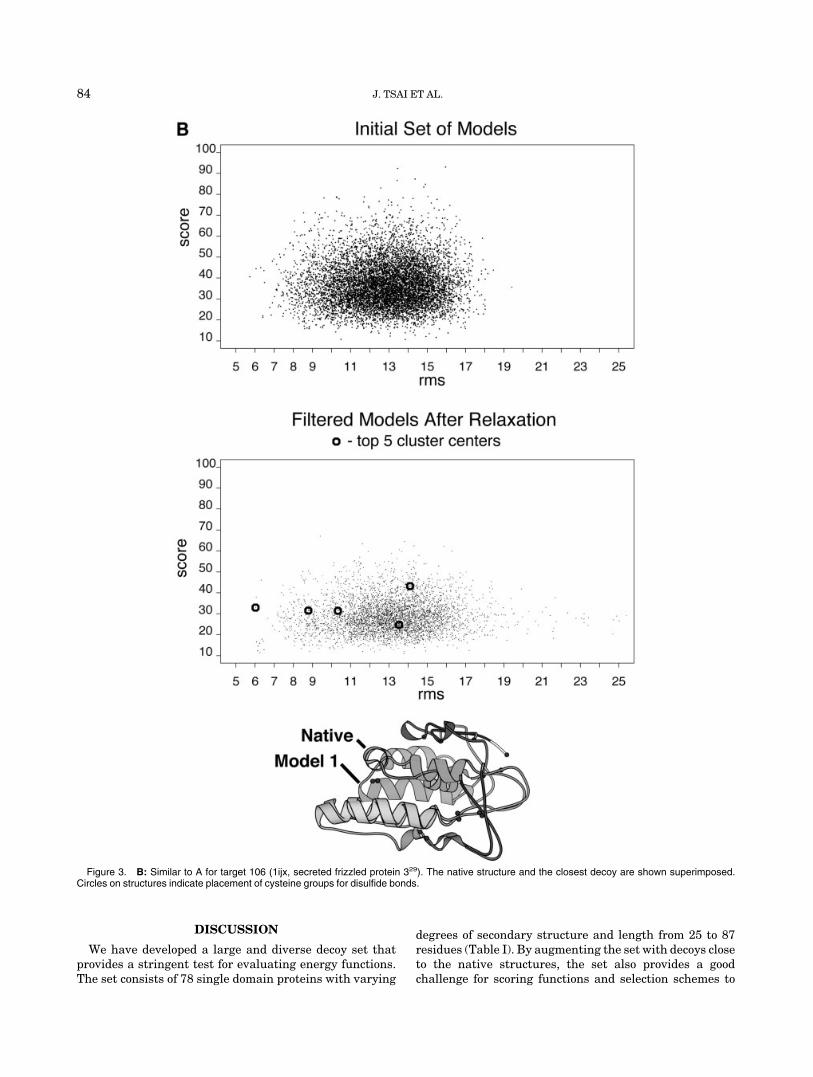
As an even more stringent test of our procedure, we usedit for predictions in the fourth Critical Assessment ofStructure Prediction (CASP4).4,27 Figure 3 shows ourresults for two proteins. In Figure 3(A), we show thedistribution of target 102’s (1e68, bacteriocin AS-4828)all-atom energies for all the decoys generated in the topplot. In Figure 3(A) (bottom) is the selected and relaxed top33%. The bottom scatter is not a direct subset of the topone, since the refinement changes the structures and theirenergies. The open circles are the clusters and the closestprediction is shown next to the native structure on thebottom. The all-atom energy for the cluster centers iscorrelated with their C�RMSD. Also, our best guess wasjust under 4 Å C�RMSD to the native structure, while if we
TABLE III. Rosetta All-Atom Energy: Weights and Contribution
Score
Weights % Contribution
� �� � � �� �
Residue-environment (structural) 1.75E-02 2.15E-02 1.55E-02 0.01 0.02 0.01Residue-residue (pair) 1.75E-02 2.15E-02 1.55E-02 0.01 0.02 0.01Helix-strand packing — 1.27E-02 — — 0.00 —Strand packing — 3.32E-02 — — 0.03 —Strand orientation — 1.15E-01 2.60E-01 — 0.01 0.01Side chain hydrogen bonding 1.56E-02 — 1.13E-02 0.01 — 0.00LJ repulsive 4.65E-04 2.39E-04 5.24E-04 0.82 0.59 0.70LJ attractive 1.01E-02 — — 0.03 — —SASA � ASP 1.21E-02 2.39E-02 3.60E-02 0.12 0.33 0.27Dunbrack 1.70E-02 2.14E-02 4.88E-03 0.01 0.01 0.00
Dashes indicate the term produced negative correlations from the fitting procedure (see Methods) and were not used (set tozero) in the energy function.
IMPROVED PROTEIN DECOY SET 81
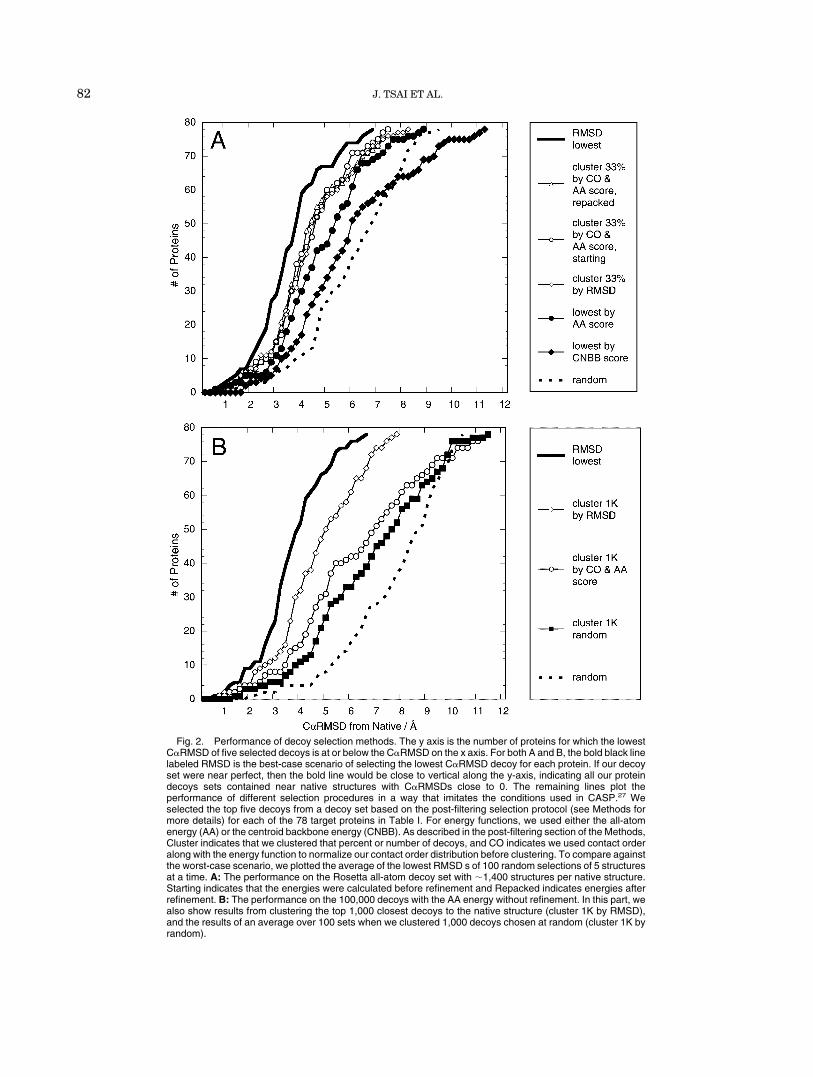
Fig. 2. Performance of decoy selection methods. The y axis is the number of proteins for which the lowestC�RMSD of five selected decoys is at or below the C�RMSD on the x axis. For both A and B, the bold black linelabeled RMSD is the best-case scenario of selecting the lowest C�RMSD decoy for each protein. If our decoyset were near perfect, then the bold line would be close to vertical along the y-axis, indicating all our proteindecoys sets contained near native structures with C�RMSDs close to 0. The remaining lines plot theperformance of different selection procedures in a way that imitates the conditions used in CASP.27 Weselected the top five decoys from a decoy set based on the post-filtering selection protocol (see Methods formore details) for each of the 78 target proteins in Table I. For energy functions, we used either the all-atomenergy (AA) or the centroid backbone energy (CNBB). As described in the post-filtering section of the Methods,Cluster indicates that we clustered that percent or number of decoys, and CO indicates we used contact orderalong with the energy function to normalize our contact order distribution before clustering. To compare againstthe worst-case scenario, we plotted the average of the lowest RMSD s of 100 random selections of 5 structuresat a time. A: The performance on the Rosetta all-atom decoy set with �1,400 structures per native structure.Starting indicates that the energies were calculated before refinement and Repacked indicates energies afterrefinement. B: The performance on the 100,000 decoys with the AA energy without refinement. In this part, wealso show results from clustering the top 1,000 closest decoys to the native structure (cluster 1K by RMSD),and the results of an average over 100 sets when we clustered 1,000 decoys chosen at random (cluster 1K byrandom).
82 J. TSAI ET AL.
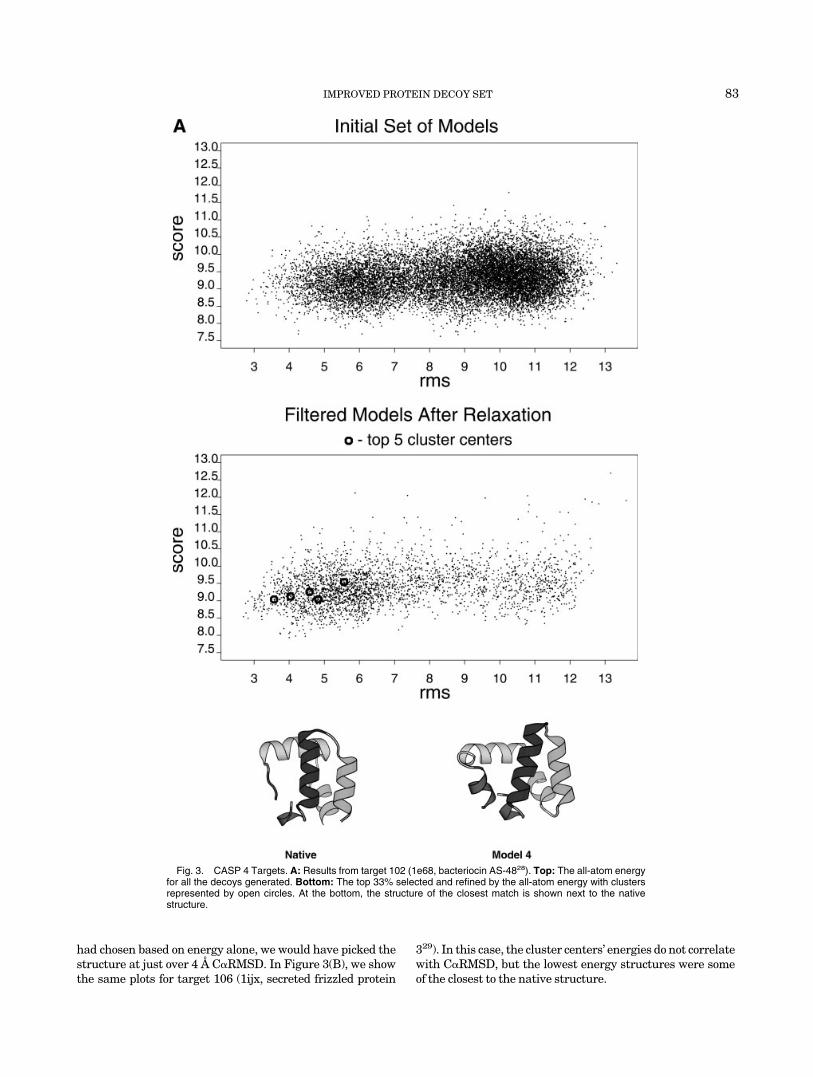
had chosen based on energy alone, we would have picked thestructure at just over 4 Å C�RMSD. In Figure 3(B), we showthe same plots for target 106 (1ijx, secreted frizzled protein
329). In this case, the cluster centers’ energies do not correlatewith C�RMSD, but the lowest energy structures were someof the closest to the native structure.
Fig. 3. CASP 4 Targets. A: Results from target 102 (1e68, bacteriocin AS-4828). Top: The all-atom energyfor all the decoys generated. Bottom: The top 33% selected and refined by the all-atom energy with clustersrepresented by open circles. At the bottom, the structure of the closest match is shown next to the nativestructure.
IMPROVED PROTEIN DECOY SET 83
DISCUSSION
We have developed a large and diverse decoy set thatprovides a stringent test for evaluating energy functions.The set consists of 78 single domain proteins with varying
degrees of secondary structure and length from 25 to 87residues (Table I). By augmenting the set with decoys closeto the native structures, the set also provides a goodchallenge for scoring functions and selection schemes to
Figure 3. B: Similar to A for target 106 (1ijx, secreted frizzled protein 329). The native structure and the closest decoy are shown superimposed.Circles on structures indicate placement of cysteine groups for disulfide bonds.
84 J. TSAI ET AL.
test themselves against the local minima around thenative state. As has been previously shown, many decoysets suffer some weakness that can be exploited to find agood correlation between an energy and C�RMSD.3 Suchweaknesses result from sampling only structures withinthe native state well or sampling of structures perturbedfrom the native state. Since this decoy set was not gener-ated with a bias for the native state, it samples manystates outside of the native well and in conformationalareas that are likely false minima for scoring functions.Table II and Figure 2 illustrates the value of this decoy setin effectively evaluating energy functions. The resultsindicate that scoring functions are discriminatory for thenative structure, but are not good at finding the absoluteclosest decoy structure. We anticipate this Rosetta All-atom decoy set should be broadly useful to developers ofpotential functions in assessing the abilities of scoringfunctions and selection schemes. Using the all-atom en-ergy function, we have been able to improve the discrimina-tory ability of the Rosetta algorithm for de novo, proteinstructure prediction. There is room for improvement,however, because this procedure cannot consistently iden-tify nearest native structures (Fig. 2). Future work willencompass further testing of energies as well as develop-ing better methods for increased refinement of decoystowards the native structure.
METHODSRosetta Method and Decoys
As described in Simons et al.,6 Rosetta is a fragment-based, de novo-structure generation method. Two frag-ment libraries (3mer and 9mer) are built based on thesecondary structure prediction of the target sequence.4
Starting from an extended amino acid chain, the methodinserts a fragment and then evaluates a centroid/backbone-based potential function7 consisting of knowledge-basedterms, secondary structure terms, and a check for overlap-ping residues. New configurations are accepted based onMonte Carlo Metropolis criterion. Ten thousand 3merinsertions follow 10,000 9mer insertions. The resultingstructures have been previously described7 and provide apoint of departure for this work.
Enriching Set for Low C�RMSD Decoys
To enrich for decoys that were closer to the nativestructure but were not biased by the native structure, weused the Rosetta method described above, but only outputstructures within 15% C�RMSD of the previously lowestC�RMSD structure. Additional decoys (�400) were pro-duced in this way for each set.
Scoring FunctionsLennard-Jones (LJ)
We used two functions for the LJ repulsive. The onereferred to as “capped” in Table II was the standard 1/r12
repulsive component of a 6–12 potential with a cutoff at100 kcal/mol. The other called “linear” switched to a linearfunction from 0 to 10 kcal/mol for all repulsive values. The“linear” function was used in the final all-atom scoringfunction described in Table III and in Figures 2 and 3.
Solvent accessible surface area (SASA)
The SASA was computed using a fast, approximatemethod,30 where the surface of an atom was representedby grid points and stored in binary. Overlap (buried) gridpoints were pre-computed based on distance and anglebetween atom centers and were switched off using binaryoperators. The grid points that remained “on” representedexposed surface. The surface area was calculated bysumming the areas of the exposed grid points. For thescoring, we multiplied the SASA by an atomic solvationparameter (ASP).20,23
Addition of Sidechains and Refinement
Side chains were added to the centroid/backbone decoystructures using a simulated annealing method describedpreviously31 and a backbone-dependent library of rotam-ers.32 The move set for relaxing the backbone consisted oftwo types: small random changes in phi, psi torsion angelsof a single residue (small move), and a three-residuefragment insertion followed by conjugate gradient minimi-zation of the perturbation on the structure by varying thebackbone torsion angels of the flanking residues (wobblemove). The number of moves for a particular structure wasset to four times the number of residues. The potentialused during refinement included the original Rosettacentroid/backbone-based terms supplemented with hydro-gen bonding and the LJ function with the linear repulsiveterm. The procedure began with an initial minimizationover the entire structure. This stage was followed by a setof small moves using a reduced rotamer set comprised ofthe top three most prevalent rotamers for a buried residueand two for an exposed one. Next, the resulting structurewas minimized using a slowly increasing weight for the LJrepulsive term in three steps. This phase was followed by aset of small moves followed by wobble moves, again usingthe reduced rotamer set for packing. After another set ofminimizations, a full set of rotamers was used. As before,the order was a set of small moves, minimization, a set ofsmall moves with minimization and wobble moves, andfinal minimization.
Scoring Potential Optimization/Fitting
Logistic regression aimed at optimizing the recognitionof the lowest C�RMSD 5% of the decoys for each proteinwas used to weight the components of the energy function.Instead of treating the protein set as whole, we split the setof structures into three groups based on secondary struc-ture (�, ��, and �; see Table I) as a logical way to separateprotein environments and improve the discrimination ofour function. All fitting was done using the programSPLUS � Mathsoft. Weights with a negative correlationhave been set to zero in the total energy function. Table IIIshows the results of the fitting, where those with negativecorrelations are given a dash.
Calculation of Enrichment
Enrichment was calculated based on the union of the top15% of decoys by energy and top 15% by C�RMSD to thenative structure. Dividing this number by what would be
IMPROVED PROTEIN DECOY SET 85
expected for a uniform distribution (15% � 15% � number inset) yields the enrichment. Values greater than one indi-cate an enrichment over a uniform distribution.
Post Filtering
We experimented with several different procedures toselect “good” decoys from the large decoy sets using anenergy function. The simplest method, and certainly thebest given a perfect energy function, is simply to take thelowest energy decoys. However, given the imperfections incurrent functions, it is useful to take into account previousobservations of the power of clustering methods to identifynear native structures,26 and of the tendency of Rosetta togenerate an excess of low contact order structures.25 If it isassumed that noise in the energy function prohibits accu-rate ranking of the quality of the decoys, but does allow theexclusion of physically implausible structures, a reason-able protocol is to select the lowest energy 1–10% of decoys,and then cluster this subset to identify the broadestminima in the energy landscape. Furthermore, to compen-sate for the uneven contact order distribution sampled byRosetta, this procedure can be further elaborated bytaking not the lowest energy 1–10% of decoys in the overallpopulation, but a fixed number of low-energy structures ineach of a number of independently considered contactorder ranges. For example, if 90% of decoys for a givenprotein fall in a contact order range only populated by 10%of native proteins in the same length range, simply select-ing by energy could produce a considerable excess oflow-contact order conformations. This can be remedied byselecting an equal number of low-energy structures fromacross the contact order range, which results in a popula-tion of low-energy structures evenly distributed with re-spect to contact order. This low-energy, contact ordernormalized population can then be clustered and the fivelargest centers selected as above.
The contact order of native proteins increases withincreasing length, and this must be taken into account indefining contact order ranges in which equal numbers ofnative protein structures are expected to fall. We sepa-rated native proteins ranging from 50 to 160 residues intoall �, all �, and ��, and computed the mean contact order(or 50th percentile), the 5th percentile value, and the 95thpercentile for each 10-residue, protein length interval.Each of these three sets of points was then fit to simplelinear functions of protein length. The slopes (m) andy-intercepts (b) of the lines thus obtained are given inTable IV, where x is the number of residues and y is eitherthe 5th, 50th, or 95th percentile contact order value. Forthe contact order normalization described in the previousparagraph, 5% of structures were taken from below the 5thpercentile value for the length of the protein, 45% frombetween this value and the 50th percentile value, and soon.
For example, to reduce a population of 100,000 decoystructures to 1,000 prior to clustering, from decoy struc-tures in the �5% bin, we would choose the lowest energy5% (50 structures) based on the energy function, from the 5to 50% bin, we would choose the best 45% (450 structures)
based on the energy function, the same number for the 50to 95% bin, and finally the lowest energy 50 from the �95%bin for a total of 5 � 450 � 450 � 5 1,000 structures to beclustered. Once clustered, the top 5 centers from thelargest clusters are selected.
ACKNOWLEDGMENTS
The authors thank Ingo Ruczinski for SPLUS expertise,Eric Alm for the SASA code, and Keith Laidig for tirelesstechnical support and system administration. We thankCharlie Strauss, Dylan Chivian, and especially Kira Mi-sura for discussion and careful reading of the manuscript.J.T. thanks the National Science Foundation (BiologicalInformatics Fellowship). B.K. is a fellow of the CancerResearch Fund of the Damon Runyon-Walter WinchellFoundation. R.B., A.M., C.A.R., and D.B. were supportedby the Howard Hughes Medical Institute. Thanks also toJ. Brad Holmes and Jordan Tayce for preparing the decoyset for public use.
REFERENCES
1. Hardin C, Pogorelov TV, Luthey-Schulten Z. Ab initio proteinstructure prediction. Curr Opin Struct Biol 2002;12:176–181.
2. Felts AK, Gallicchio E, Wallqvist A, Levy RM. Distinguishingnative conformations of proteins from decoys with an effective freeenergy estimator based on the OPLS all-atom force field and theSurface Generalized Born solvent model. Proteins 2002;48:404–422.
3. Park BH, Huang ES, Levitt M. Factors affecting the ability ofenergy functions to discriminate correct from incorrect folds. J MolBiol 1997;2664:831–846.
4. Bonneau R, Tsai J, Ruczinski I, Chivian D, Rohl C, Strauss CE,Baker D. Rosetta in CASP4: progress in ab initio protein structureprediction. Proteins 2001;45(Suppl 5):119–126.
5. Simons KT, Bonneau R, Ruczinski I, Baker D. Ab initio proteinstructure prediction of CASP III targets using ROSETTA. Pro-teins 1999;(Suppl 3):171–176.
6. Simons KT, Kooperberg C, Huang E, Baker D. Assembly of proteintertiary structures from fragments with similar local sequencesusing simulated annealing and Bayesian scoring functions. J MolBiol 1997;268:209–225.
7. Simons KT, Ruczinski I, Kooperberg C, Fox BA, Bystroff C, BakerD. Improved recognition of native-like protein structures using acombination of sequence-dependent and sequence-independentfeatures of proteins. Proteins 1999;34:82–95.
8. Eyrich,VA, Standley DM, Friesner RA. Prediction of proteintertiary structure to low resolution: performance for a large andstructurally diverse test set. J Mol Biol 1999;288:725–742.
9. Plaxco KW, Simons KT, Baker D. Contact order, transition stateplacement and the refolding rates of single domain proteins. J MolBiol 1998;277:985–994.
10. Huang ES, Subbiah S, Tsai J, Levitt M. Using a hydrophobiccontact potential to evaluate native and near-native folds gener-
TABLE IV. Parameters for Contact Order Cutoff Lines:Slope m and y-intercept b
� �� �
m b m b m b
Upper 95thpercentile
0.22 5.50 0.25 8.75 0.34 2.00
Middle 50thpercentile
0.18 2.07 0.19 7.36 0.24 6.00
Lower 5thpercentile
0.15 3.00 0.14 3.25 0.15 8.00
86 J. TSAI ET AL.
ated by molecular dynamics simulations. J Mol Biol 1996;257:716–725.
11. Park B, Levitt M. Energy functions that discriminate X-ray andnear native folds from well-constructed decoys. J Mol Biol 1996;258:367–392.
12. Chung SY, Subbiah S. How similar must a template protein be forhomology modeling by side-chain packing methods? Pac SympBiocomput 1996;126–141.
13. Liang J, Dill KA. Are proteins well-packed? Biophys J 2001;81:751–766.
14. Chothia C. Principles that determine the structure of proteins.Annu Rev Biochem 1984;53:537–572.
15. Still WC, Tempczyk A, Hawley RC, Hendrickson TJ. Semianalyti-cal treatment of solvation for molecular mechanics and dynamics.J Am Chem Soc 1990;112:6127–6129.
16. Cornell WD, Cieplak P, Bayly CI, Gould IR, Merz KM Jr,Ferguson DM, Spellmeyer DC, Fox T, Caldwell JW, Kollman PA.A second generation force field for the simulation of proteins,nucleic acids, and organic molecules. J Am Chem Soc 1995;117:5179–5197.
17. Hawkins GD, Cramer CJ, Truhlar DG. Pairwise solute descreen-ing of solute charges from a dielectric medium. Chem Phys Lett1995;246:122–129.
18. Hawkins GD, Cramer CJ, Truhlar DH. Parameterized models ofaqueous free energies of solvation based on pairwise descreeningof solute atomic charges from a dielectric medium. J Phys Chem1996;100:19824–19839.
19. Jayaram B, Sprous D, Beveridge DL. Solvation free energy ofbiomacromolecules: Parameters for a modified Generalized BornModel consistent with the AMBER force field. J Chem Phys1998;102:9571–9576.
20. Eisenberg D, McLachlan AD. Solvation energy in protein foldingand binding. Nature 1986;319:199–203.
21. Lazaridis T, Karplus M. “New view” of protein folding reconciledwith the old through multiple unfolding simulations. Science1997;278:1928–1931.
22. Qiu D, Sherkin PS, Hollinger FP, Still WC. The GB/SA continuummodel for solvation, A fast analytical method for the calculation ofapproximate Born radii. J Phys Chem A 1997;1997:3005–3014.
23. Koehl P, Delarue M. Polar and nonpolar atomic environments inthe protein core: implications for folding and binding. Proteins1994;20:264–278.
24. Gordon DB, Mayo SL. Radical performance enhancements forcombinatorial optimization algorithms based on the dead-endelimination theorem. J Comp Chem 1998;19:1505–1514.
25. Bonneau R, Ruczinski I, Tsai J, Baker D. Contact order and abinitio protein structure prediction. Protein Sci 2002:11:1937–1944.
26. Shortle D, Simons KT, Baker D. Clustering of low-energy confor-mations near the native structures of small proteins. Proc NatlAcad Sci USA 1998;95:11158–11162.
27. Moult J, Fidelis K, Zemla A, Hubbard T. Critical assessment ofmethods of protein structure prediction (CASP): Round IV. Pro-teins 2001;45(Suppl 5):2–7.
28. Gonzalez C, Langdon GM, Bruix M, Galvez A, Valdivia E,Maqueda M, Rico M. Bacteriocin AS-48, a microbial cyclic polypep-tide structurally and functionally related to mammalian NK-lysin. Proc Natl Acad Sci USA 2000;97:11221–11226.
29. Dann CE, Hsieh JC, Rattner A, Sharma D, Nathans J, LeahyDJ. Insights into Wnt binding and signalling from the structuresof two Frizzled cysteine-rich domains. Nature 2001;412:86–90.
30. LeGrand S, Merz KM. Rapid approximation to molecular surfacearea via the use of Boolean logic and look-up tables. J ComputChem 1993;14:349–352.
31. Kuhlman B, Baker D. Native protein sequences are close tooptimal for their structures. Proc Natl Acad Sci USA 2000;97:10383–10388.
32. Dunbrack RL Jr, Karplus M. Backbone-dependent rotamer li-brary for proteins. Application to side-chain prediction. J Mol Biol1993;230:543–574.
33. Morozov AV, Kortemme T, Baker D. Evaluation of models ofelectrostatic potentials. J Phys Chem B 2003;107:2075–2090.
34. Kortemme T, Morozov AV, Baker D. An orientation-dependenthydrogen bonding potential improves prediciton of specificity andstructure for proteins and protein-protein complexes. J Mol Bio2003;326:1239–1259.
IMPROVED PROTEIN DECOY SET 87
Recommended


