Appendix A1 to the simplified modalities and procedures for small-scale CDM project activities
CLEAN DEVELOPMENT MECHANISM SIMPLIFIED PROJECT DESIGN DOCUMENT
FOR SMALL–SCALE PROJECT ACTIVITIES (SSC-PDD) Version 01 (21 January, 2003)
Introductory Note
1. This document contains the clean development mechanism project design document for small-scale project activities (SSC-PDD). It elaborates on the outline of information in appendix B ‘Project Design Document’ to the CDM modalities and procedures (annex to decision 17/CP.7 contained in document FCCC/CP/2001/13/Add.2) and reflects the simplified modalities and procedures (herewith referred as simplified M&P) for small-scale CDM project activities (annex II to decision 21/CP.8 contained in document FCCC/CP/2002/7/Add.3).
2. The SSC-PDD can be obtained electronically through the UNFCCC CDM web site (http://unfccc.int/cdm/ssc.htm), by e-mail ([email protected]) or in print from the UNFCCC secretariat (Fax: +49-228-8151999).
3. Explanations for project participants are in italicized font (e.g. explanation).
4. The Executive Board may revise the SSC-PDD if necessary. Revisions shall not affect small-scale CDM project activities validated prior to the date at which a revised version of the SSC-PDD enters into effect. Versions of the SSC-PDD shall be consecutively numbered and dated. The SSC-PDD will be available on the UNFCCC CDM web site in all six official languages of the United Nations.
5. In accordance with the CDM modalities and procedures, the working language of the Board is English. The completed SSC-PDD shall therefore be submitted to the Executive Board in English.
6. Small-scale activities submitted as a bundle, in accordance with paragraphs 9 (a) and 19 of the simplified M&P for small-scale CDM project activities, may complete a single SSC-PDD provided that information regarding A.3 (Project participants) and A.4.1 (Location of the project activity) is completed for each project activity and that an overall monitoring plan is provided in section D.
7. A small-scale project activity with different components eligible to be proposed2 as a small-scale CDM project activity may submit one SSC-PDD, provided that information
1 This appendix has been developed in accordance with the simplified modalities and procedures for small-scale CDM project activities (contained in annex II to decision 21/CP.8, see document FCCC/CP/2002/7/Add.3) and it constitutes appendix A to that document. For the full text of the annex II to decision 21/CP.8 please see http://unfccc.int/cdm/ssc.htm). 2 In paragraph 7 of simplified M&P for small-scale CDM project activities, on clarifications by the Executive Board on small-scale CDM project activities, the Board agreed that in a project activity with more than one component that will benefit from simplified CDM modalities and procedures, each component shall meet the threshold criterion of each applicable type, e.g. for a project with both a renewable energy and an energy efficiency component, the renewable energy component shall meet the criterion for ‘renewable energy’ and the energy efficiency component that for ‘energy efficiency’.

regarding subsections A.4.2 (Type and category(ies) and technology of project activity), and A.4.3 (brief statement on how anthropogenic emissions of greenhouse gases (GHGs) by sources are to be reduced by the proposed CDM project activity) and sections B (Baseline methodology), D (Monitoring methodology and plan) and E (Calculation of GHG emission reductions by sources) is provided separately for each of the components of the project activity.
8. If the project activity does not fit any of the project categories in appendix B of the simplified M&P for small-scale CDM project activities, project proponents may propose additional project categories for consideration by the Executive Board, in accordance to paragraphs 15 and 16 of the simplified M&P for small-scale CDM project activities. The project design document should, however, only be submitted to the Executive Board for consideration after it has amended appendix B as necessary.
9. A glossary of terms may be found on the UNFCCC CDM web site or from the UNFCCC secretariat by e-mail ([email protected]) or in print (Fax: +49-228-8151999).
CONTENTS
A. General description of project activity B. Baseline methodology C. Duration of the project activity/Crediting period D. Monitoring methodology and plan E. Calculation of GHG emission reductions by sources F. Environmental impacts G. Stakeholders comments Annexes Annex 1: Information on participants in the project activity Annex 2: Information regarding public funding Annex 3: Data for northern regional grid Annex 4: Calorific value for different fuels Annex 5: Calculation of Baseline Emission factor for Northern regional grid.
A. General description of project activity A.1 Title of the project activity: Palachan Small Hydro Power Project, Himachal Pradesh, INDIA.
A.2 Description of the project activity: (Please include in the description - the purpose of the project activity - the view of the project participants on the contribution of the project activity to sustainable development (max. one page).)
The main purposes of this project activity are:
1. Electricity generation from three run-of-the-river small hydro projects located in
Kullu District, Himachal Pradesh
2. Harnessing of already available natural resource by generating more electricity,
exposing the local population to job opportunities and increasing their income
level thus leading to livelihood improvement through sustainable development.
• The three hydroelectric projects, with total capacity of 12MW, are planned in
cascade on Palachan Khad, a tributary of Tirthan River, in Himachal Pradesh,
India.
The proposed projects are run–of–the river type and does not include construction of
dam. The reconnaissance survey, detailed survey, investigation of the project site –
involving topographical survey, geo-technical investigations on both banks of the river
and the hydrological study have been carried out. Based on these surveys various project
components have been designed. Breakup of the total capacity in the three different
projects is given below:
• Bathad Hydroelectric Project : 4.5 MW
• Banagi Hydroelectric Project :4 MW
• Farari Hydroelectric Project : 3.5 MW
View of the project participants on the contribution of the project activity to sustainable development In India, power generation is mainly from the coal based power plants. Use of coal and
other fossil fuels for large scale power generation have negative environmental impact
globally, through emissions of greenhouse gases. They even have a negative impact
locally. Hydro power generation is in itself clean power generation where in fossil fuels

are not used. Further, the proposed project is run–of–the river which does not involve
construction of dam, which in itself is a negative environmental impact.
In addition to augmenting the power generation, the project activity tends to provide
around 40 – 45 direct as well as indirect job opportunities to the local population for
various activities involved in construction, commissioning, running and O&M of each of
the projects. This would improve their income generation and thus would improve their
livelihoods. Further due to the project activity in the region the infrastructure will also
be developed e.g. building of roads in the area which would result in overall economic
development of the area. All these would definitely contribute towards sustainable
development of the local population.
A.3 Project participants: (Please list Party(ies) and private and/or public entities involved in the project activity and provide contact information in annex 1 of this document.) (Please designate one of the above as the official contact for the CDM project activity.) DCM Shriram Consolidated Ltd(DSCL), is the only party involved in the project activity.
Organization: DCM Shriram Consolidated Ltd.(DSCL) Street/P.O.Box: 2nd Floor, Kanchenjunga Building, 18, Barakhamba Road Building: Kanchenjunga Building City: New Delhi State/Region: Delhi Postcode/ZIP: 110001 Country: India Telephone: +91-11-23316801 FAX: +91-11-23319062 E-Mail: [email protected] Contact Persons Name: Nisha Mennon Title: Sr Analyst
A.4 Technical description of the project activity: A.4.1 Location of the project activity: A.4.1.1 Host country Party(ies):
India
A.4.1.2 Region/State/Province etc.:
The project area is in the state of Himachal Pradesh.
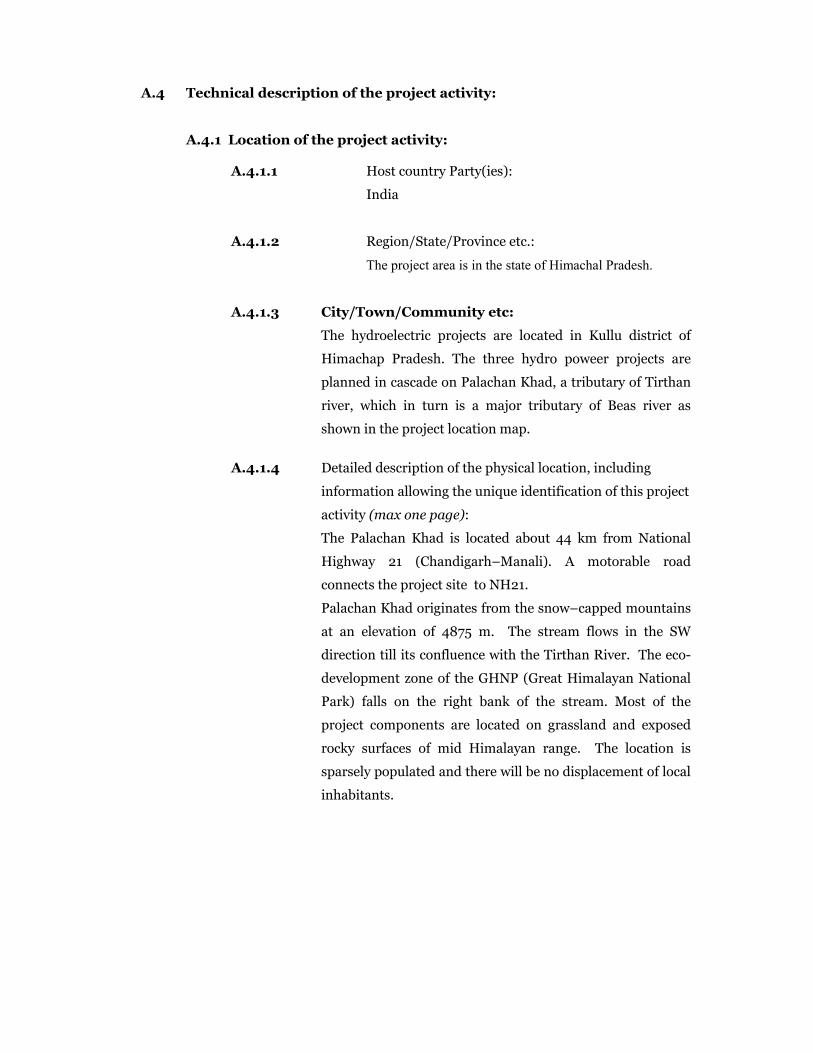
A.4.1.3 City/Town/Community etc:
The hydroelectric projects are located in Kullu district of
Himachap Pradesh. The three hydro poweer projects are
planned in cascade on Palachan Khad, a tributary of Tirthan
river, which in turn is a major tributary of Beas river as
shown in the project location map.
A.4.1.4 Detailed description of the physical location, including
information allowing the unique identification of this project
activity (max one page):
The Palachan Khad is located about 44 km from National
Highway 21 (Chandigarh–Manali). A motorable road
connects the project site to NH21.
Palachan Khad originates from the snow–capped mountains
at an elevation of 4875 m. The stream flows in the SW
direction till its confluence with the Tirthan River. The eco-
development zone of the GHNP (Great Himalayan National
Park) falls on the right bank of the stream. Most of the
project components are located on grassland and exposed
rocky surfaces of mid Himalayan range. The location is
sparsely populated and there will be no displacement of local
inhabitants.
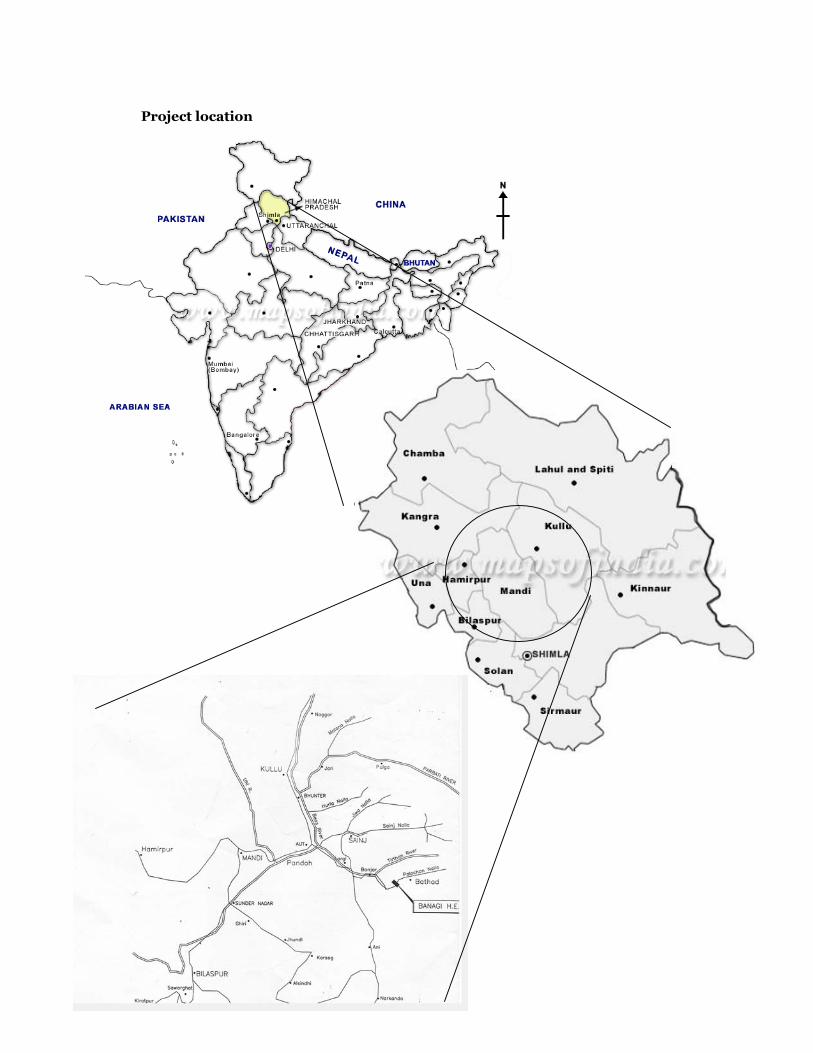
Project location
A.4.2 Type and category(ies) and technology of project activity
(Please specify the type and category of the project activity using the categorization of appendix B to the simplified M&P for small-scale CDM project activities, hereafter referred to as appendix B. Note that appendix B may be revised over time and that the most recent version will be available on the UNFCCC CDM web site. In this section you shall justify how the proposed project activity conforms with the project type and category selected (for simplicity, the rest of this document refers to ‘project category’ rather than ‘project type and category’). If your project activity does not fit any of the project categories in appendix B, you may propose additional project categories for consideration by the Executive Board, in accordance with paragraphs 15 and 16 of the simplified M&P for small-scale CDM project activities. The final SSC-PDD project design document shall, however, only be submitted to the Executive Board for consideration after the Board has amended appendix B as necessary.) (This section should include a description of how environmentally safe and sound technology and know-how is transferred to the host Party, if such a transfer is part of the project.) Project Category : Renewable Energy Project - TYPE I
Sub Category : I D Renewable electricity generation for a grid
Technology of project activity
The proposed project will have a capacity of 12 MW from three small hydro projects which
are bundled to reduce the transaction costs. The electricity generated will be fed into a 33
kV (high tension) northern grid line.
The technology used in these hydro projects is to generate electricity from hydro potential
through run–of–river schemes where no dam is built. The scheme envisages minimum
civil works with no adverse environmental effect. The natural water is directed to a Forbay
tank through a weir and channel arrangement. The water from the fore bay is fed to a
turbine by penstock pipe. The turbine is coupled to a generator which produces electricity
and then is fed to the grid. The whole operation is maintained by a sophisticated control
system.
The Bathad Hydro Electric project will use a Pelton Turbine, the Banagi and Farari
Hydro Electric Projects will employ Francis Turbines. The turbine is selected
according to the head available at various sites. Kaplan is usually used for low head
sites and Pelton for high head sites. The generators will be horizontal shaft
synchronous type and the generation voltage will be 3.3 kV. Power generated will be
evacuated at HPSEB’s (Himachal Pradesh State Electricity Board) Sidhwan 33kV
sub-station located 16 km from the Bathad power house site and 12 km from the
Farari power house site. The projects will include state-of-the art controls and
instrumentation for remote monitoring of operation of power plant.
Electronic PLC based digital governor shall be provided. It shall control the speed as well
as load of TG set in grid connection system. It shall detect speed / load from the reference
value and convert these into the main servomotor stroke deviation in a characteristic
manner. The electronic speed governor shall be linked to the mechanical hydraulic part of
the governing system i.e. by servo valve. The governing system shall mainly consist of a)
speed transducers b) position transducers c) microprocessor based governor unit e) Oil
pumping unit etc., as per the system requirement.
PLC based Unit Control board shall be provided, which shall control all functions of the
generating units, transformers and lines etc., both in auto & manual mode. A separate Unit
Control Board shall be provided for each unit and shall comprise of ammeter, voltmeter,
power factor meter, kWH meter, kVAR meter, frequency meter, recorder, push bottons,
indicators etc., as per the system requirement. The energy meter shall be provided of 0.2
accuracy class for measurement of import & export of energy for the system
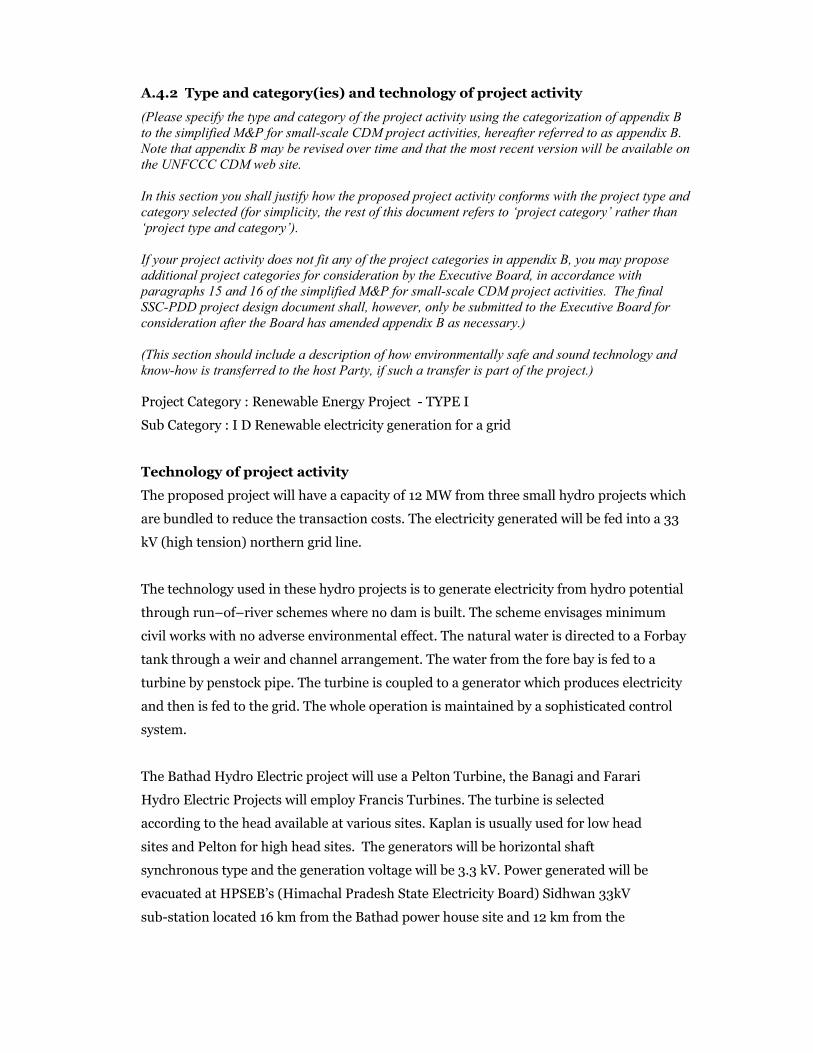
The Block Diagram given below shows the schematic of a small hydro project.
Intake from the river
Forebay
Turbine Gen
Evacuation Sub Station
Metering Point
Transmission line
Power Channel
Penstock
Tail race
Power House
Block Diagram of a “Run–Of–the–River” Small Hydro Project
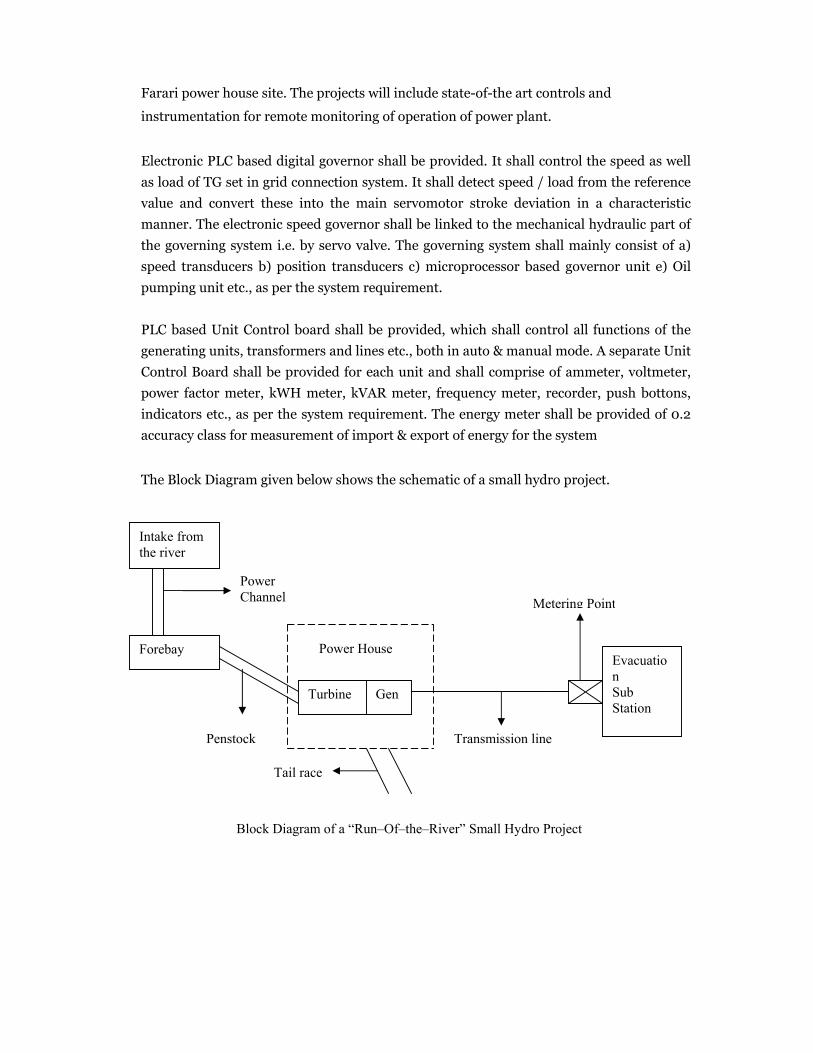
The table below gives a brief technical specification of the projects
Bathad HEP Banagi HEP Farari HEP Installed Capacity 4.5 MW 4.0 MW 3.5 MW Annual net power generation
23.45 Million kWh
20.91 Million kWh
19.15 Million kWh
STREAM Name Palachan Khad
Source Snow/ Glacier/ Rain Fed
Altitude (Power House) 2024 m 1855 m 1728 m Catchment Area at Diversion
64.86 km2 81.06 km2 101.89 km2
TECHNICAL DESCRIPTION Gross Head, m 246 132 106.5 Net Head , m 236 125 98 Design Discharge, cumec
2.25 3.76 4.20
Trench type weir (RCC) Diversion Structure & Intake Altitude 2267.5 Altitude 1987 m Altitude 1831 m
Water Conductor Intake
Steel Pipe of 1200mm dia,
35 m long
Steel Pipe of 1500mm dia,
138 m long
Steel Pipe of 1500mm dia, 205 m long
De-silting Chamber Remove particles of size > 0.2 mm with appropriate flushing arrangement
Power Channel Rectangular RCC 2500 m length Slope 1 in 735
Rectangular RCC 1870m length
Slope 1 in 2000
Rectangular RCC 1588 m length
Slope 1 in 2000 Fore bay Tank Rectangular RCC, 3 minutes storage 2 gates
MS Fabricated anchor and saddle supports Penstock 1100 mm dia, 2
bifurcations, 350 m length
1200 mm dia, 2 bifurcations, 230 m length
1200 mm dia, 2 bifurcations, 230 m length
Power House Surface Type Turbine 2 x 2250 kW
Horizontal Pelton Turbine
2 x 2000 kW Horizontal
Francis
2 x 1750 kW Horizontal
Francis 2 x 2250 kW 2 x 2000 kW 2 x 1750 kW Generator
Horizontal, synchronous, SESR brush less 8 MVA 6.3 MVA
5MVA Transformer
3.3/33 kV Delta Star Step Up ONAN Transmission Lines 33 kV 16 km
Tail Race 2 channels – rectangular RCC
A.4.3 Brief statement on how anthropogenic emissions of GHGs (greenhouse
gases) by sources are to be reduced by the proposed CDM project activity:
(Please state briefly how anthropogenic GHG (greenhouse gas) emission reductions are to be achieved (detail to be provided in section B.) and provide the estimate of total anticipated reductions in tonnes of CO2 equivalent as determined in section E. below.)
The proposed project activity of hydro power generation dose not result in any direct GHG
emissions. The power generation from the project is supplied to the northern grid. The
northern grid, with present generation mix, is dominated by coal based power generation
and thus have high emissions intensity. The project will displace the fossil fuel based grid
electricity with the hydro based electricity, contributing to GHG emission reductions.
The project envisages annual generation of 63.51 million kWhr of energy which will be
fed in to the northern grid. With present generation mix of the northern region it is
estimated that the CO2 emission reduction will be to the tune of 49537.8t CO2e (tonnes of
carbon dioxide equivalent) per year. With a 10 -year crediting period, the project is
expected to reduce approximately 495378 tCO2e, thereby generating equivalent amount
of CERs(Certified Emission Reductions).
A.4.4 Public funding of the project activity:
(Indicate whether public funding from Parties included in Annex I is involved in the proposed
project activity. If public funding from one or more Annex I Parties is involved, please provide
information on sources of public funding for the project activity in annex 2, including an
affirmation that such funding does not result in a diversion of official development assistance and is
separate from and is not counted towards the financial obligations of those Parties.)
The proposed debt equity ratio for the project is 3:2. While the equity( Rs 215 million)
would be invested by the promoters, remaining portion of the project cost(Rs 500 million)
would come as commercial loans from the banking institutions. No funding/grant from
the annex –I countries is involved for the project activity.
A.4.5 Confirmation that the small-scale project activity is not a debundled
component of a larger project activity:

(Please refer to appendix C to the simplified M&P for the small-scale CDM project activities for guidance on how to determine whether the proposed project activity is not a debundled component of a larger project activity.)
The proposed project is not a debundled component of a larger project activity. The
proposed hydro projects do not form a part of any larger activity and are independent.
B. Baseline methodology B.1 Title and reference of the project category applicable to the project
activity:
(Please refer to the UNFCCC CDM web site for the most recent list of the small-scale CDM project activity categories contained in appendix B of the simplified M&P for small-scale CDM project activities.)
Type I Renewable Energy Projects – ID Renewable Electricity Generation for a grid.
B.2 Project category applicable to the project activity:
(Justify the choice of the applicable baseline calculation for the project category as
provided for in appendix B of the simplified M&P for small-scale CDM project activities.)
According to article 23 of appendix B of the simplified M&P for small-scale CDM project
activities, the category ‘renewable generating unit, that supply electricity to an electricity
distribution system that is or would have been supplied by at least one fossil fuel or
nonrenewable biomass fired generating unit.’
Two methodologies for estimation of baseline, for the above mentioned category of
projects, have been approved
1. Average of built margin and approximate operating margin of the grid
2. Grid system average of emissions from present generation mix
The selection of appropriate baseline methodology depends on the existing power sector
scenario, grid size, generation mix and operation. The following section describes the
selection of baseline methodology for the proposed project.
Power scenario : India
The total installed capacity in India, as on January 2004 was about 1 08 315.30 MW, with
thermal power plants constituting a major share at 71.50 % of the total capacity, followed
by hydro (26 %) and nuclear (2.5%). The total generation for the year 2003-2004 till
January 2004 was about 460 712 million units, with nearly 83%, coming from thermal
power plants. It is evident that the power generation is heavily dependent on the thermal
generation. There are about 143 thermal power stations in India, out of which 90 are coal
based and the remaining use other fuels like gas, diesel, naphtha, etc.
In India, power is a concurrent subject between the state and the central governments.
The perspective planning, monitoring of implementation of power projects is the
responsibility of Ministry of Power, Government of India. At the state level the state
utilities or SEBs (state electricity boards) are responsible for supply, transmission, and
distribution of power. In addition, there are different central / public sector organizations
involved in generation like NTPC (National Thermal Power Corporation), NHPC (National
Hydro Power Corporation), etc. in transmission e.g. PGCIL (Power Grid Corporation of
India Ltd.) and in financing e.g. PFC (Power Finance Corporation Ltd.).
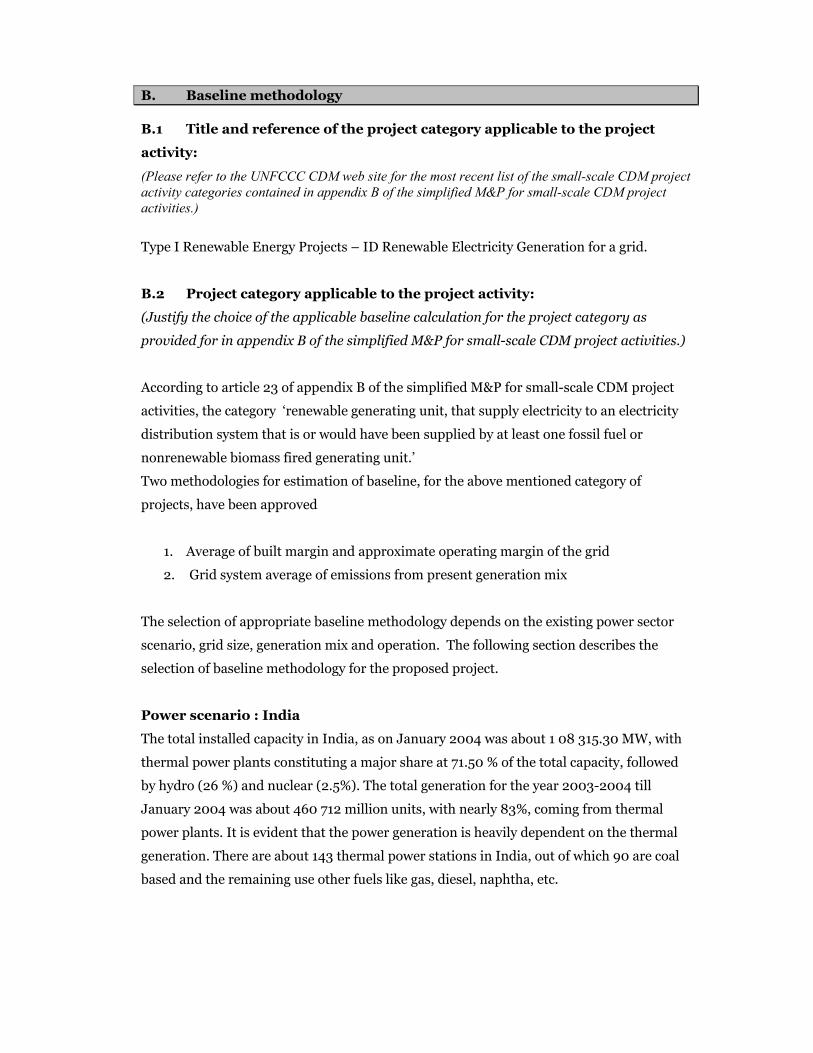
There are five regional grids in India: Northern, Western, Southern, Eastern and North-
Eastern. Different states are connected to one of the five regional grids as shown in the
Table below.
States connected to different regional grids Regional grid Northern Western Southern Eastern
North Eastern States Haryana, Himachal
Pradesh, Jammu & Kashmir, Punjab, Rajasthan, Uttar Pradesh, Uttaranchal, Delhi
Gujarat, Madhya Pradesh, Maharashtra, Goa, Chattisgarh
Andhra Pradesh, Karnataka, Kerala, Tamil Nadu,
Bihar, Orissa, West Bengal, Zarkhand
Arunachal Pradesh, Assam, Manipur, Meghalaya, Mizoram, Nagaland, Tripura
The management of generation and supply of power within the state and regional grid is
undertaken by the SLDC (state load dispatch centres) and RLDC (regional load dispatch
centres). Different states within the regional grids meet the demand from their own
generation facilities plus generation by power plants owned by the central sector i.e. NTPC
and NHPC etc. Depending on the demand and generation there are exports and imports of
power within different states in the regional grid. Thus there is an exchange of power
among states in the regional grid. Similarly there exists imports and export of power
between regional grids.
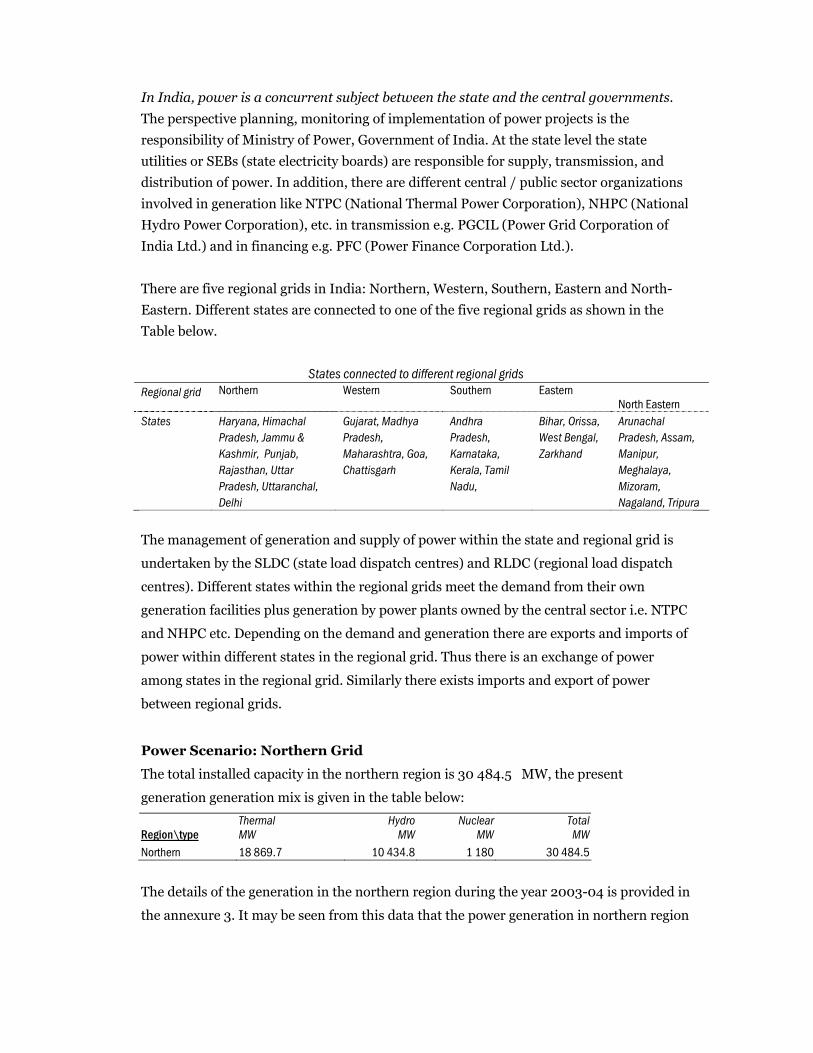
Power Scenario: Northern Grid
The total installed capacity in the northern region is 30 484.5 MW, the present
generation generation mix is given in the table below:
Region\type Thermal MW
HydroMW
Nuclear MW
Total MW
Northern 18 869.7 10 434.8 1 180 30 484.5
The details of the generation in the northern region during the year 2003-04 is provided in
the annexure 3. It may be seen from this data that the power generation in northern region
is dominated by the thermal power plants. Out of total generation of 166 273 million units
in the year 73% generation was from the thermal power plants, followed by hydro (22.4%)
and nuclear (4.4%).
Himachal Pradesh is having all installed capacity based on hydro power. However it is net
exporter of energy in the states in the northern grid. In the year 2003-04 it has exported 11
753 units to the northern grid. Himachal Pradesh also plans to increase the exports by
exploiting the hydro resource in the state.
Selection of Baseline methodology
Power scenario in the northern grid
The proposed project would be feeding power in to the northern grid. The power scenario
in the northern regional grid is of demand outstripping the supply. During the April to
June 2004 period the energy and peak shortage in the northern region was 5.4% & 5.7 %
respectively. The energy as well as peak shortage in the northern region are given in table
3, annexure 3. The state of Himachal Pradesh, where the project is located, is meeting its
power demand, thus the additional power would be used in the other states of the
northern regional grid.
The average of built margin and approximate operating margin:
There is a gap between demand and supply in the northern regional grid and it is expected to
remain so in the future. Thus in case of project scenario, the operating margin method for
estimating baseline would not be appropriate for the proposed project . In case of built
margin approach the assumption is that the CDM project is affecting future planning of
capacity additions. In case of India, though the renewable energy technologies for power
generation are well developed, the installed capacity of renewable energy projects is still
about 3700 MW, which is approximately 3.5% of total generation capacity. In addition to
this, the small–scale CDM project of the size 12MW would not have an impact on planned
capacity additions which are in terms of hundreds of MW of individual power plant
capacity. Thus it is unlikely that run of the river type projects of total capacity 12.5 MW
project will alter the decisions regarding new capacity additions in the northern grid.
In case of the project scenario, the power fed in to the grid would simply displace the
present generation mix in the northern region. Thus the grid system average method is
appropriate for estimation of baseline for the proposed project.
B.3 Description of how the anthropogenic GHG emissions by sources are
reduced below those that would have occurred in the absence of the proposed
CDM project activity
(Justify that the proposed project activity qualifies to use simplified methodologies and is additional using attachment A to appendix B of the simplified M&P for small-scale CDM project activities.) (National policies and circumstances relevant to the baseline of the proposed project activity shall be summarized here as well.)
According to article 23 of appendix B of the simplified M&P for small scale CDM project
activities, the category ‘renewable generating unit, that supply electricity to an electricity
distribution system that is or would have been supplied by at least one fossil fuel or
nonrenewable biomass fired generating unit’.
The proposed project is to generate power from three run-of-the river hydro power plants
having a total capacity of 12 MW. Thus the project is small scale CDM activity having
power generation capacity below 15MW.
Project additonality
i. The projected investment in the proposed plants is about Rs 715 million. This comes
upto Rs 59.6 million/MW, which is higher than the cost/MW of conventional power
plants which is around 30-40 million/MW (source: CEA). Further in case of run-of-the
river small hydro projects the generation is uncertain, due to the very fact that there is no
reservoir, compared with the conventional as well as other small hydro plants involving
storage. Thus the uncertainty or the risk in terms of the generation is a barrier for
investment, especially in case of Himachal Pradesh where large hydro potential for small
hydro plants, with storage dams, is available. Thus the risk in the run-of-the river project
vis a vis the other small hydro plants and the conventional power plants is an barrier.
Further the sites identified for the run-of-the river projects are unique where normal small
hydro plants with dams can not be constructed. Thus with the investment barrier the
potential at these site will remain untapped. Though the state has a estimated run of the
river hydro potential of 1624.78 MW, only 93.54 MW of capacity has been utilised.
ii. The evacuation of the power generated by the project to the grid is a major concern. The
power generated has to be transmitted through long distances to the available grid/sub
station. This involves technical issues and investment in substation if the grid is far away
from the place electricity is generated.
iii. The project requires a number of administrative approvals as well as power purchase
agreements with the state electricity boards and environmental clearances. This takes a
considerable amount of time for the project to reach the implementation stage. This is a
barrier for such small-scale project activity.
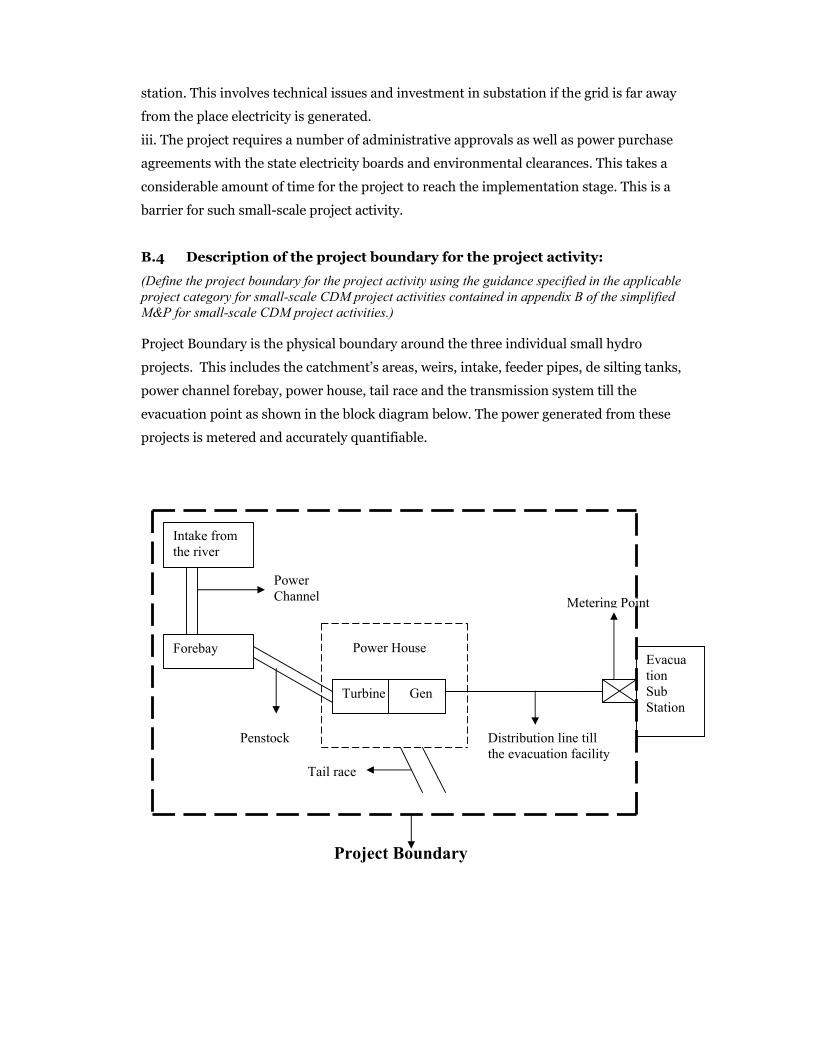
B.4 Description of the project boundary for the project activity:
(Define the project boundary for the project activity using the guidance specified in the applicable project category for small-scale CDM project activities contained in appendix B of the simplified M&P for small-scale CDM project activities.) Project Boundary is the physical boundary around the three individual small hydro
projects. This includes the catchment’s areas, weirs, intake, feeder pipes, de silting tanks,
power channel forebay, power house, tail race and the transmission system till the
evacuation point as shown in the block diagram below. The power generated from these
projects is metered and accurately quantifiable.
Intake from the river
Forebay
Turbine Gen
Evacua tion Sub Station
Metering Point
Distribution line till the evacuation facility
Power Channel
Penstock
Tail race
Power House
Project Boundary
B.5 Details of the baseline and its development:
B.5.1 Specify the baseline for the proposed project activity using a methodology specified
in the applicable project category for small-scale CDM project activities contained in
appendix B of the simplified M&P for small-scale CDM project activities:
The proposed project uses the weighted average carbon emission factor of the current
generation mix i.e. system average baseline methodology. This is the approved
methodology for small-scale renewable energy projects supplying power into grid.
Thus the weighted average of carbon emission factor for all power generation activities in
the northern regional grid, to which the proposed project would be supplying the power,
would form the baseline for the proposed project.
B.5.2 Date of completing the final draft of this baseline section (DD/MM/YYYY):
11/07/2004
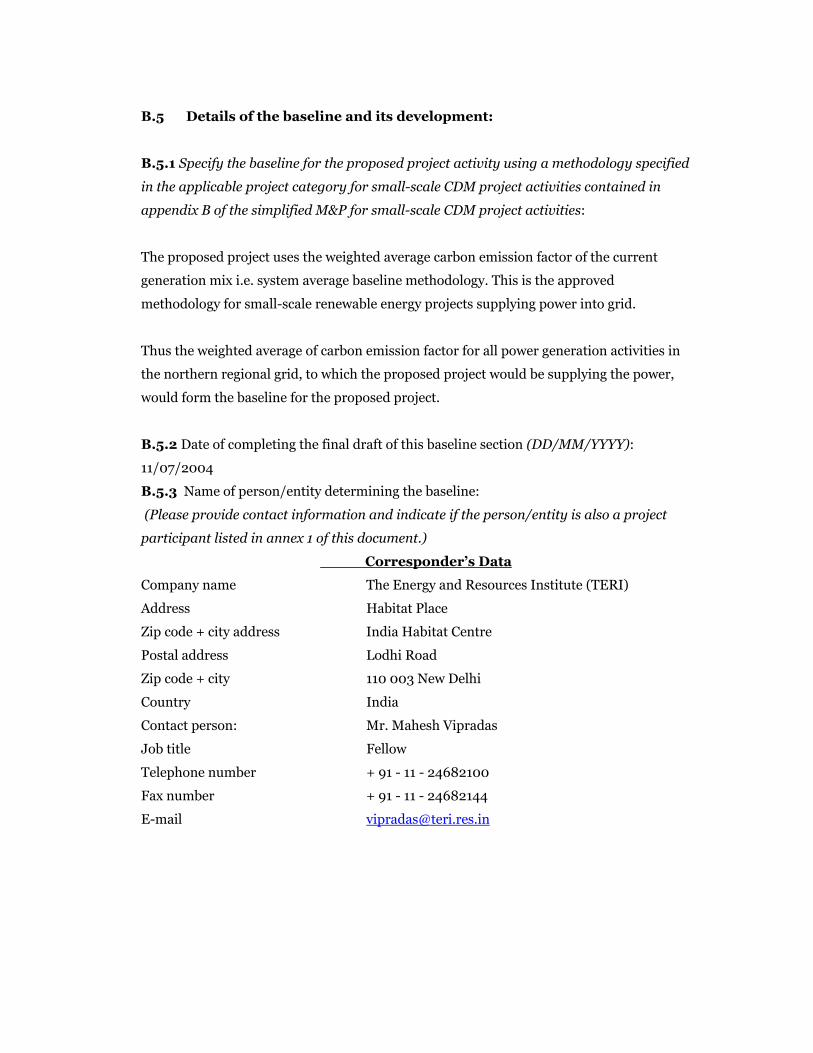
B.5.3 Name of person/entity determining the baseline:
(Please provide contact information and indicate if the person/entity is also a project
participant listed in annex 1 of this document.)
Corresponder’s Data
Company name The Energy and Resources Institute (TERI)
Address Habitat Place
Zip code + city address India Habitat Centre
Postal address Lodhi Road
Zip code + city 110 003 New Delhi
Country India
Contact person: Mr. Mahesh Vipradas
Job title Fellow
Telephone number + 91 - 11 - 24682100
Fax number + 91 - 11 - 24682144
E-mail [email protected]
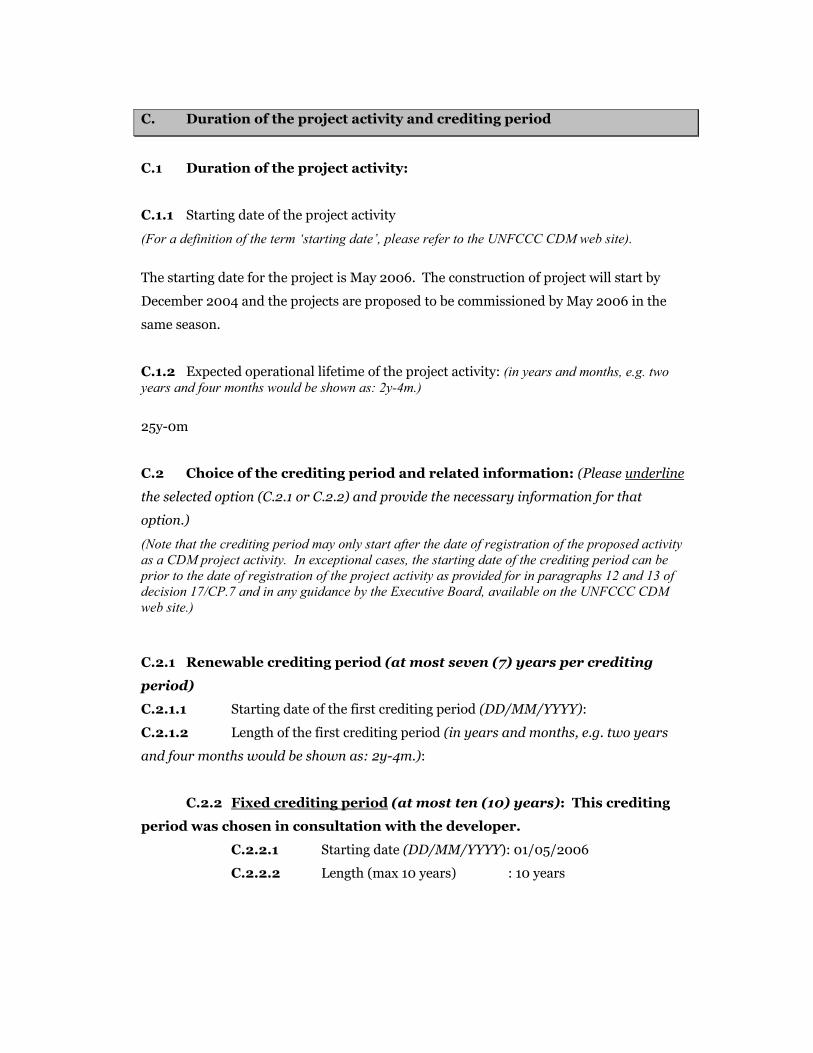
C. Duration of the project activity and crediting period
C.1 Duration of the project activity:
C.1.1 Starting date of the project activity
(For a definition of the term ‘starting date’, please refer to the UNFCCC CDM web site).
The starting date for the project is May 2006. The construction of project will start by
December 2004 and the projects are proposed to be commissioned by May 2006 in the
same season.
C.1.2 Expected operational lifetime of the project activity: (in years and months, e.g. two years and four months would be shown as: 2y-4m.)
25y-0m
C.2 Choice of the crediting period and related information: (Please underline
the selected option (C.2.1 or C.2.2) and provide the necessary information for that
option.)
(Note that the crediting period may only start after the date of registration of the proposed activity as a CDM project activity. In exceptional cases, the starting date of the crediting period can be prior to the date of registration of the project activity as provided for in paragraphs 12 and 13 of decision 17/CP.7 and in any guidance by the Executive Board, available on the UNFCCC CDM web site.)
C.2.1 Renewable crediting period (at most seven (7) years per crediting
period)
C.2.1.1 Starting date of the first crediting period (DD/MM/YYYY):
C.2.1.2 Length of the first crediting period (in years and months, e.g. two years
and four months would be shown as: 2y-4m.):
C.2.2 Fixed crediting period (at most ten (10) years): This crediting
period was chosen in consultation with the developer.
C.2.2.1 Starting date (DD/MM/YYYY): 01/05/2006
C.2.2.2 Length (max 10 years) : 10 years
D. Monitoring methodology and plan
(The monitoring plan shall incorporate a monitoring methodology specified for the applicable project category for small-scale CDM project activities contained in appendix B of the simplified M&P for small-scale CDM project activities and represent good monitoring practice appropriate to the type of project activity. The monitoring plan shall also provide information on the collection and archiving of the data specified in appendix B of the simplified M&P for small-scale CDM project activities to: - Estimate or measure emissions occurring within the project boundary; - Determine the baseline, as applicable; - Estimate leakage, where this needs to be considered. Project participants shall implement the registered monitoring plan and provide data, in accordance with the plan, through their monitoring reports. Operational entities will verify that the monitoring methodology and plan have been implemented correctly and check the information in accordance with the provisions on verification. This section shall provide a detailed description of the monitoring plan, including an identification of the data to be collected, its quality with regard to accuracy, comparability, completeness and validity, taking into consideration any guidance contained in the methodology, and archiving of the data collected. Please note that monitoring data required for verification and issuance are to be kept for two years after the end of the crediting period or the last issuance of CERs for this project activity, whichever occurs later. An overall monitoring plan that monitors performance of the constituent project activities on a sample basis may be proposed for bundled project activities. If bundled project activities are registered with an overall monitoring plan, this monitoring plan shall be implemented and each verification/certification of the emission reductions achieved shall cover all of the bundled project activities.)
D.1 Name and reference of approved methodology applied to the project
activity:
(Please refer to the UNFCCC CDM web site for the most recent version of the indicative list of small-scale CDM project activities contained in appendix B of the simplified M&P for small-scale CDM project activities.) (If a national or international monitoring standard has to be applied to monitor certain aspects of the project activity, please identify this standard and provide a reference to the source where a detailed description of the standard can be found.)
The proposed project is of Type I Renewable Energy Projects – ID Renewable Electricity
Generation for a grid.
The monitoring methodology involves metering of the electricity generated and supplied to
the grid by the proposed hydro project.

D.2 Justification of the choice of the methodology and why it is applicable
to the project activity:
(Justify the choice of the monitoring methodology applicable to the project category as provided for in appendix B.) The proposed project is eligible as a small scale project (see section 2.2.2), category
‘Renewable electricity generation for a grid’ (1.D.). The monitoring methodology is
consistent with the methodology as required in Appendix B (UNFCCC, 2003b).
The proposed methodology thus provides measured data on the amount of electricity
generated through energy meters. With this information, a reliable estimate of the amount
of emission reduction can be made.
D.3 Data to be monitored:
(The table below specifies the minimum information to be provided for monitored data. Please complete the table for the monitoring methodology chosen for the proposed project activity from the simplified monitoring methodologies for the applicable small-scale CDM project activity category contained in appendix B of the simplified M&P for small-scale CDM project activities. Please note that for some project categories it may be necessary to monitor the implementation of the project activity and/or activity levels for the calculation of emission reductions achieved. Please add rows or columns to the table below, as needed) The data to be monitored is given in table below
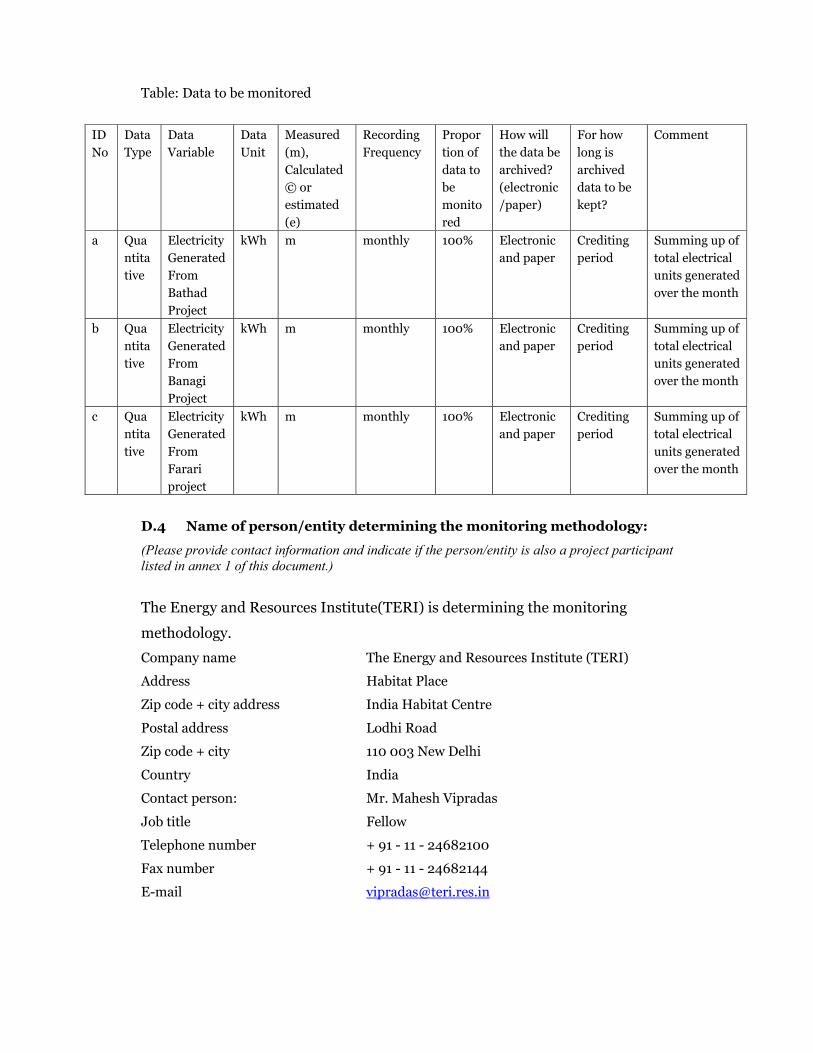
Table: Data to be monitored
D.4 Name of person/entity determining the monitoring methodology:
(Please provide contact information and indicate if the person/entity is also a project participant listed in annex 1 of this document.)
The Energy and Resources Institute(TERI) is determining the monitoring
methodology.
Company name The Energy and Resources Institute (TERI)
Address Habitat Place
Zip code + city address India Habitat Centre
Postal address Lodhi Road
Zip code + city 110 003 New Delhi
Country India
Contact person: Mr. Mahesh Vipradas
Job title Fellow
Telephone number + 91 - 11 - 24682100
Fax number + 91 - 11 - 24682144
E-mail [email protected]
ID No
Data Type
Data Variable
Data Unit
Measured (m), Calculated© or estimated (e)
Recording Frequency
Propor tion of data to be monitored
How will the data be archived? (electronic/paper)
For how long is archived data to be kept?
Comment
a Quantitative
Electricity Generated From Bathad Project
kWh m monthly 100% Electronic and paper
Crediting period
Summing up of total electrical units generated over the month
b Quantitative
Electricity Generated From Banagi Project
kWh m monthly 100% Electronic and paper
Crediting period
Summing up of total electrical units generated over the month
c Quantitative
Electricity Generated From Farari project
kWh m monthly 100% Electronic and paper
Crediting period
Summing up of total electrical units generated over the month
E. Calculation of GHG emission reductions by sources
E.1 Formulae used:
(In E.1.1 please provide the formula used to calculate the GHG emission reductions by sources in accordance with the applicable project category of small-scale CDM project activities contained in appendix B of the simplified M&P for small-scale CDM project activities. In case the applicable project category from appendix B does not indicate a specific formula to calculate the GHG emission reductions by sources, please complete E.1.2 below.)
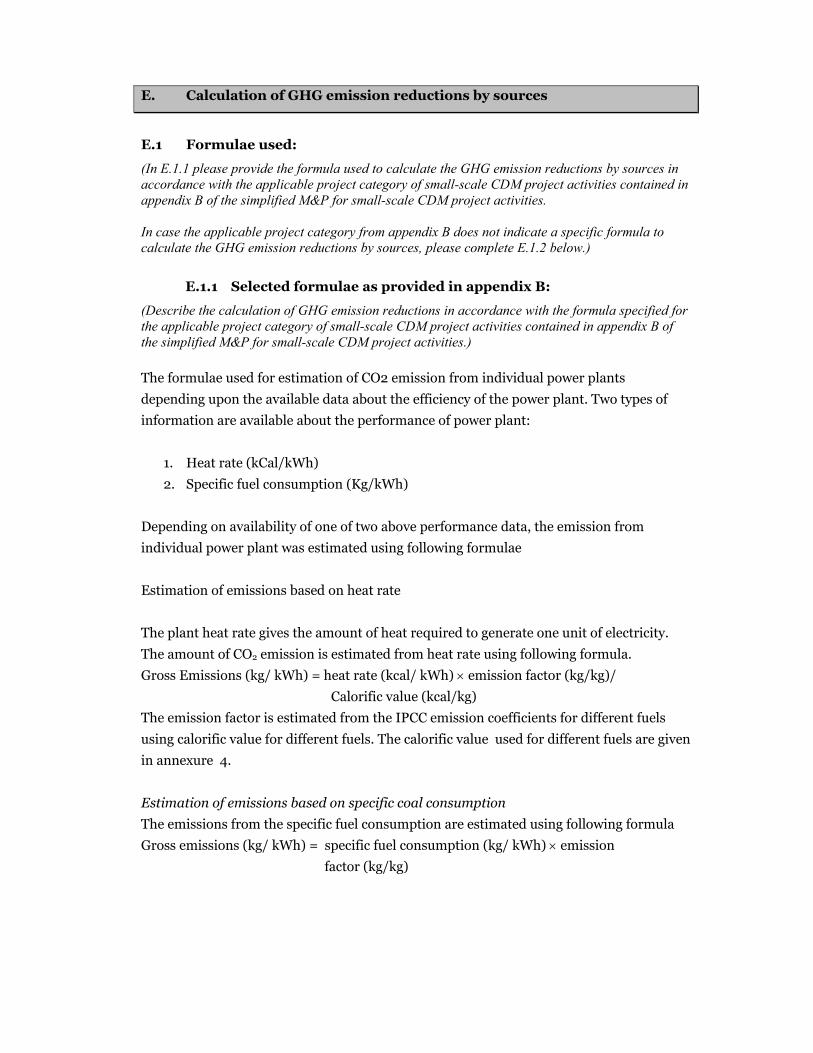
E.1.1 Selected formulae as provided in appendix B:
(Describe the calculation of GHG emission reductions in accordance with the formula specified for the applicable project category of small-scale CDM project activities contained in appendix B of the simplified M&P for small-scale CDM project activities.) The formulae used for estimation of CO2 emission from individual power plants
depending upon the available data about the efficiency of the power plant. Two types of
information are available about the performance of power plant:
1. Heat rate (kCal/kWh)
2. Specific fuel consumption (Kg/kWh)
Depending on availability of one of two above performance data, the emission from
individual power plant was estimated using following formulae
Estimation of emissions based on heat rate
The plant heat rate gives the amount of heat required to generate one unit of electricity.
The amount of CO2 emission is estimated from heat rate using following formula.
Gross Emissions (kg/ kWh) = heat rate (kcal/ kWh) × emission factor (kg/kg)/
Calorific value (kcal/kg)
The emission factor is estimated from the IPCC emission coefficients for different fuels
using calorific value for different fuels. The calorific value used for different fuels are given
in annexure 4.
Estimation of emissions based on specific coal consumption
The emissions from the specific fuel consumption are estimated using following formula
Gross emissions (kg/ kWh) = specific fuel consumption (kg/ kWh) × emission
factor (kg/kg)
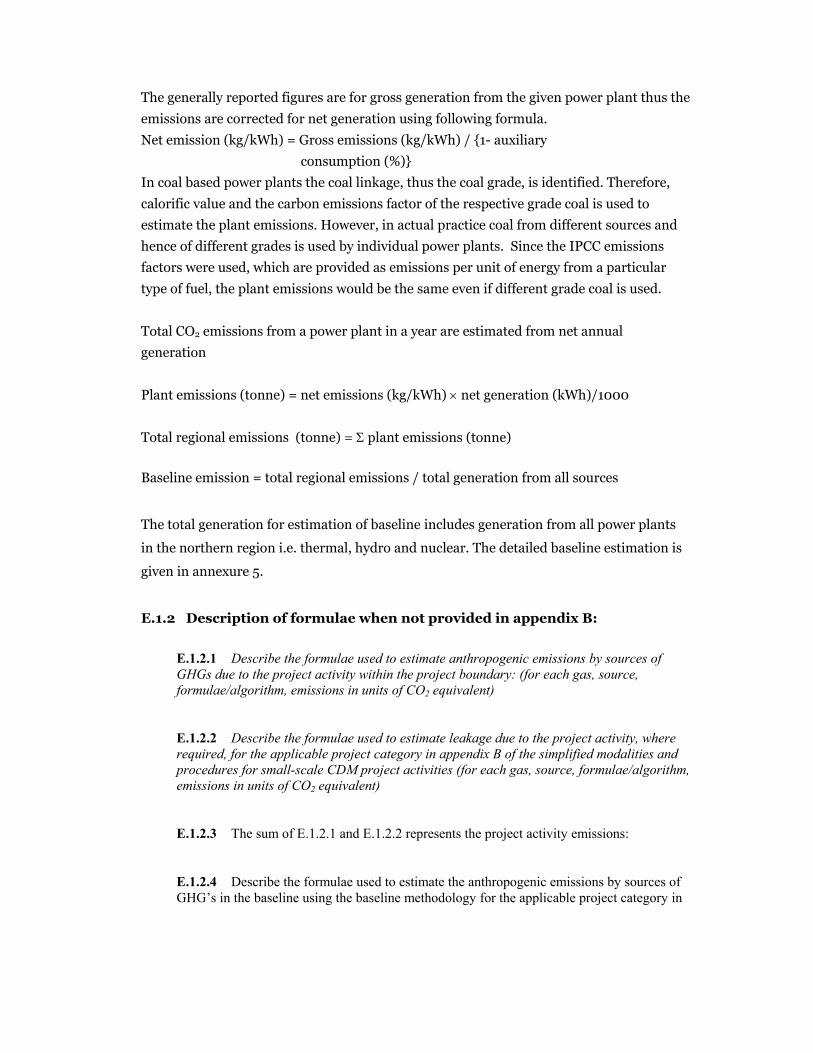
The generally reported figures are for gross generation from the given power plant thus the
emissions are corrected for net generation using following formula.
Net emission (kg/kWh) = Gross emissions (kg/kWh) / {1- auxiliary
consumption (%)}
In coal based power plants the coal linkage, thus the coal grade, is identified. Therefore,
calorific value and the carbon emissions factor of the respective grade coal is used to
estimate the plant emissions. However, in actual practice coal from different sources and
hence of different grades is used by individual power plants. Since the IPCC emissions
factors were used, which are provided as emissions per unit of energy from a particular
type of fuel, the plant emissions would be the same even if different grade coal is used.
Total CO2 emissions from a power plant in a year are estimated from net annual
generation
Plant emissions (tonne) = net emissions (kg/kWh) × net generation (kWh)/1000
Total regional emissions (tonne) = Σ plant emissions (tonne)
Baseline emission = total regional emissions / total generation from all sources
The total generation for estimation of baseline includes generation from all power plants
in the northern region i.e. thermal, hydro and nuclear. The detailed baseline estimation is
given in annexure 5.
E.1.2 Description of formulae when not provided in appendix B:
E.1.2.1 Describe the formulae used to estimate anthropogenic emissions by sources of GHGs due to the project activity within the project boundary: (for each gas, source, formulae/algorithm, emissions in units of CO2 equivalent) E.1.2.2 Describe the formulae used to estimate leakage due to the project activity, where required, for the applicable project category in appendix B of the simplified modalities and procedures for small-scale CDM project activities (for each gas, source, formulae/algorithm, emissions in units of CO2 equivalent) E.1.2.3 The sum of E.1.2.1 and E.1.2.2 represents the project activity emissions: E.1.2.4 Describe the formulae used to estimate the anthropogenic emissions by sources of GHG’s in the baseline using the baseline methodology for the applicable project category in
appendix B of the simplified modalities and procedures for small-scale CDM project activities: (for each gas, source, formulea/algorithm, emissions in units of CO2 equivalent) E.1.2.5 Difference between E.1.2.4 and E.1.2.3 represents the emission reductions due to the project activity during a given period:
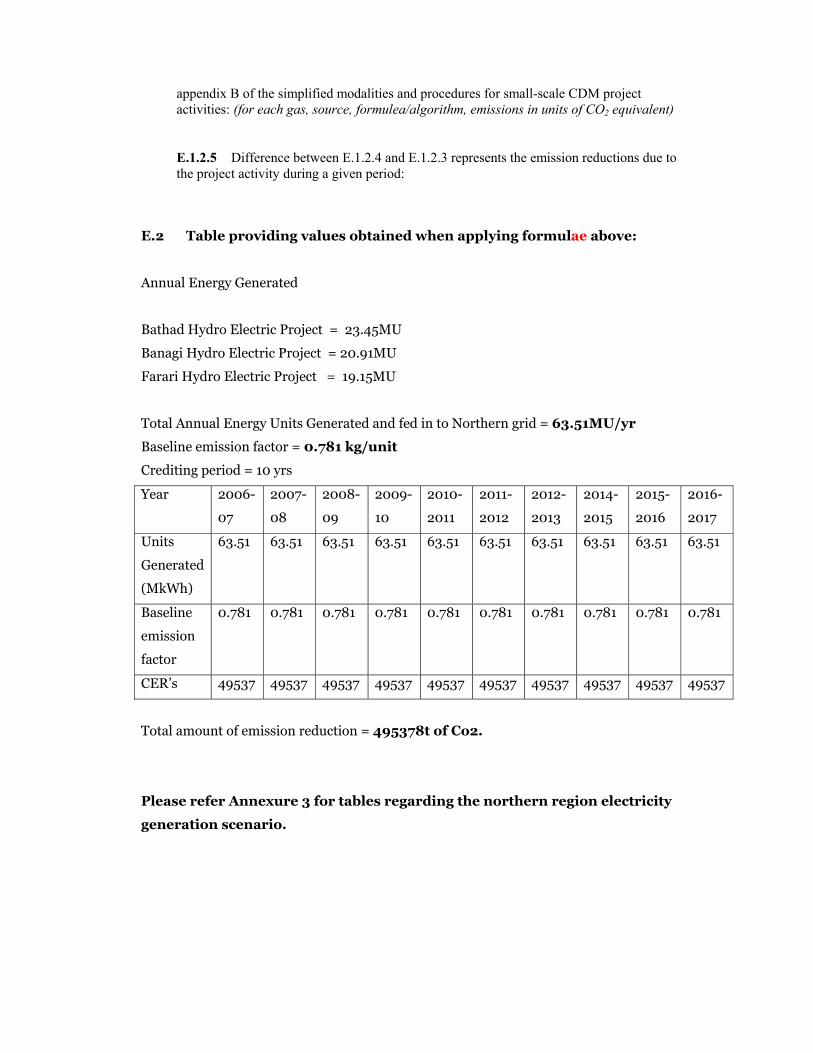
E.2 Table providing values obtained when applying formulae above:
Annual Energy Generated
Bathad Hydro Electric Project = 23.45MU
Banagi Hydro Electric Project = 20.91MU
Farari Hydro Electric Project = 19.15MU
Total Annual Energy Units Generated and fed in to Northern grid = 63.51MU/yr
Baseline emission factor = 0.781 kg/unit
Crediting period = 10 yrs
Year 2006-
07
2007-
08
2008-
09
2009-
10
2010-
2011
2011-
2012
2012-
2013
2014-
2015
2015-
2016
2016-
2017
Units
Generated
(MkWh)
63.51 63.51 63.51 63.51 63.51 63.51 63.51 63.51 63.51 63.51
Baseline
emission
factor
0.781 0.781 0.781 0.781 0.781 0.781 0.781 0.781 0.781 0.781
CER’s 49537 49537 49537 49537 49537 49537 49537 49537 49537 49537
Total amount of emission reduction = 495378t of Co2.
Please refer Annexure 3 for tables regarding the northern region electricity
generation scenario.
F. Environmental impacts F.1 If required by the host Party, documentation on the analysis of the environmental impacts of the project activity: (if applicable, please provide a short summary and attach documentation) Environmental clearances required to set up the hydro projects are required which are
being processed by the developer. EIA is not mandatory, but the project developer has
made the analysis on
a) Impact due to project location, involving impact on settlements, flora fauna and
rehabilitation problems
b) Impact due to project design involving seismicity and climate.
c) Impact due to construction works involving pollution, soil erosion, sanitary and health
effect
d) Impact due to project operation involving land inundation, water logging and salinity
The proposed activities by the developer are
a) Compensatory afforestation
Some trees may be felled for project construction works. Compensatory afforestation would be carried out in the vicinity of the project area. This would also deter the soil erosion. A budgetary provision of Rs 0.5 million has been kept for the same.
b) Restoration of construction areas and disposal of muck
The entire construction area shall be properly landscaped when the project is completed so as to merge the project with the natural surroundings. Major portion of the muck generated during excavation of diversion channel, desilting tank, forebay shall be dumped in the properly demarcated sites. The dumping sites shall be identified before project implementation in consultation with the state authorities. These dumping sites shall have proper protection works like wire crates, etc to make the slopes stable. A total provision of Rs 0.4 million has been kept for the same.
c) Provision of fuel and labour force
Fuel wood shall be purchased from depots of the Forest Department and shall be provided free of cost to the labour force to ensure that such requirements do not compel the work force to fell trees during the construction of the project. The project staff shall be provided with electricity connection and LPG cylinders. A provision of Rs 0.1 million has been kept for this purpose.
d) Anti poaching measures
The construction labour and project staff will be educated in terms of environmental
concerns and relevant anti poaching laws in consultation with the forest department.
Apart from this, suitable information dissemination activities like setting up of notice
boards, posters etc. at appropriate places to warn people against poaching in the area
would be carried out. It is felt that these measures may benefit the people in general
making them more aware and concerned with their natural surroundings.
e) Environment monitoring cell
An environment-monitoring cell would be set up during the construction & operation phases
of the project to supervise all the above activities and liaison with state/ central government
authorities. A provision of Rs.0.2 million has been earmarked for the same in the project
budget.
G. Stakeholders comments G.1 Brief description of the process by which comments by local stakeholders have been invited and compiled: The developer to provide the official documents regarding the comments received. The procedure which would be applied to collect the comments are 1) Meeting with the villagers on whose land the construction activities would take place and minutes of the meetings would be documented 2) Meeting with state electricity board officials 3) Meetings with the forest officials 4) Meetings with the villagers who are staying in the surrounding environment

Annex 1: Contact Information For Participants In The Project Activity (Please repeat table as needed) Organization: DCM Shriram Consolidated Ltd.(DSCL) Street/P.O.Box: 2nd Floor, Kanchenjunga Building, 18, Barakhamba Road Building: Kanchenjunga Building City: New Delhi State/Region: Delhi Postcode/ZIP: 110001 Country: India Telephone: +91-11-23316801 FAX: +91-11-23319062 E-Mail: [email protected] URL: Represented by: Title: Sr Analyst Salutation: Ms Last Name: Menon Middle Name: First Name: Nisha Department: Mobile: Direct FAX: +91-11-23319062 Direct tel: +91-11-23316801 Personal E-Mail: [email protected]

Annex 2
INFORMATION REGARDING PUBLIC FUNDING No public funding from Annex I countries was sought for the proposed project activity
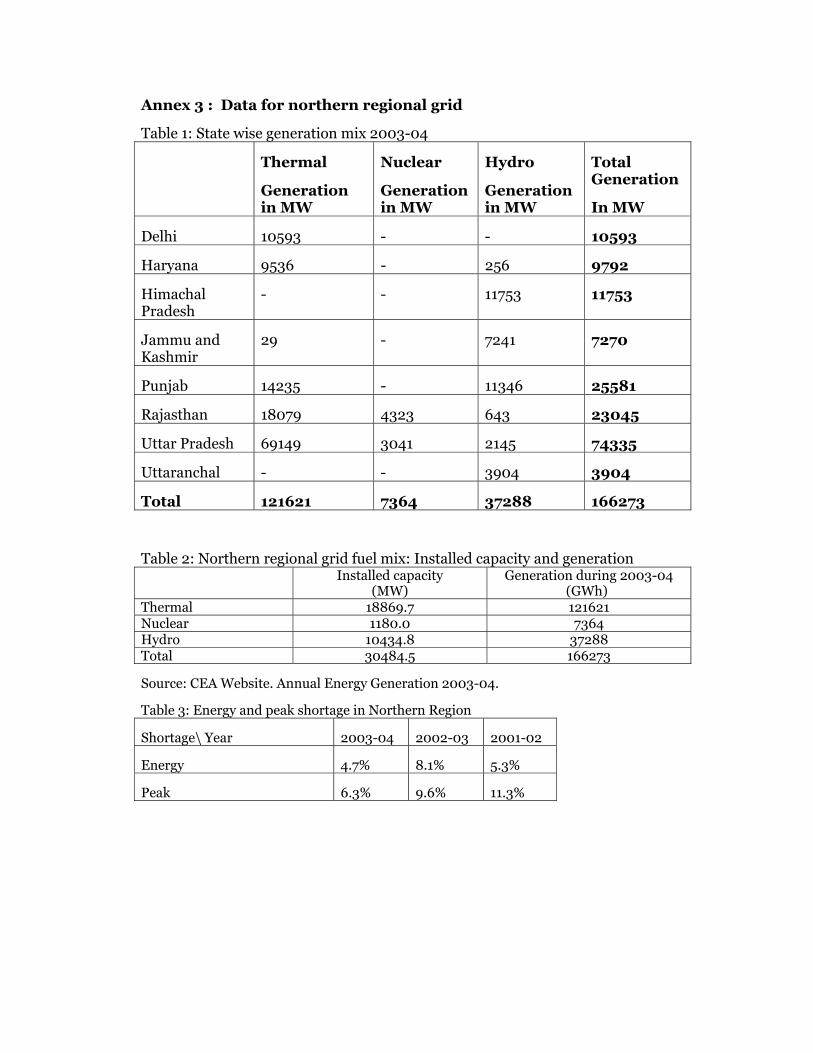
Annex 3 : Data for northern regional grid
Table 1: State wise generation mix 2003-04
Thermal
Generation in MW
Nuclear
Generation in MW
Hydro
Generation in MW
Total Generation
In MW
Delhi 10593 - - 10593
Haryana 9536 - 256 9792
Himachal Pradesh
- - 11753 11753
Jammu and Kashmir
29 - 7241 7270
Punjab 14235 - 11346 25581
Rajasthan 18079 4323 643 23045
Uttar Pradesh 69149 3041 2145 74335
Uttaranchal - - 3904 3904
Total 121621 7364 37288 166273
Table 2: Northern regional grid fuel mix: Installed capacity and generation Installed capacity
(MW) Generation during 2003-04
(GWh) Thermal 18869.7 121621 Nuclear 1180.0 7364 Hydro 10434.8 37288 Total 30484.5 166273
Source: CEA Website. Annual Energy Generation 2003-04.
Table 3: Energy and peak shortage in Northern Region
Shortage\ Year 2003-04 2002-03 2001-02
Energy 4.7% 8.1% 5.3%
Peak 6.3% 9.6% 11.3%
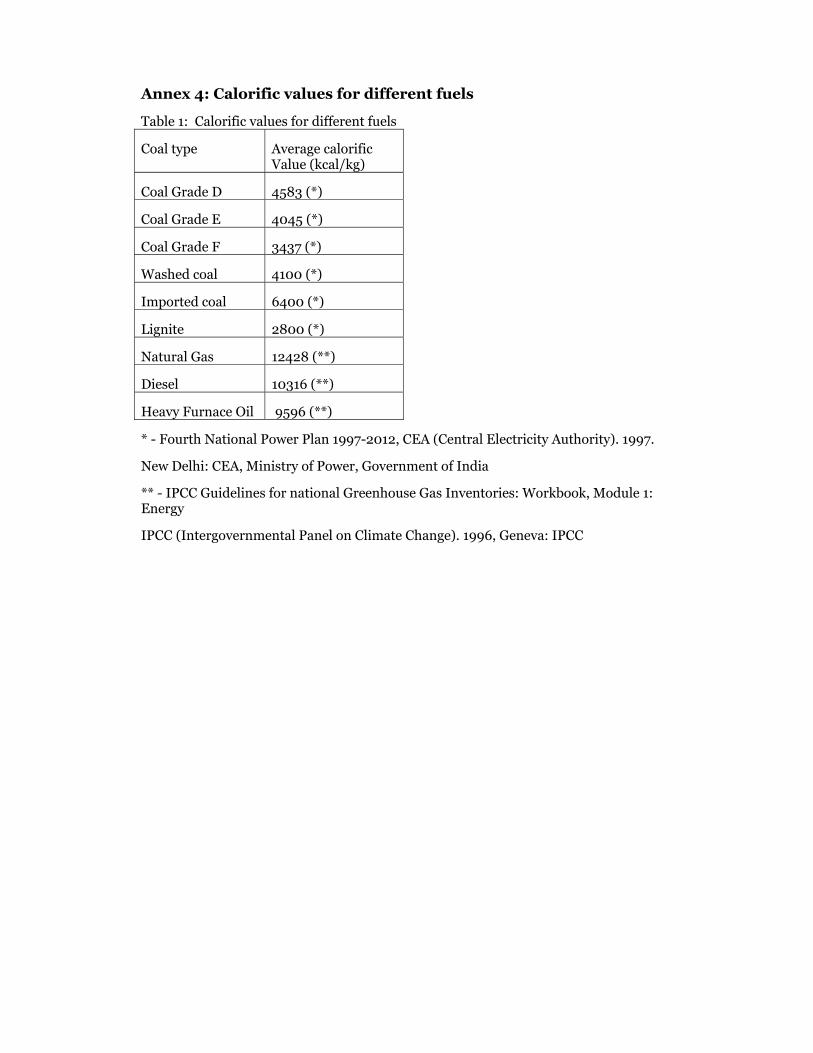
Annex 4: Calorific values for different fuels
Table 1: Calorific values for different fuels
Coal type Average calorific Value (kcal/kg)
Coal Grade D 4583 (*)
Coal Grade E 4045 (*)
Coal Grade F 3437 (*)
Washed coal 4100 (*)
Imported coal 6400 (*)
Lignite 2800 (*)
Natural Gas 12428 (**)
Diesel 10316 (**)
Heavy Furnace Oil 9596 (**)
* - Fourth National Power Plan 1997-2012, CEA (Central Electricity Authority). 1997.
New Delhi: CEA, Ministry of Power, Government of India
** - IPCC Guidelines for national Greenhouse Gas Inventories: Workbook, Module 1: Energy
IPCC (Intergovernmental Panel on Climate Change). 1996, Geneva: IPCC
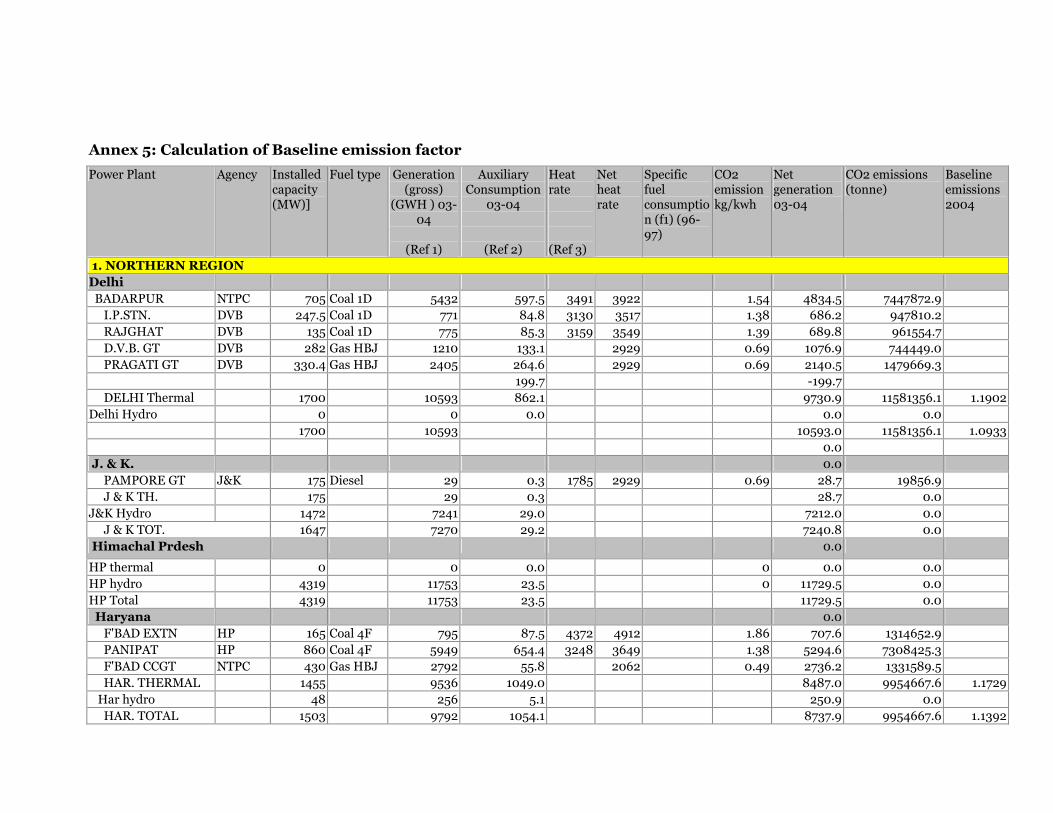
Annex 5: Calculation of Baseline emission factor
Power Plant Agency Installed capacity (MW)]
Fuel type Generation (gross)
(GWH ) 03-04
(Ref 1)
Auxiliary Consumption
03-04
(Ref 2)
Heat rate (Ref 3)
Net heat rate
Specific fuel consumption (f1) (96-97)
CO2 emission kg/kwh
Net generation 03-04
CO2 emissions (tonne)
Baseline emissions 2004
1. NORTHERN REGION Delhi BADARPUR NTPC 705 Coal 1D 5432 597.5 3491 3922 1.54 4834.5 7447872.9 I.P.STN. DVB 247.5 Coal 1D 771 84.8 3130 3517 1.38 686.2 947810.2 RAJGHAT DVB 135 Coal 1D 775 85.3 3159 3549 1.39 689.8 961554.7 D.V.B. GT DVB 282 Gas HBJ 1210 133.1 2929 0.69 1076.9 744449.0 PRAGATI GT DVB 330.4 Gas HBJ 2405 264.6 2929 0.69 2140.5 1479669.3
199.7 -199.7 DELHI Thermal 1700 10593 862.1 9730.9 11581356.1 1.1902 Delhi Hydro 0 0 0.0 0.0 0.0
1700 10593 10593.0 11581356.1 1.0933 0.0
J. & K. 0.0 PAMPORE GT J&K 175 Diesel 29 0.3 1785 2929 0.69 28.7 19856.9 J & K TH. 175 29 0.3 28.7 0.0 J&K Hydro 1472 7241 29.0 7212.0 0.0 J & K TOT. 1647 7270 29.2 7240.8 0.0 Himachal Prdesh 0.0
HP thermal 0 0 0.0 0 0.0 0.0 HP hydro 4319 11753 23.5 0 11729.5 0.0 HP Total 4319 11753 23.5 11729.5 0.0 Haryana 0.0 F'BAD EXTN HP 165 Coal 4F 795 87.5 4372 4912 1.86 707.6 1314652.9 PANIPAT HP 860 Coal 4F 5949 654.4 3248 3649 1.38 5294.6 7308425.3 F'BAD CCGT NTPC 430 Gas HBJ 2792 55.8 2062 0.49 2736.2 1331589.5 HAR. THERMAL 1455 9536 1049.0 8487.0 9954667.6 1.1729 Har hydro 48 256 5.1 250.9 0.0 HAR. TOTAL 1503 9792 1054.1 8737.9 9954667.6 1.1392
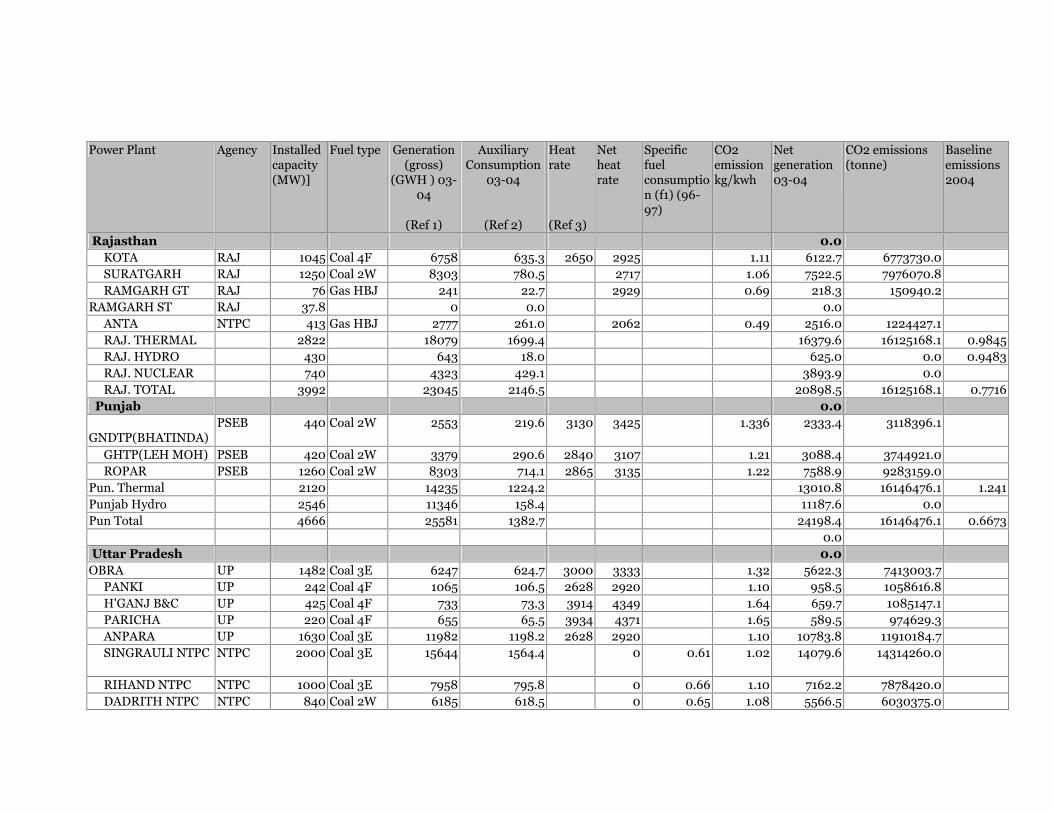
Power Plant Agency Installed capacity (MW)]
Fuel type Generation (gross)
(GWH ) 03-04
(Ref 1)
Auxiliary Consumption
03-04
(Ref 2)
Heat rate (Ref 3)
Net heat rate
Specific fuel consumption (f1) (96-97)
CO2 emission kg/kwh
Net generation 03-04
CO2 emissions (tonne)
Baseline emissions 2004
Rajasthan 0.0 KOTA RAJ 1045 Coal 4F 6758 635.3 2650 2925 1.11 6122.7 6773730.0 SURATGARH RAJ 1250 Coal 2W 8303 780.5 2717 1.06 7522.5 7976070.8 RAMGARH GT RAJ 76 Gas HBJ 241 22.7 2929 0.69 218.3 150940.2 RAMGARH ST RAJ 37.8 0 0.0 0.0 ANTA NTPC 413 Gas HBJ 2777 261.0 2062 0.49 2516.0 1224427.1 RAJ. THERMAL 2822 18079 1699.4 16379.6 16125168.1 0.9845 RAJ. HYDRO 430 643 18.0 625.0 0.0 0.9483 RAJ. NUCLEAR 740 4323 429.1 3893.9 0.0 RAJ. TOTAL 3992 23045 2146.5 20898.5 16125168.1 0.7716 Punjab 0.0 GNDTP(BHATINDA)
PSEB 440 Coal 2W 2553 219.6 3130 3425 1.336 2333.4 3118396.1
GHTP(LEH MOH) PSEB 420 Coal 2W 3379 290.6 2840 3107 1.21 3088.4 3744921.0 ROPAR PSEB 1260 Coal 2W 8303 714.1 2865 3135 1.22 7588.9 9283159.0 Pun. Thermal 2120 14235 1224.2 13010.8 16146476.1 1.241 Punjab Hydro 2546 11346 158.4 11187.6 0.0 Pun Total 4666 25581 1382.7 24198.4 16146476.1 0.6673
0.0 Uttar Pradesh 0.0 OBRA UP 1482 Coal 3E 6247 624.7 3000 3333 1.32 5622.3 7413003.7 PANKI UP 242 Coal 4F 1065 106.5 2628 2920 1.10 958.5 1058616.8 H'GANJ B&C UP 425 Coal 4F 733 73.3 3914 4349 1.64 659.7 1085147.1 PARICHA UP 220 Coal 4F 655 65.5 3934 4371 1.65 589.5 974629.3 ANPARA UP 1630 Coal 3E 11982 1198.2 2628 2920 1.10 10783.8 11910184.7 SINGRAULI NTPC NTPC 2000 Coal 3E 15644 1564.4 0 0.61 1.02 14079.6 14314260.0
RIHAND NTPC NTPC 1000 Coal 3E 7958 795.8 0 0.66 1.10 7162.2 7878420.0 DADRITH NTPC NTPC 840 Coal 2W 6185 618.5 0 0.65 1.08 5566.5 6030375.0
Power Plant Agency Installed capacity (MW)]
Fuel type Generation (gross)
(GWH ) 03-04
(Ref 1)
Auxiliary Consumption
03-04
(Ref 2)
Heat rate (Ref 3)
Net heat rate
Specific fuel consumption (f1) (96-97)
CO2 emission kg/kwh
Net generation 03-04
CO2 emissions (tonne)
Baseline emissions 2004
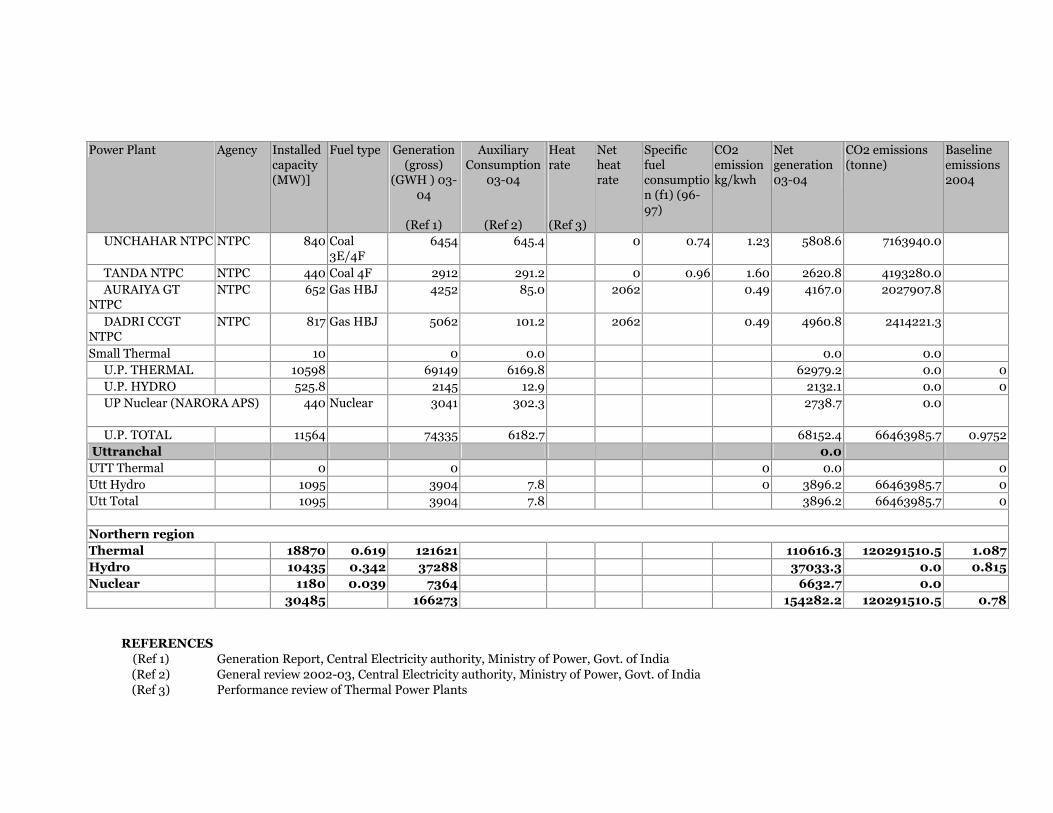
UNCHAHAR NTPC NTPC 840 Coal 3E/4F
6454 645.4 0 0.74 1.23 5808.6 7163940.0
TANDA NTPC NTPC 440 Coal 4F 2912 291.2 0 0.96 1.60 2620.8 4193280.0 AURAIYA GT NTPC
NTPC 652 Gas HBJ 4252 85.0 2062 0.49 4167.0 2027907.8
DADRI CCGT NTPC
NTPC 817 Gas HBJ 5062 101.2 2062 0.49 4960.8 2414221.3
Small Thermal 10 0 0.0 0.0 0.0 U.P. THERMAL 10598 69149 6169.8 62979.2 0.0 0 U.P. HYDRO 525.8 2145 12.9 2132.1 0.0 0 UP Nuclear (NARORA APS) 440 Nuclear 3041 302.3 2738.7 0.0
U.P. TOTAL 11564 74335 6182.7 68152.4 66463985.7 0.9752 Uttranchal 0.0 UTT Thermal 0 0 0 0.0 0 Utt Hydro 1095 3904 7.8 0 3896.2 66463985.7 0 Utt Total 1095 3904 7.8 3896.2 66463985.7 0
Northern region Thermal 18870 0.619 121621 110616.3 120291510.5 1.087 Hydro 10435 0.342 37288 37033.3 0.0 0.815 Nuclear 1180 0.039 7364 6632.7 0.0
30485 166273 154282.2 120291510.5 0.78
REFERENCES
(Ref 1) Generation Report, Central Electricity authority, Ministry of Power, Govt. of India (Ref 2) General review 2002-03, Central Electricity authority, Ministry of Power, Govt. of India (Ref 3) Performance review of Thermal Power Plants
Recommended


