AVIAN CONSUMPTION AND USE OF CONTAMINATED WATER SOURCES:
TOXICOLOGICAL ASSESSMENTS OF EXPOSURE, EFFECTS AND SUSCEPTIBILITY.
Final Report - Part I
Report No. RWO55-T04-47-A
By:
Dr. Michael Hooper, John Isanhart and Dr. Stephen Cox The Institute of Environmental and Human Health
Texas Tech University Box 41163
Lubbock, Texas 79409
Through:
Dr. Reynaldo Patiño Texas Cooperative Fish and Wildlife Research Unit
U.S. Geological Survey, Cooperative Research Units Program Texas Tech University
Box 42120 Lubbock, Texas 79409
Produced for:
Russell MacRae United States Fish and Wildlife Service
New Mexico Ecological Services Field Office 2105 Osuna Road NE
Albuquerque, NM 87113
Dr. Kevin D. Reynolds United States Fish and Wildlife Service
Arizona Ecological Services Field Office 2321 West Royal Palm Road, Suite 103
Phoenix, AZ 85021
Produced Under:
Project No. T04-47, The Institute of Environmental and Human Health (TIEHH), and Research Work Order No..55, Texas Cooperative Fish and Wildlife Research Unit (TCFWRU)
February 15, 2007
AMW Exposures in Birds Final Report - Part I Page 2
Report No. RWO55-T04-47-A February 15, 2007 Texas Tech University
Table of Contents Table of Tables .........................................................................................................................3 Table of Figures ........................................................................................................................6 Introduction ...............................................................................................................................7 Project Objectives .....................................................................................................................8 Study A ...................................................................................................................................13
Introduction .......................................................................................................................13 Methods .............................................................................................................................13 Results ...............................................................................................................................18 Discussion .........................................................................................................................24
Study B ....................................................................................................................................36
Introduction .......................................................................................................................36 Methods .............................................................................................................................36 Results ...............................................................................................................................38 Discussion .........................................................................................................................40
Study C ....................................................................................................................................44
Introduction .......................................................................................................................44 Methods .............................................................................................................................44 Results ...............................................................................................................................47 Discussion .........................................................................................................................49
Study D ...................................................................................................................................60
Introduction .......................................................................................................................60 Methods .............................................................................................................................60 Results ...............................................................................................................................63 Discussion .........................................................................................................................65
Conclusion…………………………………………………………………………………………………….72 Literature Cited .......................................................................................................................73
AMW Exposures in Birds Final Report - Part I Page 3
Report No. RWO55-T04-47-A February 15, 2007 Texas Tech University
Table of Tables
Table 1. Diseases/conditions associated with alterations in clinical chemistry parameters...11 Table 2. Diseases/conditions associated with alterations in complete blood count
parameters………………………………………………………………………………….12 Table A.1. Concentrations of metals from mine-associated AMW, synthetic AMW
dosing solution, and RO water analyzed by flame/furnace atomic absorption spectroscopy (AAS) and inductively-coupled plasma atomic emission spectroscopy (ICP-AES) ............................................................................................................................26
Table A.2. Total synthetic acid metalliferous water and estimated metal component
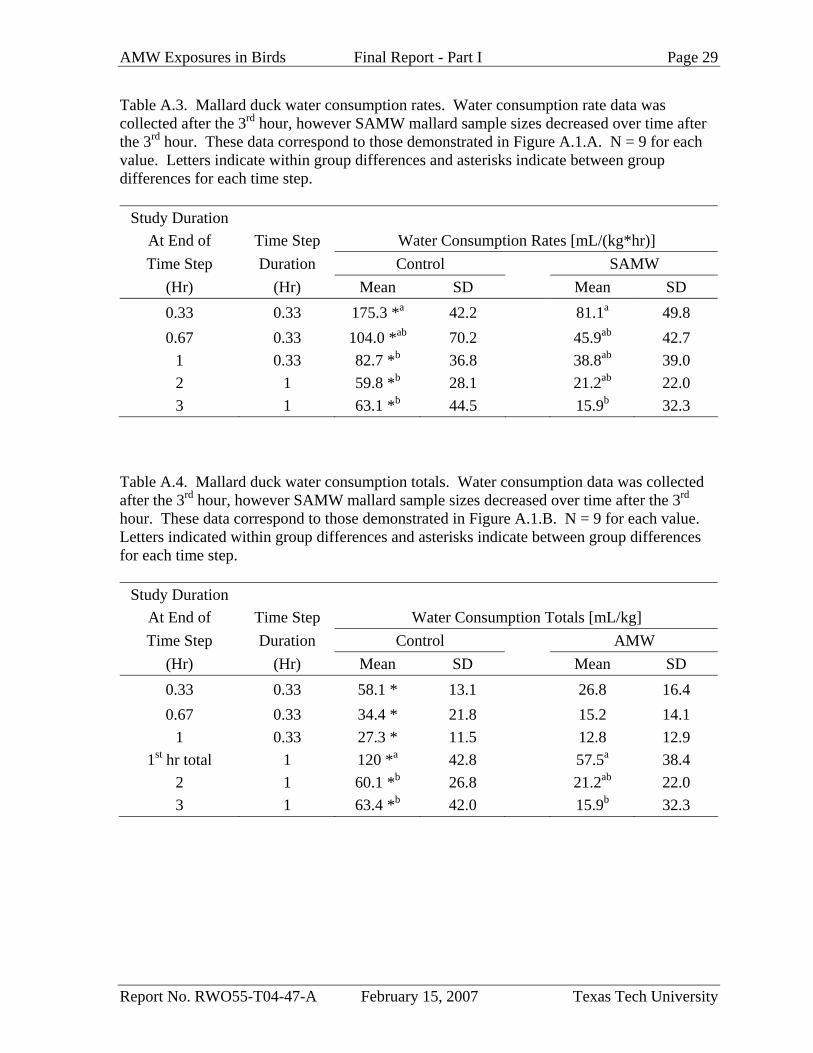
doses among SAMW treatment birds ....................................................................... 27 Table A.3. Mallard duck water consumption rates… These data correspond to those
demonstrated in Figure A.1.A ..............................................................................................29 Table A.4. Mallard duck water consumption totals… These data correspond to those
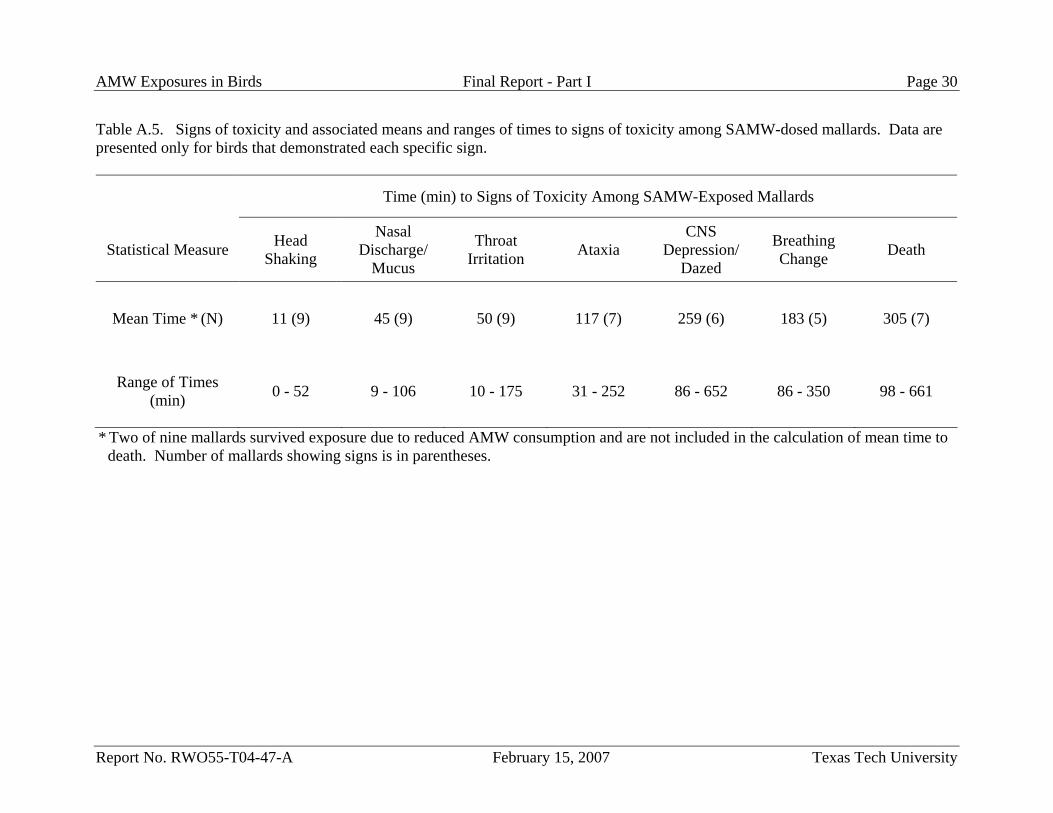
demonstrated in Figure A.1.B ..............................................................................................29 Table A.5. Signs of toxicity and associated means and ranges of times to signs of
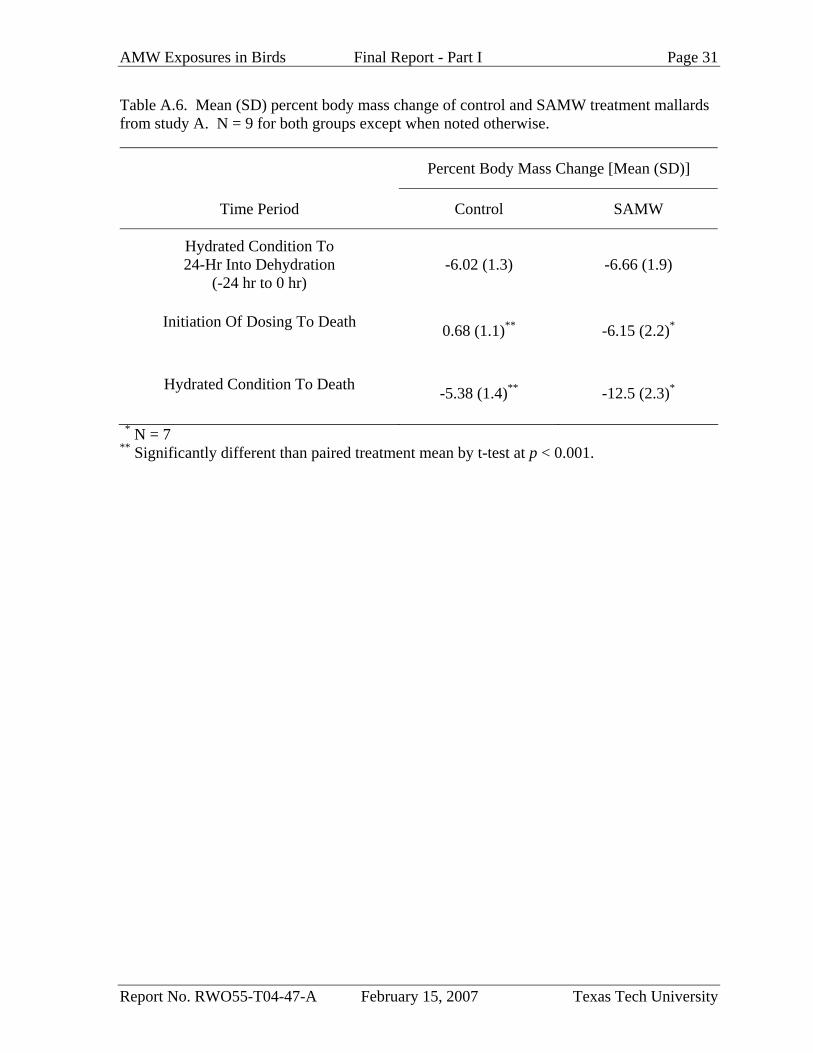
toxicity among SAMW-dosed mallards ...............................................................................30 Table A.6. Mean (SD) percent body mass change of control and SAMW treatment
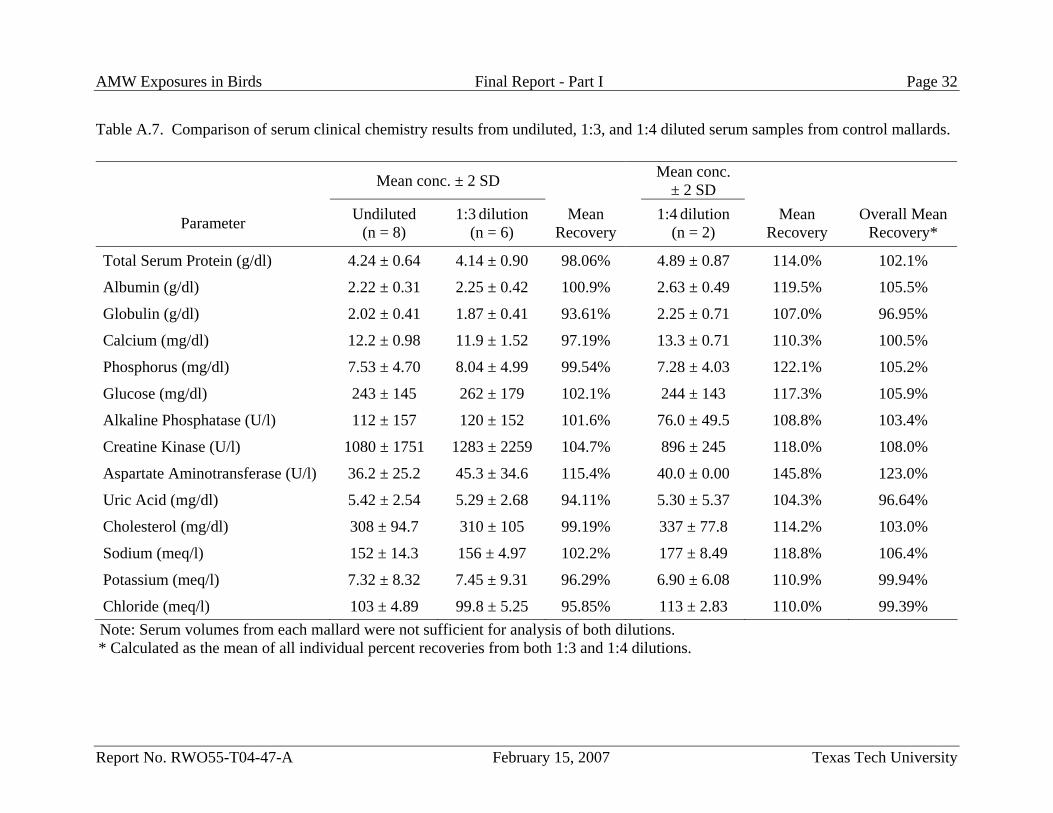
mallards from study A .........................................................................................................31 Table A.7. Comparison of serum clinical chemistry results from undiluted, 1:3, and
1:4 diluted serum samples from control mallards ................................................................32 Table A.8. Mean ± SD serum clinical chemistry results from SAMW treatment and
control mallards ...................................................................................................................33 Table A.9. Occurrence of histopathological changes in tissues following acute
SAMW and control water treatments in mallard ducks .......................................................34 Table A.10. Nature of histopathological changes in the ventriculus following acute
SAMW and control water treatments in mallard ducks .......................................................34 Table A.11. Mean ± SD concentrations of elements detected in livers, kidneys,
blood, and bile from SAMW treatment and control mallards .............................................35 Table B.1. pH values of NAMW over an 8-day period during mallard study B ...................41 Table B.2. Concentrations of metals from the aqueous layer of synthetic neutralized
AMW analyzed by inductively-coupled plasma atomic emission spectroscopy .................41
AMW Exposures in Birds Final Report - Part I Page 4
Report No. RWO55-T04-47-A February 15, 2007 Texas Tech University
Table B.3. Mean ± SD body mass changes of control and NAMW treatment group mallards in study B ..............................................................................................................42
Table B.4. Serum clinical chemistry and hematocrit results (mean ± SD) from control
and treatment mallards following a 48-hr acute ad libitum exposure to synthetic neutralized acid mine water .................................................................................................43
Table C.1. Water consumption totals and standard deviations (SD) of mallards
receiving tap water or SAMW. These data correspond to those demonstrated in Figure C.1.A .........................................................................................................................52
Table C.2. Water consumption totals and standard deviations (SD) of mallards
receiving tap water or SAMW. These data correspond to those demonstrated in Figure C.1.B .........................................................................................................................53
Table C.3. Water consumption totals and standard deviations (SD) of mallards
receiving tap water or SAMW. These data correspond to those demonstrated in Figure C.1.C .........................................................................................................................54
Table C.4. Total food consumption (g/kg/day) of SAMW treated mallards .........................55 Table C.5. Mean ± SD body mass changes of control and SAMW treatment group
mallards in study C ..............................................................................................................56 Table C.6. Serum clinical chemistry results (mean ± SD) from Day 1, 3, and 7
control and treatment mallards from Study C ......................................................................57 Table C.7. Occurrence of histopathological changes in gastrointestinal tract tissues
following 1, 3, and 7 days post-treatment with SAMW treatment in mallards ...................59 Table D.1. Concentrations of metals in the SAMW solution analyzed by
flame/furnace atomic absorption spectroscopy and inductively-coupled plasma atomic emission spectroscopy and estimated concentrations of metals in 10-fold and 100-fold SAMW dilutions ...................................................................................................66
Table D.2. Mean ± SD and ranges of first hour and total doses (g/kg) and associated
percent mortality and time to death for tap water, 1/100 SAMW, 1/10 SAMW, and SAMW treatment groups .....................................................................................................67
Table D.3. Mean ± SD body mass changes of control, SAMW, 1/10 SAMW, and
1/100 SAMW treatment group mallards in study D ............................................................68 Table D.4. Serum clinical biochemistry (mean ± SD) results from SAMW, 1/10
SAMW, 1/100 SAMW, and tap water treatment group mallards ........................................69
AMW Exposures in Birds Final Report - Part I Page 5
Report No. RWO55-T04-47-A February 15, 2007 Texas Tech University
Table D.5. Mean ± SD complete blood count values from control, 1/100 SAMW, 1/10 SAMW, and SAMW treatment groups ........................................................................70
AMW Exposures in Birds Final Report - Part I Page 6
Report No. RWO55-T04-47-A February 15, 2007 Texas Tech University
Table of Figures Figure A.1. Water consumption rates (A) and totals (B) for mallard ducks provided
either clean water or synthetic AMW ..................................................................................28 Figure C.1. Water consumption totals for mallards euthanized 1 day after SAMW
exposure (A), 3 days after SAMW exposure (B), and 7 days after exposure (C, next page) .....................................................................................................................................50
AMW Exposures in Birds Final Report - Part I Page 7
Report No. RWO55-T04-47-A February 15, 2007 Texas Tech University
Introduction
Availability of clean water sources is critical to the daily survival of wild bird species,
while migratory species are dependent on water sources as they labor to reach their wintering
or breeding grounds. Water availability in the western U.S. is a particularly important
consideration in the life of local or migratory birds as its scarcity makes it a critical
commodity. The occurrence of contaminated water sources in the arid or semi-arid areas of
the western U.S. pose an important threat to local and migratory birds, as their need for water
can often preclude their ability to choose between a variety of sources. Current data suggest
that passerines and waterfowl are the species most at risk to injury from drinking acid mine
tailings water (Stubblefield et al., 1997; Stratus, 2003). There is relatively little other data
that exist on this topic, and what other information that does exist primarily addresses the
toxicity of zinc, lead, and/or cyanide-rich water from mining sites and acidified water bodies
to birds (Beyer et al., 2004; Henny et al., 1994; Rattner et al., 1987; Foster, 1999; Tyler and
Omerod, 1992; Read and Pickering, 1999; Read, 1999; Sileo et al., 2004). Poisoning of birds
that use toxic tailings waters is of particular concern in arid Australia, with approximately
1000 birds dying annually in gold mine tailings dams (Read, 1999; Minerals Council of
Australia, 1996). Examples of bird poisonings from water sources other than cyanide-
contaminated water in the U.S. include incidents at the Berkeley Pit, Butte, MT (ENSR,
1996) and a petroleum refinery fly ash pond in Delaware (Rattner et al., 2006). Such
anthropogenic landscape modifications pose compounding problems for nomadic or
migratory species that are in search of food, water, and/or resting sites.
Birds require water for the maintenance of cellular homeostasis, tissue integrity, food
digestion, waste excretion, hygiene, and numerous biochemical reactions (Koutsos et al.,
2001). While many birds are able to obtain all of the water they require through succulent
food, insects, or even metabolic water alone, most birds require drinking water as the primary
source. Dehydrated birds often drink substantially more water than required to restore water
homeostasis than their non-dehydrated counterparts (Takei et al., 1988). Dehydrated
migratory and/or nomadic birds have been observed gorge drinking (Klaassen, 2004). In
addition, drinking rates may increase with increasing osmolarity of the drinking water
(Goldstein and Skadhauge, 2000). Migratory birds that use mine tailings waters, which often
AMW Exposures in Birds Final Report - Part I Page 8
Report No. RWO55-T04-47-A February 15, 2007 Texas Tech University
contain elevated levels of toxic metals, for stopover sites may be at increased risk to injury or
death as a result of gorge drinking and physiological responses to “salt” water.
The acidic and metal-contaminated water in the tailings, pregnant leach solution,
stormwater, and process water storage ponds located at Phelps Dodge’s Tyrone, Chino, and
Morenci mines is of concern due to its potential toxicity and adverse effects in avian species.
From September to November 2000, United States Fish and Wildlife Service (USFWS)
biologists investigated a series of incidents involving 221 bird deaths at three mine sites
located in New Mexico and Arizona (Stratus, 2003). These bird deaths were assumed to be
linked to consumption and/or use of acid mine tailings water as all of the carcasses were
found near pregnant leach solution ponds, tailings ponds and associated lakes or storm water
retention basins (Stratus, 2003). Other highly decomposed bird remains were observed on or
near metal-contaminated waters but were not collected and included in the total count. Many
of of the carcasses (approximately 40%) were found near a 280 acre uncovered tailings pond
containing high concentrations of copper, zinc, aluminum, magnesium, cadmium,
manganese, cobalt, and iron in standing water (Table A.1). Our goal was to perform a series
of studies to develop an understanding of how avian drinking behavior can potentially
influence the occurrence of acid mine water (AMW) toxicity events and to characterize the
behavioral, clinical, and pathological signs of acid metal-enriched water toxicosis that likely
occurred in the birds that were found dead at the Phelps Dodge mines.
In drinking water assessments, palatability and the nature of acid metalliferous pond
water toxicity in one avian species, the mallard duck (Anas platyrhynchos), were assessed.
The mallard duck was selected because it is a standard test species for both pesticides and
contaminants with data available for both acid and metals toxicity. In addition, mallards are
representative of a highly impacted family on the mining sites (Stratus, 2003).
Project Objectives
There are four primary objectives for this project, each represented by an individual study.
The first evaluates effects in birds following consumption of synthetic acid metalliferous
water (SAMW). The second, third and fourth objectives address the potential for altering
SAMW toxicity based on availability of alternative water sources or chemical modification
AMW Exposures in Birds Final Report - Part I Page 9
Report No. RWO55-T04-47-A February 15, 2007 Texas Tech University
of SAMW to reduce its toxicity. Exposure scenarios correspond to actual conditions
measured at the Phelps Dodge mine sites where dead birds have been recovered. Mallards
were food and water-fasted in all studies to simulate migratory physiological stressors of
maintenance of water and energy balance in wild birds.
1. Study A. Assess the acute toxicity of acid SAMW under acute exposure scenarios
simulating conditions at the Phelps Dodge mines in dehydrated mallard,
2. Study B. Assess the potential for alleviation of SAMW’s avian toxic effects by
neutralizing its acidic character,
3. Study C. Assess the potential role that clean water availability and consumption might
play in protecting birds after a toxic exposure to SAMW, and
4. Study D. Assess the acute toxicity of SAMW to mallards after being diluted 10- and
100-fold.
Biomarkers of exposure and effect were the tools used to evaluate the toxicity of SAMW
to mallards. These biomarkers include clinical chemistry, gross and histopathology,
hematology, behavior, and mortality. Others have used or discuss the applicability of such
endpoints to examine the toxic properties of metals to birds (Rattner et al., 2006; Fairbrother
et al., 2004; Foster, 1999), and these methods have become common practice in toxicological
studies. Clinical chemistry tests are useful tools that examine levels of important enzymes,
electrolytes, minerals, and other proteins which help determine any physiological alteration
that may be suggestive of disease, illness, or other dysfunction. Gross pathology is the
recognition of disease or injury based on macroscopic examination of external and internal
tissues at the time of autopsy. Histopathology is the diagnosis of disease or injury based on
microscopic examination of tissues. Hematology is the science of blood, blood forming
organs, and blood diseases. Complete blood counts are a common method used to diagnose
blood diseases and assess immune function status. Behavioral endpoints identify the signs of
toxicity associated with exposure to a particular chemical. Some behaviors can be used to
AMW Exposures in Birds Final Report - Part I Page 10
Report No. RWO55-T04-47-A February 15, 2007 Texas Tech University
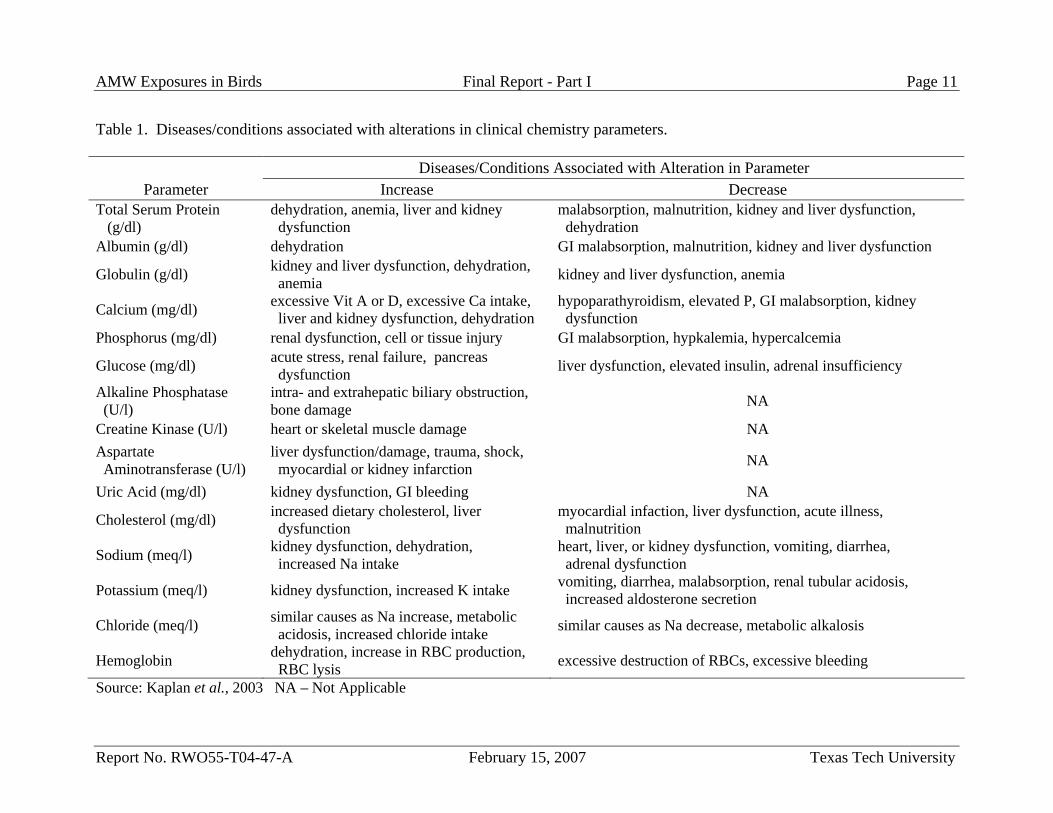
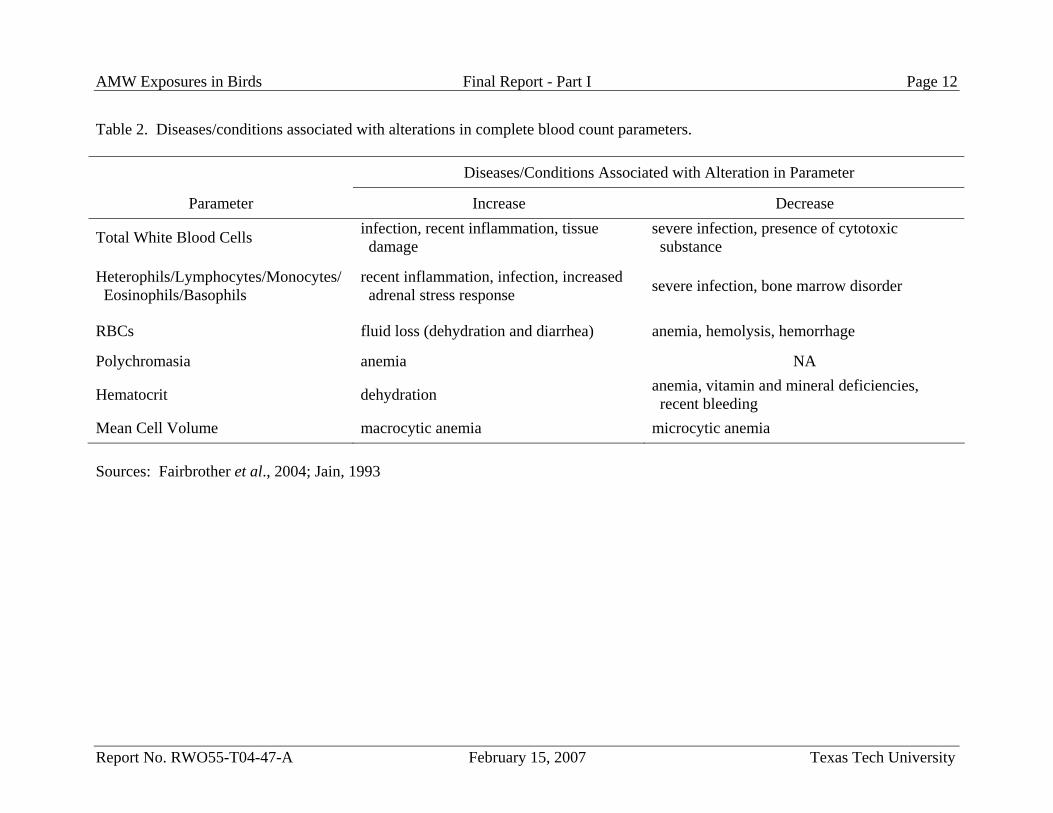
identify physiological dysfunctions. A table of clinical chemistry and hematology
parameters and interpretations of alterations in parameters is provided below.
AMW Exposures in Birds Final Report - Part I Page 11
Report No. RWO55-T04-47-A February 15, 2007 Texas Tech University
Table 1. Diseases/conditions associated with alterations in clinical chemistry parameters.
Diseases/Conditions Associated with Alteration in Parameter Parameter Increase Decrease
Total Serum Protein (g/dl)
dehydration, anemia, liver and kidney dysfunction
malabsorption, malnutrition, kidney and liver dysfunction, dehydration
Albumin (g/dl) dehydration GI malabsorption, malnutrition, kidney and liver dysfunction
Globulin (g/dl) kidney and liver dysfunction, dehydration, anemia kidney and liver dysfunction, anemia
Calcium (mg/dl) excessive Vit A or D, excessive Ca intake, liver and kidney dysfunction, dehydration
hypoparathyroidism, elevated P, GI malabsorption, kidney dysfunction
Phosphorus (mg/dl) renal dysfunction, cell or tissue injury GI malabsorption, hypkalemia, hypercalcemia
Glucose (mg/dl) acute stress, renal failure, pancreas dysfunction liver dysfunction, elevated insulin, adrenal insufficiency
Alkaline Phosphatase (U/l)
intra- and extrahepatic biliary obstruction, bone damage NA
Creatine Kinase (U/l) heart or skeletal muscle damage NA Aspartate Aminotransferase (U/l)
liver dysfunction/damage, trauma, shock, myocardial or kidney infarction NA
Uric Acid (mg/dl) kidney dysfunction, GI bleeding NA
Cholesterol (mg/dl) increased dietary cholesterol, liver dysfunction
myocardial infaction, liver dysfunction, acute illness, malnutrition
Sodium (meq/l) kidney dysfunction, dehydration, increased Na intake
heart, liver, or kidney dysfunction, vomiting, diarrhea, adrenal dysfunction
Potassium (meq/l) kidney dysfunction, increased K intake vomiting, diarrhea, malabsorption, renal tubular acidosis, increased aldosterone secretion
Chloride (meq/l) similar causes as Na increase, metabolic acidosis, increased chloride intake similar causes as Na decrease, metabolic alkalosis
Hemoglobin dehydration, increase in RBC production, RBC lysis excessive destruction of RBCs, excessive bleeding
Source: Kaplan et al., 2003 NA – Not Applicable
AMW Exposures in Birds Final Report - Part I Page 12
Report No. RWO55-T04-47-A February 15, 2007 Texas Tech University
Table 2. Diseases/conditions associated with alterations in complete blood count parameters.
Diseases/Conditions Associated with Alteration in Parameter
Parameter Increase Decrease
Total White Blood Cells infection, recent inflammation, tissue damage
severe infection, presence of cytotoxic substance
Heterophils/Lymphocytes/Monocytes/ Eosinophils/Basophils
recent inflammation, infection, increased adrenal stress response severe infection, bone marrow disorder
RBCs fluid loss (dehydration and diarrhea) anemia, hemolysis, hemorrhage
Polychromasia anemia NA
Hematocrit dehydration anemia, vitamin and mineral deficiencies, recent bleeding
Mean Cell Volume macrocytic anemia microcytic anemia Sources: Fairbrother et al., 2004; Jain, 1993
AMW Exposures in Birds Final Report - Part I Page 13
Report No. RWO55-T04-47-A February 15, 2007 Texas Tech University
Study A: Acute Toxicity of Synthetic Acid Mine Water to Mallards
Introduction
Consumption of acid metalliferous water found on mining and processing sites is
hazardous to birds. Our goal in Study A was to develop an understanding of how avian
drinking behavior can potentially influence the occurrence of acid metalliferous toxicity
events and to characterize the behavioral, clinical, and pathological signs of acid metal-
enriched water toxicosis that likely occurred in the birds that were found dead at the New
Mexico and Arizona mine sites. The main purpose of this study was to assess the acute
toxicity of synthetic AMW that is representative of tailings pond or pregnant leach solution
water found at the Tyrone Mine under an acute exposure scenario using water- and food-
fasted mallard ducks.
Methods
Synthetic Acid Metalliferous Water Synthesis and Analysis
Fifty gallons of SAMW was prepared according to water chemistry data obtained by
the USFWS from a mine tailings pond where known bird mortalities have occurred (Stratus
Consulting Inc. 2003; Table A.1). SAMW was formulated to match site water exactly in
terms of both cation and anion concentrations. Metals and acid were added as chloride,
nitrate, or sulfate salts to simulate site water ionic content. Reagent grade chemicals,
deionized water, and 18 M trace-metal grade nitric acid were added to a 55 gallon drum and
mixed using a reciprocating pump and electric mixer until most of the particulate material
had dissolved. Any remaining undissolved chemical was removed with a GE Smart Water™
water filtration system that housed a 15 µm sediment filter. Nitric acid was used to adjust the
pH to 2.0. The pH of the solution ranged between 2.01 and 2.03 from the time it was
synthesized until the initiation of dosing (approx. 2 months). Concentrations of 15 elements
in the solution were determined using flame and furnace atomic absorption spectroscopy and
inductively-coupled plasma atomic emission spectroscopy (ICP-AES).
AMW Exposures in Birds Final Report - Part I Page 14
Report No. RWO55-T04-47-A February 15, 2007 Texas Tech University
Study Design
Eighteen 18-20 week old mallards (9 males, 9 females; NPIP certified disease free) were
obtained (Dan and Imogene’s Flying Mallard Ducks, Hartville, MO) and transported to the
Texas Tech University Animal Care Resources Center. Mallards were 22-24 weeks of age at
the time of dosing. Birds were banded and maintained individually in 2.5 ft3 stainless steel
rabbit cages at 20°C, 40-70% relative humidity, and 12h:12h light:dark photoperiod. All
mallards acclimated for 1 month to acclimate to indoor, caged conditions prior to initiation of
testing, with their body weight near or exceeding that recorded upon receipt into the animal
facility. Ducks had ad libitum access to feed (Mazuri waterfowl maintenance diet in pellet
form; PMI Nutritional, LLC, Brentwood, MO, USA) and reverse osmosis (RO) water during
the acclimation period. All animal care was performed in accordance with the Texas Tech
University ACRC and the Institutional Animal Care and Use Committee.
Dosing of each mallard was staggered at 2-min intervals to allow for changing of water
bottle reservoirs and waste-collection bottles. SAMW consumption was adjusted for the
density of the dosing solution (1.05 g/ml) and control consumption was based on 1 g/ml for
RO water. Total dose (g SAMW/kg body mass) for each bird was calculated by dividing the
mass of SAMW consumed (g) by the bird’s body mass (kg). Total dose units were converted
to mL SAMW/kg body mass by dividing by the density. Animals were observed
continuously throughout the exposure period, with behavioral observations and water
consumption data collected.
The water consumption measurement system consisted of multiple components that were
located outside of the cage. Drinking water reservoirs were made from a 1-L plastic water
bottle with an attached rubber stopper, straight tubing connector, approximately 8 inches of
tubing, ratchet clamp, and quick-disconnect connector. The water reservoir was connected to
a standard avian drink cup with a spring-loaded lever (GQF Manufacturing Company Inc.,
Savannah, GA, USA). A majority of spillage drained into waste-collection devices
consisting of an inverted top-half of a 1-gal jug and funnel connected by tubing to a 2-L
plastic water bottle waste reservoir. Small amounts of spillage were also collected using
aluminum pans located below the immediate drinking area. Water consumption was
measured by weighing water in source and waste water reservoirs. Water consumed was
defined as the difference between:
AMW Exposures in Birds Final Report - Part I Page 15
Report No. RWO55-T04-47-A February 15, 2007 Texas Tech University
A) the mass of water loss from in the source reservoir between the start and end of a
defined time period, and
B) the total waste water recovered from
1. the waste water / spillage reservoir under the drinking cup,
2. the waste pan immediately under the drinking area inside the cage, and
3. any remaining water in the drinking cup.
The study was performed on three separate days during a one-week time period, with
three control and three treatment ducks being tested on each day. During each day, three
control mallards were provided with RO water and three were provided with SAMW ad
libitum in the morning following a 24-hr fast and dehydration period. Food was withheld
during the dosing period for both control and treatment groups. Body mass measurements
were collected for each mallard before the initiation of the dehydration and fasting period, at
the initiation of dosing, and at the time of euthanasia or death. Body mass was collected with
an electronic balance to the nearest 0.1 g.
Animal Euthanasia and Sample Collection
Birds were determined to be in moribund condition by visual signs of wing droop,
immobility, lack of response to touch/visual/auditory stimuli, and/or inability to hold head
erectly. All treatment ducks were observed until they were in extremis weighed, and
euthanized via carbon dioxide asphyxiation. Control birds were euthanized as close as
possible to the time treatment animals died. Due to the moribund condition and reduced
blood flow of treatment ducks, we were unable to collect blood samples via jugular or
brachial venipuncture and instead collected blood using cardiac puncture. Whole blood was
collected with 1 mL syringes and placed in 5 mL serum separator tubes for serum clinical
chemistry, 2 ml microcentrifuge tubes for metal residues, and microhematocrit tubes for
determination of erythrocyte packed cell volume (PCV). Whole blood in serum separator
tubes was allowed to clot at room temperature for 30 minutes and then centrifuged at 6,000
rpm for 10 minutes. Serum was decanted into 2-ml microcentrifuge tubes and frozen at -
80°C until being shipped for analysis. All serum samples from treatment mortalities
contained insufficient amounts of serum for clinical chemistry analyses, they were diluted
with 18.0 mega-ohm water to a 1:3, 1:4, or 1:9 serum to water ratio. Serum samples were
AMW Exposures in Birds Final Report - Part I Page 16
Report No. RWO55-T04-47-A February 15, 2007 Texas Tech University
analyzed with a Hitachi 911 Analyzer at the Texas Veterinary Medical Diagnostic
Laboratory (TVMDL) for total serum protein, albumin, globulins, calcium, phosphorus,
glucose, creatine kinase (CK), aspartate aminotransferase (AST), uric acid, cholesterol,
alkaline phosphatase (ALP), and electrolytes. Additional dilutions of control mallard serum
in the ratios of 1:3 (n=6) and 1:4 (n=2) were sent for analysis and compared to undiluted
control mallard serum samples. Serum volumes from each control mallard were not
sufficient for analysis of both dilutions.
Grossly observable lesions were documented, and tissues were collected for both metal
residue and histopathological analyses for all birds. Bile was collected from gall bladders
using 1-inch 23 ga needles and 1 mL syringes, placed in microcentrifuge tubes, and frozen at
-20°C until analysis. A section of left lung, left kidney, brain, spleen, pancreas, left testis,
and salt gland were collected, weighed, and frozen at -20°C for future metal analyses.
Sections of right lung, right testis, right kidney, salt gland, spleen, pancreas, brain, tongue,
esophagus, trachea, heart, proventriculus, ventriculus, duodenum, jejunum, ileum, ceca, and
large intestine were fixed in 10% buffered formalin and stored in jars until being processed at
the Colorado State University Veterinary Diagnostic Laboratory.
Histopathology
Tissue samples were embedded in paraffin and 5 µm sections of these tissues were
histologically analyzed following routine hematoxylin and eosin staining. When dictated by
histopathologic findings, specific tissue sections were also stained for the minerals, calcium
and copper (VonKassa and Rhodanine methods, respectively). Primary histopathologic
analysis was performed blindly without knowledge of treatment. Following analysis,
observations in treated and control groups that were indistinguishable both qualitatively and
quantitatively were considered to be background lesions and deemed unrelated to treatment.
Tissue Metals Analysis
Approximately 0.3 – 0.5 g of thawed tissue/fluid sample (liver, kidney, blood, or bile)
was weighed in a 50 mL Teflon beaker. Samples were digested with trace-metal grade 18M
nitric acid and 30% hydrogen peroxide. Digestion solutions were volumetrically diluted to
20 mL with milli-Q water, poured into 50 mL plastic centrifuge tubes, and stored at 4°C until
AMW Exposures in Birds Final Report - Part I Page 17
Report No. RWO55-T04-47-A February 15, 2007 Texas Tech University
analysis. Any samples containing coagulated lipid were centrifuged at 3500 rpm for 10
minutes. Some digestion solutions containing excess lipid were filtered using filter paper.
Aluminum was quantified by inductively coupled plasma-atomic emission spectroscopy
using a background correction and all other elements (Cu, Zn, Mg, Mn, and Fe) by flame
atomic absorption spectroscopy with a deuterium background correction. Values are
reported on a wet weight (ww) basis. Standards for Cu, Zn, Mg, Mn, and Fe analyses were
prepared in 3% nitric acid, while standards for Al analyses were prepared in an acid digested
liver matrix. Spike returns for all 4 tissues were within ± 10% of total. Mean percent
recoveries ± SD for Cu, Zn, Fe, Mn, and Al in a standard reference material (DOLT-2) were
96.9 ± 4.1 (n=3), 94.8 ± 1.4 (n=3), 83.1 ± 2.2 (n=3), 80.4 ± 0.8 (n=3), and 90.6 ± 83.0 (n=2),
respectively. Mean recoveries of check standards throughout analyses for all elements and
tissues were ± 10%. Data were not corrected for percent recoveries of spikes or reference
material. Where data are listed as not quantified (NQ), tissue concentrations were below the
lowest calibration standard, or below the method detection limit (MDL), whichever was the
higher value. MDLs for metal combinations in water and tissue matrices were calculated
according to USEPA test methods (USEPA, 1994; 40 CFR part 136, Appendix B). MDLs
for all analytes in water were less than 1% of the analyte concentrations determined in
SAMW. MDL determination details can be found in the report appendices under Study A.
Statistical Methods
Measures of central tendency were expressed as the mean ± standard deviation unless
noted otherwise. All data analyzed using parametric methods were tested for normality and
homogeneity of variances. When non-gaussian distribution, heterogeneity of variance, or
unbalanced design were observed, nonparametric tests were chosen for subsequent analysis.
The effect of SAMW treatment on hematocrit was tested using Wilcoxon Rank Sum Test.
Differences between control and SAMW-treatment group tissue metal concentrations were
analyzed using t-tests. Body mass dynamics were analyzed using t-tests. Water
consumption rates during the first three hours of dosing was analyzed using a linear mixed-
effects model with dose after log transformation as the fixed factor and time as the random
factor, as well as the interaction between dose and time. Any differences in the model were
further analyzed using t-tests to determine differences between treatment groups during water
AMW Exposures in Birds Final Report - Part I Page 18
Report No. RWO55-T04-47-A February 15, 2007 Texas Tech University
consumption time periods. Water consumption over time within treatment differences were
analyzed using analysis of variance after log transformation of water consumption data.
Absolute water consumption data for the first three 20-min periods were summed for each
treatment group. Following summation, analysis of variance was used to test for within
group differences in absolute water consumption during the first three 1-hr periods.
Pearson’s product-moment correlation was used to assess the relationship between total
AMW consumption or hematocrit and time to death, as well as the relationship between 20
min, 40 min, 60 min, 120 min, and 180 min AMW consumption and time to death. All
statistical analyses were performed with R (version 2.2.0; R Foundation, Vienna, Austria).
Results of statistical tests were considered to be significant at p < 0.05. Serum clinical
chemistry endpoints were not analyzed with statistical methods due to the small serum
sample numbers obtained from treatment mortality mallards. For these reasons, data from 5
AMW treatment mallard serum samples (3 mortalities and 2 survivors) were compared
qualitatively to 8 control mallard samples.
Results
Water Consumption Totals and Rates
Total doses of SAMW ranged from 52.4 - 270.1 mL SAMW/kg body mass for mortalities
with a mean ± SD of 106.8 ± 75.0, while doses for the two survivor mallards were 25.6 and
40.0 mL SAMW/kg body mass(Table A.2). Total doses of control mallards ranged from
193.3 – 1,249.8 mL water/kg body mass with a mean ± SD of 543.2 ± 358.8.
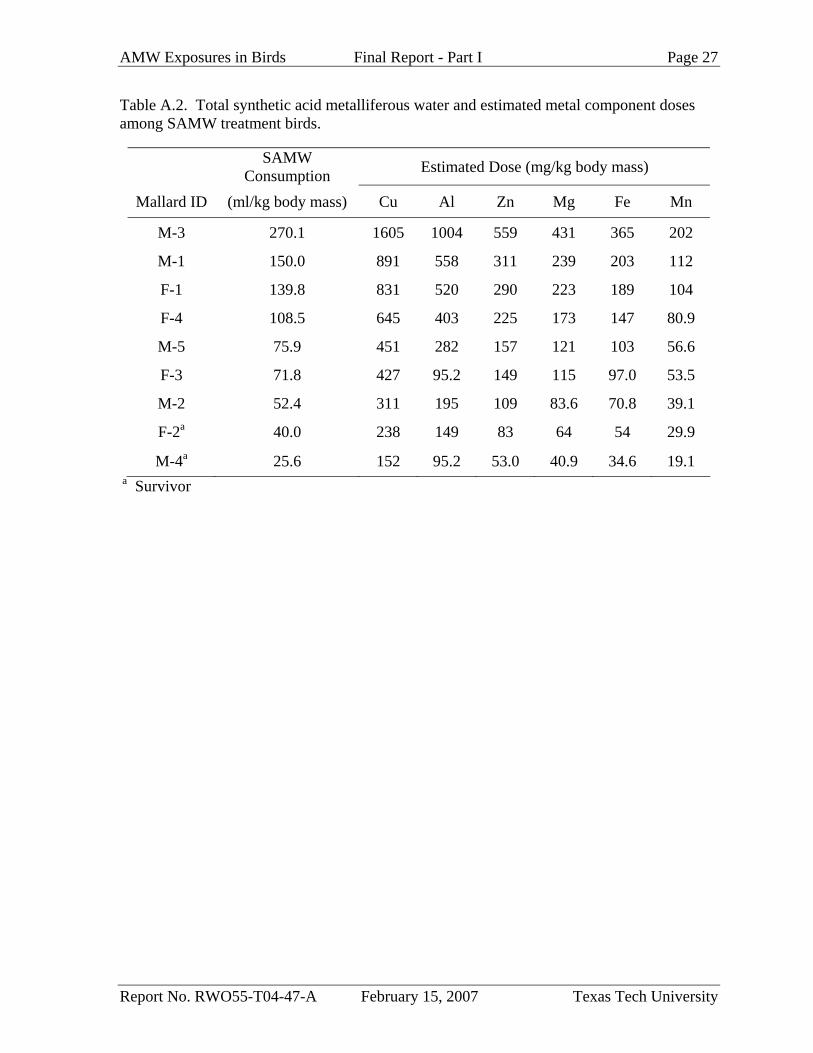
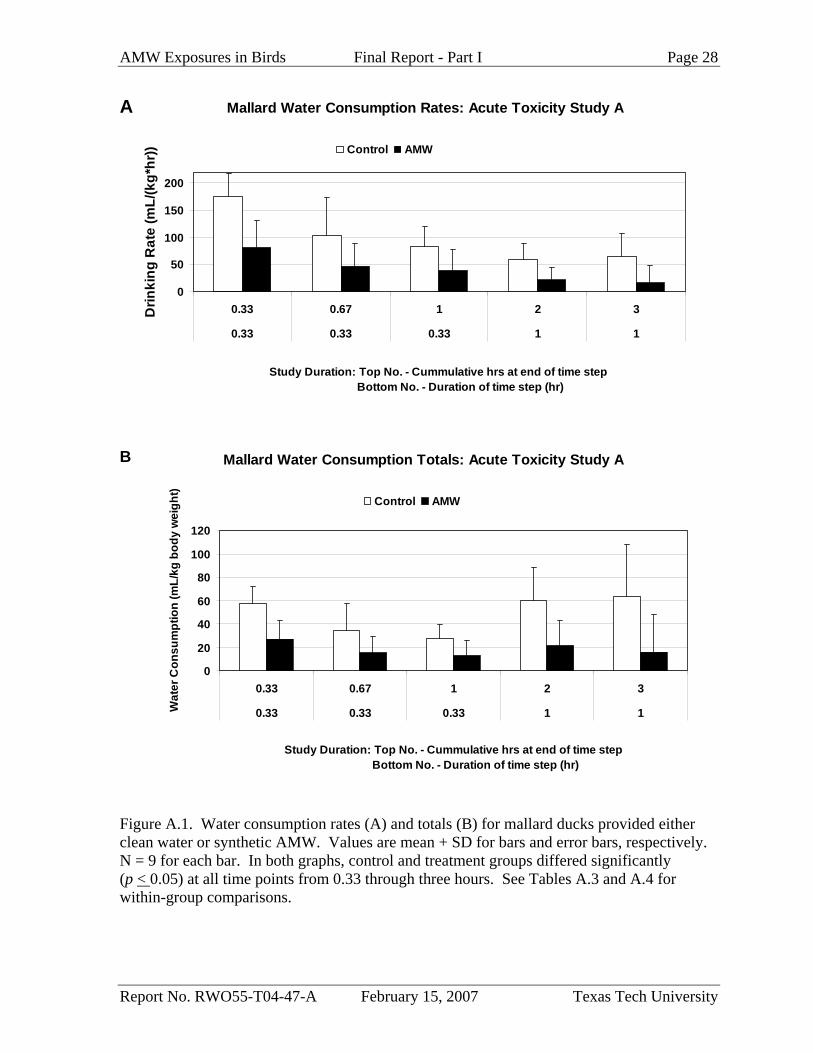
There was a significant difference in water consumption rate (mL/kg/hr) due to the type
of water (p < 0.01), as well as the drinking time period (p < 0.001) and the interaction
between type of water and time period (p < 0.05). Control mallards drank significantly more
water than AMW treatment mallards during the first three 20-min drinking periods and the
subsequent two 1-hr drinking periods (p < 0.05 for all periods; Fig. A.1; Table A.3 and A.4).
Control mallard water consumption rates were significantly higher during the first 20-minute
drinking period in comparison to the third 20-min drinking period (p < 0.05) and the second
and third 1-hr drinking periods (p < 0.001 for both periods). Drinking rates for SAMW
treatment mallards were significantly higher during the first 20-min drinking period only in
comparison to the third 1-hr drinking period (p < 0.01). Water consumption totals were
AMW Exposures in Birds Final Report - Part I Page 19
Report No. RWO55-T04-47-A February 15, 2007 Texas Tech University
compared for the first three hours by totaling the initial three 20-minute intervals into a single
hour value and comparing to the second and third hour data. Control totals were different
from SAMW totals for all three hours of the assessment. Within controls, first hour
consumption totals were significantly greater and double those of hours 2 and 3. Treatment
totals for hour 1, over twice hour two and nearly 4 times hour 3 totals, were significantly
higher than hour 3 values. Water consumption data after 3 hrs into the dosing study is not
presented due to small sample sizes, deteriorating condition of treatment mallards, and
unwillingness of mallards to continue to drink the dosing solution.
There were no significant relationships between time to death and total SAMW dose or
any of the other consumption intervals. Although not significant, SAMW consumption
following 60 min. appeared to be the best predictor of time to death (r=-0.57) when
compared to all other time intervals. Relationships were not significant for any of the other
time points most likely due to small sample sizes.
Signs of Toxicity
Common signs of toxicity, in general order of occurrence, among SAMW treatment
mallards included lateral head shaking, nasal discharge or oral mucus production, signs of
throat irritation, ataxia, signs of central nervous system (CNS) depression, increased
breathing rate with shallow breaths, and death (Table A.5). Additional, less common signs of
toxicity included regurgitation, subtle head and/or body shivering, coughing, and sneezing.
Fecal material from treatment mallards was usually viscous, dark green, and lacking visible
signs of urates (milky-white), while control mallards defecated clear and watery feces. None
of these signs were observed in any of the control mallards. In most cases, vigorous lateral
head shaking followed the first initial drinks. Oral mucus production was more common
than nasal discharge. Mucus was usually clear and colorless; however, there were some
instances of blue-green nasal discharge and/or oral mucus. Exaggerated swallowing behavior
in the absence of drinking was suggestive of throat irritation and mucus production.
Mallards that consumed enough SAMW to cause death showed all signs of toxicity through
ataxia, and six of seven treatment mortalities showed signs of CNS depression. Signs of
CNS depression included: reoccurring bouts of head dropping lasting 10-15 sec followed by
recovery, lack of response to auditory/visual/touch stimuli, additional head droop and wing
AMW Exposures in Birds Final Report - Part I Page 20
Report No. RWO55-T04-47-A February 15, 2007 Texas Tech University
droop, immobility, and/or closed eyelids. Seven of nine AMW treatment mallards died
within 98-661 minutes following initiation of dosing. Two SAMW treatment mallards, one
of each sex, survived exposure, presumably due to reduced consumption of SAMW. The
two surviving mallards were euthanized and necropsied either 27 or 33 hours post-dose. No
control mallards died prior to euthanasia at the termination of the study.
Mean percent body mass loss for control and treatment mallards following a 24-hr
dehydration period prior to AMW exposure was 6.02 ± 1.3 and 6.66 ± 1.9, respectively
(Table A.6). While a 24-hr dehydration period resulted in an approximately 6% loss of body
mass for both groups, the period from initiation of dosing to death resulted in a mean percent
body mass change of 0.68 ± 1.1 for controls and -6.15 ± 2.2 for treatment mallards. Overall
mean percent body mass loss of control and SAMW treatment mallards from a hydrated
condition to death was 5.38 ± 1.4 and 12.5 ± 2.3, respectively. Treatment period and overall
study duration mass losses were significantly greater in SAMW treated birds.
Clinical Chemistry and Hematocrit
Mean percent recoveries of 1:3 serum sample dilutions ranged from 93.6% to 105%
for all serum chemistry endpoints except for AST, which had a mean percent recovery of
115% (Table A.7). Mean percent recoveries of 1:4 serum sample dilutions ranged from
104% to 122% for all serum chemistry endpoints except for AST, which had a mean percent
recovery of 146%. Overall mean percent recoveries, calculated as the mean of all individual
percent recoveries from both 1:3 and 1:4 dilutions, ranged from 96.6% to 108% for all serum
chemistry endpoints except for AST, which had an overall mean percent recovery of 123%.
All serum samples collected from SAMW treatment mallards were mildly to moderately
hemolyzed, while control serum samples were not. Due to dilution-induced changes in some
endpoints, changes in clinical chemistries were not considered notable until at least 30%
elevated above or 20% depressed below control values. There was no apparent treatment-
related effect on total serum protein, albumin, globulin, or cholesterol (Table A.8). SAMW-
poisoned mallards had reduced mean serum levels of calcium, glucose, sodium, and chloride
in comparison to control and treatment survivor mallards. Slight hypocalcaemia was
observed in the 3 SAMW-poisoned mallards in comparison to both control and SAMW
treatment survivor mallards. Mean glucose levels were nearly 10-fold lower in poisoned
AMW Exposures in Birds Final Report - Part I Page 21
Report No. RWO55-T04-47-A February 15, 2007 Texas Tech University
mallards in comparison to survivor and control mallards, indicating severe hypoglycemia in
mallards that died from SAMW. Mean sodium and chloride levels were only slightly lower
(< 20%) in treatment mallards that died in comparison to both controls and treatment
survivors.
Increased mean serum levels of phosphorus, ALP, CK, AST, uric acid, and potassium
were observed in treatment mallards that died in comparison to both control and treatment
survivor mallards. While mean potassium levels of SAMW-poisoned birds were only
slightly elevated in comparison to controls, mean phosphorus, ALP, CK, AST, and uric acid
levels ranged from approximately 2-15 times higher in mallards that died compared to
controls. However, variability of these four endpoints for birds that died was relatively high
and exceeded that of controls, which was likely influenced by reduced serum sample sizes of
treatment mallards.
Mean hematocrit values from treatment mortalities were significantly higher than
those of controls (p < 0.001). Mean hematocrits from the two SAMW treatment survivors
were slightly elevated compared to controls, but lower than mean values from treatment
mortalities. There was also a significant negative correlation between hematocrit and time to
death (p=0.05; r=-0.75), with higher hematocrits coinciding with shorter times to death.
Pathology
Common grossly observable abnormalities in treated mallards included presence of
increased clear or blue-green mucus and associated discoloration of the mucosa of
esophagus, proventriculus, ventricular kaolin, and intestine. Clear or blue-green mucus was
also present in the proximal trachea and nasopharynx of SAMW-treated mallards. Other
abnormalities that were less common and more severe included petechial hemorrhages on the
serosal surface of the duodenum and localized ulcerations of the ventriculus, mostly along
the proventricular-ventricular junction, and duodenum. Reddening of the proventriculus, and
erosion and reddening of the mucosa of the proximal duodenum, were noted in seven
SAMW-treated birds. Similar lesions were absent in control birds.
Histopathologically, mild chronic portal hepatitis, mild to marked chronic heterophilic
tracheitis were observed both in treated and control mallards and were considered
background findings, unrelated to treatment. Minimal to mild splenic lymphoid necrosis
AMW Exposures in Birds Final Report - Part I Page 22
Report No. RWO55-T04-47-A February 15, 2007 Texas Tech University
was noted in five SAMW-treated birds and in two control birds. Lymphoid necrosis is often
a manifestation of stress in animals and is most likely a nonspecific effect. Increased
incidence in treated birds as compared to controls is most likely an indicator of increased
stress in treated birds.
Treatment-related histopathologic lesions were limited to esophagus, proventriculus,
ventriculus, and duodenum (Table A.9). Esophagus in four of seven treated birds exhibited
varying degrees of mucous gland ectasia with or without associated heterophilic
inflammation. Occasionally glands were obliterated by heterophilic inflammation and
necrosis. Condensed blue discoloration was often noted at the opening of the esophageal
glands on the mucosa. This condensed material was negative for calcium and copper by
special stains (VonKassa and Rhodanine methods, respectively). Its composition was
uncertain but it could represent coagulated mucous and or other precipitate from SAMW.
Compared to control birds, the proventricular mucosa of treated birds (9/9) was variably
eroded and denuded and covered by an amorphous layer of mucin and granular eosinophilic
material (interpreted as fibrin). Often, along the eroded epithelium there was basophilic
discoloration of the connective tissue scaffold suggesting mineralization. Additionally, there
was marked congestion with or without heterophilic inflammation in the lamina propria and
submucosa. The proventricular glands were within normal limits in treated and control
animals. A male mallard survivor consuming the lowest dose of SAMW represented the
most acute morphologic change in the proventricular mucosa. In this bird, individual or
small clusters of mucosal epithelial cells were degenerative to necrotic (as indicated by
cellular swelling, cytoplasmic eosinophilia and pyknosis) and in the process of being
sloughed. In other areas there was complete loss of mucosal epithelium and the denuded
connective tissue exhibited basophilic discoloration described above. In the two SAMW-
treatment survivors, there was an apparent attempt at re-epithelization of focally extensive
areas of the mucosa as suggested by lining of the mucosa by flattened epithelial cells as
compared to columnar cells in the controls.
Changes in the ventriculus were noted in eight of nine SAMW-treated and one of nine
control treated mallards (Table A.10). The changes in the control mallard included minimal
infiltrate of heterophils in the submucosa. In contrast, the changes in the treated mallards
were markedly more prominent and included a greater heterophilic response in the
AMW Exposures in Birds Final Report - Part I Page 23
Report No. RWO55-T04-47-A February 15, 2007 Texas Tech University
submucosa with degenerate heterophils extending into the kaolin layer of some birds. Also,
erosion or ulceration of the kaolin layer with subjacent congestion and hemorrhage were
noted in most treated mallards (7/9). It is important to note that the changes in the
ventriculus persisted while the proventriculus exhibited signs of repair in the SAMW-treated
survivors.
Changes in the small intestine were noted in six of nine SAMW mallards. Changes in the
small intestine included increase mucus and coagulated protein on the mucosal epithelial
surface of the jejunum, small intestine congestion and hemorrhaging, and one case of
coagulative necrosis in the duodenal lamina propria and denudation of the duodenal tips of
villi.
Examples of macroscopic changes in internal tissues are provided in the appendix.
Tissue Metal Residues
In general, tissues from SAMW-treated mallards tended to have elevated
concentrations of metals when compared to control mallards (Table A.11). Mean kidney
copper, zinc, magnesium, iron, and manganese concentrations were significantly higher in
SAMW-treatment mallards when compared to controls (p<0.05). Mean kidney copper
concentration were approximately 5 times higher in treatment mallards compared to controls,
and mean kidney manganese concentrations were approximately 3.5 times higher in
treatment mallards compared to controls. Mean blood copper, zinc, magnesium and iron
concentrations from SAMW mallards were significantly higher than control mallards, as well
(p<0.05). Blood copper levels were approximately 18 times higher in SAMW-treatment
birds when compared to controls, and SAMW mallard mean blood zinc levels were
approximately twice the mean of controls. There were no significant differences in liver
metal concentrations; however, mean liver copper concentrations were approximately 50%
higher in treatment mallards than those of controls. Bile concentrations of Cu and Mn in
SAMW-treated mallards were significantly higher than those from controls (p<0.05). In
general, the highest mean concentrations of Cu, Zn, Mg, and Fe were found in liver samples,
while bile samples contained the highest mean levels of Mn. Most of the tissue Al
concentrations in digested solutions, control and SAMW-treatment, fell below the lowest
analytical standard concentration of 0.05 mg/L (approximately 5ug/g tissue wt).
AMW Exposures in Birds Final Report - Part I Page 24
Report No. RWO55-T04-47-A February 15, 2007 Texas Tech University
Discussion
Results of the present study indicate the synthetic version of the acid mine tailings pond
water was highly toxic to mallards, with seven of nine mallards dying as quickly as 98
minutes following first exposure. Clinical, pathological, and tissue residue results from this
study are consistent with literature pertaining to acute metal toxicosis, especially copper, in
avian species. Time to death from other reports of copper or acid mine water-related
waterfowl mortalities (Stubblefield et al. 1997; Henderson and Winterfield, 1975) have been
similar to our findings, with birds being found in extremis or dead within 12-24 hrs following
first ad libitum exposure.
Most of the clinical signs of toxicity, which were suggestive of renal dysfunction, liver
damage, heart or muscle damage, potential biliary obstruction, dehydration, hemolysis,
and/or shock (Table 1), are similar with previous reports of acute copper or acid mine water
toxicosis in waterfowl (Stubblefield et al., 1997; ENSR, 1996). In addition to clinical signs
of metals toxicosis, pathological signs of metal-induced damage, particularly copper, were
observed in SAMW-treated mallards. Characteristic changes found in acute copper toxicosis
are hemorrhage or necrosis of the liver and kidney, proventricular and ventricular necrosis,
intestinal hemorrhage, elevated liver copper concentrations, and sometimes stomatitis
(Henderson and Winterfield, 1975; Pullar, 1940; Jensen et al., 1991). Mallards from our
studies demonstrated all of these changes with the exception of consistent liver and kidney
damage and stomatitis. Reduced exposure duration and sudden mortality were likely
responsible for the lack of stomatitis and kidney damage in our study. Based on the gross
pathology and histopathology findings, we assume that the majority of the toxicity of the
SAMW solution is related to the extremely high concentration of copper. Metal residues are
also a commonly used and reliable index of exposure in acute/peracute metal toxicosis.
While liver copper residues are commonly used as a reliable indicator of acute copper
toxicosis, results from this study indicated that blood or kidney copper levels may be more
sensitive indicators of acute copper toxicity in birds. All of the above signs of toxicity, with
a particular emphasis on uric acid, liver enzymes, hematocrit, GI pathology, and tissue metal
residues, are recommended for diagnosing AMW poisoning in birds.
While we recognize that the SAMW dosing solution used in this study had high
concentrations of several potentially toxic metals, and several metals were at elevated levels
AMW Exposures in Birds Final Report - Part I Page 25
Report No. RWO55-T04-47-A February 15, 2007 Texas Tech University
in more than one tissue in SAMW-treated mallards when compared to controls, we feel that
the tissue residue data do not reflect acutely toxic levels for any of the metals except copper.
For instance, mean liver and kidney Zn concentrations can range from 600-1100 µg/g dw and
1000-1700 µg/g dw, respectively, in zinc-poisoned mallards (Gasaway and Buss, 1972).
Mean liver and kidney Zn concentrations from mallards in our study were 60.3 and 27.9 µg/g
ww, or approximately 201 and 93 µg/g dw assuming 70% moisture, which are similar to
reported control mallard liver and kidney Zn concentration (Gasaway and Buss, 1972).
Conversely, a 970 mg dose of Zn shot in form of eight shot pellets containing 98% Zn
resulted in mortality, incoordination, paralysis, anemia, macroscopic lesions in the cecum,
intestine, gizzard, and liver, increased leukocyte counts, and alterations in liver enzyme, uric
acid, phosphorus, glucose, calcium and total protein levels (Levengood et al., 2000).
Another common sign of zinc-intoxication is pancreatitis (Sileo et al., 2004), which was not
observed in Study A. While it is likely that zinc in the SAMW added to the overall toxicity,
it is unlikely, based on the rapid progression to death and Zn tissue concentrations, that
mallards in Study A were poisoned by Zn.
The lowest lethal dose of copper in mallards is noted to be 600 mg/kg (EXTOXNET,
1996). Another report indicates the dose required to produce mortality in adult mallards is
400 mg/kg (Pullar, 1940). As both of these cited doses are for copper sulfate, of which 40%
is actually copper, their dose in copper alone is 240 and 160 mg/kg, respectively. Based on
the geometric mean of these two values, 196 mg/kg, all seven of the lethally-treated AMW
mallards consumed above the lowest lethal dose, as did one of the survivors (Table A.2).
The average AMW consumption rate in the first 20 minutes was approximately 80 mL/kg/hr,
which indicates there could be a high potential for acute mortality in a very short period of
time in birds that are willing to drink AMW with such high concentrations of toxic metals.
Based on the findings from Study A, we conclude that acid metalliferous water bodies
with similar chemical composition and acidity as SAMW pose a significant hazard to birds
that come in contact with them. SAMW-treated mallards drink less water, on a time interval
basis and overall, compared to control mallards. Despite reduced water consumption of
SAMW-treated mallards, doses of SAMW were still sufficient to cause mortality and
significant alterations in blood chemistry parameters and gastrointestinal pathology.
AMW Exposures in Birds Final Report - Part I Page 26
Report No. RWO55-T04-47-A February 15, 2007 Texas Tech University
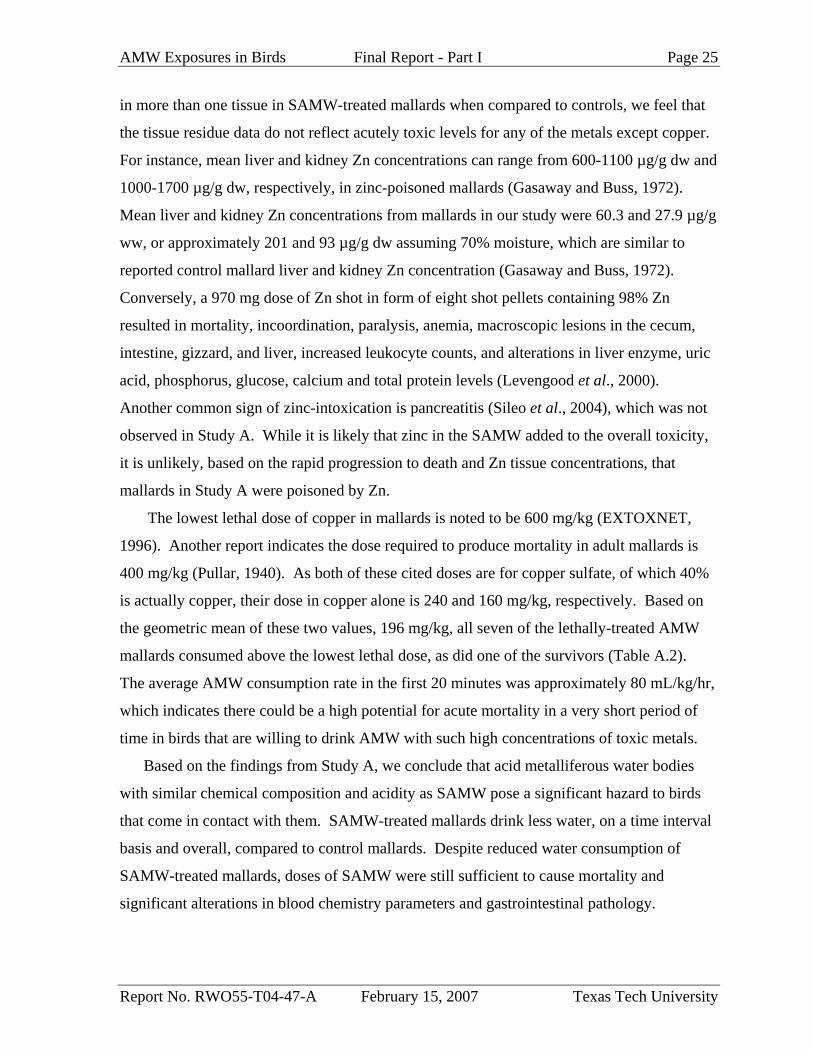
Table A.1. Concentrations of metals from mine-associated AMW, synthetic AMW dosing solution, and RO water analyzed by flame/furnace atomic absorption spectroscopy (AAS) and inductively-coupled plasma atomic emission spectroscopy (ICP-AES).
Element Data from USFWS AMW investigation (mg/L at pH = 2)*
Measured Concentrations from
Synthetic AMW (mg/L at pH = 2)
RO water (mg/L)
Cu 5840 5943 6.6
Al 3436 3718 3.5
Zn 2010 2071 2.3
Mg 1680 1596 1.8
Fe 1350 1351 1.2
Mn 738 746 <0.5
Ca 400 493 <0.1
Cd 21.9 22.2 <0.5
Co 21.7 21.8 <0.5
Na 12.4 17.3 0.1
Ni 10 10.8 <0.5
Cr 4.2 4.8 <0.02
Se 0.534 0.639 <0.01
V 0.385 0.352 <0.01
As 0.250 0.344 <0.01
* Data from Stratus Consulting, Inc. 2003. AMW samples from mine site collected on Sept. 12, 2000.
AMW Exposures in Birds Final Report - Part I Page 27
Report No. RWO55-T04-47-A February 15, 2007 Texas Tech University
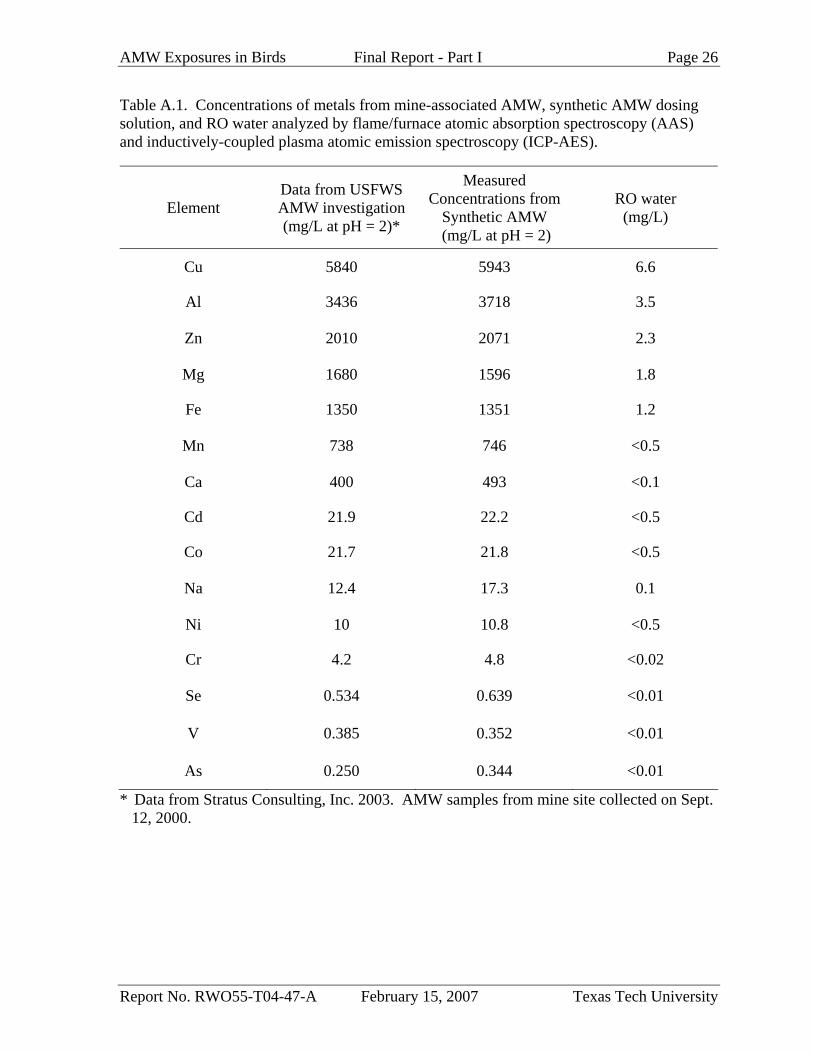
Table A.2. Total synthetic acid metalliferous water and estimated metal component doses among SAMW treatment birds.
SAMW Consumption Estimated Dose (mg/kg body mass)
Mallard ID (ml/kg body mass) Cu Al Zn Mg Fe Mn
M-3 270.1 1605 1004 559 431 365 202
M-1 150.0 891 558 311 239 203 112
F-1 139.8 831 520 290 223 189 104
F-4 108.5 645 403 225 173 147 80.9
M-5 75.9 451 282 157 121 103 56.6
F-3 71.8 427 95.2 149 115 97.0 53.5
M-2 52.4 311 195 109 83.6 70.8 39.1
F-2a 40.0 238 149 83 64 54 29.9
M-4a 25.6 152 95.2 53.0 40.9 34.6 19.1 a Survivor
AMW Exposures in Birds Final Report - Part I Page 28
Report No. RWO55-T04-47-A February 15, 2007 Texas Tech University
Mallard Water Consumption Rates: Acute Toxicity Study A
0
50
100
150
200
0.33 0.67 1 2 3
0.33 0.33 0.33 1 1
Study Duration: Top No. - Cummulative hrs at end of time step Bottom No. - Duration of time step (hr)
Drin
king
Rat
e (m
L/(k
g*hr
)) Control AMW
Mallard Water Consumption Totals: Acute Toxicity Study A
0
20
40
60
80
100
120
0.33 0.67 1 2 3
0.33 0.33 0.33 1 1
Study Duration: Top No. - Cummulative hrs at end of time step Bottom No. - Duration of time step (hr)
Wat
er C
onsu
mpt
ion
(mL/
kg b
ody
wei
ght)
Control AMW
A B Figure A.1. Water consumption rates (A) and totals (B) for mallard ducks provided either clean water or synthetic AMW. Values are mean + SD for bars and error bars, respectively. N = 9 for each bar. In both graphs, control and treatment groups differed significantly (p < 0.05) at all time points from 0.33 through three hours. See Tables A.3 and A.4 for within-group comparisons.
AMW Exposures in Birds Final Report - Part I Page 29
Report No. RWO55-T04-47-A February 15, 2007 Texas Tech University
Table A.3. Mallard duck water consumption rates. Water consumption rate data was collected after the 3rd hour, however SAMW mallard sample sizes decreased over time after the 3rd hour. These data correspond to those demonstrated in Figure A.1.A. N = 9 for each value. Letters indicate within group differences and asterisks indicate between group differences for each time step.
Study Duration At End of Time Step Water Consumption Rates [mL/(kg*hr)] Time Step Duration Control SAMW
(Hr) (Hr) Mean SD Mean SD 0.33 0.33 175.3 *a 42.2 81.1a 49.8 0.67 0.33 104.0 *ab 70.2 45.9ab 42.7
1 0.33 82.7 *b 36.8 38.8ab 39.0 2 1 59.8 *b 28.1 21.2ab 22.0 3 1 63.1 *b 44.5 15.9b 32.3
Table A.4. Mallard duck water consumption totals. Water consumption data was collected after the 3rd hour, however SAMW mallard sample sizes decreased over time after the 3rd hour. These data correspond to those demonstrated in Figure A.1.B. N = 9 for each value. Letters indicated within group differences and asterisks indicate between group differences for each time step.
Study Duration At End of Time Step Water Consumption Totals [mL/kg] Time Step Duration Control AMW
(Hr) (Hr) Mean SD Mean SD 0.33 0.33 58.1 * 13.1 26.8 16.4 0.67 0.33 34.4 * 21.8 15.2 14.1
1 0.33 27.3 * 11.5 12.8 12.9 1st hr total 1 120 *a 42.8 57.5a 38.4
2 1 60.1 *b 26.8 21.2ab 22.0 3 1 63.4 *b 42.0 15.9b 32.3
AMW Exposures in Birds Final Report - Part I Page 30
Report No. RWO55-T04-47-A February 15, 2007 Texas Tech University
Table A.5. Signs of toxicity and associated means and ranges of times to signs of toxicity among SAMW-dosed mallards. Data are presented only for birds that demonstrated each specific sign.
Time (min) to Signs of Toxicity Among SAMW-Exposed Mallards
Statistical Measure Head Shaking
Nasal Discharge/
Mucus
Throat Irritation Ataxia
CNS Depression/
Dazed
Breathing Change Death
Mean Time * (N) 11 (9) 45 (9) 50 (9) 117 (7) 259 (6) 183 (5) 305 (7)
Range of Times (min) 0 - 52 9 - 106 10 - 175 31 - 252 86 - 652 86 - 350 98 - 661
* Two of nine mallards survived exposure due to reduced AMW consumption and are not included in the calculation of mean time to death. Number of mallards showing signs is in parentheses.
AMW Exposures in Birds Final Report - Part I Page 31
Report No. RWO55-T04-47-A February 15, 2007 Texas Tech University
Table A.6. Mean (SD) percent body mass change of control and SAMW treatment mallards from study A. N = 9 for both groups except when noted otherwise.
Percent Body Mass Change [Mean (SD)]
Time Period Control SAMW
Hydrated Condition To 24-Hr Into Dehydration
(-24 hr to 0 hr) -6.02 (1.3) -6.66 (1.9)
Initiation Of Dosing To Death 0.68 (1.1)** -6.15 (2.2)*
Hydrated Condition To Death -5.38 (1.4)** -12.5 (2.3)*
* N = 7 ** Significantly different than paired treatment mean by t-test at p < 0.001.
AMW Exposures in Birds Final Report - Part I Page 32
Report No. RWO55-T04-47-A February 15, 2007 Texas Tech University
Table A.7. Comparison of serum clinical chemistry results from undiluted, 1:3, and 1:4 diluted serum samples from control mallards.
Note: Serum volumes from each mallard were not sufficient for analysis of both dilutions. * Calculated as the mean of all individual percent recoveries from both 1:3 and 1:4 dilutions.
Mean conc. ± 2 SD Mean conc. ± 2 SD
Parameter Undiluted (n = 8)
1:3 dilution (n = 6)
Mean Recovery 1:4 dilution
(n = 2) Mean
Recovery Overall Mean
Recovery*
Total Serum Protein (g/dl) 4.24 ± 0.64 4.14 ± 0.90 98.06% 4.89 ± 0.87 114.0% 102.1%
Albumin (g/dl) 2.22 ± 0.31 2.25 ± 0.42 100.9% 2.63 ± 0.49 119.5% 105.5%
Globulin (g/dl) 2.02 ± 0.41 1.87 ± 0.41 93.61% 2.25 ± 0.71 107.0% 96.95%
Calcium (mg/dl) 12.2 ± 0.98 11.9 ± 1.52 97.19% 13.3 ± 0.71 110.3% 100.5%
Phosphorus (mg/dl) 7.53 ± 4.70 8.04 ± 4.99 99.54% 7.28 ± 4.03 122.1% 105.2%
Glucose (mg/dl) 243 ± 145 262 ± 179 102.1% 244 ± 143 117.3% 105.9%
Alkaline Phosphatase (U/l) 112 ± 157 120 ± 152 101.6% 76.0 ± 49.5 108.8% 103.4%
Creatine Kinase (U/l) 1080 ± 1751 1283 ± 2259 104.7% 896 ± 245 118.0% 108.0%
Aspartate Aminotransferase (U/l) 36.2 ± 25.2 45.3 ± 34.6 115.4% 40.0 ± 0.00 145.8% 123.0%
Uric Acid (mg/dl) 5.42 ± 2.54 5.29 ± 2.68 94.11% 5.30 ± 5.37 104.3% 96.64%
Cholesterol (mg/dl) 308 ± 94.7 310 ± 105 99.19% 337 ± 77.8 114.2% 103.0%
Sodium (meq/l) 152 ± 14.3 156 ± 4.97 102.2% 177 ± 8.49 118.8% 106.4%
Potassium (meq/l) 7.32 ± 8.32 7.45 ± 9.31 96.29% 6.90 ± 6.08 110.9% 99.94%
Chloride (meq/l) 103 ± 4.89 99.8 ± 5.25 95.85% 113 ± 2.83 110.0% 99.39%
AMW Exposures in Birds Final Report - Part I Page 33
Report No. RWO55-T04-47-A February 15, 2007 Texas Tech University
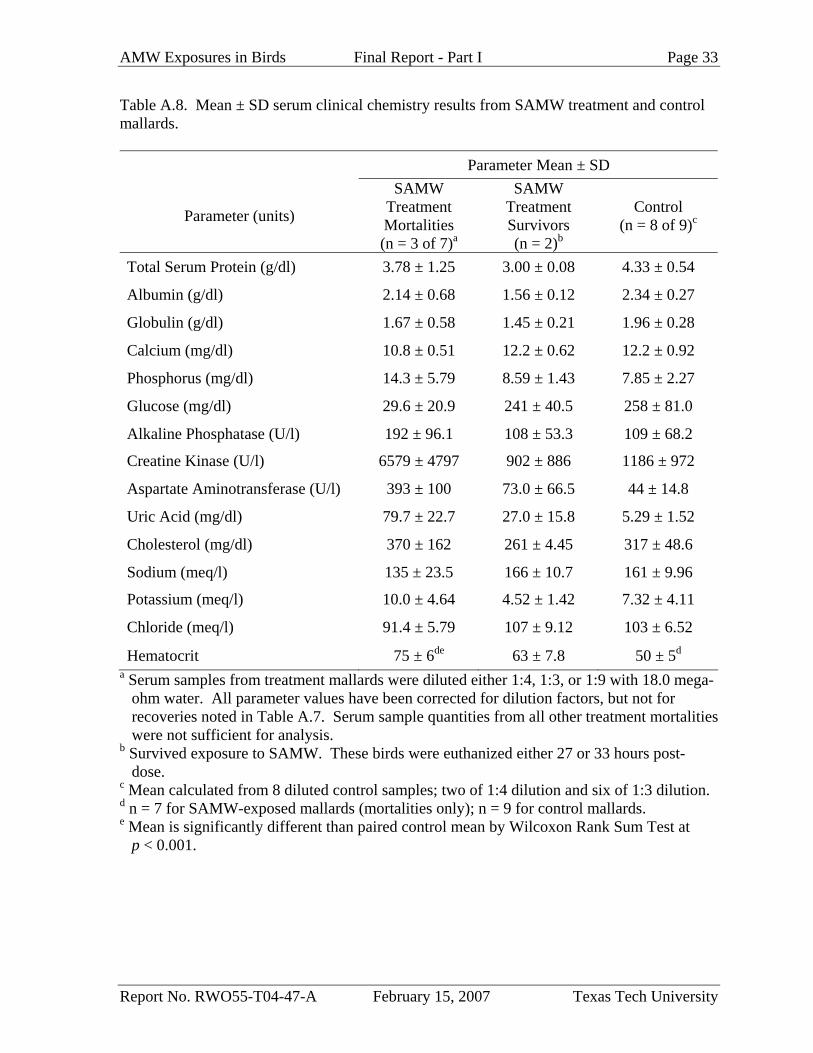
Table A.8. Mean ± SD serum clinical chemistry results from SAMW treatment and control mallards.
Parameter Mean ± SD
Parameter (units)
SAMW Treatment Mortalities (n = 3 of 7)a
SAMW Treatment Survivors (n = 2)b
Control (n = 8 of 9)c
Total Serum Protein (g/dl) 3.78 ± 1.25 3.00 ± 0.08 4.33 ± 0.54
Albumin (g/dl) 2.14 ± 0.68 1.56 ± 0.12 2.34 ± 0.27
Globulin (g/dl) 1.67 ± 0.58 1.45 ± 0.21 1.96 ± 0.28
Calcium (mg/dl) 10.8 ± 0.51 12.2 ± 0.62 12.2 ± 0.92
Phosphorus (mg/dl) 14.3 ± 5.79 8.59 ± 1.43 7.85 ± 2.27
Glucose (mg/dl) 29.6 ± 20.9 241 ± 40.5 258 ± 81.0
Alkaline Phosphatase (U/l) 192 ± 96.1 108 ± 53.3 109 ± 68.2
Creatine Kinase (U/l) 6579 ± 4797 902 ± 886 1186 ± 972
Aspartate Aminotransferase (U/l) 393 ± 100 73.0 ± 66.5 44 ± 14.8
Uric Acid (mg/dl) 79.7 ± 22.7 27.0 ± 15.8 5.29 ± 1.52
Cholesterol (mg/dl) 370 ± 162 261 ± 4.45 317 ± 48.6
Sodium (meq/l) 135 ± 23.5 166 ± 10.7 161 ± 9.96
Potassium (meq/l) 10.0 ± 4.64 4.52 ± 1.42 7.32 ± 4.11
Chloride (meq/l) 91.4 ± 5.79 107 ± 9.12 103 ± 6.52
Hematocrit 75 ± 6de 63 ± 7.8 50 ± 5d
a Serum samples from treatment mallards were diluted either 1:4, 1:3, or 1:9 with 18.0 mega-ohm water. All parameter values have been corrected for dilution factors, but not for recoveries noted in Table A.7. Serum sample quantities from all other treatment mortalities were not sufficient for analysis.
b Survived exposure to SAMW. These birds were euthanized either 27 or 33 hours post-dose.
c Mean calculated from 8 diluted control samples; two of 1:4 dilution and six of 1:3 dilution. d n = 7 for SAMW-exposed mallards (mortalities only); n = 9 for control mallards. e Mean is significantly different than paired control mean by Wilcoxon Rank Sum Test at
p < 0.001.
AMW Exposures in Birds Final Report - Part I Page 34
Report No. RWO55-T04-47-A February 15, 2007 Texas Tech University
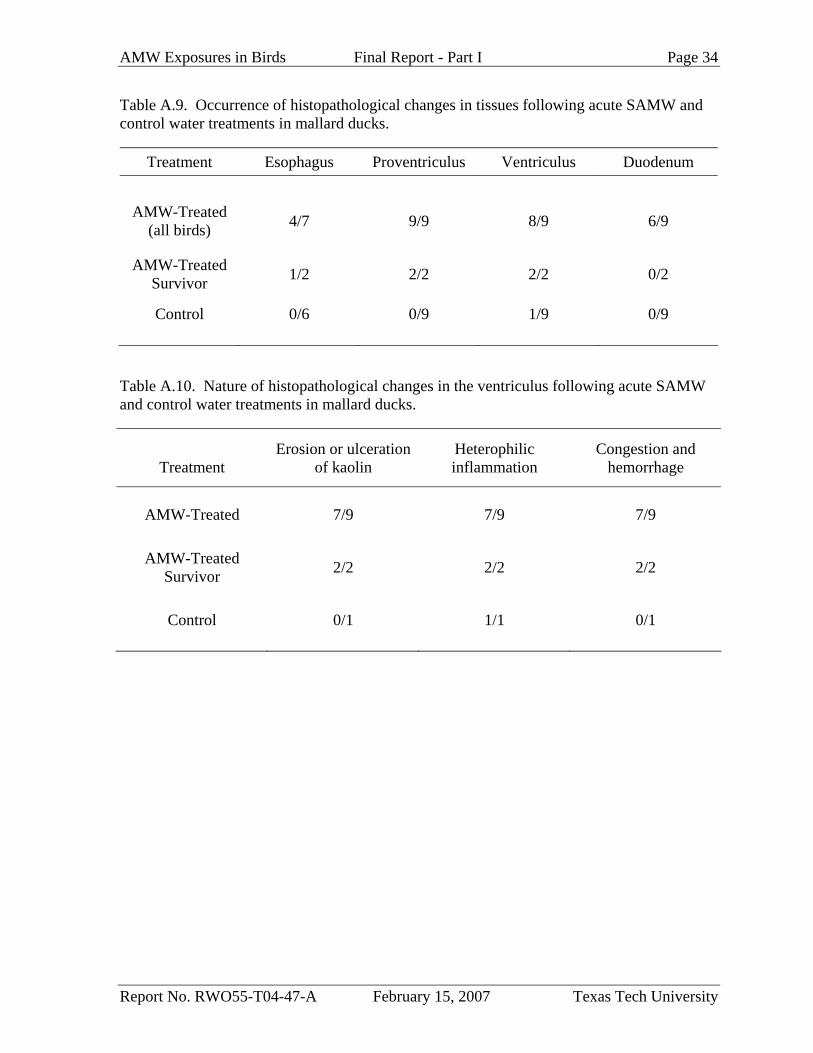
Table A.9. Occurrence of histopathological changes in tissues following acute SAMW and control water treatments in mallard ducks.
Treatment Esophagus Proventriculus Ventriculus Duodenum
AMW-Treated (all birds) 4/7 9/9 8/9 6/9
AMW-Treated Survivor 1/2 2/2 2/2 0/2
Control 0/6 0/9 1/9 0/9
Table A.10. Nature of histopathological changes in the ventriculus following acute SAMW and control water treatments in mallard ducks.
Treatment
Erosion or ulceration of kaolin
Heterophilic inflammation
Congestion and hemorrhage
AMW-Treated 7/9 7/9 7/9
AMW-Treated Survivor 2/2 2/2 2/2
Control 0/1 1/1 0/1
AMW Exposures in Birds Final Report - Part I Page 35
Report No. RWO55-T04-47-A February 15, 2007 Texas Tech University
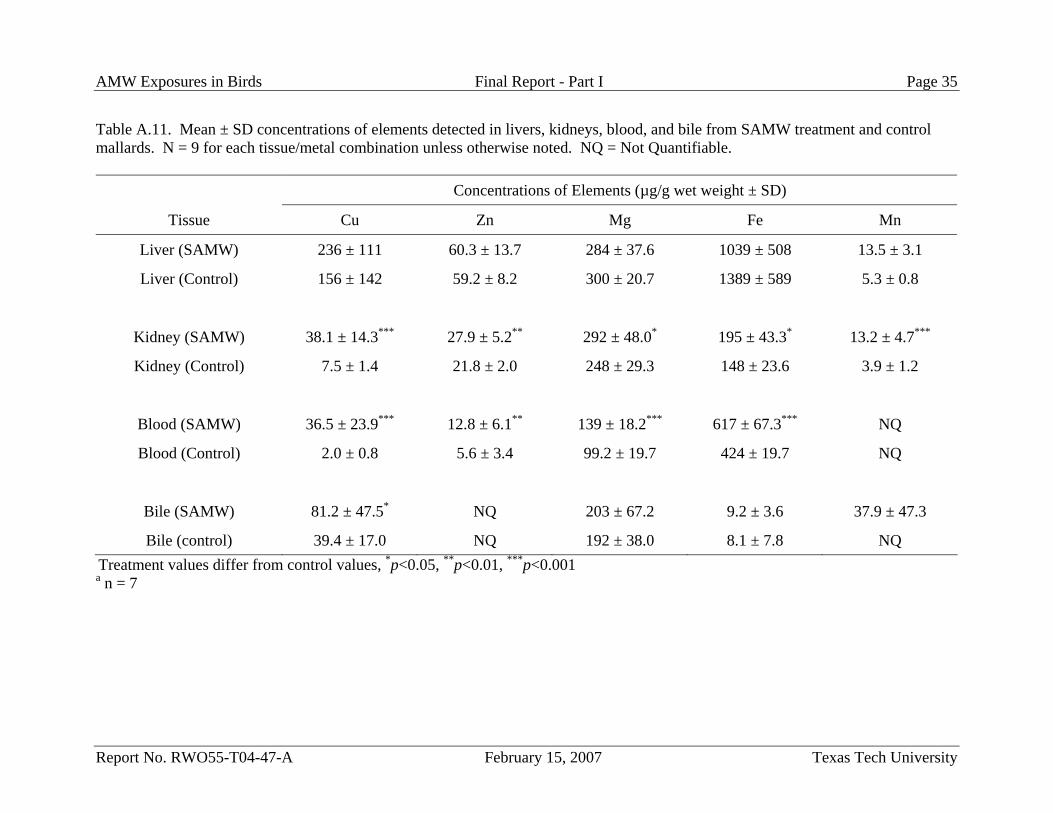
Table A.11. Mean ± SD concentrations of elements detected in livers, kidneys, blood, and bile from SAMW treatment and control mallards. N = 9 for each tissue/metal combination unless otherwise noted. NQ = Not Quantifiable.
Concentrations of Elements (µg/g wet weight ± SD)
Tissue Cu Zn Mg Fe Mn
Liver (SAMW) 236 ± 111 60.3 ± 13.7 284 ± 37.6 1039 ± 508 13.5 ± 3.1
Liver (Control) 156 ± 142 59.2 ± 8.2 300 ± 20.7 1389 ± 589 5.3 ± 0.8
Kidney (SAMW) 38.1 ± 14.3*** 27.9 ± 5.2** 292 ± 48.0* 195 ± 43.3* 13.2 ± 4.7***
Kidney (Control) 7.5 ± 1.4 21.8 ± 2.0 248 ± 29.3 148 ± 23.6 3.9 ± 1.2
Blood (SAMW) 36.5 ± 23.9*** 12.8 ± 6.1** 139 ± 18.2*** 617 ± 67.3*** NQ
Blood (Control) 2.0 ± 0.8 5.6 ± 3.4 99.2 ± 19.7 424 ± 19.7 NQ
Bile (SAMW) 81.2 ± 47.5* NQ 203 ± 67.2 9.2 ± 3.6 37.9 ± 47.3
Bile (control) 39.4 ± 17.0 NQ 192 ± 38.0 8.1 ± 7.8 NQ Treatment values differ from control values, *p<0.05, **p<0.01, ***p<0.001 a n = 7
AMW Exposures in Birds Final Report - Part I Page 36
Report No. RWO55-T04-47-A February 15, 2007 Texas Tech University
Study B: Acute Toxicity of Neutralized Synthetic Acid Mine Water to Mallards
Introduction
One of the remediation techniques used on acid metalliferous water sources, such as
tailings ponds, is the addition of lime to neutralize the acidic character and reduce dissolved
metal content. Such a remediation technique may reduce the toxicity of AMW to avian
species. Our goal in Study B was to assess the potential for alleviation of AMW’s avian
toxic effects by neutralizing its acidic character with lime.
Methods
Neutralized AMW Dosing Solution Preparation
Reagents for the preparation of the dosing solution included 95% CaOH (lime) and
AMW that was synthesized in study A. Two 21-L batches of neutralized AMW (NAMW)
were formulated and then mixed together into one 42-L batch. The first batch was prepared
by adding 540.2 g of lime to 21-L of AMW in a large carboy. The solution was stirred
periodically with a mixer while adding lime to the AMW solution. The pH of the mixed
solution was 6.97 three days after being formulated. The second batch was prepared in the
same manner, however 504.9 g of lime was added to the AMW solution. Both NAMW
batches were combined to formulate approximately 42 L of the dosing solution. The NAMW
solution contained a light green precipitate layer and a clear colorless aqueous layer when
unstirred. A total of 1098 g of lime was added to the 42 liters of NAMW solution to adjust it
to a pH of 7.21 on the first dosing day. The pH of the dosing solution gradually increased
over an eight-day period (time from beginning of study to end of study) from 7.21 to 7.38
(Table B.1). Concentrations of elements in the aqueous layer of NAMW were measured by
ICP-AES (Table B.2).
Study Design
Eighteen 22-24 week-old mallards of mixed sex were commercially obtained (see Study
A) and transported to the Texas Tech University Animal Care Resources Center. Birds were
banded and maintained in 2.5 ft3 stainless steel rabbit cages at 20°C, 40-70% relative
humidity, and 12h:12h light:dark photoperiod. Ducks had ad libitum access to feed (Mazuri
AMW Exposures in Birds Final Report - Part I Page 37
Report No. RWO55-T04-47-A February 15, 2007 Texas Tech University
waterfowl maintenance diet in pellet form; PMI Nutritional, LLC, Brentwood, MO, USA)
and tap water. All mallards were allowed 2 weeks to acclimate to indoor, caged conditions
prior to initiation of testing, with their body weight near or exceeding that recorded upon
receipt into the animal facility. All animal care was performed in accordance with the Texas
Tech University ACRC and the Institutional Animal Care and Use Committee.
The study was performed during a 48-hr test period with nine control and nine NAMW
treatment mallards. Three groups of six mallards were used in this study in order to facilitate
reasonable timing of necropsies. A total of three females and three males were used in each
48-hr test. The first group was tested from November 12 – 14, 2005, the second group from
November 13 – 15, 2005, and the third group from November 19 – 21, 2005. All mallards
were fasted and dehydrated for 24 hrs prior to initiation of the dosing study. The NAMW
dosing solution and tap water were presented to treatment and control mallards, respectively,
in semicircular plastic bowls with an approximate volume of 350 mL. Bowls were used in
this study instead of bottles to simulate field conditions in which birds would likely agitate
metal precipitates in the sediment, and therefore receive an oral dose of AMW reflective of
both the precipitate in addition to the aqueous solution. The drinking apparatus used in study
A would not allow this type of drinking scenario. Control mallards received tap water
instead of RO water to serve as a clean water source that is more representative of a natural
clean water source for wild birds. Tap water was provided to control mallards for the
remaining studies as well. Bowls were filled with approximately 300 mL of either NAMW or
tap water at the initiation of dosing as well as when bowls needed to be re-filled. NAMW
and sediments were mixed with an electric mixer during transfer from the stock solution
container into individual plastic bowls. All mallards were allowed ad libitum access to
NAMW, and water consumption data were not collected during the study, as the plastic
bowls were not amenable to water wastage data collection. Animals were observed
periodically throughout exposure duration and behavioral observations were collected. Food
was withheld during the entire study period for all control and treatment mallards.
Animal Euthanasia and Sample Collection
Treatment and control birds were euthanized following 48 hrs access to either NAMW or
tap water. All birds were allowed access to their designated water type until time of death.
AMW Exposures in Birds Final Report - Part I Page 38
Report No. RWO55-T04-47-A February 15, 2007 Texas Tech University
Birds were euthanized by carbon dioxide asphyxiation. Blood was collected using cardiac
puncture with 1 mL syringes. Whole blood was placed in 5 mL serum separator tubes for
serum clinical chemistry, 2 ml microcentrifuge tubes for metal residues, and microhematocrit
tubes for determination of erythrocyte PCV. Whole blood in serum separator tubes was
allowed to clot at room temperature for 30 minutes and then centrifuged at 6,000 rpm for 10
minutes. Serum was decanted into 2-ml microcentrifuge tubes and frozen at -80°C until
being shipped for analysis. Serum samples were analyzed with a Hitachi 911 Analyzer at
TVMDL for total serum protein, albumin, globulins, calcium, phosphorus, glucose, CK,
AST, uric acid, cholesterol, ALP, and electrolytes.
Gross pathological lesions were documented, and tissues were collected for both metal
and histopathological analyses for all birds. Sections of right lung, right testis or ovaries,
right kidney, salt gland, spleen, liver, pancreas, brain, tongue, esophagus, trachea, heart,
proventriculus, ventriculus, duodenum, jejunum, ileum, ceca, and large intestine were fixed
in 10% buffered formalin. Histopathology samples have been stored for possible analysis at
a future date.
Statistical Methods
Measures of central tendency are expressed as the mean ± standard deviation. All data
analyzed using parametric methods were tested for normality and homogeneity of variances.
When the assumptions of parametric tests were not met, data were reanalyzed after log
transformation or analyzed using non-parametric methods. Body mass dynamics were
analyzed using t-tests. Serum clinical chemistry endpoints and hematocrit were analyzed
using either t-tests or Wilcoxon Rank Sum tests. All statistical analyses were performed with
R (version 2.2.0 ; R Foundation, Vienna, Austria). Results of statistical tests were considered
to be significant at p < 0.05.
Results
Signs of Toxicity
There were no mortality events during the study. Sublethal effects included mild
dehydration, body mass loss, lethargy, and subtle shivering in NAMW mallards. Other
common signs of toxicity in NAMW mallards included mild to vigorous lateral head shaking,
AMW Exposures in Birds Final Report - Part I Page 39
Report No. RWO55-T04-47-A February 15, 2007 Texas Tech University
production of oral mucus, and gular fluttering. Less common signs of toxicity included
subtle shivering and regurgitation. These signs of toxicity were absent in control birds.
Nonetheless, all birds appeared to be in relatively good health at the time of euthanasia.
Both treatment groups lost approximately 5% body mass from the period 24-hrs prior to
dose to the initiation of dose (Table B.3). NAMW mallards lost significantly more mass than
control mallards from the periods from initiation of dosing to death (0 hr to 48 hr), as well as
the period from hydrated condition to death (-24 hrs to 48 hrs). NAMW treatment mallards
lost approximately 17% of body mass from the time of initiation of dose to completion of
study, nearly twice that amount lost by controls.
Clinical Chemistry and Hematocrit
NAMW treatment mallards had significantly lower mean levels of serum total protein,
albumin, and globulin in comparison to controls (p < 0.05; Table B.4). NAMW treatment
mallards had elevated mean serum levels of phosphorus (p < 0.05), glucose (p < 0.001),
alkaline phosphatase (p < 0.05), and uric acid (p < 0.01) when compared to control mallards.
Electrolytes (sodium, potassium, and chloride) were also significantly elevated when
compared to control mallards (p < 0.001). Mean serum uric acid levels and alkaline
phosphatase levels were nearly 3.5 and 2 times higher, respectively, in NAMW treatment
mallards when compared to control mallards.
Mean hematocrit levels from NAMW mallards were significantly higher than control
hematocrit levels (p < 0.001). Mean hematocrits from NAMW mallards were approximately
23% higher than mean control hematocrit values.
Gross Pathology
Gross abnormalities in the oral cavity and esophagus of NAMW mallards included
discoloration of the mucosal surface of the esophagus (light brown) and the presence of small
to large amounts of yellow-green NAMW precipitate. There was a single case of NAMW
precipitate in the proximal trachea of a NAMW treatment mallard. Proventricular lesions
ranged from mild to severe reddening of the mucosal surface and inflammation. The most
severe lesions were present in the ventriculus with abnormalities including discoloration
(blue-green vs. yellow-green of controls) and ulcerations or mild to moderate erosion of the
AMW Exposures in Birds Final Report - Part I Page 40
Report No. RWO55-T04-47-A February 15, 2007 Texas Tech University
kaolin. Duodenal and lower gastrointestinal contents of some NAMW birds were light green
and similar in color and viscosity to the NAMW dosing solution, however no abnormalities
were noted on the mucosal surfaces of these tissues.
Examples of macroscopic changes in internal tissues are provided in the appendix.
Discussion
The synthetic NAMW dosing solution tested in this study was mildly toxic to mallards.
Gross lesions were generally mild to moderate and limited to the proventriculus and
ventriculus in NAMW treated mallards following a 48-hr exposure period. Alterations in
serum biochemistry parameters indicate that the NAMW has an effect on liver and kidney
function, regulation of protein homeostasis, and electrolyte balance. Mallards were less
averse to NAMW than SAMW and were observed using typical waterfowl filter-feeding
behavior. Mallards do not only ingest water from the aqueous layer of NAMW, but also sift
through the entire mixture and ingest precipitated metals.
Liming the acid metalliferous water source effectively reduced dissolved metal levels,
however, the process ultimately increased precipitated levels of metals. Such practices on
metal mining and processing sites may ultimately decrease the toxicity of acid metalliferous
water to wildlife, but likely do not eliminate risk of injury. This study demonstrated that
birds can accumulate metal sediments in their upper gastrointestinal tract. These metals can
ultimately damage tissues and alter biochemical processes.
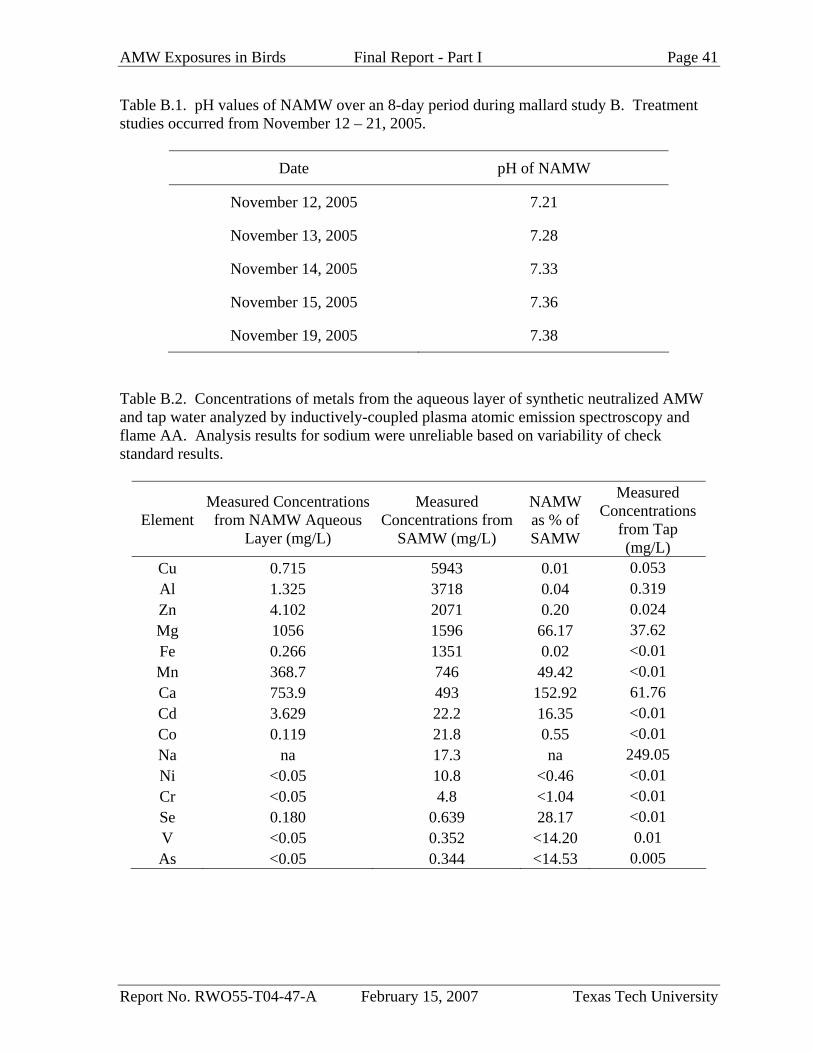
AMW Exposures in Birds Final Report - Part I Page 41
Report No. RWO55-T04-47-A February 15, 2007 Texas Tech University
Table B.1. pH values of NAMW over an 8-day period during mallard study B. Treatment studies occurred from November 12 – 21, 2005.
Date pH of NAMW
November 12, 2005 7.21
November 13, 2005 7.28
November 14, 2005 7.33
November 15, 2005 7.36
November 19, 2005 7.38
Table B.2. Concentrations of metals from the aqueous layer of synthetic neutralized AMW and tap water analyzed by inductively-coupled plasma atomic emission spectroscopy and flame AA. Analysis results for sodium were unreliable based on variability of check standard results.
Element Measured Concentrations from NAMW Aqueous
Layer (mg/L)
Measured Concentrations from
SAMW (mg/L)
NAMW as % of SAMW
Measured Concentrations
from Tap (mg/L)
Cu 0.715 5943 0.01 0.053 Al 1.325 3718 0.04 0.319 Zn 4.102 2071 0.20 0.024 Mg 1056 1596 66.17 37.62 Fe 0.266 1351 0.02 <0.01 Mn 368.7 746 49.42 <0.01 Ca 753.9 493 152.92 61.76 Cd 3.629 22.2 16.35 <0.01 Co 0.119 21.8 0.55 <0.01 Na na 17.3 na 249.05 Ni <0.05 10.8 <0.46 <0.01 Cr <0.05 4.8 <1.04 <0.01 Se 0.180 0.639 28.17 <0.01 V <0.05 0.352 <14.20 0.01 As <0.05 0.344 <14.53 0.005
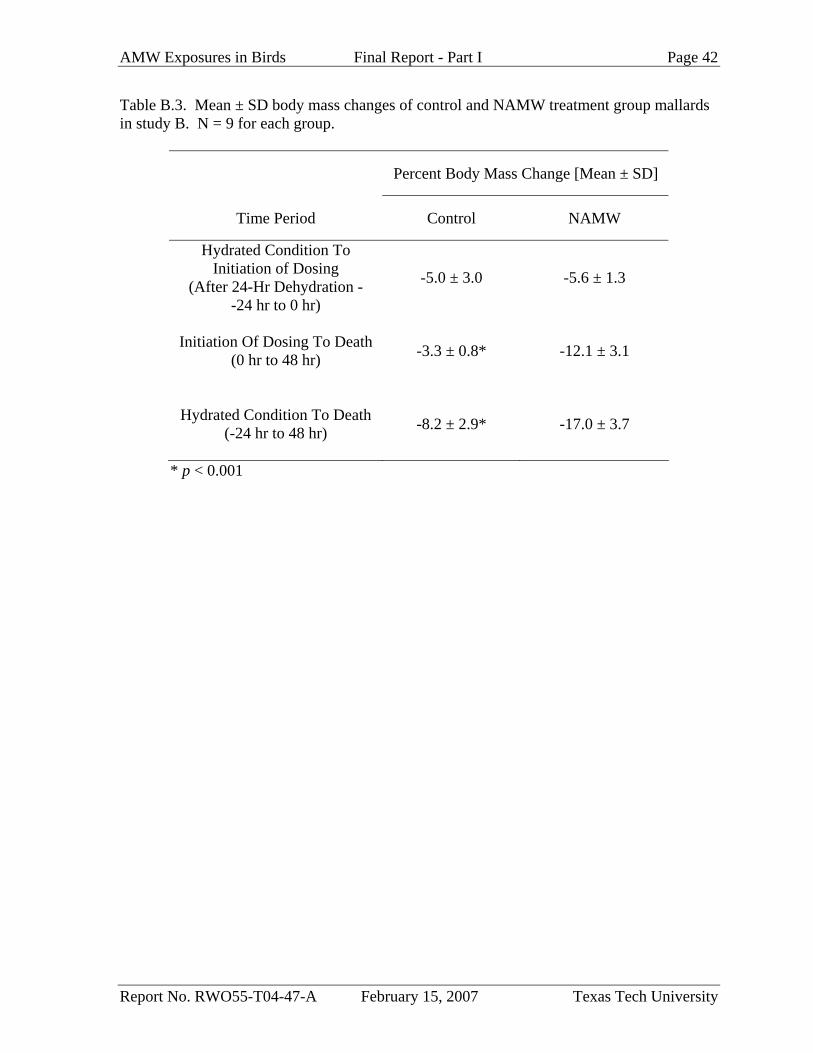
AMW Exposures in Birds Final Report - Part I Page 42
Report No. RWO55-T04-47-A February 15, 2007 Texas Tech University
Table B.3. Mean ± SD body mass changes of control and NAMW treatment group mallards in study B. N = 9 for each group.
Percent Body Mass Change [Mean ± SD]
Time Period Control NAMW
Hydrated Condition To Initiation of Dosing
(After 24-Hr Dehydration - -24 hr to 0 hr)
-5.0 ± 3.0 -5.6 ± 1.3
Initiation Of Dosing To Death (0 hr to 48 hr) -3.3 ± 0.8* -12.1 ± 3.1
Hydrated Condition To Death (-24 hr to 48 hr) -8.2 ± 2.9* -17.0 ± 3.7
* p < 0.001
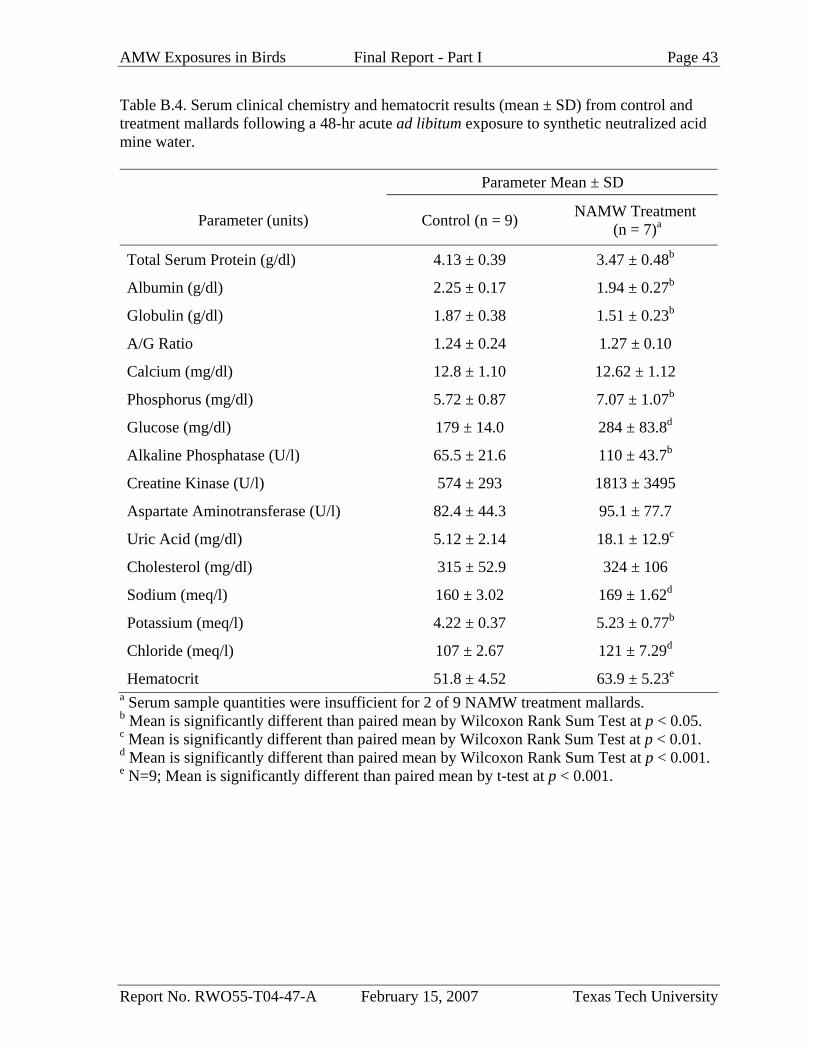
AMW Exposures in Birds Final Report - Part I Page 43
Report No. RWO55-T04-47-A February 15, 2007 Texas Tech University
Table B.4. Serum clinical chemistry and hematocrit results (mean ± SD) from control and treatment mallards following a 48-hr acute ad libitum exposure to synthetic neutralized acid mine water.
Parameter Mean ± SD
Parameter (units) Control (n = 9) NAMW Treatment (n = 7)a
Total Serum Protein (g/dl) 4.13 ± 0.39 3.47 ± 0.48b
Albumin (g/dl) 2.25 ± 0.17 1.94 ± 0.27b
Globulin (g/dl) 1.87 ± 0.38 1.51 ± 0.23b
A/G Ratio 1.24 ± 0.24 1.27 ± 0.10
Calcium (mg/dl) 12.8 ± 1.10 12.62 ± 1.12
Phosphorus (mg/dl) 5.72 ± 0.87 7.07 ± 1.07b
Glucose (mg/dl) 179 ± 14.0 284 ± 83.8d
Alkaline Phosphatase (U/l) 65.5 ± 21.6 110 ± 43.7b
Creatine Kinase (U/l) 574 ± 293 1813 ± 3495
Aspartate Aminotransferase (U/l) 82.4 ± 44.3 95.1 ± 77.7
Uric Acid (mg/dl) 5.12 ± 2.14 18.1 ± 12.9c
Cholesterol (mg/dl) 315 ± 52.9 324 ± 106
Sodium (meq/l) 160 ± 3.02 169 ± 1.62d
Potassium (meq/l) 4.22 ± 0.37 5.23 ± 0.77b
Chloride (meq/l) 107 ± 2.67 121 ± 7.29d
Hematocrit 51.8 ± 4.52 63.9 ± 5.23e
a Serum sample quantities were insufficient for 2 of 9 NAMW treatment mallards. b Mean is significantly different than paired mean by Wilcoxon Rank Sum Test at p < 0.05. c Mean is significantly different than paired mean by Wilcoxon Rank Sum Test at p < 0.01. d Mean is significantly different than paired mean by Wilcoxon Rank Sum Test at p < 0.001. e N=9; Mean is significantly different than paired mean by t-test at p < 0.001.
AMW Exposures in Birds Final Report - Part I Page 44
Report No. RWO55-T04-47-A February 15, 2007 Texas Tech University
Study C: Synthetic Acid Mine Water Time Course Study with Mallards
Introduction
Short-term exposure to acid metalliferous water followed by ingestion of clean water can
potentially be survived by exposed birds. Therefore, clean water availability is an important
requirement for survival of exposed birds in the field. The purpose of study C was to assess
the potential role that clean water availability and consumption might play in protecting birds
after a toxic exposure to SAMW.
Methods
Treatment Water Source
Treatment mallards were dosed with the same SAMW used in Study A. The pH of
SAMW was measured at 2.05 and the density of SAMW was consistent with study A (1.05
g/mL).
Study Design
Thirty 8-week old mallards (15 males, 15 females) were obtained from a commercial
gamebird grower (see study A), raised at The Institute of Environmental and Human Health
aviary facility, and later transported to the Texas Tech University Animal Care Resources
Center when the birds had reached approximately 22-weeks of age. Mallards were
approximately 25-29 weeks of age at the time of dosing. Birds were banded and maintained
individually in 2.5 ft3 stainless steel rabbit cages at 20°C, 40-70% relative humidity, and
12h:12h light:dark photoperiod. All mallards were allowed approximately three weeks to
acclimate to indoor, caged conditions prior to initiation of testing, with their body weight
near or exceeding that recorded upon receipt into the animal facility. Ducks had ad libitum
access to feed (Mazuri waterfowl maintenance diet in pellet form; PMI Nutritional, LLC,
Brentwood, MO, USA) and tap water during the acclimation period. All animal care was
performed in accordance with the Texas Tech University ACRC and the Institutional Animal
Care and Use Committee.
The study was performed during two separate weeks, with 4 weeks in between each
dosing trial. Sixteen mallards (8 males and 8 females) were tested during the first week and
AMW Exposures in Birds Final Report - Part I Page 45
Report No. RWO55-T04-47-A February 15, 2007 Texas Tech University
fourteen mallards (7 males and 7 females) were tested during the second week. All mallards
were fasted and dehydrated for a 24-hr period prior to the dosing period. During each trial,
eight mallards were provided ad libitum access to SAMW for a maximum of 55-min or a
maximum dose of 40 mL/kg, whichever event occurred first. The exposure duration and
maximum dose were based on results from study A, which indicated that the lowest lethal
dose was above 40 mL/kg and most birds did not consume that dose in less than one hour.
Immediately following the SAMW exposure period, the water source was changed to tap
water and SAMW treatment mallards were allowed ad libitum access. Control mallards were
allowed free access to tap water at the same time SAMW treatment birds were provided tap
water. Control mallards were pair-fed with SAMW treatment mallards. An individual
mallard was assigned to be pair-fed with an individual of the same sex from the SAMW
group. SAMW treatment mallards were allowed ad libitum access to food. Food was
provided approximately three to four hours after birds first received access to water. Body
mass measurements were collected for each mallard before the initiation of the dehydration
and fasting period, at the initiation of dosing, and at the time of euthanasia. Body mass was
collected with an electronic balance to the nearest 0.1 g.
Dosing of each mallard was staggered at 2-min intervals to allow for changing of water
bottle reservoirs and waste-collection bottles. SAMW consumption was adjusted for the
density of the dosing solution (1.05 g/ml) and control consumption was based on 1 g/ml for
tap water. Animals were observed continuously throughout the exposure period, with
behavioral observations and water consumption data collected. Water consumption
measurement methods were the same as those used in Study A.
Animal Euthanasia and Sample Collection
Control and treatment birds were euthanized via carbon dioxide asphyxiation following
either 1, 3, or 7 days post-dose. Whole blood was collected with 1 mL syringes and placed in
5 mL serum separator tubes for serum clinical chemistry, 2 ml microcentrifuge tubes for
metal residues, and microhematocrit tubes for determination of erythrocyte PCV. Whole
blood in serum separator tubes was allowed to clot at room temperature for 30 minutes and
centrifuged at 6,000 rpm for 10 minutes. Serum was decanted into 2-ml microcentrifuge
tubes and frozen at -80°C until shipped for analysis. Serum samples were analyzed with a
AMW Exposures in Birds Final Report - Part I Page 46
Report No. RWO55-T04-47-A February 15, 2007 Texas Tech University
Hitachi 911 Analyzer at the TVMDL for total serum protein, albumin, globulins, calcium,
phosphorus, glucose, CK, AST, uric acid, cholesterol, ALP, and electrolytes.
Gross pathological lesions were documented, and tissues were collected for
histopathological analyses for all birds. Sections of right lung, testes or ovaries, right kidney,
liver, spleen, pancreas, brain, tongue, esophagus, trachea, heart, proventriculus, ventriculus,
duodenum, jejunum, ileum, ceca, and large intestine were fixed in 10% buffered formalin
and stored in jars until processed.
Histopathology
Histopathological analyses were performed at Colorado State University’s College of
Veterinary Medicine and Biomedical Sciences. Tissue samples were embedded in paraffin
and 5 µm sections of these tissues were histologically analyzed following routine
hematoxylin and eosin staining. When dictated by histopathologic findings, specific tissue
sections were also stained for minerals. Primary histopathologic analysis was performed
blindly without knowledge of treatment. Following analysis, observations in treated and
control groups that were indistinguishable both qualitatively and quantitatively were
considered to be background lesions and deemed unrelated to treatment.
Statistical Methods
Measures of central tendency were expressed as the mean ± standard deviation. All data
analyzed using parametric methods were tested for normality and homogeneity of variances.
When the assumptions of parametric tests were not met, data were reanalyzed after log
transformation or analyzed using non-parametric methods. To control for experimental-wise
error, we used a linear mixed-effects model to analyze for a treatment-related effect on water
consumption (mL/kg). Dose was used as the fixed factor and time as the random factor, as
well as the interaction between dose and time. Any differences in the model were further
analyzed using t-tests or Wilcoxon Rank-Sum Test to determine differences between
treatment groups during consumption time periods. Among day SAMW total doses were
analyzed using analysis of variance. SAMW treatment mortalities and their paired controls
were not included in water consumption or total dose analyses. Serum clinical chemistry
endpoints were analyzed using either t-tests or Wilcoxon Rank Sum tests. Differences in
AMW Exposures in Birds Final Report - Part I Page 47
Report No. RWO55-T04-47-A February 15, 2007 Texas Tech University
body mass between treatment groups were analyzed using a linear mixed-effects model to
determine differences in body mass change between treatment groups for all three bird
collection time points. All statistical analyses were performed with R version 2.2.0 (R
Foundation, Vienna, Austria). Results of statistical tests were considered to be significant at
p < 0.05.
Results
Total Doses and Water Consumption
Total doses of SAMW in treated mallards ranged from 15.0 to 36.7 mL/kg, not including
one female mallard that was accidentally allowed to consume 46.1 mL/kg SAMW and
subsequently died. Total SAMW doses were not significantly different among the three
different AMW-treated groups (Figure C.1, Tables C.1, C.2, and C.3).
On average, AMW treatment mallards tended to drink less tap water than controls during
the day of SAMW treatment on a time interval basis. This was not the case in SAMW-
treated mallards from the second to seventh day however. During these days, although not
statistically significant in most cases, SAMW-treated mallards on average tended to consume
more clean water than controls.
Food Consumption and Body Mass Dynamics
In general, SAMW-treated mallards consumed very little, if any food at all on the same
day as treatment (Table C.4). Whereas the SAMW-treated mallards that did eat food were
generally hesitant to consume it, pair-fed controls were very eager to eat and tended to
devour all available food immediately after it was presented. Three of 13 mallards did not
eat on the same day they were exposed to SAMW. Four of nine mallards were not eating 1
day after exposure, and three of nine mallards were still not eating 2 days after exposure.
Normal ad libitum food consumption was determined to be approximately 66 ± 16 g/kg/day
in our laboratory-maintained mallards. Whereas day 3 mallards were eating normal mean ad
libitum food levels by 1 day after exposure, day 7 birds were not eating normal mean levels
of food until 3 days after SAMW treatment.
There were no significant differences in body mass change between treatment groups
for all three mallard collection time points (Table C.5) due to the paired feeding strategy.
AMW Exposures in Birds Final Report - Part I Page 48
Report No. RWO55-T04-47-A February 15, 2007 Texas Tech University
Clinical Chemistry
There were no significant differences in clinical chemistry parameters between treatment
groups for all three collection time points except for total serum protein and albumin levels
(Table C.6). Total serum protein levels from SAMW mallards from day 1 were significantly
reduced in comparison to controls (p < 0.01). Albumin levels from AMW mallards from all
three collection time points were significantly reduced in comparison to controls (p < 0.05).
Although not statistically different, mean levels of ALP, CK, AST, uric acid, and potassium
were higher in day 1 and day 3 AMW mallards in comparison to controls, while mean
sodium and chloride levels were lower in SAMW mallards in comparison to controls. Such
trends were not observed in day 7 SAMW mallards.
Survival and Pathology
Two SAMW-treated female mallards died within the first 24 hrs of the study. One
mallard consumed 31.0 mL/kg SAMW, while the other mallard consumed 46.1 mL/kg
SAMW, a dose greater than our estimated lethal limit. Gross lesions in these birds were
consistent with birds poisoned in Study A. There were no control group mortality events
prior to euthanasia at the end of each study period.
Gross lesions in SAMW-treated mallards euthanized one day post-treatment included
mild to severe ventricular and proventricular ulcerations and hemorrhaging, erosion of the
kaolin, and presence of yellow-green oral mucus. Some ventricular ulcers were atypically
black in color in comparison to brownish-yellow ulcers observed in mallards acutely
poisoned by SAMW. Gross lesions in SAMW-treated mallards euthanized three days post-
treatment were observed in similar tissues, however they were less severe in nature. Mild
ventricular lesions were the most commonly observed abnormality. Gross treatment-related
lesions in SAMW-treated mallards euthanized seven days post-treatment were relatively mild
in nature and limited strictly to the ventriculus. Lesions were few in number and were only
slightly raised in nature and/or colored brownish-green or brownish-orange. Bilateral
testicular necrosis was noted in one SAMW-treated bird euthanized 7 days post-treatment.
Since similar lesions were not observed in other treated male birds, it is likely that this was
an incidental finding in this bird unrelated to treatment. The necrosis observed in the testis
AMW Exposures in Birds Final Report - Part I Page 49
Report No. RWO55-T04-47-A February 15, 2007 Texas Tech University
was coagulative and would be consistent with infarction which could be related to previous
kaolin ulceration and a transient septicemia.
As observed in previous studies, the histologic lesions were restricted to the anterior
gastrointestinal tract, including esophagus, proventriculus, and ventriculus (Table C.7).
Changes noted in the liver and trachea of many treated and control birds were determined to
be background and unrelated to treatment.
Definitive treatment-related changes in the proventriculus and esophagus are transient
and were not observed after 1 day post treatment. They were most likely related to local
irritation caused by ingestion of SAMW. The only observed esophageal lesion (dilated
glands filled with mucous) was consistent with abundant mucus seen in the upper GI and
respiratory tract of these birds. Changes (degeneration, ulceration and heterophilic
inflammation) in the ventriculus lasted longer, until at least 3 days post-treatment, but were
not seen in birds euthanized 7 days post treatment. These decreases in lesion severity over
time were likely correlated with concurrent increases in food intake.
Examples of macroscopic changes in internal tissues are provided in the appendix.
Discussion
Nearly all mallards consuming typically sublethal doses of SAMW were able to survive
exposure if allowed access to clean water and/or food. A time course evaluation of the
healing process of upper gastrointestinal tract lesions in mallards treated with SAMW
indicated most of the lesions can heal if a bird can obtain clean water and food. However,
the healing process may be different in terms of duration and nature in wild birds that are
exposed to more physiologically-stressed conditions than our laboratory mallards. The most
significant finding from this study is the occurrence of prolonged anorexia and decreased
food consumption in birds with mild to severe ventricular pathology. Whereas large birds,
such as some waterfowl, may have enough fat stores to survive a period of several days
without food, small birds, with higher bioenergetic demands and similar ventricular lesions,
may be less likely to survive without food for a similar time period.
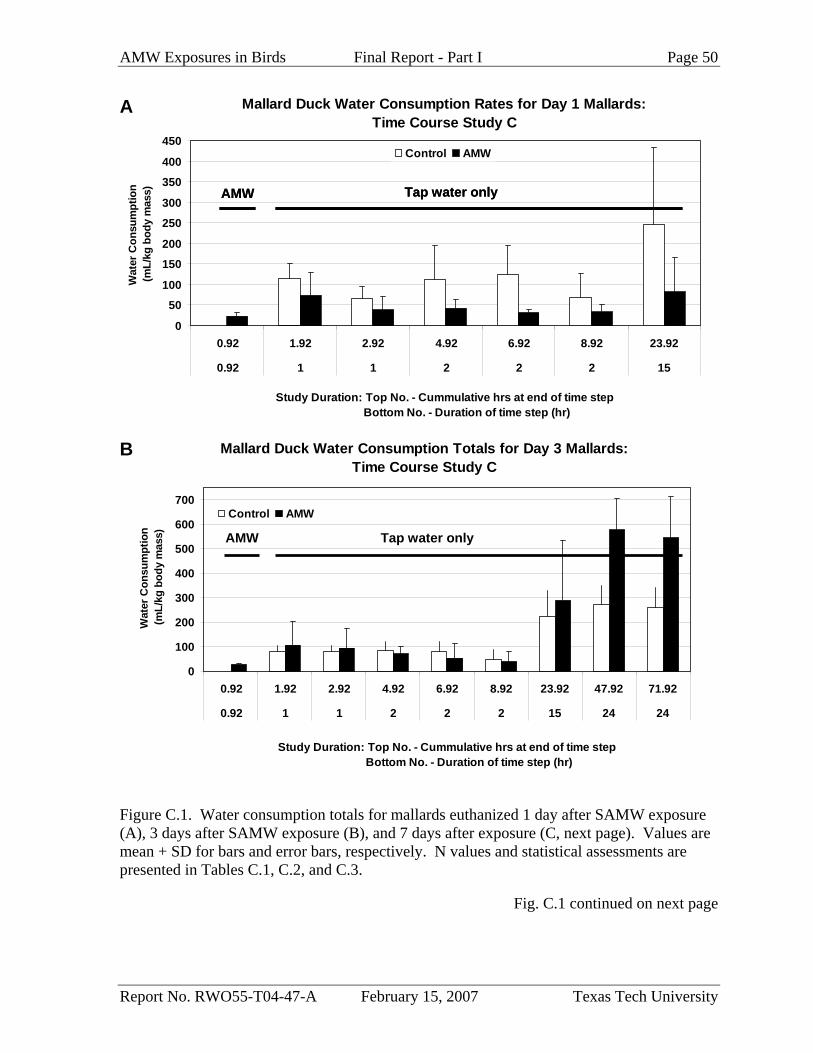
AMW Exposures in Birds Final Report - Part I Page 50
Report No. RWO55-T04-47-A February 15, 2007 Texas Tech University
Mallard Duck Water Consumption Rates for Day 1 Mallards: Time Course Study C
0
50
100
150
200
250
300
350
400
450
0.92 1.92 2.92 4.92 6.92 8.92 23.92
0.92 1 1 2 2 2 15
Study Duration: Top No. - Cummulative hrs at end of time step Bottom No. - Duration of time step (hr)
Wat
er C
onsu
mpt
ion
(mL/
kg b
ody
mas
s)Control AMW
AMW Tap water only
Mallard Duck Water Consumption Totals for Day 3 Mallards: Time Course Study C
0
100
200
300
400
500
600
700
0.92 1.92 2.92 4.92 6.92 8.92 23.92 47.92 71.92
0.92 1 1 2 2 2 15 24 24
Study Duration: Top No. - Cummulative hrs at end of time step Bottom No. - Duration of time step (hr)
Wat
er C
onsu
mpt
ion
(mL/
kg b
ody
mas
s)
Control AMW
AMW Tap water only
A B Figure C.1. Water consumption totals for mallards euthanized 1 day after SAMW exposure (A), 3 days after SAMW exposure (B), and 7 days after exposure (C, next page). Values are mean + SD for bars and error bars, respectively. N values and statistical assessments are presented in Tables C.1, C.2, and C.3.
Fig. C.1 continued on next page
AMW Tap water only
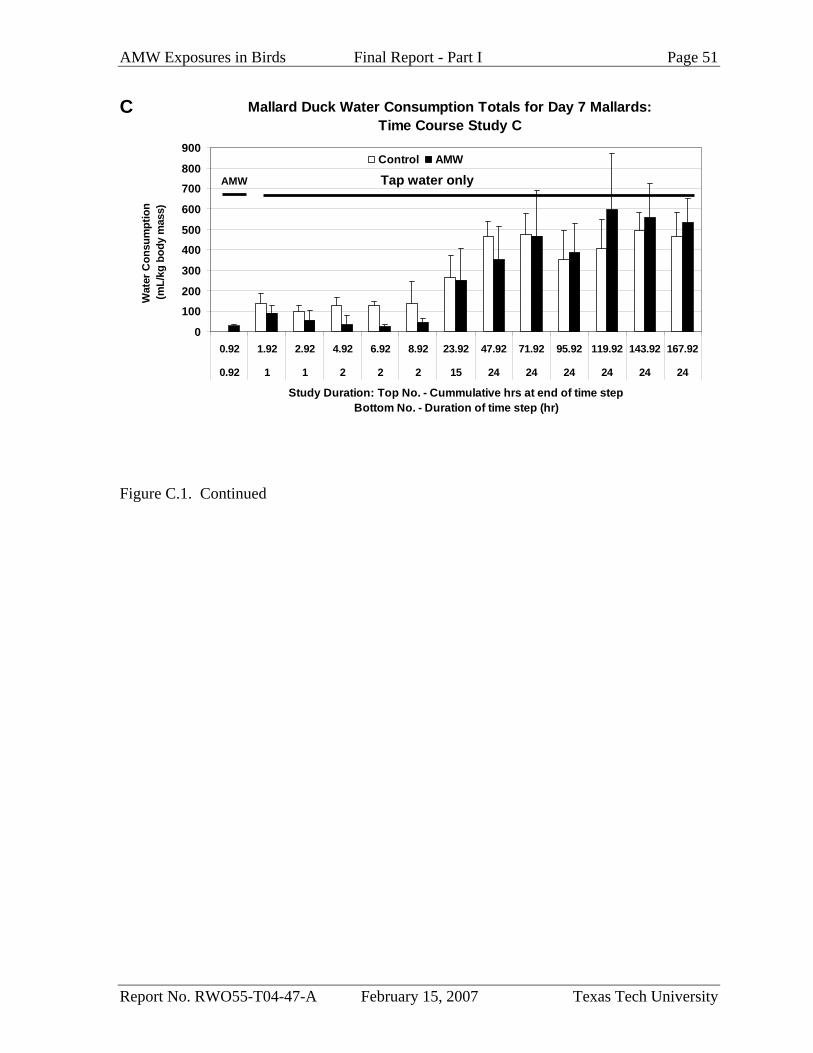
AMW Exposures in Birds Final Report - Part I Page 51
Report No. RWO55-T04-47-A February 15, 2007 Texas Tech University
Mallard Duck Water Consumption Totals for Day 7 Mallards:Time Course Study C
0
100
200
300
400
500
600
700
800
900
0.92 1.92 2.92 4.92 6.92 8.92 23.92 47.92 71.92 95.92 119.92 143.92 167.92
0.92 1 1 2 2 2 15 24 24 24 24 24 24
Study Duration: Top No. - Cummulative hrs at end of time stepBottom No. - Duration of time step (hr)
Wat
er C
onsu
mpt
ion
(mL/
kg b
ody
mas
s)Control AMW
AMW Tap water only
C Figure C.1. Continued
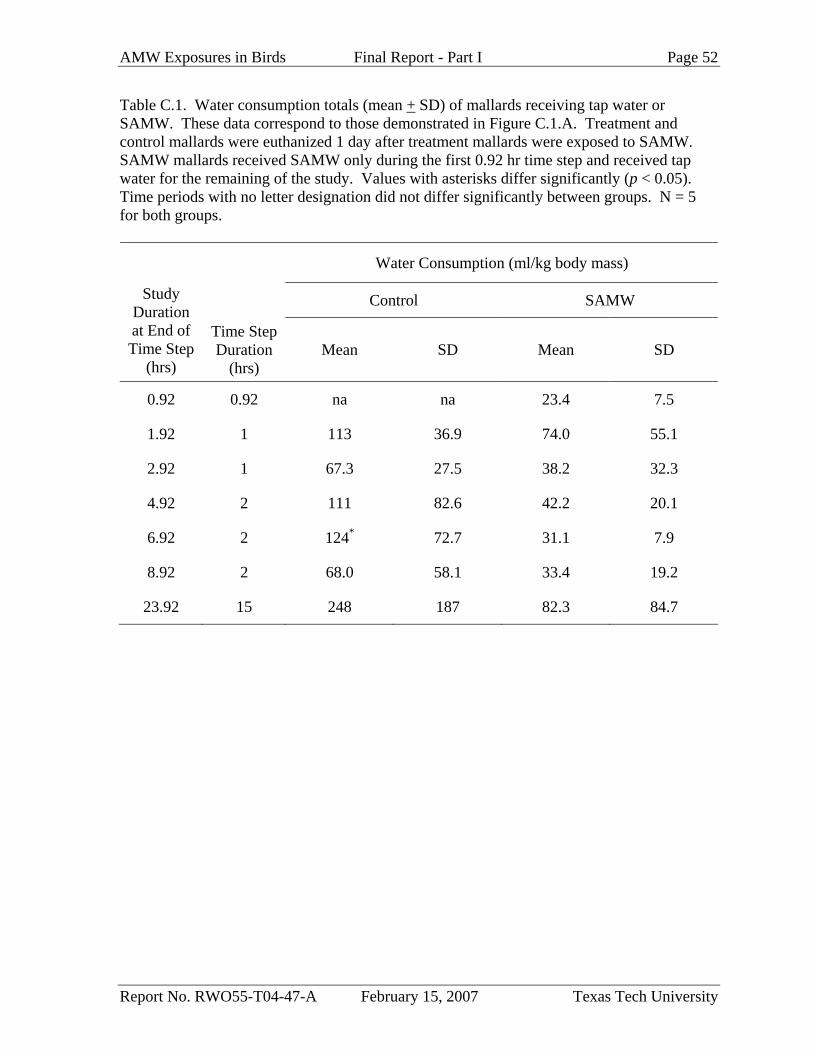
AMW Exposures in Birds Final Report - Part I Page 52
Report No. RWO55-T04-47-A February 15, 2007 Texas Tech University
Table C.1. Water consumption totals (mean + SD) of mallards receiving tap water or SAMW. These data correspond to those demonstrated in Figure C.1.A. Treatment and control mallards were euthanized 1 day after treatment mallards were exposed to SAMW. SAMW mallards received SAMW only during the first 0.92 hr time step and received tap water for the remaining of the study. Values with asterisks differ significantly (p < 0.05). Time periods with no letter designation did not differ significantly between groups. N = 5 for both groups.
Water Consumption (ml/kg body mass)
Control SAMW
Study Duration at End of Time Step
(hrs)
Time Step Duration
(hrs) Mean SD Mean SD
0.92 0.92 na na 23.4 7.5
1.92 1 113 36.9 74.0 55.1
2.92 1 67.3 27.5 38.2 32.3
4.92 2 111 82.6 42.2 20.1
6.92 2 124* 72.7 31.1 7.9
8.92 2 68.0 58.1 33.4 19.2
23.92 15 248 187 82.3 84.7
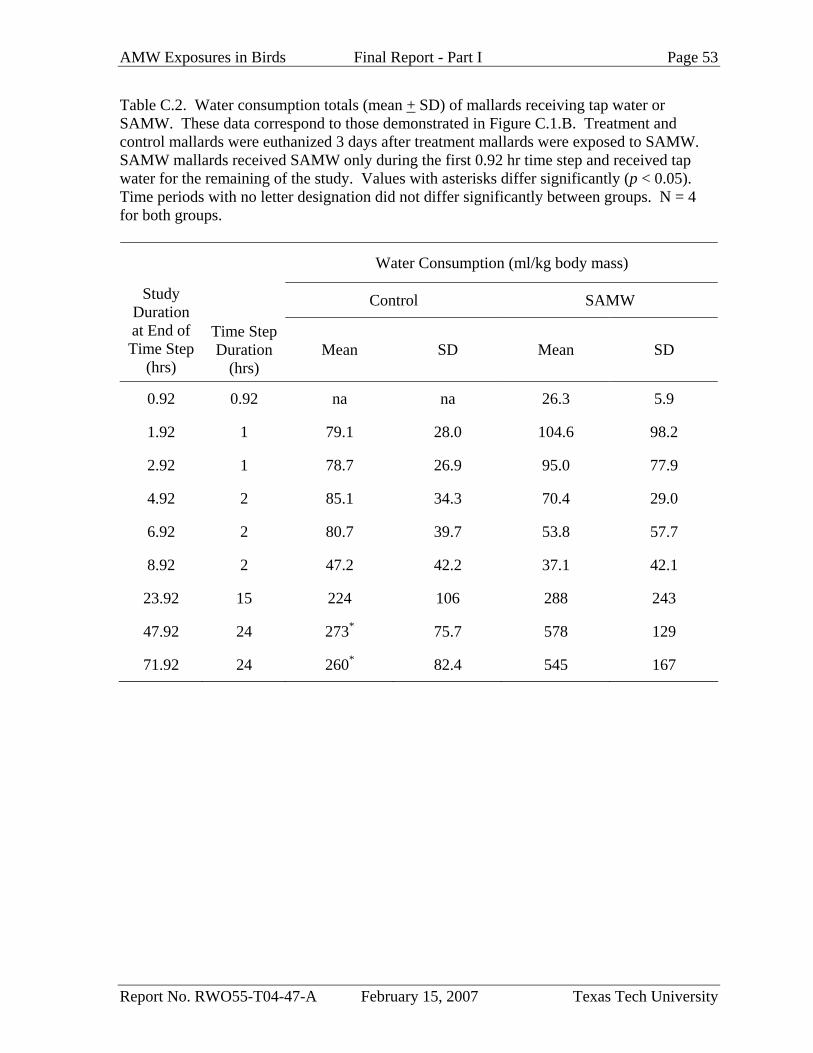
AMW Exposures in Birds Final Report - Part I Page 53
Report No. RWO55-T04-47-A February 15, 2007 Texas Tech University
Table C.2. Water consumption totals (mean + SD) of mallards receiving tap water or SAMW. These data correspond to those demonstrated in Figure C.1.B. Treatment and control mallards were euthanized 3 days after treatment mallards were exposed to SAMW. SAMW mallards received SAMW only during the first 0.92 hr time step and received tap water for the remaining of the study. Values with asterisks differ significantly (p < 0.05). Time periods with no letter designation did not differ significantly between groups. N = 4 for both groups.
Water Consumption (ml/kg body mass)
Control SAMW
Study Duration at End of Time Step
(hrs)
Time Step Duration
(hrs) Mean SD Mean SD
0.92 0.92 na na 26.3 5.9
1.92 1 79.1 28.0 104.6 98.2
2.92 1 78.7 26.9 95.0 77.9
4.92 2 85.1 34.3 70.4 29.0
6.92 2 80.7 39.7 53.8 57.7
8.92 2 47.2 42.2 37.1 42.1
23.92 15 224 106 288 243
47.92 24 273* 75.7 578 129
71.92 24 260* 82.4 545 167
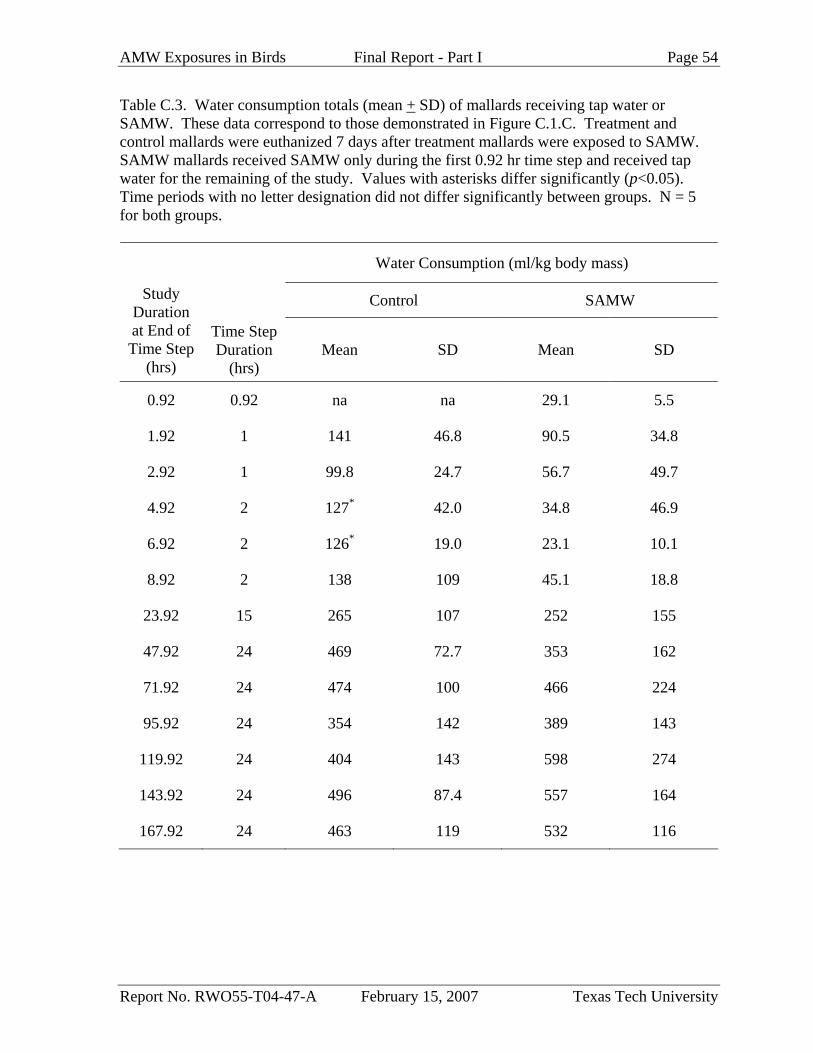
AMW Exposures in Birds Final Report - Part I Page 54
Report No. RWO55-T04-47-A February 15, 2007 Texas Tech University
Table C.3. Water consumption totals (mean + SD) of mallards receiving tap water or SAMW. These data correspond to those demonstrated in Figure C.1.C. Treatment and control mallards were euthanized 7 days after treatment mallards were exposed to SAMW. SAMW mallards received SAMW only during the first 0.92 hr time step and received tap water for the remaining of the study. Values with asterisks differ significantly (p<0.05). Time periods with no letter designation did not differ significantly between groups. N = 5 for both groups.
Water Consumption (ml/kg body mass)
Control SAMW
Study Duration at End of Time Step
(hrs)
Time Step Duration
(hrs) Mean SD Mean SD
0.92 0.92 na na 29.1 5.5
1.92 1 141 46.8 90.5 34.8
2.92 1 99.8 24.7 56.7 49.7
4.92 2 127* 42.0 34.8 46.9
6.92 2 126* 19.0 23.1 10.1
8.92 2 138 109 45.1 18.8
23.92 15 265 107 252 155
47.92 24 469 72.7 353 162
71.92 24 474 100 466 224
95.92 24 354 142 389 143
119.92 24 404 143 598 274
143.92 24 496 87.4 557 164
167.92 24 463 119 532 116
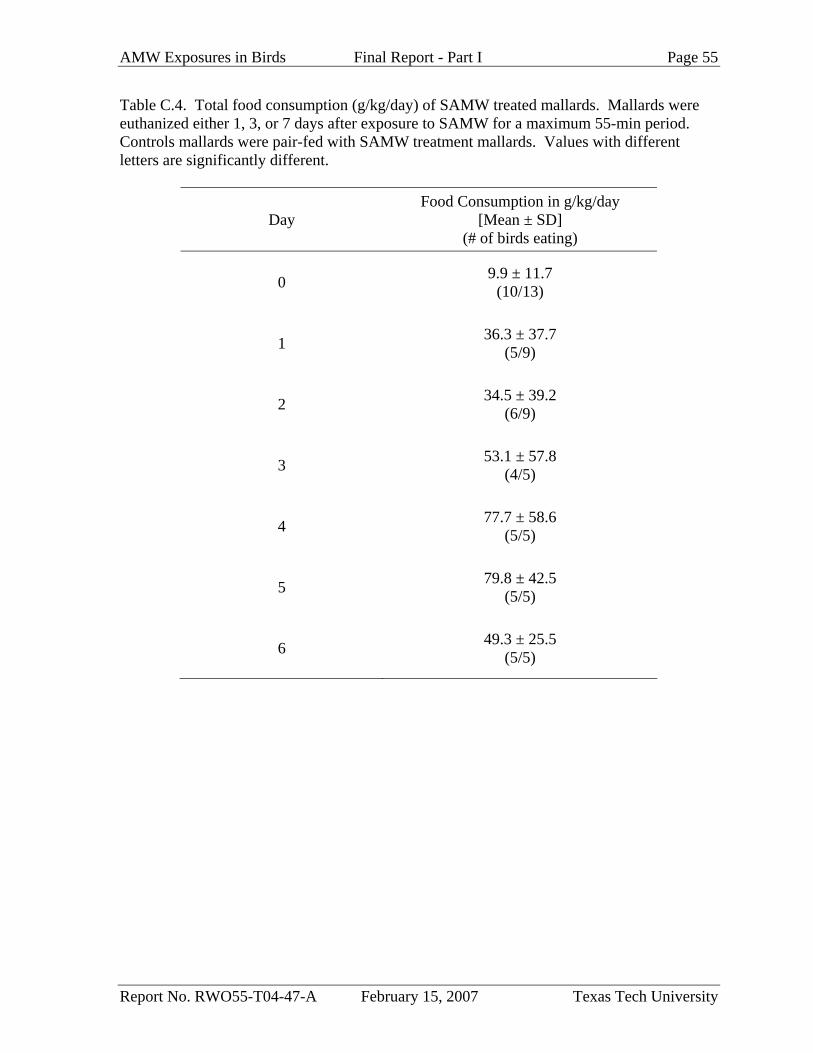
AMW Exposures in Birds Final Report - Part I Page 55
Report No. RWO55-T04-47-A February 15, 2007 Texas Tech University
Table C.4. Total food consumption (g/kg/day) of SAMW treated mallards. Mallards were euthanized either 1, 3, or 7 days after exposure to SAMW for a maximum 55-min period. Controls mallards were pair-fed with SAMW treatment mallards. Values with different letters are significantly different.
Day Food Consumption in g/kg/day
[Mean ± SD] (# of birds eating)
0 9.9 ± 11.7 (10/13)
1 36.3 ± 37.7 (5/9)
2 34.5 ± 39.2 (6/9)
3 53.1 ± 57.8 (4/5)
4 77.7 ± 58.6 (5/5)
5 79.8 ± 42.5 (5/5)
6 49.3 ± 25.5 (5/5)
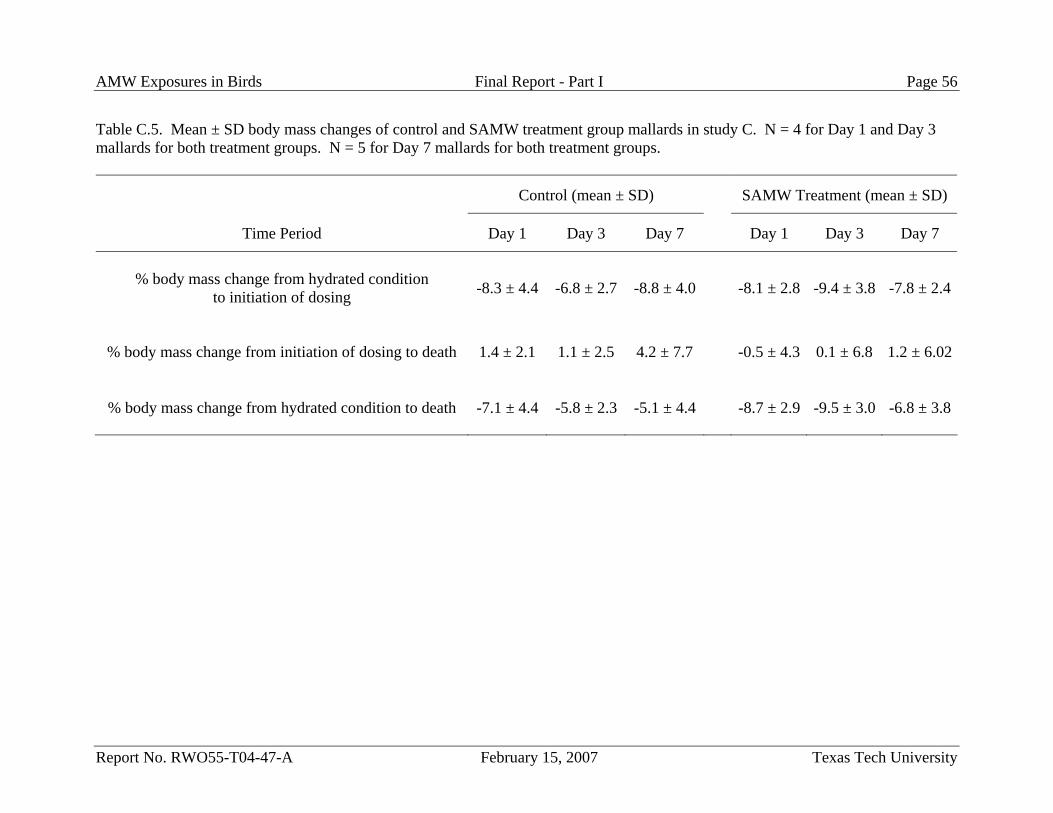
AMW Exposures in Birds Final Report - Part I Page 56
Report No. RWO55-T04-47-A February 15, 2007 Texas Tech University
Table C.5. Mean ± SD body mass changes of control and SAMW treatment group mallards in study C. N = 4 for Day 1 and Day 3 mallards for both treatment groups. N = 5 for Day 7 mallards for both treatment groups.
Control (mean ± SD) SAMW Treatment (mean ± SD)
Time Period Day 1 Day 3 Day 7 Day 1 Day 3 Day 7
% body mass change from hydrated condition to initiation of dosing -8.3 ± 4.4 -6.8 ± 2.7 -8.8 ± 4.0 -8.1 ± 2.8 -9.4 ± 3.8 -7.8 ± 2.4
% body mass change from initiation of dosing to death 1.4 ± 2.1 1.1 ± 2.5 4.2 ± 7.7 -0.5 ± 4.3 0.1 ± 6.8 1.2 ± 6.02
% body mass change from hydrated condition to death -7.1 ± 4.4 -5.8 ± 2.3 -5.1 ± 4.4 -8.7 ± 2.9 -9.5 ± 3.0 -6.8 ± 3.8
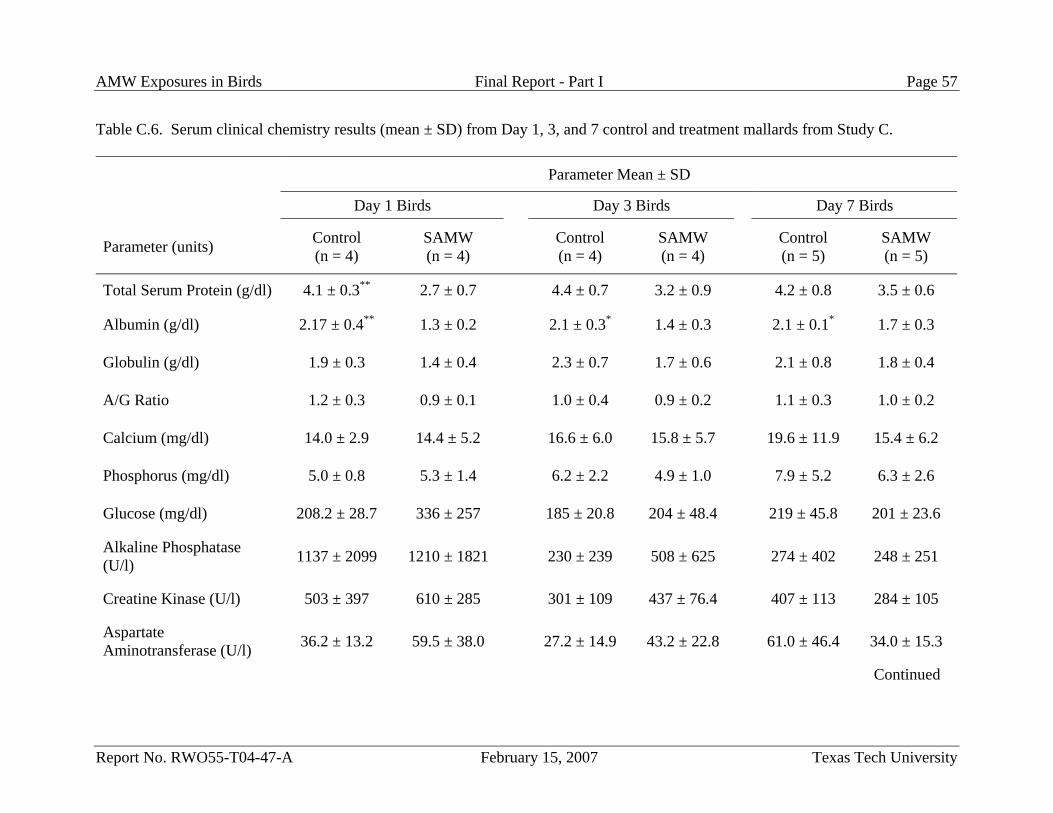
AMW Exposures in Birds Final Report - Part I Page 57
Report No. RWO55-T04-47-A February 15, 2007 Texas Tech University
Table C.6. Serum clinical chemistry results (mean ± SD) from Day 1, 3, and 7 control and treatment mallards from Study C.
Parameter Mean ± SD
Day 1 Birds Day 3 Birds Day 7 Birds
Parameter (units) Control (n = 4)
SAMW (n = 4) Control
(n = 4) SAMW (n = 4) Control
(n = 5) SAMW (n = 5)
Total Serum Protein (g/dl) 4.1 ± 0.3** 2.7 ± 0.7 4.4 ± 0.7 3.2 ± 0.9 4.2 ± 0.8 3.5 ± 0.6
Albumin (g/dl) 2.17 ± 0.4** 1.3 ± 0.2 2.1 ± 0.3* 1.4 ± 0.3 2.1 ± 0.1* 1.7 ± 0.3
Globulin (g/dl) 1.9 ± 0.3 1.4 ± 0.4 2.3 ± 0.7 1.7 ± 0.6 2.1 ± 0.8 1.8 ± 0.4
A/G Ratio 1.2 ± 0.3 0.9 ± 0.1 1.0 ± 0.4 0.9 ± 0.2 1.1 ± 0.3 1.0 ± 0.2
Calcium (mg/dl) 14.0 ± 2.9 14.4 ± 5.2 16.6 ± 6.0 15.8 ± 5.7 19.6 ± 11.9 15.4 ± 6.2
Phosphorus (mg/dl) 5.0 ± 0.8 5.3 ± 1.4 6.2 ± 2.2 4.9 ± 1.0 7.9 ± 5.2 6.3 ± 2.6
Glucose (mg/dl) 208.2 ± 28.7 336 ± 257 185 ± 20.8 204 ± 48.4 219 ± 45.8 201 ± 23.6
Alkaline Phosphatase (U/l) 1137 ± 2099 1210 ± 1821 230 ± 239 508 ± 625 274 ± 402 248 ± 251
Creatine Kinase (U/l) 503 ± 397 610 ± 285 301 ± 109 437 ± 76.4 407 ± 113 284 ± 105
Aspartate Aminotransferase (U/l) 36.2 ± 13.2 59.5 ± 38.0 27.2 ± 14.9 43.2 ± 22.8 61.0 ± 46.4 34.0 ± 15.3
Continued
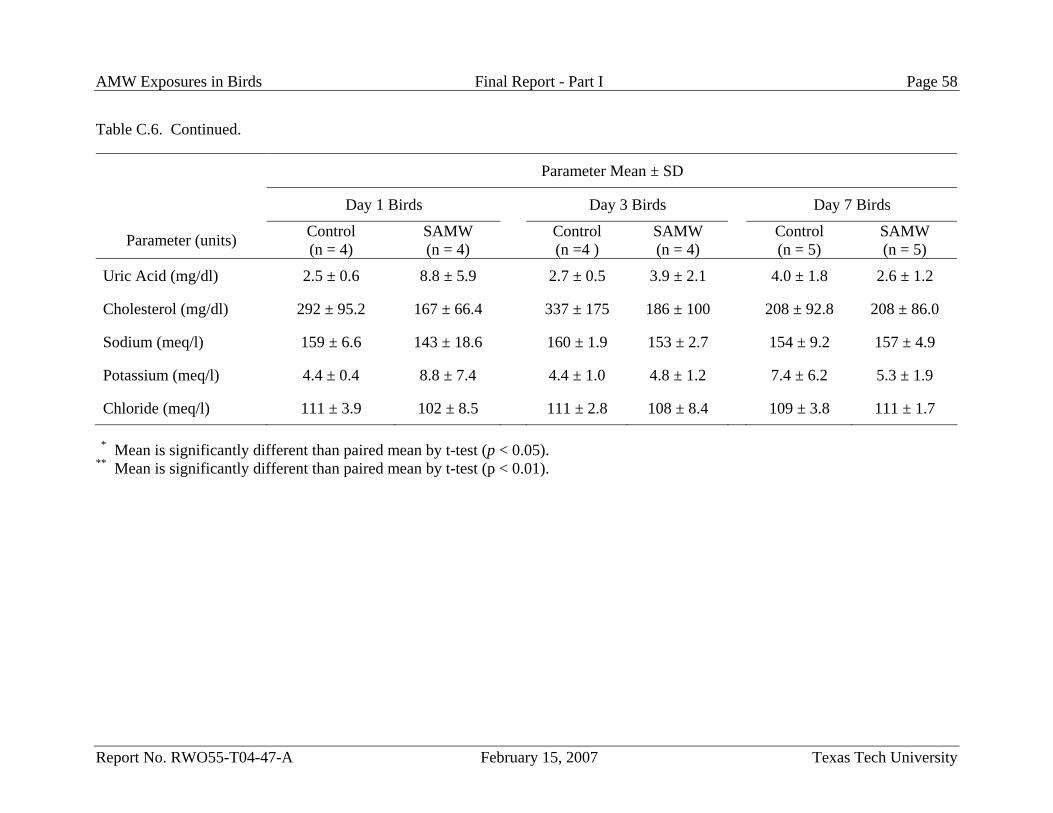
AMW Exposures in Birds Final Report - Part I Page 58
Report No. RWO55-T04-47-A February 15, 2007 Texas Tech University
Table C.6. Continued.
Parameter Mean ± SD
Day 1 Birds Day 3 Birds Day 7 Birds
Parameter (units) Control (n = 4)
SAMW (n = 4) Control
(n =4 ) SAMW (n = 4) Control
(n = 5) SAMW (n = 5)
Uric Acid (mg/dl) 2.5 ± 0.6 8.8 ± 5.9 2.7 ± 0.5 3.9 ± 2.1 4.0 ± 1.8 2.6 ± 1.2
Cholesterol (mg/dl) 292 ± 95.2 167 ± 66.4 337 ± 175 186 ± 100 208 ± 92.8 208 ± 86.0
Sodium (meq/l) 159 ± 6.6 143 ± 18.6 160 ± 1.9 153 ± 2.7 154 ± 9.2 157 ± 4.9
Potassium (meq/l) 4.4 ± 0.4 8.8 ± 7.4 4.4 ± 1.0 4.8 ± 1.2 7.4 ± 6.2 5.3 ± 1.9
Chloride (meq/l) 111 ± 3.9 102 ± 8.5 111 ± 2.8 108 ± 8.4 109 ± 3.8 111 ± 1.7 * Mean is significantly different than paired mean by t-test (p < 0.05). ** Mean is significantly different than paired mean by t-test (p < 0.01).
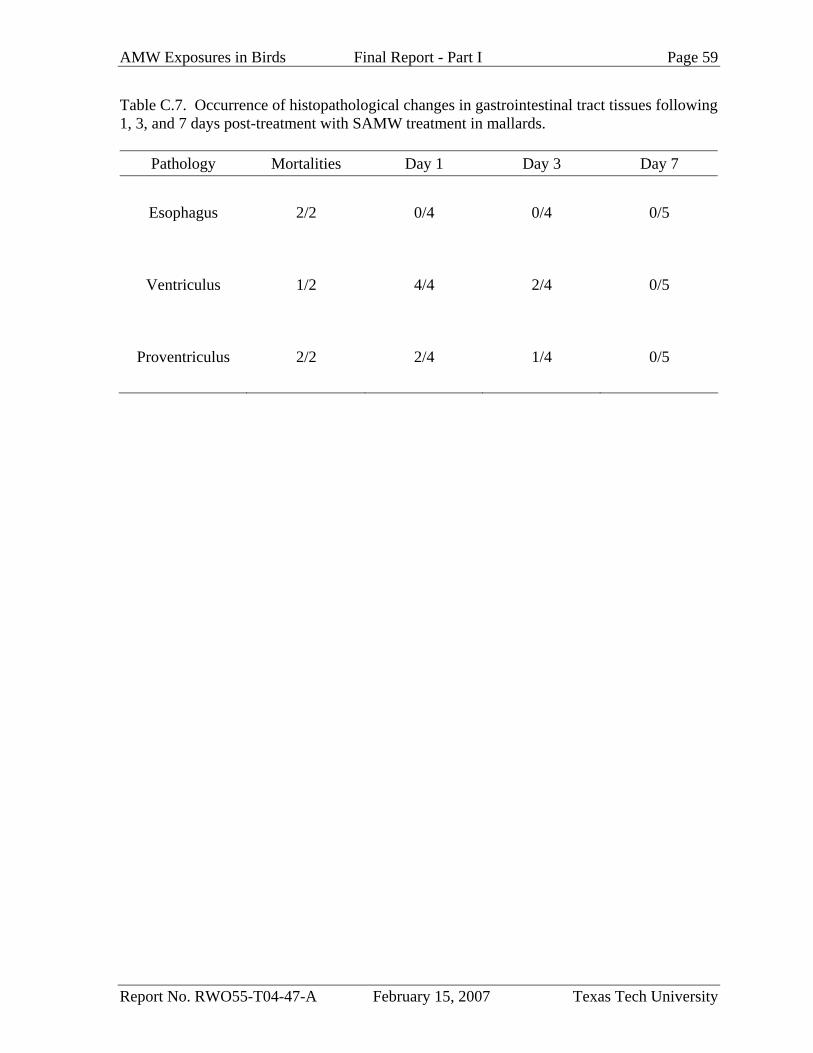
AMW Exposures in Birds Final Report - Part I Page 59
Report No. RWO55-T04-47-A February 15, 2007 Texas Tech University
Table C.7. Occurrence of histopathological changes in gastrointestinal tract tissues following 1, 3, and 7 days post-treatment with SAMW treatment in mallards.
Pathology Mortalities Day 1 Day 3 Day 7
Esophagus 2/2 0/4 0/4 0/5
Ventriculus 1/2 4/4 2/4 0/5
Proventriculus 2/2 2/4 1/4 0/5
AMW Exposures in Birds Final Report - Part I Page 60
Report No. RWO55-T04-47-A February 15, 2007 Texas Tech University
Study D: Dose-Response Acute Toxicity of Synthetic Acid Mine Water to Mallards
Introduction
Study A demonstrated acute toxicity of a synthetic AMW representative of a high level of
AMW contamination. Other tailings ponds and pregnant leach solutions associated with the
Tyrone, Morenci, and Chino mines contain lower levels of AMW contamination (Stratus,
2003). The goals of study D were to 1) compare the acute toxicity of SAMW with SAMWs
that are representative of lower levels of AMW contamination 2) provide a first step towards
the determination of dose-response relationship and 3) determine if findings from this dose-
response study are consistent with other reports from SAMW and AMW acute toxicity
studies.
Methods
Treatment Water Source and Preparation
SAMW treatment group mallards were dosed with same SAMW that was used in Study
A. The pH of SAMW was 2.00. Twenty liters of 1/10 SAMW and 1/100 SAMW were
formulated by sequentially diluting the stock SAMW solution 10-fold and 10-fold again with
deionized water, producing 1/10th and 1/100th strength nominal SAMW solutions,
respectively (Table D.1). Each step in the dilution was accompanied by 2 hr of mixing prior
to removal of the stock SAMW for use in the dilution. Following dilution, the pH of the 1/10
SAMW solution was 2.70 and the 1/100 SAMW was 3.28. Eighteen mL of 18M nitric acid
was added to the 1/10 SAMW to adjust the pH to 2.02. Thirteen mL of 18M nitric acid was
added to the 1/100 SAMW solution to adjust the pH to 2.04. The pHs of tap water, 1/100
SAMW, 1/10 SAMW, and SAMW dosing solutions ranged from 8.18 to 8.31, 2.10 to 2.11,
2.10 to 2.11, and 2.06 to 2.08, respectively, during the study.
Study Design
Thirty-two 8-week old mallards (16 males, 16 females) were obtained from a commercial
gamebird grower (see Study A), raised at The Institute of Environmental and Human Health
avian facility, and later transported to the Texas Tech University Animal Care Resources
Center when the birds had reached approximately 20 to 22 weeks of age. Mallards were
AMW Exposures in Birds Final Report - Part I Page 61
Report No. RWO55-T04-47-A February 15, 2007 Texas Tech University
approximately 22 - 24 weeks of age at the time of dosing. Birds were banded and maintained
individually in 2.5 ft3 stainless steel rabbit cages at 20°C, 40-70% relative humidity, and
12h:12h light:dark photoperiod. All mallards were allowed at least two weeks to acclimate to
indoor, caged conditions prior to initiation of testing, with their body weight near or
exceeding that recorded upon receipt into the animal facility. Ducks had ad libitum access to
feed (Mazuri waterfowl maintenance diet in pellet form; PMI Nutritional, LLC, Brentwood,
MO, USA) and tap water during the acclimation period. All animal care was performed in
accordance with the Texas Tech University ACRC and the Institutional Animal Care and Use
Committee.
The study was performed over an 11-day period, with two groups of sixteen (equal sex
per trial) tested at a time. All mallards were fasted and dehydrated for a 24-hr period prior to
dosing. During each half of the study, four groups of four mallards were provided ad libitum
access to SAMW, 1/10 SAMW, 1/100 SAMW, or tap water for a maximum of 48 hours.
Mallards were not allowed access to food for the duration of the study. Body mass
measurements were collected for each mallard before the initiation of the dehydration and
fasting period, at the initiation of dosing, at 24 hrs post-dose for survivors, and at the time of
euthanasia. Body mass was collected with an electronic balance to the
nearest 0.1 g.
Dosing of each mallard was staggered at 2-min intervals to allow for changing of water
bottle reservoirs and waste-collection bottles. Consumption of different treatment water
sources was not adjusted for the density of the solutions and is reported in g of water/kg body
mass. Animals were observed continuously throughout the exposure period while behavioral
observations and water consumption data were collected. Water consumption measurement
methods were the same as those used in Study A.
Animal Euthanasia and Sample Collection
Birds were determined to be in moribund condition by visual signs of wing droop,
immobility, lack of response to touch/visual/auditory stimuli, and/or inability to hold head
erectly. All treatment ducks were observed until they were in extremis, at which time were
weighed and then euthanized via carbon dioxide asphyxiation. Control birds were
euthanized as close as possible to the time treatment animals died. Due to the moribund
AMW Exposures in Birds Final Report - Part I Page 62
Report No. RWO55-T04-47-A February 15, 2007 Texas Tech University
condition and reduced blood flow of treatment ducks, we were unable to collect blood
samples via jugular or brachial venipuncture and instead collected blood using cardiac
puncture. Whole blood was collected with 1 mL syringes and placed in 5 mL serum
separator tubes for serum clinical chemistry, 2 ml microcentrifuge tubes for metal residues,
and microhematocrit tubes for determination of erythrocyte PCV. An additional 1 mL
heparinized blood sample was collected from mallards from the second half of the study for
the purpose of complete blood counts. Blood smears were performed during sample
collections. Whole blood in serum separator tubes was allowed to clot at room temperature
for 30 minutes and then centrifuged at 6,000 rpm for 10 minutes. Serum was decanted into
2-ml microcentrifuge tubes and frozen at -80°C until being shipped for analysis. Serum
volumes from 6 of 7 SAMW samples, 2 of 8 1/10 SAMW samples, and 1 of 8 1/100 SAMW
samples were not sufficient for clinical chemistry analysis and were diluted two-fold with 18
mega-ohm deionized water. All other samples were submitted undiluted. Serum samples
were analyzed with a Hitachi 911 Analyzer at the TVMDL for total serum protein, albumin,
globulins, calcium, phosphorus, glucose, CK, AST, uric acid, cholesterol, ALP, hemoglobin,
and electrolytes. Serum clinical chemistry data were corrected for dilutions. Heparinized
whole blood samples with blood smears were shipped on ice for determination of complete
blood counts.
Gross pathological lesions were documented, and tissues were collected for
histopathological analyses for all birds. Sections of right lung, testes or ovaries, right kidney,
liver, spleen, pancreas, brain, tongue, esophagus, trachea, heart, proventriculus, ventriculus,
duodenum, jejunum, ileum, ceca, and large intestine were fixed in 10% buffered formalin
and stored in jars until processed. Histopathology samples have been stored for possible
analysis at a future date.
Statistical Methods
Measures of central tendency were expressed as the mean ± standard deviation. All data
analyzed using parametric methods were tested for normality and homogeneity of variances.
When the assumptions of parametric tests were not met, data were reanalyzed after log
transformation or analyzed using non-parametric methods. Differences in total and first hour
dose among groups were analyzed using analysis of variance or Kruskal-Wallis Tests. Body
AMW Exposures in Birds Final Report - Part I Page 63
Report No. RWO55-T04-47-A February 15, 2007 Texas Tech University
mass and hematology parameters were analyzed using analysis of variance or Kruskal-Wallis
tests. Not all clinical chemistry parameters could be analyzed using either analysis of
variance or Kruskal-Wallis tests; therefore, these parameters were analyzed using both tests.
Because analysis of variance is generally a robust test for sample testing among means and
tests for homogeneity of variance are generally poor (Zar, 1998) only the assumption of
normality was applied to the clinical chemistry dataset. If the assumption of normality was
met, results from the analysis of variance test were used in place of Kruskal-Wallis test
results. All statistical analyses were performed with R (version 2.2.0; R Foundation, Vienna,
Austria). Results of statistical tests were considered to be significant at p < 0.05.
Results
First Hour and Total Water Consumption
There were no significant differences in first hour water consumption among treatment
groups (p = 0.17; Table D.2). Two mallards in the SAMW treatment group consumed
greater than 50 mL/kg in the first hour. Total water consumption increased significantly as
metal content decreased (Table D.2) and was significantly different (p < 0.001) between all
pairs of treatment groups except for 1/10 SAMW and 1/100 SAMW treatment groups.
Signs of Toxicity
Signs of toxicity in SAMW and 1/10 SAMW treatment group mallards were similar to
those reported in study A. SAMW-treated mallards were euthanized in extremis 241 ± 137
minutes following initiation of dosing. Two 1/10 SAMW-treated mallards were euthanized
in extremis 226 and 328 minutes following initiation of dosing. Survivor mallards from the
1/10 SAMW treatment group were lethargic, consumed very little water, and were
occasionally heard wheezing while breathing on the second day of dosing. Mallards from the
1/100 SAMW treatment group initially responded to the treated water with vigorous lateral
head shaking and regurgitation, however similar signs of toxicity were observed less on the
second day of dosing. Despite these signs of toxicity , no 1/100 SAMW-treated mallards
died. Signs of toxicity were absent in control mallards.
AMW Exposures in Birds Final Report - Part I Page 64
Report No. RWO55-T04-47-A February 15, 2007 Texas Tech University
There were no significant among group differences in body mass for the pre-dose
dehydration period (Table D.3). Multiple between group differences in body mass change
existed for the other two time periods (Table D.3).
Clinical Chemistry
Multiple parameters were significantly affected by SAMW treatments. SAMW and 1/10
SAMW treatment mallards had significantly elevated creatine kinase, aspartate transaminase,
and uric acid levels when compared to both control and 1/100 SAMW mallard treatment
groups (Table D.4). Alkaline phosphatase levels were significantly elevated in SAMW-
treated mallards when compared only to 1/100 SAMW and control group mallards.
Phosphorus levels of 1/10 SAMW and SAMW-treated mallards were significantly elevated
when compared to 1/100 SAMW-treated mallards only, and potassium levels of SAMW-
treated mallards were significantly elevated when compared to 1/100 SAMW-treated
mallards. SAMW-treated mallard serum glucose levels were significantly lower compared to
1/10 SAMW-treated mallard levels.
Hematology
Percent heterophil counts in SAMW and 1/10 SAMW treatment mallards were
significantly elevated when compared to both control and 1/100 SAMW treatment groups
(p < 0.001; Table D.5). Conversely, percent lymphocyte counts in SAMW and 1/10 SAMW
treatment mallards were significantly reduced when compared to control and 1/100 SAMW
treatment groups (p < 0.001; Table D.5). Absolute lymphocyte counts were also reduced in
SAMW and 1/10 SAMW treatment groups when compared to the 1/100 SAMW group
(p < 0.001; Table D.5). Mean cell volumes of 1/10 SAMW mallards were significantly
elevated when compared to 1/100 SAMW mallards (p < 0.05; Table D.5). Blood samples
from SAMW mallards were too hemolyzed to determine mean cell volumes. Mean
hematocrit values were highest in SAMW treatment mallards and decreased as dilution of
metal content increased.
AMW Exposures in Birds Final Report - Part I Page 65
Report No. RWO55-T04-47-A February 15, 2007 Texas Tech University
Gross Pathology
Common grossly observable abnormalities in mallards that died in the SAMW and 1/10
SAMW treatment groups were consistent with those identified in Study A. Gross lesions in
survivors from the 1/10 SAMW treatment group were similar and sometimes appeared more
severe than those that belonged to their lethally-treated counterparts. Additionally, surviving
mallards from the 1/10 SAMW group sustained lesions on the ventral surfaces of the tongue
and upper and lower mandibles. There were no treatment-related gross lesions observed in
the 1/100 AMW or control groups.
Examples of macroscopic changes in internal tissues are provided in the appendix.
Discussion
Behavioral, clinical, and pathological responses of SAMW and 1/10 SAMW-treated
mallards were similar to those observed from mallards acutely poisoned with SAMW in
study A. Three of eight mallards in the SAMW treatment group consumed a dose in the first
hour that is above the lowest lethal dose (31.0 mL/kg). Such a finding suggests that birds
have the potential to obtain a lethal dose in a short period of time. The surviving six of eight
survivors from the 1/10 SAMW treatment group sustained severe gastrointestinal injuries and
alterations of some clinical chemistry endpoints that are indicative of liver, kidney, and/or
muscle damage or dysfunction. Gastrointestinal lesions can induce anorexia in birds, as seen
in Study C, and can have potentially lethal implications for birds with high bioenergetic
demands or that are experiencing physiologically stressful circumstances.
One confounding factor in Studies A, C, and D, is the contribution of the acidic nature of
the solution to the overall toxicity of SAMW and AMW. Acidic water containing low levels
of hazardous metals, such as the 1/100 SAMW tested in this study, appear to pose less of a
hazard to birds. However, ducklings exposed to drinking water at pH 3.0 without any added
metals experience 67% mortality over a 5-day exposure period (Foster, 1999). Acid-only
solutions may produce age-dependent toxicity in avian species, however data are limited.
The observed pathologies suggest that AMWs with character similar to the 1/10 SAMW
pose a significant health risk to wild birds that ingest them. These findings are consistent
with the literature pertaining to the acute toxicity of lower levels of AMW contamination or
copper supplementation (ENSR, 1996; Stubblefield et al., 1997; Jensen et al., 1991).
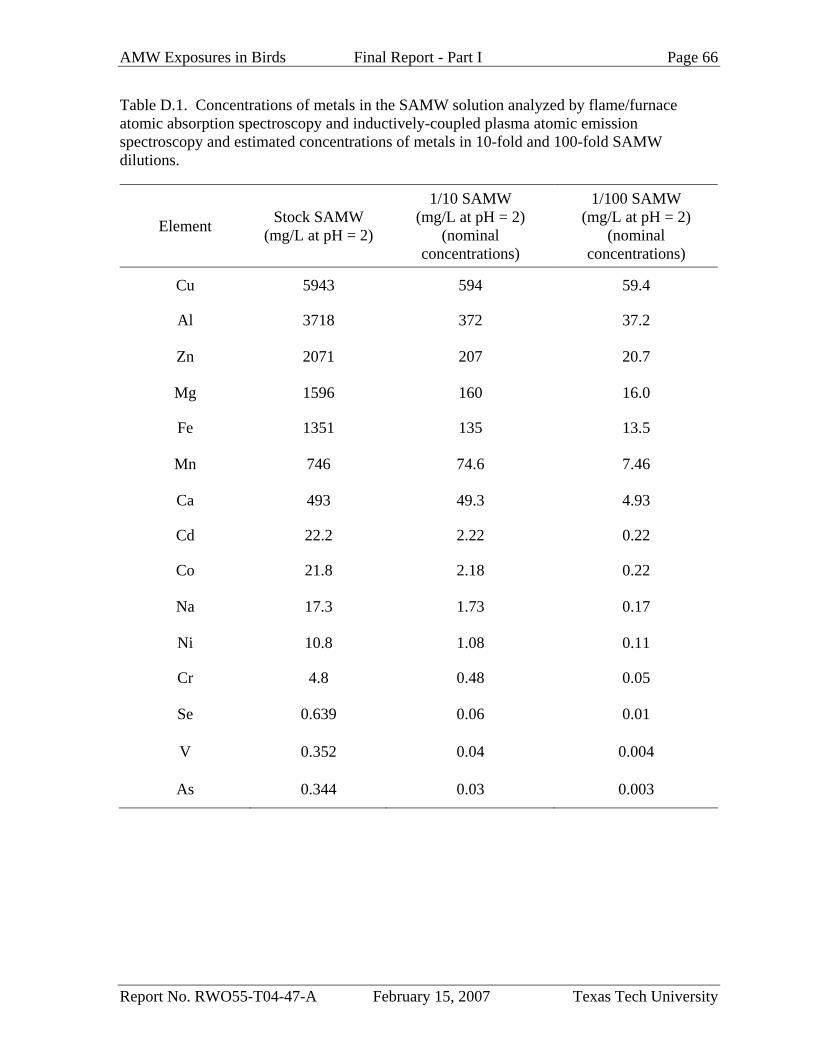
AMW Exposures in Birds Final Report - Part I Page 66
Report No. RWO55-T04-47-A February 15, 2007 Texas Tech University
Table D.1. Concentrations of metals in the SAMW solution analyzed by flame/furnace atomic absorption spectroscopy and inductively-coupled plasma atomic emission spectroscopy and estimated concentrations of metals in 10-fold and 100-fold SAMW dilutions.
Element Stock SAMW (mg/L at pH = 2)
1/10 SAMW (mg/L at pH = 2)
(nominal concentrations)
1/100 SAMW (mg/L at pH = 2)
(nominal concentrations)
Cu 5943 594 59.4
Al 3718 372 37.2
Zn 2071 207 20.7
Mg 1596 160 16.0
Fe 1351 135 13.5
Mn 746 74.6 7.46
Ca 493 49.3 4.93
Cd 22.2 2.22 0.22
Co 21.8 2.18 0.22
Na 17.3 1.73 0.17
Ni 10.8 1.08 0.11
Cr 4.8 0.48 0.05
Se 0.639 0.06 0.01
V 0.352 0.04 0.004
As 0.344 0.03 0.003
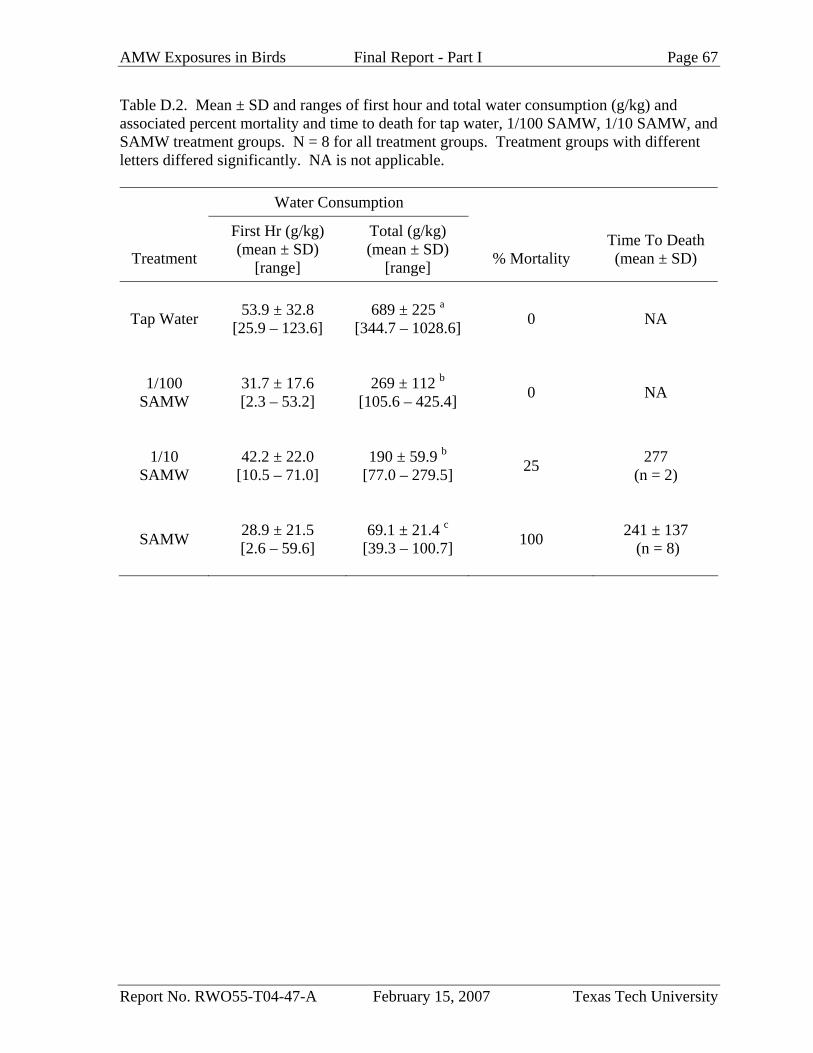
AMW Exposures in Birds Final Report - Part I Page 67
Report No. RWO55-T04-47-A February 15, 2007 Texas Tech University
Table D.2. Mean ± SD and ranges of first hour and total water consumption (g/kg) and associated percent mortality and time to death for tap water, 1/100 SAMW, 1/10 SAMW, and SAMW treatment groups. N = 8 for all treatment groups. Treatment groups with different letters differed significantly. NA is not applicable.
Water Consumption
Treatment
First Hr (g/kg) (mean ± SD)
[range]
Total (g/kg) (mean ± SD)
[range]
% Mortality
Time To Death (mean ± SD)
Tap Water
53.9 ± 32.8
[25.9 – 123.6]
689 ± 225 a [344.7 – 1028.6] 0 NA
1/100 SAMW
31.7 ± 17.6 [2.3 – 53.2]
269 ± 112 b [105.6 – 425.4] 0 NA
1/10 SAMW
42.2 ± 22.0
[10.5 – 71.0]
190 ± 59.9 b [77.0 – 279.5] 25 277
(n = 2)
SAMW
28.9 ± 21.5 [2.6 – 59.6]
69.1 ± 21.4 c [39.3 – 100.7] 100 241 ± 137
(n = 8)
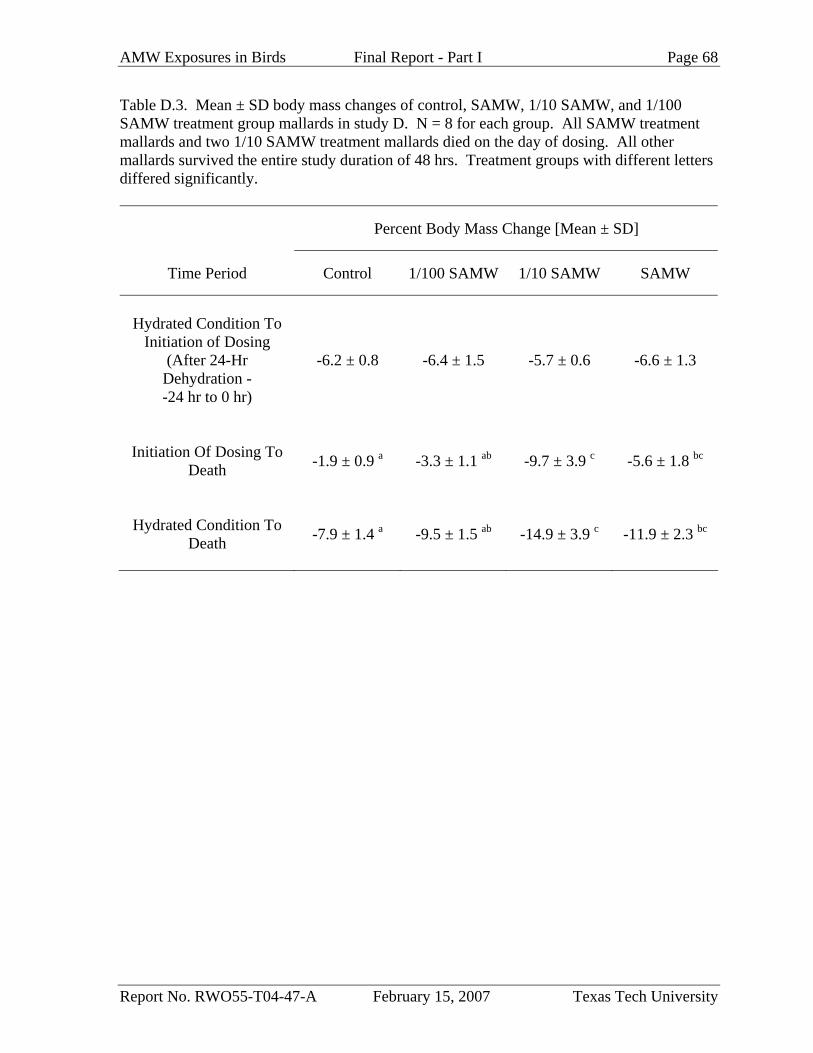
AMW Exposures in Birds Final Report - Part I Page 68
Report No. RWO55-T04-47-A February 15, 2007 Texas Tech University
Table D.3. Mean ± SD body mass changes of control, SAMW, 1/10 SAMW, and 1/100 SAMW treatment group mallards in study D. N = 8 for each group. All SAMW treatment mallards and two 1/10 SAMW treatment mallards died on the day of dosing. All other mallards survived the entire study duration of 48 hrs. Treatment groups with different letters differed significantly.
Percent Body Mass Change [Mean ± SD]
Time Period Control 1/100 SAMW 1/10 SAMW SAMW
Hydrated Condition To
Initiation of Dosing (After 24-Hr
Dehydration - -24 hr to 0 hr)
-6.2 ± 0.8 -6.4 ± 1.5 -5.7 ± 0.6 -6.6 ± 1.3
Initiation Of Dosing To Death -1.9 ± 0.9 a -3.3 ± 1.1 ab -9.7 ± 3.9 c -5.6 ± 1.8 bc
Hydrated Condition To Death -7.9 ± 1.4 a -9.5 ± 1.5 ab -14.9 ± 3.9 c -11.9 ± 2.3 bc
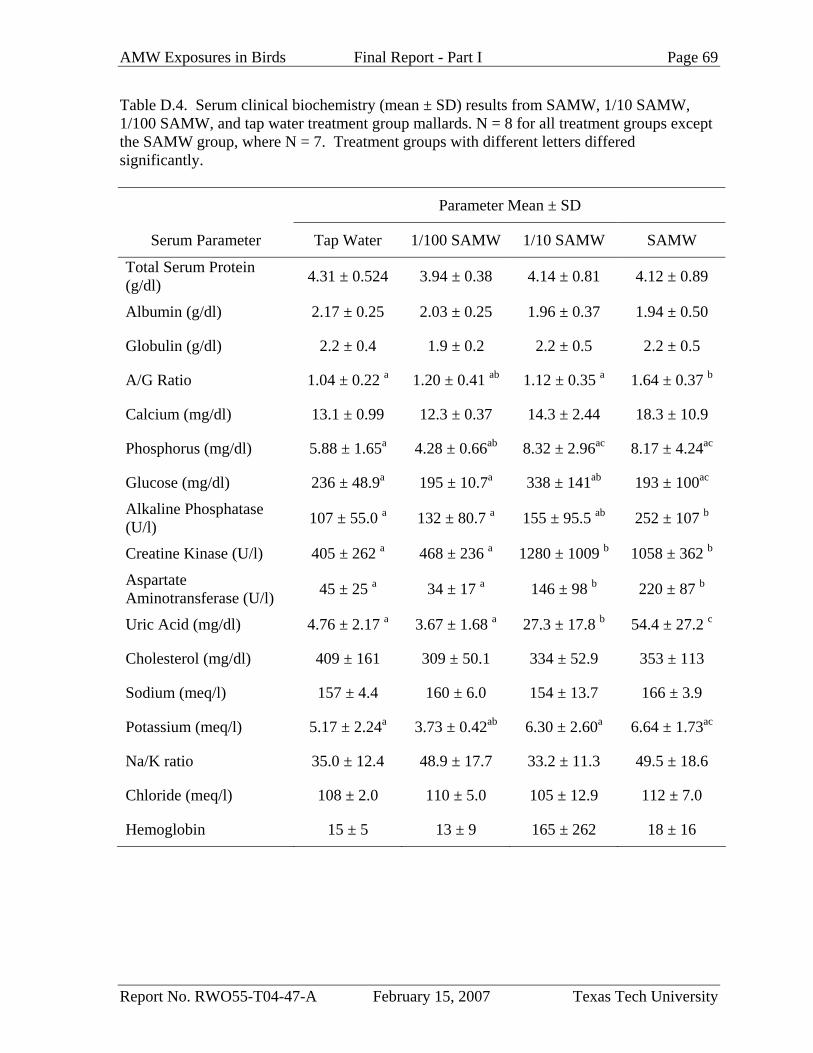
AMW Exposures in Birds Final Report - Part I Page 69
Report No. RWO55-T04-47-A February 15, 2007 Texas Tech University
Table D.4. Serum clinical biochemistry (mean ± SD) results from SAMW, 1/10 SAMW, 1/100 SAMW, and tap water treatment group mallards. N = 8 for all treatment groups except the SAMW group, where N = 7. Treatment groups with different letters differed significantly.
Parameter Mean ± SD
Serum Parameter Tap Water 1/100 SAMW 1/10 SAMW SAMW
Total Serum Protein (g/dl) 4.31 ± 0.524 3.94 ± 0.38 4.14 ± 0.81 4.12 ± 0.89
Albumin (g/dl) 2.17 ± 0.25 2.03 ± 0.25 1.96 ± 0.37 1.94 ± 0.50
Globulin (g/dl) 2.2 ± 0.4 1.9 ± 0.2 2.2 ± 0.5 2.2 ± 0.5
A/G Ratio 1.04 ± 0.22 a 1.20 ± 0.41 ab 1.12 ± 0.35 a 1.64 ± 0.37 b
Calcium (mg/dl) 13.1 ± 0.99 12.3 ± 0.37 14.3 ± 2.44 18.3 ± 10.9
Phosphorus (mg/dl) 5.88 ± 1.65a 4.28 ± 0.66ab 8.32 ± 2.96ac 8.17 ± 4.24ac
Glucose (mg/dl) 236 ± 48.9a 195 ± 10.7a 338 ± 141ab 193 ± 100ac
Alkaline Phosphatase (U/l) 107 ± 55.0 a 132 ± 80.7 a 155 ± 95.5 ab 252 ± 107 b
Creatine Kinase (U/l) 405 ± 262 a 468 ± 236 a 1280 ± 1009 b 1058 ± 362 b
Aspartate Aminotransferase (U/l) 45 ± 25 a 34 ± 17 a 146 ± 98 b 220 ± 87 b
Uric Acid (mg/dl) 4.76 ± 2.17 a 3.67 ± 1.68 a 27.3 ± 17.8 b 54.4 ± 27.2 c
Cholesterol (mg/dl) 409 ± 161 309 ± 50.1 334 ± 52.9 353 ± 113
Sodium (meq/l) 157 ± 4.4 160 ± 6.0 154 ± 13.7 166 ± 3.9
Potassium (meq/l) 5.17 ± 2.24a 3.73 ± 0.42ab 6.30 ± 2.60a 6.64 ± 1.73ac
Na/K ratio 35.0 ± 12.4 48.9 ± 17.7 33.2 ± 11.3 49.5 ± 18.6
Chloride (meq/l) 108 ± 2.0 110 ± 5.0 105 ± 12.9 112 ± 7.0
Hemoglobin 15 ± 5 13 ± 9 165 ± 262 18 ± 16
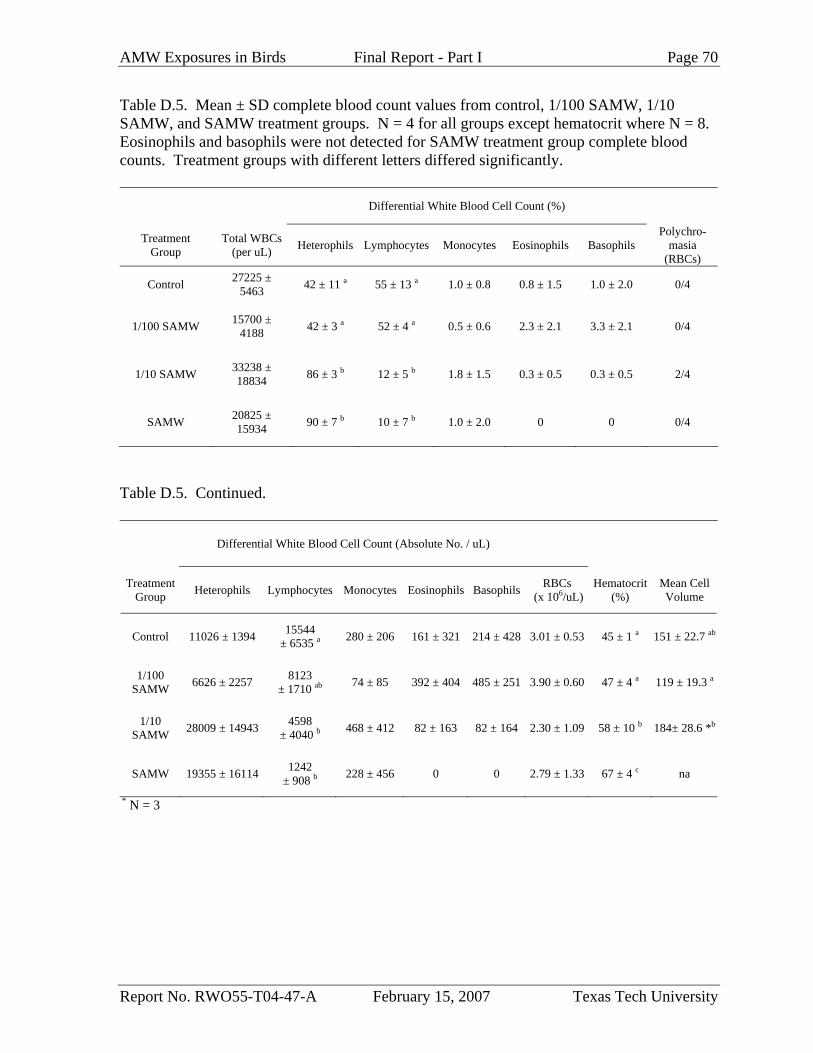
AMW Exposures in Birds Final Report - Part I Page 70
Report No. RWO55-T04-47-A February 15, 2007 Texas Tech University
Table D.5. Mean ± SD complete blood count values from control, 1/100 SAMW, 1/10 SAMW, and SAMW treatment groups. N = 4 for all groups except hematocrit where N = 8. Eosinophils and basophils were not detected for SAMW treatment group complete blood counts. Treatment groups with different letters differed significantly.
Differential White Blood Cell Count (%)
Treatment Group
Total WBCs (per uL) Heterophils Lymphocytes Monocytes Eosinophils Basophils
Polychro-masia
(RBCs)
Control 27225 ± 5463 42 ± 11 a 55 ± 13 a 1.0 ± 0.8 0.8 ± 1.5 1.0 ± 2.0 0/4
1/100 SAMW 15700 ± 4188 42 ± 3 a 52 ± 4 a 0.5 ± 0.6 2.3 ± 2.1 3.3 ± 2.1 0/4
1/10 SAMW 33238 ± 18834 86 ± 3 b 12 ± 5 b 1.8 ± 1.5 0.3 ± 0.5 0.3 ± 0.5 2/4
SAMW 20825 ± 15934 90 ± 7 b 10 ± 7 b 1.0 ± 2.0 0 0 0/4
Table D.5. Continued.
Differential White Blood Cell Count (Absolute No. / uL)
Treatment Group Heterophils Lymphocytes Monocytes Eosinophils Basophils RBCs
(x 106/uL) Hematocrit
(%) Mean Cell Volume
Control 11026 ± 1394 15544 ± 6535 a 280 ± 206 161 ± 321 214 ± 428 3.01 ± 0.53 45 ± 1 a 151 ± 22.7 ab
1/100 SAMW 6626 ± 2257 8123
± 1710 ab 74 ± 85 392 ± 404 485 ± 251 3.90 ± 0.60 47 ± 4 a 119 ± 19.3 a
1/10 SAMW 28009 ± 14943 4598
± 4040 b 468 ± 412 82 ± 163 82 ± 164 2.30 ± 1.09 58 ± 10 b 184± 28.6 *b
SAMW 19355 ± 16114 1242 ± 908 b 228 ± 456 0 0 2.79 ± 1.33 67 ± 4 c na
* N = 3
AMW Exposures in Birds Final Report - Part I Page 71
Report No. RWO55-T04-47-A February 15, 2007 Texas Tech University
Conclusion
Based on the findings from our studies and findings from other reports, we conclude that
acid metalliferous water bodies pose a significant hazard to wildlife that come in contact with
them. Birds that are not averse to AMW have a potential increased risk of injury following
oral exposure, and possibly dermal/feather or ocular exposure as well. Thousands of
migrating birds are likely to be injured every year in the western U.S. due to exposure to
AMW; however limited monitoring effort prevents the ability to accurately assess the
severity of this issue. We have presented data concerning the acute toxicity of multiple
SAMWs that likely reflect worst-case, yet realistic exposure scenarios that correspond to
actual conditions measured at the Phelps Dodge mine sites. While it appears that more
typical concentrations of hazardous metals may be on the order of 2-10 times lower than
those investigated in study A (Stratus, 2003), ponds of relatively lower levels of metal
contamination, such as those examined in study D, may still pose a significant hazard to
wildlife (ENSR, 1996; Stratus, 2003).
AMW Exposures in Birds Final Report - Part I Page 72
Report No. RWO55-T04-47-A February 15, 2007 Texas Tech University
Literature Cited
Beyer, W.N., J. Dalgarn, S. Dudding, J.B. French, R. Mateo, J. Miesner, L. Sileo, and J. Spann. 2004. Zinc and lead poisoning in wild birds in the Tri-State Mining District (Oklahoma, Kansas, and Missouri). Archives of Environmental Contamination and Toxicology. 48: 108-117. ENSR Corporation. 1996. Oral toxicity of Berkeley Pit (Butte, Montana) water to snow geese (Chen caerulescens). Prepared for ARCO, Inc. Document No. 0480-375. Extension Toxicology Network (EXTOXNET). 1996. Copper sulfate. Pesticide Information Project of Cooperative Extension Offices of Cornell University, Oregon State University, the University of Idaho, and the University of California at Davis and the Institute for Environmental Toxicology, Michigan State University. Viewed Online December 4, 2006: http://extoxnet.orst.edu/pips/coppersu.htm. Fairbrother, A., J. Smits, and K.A. Grasman. 2004. Avian Immunotoxicology. Journal of Toxicology and Environmental Health, Part B. 7: 105-137. Gasaway, W.C. and I.O. Buss. 1972. Zinc toxicity in the mallard. Journal of Wildlife Management. 36: 1107-1117. Goldstein, D.L. and E. Skadhauge. 2000. Renal and extrarenal regulation of body fluid composition. In “Sturkie’s Avian Physiology” (G.C. Whittow, ed.), pp. 265-298. Academic Press, London. Henderson, B.M. and R.W Winterfield. 1975. Acute copper toxicosis in the Canada Goose. Avian Diseases. 19(2): 385-387. Henny, C.J., R.J. Hallock and E.F. Hill. 1994. Cyanide and migratory birds at gold mines in Nevada, USA. Ecotoxicology. 3:45-58. Jain, N.C. 1993. Essentials of veterinary hematology. Lea and Febiger. Philadelphia, PA, USA. Jensen, L.S., P.A. Dunn, and K.N. Dobson. 1991. Induction of oral lesions in broiler chicks by supplementing the diet with copper. Avian Diseases. 35: 969-973. Kaplan, L.A., A.J. Pesce, and S.C. Kazmierczak. 2003. Clinical Chemistry: Theory, Analysis, Correlation. Mosby, Inc., St. Louis, MO, USA. Klaassen, M. 2004. May dehydration risk govern long-distance migratory behavior? Journal of Avian Biology. 35: 4-6.
AMW Exposures in Birds Final Report - Part I Page 73
Report No. RWO55-T04-47-A February 15, 2007 Texas Tech University
Koutsos, E.A., K.D. Matson and K.C. Klasing. 2001. Nutrition of birds in the order Psittaciformes: a review. Journal of Avian Medicine and Surgery. 14: 257-275. Levengood, J.M., G.C. Sanderson, W.L. Anderson, G.L. Foley, P.W. Brown, and J.W. Seets. 2000. Journal of Wildlife Diseases. 36(1): 111-123. Minerals Council of Australia. 1996. Tailings storage facilities at Australian gold mines. Submission to the Senate Environment, Recreation, Communications and the Arts References Committee, Canberra, Australia. Pullar, E.M. 1940. The toxicity of various copper compounds and mixtures for domestic birds. Australian Veterinary Journal. 16: 147-162, 203-213. Rattner, B.A., M.A. McKernan, K.M. Eisenreich, W.A. Link, G.H. Olsen, D.J. Hoffman, K.A. Knowles, P.C. McGowan. 2006. Toxicity and hazard of vanadium to mallard ducks (Anas platyrhynchos) and Canada geese (Branta Canadensis). Journal of Toxicology and Environmental Health Part A. 69(4): 331-351. Read, J.L. 1999. A strategy for minimizing waterfowl deaths on toxic waterbodies. Journal of Applied Ecology. 36:345-350. Read, J.L. and R. Pickering. 1999. Ecological and toxicological effects of exposure to an acidic, radioactive tailings storage. Environmental Monitoring and Assessment. 54: 69-85. Sileo, L., W.N. Beyer, and R. Mateo. 2004. Pancreatitis in wild zinc-poisoned waterfowl. Avian Pathology. 32(6): 655-660. Stratus Consulting Inc. 2003. Preassessment Screen for the Chino, Tyrone, and Morenci Mine Sites, Grant County, New Mexico, and Morenci, Arizona. Prepared for USFWS, Albuquerque, NM. Stubblefield, W.A., J. Baroch, P. Dressen, T.R. Spraker and D.M. Getzy. 1997. Evaluation of the toxic properties of acid mine drainage water to snow geese. Abstract No. 009, 18th Annual Meeting Society of Environmental Toxicology and Chemistry, San Francisco, CA. November 16-20. Takei, Y., Y Okawara, and H. Kobayashi. 1988. Water intake induced by water deprivation in the quail, Coturnix coturnix japonica. Journal of Comparative Physiology B 158: 519-525. Tyler, S.J. and S.J. Omerod. 1992. A review of the likely causal pathways relating the reduced density of breeding dippers Cinclus cinclus to the acidification of upland streams. Environmental Pollution. 78:49-55.
AMW Exposures in Birds Final Report - Part I Page 74
Report No. RWO55-T04-47-A February 15, 2007 Texas Tech University
USEPA. 1994. Test Methods for Evaluating Solid Waste, Physical/Chemical Methods. Environmental Protection Agency, Office of Solid Waste and Emergency Response. Zar, J.H. 1998. Biostatistical Analysis. 4th edition. Prentice Hall. Upper Saddle River, New Jersey, USA.
AVIAN CONSUMPTION AND USE OF CONTAMINATED WATER SOURCES:
TOXICOLOGICAL ASSESSMENTS OF EXPOSURE, EFFECTS AND SUSCEPTIBILITY
Final Report – Part I - APPENDICES
Report No. RWO55-T04-47-A
By:
Dr. Michael Hooper, John Isanhart and Dr. Stephen Cox The Institute of Environmental and Human Health
Texas Tech University Box 41163
Lubbock, Texas 79409
Through:
Dr. Reynaldo Patiño Texas Cooperative Fish and Wildlife Research Unit
U.S. Geological Survey, Cooperative Research Units Program Texas Tech University
Box 42120 Lubbock, Texas 79409
Produced for:
Russell MacRae United States Fish and Wildlife Service
New Mexico Ecological Services Field Office 2105 Osuna Road NE
Albuquerque, NM 87113
Dr. Kevin D. Reynolds United States Fish and Wildlife Service
Arizona Ecological Services Field Office 2321 West Royal Palm Road, Suite 103
Phoenix, AZ 85021
Produced Under:
Project No. T04-47, The Institute of Environmental and Human Health (TIEHH), and Research Work Order No..55, Texas Cooperative Fish and Wildlife Research Unit (TCFWRU)
February 15, 2007
AMW Exposures in Birds Final Report – Part I - Appendices Page 2
Report No. RWO55-T04-47-A February 15, 2007 Texas Tech University
Table of Contents A Note on Organization ......................................................................................................3
Study A: MDL Determination ………………………………………………………………………...4
Study A, MDL APP: Table 1 ………………………………………………………………………….5
Study A, MDL APP: Table 2 ………………………………………………………………………….6
Figure A.1-Table A.3-Table A.4 APP ................................................................................7
Table A.5. APP .................................................................................................................19
Table A.6. APP .................................................................................................................20
Table A.7. APP .................................................................................................................21
Table A.8. APP .................................................................................................................25
Table A.9, Table A.10. APP .............................................................................................27
Table A.11. APP ...............................................................................................................35
Table B.2. APP .................................................................................................................39
Table B.3. APP .................................................................................................................40
Figure C.1, C.2, C.3 and Table C.1, C.2, C.3. APP ........................................................42
Table C.4. APP .................................................................................................................73
Table C.5. APP .................................................................................................................92
Table C.6. APP .................................................................................................................95
Table C.7. APP ...............................................................................................................101
Table D.2. APP ..............................................................................................................110
Table D.3. APP ..............................................................................................................143
Table D.4. APP ...............................................................................................................145
Table D.5. APP ...............................................................................................................149
Photographs of Animal Caging and Pathology................................................................152
AMW Exposures in Birds Final Report – Part I - Appendices Page 3
Report No. RWO55-T04-47-A February 15, 2007 Texas Tech University
A Note on Organization These Appendices are organized in the same order as they are referenced or as they appear as tables and figures in the Interim Report. Tables and figures are numbered using the same table and figure numbers as appear in the Report with the suffix “.APP”. Raw data are presented and, in some instances, summary statistics as well.
AMW Exposures in Birds Final Report – Part I - Appendices Page 4
Report No. RWO55-T04-47-A February 15, 2007 Texas Tech University
Study A: MDL Determination Method detection limits (MDL) were calculated for Cu, Al, Zn, Mg, Fe, Mn, Ca, Cd, Co,
Na, Ni, Cr, Se, V, and As in 3% nitric acid (v:v), and Cu, Zn, Mg, Fe, and Mn in mallard
liver and pig blood acid digest matrices. A minimum of seven samples per sample matrix
were analyzed in duplicate for all reported analytes. The MDL procedure was not iterated for
any sample matrix analyzed by atomic absorption methods. MDLs for Al, Cr, and Ca in
nitric acid samples were generated from analyses of multiple iterations of laboratory
standards in water on a Leeman Labs ICP-AES. ICP data were generated by the Texas Tech
University Geosciences Department.
Liver and blood samples for MDL determinations were digested and diluted in the same
manner as samples analyzed in Study A. Digestion matrices were filtered with filter paper
prior to being analyzed by flame AAS. All liver and blood matrix levels of analytes, except
Mn, were greater than 10 times the MDL of analytes in reagent water. For scenarios where
the level of sample analyte exceeds 10 times the MDL of analyte in reagent, MDL values are
usually not reported for such matrices because MDLs determined under such circumstances
may not reflect method variance at lower analyte concentrations. However, because liver
and blood contain substantial constitutive levels of all metals analyzed, we report estimated
MDLs for liver and blood matrices for demonstration purposes. MDLs for Mn in liver and
blood matrices are representative of the true MDL.
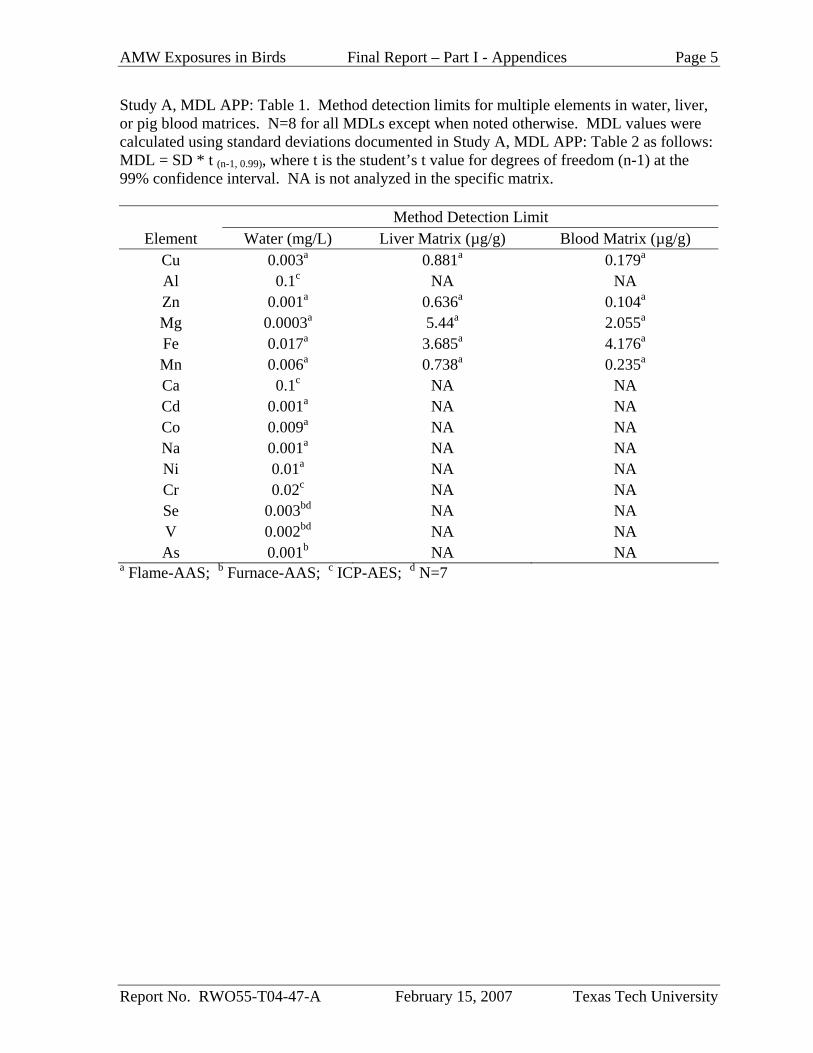
AMW Exposures in Birds Final Report – Part I - Appendices Page 5
Report No. RWO55-T04-47-A February 15, 2007 Texas Tech University
Study A, MDL APP: Table 1. Method detection limits for multiple elements in water, liver, or pig blood matrices. N=8 for all MDLs except when noted otherwise. MDL values were calculated using standard deviations documented in Study A, MDL APP: Table 2 as follows: MDL = SD * t (n-1, 0.99), where t is the student’s t value for degrees of freedom (n-1) at the 99% confidence interval. NA is not analyzed in the specific matrix.
Method Detection Limit Element Water (mg/L) Liver Matrix (µg/g) Blood Matrix (µg/g)
Cu 0.003a 0.881a 0.179a Al 0.1c NA NA Zn 0.001a 0.636a 0.104a Mg 0.0003a 5.44a 2.055a Fe 0.017a 3.685a 4.176a Mn 0.006a 0.738a 0.235a Ca 0.1c NA NA Cd 0.001a NA NA Co 0.009a NA NA Na 0.001a NA NA Ni 0.01a NA NA Cr 0.02c NA NA Se 0.003bd NA NA V 0.002bd NA NA As 0.001b NA NA
a Flame-AAS; b Furnace-AAS; c ICP-AES; d N=7
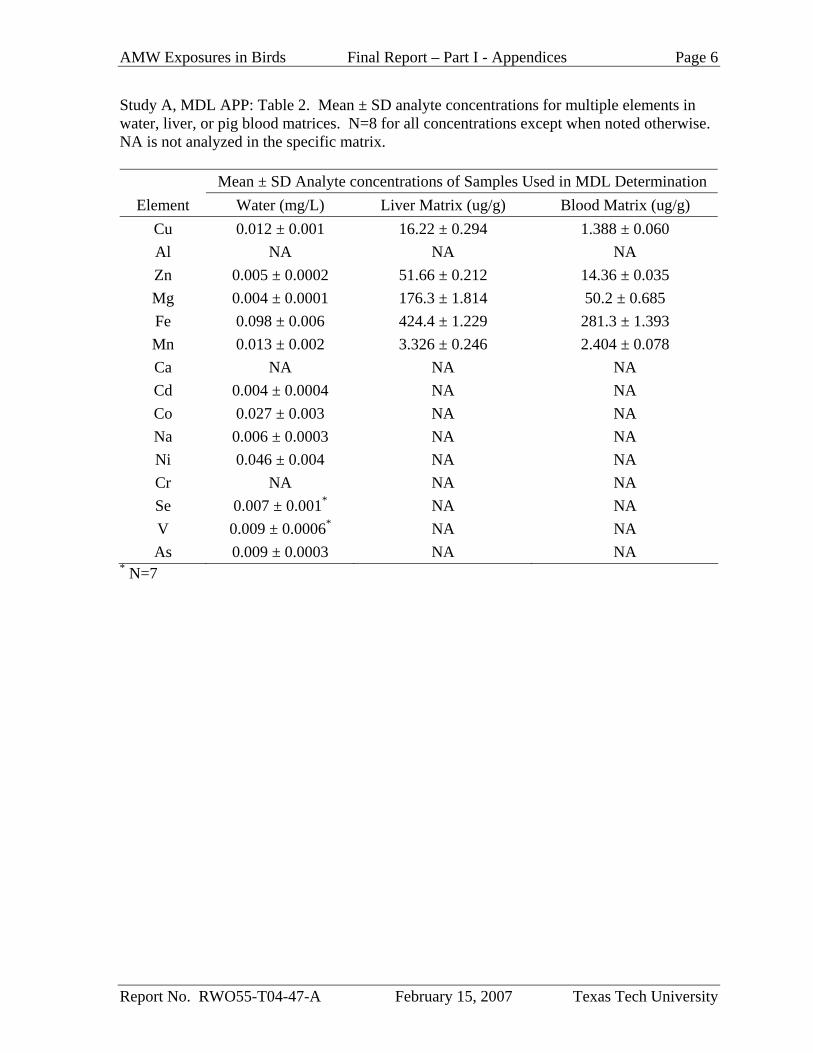
AMW Exposures in Birds Final Report – Part I - Appendices Page 6
Report No. RWO55-T04-47-A February 15, 2007 Texas Tech University
Study A, MDL APP: Table 2. Mean ± SD analyte concentrations for multiple elements in water, liver, or pig blood matrices. N=8 for all concentrations except when noted otherwise. NA is not analyzed in the specific matrix.
Mean ± SD Analyte concentrations of Samples Used in MDL Determination Element Water (mg/L) Liver Matrix (ug/g) Blood Matrix (ug/g)
Cu 0.012 ± 0.001 16.22 ± 0.294 1.388 ± 0.060 Al NA NA NA Zn 0.005 ± 0.0002 51.66 ± 0.212 14.36 ± 0.035 Mg 0.004 ± 0.0001 176.3 ± 1.814 50.2 ± 0.685 Fe 0.098 ± 0.006 424.4 ± 1.229 281.3 ± 1.393 Mn 0.013 ± 0.002 3.326 ± 0.246 2.404 ± 0.078 Ca NA NA NA Cd 0.004 ± 0.0004 NA NA Co 0.027 ± 0.003 NA NA Na 0.006 ± 0.0003 NA NA Ni 0.046 ± 0.004 NA NA Cr NA NA NA Se 0.007 ± 0.001* NA NA V 0.009 ± 0.0006* NA NA As 0.009 ± 0.0003 NA NA
* N=7
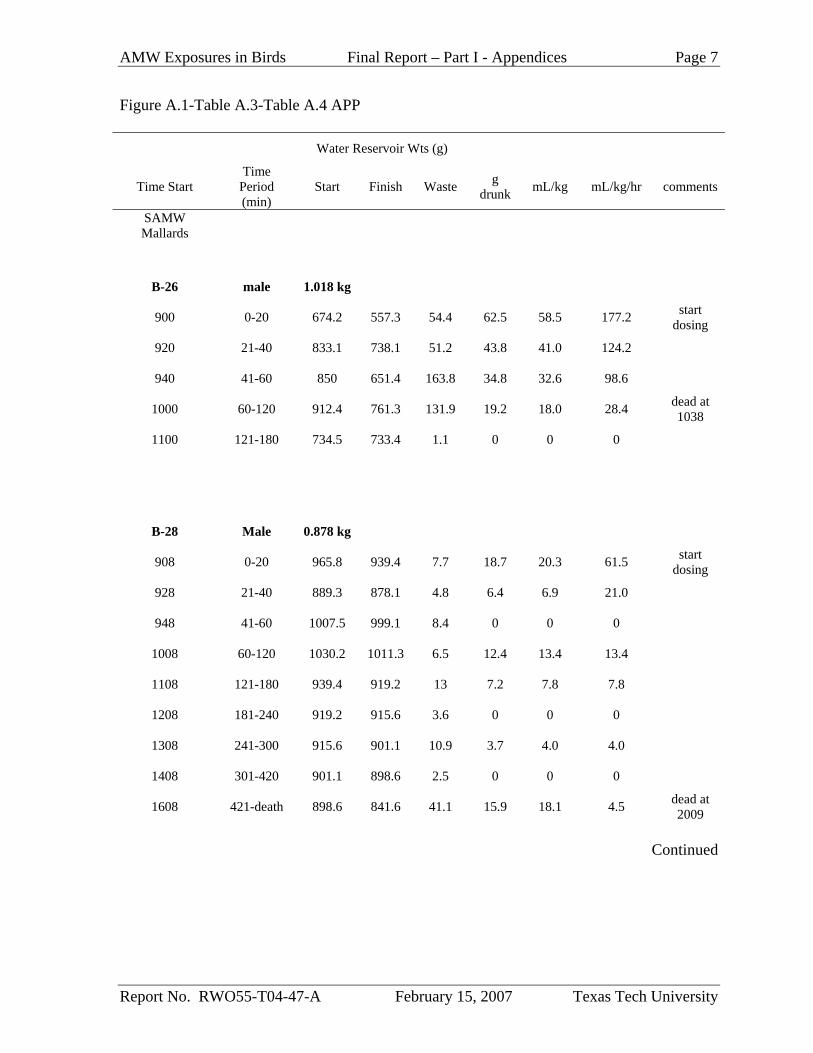
AMW Exposures in Birds Final Report – Part I - Appendices Page 7
Report No. RWO55-T04-47-A February 15, 2007 Texas Tech University
Figure A.1-Table A.3-Table A.4 APP
Water Reservoir Wts (g)
Time Start Time
Period (min)
Start Finish Waste g drunk mL/kg mL/kg/hr comments
SAMW Mallards
B-26 male 1.018 kg
900 0-20 674.2 557.3 54.4 62.5 58.5 177.2 start dosing
920 21-40 833.1 738.1 51.2 43.8 41.0 124.2
940 41-60 850 651.4 163.8 34.8 32.6 98.6
1000 60-120 912.4 761.3 131.9 19.2 18.0 28.4 dead at 1038
1100 121-180 734.5 733.4 1.1 0 0 0
B-28 Male 0.878 kg
908 0-20 965.8 939.4 7.7 18.7 20.3 61.5 start dosing
928 21-40 889.3 878.1 4.8 6.4 6.9 21.0
948 41-60 1007.5 999.1 8.4 0 0 0
1008 60-120 1030.2 1011.3 6.5 12.4 13.4 13.4
1108 121-180 939.4 919.2 13 7.2 7.8 7.8
1208 181-240 919.2 915.6 3.6 0 0 0
1308 241-300 915.6 901.1 10.9 3.7 4.0 4.0
1408 301-420 901.1 898.6 2.5 0 0 0
1608 421-death 898.6 841.6 41.1 15.9 18.1 4.5 dead at 2009
Continued
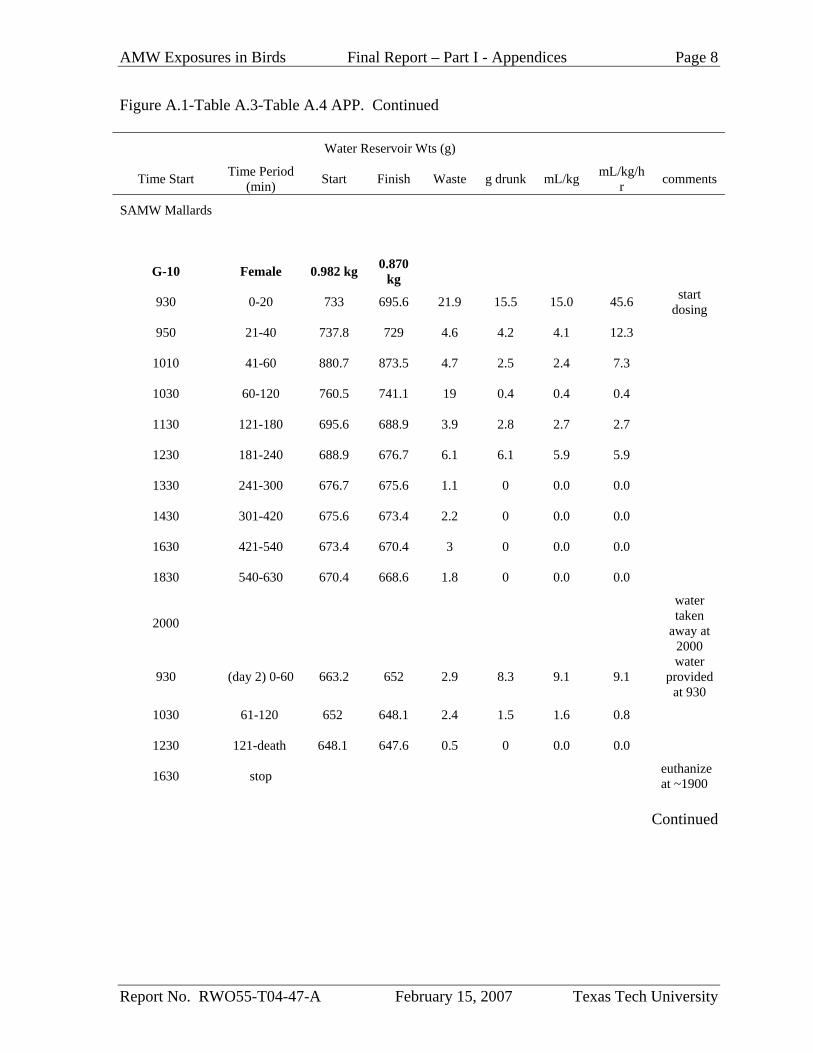
AMW Exposures in Birds Final Report – Part I - Appendices Page 8
Report No. RWO55-T04-47-A February 15, 2007 Texas Tech University
Figure A.1-Table A.3-Table A.4 APP. Continued
Water Reservoir Wts (g)
Time Start Time Period (min) Start Finish Waste g drunk mL/kg mL/kg/h
r comments
SAMW Mallards
G-10 Female 0.982 kg 0.870 kg
930 0-20 733 695.6 21.9 15.5 15.0 45.6 start dosing
950 21-40 737.8 729 4.6 4.2 4.1 12.3
1010 41-60 880.7 873.5 4.7 2.5 2.4 7.3
1030 60-120 760.5 741.1 19 0.4 0.4 0.4
1130 121-180 695.6 688.9 3.9 2.8 2.7 2.7
1230 181-240 688.9 676.7 6.1 6.1 5.9 5.9
1330 241-300 676.7 675.6 1.1 0 0.0 0.0
1430 301-420 675.6 673.4 2.2 0 0.0 0.0
1630 421-540 673.4 670.4 3 0 0.0 0.0
1830 540-630 670.4 668.6 1.8 0 0.0 0.0
2000
water taken
away at 2000
930 (day 2) 0-60 663.2 652 2.9 8.3 9.1 9.1 water
provided at 930
1030 61-120 652 648.1 2.4 1.5 1.6 0.8
1230 121-death 648.1 647.6 0.5 0 0.0 0.0
1630 stop euthanize at ~1900
Continued
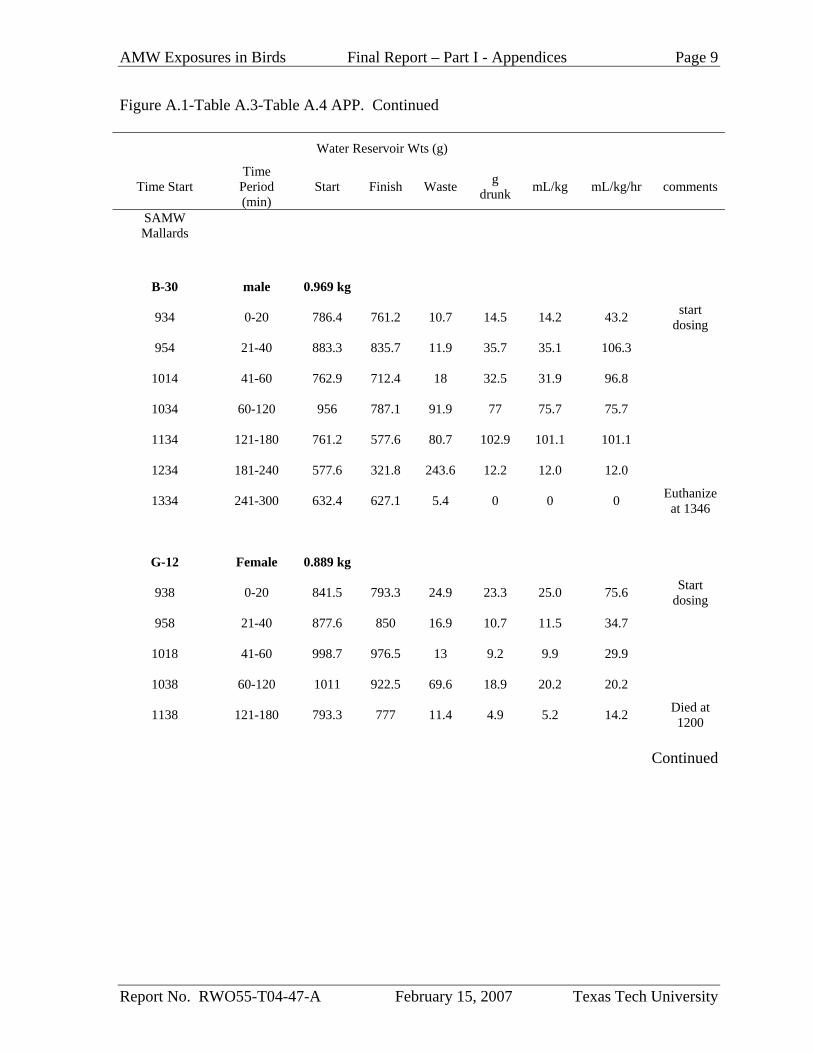
AMW Exposures in Birds Final Report – Part I - Appendices Page 9
Report No. RWO55-T04-47-A February 15, 2007 Texas Tech University
Figure A.1-Table A.3-Table A.4 APP. Continued
Water Reservoir Wts (g)
Time Start Time
Period (min)
Start Finish Waste g drunk mL/kg mL/kg/hr comments
SAMW Mallards
B-30 male 0.969 kg
934 0-20 786.4 761.2 10.7 14.5 14.2 43.2 start dosing
954 21-40 883.3 835.7 11.9 35.7 35.1 106.3
1014 41-60 762.9 712.4 18 32.5 31.9 96.8
1034 60-120 956 787.1 91.9 77 75.7 75.7
1134 121-180 761.2 577.6 80.7 102.9 101.1 101.1
1234 181-240 577.6 321.8 243.6 12.2 12.0 12.0
1334 241-300 632.4 627.1 5.4 0 0 0 Euthanize at 1346
G-12 Female 0.889 kg
938 0-20 841.5 793.3 24.9 23.3 25.0 75.6 Start dosing
958 21-40 877.6 850 16.9 10.7 11.5 34.7
1018 41-60 998.7 976.5 13 9.2 9.9 29.9
1038 60-120 1011 922.5 69.6 18.9 20.2 20.2
1138 121-180 793.3 777 11.4 4.9 5.2 14.2 Died at 1200
Continued
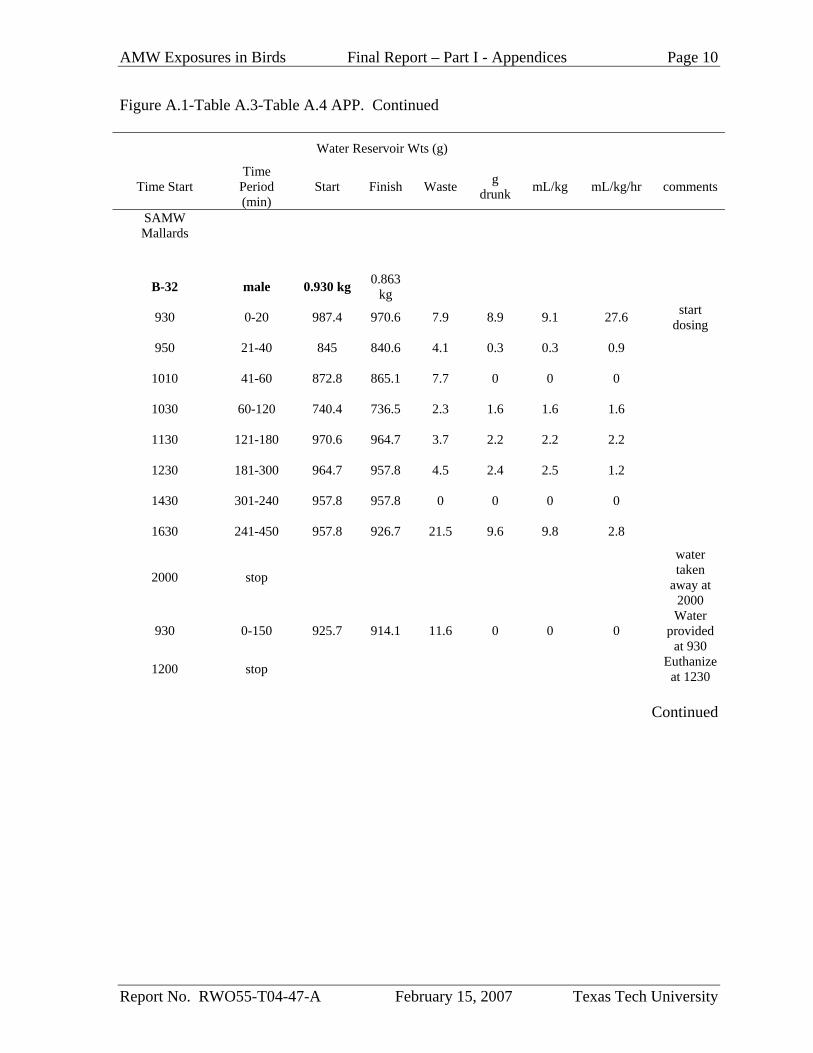
AMW Exposures in Birds Final Report – Part I - Appendices Page 10
Report No. RWO55-T04-47-A February 15, 2007 Texas Tech University
Figure A.1-Table A.3-Table A.4 APP. Continued
Water Reservoir Wts (g)
Time Start Time
Period (min)
Start Finish Waste g drunk mL/kg mL/kg/hr comments
SAMW Mallards
B-32 male 0.930 kg 0.863 kg
930 0-20 987.4 970.6 7.9 8.9 9.1 27.6 start dosing
950 21-40 845 840.6 4.1 0.3 0.3 0.9
1010 41-60 872.8 865.1 7.7 0 0 0
1030 60-120 740.4 736.5 2.3 1.6 1.6 1.6
1130 121-180 970.6 964.7 3.7 2.2 2.2 2.2
1230 181-300 964.7 957.8 4.5 2.4 2.5 1.2
1430 301-240 957.8 957.8 0 0 0 0
1630 241-450 957.8 926.7 21.5 9.6 9.8 2.8
2000 stop
water taken
away at 2000
930 0-150 925.7 914.1 11.6 0 0 0 Water
provided at 930
1200 stop Euthanize at 1230
Continued
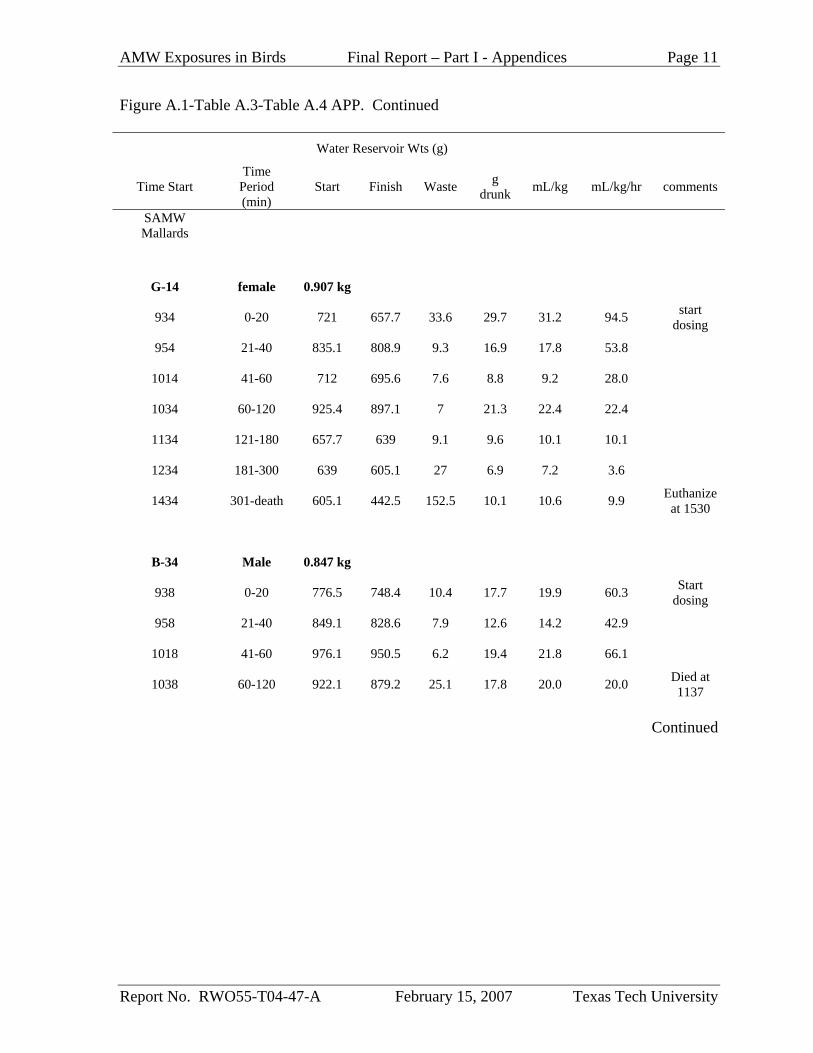
AMW Exposures in Birds Final Report – Part I - Appendices Page 11
Report No. RWO55-T04-47-A February 15, 2007 Texas Tech University
Figure A.1-Table A.3-Table A.4 APP. Continued
Water Reservoir Wts (g)
Time Start Time
Period (min)
Start Finish Waste g drunk mL/kg mL/kg/hr comments
SAMW Mallards
G-14 female 0.907 kg
934 0-20 721 657.7 33.6 29.7 31.2 94.5 start dosing
954 21-40 835.1 808.9 9.3 16.9 17.8 53.8
1014 41-60 712 695.6 7.6 8.8 9.2 28.0
1034 60-120 925.4 897.1 7 21.3 22.4 22.4
1134 121-180 657.7 639 9.1 9.6 10.1 10.1
1234 181-300 639 605.1 27 6.9 7.2 3.6
1434 301-death 605.1 442.5 152.5 10.1 10.6 9.9 Euthanize at 1530
B-34 Male 0.847 kg
938 0-20 776.5 748.4 10.4 17.7 19.9 60.3 Start dosing
958 21-40 849.1 828.6 7.9 12.6 14.2 42.9
1018 41-60 976.1 950.5 6.2 19.4 21.8 66.1
1038 60-120 922.1 879.2 25.1 17.8 20.0 20.0 Died at 1137
Continued
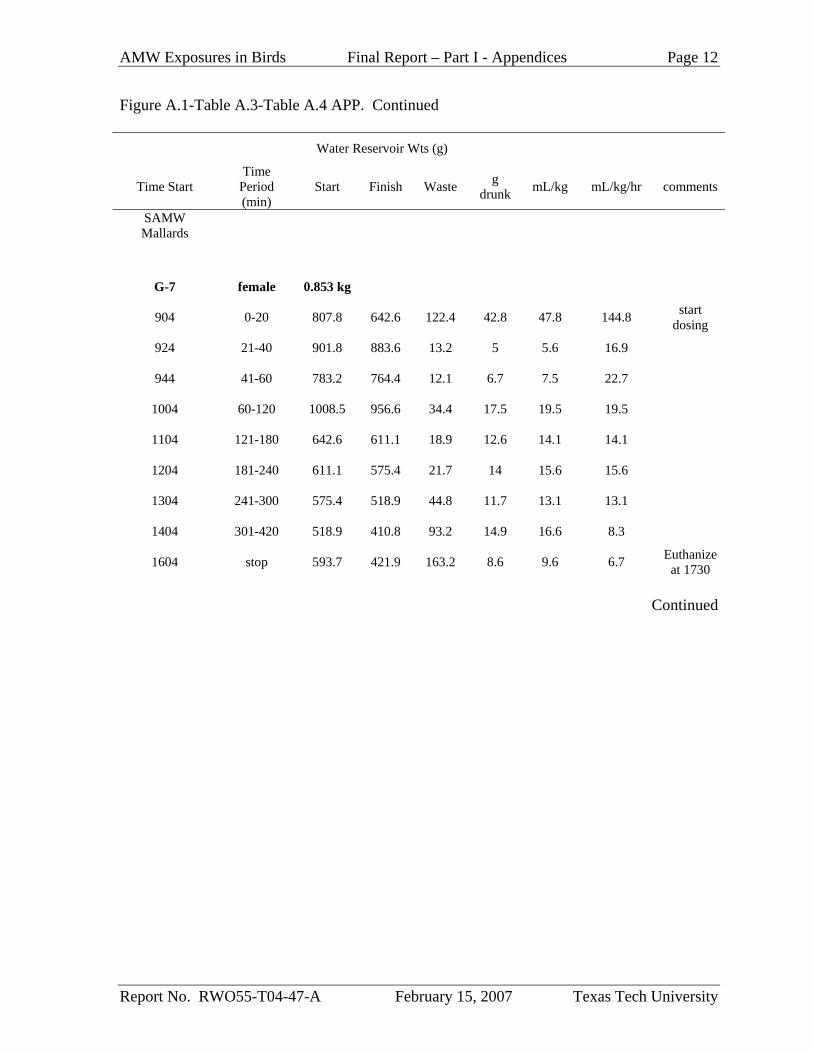
AMW Exposures in Birds Final Report – Part I - Appendices Page 12
Report No. RWO55-T04-47-A February 15, 2007 Texas Tech University
Figure A.1-Table A.3-Table A.4 APP. Continued
Water Reservoir Wts (g)
Time Start Time
Period (min)
Start Finish Waste g drunk mL/kg mL/kg/hr comments
SAMW Mallards
G-7 female 0.853 kg
904 0-20 807.8 642.6 122.4 42.8 47.8 144.8 start dosing
924 21-40 901.8 883.6 13.2 5 5.6 16.9
944 41-60 783.2 764.4 12.1 6.7 7.5 22.7
1004 60-120 1008.5 956.6 34.4 17.5 19.5 19.5
1104 121-180 642.6 611.1 18.9 12.6 14.1 14.1
1204 181-240 611.1 575.4 21.7 14 15.6 15.6
1304 241-300 575.4 518.9 44.8 11.7 13.1 13.1
1404 301-420 518.9 410.8 93.2 14.9 16.6 8.3
1604 stop 593.7 421.9 163.2 8.6 9.6 6.7 Euthanize at 1730
Continued
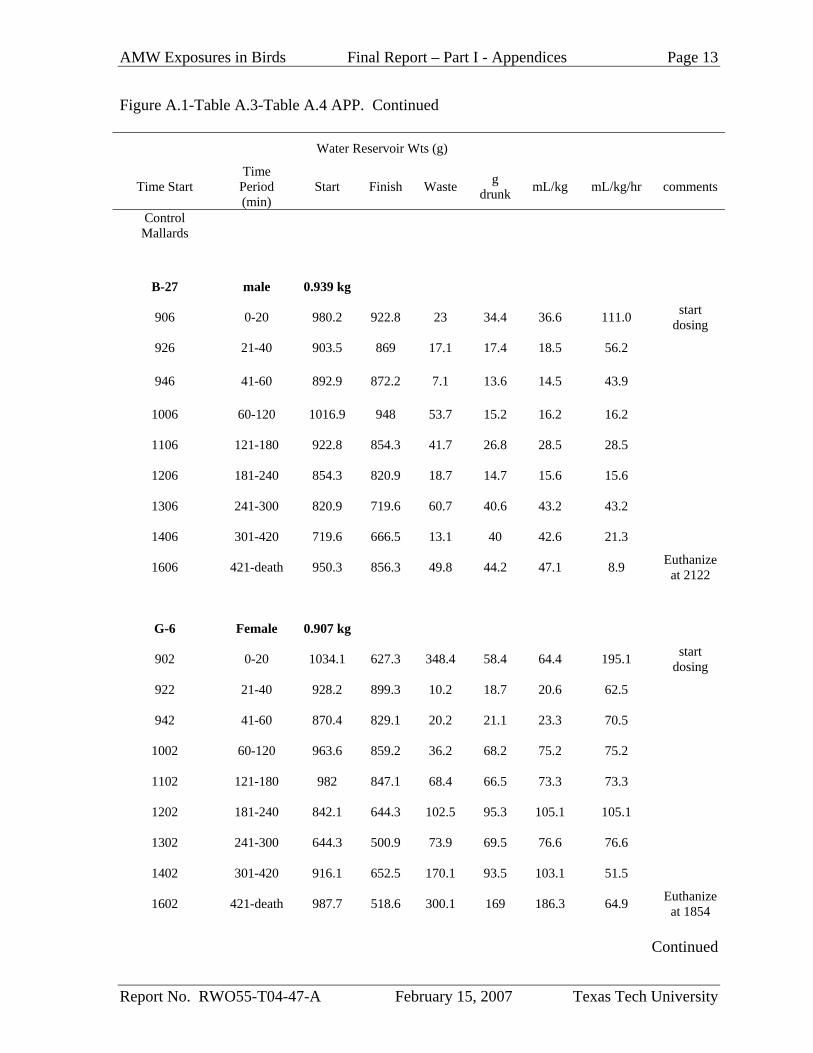
AMW Exposures in Birds Final Report – Part I - Appendices Page 13
Report No. RWO55-T04-47-A February 15, 2007 Texas Tech University
Figure A.1-Table A.3-Table A.4 APP. Continued
Water Reservoir Wts (g)
Time Start Time
Period (min)
Start Finish Waste g drunk mL/kg mL/kg/hr comments
Control Mallards
B-27 male 0.939 kg
906 0-20 980.2 922.8 23 34.4 36.6 111.0 start dosing
926 21-40 903.5 869 17.1 17.4 18.5 56.2
946 41-60 892.9 872.2 7.1 13.6 14.5 43.9
1006 60-120 1016.9 948 53.7 15.2 16.2 16.2
1106 121-180 922.8 854.3 41.7 26.8 28.5 28.5
1206 181-240 854.3 820.9 18.7 14.7 15.6 15.6
1306 241-300 820.9 719.6 60.7 40.6 43.2 43.2
1406 301-420 719.6 666.5 13.1 40 42.6 21.3
1606 421-death 950.3 856.3 49.8 44.2 47.1 8.9 Euthanize at 2122
G-6 Female 0.907 kg
902 0-20 1034.1 627.3 348.4 58.4 64.4 195.1 start dosing
922 21-40 928.2 899.3 10.2 18.7 20.6 62.5
942 41-60 870.4 829.1 20.2 21.1 23.3 70.5
1002 60-120 963.6 859.2 36.2 68.2 75.2 75.2
1102 121-180 982 847.1 68.4 66.5 73.3 73.3
1202 181-240 842.1 644.3 102.5 95.3 105.1 105.1
1302 241-300 644.3 500.9 73.9 69.5 76.6 76.6
1402 301-420 916.1 652.5 170.1 93.5 103.1 51.5
1602 421-death 987.7 518.6 300.1 169 186.3 64.9 Euthanize at 1854
Continued
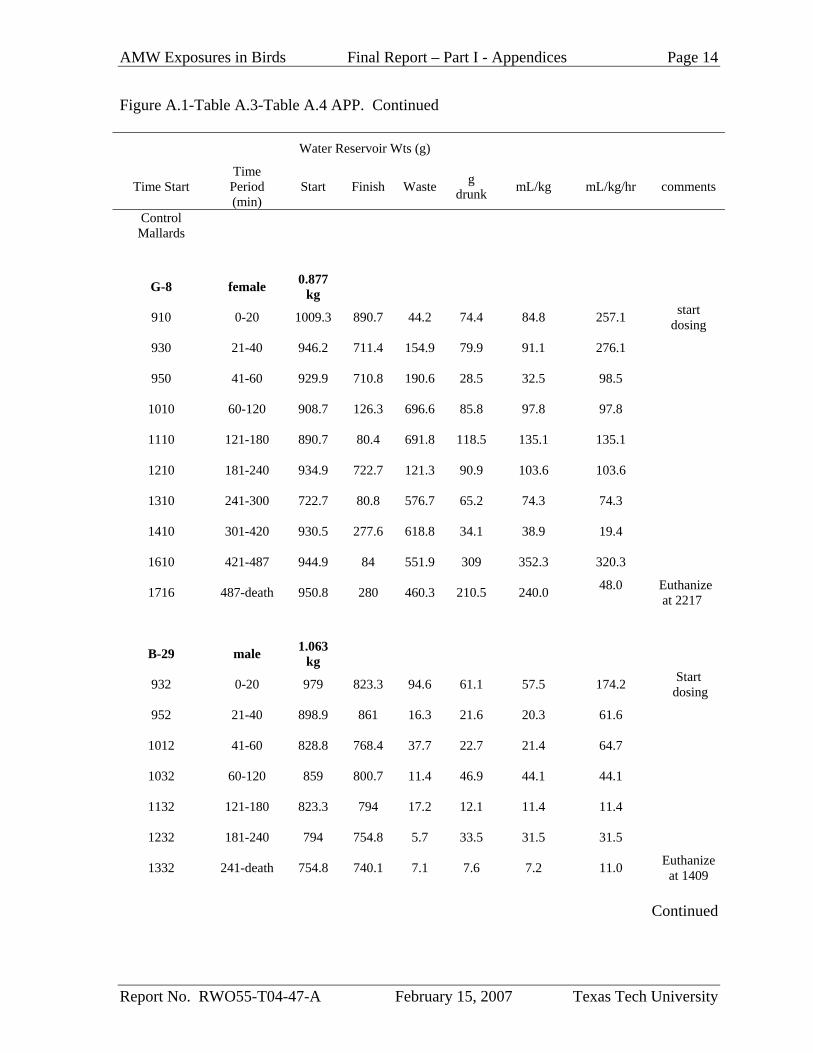
AMW Exposures in Birds Final Report – Part I - Appendices Page 14
Report No. RWO55-T04-47-A February 15, 2007 Texas Tech University
Figure A.1-Table A.3-Table A.4 APP. Continued
Water Reservoir Wts (g)
Time Start Time
Period (min)
Start Finish Waste g drunk mL/kg mL/kg/hr comments
Control Mallards
G-8 female 0.877 kg
910 0-20 1009.3 890.7 44.2 74.4 84.8 257.1 start dosing
930 21-40 946.2 711.4 154.9 79.9 91.1 276.1
950 41-60 929.9 710.8 190.6 28.5 32.5 98.5
1010 60-120 908.7 126.3 696.6 85.8 97.8 97.8
1110 121-180 890.7 80.4 691.8 118.5 135.1 135.1
1210 181-240 934.9 722.7 121.3 90.9 103.6 103.6
1310 241-300 722.7 80.8 576.7 65.2 74.3 74.3
1410 301-420 930.5 277.6 618.8 34.1 38.9 19.4
1610 421-487 944.9 84 551.9 309 352.3 320.3
1716 487-death 950.8 280 460.3 210.5 240.0 48.0
Euthanize at 2217
B-29 male 1.063 kg
932 0-20 979 823.3 94.6 61.1 57.5 174.2 Start dosing
952 21-40 898.9 861 16.3 21.6 20.3 61.6
1012 41-60 828.8 768.4 37.7 22.7 21.4 64.7
1032 60-120 859 800.7 11.4 46.9 44.1 44.1
1132 121-180 823.3 794 17.2 12.1 11.4 11.4
1232 181-240 794 754.8 5.7 33.5 31.5 31.5
1332 241-death 754.8 740.1 7.1 7.6 7.2 11.0 Euthanize at 1409
Continued
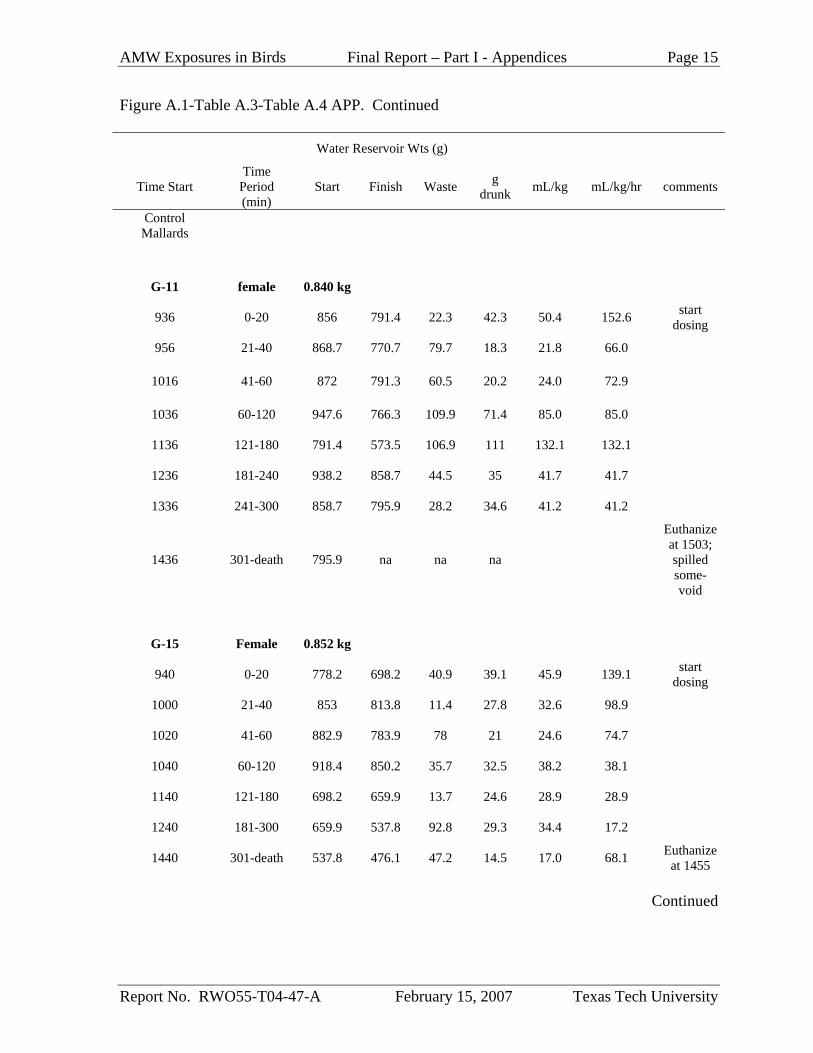
AMW Exposures in Birds Final Report – Part I - Appendices Page 15
Report No. RWO55-T04-47-A February 15, 2007 Texas Tech University
Figure A.1-Table A.3-Table A.4 APP. Continued
Water Reservoir Wts (g)
Time Start Time
Period (min)
Start Finish Waste g drunk mL/kg mL/kg/hr comments
Control Mallards
G-11 female 0.840 kg
936 0-20 856 791.4 22.3 42.3 50.4 152.6 start dosing
956 21-40 868.7 770.7 79.7 18.3 21.8 66.0
1016 41-60 872 791.3 60.5 20.2 24.0 72.9
1036 60-120 947.6 766.3 109.9 71.4 85.0 85.0
1136 121-180 791.4 573.5 106.9 111 132.1 132.1
1236 181-240 938.2 858.7 44.5 35 41.7 41.7
1336 241-300 858.7 795.9 28.2 34.6 41.2 41.2
1436 301-death 795.9 na na na
Euthanize at 1503; spilled some-void
G-15 Female 0.852 kg
940 0-20 778.2 698.2 40.9 39.1 45.9 139.1 start dosing
1000 21-40 853 813.8 11.4 27.8 32.6 98.9
1020 41-60 882.9 783.9 78 21 24.6 74.7
1040 60-120 918.4 850.2 35.7 32.5 38.2 38.1
1140 121-180 698.2 659.9 13.7 24.6 28.9 28.9
1240 181-300 659.9 537.8 92.8 29.3 34.4 17.2
1440 301-death 537.8 476.1 47.2 14.5 17.0 68.1 Euthanize at 1455
Continued
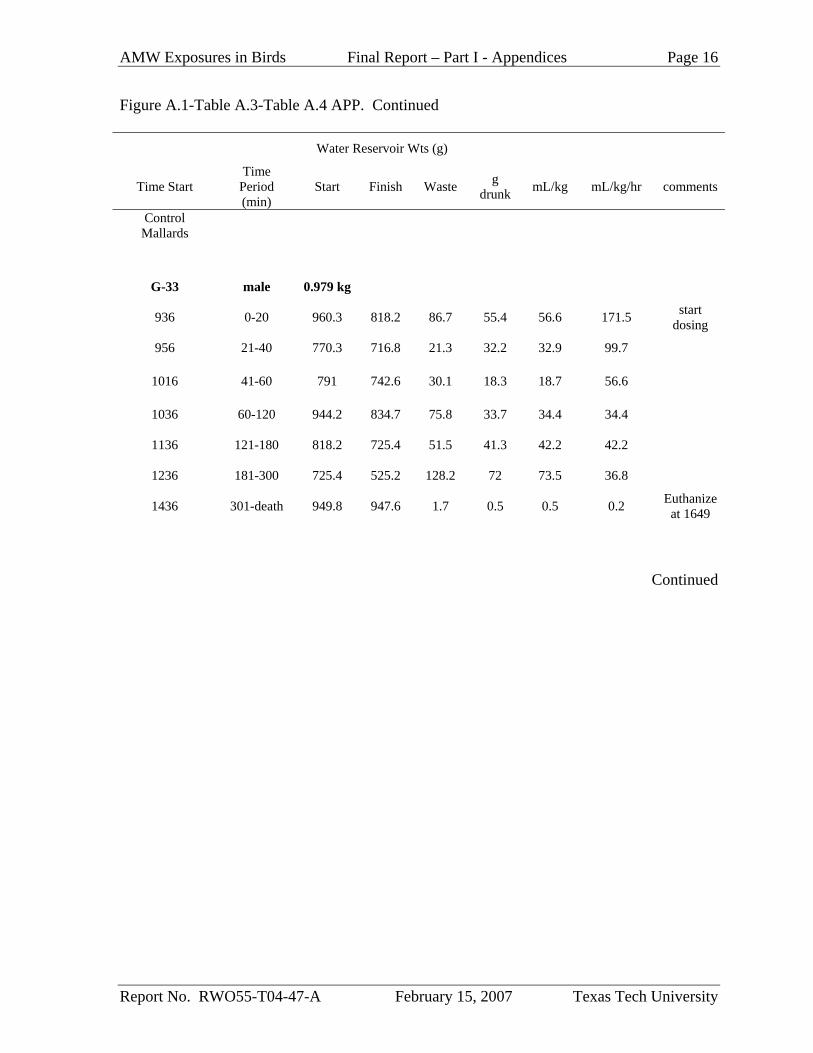
AMW Exposures in Birds Final Report – Part I - Appendices Page 16
Report No. RWO55-T04-47-A February 15, 2007 Texas Tech University
Figure A.1-Table A.3-Table A.4 APP. Continued
Water Reservoir Wts (g)
Time Start Time
Period (min)
Start Finish Waste g drunk mL/kg mL/kg/hr comments
Control Mallards
G-33 male 0.979 kg
936 0-20 960.3 818.2 86.7 55.4 56.6 171.5 start dosing
956 21-40 770.3 716.8 21.3 32.2 32.9 99.7
1016 41-60 791 742.6 30.1 18.3 18.7 56.6
1036 60-120 944.2 834.7 75.8 33.7 34.4 34.4
1136 121-180 818.2 725.4 51.5 41.3 42.2 42.2
1236 181-300 725.4 525.2 128.2 72 73.5 36.8
1436 301-death 949.8 947.6 1.7 0.5 0.5 0.2 Euthanizeat 1649
Continued
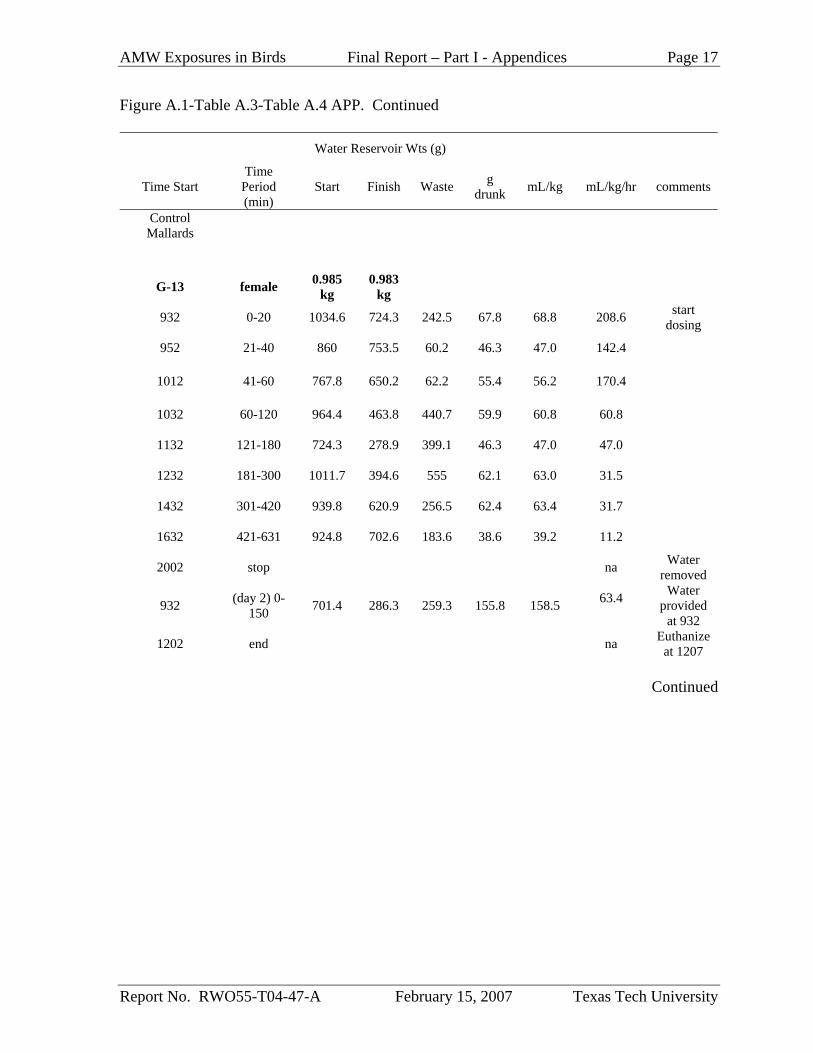
AMW Exposures in Birds Final Report – Part I - Appendices Page 17
Report No. RWO55-T04-47-A February 15, 2007 Texas Tech University
Figure A.1-Table A.3-Table A.4 APP. Continued
Water Reservoir Wts (g)
Time Start Time
Period (min)
Start Finish Waste g drunk mL/kg mL/kg/hr comments
Control Mallards
G-13 female 0.985 kg
0.983 kg
932 0-20 1034.6 724.3 242.5 67.8 68.8 208.6 start dosing
952 21-40 860 753.5 60.2 46.3 47.0 142.4
1012 41-60 767.8 650.2 62.2 55.4 56.2 170.4
1032 60-120 964.4 463.8 440.7 59.9 60.8 60.8
1132 121-180 724.3 278.9 399.1 46.3 47.0 47.0
1232 181-300 1011.7 394.6 555 62.1 63.0 31.5
1432 301-420 939.8 620.9 256.5 62.4 63.4 31.7
1632 421-631 924.8 702.6 183.6 38.6 39.2 11.2
2002 stop na Water removed
932 (day 2) 0-150 701.4 286.3 259.3 155.8 158.5 63.4
Water provided
at 932
1202 end na Euthanize at 1207
Continued
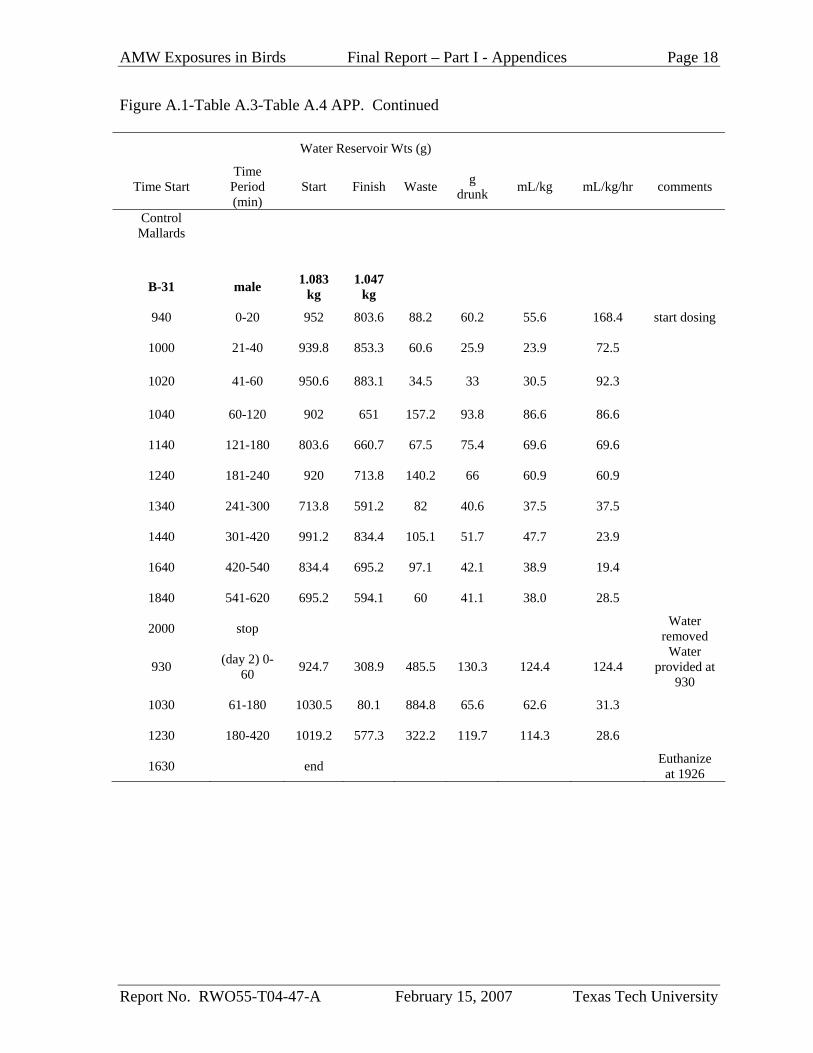
AMW Exposures in Birds Final Report – Part I - Appendices Page 18
Report No. RWO55-T04-47-A February 15, 2007 Texas Tech University
Figure A.1-Table A.3-Table A.4 APP. Continued
Water Reservoir Wts (g)
Time Start Time
Period (min)
Start Finish Waste g drunk mL/kg mL/kg/hr comments
Control Mallards
B-31 male 1.083 kg
1.047 kg
940 0-20 952 803.6 88.2 60.2 55.6 168.4 start dosing
1000 21-40 939.8 853.3 60.6 25.9 23.9 72.5
1020 41-60 950.6 883.1 34.5 33 30.5 92.3
1040 60-120 902 651 157.2 93.8 86.6 86.6
1140 121-180 803.6 660.7 67.5 75.4 69.6 69.6
1240 181-240 920 713.8 140.2 66 60.9 60.9
1340 241-300 713.8 591.2 82 40.6 37.5 37.5
1440 301-420 991.2 834.4 105.1 51.7 47.7 23.9
1640 420-540 834.4 695.2 97.1 42.1 38.9 19.4
1840 541-620 695.2 594.1 60 41.1 38.0 28.5
2000 stop Water removed
930 (day 2) 0-60 924.7 308.9 485.5 130.3 124.4 124.4
Water provided at
930
1030 61-180 1030.5 80.1 884.8 65.6 62.6 31.3
1230 180-420 1019.2 577.3 322.2 119.7 114.3 28.6
1630 end Euthanize at 1926
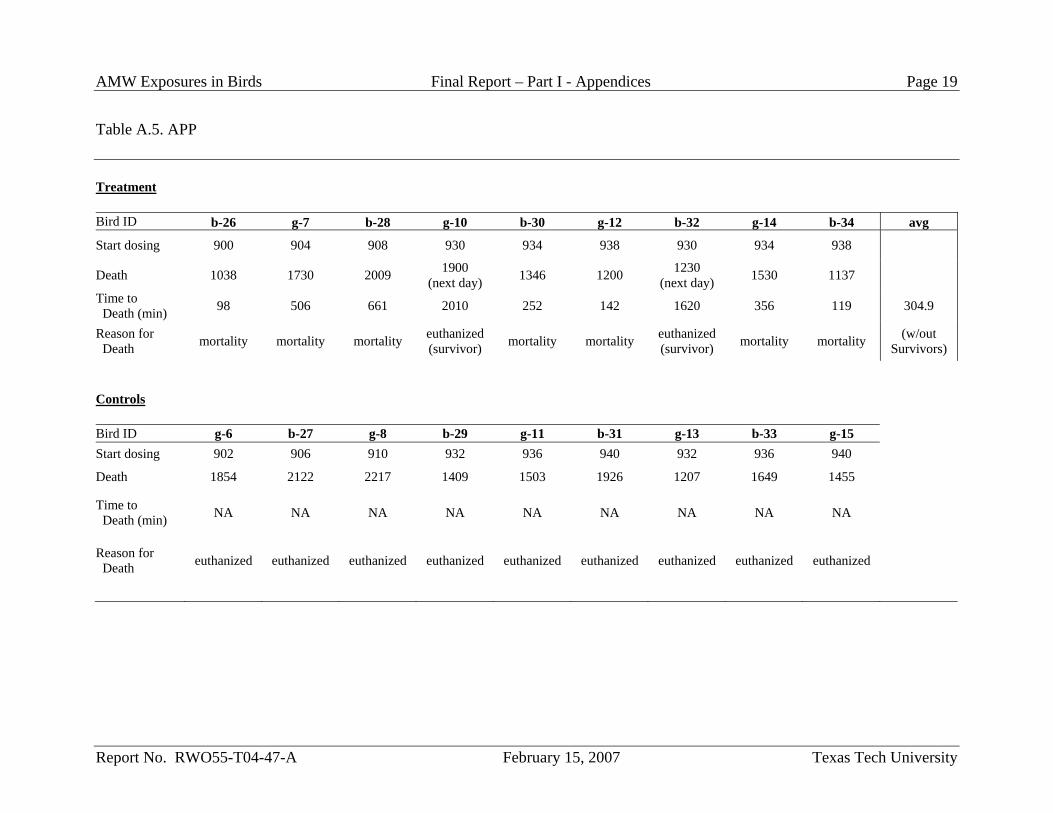
AMW Exposures in Birds Final Report – Part I - Appendices Page 19
Report No. RWO55-T04-47-A February 15, 2007 Texas Tech University
Table A.5. APP Treatment Bird ID b-26 g-7 b-28 g-10 b-30 g-12 b-32 g-14 b-34 avg
Start dosing 900 904 908 930 934 938 930 934 938
Death 1038 1730 2009 1900 (next day) 1346 1200 1230
(next day) 1530 1137
Time to Death (min) 98 506 661 2010 252 142 1620 356 119 304.9
Reason for Death mortality mortality mortality euthanized
(survivor) mortality mortality euthanized (survivor) mortality mortality (w/out
Survivors)
Controls Bird ID g-6 b-27 g-8 b-29 g-11 b-31 g-13 b-33 g-15 Start dosing 902 906 910 932 936 940 932 936 940
Death 1854 2122 2217 1409 1503 1926 1207 1649 1455
Time to Death (min) NA NA NA NA NA NA NA NA NA
Reason for Death euthanized euthanized euthanized euthanized euthanized euthanized euthanized euthanized euthanized
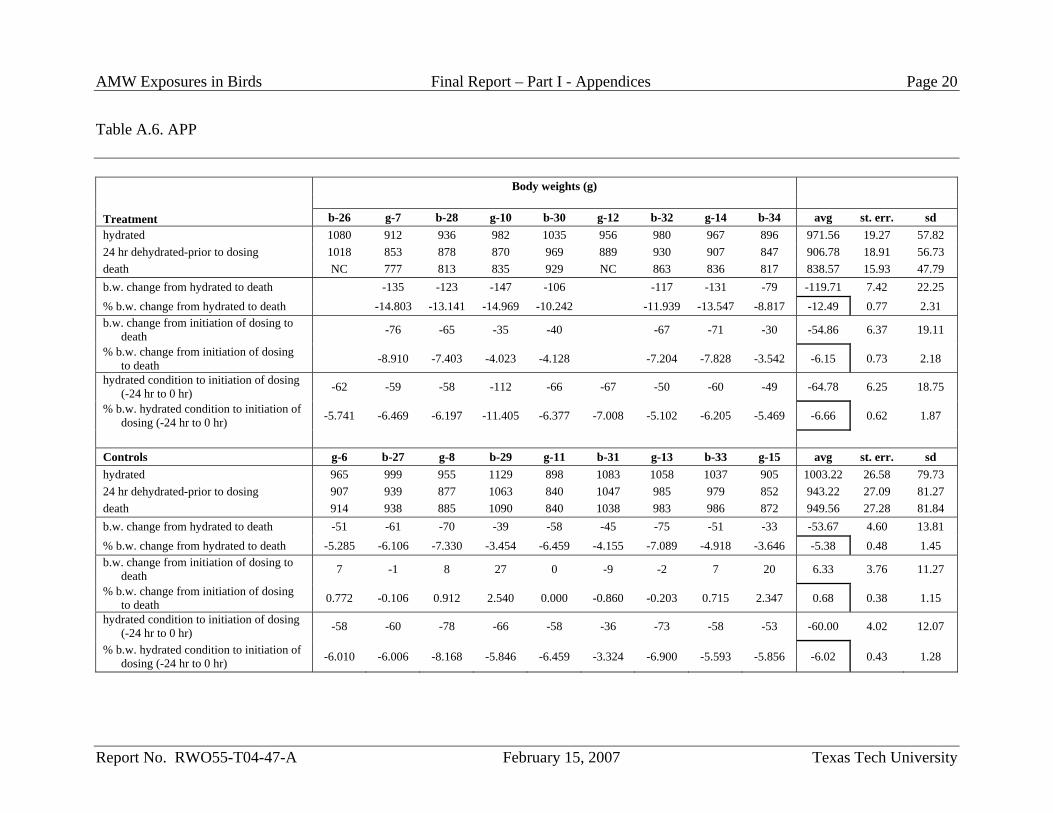
AMW Exposures in Birds Final Report – Part I - Appendices Page 20
Report No. RWO55-T04-47-A February 15, 2007 Texas Tech University
Table A.6. APP
Body weights (g) Treatment b-26 g-7 b-28 g-10 b-30 g-12 b-32 g-14 b-34 avg st. err. sd hydrated 1080 912 936 982 1035 956 980 967 896 971.56 19.27 57.82 24 hr dehydrated-prior to dosing 1018 853 878 870 969 889 930 907 847 906.78 18.91 56.73 death NC 777 813 835 929 NC 863 836 817 838.57 15.93 47.79 b.w. change from hydrated to death -135 -123 -147 -106 -117 -131 -79 -119.71 7.42 22.25 % b.w. change from hydrated to death -14.803 -13.141 -14.969 -10.242 -11.939 -13.547 -8.817 -12.49 0.77 2.31 b.w. change from initiation of dosing to
death -76 -65 -35 -40 -67 -71 -30 -54.86 6.37 19.11
% b.w. change from initiation of dosing to death -8.910 -7.403 -4.023 -4.128 -7.204 -7.828 -3.542 -6.15 0.73 2.18
hydrated condition to initiation of dosing (-24 hr to 0 hr) -62 -59 -58 -112 -66 -67 -50 -60 -49 -64.78 6.25 18.75
% b.w. hydrated condition to initiation of dosing (-24 hr to 0 hr) -5.741 -6.469 -6.197 -11.405 -6.377 -7.008 -5.102 -6.205 -5.469 -6.66 0.62 1.87
Controls g-6 b-27 g-8 b-29 g-11 b-31 g-13 b-33 g-15 avg st. err. sd hydrated 965 999 955 1129 898 1083 1058 1037 905 1003.22 26.58 79.73 24 hr dehydrated-prior to dosing 907 939 877 1063 840 1047 985 979 852 943.22 27.09 81.27 death 914 938 885 1090 840 1038 983 986 872 949.56 27.28 81.84 b.w. change from hydrated to death -51 -61 -70 -39 -58 -45 -75 -51 -33 -53.67 4.60 13.81 % b.w. change from hydrated to death -5.285 -6.106 -7.330 -3.454 -6.459 -4.155 -7.089 -4.918 -3.646 -5.38 0.48 1.45 b.w. change from initiation of dosing to
death 7 -1 8 27 0 -9 -2 7 20 6.33 3.76 11.27
% b.w. change from initiation of dosing to death 0.772 -0.106 0.912 2.540 0.000 -0.860 -0.203 0.715 2.347 0.68 0.38 1.15
hydrated condition to initiation of dosing (-24 hr to 0 hr) -58 -60 -78 -66 -58 -36 -73 -58 -53 -60.00 4.02 12.07
% b.w. hydrated condition to initiation of dosing (-24 hr to 0 hr) -6.010 -6.006 -8.168 -5.846 -6.459 -3.324 -6.900 -5.593 -5.856 -6.02 0.43 1.28
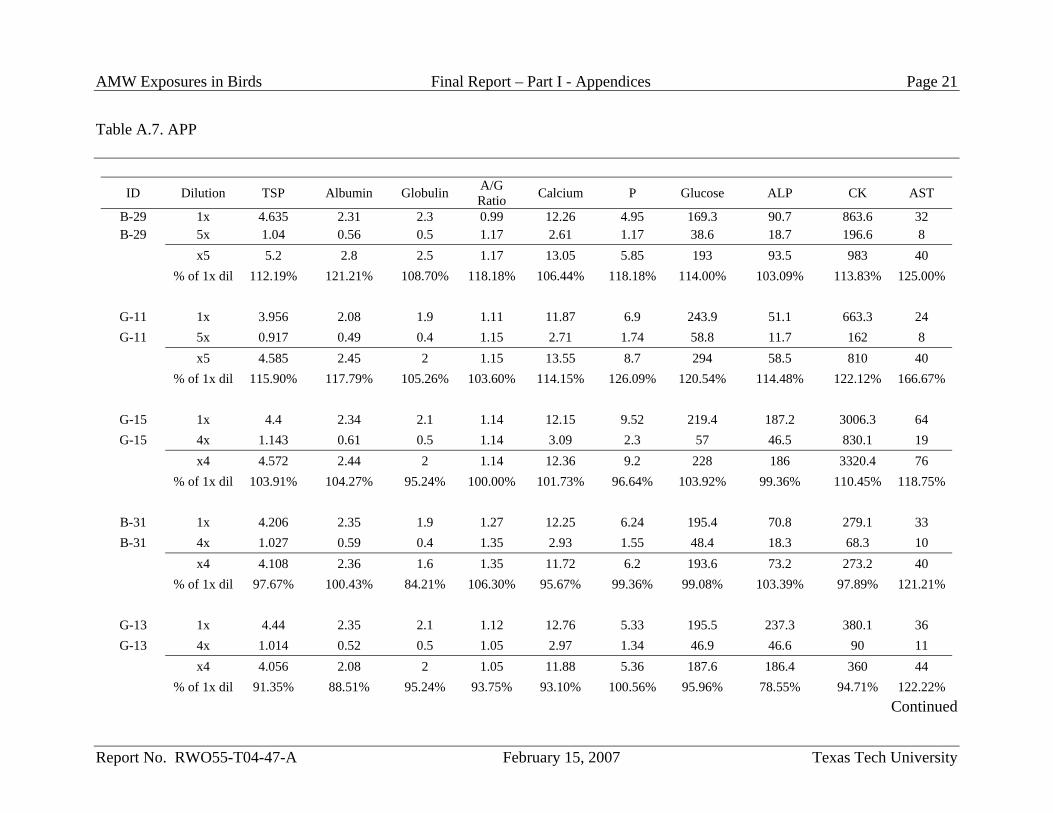
AMW Exposures in Birds Final Report – Part I - Appendices Page 21
Report No. RWO55-T04-47-A February 15, 2007 Texas Tech University
Table A.7. APP
ID Dilution TSP Albumin Globulin A/G Ratio Calcium P Glucose ALP CK AST
B-29 1x 4.635 2.31 2.3 0.99 12.26 4.95 169.3 90.7 863.6 32 B-29 5x 1.04 0.56 0.5 1.17 2.61 1.17 38.6 18.7 196.6 8
x5 5.2 2.8 2.5 1.17 13.05 5.85 193 93.5 983 40 % of 1x dil 112.19% 121.21% 108.70% 118.18% 106.44% 118.18% 114.00% 103.09% 113.83% 125.00%
G-11 1x 3.956 2.08 1.9 1.11 11.87 6.9 243.9 51.1 663.3 24 G-11 5x 0.917 0.49 0.4 1.15 2.71 1.74 58.8 11.7 162 8
x5 4.585 2.45 2 1.15 13.55 8.7 294 58.5 810 40 % of 1x dil 115.90% 117.79% 105.26% 103.60% 114.15% 126.09% 120.54% 114.48% 122.12% 166.67%
G-15 1x 4.4 2.34 2.1 1.14 12.15 9.52 219.4 187.2 3006.3 64 G-15 4x 1.143 0.61 0.5 1.14 3.09 2.3 57 46.5 830.1 19
x4 4.572 2.44 2 1.14 12.36 9.2 228 186 3320.4 76 % of 1x dil 103.91% 104.27% 95.24% 100.00% 101.73% 96.64% 103.92% 99.36% 110.45% 118.75%
B-31 1x 4.206 2.35 1.9 1.27 12.25 6.24 195.4 70.8 279.1 33 B-31 4x 1.027 0.59 0.4 1.35 2.93 1.55 48.4 18.3 68.3 10
x4 4.108 2.36 1.6 1.35 11.72 6.2 193.6 73.2 273.2 40 % of 1x dil 97.67% 100.43% 84.21% 106.30% 95.67% 99.36% 99.08% 103.39% 97.89% 121.21%
G-13 1x 4.44 2.35 2.1 1.12 12.76 5.33 195.5 237.3 380.1 36 G-13 4x 1.014 0.52 0.5 1.05 2.97 1.34 46.9 46.6 90 11
x4 4.056 2.08 2 1.05 11.88 5.36 187.6 186.4 360 44 % of 1x dil 91.35% 88.51% 95.24% 93.75% 93.10% 100.56% 95.96% 78.55% 94.71% 122.22%
Continued
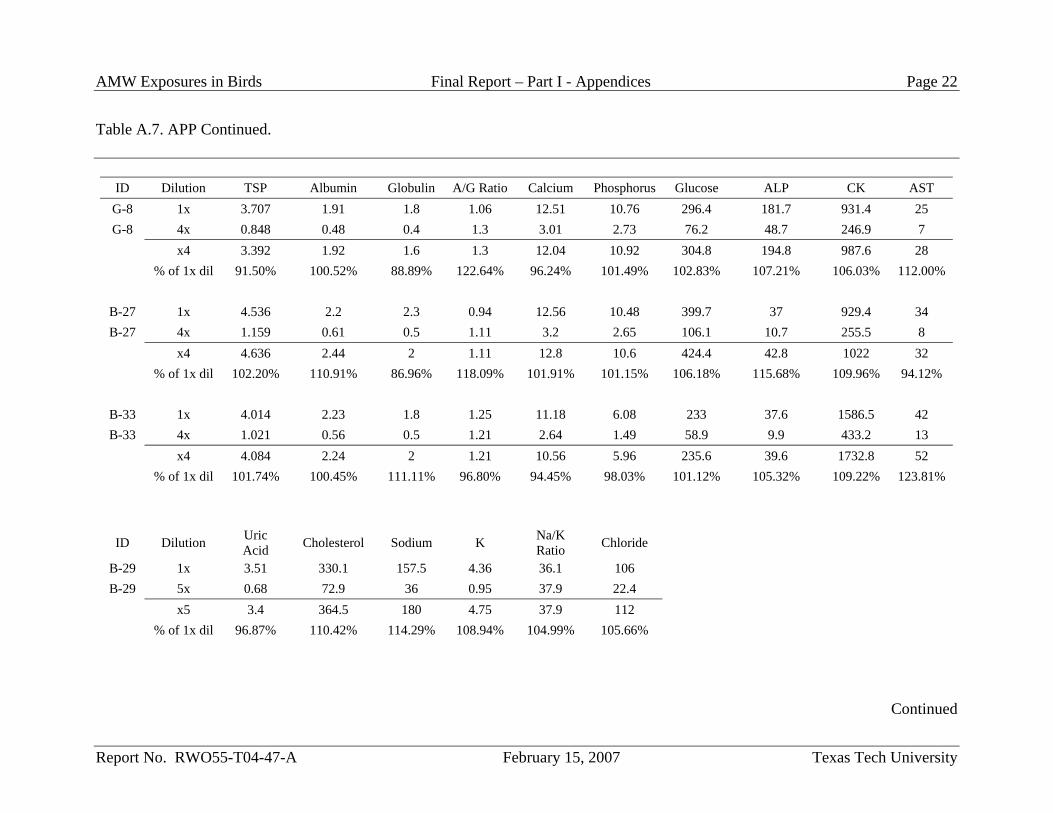
AMW Exposures in Birds Final Report – Part I - Appendices Page 22
Report No. RWO55-T04-47-A February 15, 2007 Texas Tech University
Table A.7. APP Continued.
ID Dilution TSP Albumin Globulin A/G Ratio Calcium Phosphorus Glucose ALP CK AST G-8 1x 3.707 1.91 1.8 1.06 12.51 10.76 296.4 181.7 931.4 25 G-8 4x 0.848 0.48 0.4 1.3 3.01 2.73 76.2 48.7 246.9 7
x4 3.392 1.92 1.6 1.3 12.04 10.92 304.8 194.8 987.6 28 % of 1x dil 91.50% 100.52% 88.89% 122.64% 96.24% 101.49% 102.83% 107.21% 106.03% 112.00%
B-27 1x 4.536 2.2 2.3 0.94 12.56 10.48 399.7 37 929.4 34 B-27 4x 1.159 0.61 0.5 1.11 3.2 2.65 106.1 10.7 255.5 8
x4 4.636 2.44 2 1.11 12.8 10.6 424.4 42.8 1022 32 % of 1x dil 102.20% 110.91% 86.96% 118.09% 101.91% 101.15% 106.18% 115.68% 109.96% 94.12%
B-33 1x 4.014 2.23 1.8 1.25 11.18 6.08 233 37.6 1586.5 42 B-33 4x 1.021 0.56 0.5 1.21 2.64 1.49 58.9 9.9 433.2 13
x4 4.084 2.24 2 1.21 10.56 5.96 235.6 39.6 1732.8 52 % of 1x dil 101.74% 100.45% 111.11% 96.80% 94.45% 98.03% 101.12% 105.32% 109.22% 123.81%
ID Dilution Uric Acid Cholesterol Sodium K Na/K
Ratio Chloride
B-29 1x 3.51 330.1 157.5 4.36 36.1 106 B-29 5x 0.68 72.9 36 0.95 37.9 22.4
x5 3.4 364.5 180 4.75 37.9 112 % of 1x dil 96.87% 110.42% 114.29% 108.94% 104.99% 105.66%
Continued
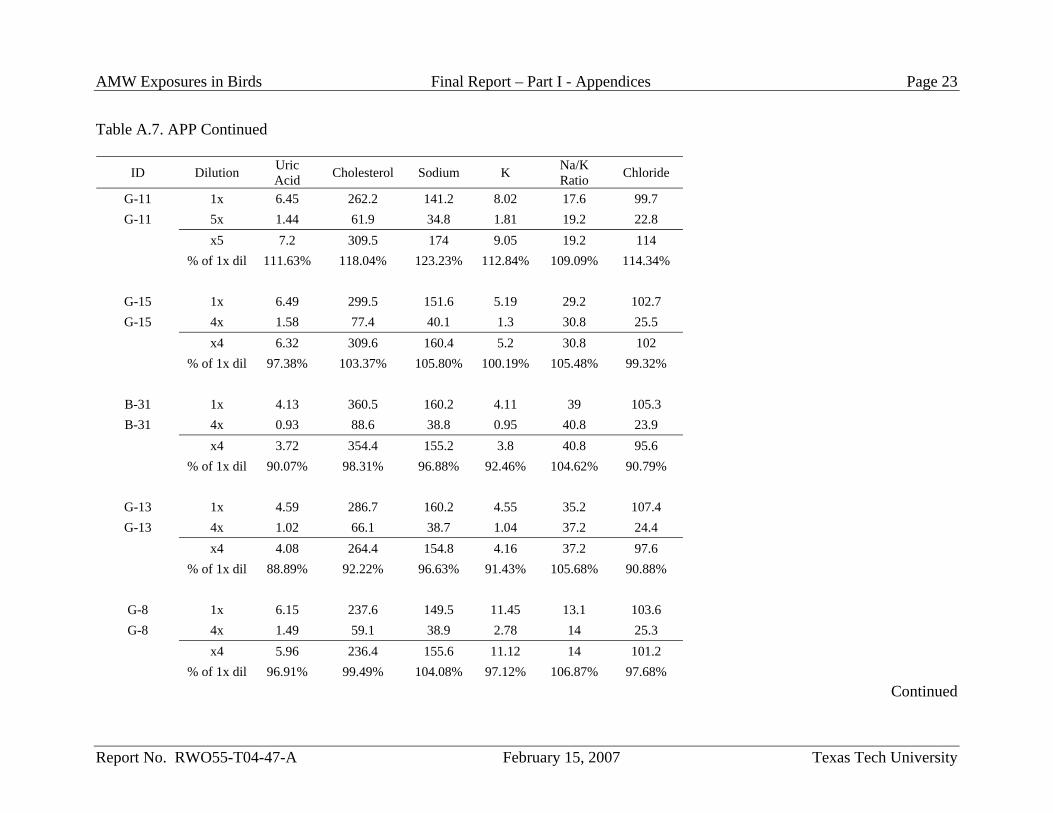
AMW Exposures in Birds Final Report – Part I - Appendices Page 23
Report No. RWO55-T04-47-A February 15, 2007 Texas Tech University
Table A.7. APP Continued
ID Dilution Uric Acid Cholesterol Sodium K Na/K
Ratio Chloride
G-11 1x 6.45 262.2 141.2 8.02 17.6 99.7 G-11 5x 1.44 61.9 34.8 1.81 19.2 22.8
x5 7.2 309.5 174 9.05 19.2 114 % of 1x dil 111.63% 118.04% 123.23% 112.84% 109.09% 114.34%
G-15 1x 6.49 299.5 151.6 5.19 29.2 102.7 G-15 4x 1.58 77.4 40.1 1.3 30.8 25.5
x4 6.32 309.6 160.4 5.2 30.8 102 % of 1x dil 97.38% 103.37% 105.80% 100.19% 105.48% 99.32%
B-31 1x 4.13 360.5 160.2 4.11 39 105.3 B-31 4x 0.93 88.6 38.8 0.95 40.8 23.9
x4 3.72 354.4 155.2 3.8 40.8 95.6 % of 1x dil 90.07% 98.31% 96.88% 92.46% 104.62% 90.79%
G-13 1x 4.59 286.7 160.2 4.55 35.2 107.4 G-13 4x 1.02 66.1 38.7 1.04 37.2 24.4
x4 4.08 264.4 154.8 4.16 37.2 97.6 % of 1x dil 88.89% 92.22% 96.63% 91.43% 105.68% 90.88%
G-8 1x 6.15 237.6 149.5 11.45 13.1 103.6 G-8 4x 1.49 59.1 38.9 2.78 14 25.3
x4 5.96 236.4 155.6 11.12 14 101.2 % of 1x dil 96.91% 99.49% 104.08% 97.12% 106.87% 97.68%
Continued
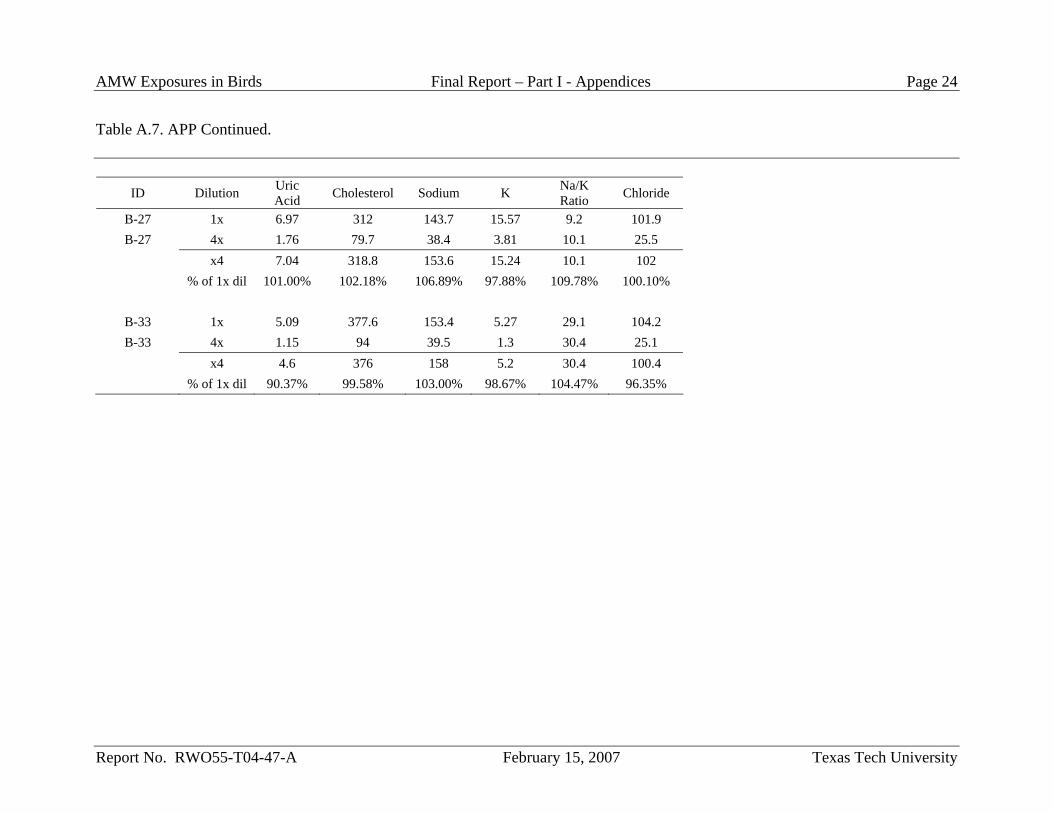
AMW Exposures in Birds Final Report – Part I - Appendices Page 24
Report No. RWO55-T04-47-A February 15, 2007 Texas Tech University
Table A.7. APP Continued.
ID Dilution Uric Acid Cholesterol Sodium K Na/K
Ratio Chloride
B-27 1x 6.97 312 143.7 15.57 9.2 101.9 B-27 4x 1.76 79.7 38.4 3.81 10.1 25.5
x4 7.04 318.8 153.6 15.24 10.1 102 % of 1x dil 101.00% 102.18% 106.89% 97.88% 109.78% 100.10%
B-33 1x 5.09 377.6 153.4 5.27 29.1 104.2 B-33 4x 1.15 94 39.5 1.3 30.4 25.1
x4 4.6 376 158 5.2 30.4 100.4 % of 1x dil 90.37% 99.58% 103.00% 98.67% 104.47% 96.35%
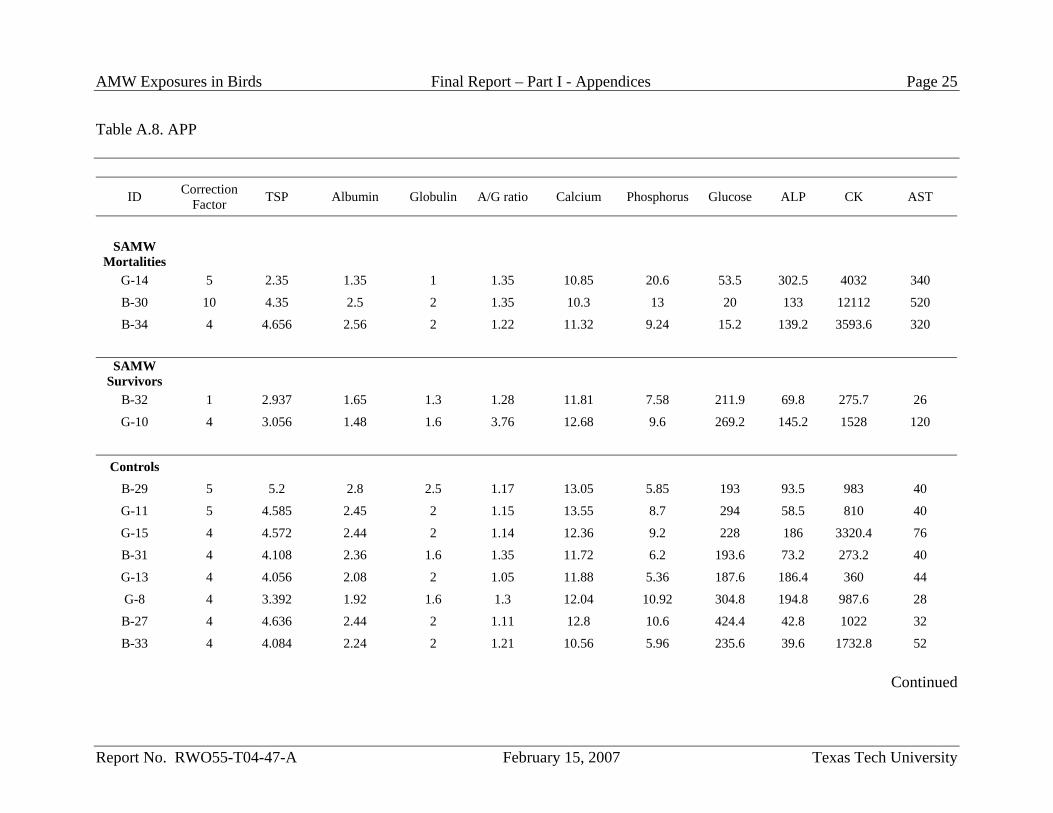
AMW Exposures in Birds Final Report – Part I - Appendices Page 25
Report No. RWO55-T04-47-A February 15, 2007 Texas Tech University
Table A.8. APP
ID Correction Factor TSP Albumin Globulin A/G ratio Calcium Phosphorus Glucose ALP CK AST
SAMW
Mortalities
G-14 5 2.35 1.35 1 1.35 10.85 20.6 53.5 302.5 4032 340
B-30 10 4.35 2.5 2 1.35 10.3 13 20 133 12112 520
B-34 4 4.656 2.56 2 1.22 11.32 9.24 15.2 139.2 3593.6 320
SAMW
Survivors B-32 1 2.937 1.65 1.3 1.28 11.81 7.58 211.9 69.8 275.7 26
G-10 4 3.056 1.48 1.6 3.76 12.68 9.6 269.2 145.2 1528 120
Controls
B-29 5 5.2 2.8 2.5 1.17 13.05 5.85 193 93.5 983 40
G-11 5 4.585 2.45 2 1.15 13.55 8.7 294 58.5 810 40
G-15 4 4.572 2.44 2 1.14 12.36 9.2 228 186 3320.4 76
B-31 4 4.108 2.36 1.6 1.35 11.72 6.2 193.6 73.2 273.2 40
G-13 4 4.056 2.08 2 1.05 11.88 5.36 187.6 186.4 360 44
G-8 4 3.392 1.92 1.6 1.3 12.04 10.92 304.8 194.8 987.6 28
B-27 4 4.636 2.44 2 1.11 12.8 10.6 424.4 42.8 1022 32
B-33 4 4.084 2.24 2 1.21 10.56 5.96 235.6 39.6 1732.8 52
Continued
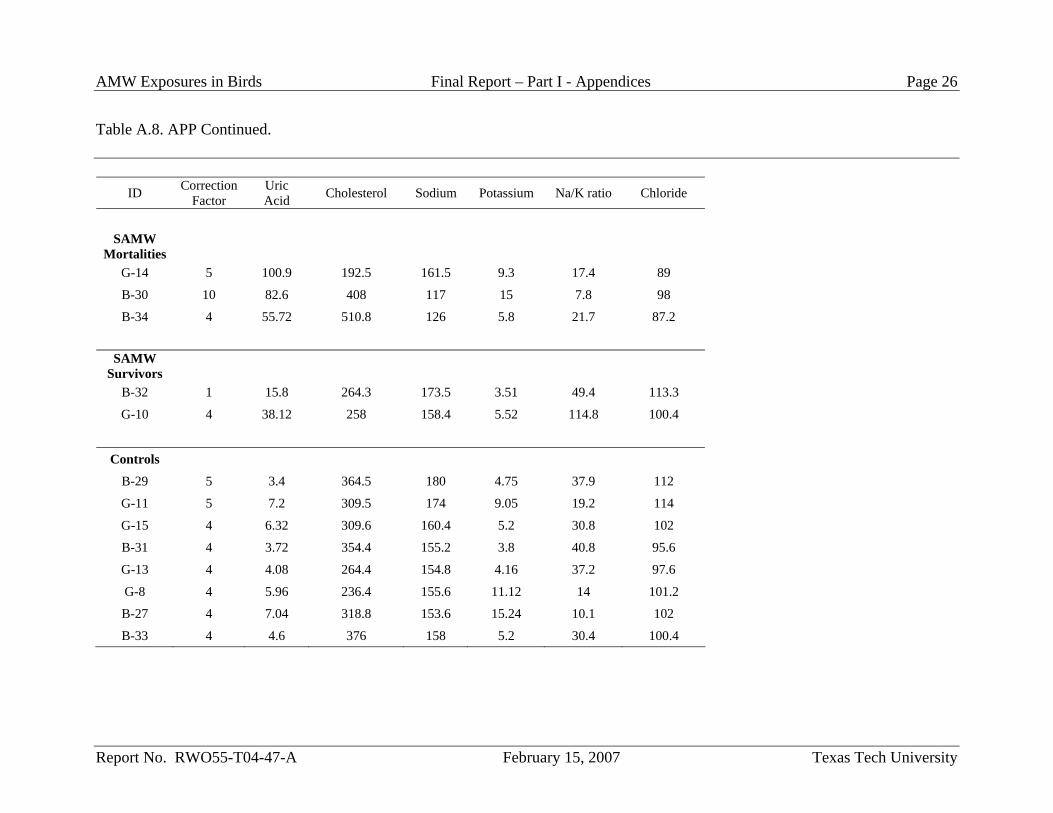
AMW Exposures in Birds Final Report – Part I - Appendices Page 26
Report No. RWO55-T04-47-A February 15, 2007 Texas Tech University
Table A.8. APP Continued.
ID Correction Factor
Uric Acid Cholesterol Sodium Potassium Na/K ratio Chloride
SAMW
Mortalities
G-14 5 100.9 192.5 161.5 9.3 17.4 89
B-30 10 82.6 408 117 15 7.8 98
B-34 4 55.72 510.8 126 5.8 21.7 87.2
SAMW
Survivors
B-32 1 15.8 264.3 173.5 3.51 49.4 113.3
G-10 4 38.12 258 158.4 5.52 114.8 100.4
Controls
B-29 5 3.4 364.5 180 4.75 37.9 112
G-11 5 7.2 309.5 174 9.05 19.2 114
G-15 4 6.32 309.6 160.4 5.2 30.8 102
B-31 4 3.72 354.4 155.2 3.8 40.8 95.6
G-13 4 4.08 264.4 154.8 4.16 37.2 97.6
G-8 4 5.96 236.4 155.6 11.12 14 101.2
B-27 4 7.04 318.8 153.6 15.24 10.1 102
B-33 4 4.6 376 158 5.2 30.4 100.4
AMW Exposures in Birds Final Report – Part I - Appendices Page 27
Report No. RWO55-T04-47-A February 15, 2007 Texas Tech University
Table A.9, Table A.10. APP B-31 (056-30750) Control
Slide 1 – Pancreas, lung, spleen, liver (mild portal infiltrate of mononuclear cells including lymphocytes and macrophages) and kidney -wnl Slide 2 – Duodenum, jejunum, ileum-wnl Slide 3 – Esophagus, testis, salt gland, pancreas – wnl Slide 4 – Tongue, esophagus, trachea (mild mucosal heterophilic infiltrate), ventriculus – wnl Slide 5 – Heart–wnl Slide 6 – Brain – wnl Slide 7 - Proventriculus -wnl
B-26 (056-30751) AMW
Slide 1. Lungs, liver (mild portal mononuclear infiltrate), kidney wnl. Spleen lymphoid necrosis noted within follicles (often observed in cases of severe stress) Slide 2. Esophagus –wnl. Small intestine, some sections of jejunum exhibit increased mucus and coagulated protein (special stains negative for copper and calcium)on the surface. Slide 3. Trachea (minimal mucosal heterophilic infiltrate), tongue –wnl. Slide 4. Pancreas, testis – wnl. Proventriculus-congestion, increased mucus, (special stains negative for copper and calcium)
Slide 5. Heart - wnl Slide 6. Brain – wnl
Slide 7. Erosion of kaolin layer and hemorrhage. Severe erosion of mucosa of proventriculus. There is a basophilic zone, midway through the eroded mucosal folds at the junction of proventriculus and ventriculus, suggestive of mineral
B-30 (056-30752) AMW Slide 1. Liver , lungs, kidney-wnl. Spleen –minimal lymphoid necrosis
Slide 2. Small intestine –congestion (some sections show extensive autolysis). Esophagus, mineralization at the ostia of mucus glands. Mucous glands are ecstatic and filled with mucus. Vesicles containing mucous and serous fluid present in the keratinized layer.
Slide 3 Pancreas, testis, salt gland-wnl Slide 4 Ventriculus-mild infiltrate of heterophils in foci of the superficial lamina propria of the mucosa. Kaolin layer is unremarkable. Tongue, esophagus, trachea (mild mucosal heterophilic infiltrate)-wnl
Slide 5. Heart-wnl Slide 6 Brain –wnl.
Slide 7 Proventriculus, mucosa is denuded and cover with amorphous eosinophilic slightly granular debris, consistent with fibrin . Marked
AMW Exposures in Birds Final Report – Part I - Appendices Page 28
Report No. RWO55-T04-47-A February 15, 2007 Texas Tech University
Table A.9, Table A.10. APP Continued
congestion. Ventriculus is as above except there is erosion of kaolin at junction with proventriculus
B-32 ( 056-30753) AMW (survivor) Slide 1 Lungs, spleen, kidney, liver (mild portal mononuclear infiltrate) -wnl. Slide 2. Duodenum, jejunum, ileum-wnl Slide 3. Salt glands, testis, pancreas-wnl
Slide 4. Tongue, esophagus, trachea-wnl. Ventriculus, ventriculitis, focally extensive degeneration of kaolin with accumulation of degenerate heterophils in the degenerative kaolin (IMAGE-2)
Slide 5. Heart-wnl Slide 6. Brain –wnl
Slide 7. Proventriculus, marked congestion, Villi are lined by flattened attenuated epithelium suggestive of repair and regeneration (IMAGE-3). In other areas the lining is columnar (normal) but the crypts appear to be hyperplastic. Ventriculus, erosion of kaolin and hemorrhage.
B28 (056-30754) AMW Slide 1 Spleen, mild lymphoid necrosis. Pancreas, liver ( mild portal mononuclear infiltrates), and lungs –wnl Slide 2. Small intestine (small necrotic areas at tips of villi in some sections. These are areas of coagulative necrosis in the lamina propria and overlying epithelium appears viable) and pancreas –wnl
Slide 3. Salt gland, testis -wnl Slide 4. Trachea, mucosal congestion, hemorrhage and sloughing. Numerous heterophils in mucus in the lumen. Ventriculus- extensive ulceration and erosion of kaolin layer with hemorrhage and heterophilic ventriculitis (IMAGE-4).
Slide 5. Heart – wnl Slide 6. Brain – wnl
Slide 7. Proventriculus, mucosal epithelium is denuded, there is marked submucosa congestion and hemorrhage. Necrotic cells are present the crypts. (This might represent the earliest damage to the mucosa of proventriculus). The lesion extends to the junction of ventriculus and proventriculus (IMAGE-5).
B33 (056-30755) Control
Slide 1. Kidney, liver (minimal portal mononuclear infiltrates), spleen, lungs-wnl . Slide 2. Pancreas, duodenum, jejunum, ileum –wnl Slide 3. Testis, salt gland, proventriculus (IMAGE -6), tongue –wnl Slide 4. Ventriculus (IMAGE -7), trachea, esophagus-wnl Slide5. Heart –wnl Slide6. Brain- wnl
AMW Exposures in Birds Final Report – Part I - Appendices Page 29
Report No. RWO55-T04-47-A February 15, 2007 Texas Tech University
Table A.9, Table A.10. APP Continued B34 (056-30756) AMW
Slide 1. Kidney, liver (mild portal mononuclear infiltrates), lungs – wnl. Spleen minimal necrosis in follicles, Slide 2. Pancreas, jejunum (congestion), duodenum, ileum-wnl. Proventriculus –abundant mucous (special stains negative for copper and calcium) on surface and congestion
Slide 3. Testis and salt gland –wnl Slide 4. Trachea (mild mucosal heterophilic infiltrate), esophagus, tongue –wnl. Ventriculus- minimal heterophilic infiltrates into the submucosa and kaolin layer at the junction with glandular epithelium. Separation of the kaolin layer from the epithelium in this area (artifact cannot be ruled out).
Slide 5. Heart-wnl Slide 6. Brain –wnl
Slide 7. Proventriculus, mucosa is denuded and surface covered by amorphous exudate. Also the connective tissue fibers of mucosal scaffold are hyperbasophilic (special stains negative for copper and calcium)
B29 (056-30757) Control
Slide 1. Lung, kidney, liver (mild portal mononuclear infiltrates) - wnl. Spleen some necrosis.
Slide 2. Pancreas, duodenum, jejunum, ileum-wnl Slide 3. Testis (immature), salt glands-wnl
Slide 4. Ventriculits, minimal heterophilic infiltrate into superficial submucosa. trachea (moderate mucosal heterophilic infiltrates), tongue, esophagus-wnl
Slide 5. Heart-wnl Slide 6. Brain – wnl Slide 7. Proventriculus - wnl G-7 (056-30758) (AMW) Slide 1. Liver (portal infiltrate), lungs, kidney-wnl Slide 2. Pancreas, duodenum, jejunum, ileum-wnl Slide 3. Salt gland-wnl
Slide 4. Tongue, trachea –wnl. Ventriculus – mild heterophilic infiltration in lamina propria.
Slide 5. Heart- wnl Slide 6. Brain-wnl
Slide 7. Proventriculus, mucosa is denuded and there is abundant congestion, hemorrhage and mild heterophilic infiltrate in the submucosa. Ventriculus, kaolin layer is separating from the glandular layer at junction of ventriculus and proventriculus. Abundant hemorrhage and moderate heterophilic inflammation (IMAGE – 8).
AMW Exposures in Birds Final Report – Part I - Appendices Page 30
Report No. RWO55-T04-47-A February 15, 2007 Texas Tech University
Table A.9, Table A.10. APP Continued G 10 (056-30759) AMW survivor
Slide 1. Lungs one granuloma present, most likely incidental finding. Liver, vacuolar change and mild portal mononuclear infiltrate. Kidney-wnl Slide 2. Eosphagus, heterophilic inflammation in mucous glands. Bluish discoloration at ostia of some glands. Vesicles filled with serous or mucous fluid in keratinized layer. Duodenum, pancreas, ileum, jejunum –wnl
Slide 3. Spleen, salt gland, proventriculus –wnl Slide 4. Trachea (mild heterophilic infiltrate), tongue-wnl. Esophagus, same as in slide 2. Ventriculus multifocal erosion and loss of kaolin layer with subjacent necrosis and heterophilic inflammation.
Slide 5. Heart-wnl Slide 6. Brain-wnl
Slide 7. Proventriculus, mucosal lining is attenuated multifocally (lining epithelial cells are flattened indicating some cell loss and attempt at reepithelization of the surface. Ventriculus, heterophilic inflammation and extensinsive hemorrhage in submucosa. The kaolin layer has separated from glandular layer at junction of proventriculus and ventriculus.
B27 (056-30760) Control Slide 1. Lungs, liver (mild portal mononuclear infiltrate), kidney-wnl Slide 2. Proventriculus, pancreas, duodenum, jejunum, ileum-wnl. Slide 3. Spleen, testis, salt gland-wnl.
Slide 4. Trachea, heterophilic infiltrate in the submucosa (marked). Tongue and ventriculus –wnl.
Slide 5. Heart-wnl Slide6. Brain-wnl G8 (056-30761) (control) Slide 1. Liver (mild portal mononuclear infiltrate), lungs, kidney-wnl Slide 2. Pancreas, duodenum jejunum, ileum-wnl. Slide 3. Spleen, minimal lymphoid necrosis. Proventriculus, salt gland-wnl.
Slide 4. Tongue, small pustule composed of degenerate heterophils noted in deep squamous mucosa and numerous heterophils in dermis and some translocating through the squamous mucosa. Trachea (moderate mucosal heterophilic infiltrate), ventriculus –wnl.
Slide 5. Heart-wnl Slide 6. Brain-wnl G-15 (056-30762) control Slide 1. Liver (mild portal mononuclear infiltrate), kidney, lungs–wnl
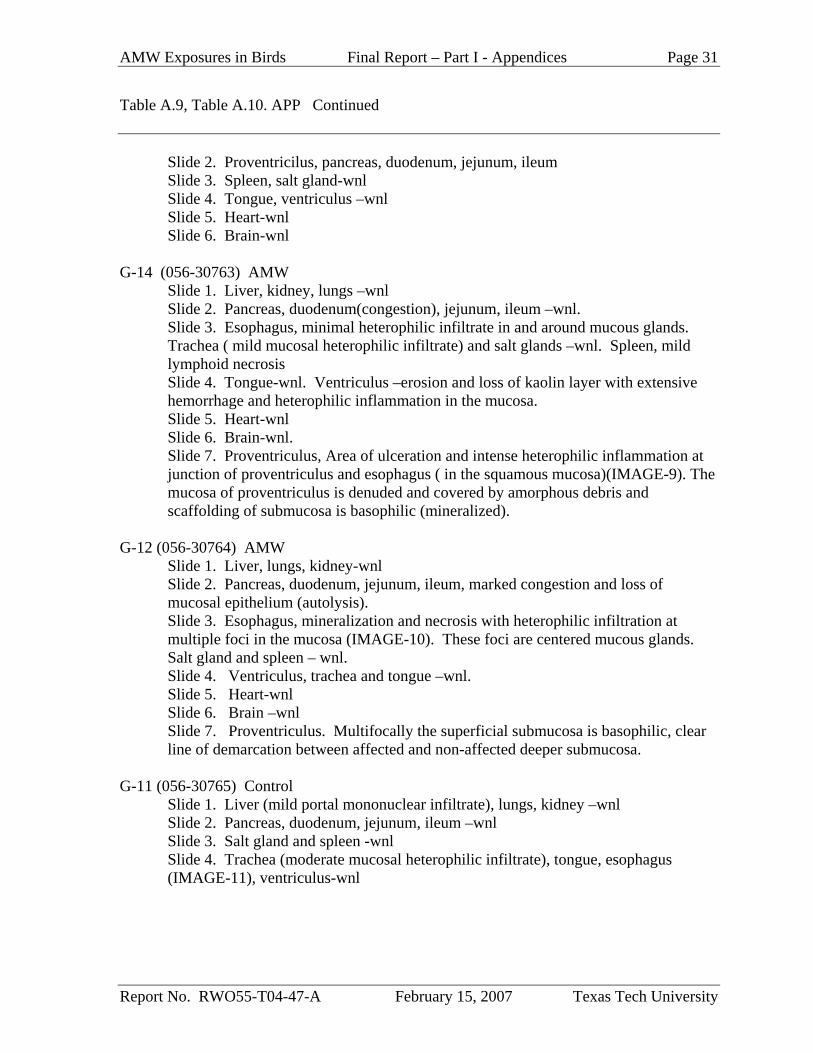
AMW Exposures in Birds Final Report – Part I - Appendices Page 31
Report No. RWO55-T04-47-A February 15, 2007 Texas Tech University
Table A.9, Table A.10. APP Continued Slide 2. Proventricilus, pancreas, duodenum, jejunum, ileum Slide 3. Spleen, salt gland-wnl Slide 4. Tongue, ventriculus –wnl Slide 5. Heart-wnl Slide 6. Brain-wnl G-14 (056-30763) AMW Slide 1. Liver, kidney, lungs –wnl Slide 2. Pancreas, duodenum(congestion), jejunum, ileum –wnl.
Slide 3. Esophagus, minimal heterophilic infiltrate in and around mucous glands. Trachea ( mild mucosal heterophilic infiltrate) and salt glands –wnl. Spleen, mild lymphoid necrosis Slide 4. Tongue-wnl. Ventriculus –erosion and loss of kaolin layer with extensive hemorrhage and heterophilic inflammation in the mucosa.
Slide 5. Heart-wnl Slide 6. Brain-wnl.
Slide 7. Proventriculus, Area of ulceration and intense heterophilic inflammation at junction of proventriculus and esophagus ( in the squamous mucosa)(IMAGE-9). The mucosa of proventriculus is denuded and covered by amorphous debris and scaffolding of submucosa is basophilic (mineralized).
G-12 (056-30764) AMW Slide 1. Liver, lungs, kidney-wnl
Slide 2. Pancreas, duodenum, jejunum, ileum, marked congestion and loss of mucosal epithelium (autolysis). Slide 3. Esophagus, mineralization and necrosis with heterophilic infiltration at multiple foci in the mucosa (IMAGE-10). These foci are centered mucous glands. Salt gland and spleen – wnl.
Slide 4. Ventriculus, trachea and tongue –wnl. Slide 5. Heart-wnl Slide 6. Brain –wnl
Slide 7. Proventriculus. Multifocally the superficial submucosa is basophilic, clear line of demarcation between affected and non-affected deeper submucosa.
G-11 (056-30765) Control Slide 1. Liver (mild portal mononuclear infiltrate), lungs, kidney –wnl Slide 2. Pancreas, duodenum, jejunum, ileum –wnl Slide 3. Salt gland and spleen -wnl
Slide 4. Trachea (moderate mucosal heterophilic infiltrate), tongue, esophagus (IMAGE-11), ventriculus-wnl
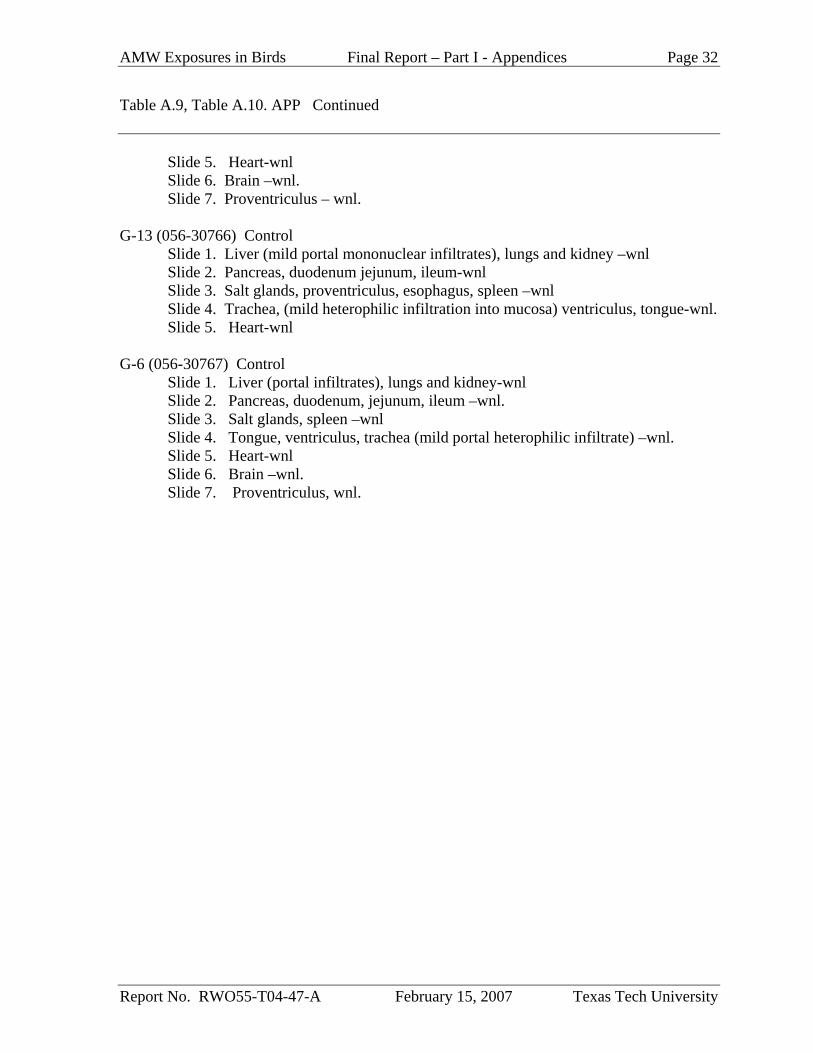
AMW Exposures in Birds Final Report – Part I - Appendices Page 32
Report No. RWO55-T04-47-A February 15, 2007 Texas Tech University
Table A.9, Table A.10. APP Continued Slide 5. Heart-wnl Slide 6. Brain –wnl. Slide 7. Proventriculus – wnl. G-13 (056-30766) Control Slide 1. Liver (mild portal mononuclear infiltrates), lungs and kidney –wnl Slide 2. Pancreas, duodenum jejunum, ileum-wnl Slide 3. Salt glands, proventriculus, esophagus, spleen –wnl
Slide 4. Trachea, (mild heterophilic infiltration into mucosa) ventriculus, tongue-wnl. Slide 5. Heart-wnl G-6 (056-30767) Control Slide 1. Liver (portal infiltrates), lungs and kidney-wnl Slide 2. Pancreas, duodenum, jejunum, ileum –wnl. Slide 3. Salt glands, spleen –wnl
Slide 4. Tongue, ventriculus, trachea (mild portal heterophilic infiltrate) –wnl. Slide 5. Heart-wnl Slide 6. Brain –wnl. Slide 7. Proventriculus, wnl.
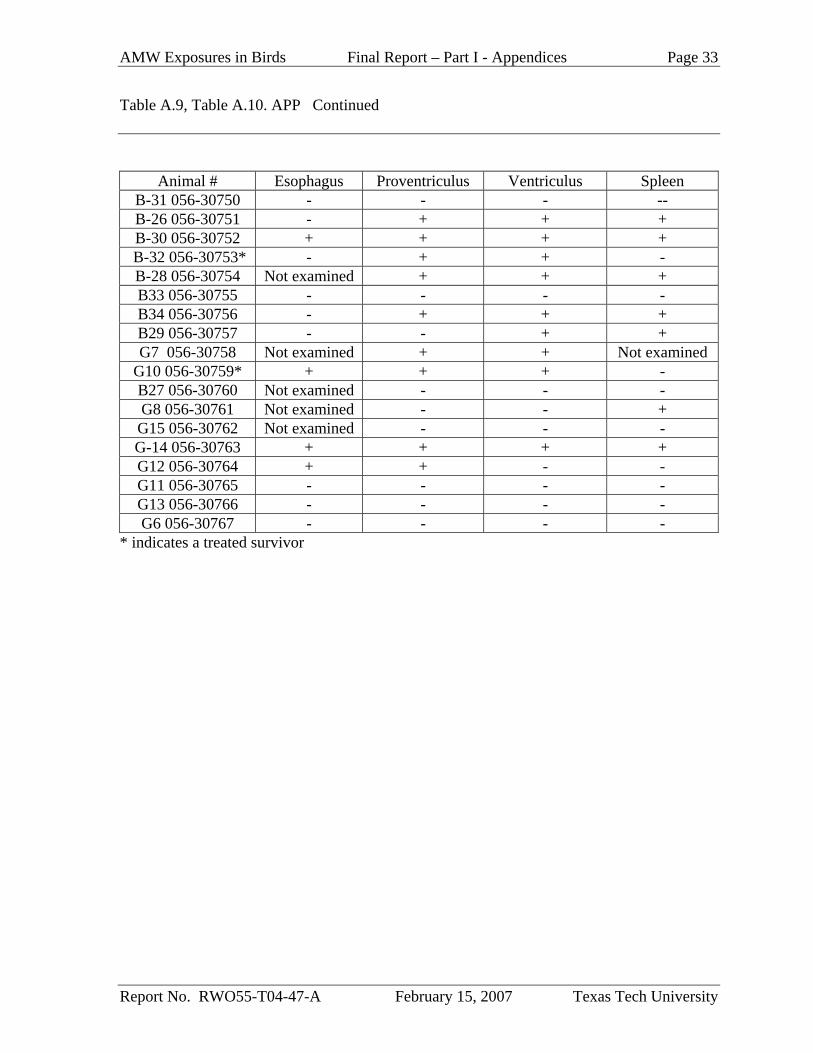
AMW Exposures in Birds Final Report – Part I - Appendices Page 33
Report No. RWO55-T04-47-A February 15, 2007 Texas Tech University
Table A.9, Table A.10. APP Continued
Animal # Esophagus Proventriculus Ventriculus Spleen B-31 056-30750 - - - -- B-26 056-30751 - + + + B-30 056-30752 + + + +
B-32 056-30753* - + + - B-28 056-30754 Not examined + + + B33 056-30755 - - - - B34 056-30756 - + + + B29 056-30757 - - + + G7 056-30758 Not examined + + Not examined
G10 056-30759* + + + - B27 056-30760 Not examined - - - G8 056-30761 Not examined - - + G15 056-30762 Not examined - - - G-14 056-30763 + + + + G12 056-30764 + + - - G11 056-30765 - - - - G13 056-30766 - - - - G6 056-30767 - - - -
* indicates a treated survivor
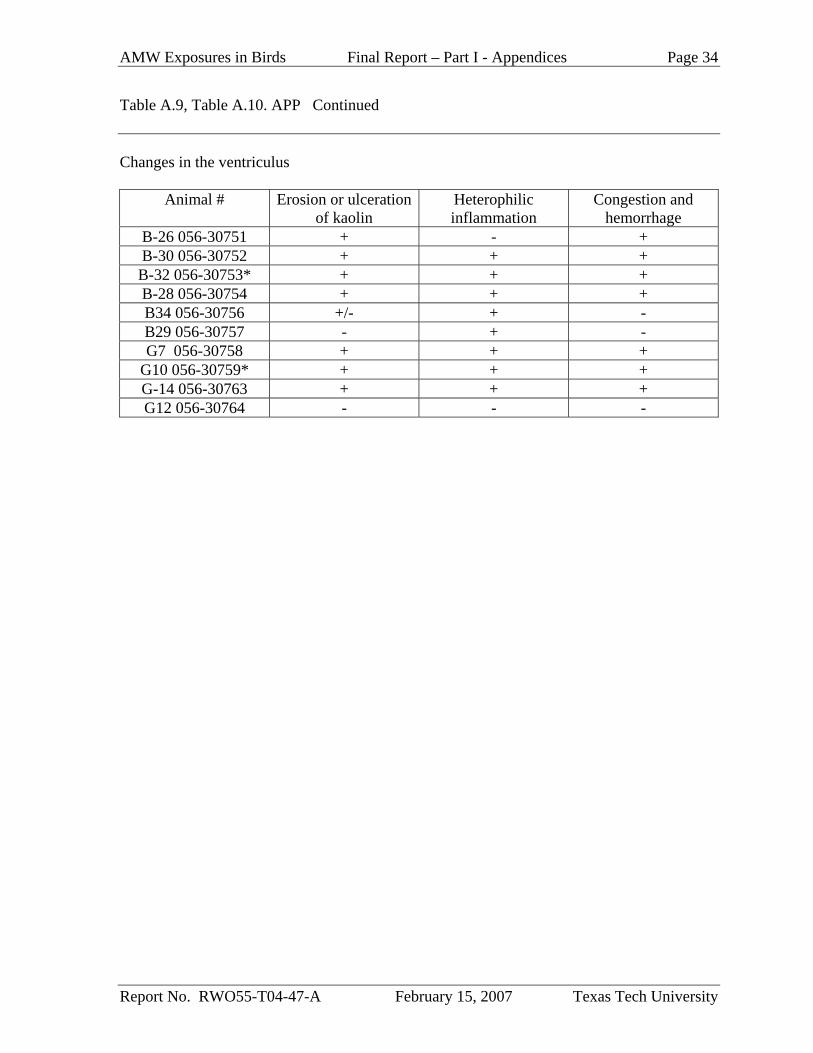
AMW Exposures in Birds Final Report – Part I - Appendices Page 34
Report No. RWO55-T04-47-A February 15, 2007 Texas Tech University
Table A.9, Table A.10. APP Continued Changes in the ventriculus
Animal # Erosion or ulceration of kaolin
Heterophilic inflammation
Congestion and hemorrhage
B-26 056-30751 + - + B-30 056-30752 + + + B-32 056-30753* + + + B-28 056-30754 + + + B34 056-30756 +/- + - B29 056-30757 - + - G7 056-30758 + + +
G10 056-30759* + + + G-14 056-30763 + + + G12 056-30764 - - -
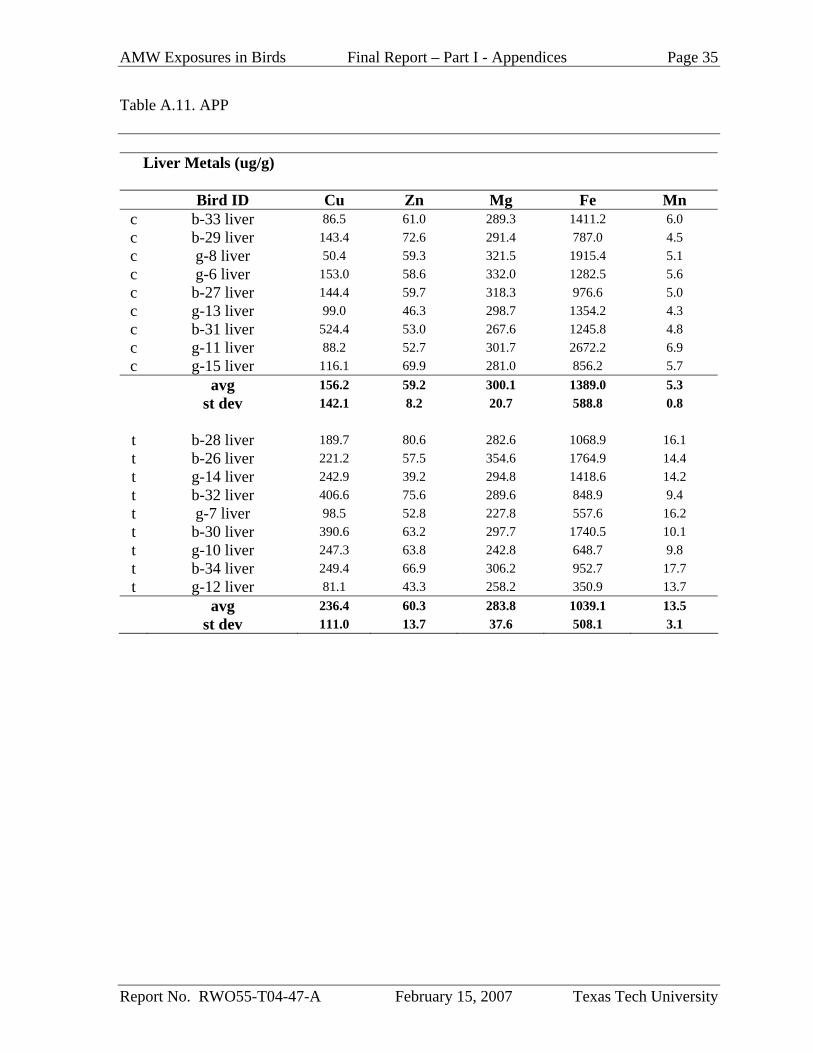
AMW Exposures in Birds Final Report – Part I - Appendices Page 35
Report No. RWO55-T04-47-A February 15, 2007 Texas Tech University
Table A.11. APP
Liver Metals (ug/g) Bird ID Cu Zn Mg Fe Mn c b-33 liver 86.5 61.0 289.3 1411.2 6.0 c b-29 liver 143.4 72.6 291.4 787.0 4.5 c g-8 liver 50.4 59.3 321.5 1915.4 5.1 c g-6 liver 153.0 58.6 332.0 1282.5 5.6 c b-27 liver 144.4 59.7 318.3 976.6 5.0 c g-13 liver 99.0 46.3 298.7 1354.2 4.3 c b-31 liver 524.4 53.0 267.6 1245.8 4.8 c g-11 liver 88.2 52.7 301.7 2672.2 6.9 c g-15 liver 116.1 69.9 281.0 856.2 5.7 avg 156.2 59.2 300.1 1389.0 5.3 st dev 142.1 8.2 20.7 588.8 0.8 t b-28 liver 189.7 80.6 282.6 1068.9 16.1 t b-26 liver 221.2 57.5 354.6 1764.9 14.4 t g-14 liver 242.9 39.2 294.8 1418.6 14.2 t b-32 liver 406.6 75.6 289.6 848.9 9.4 t g-7 liver 98.5 52.8 227.8 557.6 16.2 t b-30 liver 390.6 63.2 297.7 1740.5 10.1 t g-10 liver 247.3 63.8 242.8 648.7 9.8 t b-34 liver 249.4 66.9 306.2 952.7 17.7 t g-12 liver 81.1 43.3 258.2 350.9 13.7 avg 236.4 60.3 283.8 1039.1 13.5 st dev 111.0 13.7 37.6 508.1 3.1
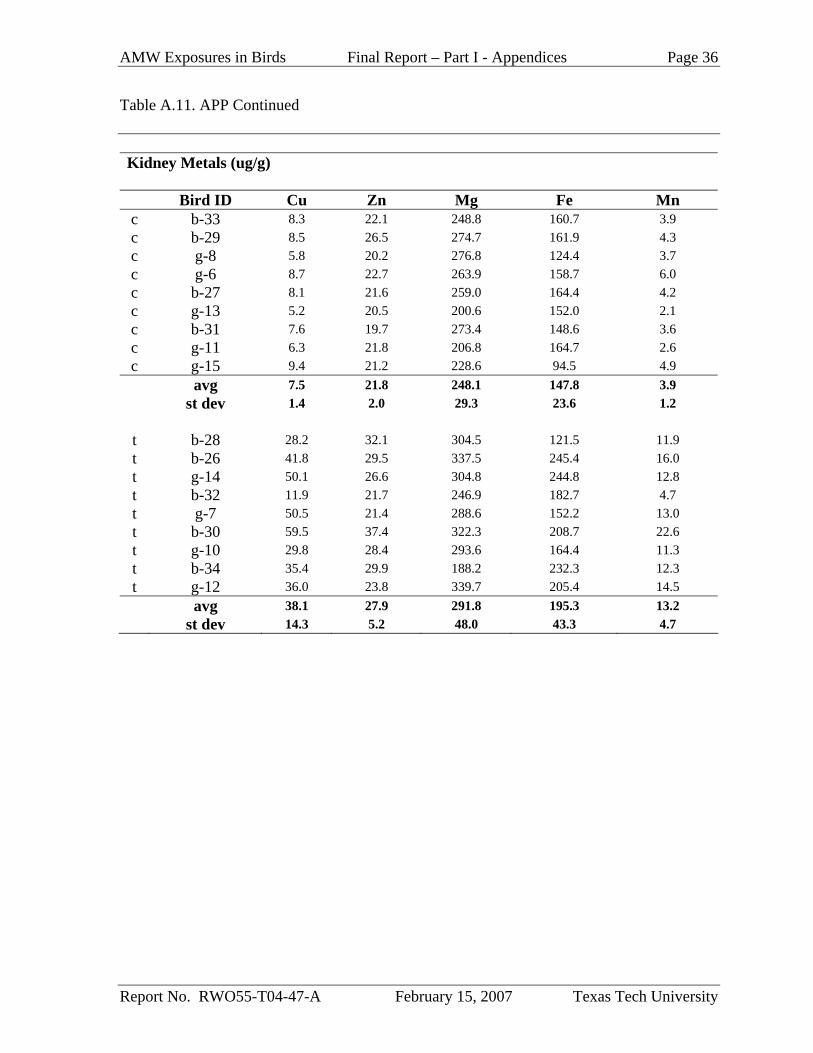
AMW Exposures in Birds Final Report – Part I - Appendices Page 36
Report No. RWO55-T04-47-A February 15, 2007 Texas Tech University
Table A.11. APP Continued Kidney Metals (ug/g) Bird ID Cu Zn Mg Fe Mn c b-33 8.3 22.1 248.8 160.7 3.9 c b-29 8.5 26.5 274.7 161.9 4.3 c g-8 5.8 20.2 276.8 124.4 3.7 c g-6 8.7 22.7 263.9 158.7 6.0 c b-27 8.1 21.6 259.0 164.4 4.2 c g-13 5.2 20.5 200.6 152.0 2.1 c b-31 7.6 19.7 273.4 148.6 3.6 c g-11 6.3 21.8 206.8 164.7 2.6 c g-15 9.4 21.2 228.6 94.5 4.9
avg 7.5 21.8 248.1 147.8 3.9 st dev 1.4 2.0 29.3 23.6 1.2 t b-28 28.2 32.1 304.5 121.5 11.9 t b-26 41.8 29.5 337.5 245.4 16.0 t g-14 50.1 26.6 304.8 244.8 12.8 t b-32 11.9 21.7 246.9 182.7 4.7 t g-7 50.5 21.4 288.6 152.2 13.0 t b-30 59.5 37.4 322.3 208.7 22.6 t g-10 29.8 28.4 293.6 164.4 11.3 t b-34 35.4 29.9 188.2 232.3 12.3 t g-12 36.0 23.8 339.7 205.4 14.5
avg 38.1 27.9 291.8 195.3 13.2 st dev 14.3 5.2 48.0 43.3 4.7
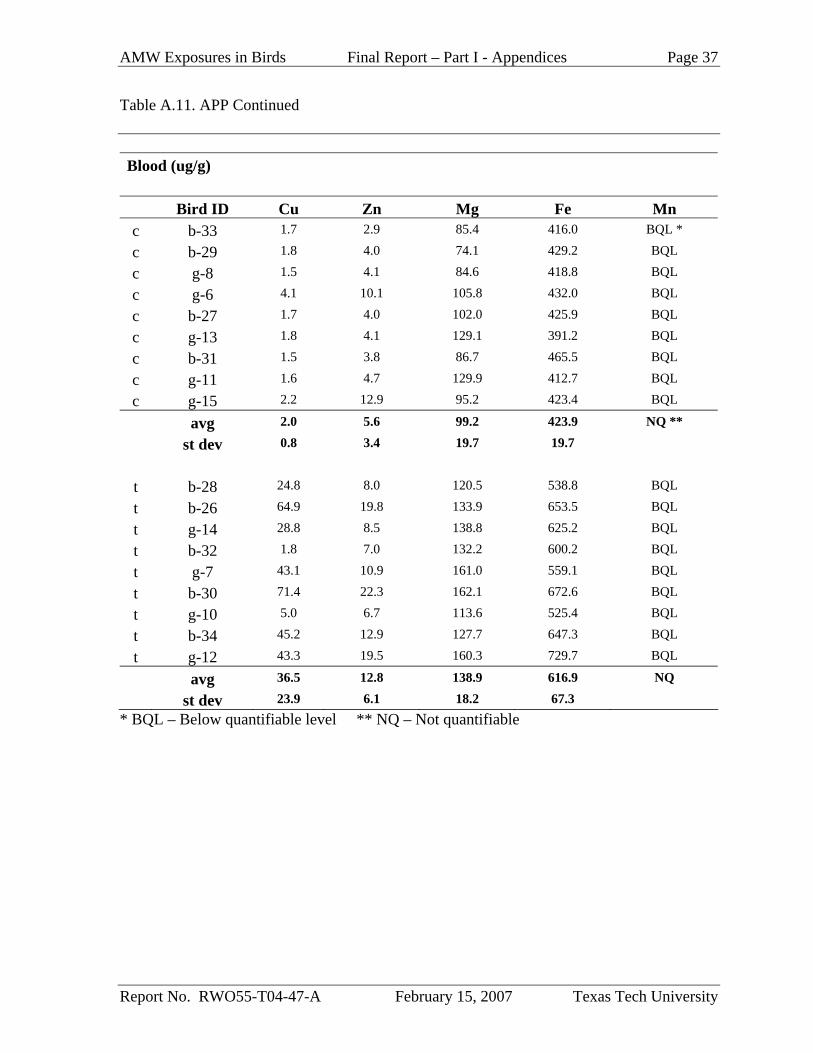
AMW Exposures in Birds Final Report – Part I - Appendices Page 37
Report No. RWO55-T04-47-A February 15, 2007 Texas Tech University
Table A.11. APP Continued Blood (ug/g)
Bird ID Cu Zn Mg Fe Mn c b-33 1.7 2.9 85.4 416.0 BQL *
c b-29 1.8 4.0 74.1 429.2 BQL
c g-8 1.5 4.1 84.6 418.8 BQL
c g-6 4.1 10.1 105.8 432.0 BQL
c b-27 1.7 4.0 102.0 425.9 BQL
c g-13 1.8 4.1 129.1 391.2 BQL
c b-31 1.5 3.8 86.7 465.5 BQL
c g-11 1.6 4.7 129.9 412.7 BQL
c g-15 2.2 12.9 95.2 423.4 BQL
avg 2.0 5.6 99.2 423.9 NQ **
st dev 0.8 3.4 19.7 19.7
t b-28 24.8 8.0 120.5 538.8 BQL
t b-26 64.9 19.8 133.9 653.5 BQL
t g-14 28.8 8.5 138.8 625.2 BQL
t b-32 1.8 7.0 132.2 600.2 BQL
t g-7 43.1 10.9 161.0 559.1 BQL
t b-30 71.4 22.3 162.1 672.6 BQL
t g-10 5.0 6.7 113.6 525.4 BQL
t b-34 45.2 12.9 127.7 647.3 BQL
t g-12 43.3 19.5 160.3 729.7 BQL
avg 36.5 12.8 138.9 616.9 NQ
st dev 23.9 6.1 18.2 67.3 * BQL – Below quantifiable level ** NQ – Not quantifiable
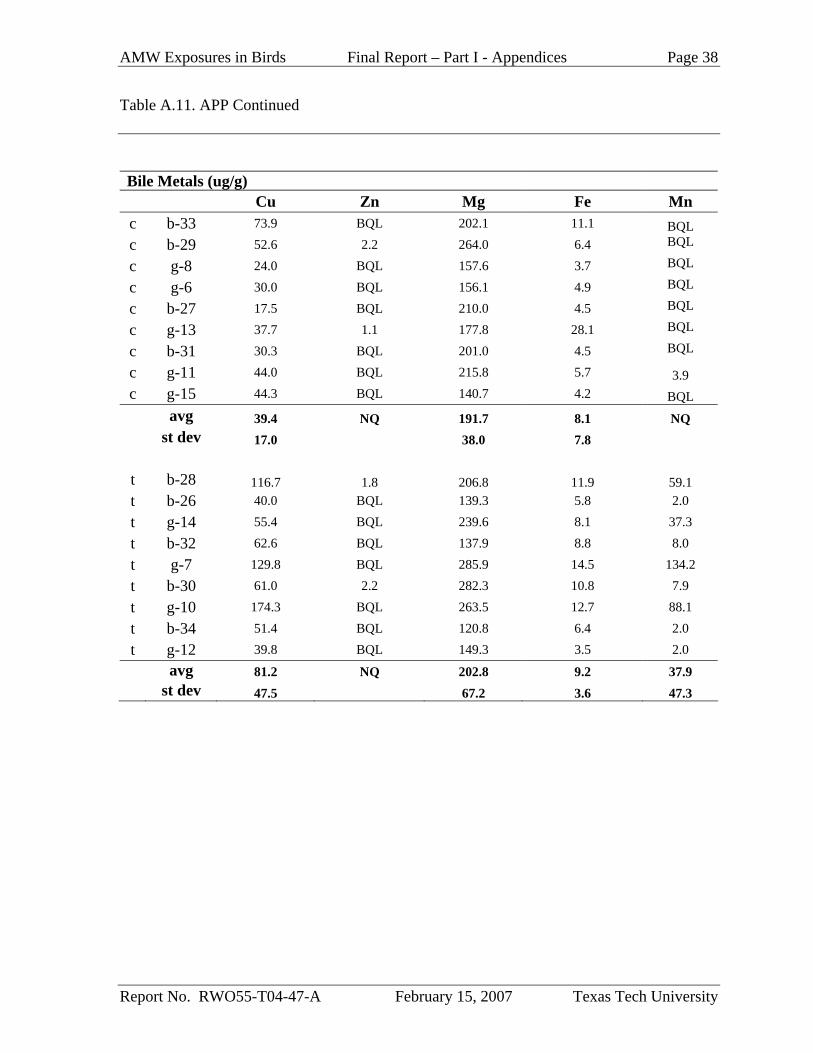
AMW Exposures in Birds Final Report – Part I - Appendices Page 38
Report No. RWO55-T04-47-A February 15, 2007 Texas Tech University
Table A.11. APP Continued Bile Metals (ug/g) Cu Zn Mg Fe Mn c b-33 73.9 BQL 202.1 11.1 BQL c b-29 52.6 2.2 264.0 6.4 BQL
c g-8 24.0 BQL 157.6 3.7 BQL
c g-6 30.0 BQL 156.1 4.9 BQL
c b-27 17.5 BQL 210.0 4.5 BQL
c g-13 37.7 1.1 177.8 28.1 BQL
c b-31 30.3 BQL 201.0 4.5 BQL
c g-11 44.0 BQL 215.8 5.7 3.9 c g-15 44.3 BQL 140.7 4.2 BQL avg 39.4 NQ 191.7 8.1 NQ st dev 17.0 38.0 7.8 t b-28 116.7 1.8 206.8 11.9 59.1 t b-26 40.0 BQL 139.3 5.8 2.0
t g-14 55.4 BQL 239.6 8.1 37.3
t b-32 62.6 BQL 137.9 8.8 8.0
t g-7 129.8 BQL 285.9 14.5 134.2
t b-30 61.0 2.2 282.3 10.8 7.9
t g-10 174.3 BQL 263.5 12.7 88.1
t b-34 51.4 BQL 120.8 6.4 2.0
t g-12 39.8 BQL 149.3 3.5 2.0 avg 81.2 NQ 202.8 9.2 37.9 st dev 47.5 67.2 3.6 47.3
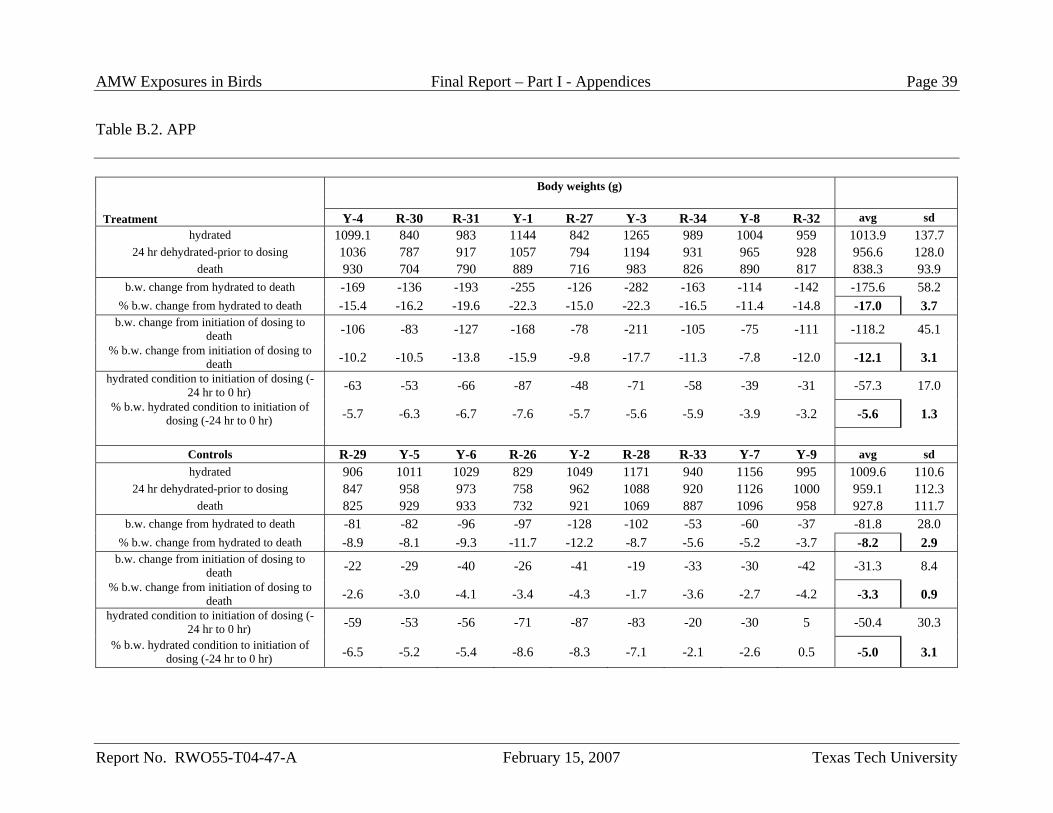
AMW Exposures in Birds Final Report – Part I - Appendices Page 39
Report No. RWO55-T04-47-A February 15, 2007 Texas Tech University
Table B.2. APP
Body weights (g) Treatment Y-4 R-30 R-31 Y-1 R-27 Y-3 R-34 Y-8 R-32 avg sd
hydrated 1099.1 840 983 1144 842 1265 989 1004 959 1013.9 137.7 24 hr dehydrated-prior to dosing 1036 787 917 1057 794 1194 931 965 928 956.6 128.0
death 930 704 790 889 716 983 826 890 817 838.3 93.9 b.w. change from hydrated to death -169 -136 -193 -255 -126 -282 -163 -114 -142 -175.6 58.2
% b.w. change from hydrated to death -15.4 -16.2 -19.6 -22.3 -15.0 -22.3 -16.5 -11.4 -14.8 -17.0 3.7 b.w. change from initiation of dosing to
death -106 -83 -127 -168 -78 -211 -105 -75 -111 -118.2 45.1 % b.w. change from initiation of dosing to
death -10.2 -10.5 -13.8 -15.9 -9.8 -17.7 -11.3 -7.8 -12.0 -12.1 3.1 hydrated condition to initiation of dosing (-
24 hr to 0 hr) -63 -53 -66 -87 -48 -71 -58 -39 -31 -57.3 17.0 % b.w. hydrated condition to initiation of
dosing (-24 hr to 0 hr) -5.7 -6.3 -6.7 -7.6 -5.7 -5.6 -5.9 -3.9 -3.2 -5.6 1.3
Controls R-29 Y-5 Y-6 R-26 Y-2 R-28 R-33 Y-7 Y-9 avg sd hydrated 906 1011 1029 829 1049 1171 940 1156 995 1009.6 110.6
24 hr dehydrated-prior to dosing 847 958 973 758 962 1088 920 1126 1000 959.1 112.3 death 825 929 933 732 921 1069 887 1096 958 927.8 111.7
b.w. change from hydrated to death -81 -82 -96 -97 -128 -102 -53 -60 -37 -81.8 28.0 % b.w. change from hydrated to death -8.9 -8.1 -9.3 -11.7 -12.2 -8.7 -5.6 -5.2 -3.7 -8.2 2.9
b.w. change from initiation of dosing to death -22 -29 -40 -26 -41 -19 -33 -30 -42 -31.3 8.4
% b.w. change from initiation of dosing to death -2.6 -3.0 -4.1 -3.4 -4.3 -1.7 -3.6 -2.7 -4.2 -3.3 0.9
hydrated condition to initiation of dosing (-24 hr to 0 hr) -59 -53 -56 -71 -87 -83 -20 -30 5 -50.4 30.3
% b.w. hydrated condition to initiation of dosing (-24 hr to 0 hr) -6.5 -5.2 -5.4 -8.6 -8.3 -7.1 -2.1 -2.6 0.5 -5.0 3.1
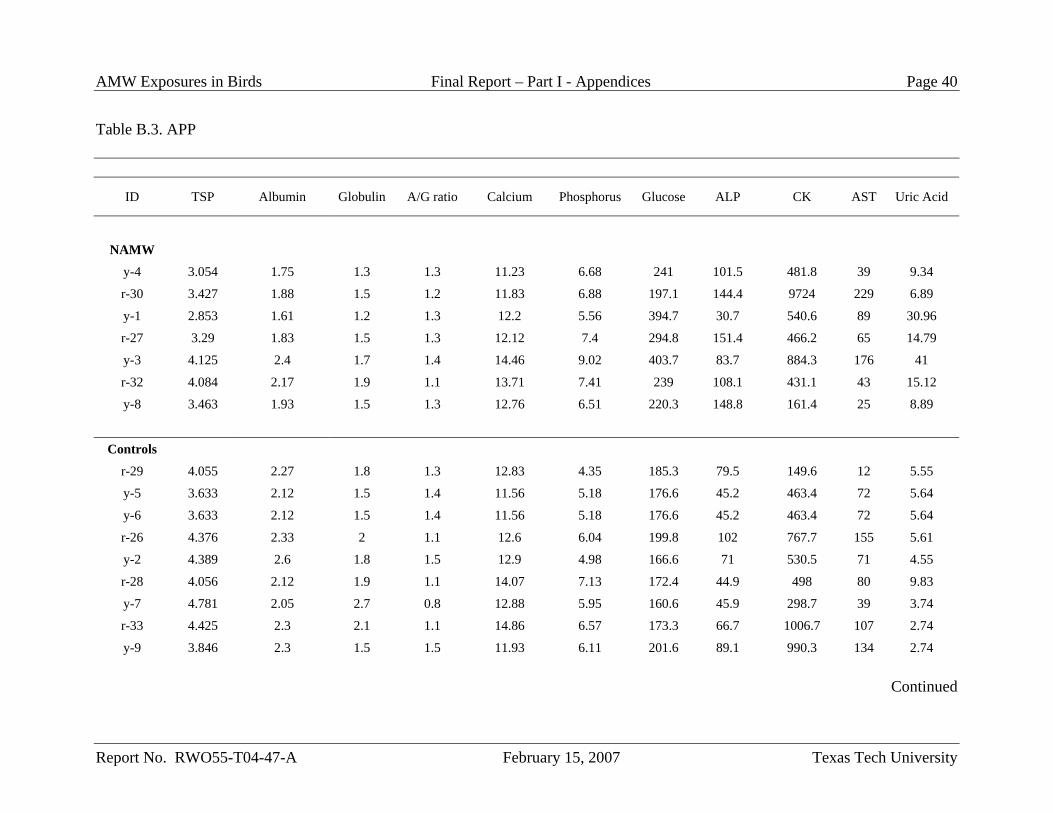
AMW Exposures in Birds Final Report – Part I - Appendices Page 40
Report No. RWO55-T04-47-A February 15, 2007 Texas Tech University
Table B.3. APP
ID TSP Albumin Globulin A/G ratio Calcium Phosphorus Glucose ALP CK AST Uric Acid
NAMW
y-4 3.054 1.75 1.3 1.3 11.23 6.68 241 101.5 481.8 39 9.34
r-30 3.427 1.88 1.5 1.2 11.83 6.88 197.1 144.4 9724 229 6.89
y-1 2.853 1.61 1.2 1.3 12.2 5.56 394.7 30.7 540.6 89 30.96
r-27 3.29 1.83 1.5 1.3 12.12 7.4 294.8 151.4 466.2 65 14.79
y-3 4.125 2.4 1.7 1.4 14.46 9.02 403.7 83.7 884.3 176 41
r-32 4.084 2.17 1.9 1.1 13.71 7.41 239 108.1 431.1 43 15.12
y-8 3.463 1.93 1.5 1.3 12.76 6.51 220.3 148.8 161.4 25 8.89
Controls
r-29 4.055 2.27 1.8 1.3 12.83 4.35 185.3 79.5 149.6 12 5.55
y-5 3.633 2.12 1.5 1.4 11.56 5.18 176.6 45.2 463.4 72 5.64
y-6 3.633 2.12 1.5 1.4 11.56 5.18 176.6 45.2 463.4 72 5.64
r-26 4.376 2.33 2 1.1 12.6 6.04 199.8 102 767.7 155 5.61
y-2 4.389 2.6 1.8 1.5 12.9 4.98 166.6 71 530.5 71 4.55
r-28 4.056 2.12 1.9 1.1 14.07 7.13 172.4 44.9 498 80 9.83
y-7 4.781 2.05 2.7 0.8 12.88 5.95 160.6 45.9 298.7 39 3.74
r-33 4.425 2.3 2.1 1.1 14.86 6.57 173.3 66.7 1006.7 107 2.74
y-9 3.846 2.3 1.5 1.5 11.93 6.11 201.6 89.1 990.3 134 2.74
Continued
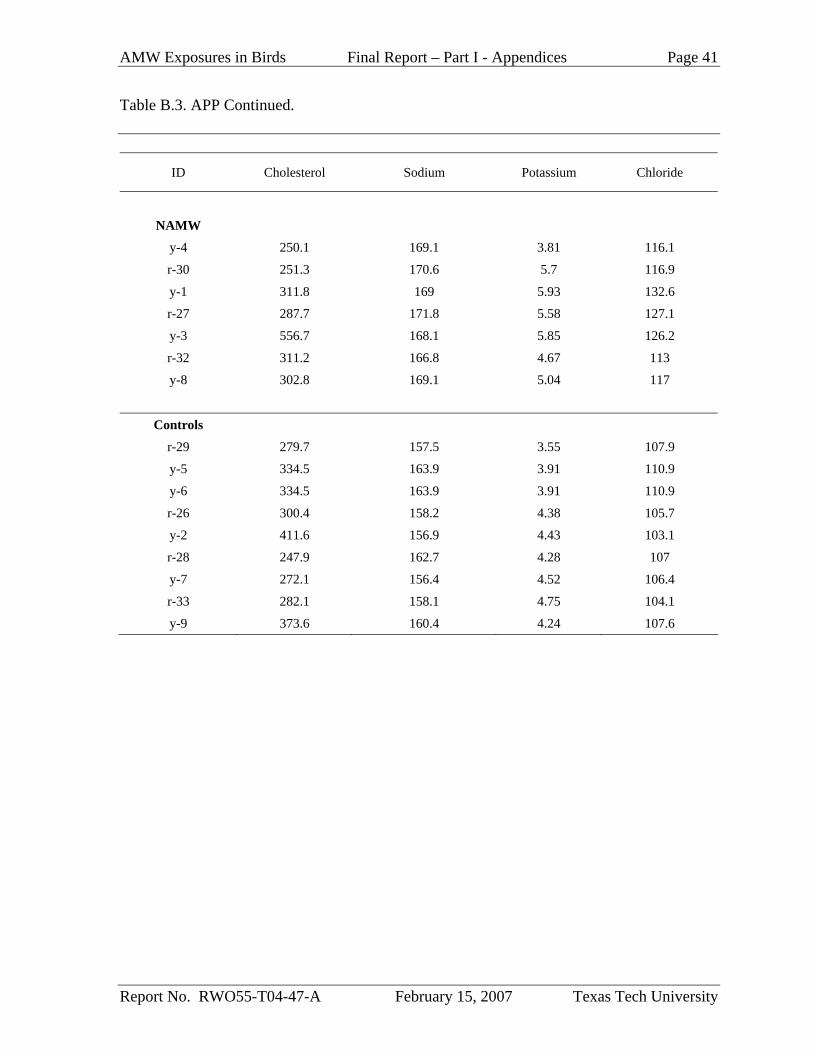
AMW Exposures in Birds Final Report – Part I - Appendices Page 41
Report No. RWO55-T04-47-A February 15, 2007 Texas Tech University
Table B.3. APP Continued.
ID Cholesterol Sodium Potassium Chloride
NAMW
y-4 250.1 169.1 3.81 116.1
r-30 251.3 170.6 5.7 116.9
y-1 311.8 169 5.93 132.6
r-27 287.7 171.8 5.58 127.1
y-3 556.7 168.1 5.85 126.2
r-32 311.2 166.8 4.67 113
y-8 302.8 169.1 5.04 117
Controls
r-29 279.7 157.5 3.55 107.9
y-5 334.5 163.9 3.91 110.9
y-6 334.5 163.9 3.91 110.9
r-26 300.4 158.2 4.38 105.7
y-2 411.6 156.9 4.43 103.1
r-28 247.9 162.7 4.28 107
y-7 272.1 156.4 4.52 106.4
r-33 282.1 158.1 4.75 104.1
y-9 373.6 160.4 4.24 107.6
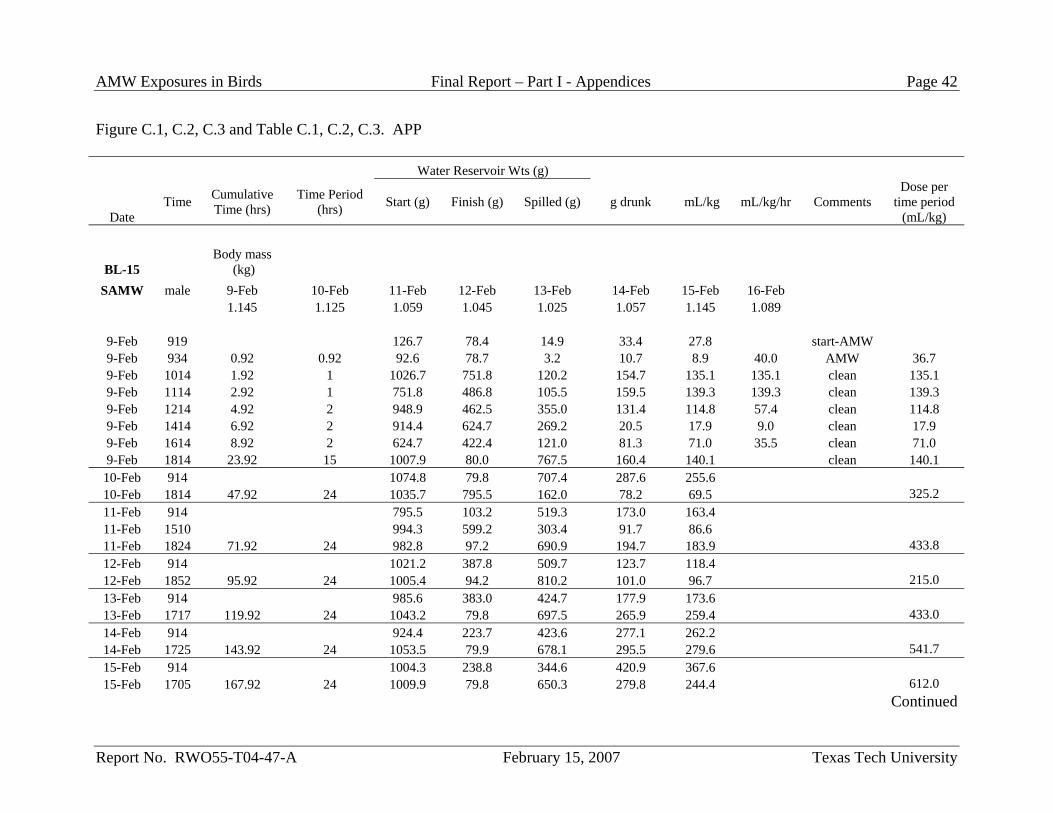
AMW Exposures in Birds Final Report – Part I - Appendices Page 42
Report No. RWO55-T04-47-A February 15, 2007 Texas Tech University
Figure C.1, C.2, C.3 and Table C.1, C.2, C.3. APP
Water Reservoir Wts (g)
Date Time Cumulative
Time (hrs) Time Period
(hrs) Start (g) Finish (g) Spilled (g) g drunk mL/kg mL/kg/hr Comments Dose per
time period (mL/kg)
BL-15 Body mass
(kg) SAMW male 9-Feb 10-Feb 11-Feb 12-Feb 13-Feb 14-Feb 15-Feb 16-Feb
1.145 1.125 1.059 1.045 1.025 1.057 1.145 1.089
9-Feb 919 126.7 78.4 14.9 33.4 27.8 start-AMW 9-Feb 934 0.92 0.92 92.6 78.7 3.2 10.7 8.9 40.0 AMW 36.7 9-Feb 1014 1.92 1 1026.7 751.8 120.2 154.7 135.1 135.1 clean 135.1 9-Feb 1114 2.92 1 751.8 486.8 105.5 159.5 139.3 139.3 clean 139.3 9-Feb 1214 4.92 2 948.9 462.5 355.0 131.4 114.8 57.4 clean 114.8 9-Feb 1414 6.92 2 914.4 624.7 269.2 20.5 17.9 9.0 clean 17.9 9-Feb 1614 8.92 2 624.7 422.4 121.0 81.3 71.0 35.5 clean 71.0 9-Feb 1814 23.92 15 1007.9 80.0 767.5 160.4 140.1 clean 140.1
10-Feb 914 1074.8 79.8 707.4 287.6 255.6 10-Feb 1814 47.92 24 1035.7 795.5 162.0 78.2 69.5 325.2 11-Feb 914 795.5 103.2 519.3 173.0 163.4 11-Feb 1510 994.3 599.2 303.4 91.7 86.6 11-Feb 1824 71.92 24 982.8 97.2 690.9 194.7 183.9 433.8 12-Feb 914 1021.2 387.8 509.7 123.7 118.4 12-Feb 1852 95.92 24 1005.4 94.2 810.2 101.0 96.7 215.0 13-Feb 914 985.6 383.0 424.7 177.9 173.6 13-Feb 1717 119.92 24 1043.2 79.8 697.5 265.9 259.4 433.0 14-Feb 914 924.4 223.7 423.6 277.1 262.2 14-Feb 1725 143.92 24 1053.5 79.9 678.1 295.5 279.6 541.7 15-Feb 914 1004.3 238.8 344.6 420.9 367.6 15-Feb 1705 167.92 24 1009.9 79.8 650.3 279.8 244.4 612.0
Continued
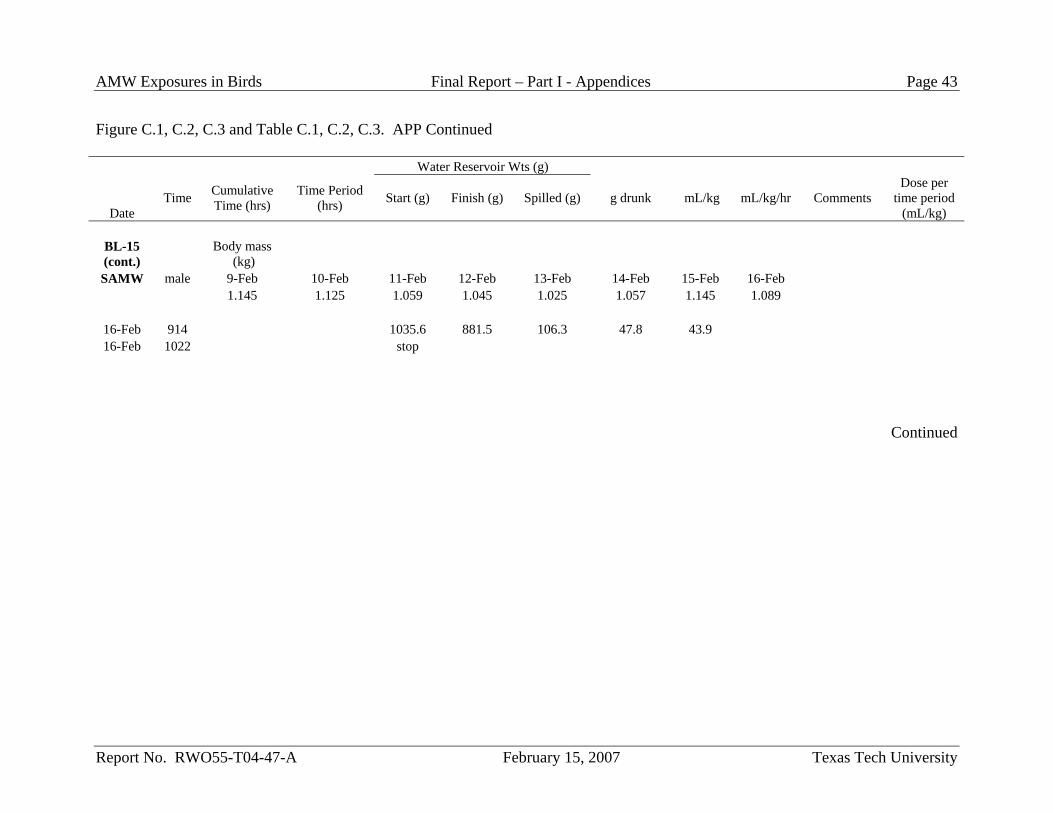
AMW Exposures in Birds Final Report – Part I - Appendices Page 43
Report No. RWO55-T04-47-A February 15, 2007 Texas Tech University
Figure C.1, C.2, C.3 and Table C.1, C.2, C.3. APP Continued
Water Reservoir Wts (g)
Date Time Cumulative
Time (hrs) Time Period
(hrs) Start (g) Finish (g) Spilled (g) g drunk mL/kg mL/kg/hr Comments Dose per
time period (mL/kg)
BL-15 (cont.)
Body mass (kg)
SAMW male 9-Feb 10-Feb 11-Feb 12-Feb 13-Feb 14-Feb 15-Feb 16-Feb 1.145 1.125 1.059 1.045 1.025 1.057 1.145 1.089
16-Feb 914 1035.6 881.5 106.3 47.8 43.9 16-Feb 1022 stop
Continued
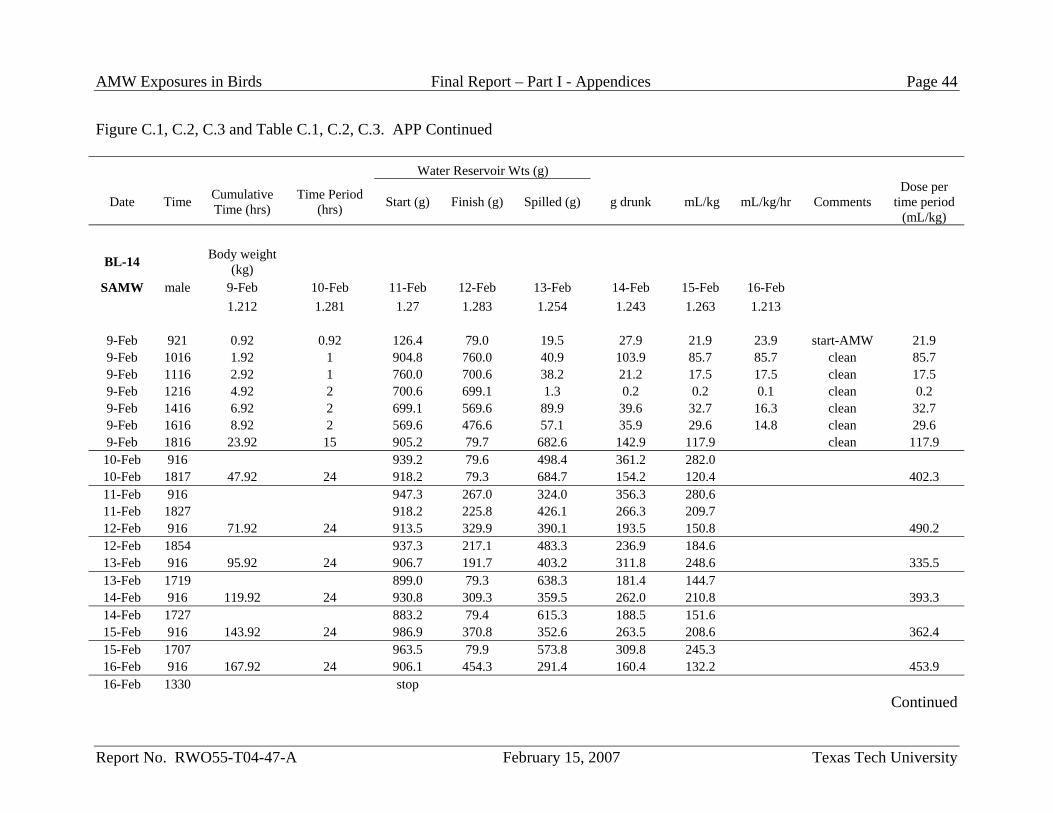
AMW Exposures in Birds Final Report – Part I - Appendices Page 44
Report No. RWO55-T04-47-A February 15, 2007 Texas Tech University
Figure C.1, C.2, C.3 and Table C.1, C.2, C.3. APP Continued
Water Reservoir Wts (g)
Date Time Cumulative Time (hrs)
Time Period (hrs) Start (g) Finish (g) Spilled (g) g drunk mL/kg mL/kg/hr Comments
Dose per time period
(mL/kg)
BL-14 Body weight (kg)
SAMW male 9-Feb 10-Feb 11-Feb 12-Feb 13-Feb 14-Feb 15-Feb 16-Feb 1.212 1.281 1.27 1.283 1.254 1.243 1.263 1.213
9-Feb 921 0.92 0.92 126.4 79.0 19.5 27.9 21.9 23.9 start-AMW 21.9 9-Feb 1016 1.92 1 904.8 760.0 40.9 103.9 85.7 85.7 clean 85.7 9-Feb 1116 2.92 1 760.0 700.6 38.2 21.2 17.5 17.5 clean 17.5 9-Feb 1216 4.92 2 700.6 699.1 1.3 0.2 0.2 0.1 clean 0.2 9-Feb 1416 6.92 2 699.1 569.6 89.9 39.6 32.7 16.3 clean 32.7 9-Feb 1616 8.92 2 569.6 476.6 57.1 35.9 29.6 14.8 clean 29.6 9-Feb 1816 23.92 15 905.2 79.7 682.6 142.9 117.9 clean 117.9
10-Feb 916 939.2 79.6 498.4 361.2 282.0 10-Feb 1817 47.92 24 918.2 79.3 684.7 154.2 120.4 402.3 11-Feb 916 947.3 267.0 324.0 356.3 280.6 11-Feb 1827 918.2 225.8 426.1 266.3 209.7 12-Feb 916 71.92 24 913.5 329.9 390.1 193.5 150.8 490.2 12-Feb 1854 937.3 217.1 483.3 236.9 184.6 13-Feb 916 95.92 24 906.7 191.7 403.2 311.8 248.6 335.5 13-Feb 1719 899.0 79.3 638.3 181.4 144.7 14-Feb 916 119.92 24 930.8 309.3 359.5 262.0 210.8 393.3 14-Feb 1727 883.2 79.4 615.3 188.5 151.6 15-Feb 916 143.92 24 986.9 370.8 352.6 263.5 208.6 362.4 15-Feb 1707 963.5 79.9 573.8 309.8 245.3 16-Feb 916 167.92 24 906.1 454.3 291.4 160.4 132.2 453.9 16-Feb 1330 stop
Continued
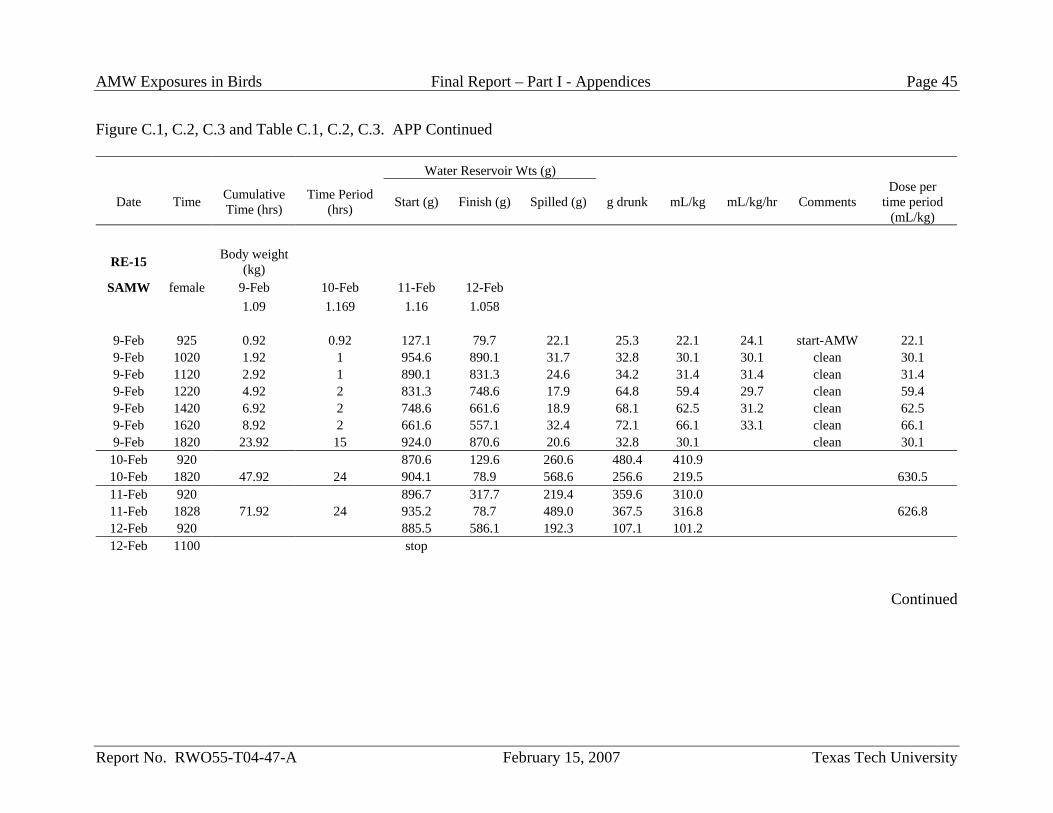
AMW Exposures in Birds Final Report – Part I - Appendices Page 45
Report No. RWO55-T04-47-A February 15, 2007 Texas Tech University
Figure C.1, C.2, C.3 and Table C.1, C.2, C.3. APP Continued
Water Reservoir Wts (g)
Date Time Cumulative Time (hrs)
Time Period (hrs) Start (g) Finish (g) Spilled (g) g drunk mL/kg mL/kg/hr Comments
Dose per time period
(mL/kg)
RE-15 Body weight (kg)
SAMW female 9-Feb 10-Feb 11-Feb 12-Feb 1.09 1.169 1.16 1.058
9-Feb 925 0.92 0.92 127.1 79.7 22.1 25.3 22.1 24.1 start-AMW 22.1 9-Feb 1020 1.92 1 954.6 890.1 31.7 32.8 30.1 30.1 clean 30.1 9-Feb 1120 2.92 1 890.1 831.3 24.6 34.2 31.4 31.4 clean 31.4 9-Feb 1220 4.92 2 831.3 748.6 17.9 64.8 59.4 29.7 clean 59.4 9-Feb 1420 6.92 2 748.6 661.6 18.9 68.1 62.5 31.2 clean 62.5 9-Feb 1620 8.92 2 661.6 557.1 32.4 72.1 66.1 33.1 clean 66.1 9-Feb 1820 23.92 15 924.0 870.6 20.6 32.8 30.1 clean 30.1 10-Feb 920 870.6 129.6 260.6 480.4 410.9 10-Feb 1820 47.92 24 904.1 78.9 568.6 256.6 219.5 630.5 11-Feb 920 896.7 317.7 219.4 359.6 310.0 11-Feb 1828 71.92 24 935.2 78.7 489.0 367.5 316.8 626.8 12-Feb 920 885.5 586.1 192.3 107.1 101.2 12-Feb 1100 stop
Continued
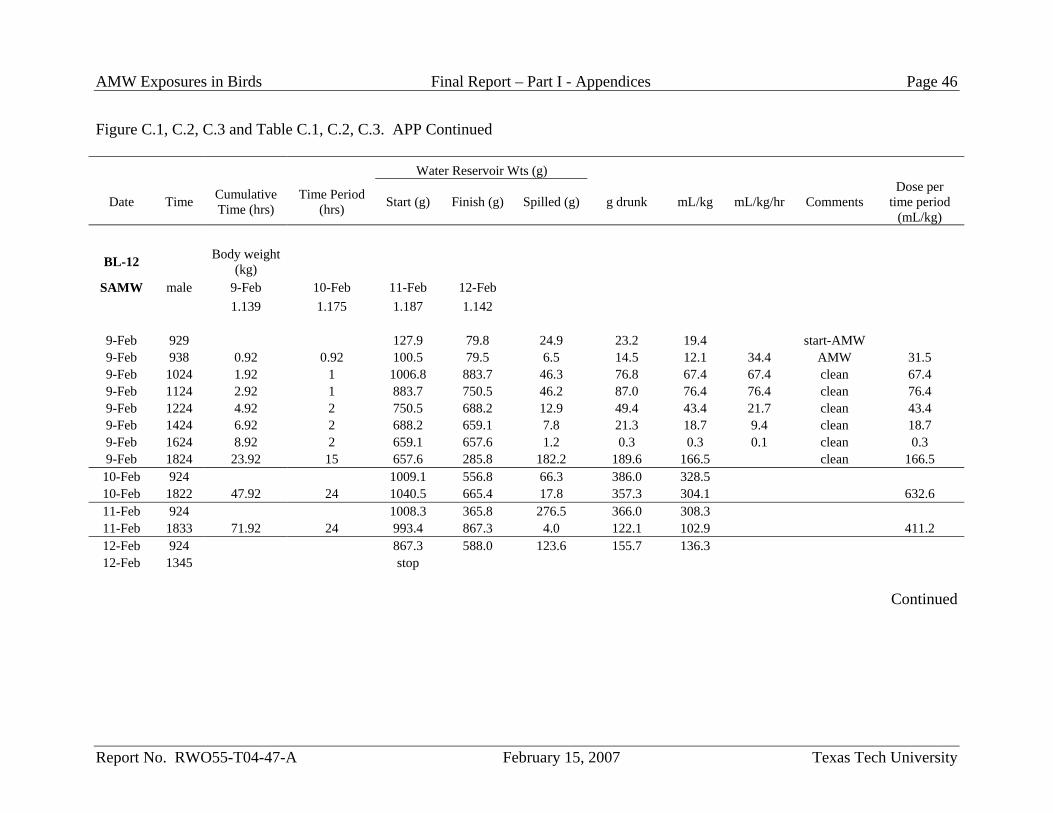
AMW Exposures in Birds Final Report – Part I - Appendices Page 46
Report No. RWO55-T04-47-A February 15, 2007 Texas Tech University
Figure C.1, C.2, C.3 and Table C.1, C.2, C.3. APP Continued
Water Reservoir Wts (g)
Date Time Cumulative Time (hrs)
Time Period (hrs) Start (g) Finish (g) Spilled (g) g drunk mL/kg mL/kg/hr Comments
Dose per time period
(mL/kg)
BL-12 Body weight (kg)
SAMW male 9-Feb 10-Feb 11-Feb 12-Feb 1.139 1.175 1.187 1.142
9-Feb 929 127.9 79.8 24.9 23.2 19.4 start-AMW 9-Feb 938 0.92 0.92 100.5 79.5 6.5 14.5 12.1 34.4 AMW 31.5 9-Feb 1024 1.92 1 1006.8 883.7 46.3 76.8 67.4 67.4 clean 67.4 9-Feb 1124 2.92 1 883.7 750.5 46.2 87.0 76.4 76.4 clean 76.4 9-Feb 1224 4.92 2 750.5 688.2 12.9 49.4 43.4 21.7 clean 43.4 9-Feb 1424 6.92 2 688.2 659.1 7.8 21.3 18.7 9.4 clean 18.7 9-Feb 1624 8.92 2 659.1 657.6 1.2 0.3 0.3 0.1 clean 0.3 9-Feb 1824 23.92 15 657.6 285.8 182.2 189.6 166.5 clean 166.5 10-Feb 924 1009.1 556.8 66.3 386.0 328.5 10-Feb 1822 47.92 24 1040.5 665.4 17.8 357.3 304.1 632.6 11-Feb 924 1008.3 365.8 276.5 366.0 308.3 11-Feb 1833 71.92 24 993.4 867.3 4.0 122.1 102.9 411.2 12-Feb 924 867.3 588.0 123.6 155.7 136.3 12-Feb 1345 stop
Continued
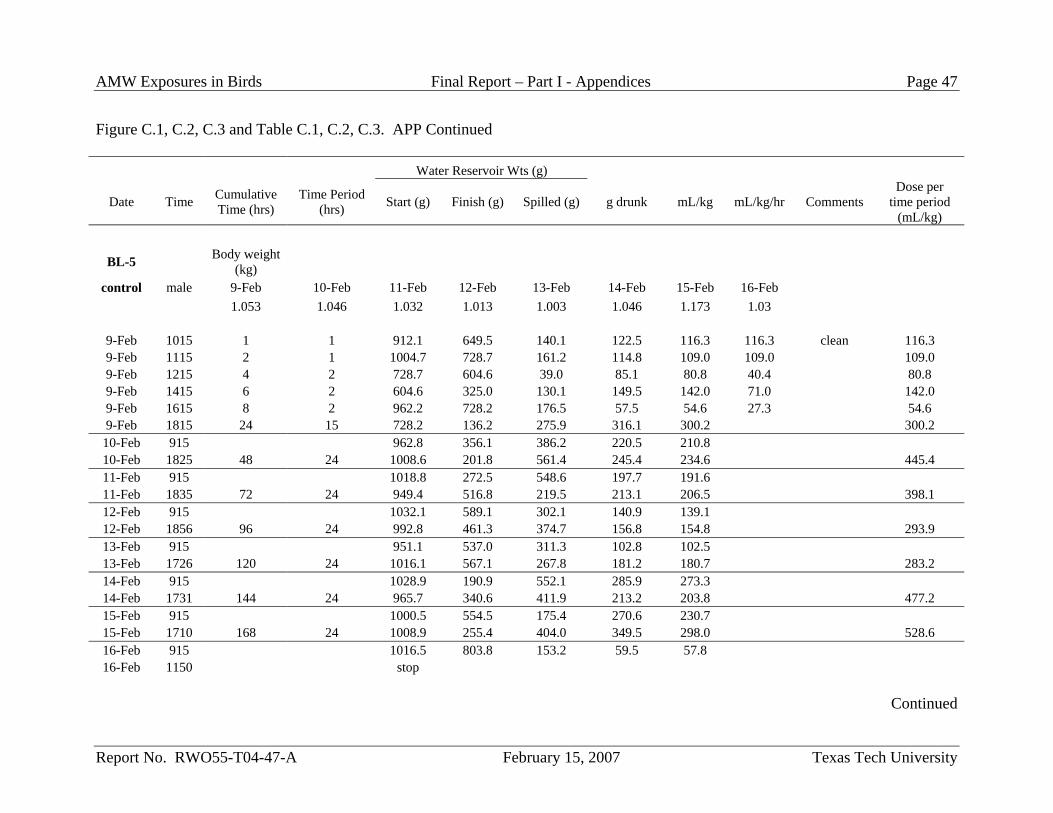
AMW Exposures in Birds Final Report – Part I - Appendices Page 47
Report No. RWO55-T04-47-A February 15, 2007 Texas Tech University
Figure C.1, C.2, C.3 and Table C.1, C.2, C.3. APP Continued
Water Reservoir Wts (g)
Date Time Cumulative Time (hrs)
Time Period (hrs) Start (g) Finish (g) Spilled (g) g drunk mL/kg mL/kg/hr Comments
Dose per time period
(mL/kg)
BL-5 Body weight (kg)
control male 9-Feb 10-Feb 11-Feb 12-Feb 13-Feb 14-Feb 15-Feb 16-Feb 1.053 1.046 1.032 1.013 1.003 1.046 1.173 1.03
9-Feb 1015 1 1 912.1 649.5 140.1 122.5 116.3 116.3 clean 116.3 9-Feb 1115 2 1 1004.7 728.7 161.2 114.8 109.0 109.0 109.0 9-Feb 1215 4 2 728.7 604.6 39.0 85.1 80.8 40.4 80.8 9-Feb 1415 6 2 604.6 325.0 130.1 149.5 142.0 71.0 142.0 9-Feb 1615 8 2 962.2 728.2 176.5 57.5 54.6 27.3 54.6 9-Feb 1815 24 15 728.2 136.2 275.9 316.1 300.2 300.2 10-Feb 915 962.8 356.1 386.2 220.5 210.8 10-Feb 1825 48 24 1008.6 201.8 561.4 245.4 234.6 445.4 11-Feb 915 1018.8 272.5 548.6 197.7 191.6 11-Feb 1835 72 24 949.4 516.8 219.5 213.1 206.5 398.1 12-Feb 915 1032.1 589.1 302.1 140.9 139.1 12-Feb 1856 96 24 992.8 461.3 374.7 156.8 154.8 293.9 13-Feb 915 951.1 537.0 311.3 102.8 102.5 13-Feb 1726 120 24 1016.1 567.1 267.8 181.2 180.7 283.2 14-Feb 915 1028.9 190.9 552.1 285.9 273.3 14-Feb 1731 144 24 965.7 340.6 411.9 213.2 203.8 477.2 15-Feb 915 1000.5 554.5 175.4 270.6 230.7 15-Feb 1710 168 24 1008.9 255.4 404.0 349.5 298.0 528.6 16-Feb 915 1016.5 803.8 153.2 59.5 57.8 16-Feb 1150 stop
Continued
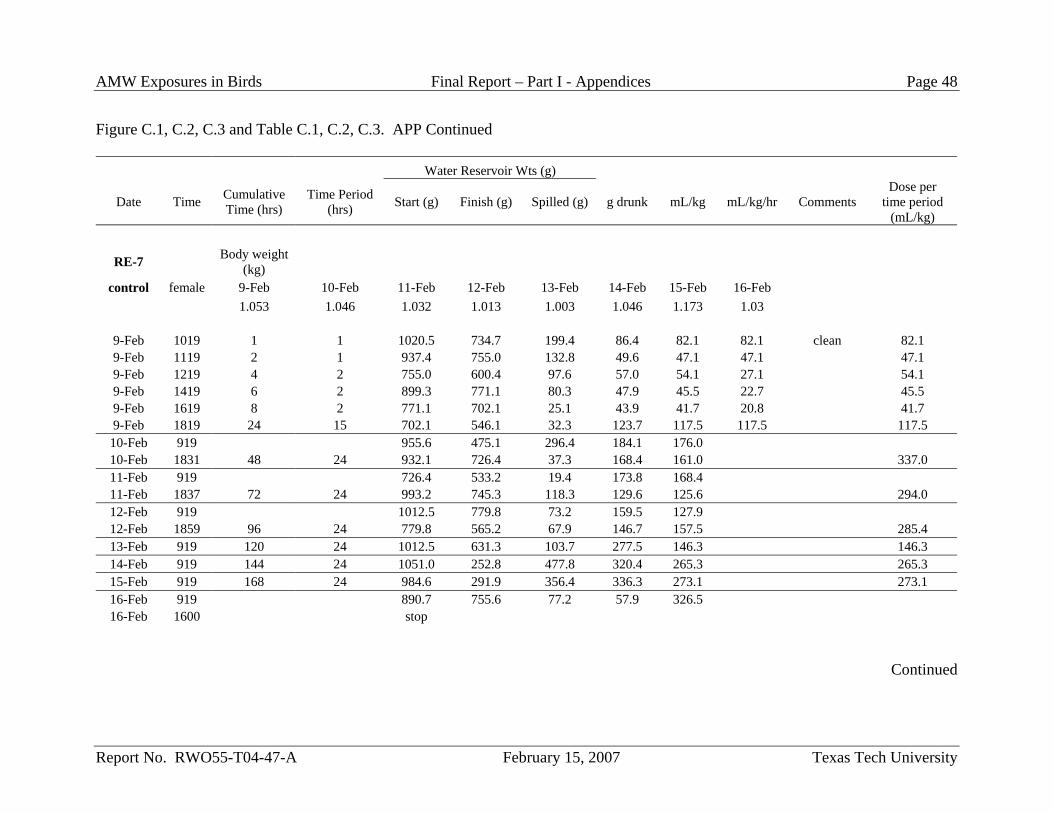
AMW Exposures in Birds Final Report – Part I - Appendices Page 48
Report No. RWO55-T04-47-A February 15, 2007 Texas Tech University
Figure C.1, C.2, C.3 and Table C.1, C.2, C.3. APP Continued
Water Reservoir Wts (g)
Date Time Cumulative Time (hrs)
Time Period (hrs) Start (g) Finish (g) Spilled (g) g drunk mL/kg mL/kg/hr Comments
Dose per time period
(mL/kg)
RE-7 Body weight (kg)
control female 9-Feb 10-Feb 11-Feb 12-Feb 13-Feb 14-Feb 15-Feb 16-Feb 1.053 1.046 1.032 1.013 1.003 1.046 1.173 1.03
9-Feb 1019 1 1 1020.5 734.7 199.4 86.4 82.1 82.1 clean 82.1 9-Feb 1119 2 1 937.4 755.0 132.8 49.6 47.1 47.1 47.1 9-Feb 1219 4 2 755.0 600.4 97.6 57.0 54.1 27.1 54.1 9-Feb 1419 6 2 899.3 771.1 80.3 47.9 45.5 22.7 45.5 9-Feb 1619 8 2 771.1 702.1 25.1 43.9 41.7 20.8 41.7 9-Feb 1819 24 15 702.1 546.1 32.3 123.7 117.5 117.5 117.5 10-Feb 919 955.6 475.1 296.4 184.1 176.0 10-Feb 1831 48 24 932.1 726.4 37.3 168.4 161.0 337.0 11-Feb 919 726.4 533.2 19.4 173.8 168.4 11-Feb 1837 72 24 993.2 745.3 118.3 129.6 125.6 294.0 12-Feb 919 1012.5 779.8 73.2 159.5 127.9 12-Feb 1859 96 24 779.8 565.2 67.9 146.7 157.5 285.4 13-Feb 919 120 24 1012.5 631.3 103.7 277.5 146.3 146.3 14-Feb 919 144 24 1051.0 252.8 477.8 320.4 265.3 265.3 15-Feb 919 168 24 984.6 291.9 356.4 336.3 273.1 273.1 16-Feb 919 890.7 755.6 77.2 57.9 326.5 16-Feb 1600 stop
Continued
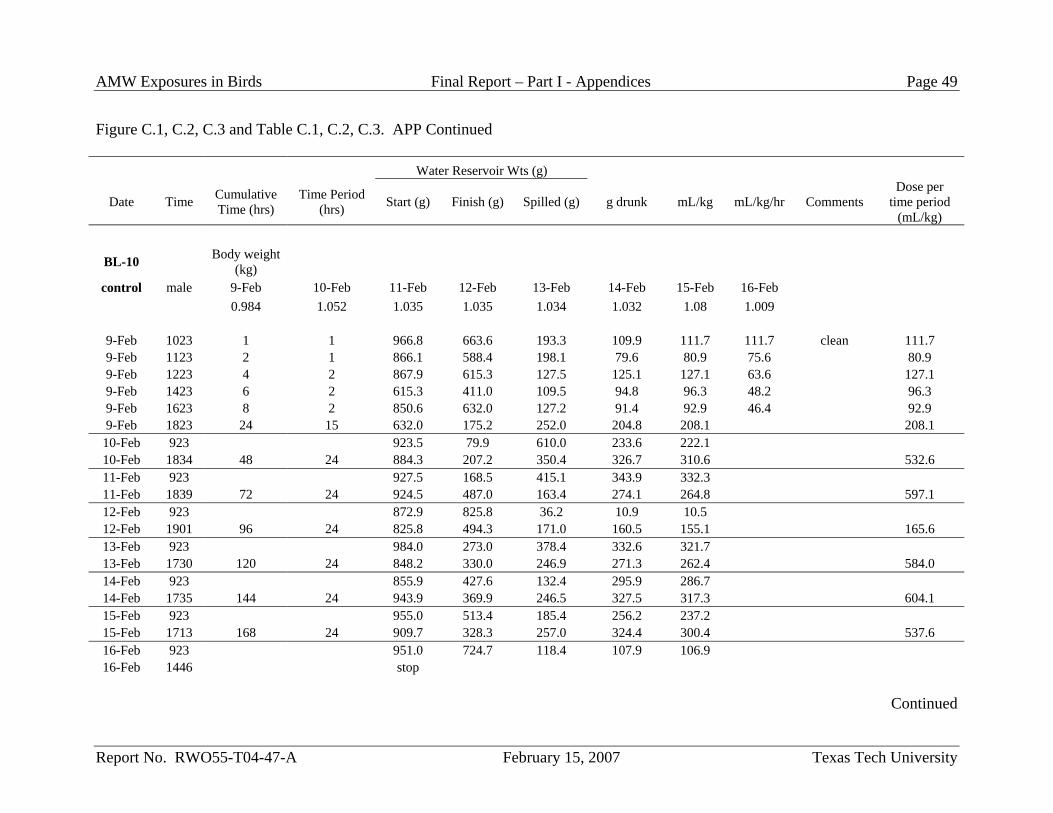
AMW Exposures in Birds Final Report – Part I - Appendices Page 49
Report No. RWO55-T04-47-A February 15, 2007 Texas Tech University
Figure C.1, C.2, C.3 and Table C.1, C.2, C.3. APP Continued
Water Reservoir Wts (g)
Date Time Cumulative Time (hrs)
Time Period (hrs) Start (g) Finish (g) Spilled (g) g drunk mL/kg mL/kg/hr Comments
Dose per time period
(mL/kg)
BL-10 Body weight (kg)
control male 9-Feb 10-Feb 11-Feb 12-Feb 13-Feb 14-Feb 15-Feb 16-Feb 0.984 1.052 1.035 1.035 1.034 1.032 1.08 1.009
9-Feb 1023 1 1 966.8 663.6 193.3 109.9 111.7 111.7 clean 111.7 9-Feb 1123 2 1 866.1 588.4 198.1 79.6 80.9 75.6 80.9 9-Feb 1223 4 2 867.9 615.3 127.5 125.1 127.1 63.6 127.1 9-Feb 1423 6 2 615.3 411.0 109.5 94.8 96.3 48.2 96.3 9-Feb 1623 8 2 850.6 632.0 127.2 91.4 92.9 46.4 92.9 9-Feb 1823 24 15 632.0 175.2 252.0 204.8 208.1 208.1 10-Feb 923 923.5 79.9 610.0 233.6 222.1 10-Feb 1834 48 24 884.3 207.2 350.4 326.7 310.6 532.6 11-Feb 923 927.5 168.5 415.1 343.9 332.3 11-Feb 1839 72 24 924.5 487.0 163.4 274.1 264.8 597.1 12-Feb 923 872.9 825.8 36.2 10.9 10.5 12-Feb 1901 96 24 825.8 494.3 171.0 160.5 155.1 165.6 13-Feb 923 984.0 273.0 378.4 332.6 321.7 13-Feb 1730 120 24 848.2 330.0 246.9 271.3 262.4 584.0 14-Feb 923 855.9 427.6 132.4 295.9 286.7 14-Feb 1735 144 24 943.9 369.9 246.5 327.5 317.3 604.1 15-Feb 923 955.0 513.4 185.4 256.2 237.2 15-Feb 1713 168 24 909.7 328.3 257.0 324.4 300.4 537.6 16-Feb 923 951.0 724.7 118.4 107.9 106.9 16-Feb 1446 stop
Continued
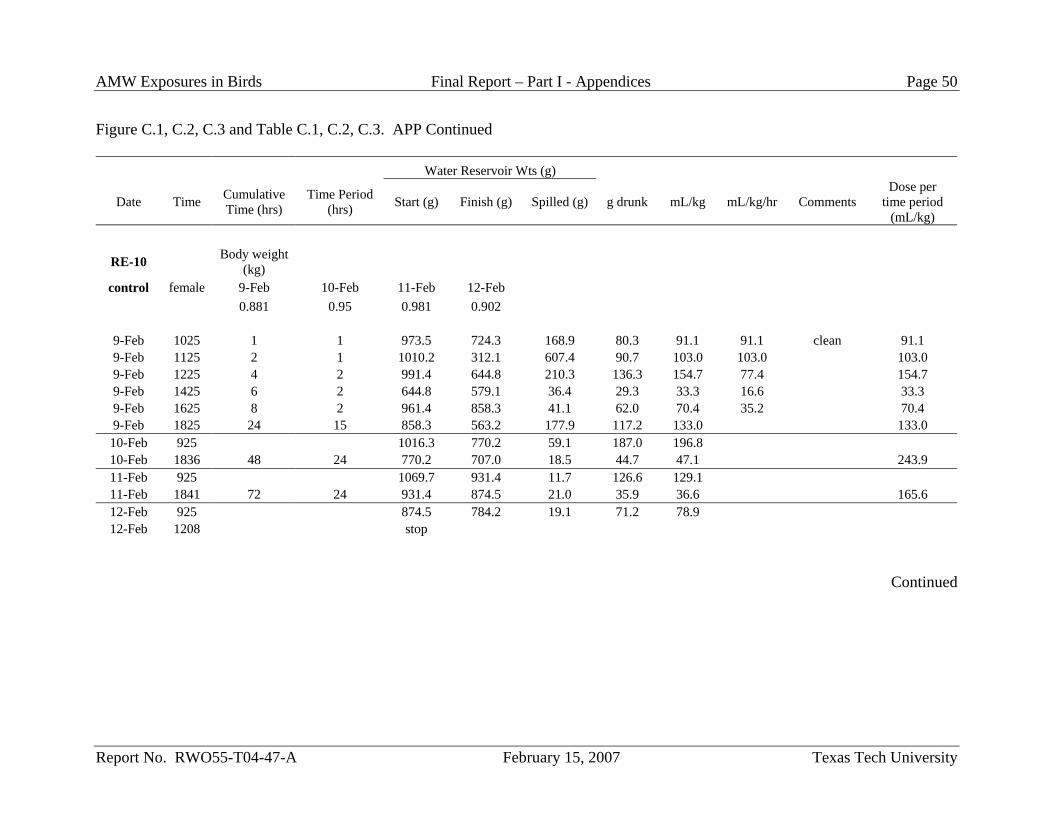
AMW Exposures in Birds Final Report – Part I - Appendices Page 50
Report No. RWO55-T04-47-A February 15, 2007 Texas Tech University
Figure C.1, C.2, C.3 and Table C.1, C.2, C.3. APP Continued
Water Reservoir Wts (g)
Date Time Cumulative Time (hrs)
Time Period (hrs) Start (g) Finish (g) Spilled (g) g drunk mL/kg mL/kg/hr Comments
Dose per time period
(mL/kg)
RE-10 Body weight (kg)
control female 9-Feb 10-Feb 11-Feb 12-Feb 0.881 0.95 0.981 0.902
9-Feb 1025 1 1 973.5 724.3 168.9 80.3 91.1 91.1 clean 91.1 9-Feb 1125 2 1 1010.2 312.1 607.4 90.7 103.0 103.0 103.0 9-Feb 1225 4 2 991.4 644.8 210.3 136.3 154.7 77.4 154.7 9-Feb 1425 6 2 644.8 579.1 36.4 29.3 33.3 16.6 33.3 9-Feb 1625 8 2 961.4 858.3 41.1 62.0 70.4 35.2 70.4 9-Feb 1825 24 15 858.3 563.2 177.9 117.2 133.0 133.0 10-Feb 925 1016.3 770.2 59.1 187.0 196.8 10-Feb 1836 48 24 770.2 707.0 18.5 44.7 47.1 243.9 11-Feb 925 1069.7 931.4 11.7 126.6 129.1 11-Feb 1841 72 24 931.4 874.5 21.0 35.9 36.6 165.6 12-Feb 925 874.5 784.2 19.1 71.2 78.9 12-Feb 1208 stop
Continued
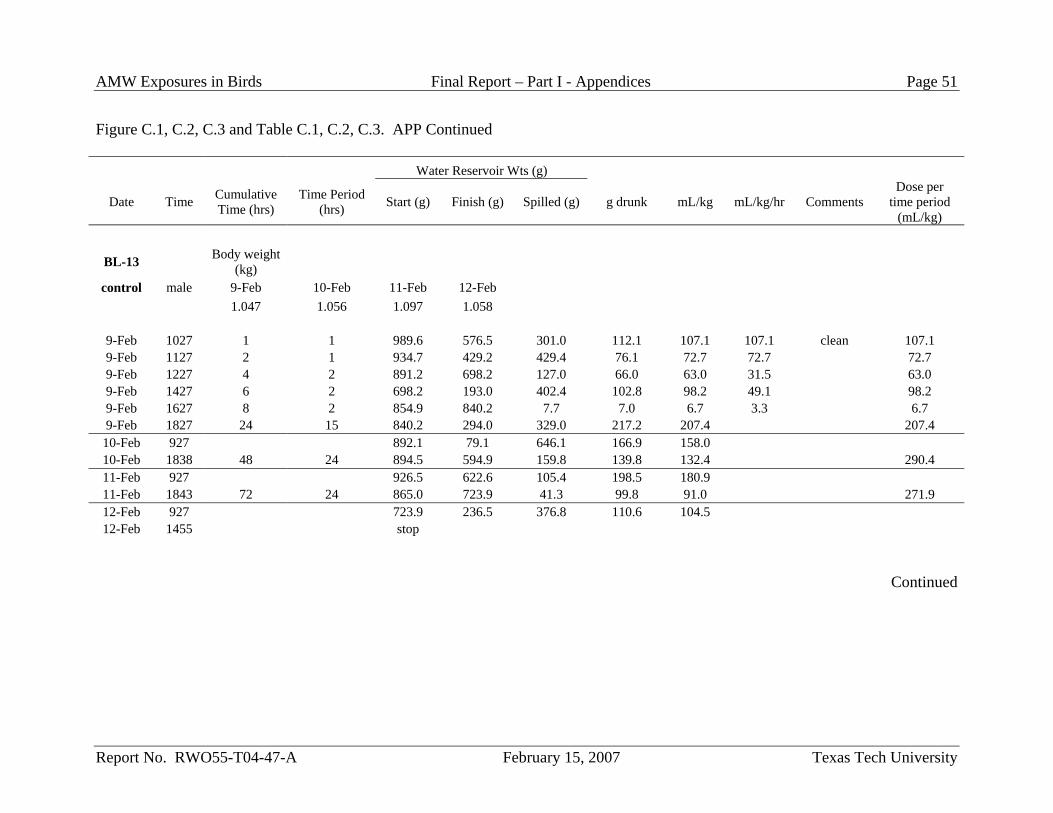
AMW Exposures in Birds Final Report – Part I - Appendices Page 51
Report No. RWO55-T04-47-A February 15, 2007 Texas Tech University
Figure C.1, C.2, C.3 and Table C.1, C.2, C.3. APP Continued
Water Reservoir Wts (g)
Date Time Cumulative Time (hrs)
Time Period (hrs) Start (g) Finish (g) Spilled (g) g drunk mL/kg mL/kg/hr Comments
Dose per time period
(mL/kg)
BL-13 Body weight (kg)
control male 9-Feb 10-Feb 11-Feb 12-Feb 1.047 1.056 1.097 1.058
9-Feb 1027 1 1 989.6 576.5 301.0 112.1 107.1 107.1 clean 107.1 9-Feb 1127 2 1 934.7 429.2 429.4 76.1 72.7 72.7 72.7 9-Feb 1227 4 2 891.2 698.2 127.0 66.0 63.0 31.5 63.0 9-Feb 1427 6 2 698.2 193.0 402.4 102.8 98.2 49.1 98.2 9-Feb 1627 8 2 854.9 840.2 7.7 7.0 6.7 3.3 6.7 9-Feb 1827 24 15 840.2 294.0 329.0 217.2 207.4 207.4 10-Feb 927 892.1 79.1 646.1 166.9 158.0 10-Feb 1838 48 24 894.5 594.9 159.8 139.8 132.4 290.4 11-Feb 927 926.5 622.6 105.4 198.5 180.9 11-Feb 1843 72 24 865.0 723.9 41.3 99.8 91.0 271.9 12-Feb 927 723.9 236.5 376.8 110.6 104.5 12-Feb 1455 stop
Continued
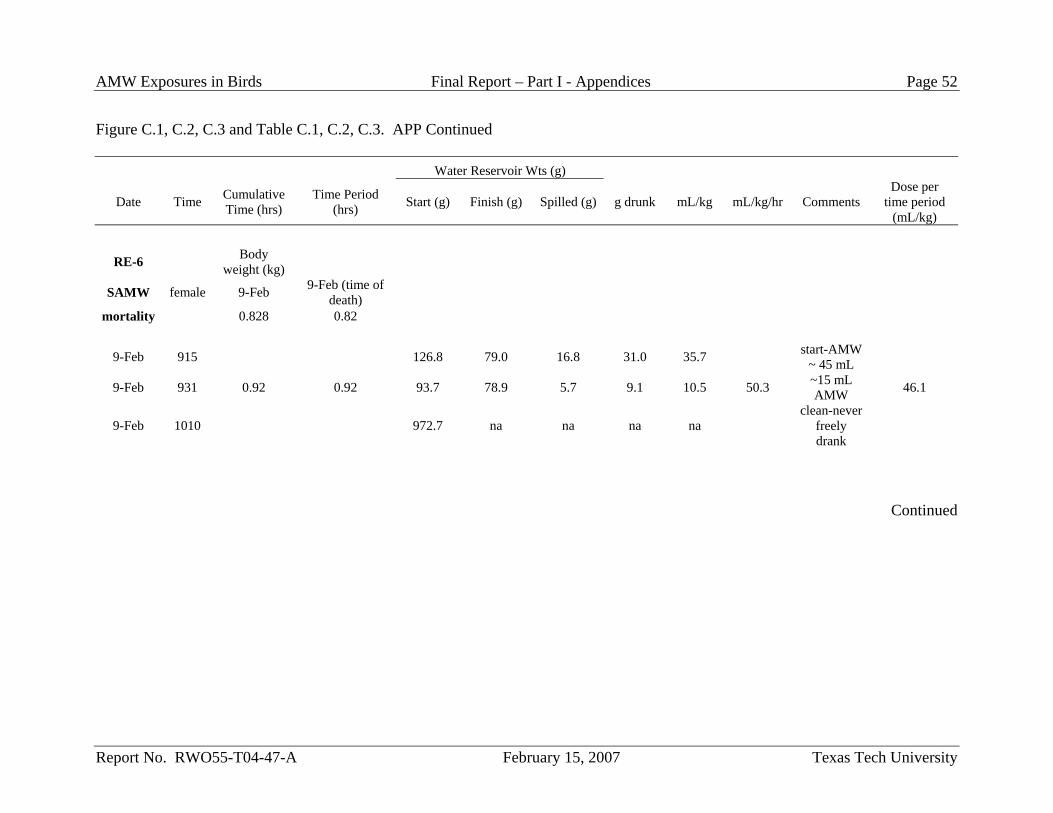
AMW Exposures in Birds Final Report – Part I - Appendices Page 52
Report No. RWO55-T04-47-A February 15, 2007 Texas Tech University
Figure C.1, C.2, C.3 and Table C.1, C.2, C.3. APP Continued
Water Reservoir Wts (g)
Date Time Cumulative Time (hrs)
Time Period (hrs) Start (g) Finish (g) Spilled (g) g drunk mL/kg mL/kg/hr Comments
Dose per time period
(mL/kg)
RE-6 Body weight (kg)
SAMW female 9-Feb 9-Feb (time of death)
mortality 0.828 0.82
9-Feb 915 126.8 79.0 16.8 31.0 35.7 start-AMW ~ 45 mL
9-Feb 931 0.92 0.92 93.7 78.9 5.7 9.1 10.5 50.3 ~15 mL AMW 46.1
9-Feb 1010 972.7 na na na na clean-never
freely drank
Continued
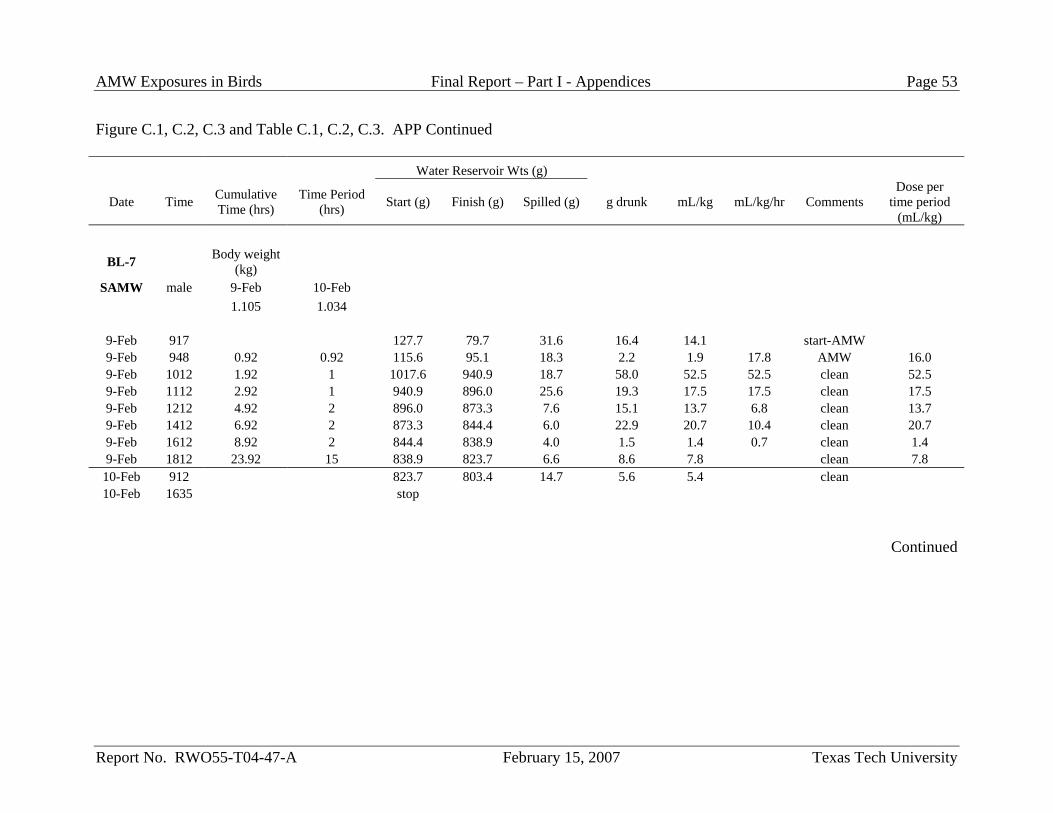
AMW Exposures in Birds Final Report – Part I - Appendices Page 53
Report No. RWO55-T04-47-A February 15, 2007 Texas Tech University
Figure C.1, C.2, C.3 and Table C.1, C.2, C.3. APP Continued
Water Reservoir Wts (g)
Date Time Cumulative Time (hrs)
Time Period (hrs) Start (g) Finish (g) Spilled (g) g drunk mL/kg mL/kg/hr Comments
Dose per time period
(mL/kg)
BL-7 Body weight (kg)
SAMW male 9-Feb 10-Feb 1.105 1.034
9-Feb 917 127.7 79.7 31.6 16.4 14.1 start-AMW 9-Feb 948 0.92 0.92 115.6 95.1 18.3 2.2 1.9 17.8 AMW 16.0 9-Feb 1012 1.92 1 1017.6 940.9 18.7 58.0 52.5 52.5 clean 52.5 9-Feb 1112 2.92 1 940.9 896.0 25.6 19.3 17.5 17.5 clean 17.5 9-Feb 1212 4.92 2 896.0 873.3 7.6 15.1 13.7 6.8 clean 13.7 9-Feb 1412 6.92 2 873.3 844.4 6.0 22.9 20.7 10.4 clean 20.7 9-Feb 1612 8.92 2 844.4 838.9 4.0 1.5 1.4 0.7 clean 1.4 9-Feb 1812 23.92 15 838.9 823.7 6.6 8.6 7.8 clean 7.8 10-Feb 912 823.7 803.4 14.7 5.6 5.4 clean 10-Feb 1635 stop
Continued
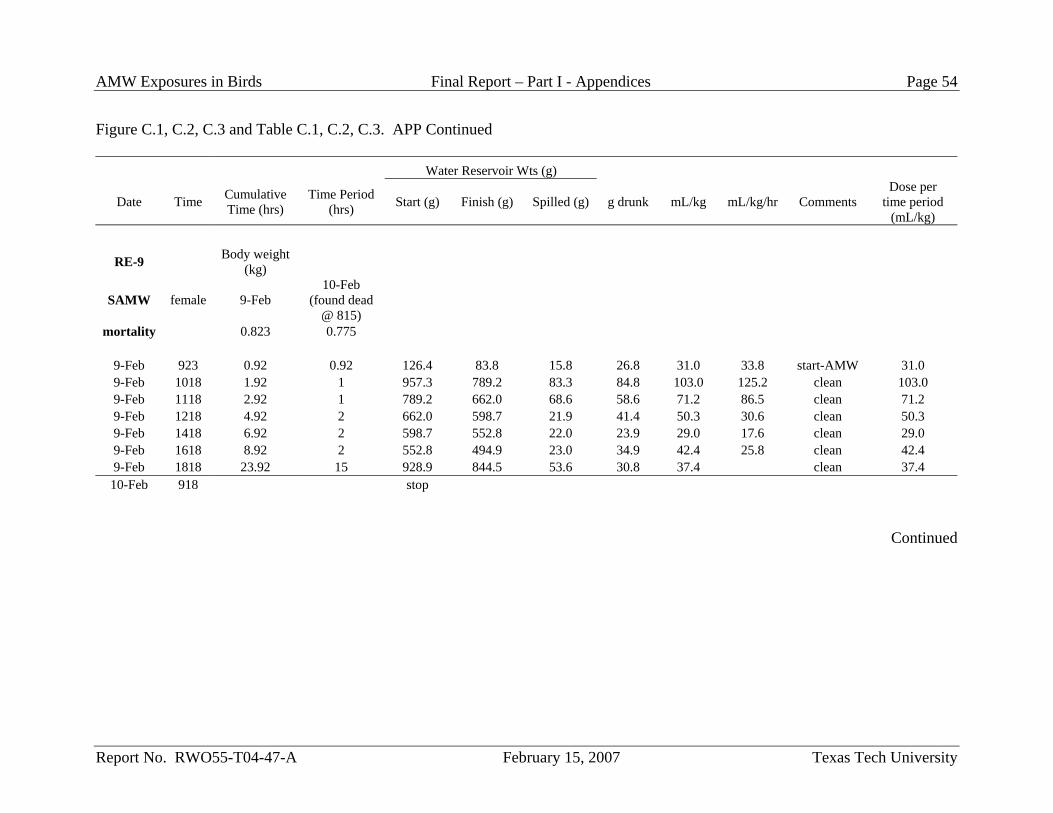
AMW Exposures in Birds Final Report – Part I - Appendices Page 54
Report No. RWO55-T04-47-A February 15, 2007 Texas Tech University
Figure C.1, C.2, C.3 and Table C.1, C.2, C.3. APP Continued
Water Reservoir Wts (g)
Date Time Cumulative Time (hrs)
Time Period (hrs) Start (g) Finish (g) Spilled (g) g drunk mL/kg mL/kg/hr Comments
Dose per time period
(mL/kg)
RE-9 Body weight (kg)
SAMW female 9-Feb 10-Feb
(found dead @ 815)
mortality 0.823 0.775
9-Feb 923 0.92 0.92 126.4 83.8 15.8 26.8 31.0 33.8 start-AMW 31.0 9-Feb 1018 1.92 1 957.3 789.2 83.3 84.8 103.0 125.2 clean 103.0 9-Feb 1118 2.92 1 789.2 662.0 68.6 58.6 71.2 86.5 clean 71.2 9-Feb 1218 4.92 2 662.0 598.7 21.9 41.4 50.3 30.6 clean 50.3 9-Feb 1418 6.92 2 598.7 552.8 22.0 23.9 29.0 17.6 clean 29.0 9-Feb 1618 8.92 2 552.8 494.9 23.0 34.9 42.4 25.8 clean 42.4 9-Feb 1818 23.92 15 928.9 844.5 53.6 30.8 37.4 clean 37.4 10-Feb 918 stop
Continued
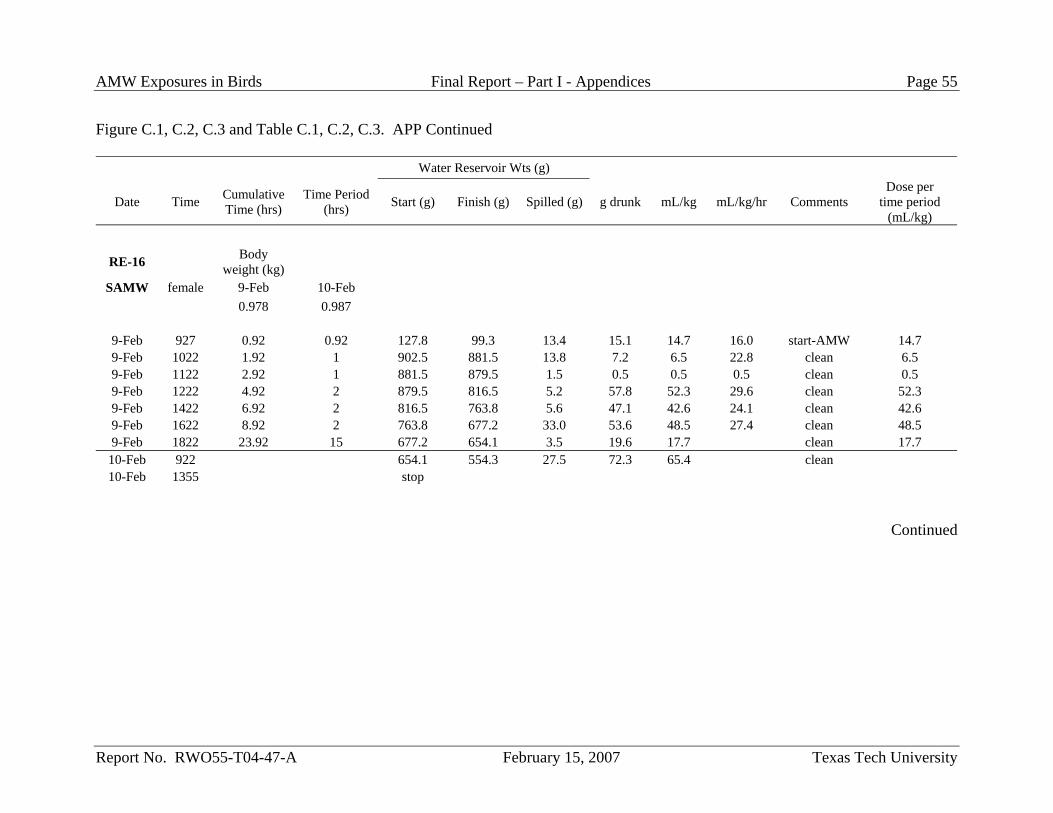
AMW Exposures in Birds Final Report – Part I - Appendices Page 55
Report No. RWO55-T04-47-A February 15, 2007 Texas Tech University
Figure C.1, C.2, C.3 and Table C.1, C.2, C.3. APP Continued
Water Reservoir Wts (g)
Date Time Cumulative Time (hrs)
Time Period (hrs) Start (g) Finish (g) Spilled (g) g drunk mL/kg mL/kg/hr Comments
Dose per time period
(mL/kg)
RE-16 Body weight (kg)
SAMW female 9-Feb 10-Feb 0.978 0.987
9-Feb 927 0.92 0.92 127.8 99.3 13.4 15.1 14.7 16.0 start-AMW 14.7 9-Feb 1022 1.92 1 902.5 881.5 13.8 7.2 6.5 22.8 clean 6.5 9-Feb 1122 2.92 1 881.5 879.5 1.5 0.5 0.5 0.5 clean 0.5 9-Feb 1222 4.92 2 879.5 816.5 5.2 57.8 52.3 29.6 clean 52.3 9-Feb 1422 6.92 2 816.5 763.8 5.6 47.1 42.6 24.1 clean 42.6 9-Feb 1622 8.92 2 763.8 677.2 33.0 53.6 48.5 27.4 clean 48.5 9-Feb 1822 23.92 15 677.2 654.1 3.5 19.6 17.7 clean 17.7
10-Feb 922 654.1 554.3 27.5 72.3 65.4 clean 10-Feb 1355 stop
Continued
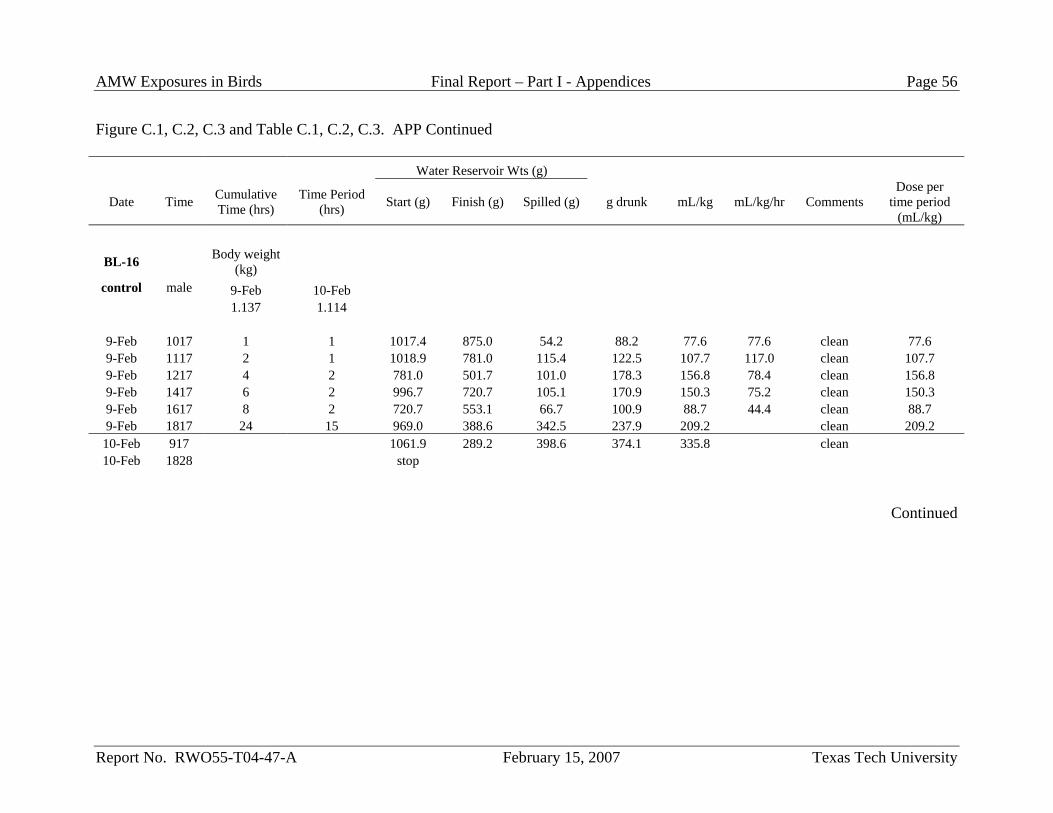
AMW Exposures in Birds Final Report – Part I - Appendices Page 56
Report No. RWO55-T04-47-A February 15, 2007 Texas Tech University
Figure C.1, C.2, C.3 and Table C.1, C.2, C.3. APP Continued
Water Reservoir Wts (g)
Date Time Cumulative Time (hrs)
Time Period (hrs) Start (g) Finish (g) Spilled (g) g drunk mL/kg mL/kg/hr Comments
Dose per time period
(mL/kg)
BL-16 Body weight (kg)
control male 9-Feb 10-Feb 1.137 1.114
9-Feb 1017 1 1 1017.4 875.0 54.2 88.2 77.6 77.6 clean 77.6 9-Feb 1117 2 1 1018.9 781.0 115.4 122.5 107.7 117.0 clean 107.7 9-Feb 1217 4 2 781.0 501.7 101.0 178.3 156.8 78.4 clean 156.8 9-Feb 1417 6 2 996.7 720.7 105.1 170.9 150.3 75.2 clean 150.3 9-Feb 1617 8 2 720.7 553.1 66.7 100.9 88.7 44.4 clean 88.7 9-Feb 1817 24 15 969.0 388.6 342.5 237.9 209.2 clean 209.2 10-Feb 917 1061.9 289.2 398.6 374.1 335.8 clean 10-Feb 1828 stop
Continued

AMW Exposures in Birds Final Report – Part I - Appendices Page 57
Report No. RWO55-T04-47-A February 15, 2007 Texas Tech University
Figure C.1, C.2, C.3 and Table C.1, C.2, C.3. APP Continued
Water Reservoir Wts (g)
Date Time Cumulative Time (hrs)
Time Period (hrs) Start (g) Finish (g) Spilled (g) g drunk mL/kg mL/kg/hr Comments
Dose per time period
(mL/kg)
RE-1 Body weight (kg)
control female 9-Feb 10-Feb 1.006 1.012
9-Feb 1021 1 1 1011.7 705.7 210.0 96.0 95.4 95.4 clean 95.4 9-Feb 1121 2 1 859.9 694.0 119.0 46.9 46.6 46.6 clean 46.6 9-Feb 1221 4 2 694.0 565.0 93.1 35.9 35.7 17.8 clean 35.7 9-Feb 1421 6 2 565.0 458.9 65.4 40.7 40.5 20.2 clean 40.5 9-Feb 1621 8 2 884.8 733.3 113.3 38.2 38.0 19.0 clean 38.0 9-Feb 1821 24 15 733.3 183.5 402.7 147.1 146.2 clean 146.2 10-Feb 921 945.3 760.4 134.7 50.2 49.6 clean 10-Feb 1230 stop
Continued
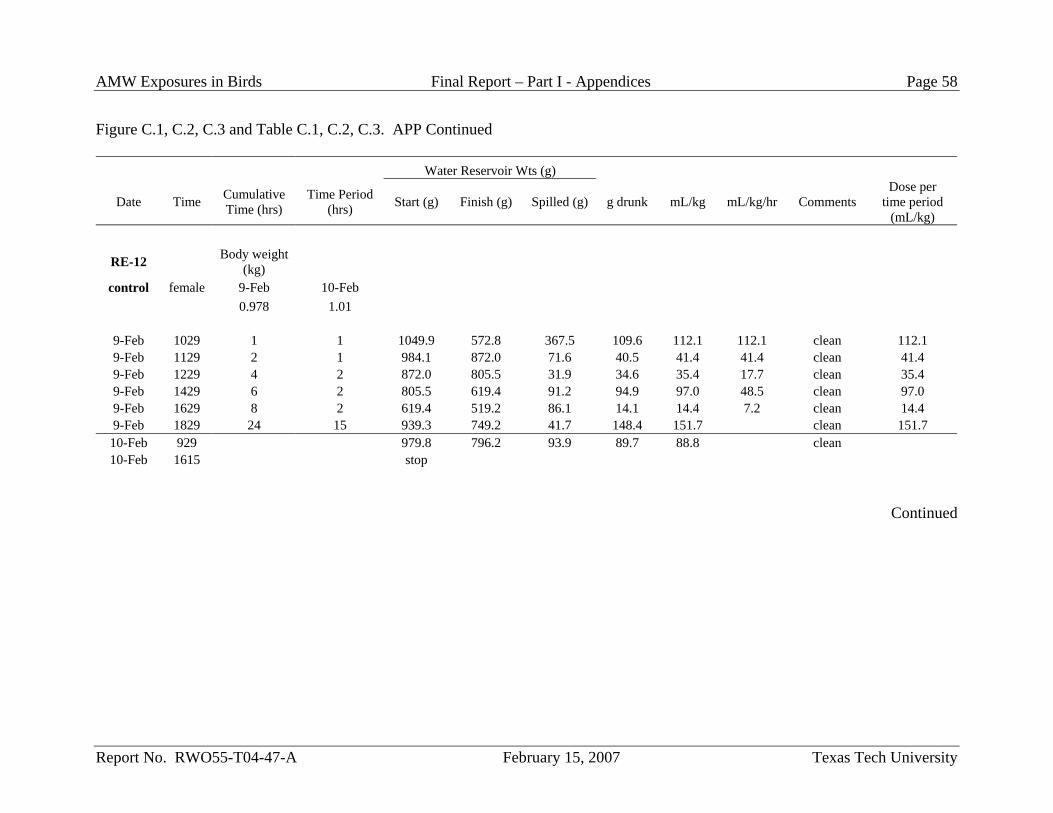
AMW Exposures in Birds Final Report – Part I - Appendices Page 58
Report No. RWO55-T04-47-A February 15, 2007 Texas Tech University
Figure C.1, C.2, C.3 and Table C.1, C.2, C.3. APP Continued
Water Reservoir Wts (g)
Date Time Cumulative Time (hrs)
Time Period (hrs) Start (g) Finish (g) Spilled (g) g drunk mL/kg mL/kg/hr Comments
Dose per time period
(mL/kg)
RE-12 Body weight (kg)
control female 9-Feb 10-Feb 0.978 1.01
9-Feb 1029 1 1 1049.9 572.8 367.5 109.6 112.1 112.1 clean 112.1 9-Feb 1129 2 1 984.1 872.0 71.6 40.5 41.4 41.4 clean 41.4 9-Feb 1229 4 2 872.0 805.5 31.9 34.6 35.4 17.7 clean 35.4 9-Feb 1429 6 2 805.5 619.4 91.2 94.9 97.0 48.5 clean 97.0 9-Feb 1629 8 2 619.4 519.2 86.1 14.1 14.4 7.2 clean 14.4 9-Feb 1829 24 15 939.3 749.2 41.7 148.4 151.7 clean 151.7 10-Feb 929 979.8 796.2 93.9 89.7 88.8 clean 10-Feb 1615 stop
Continued
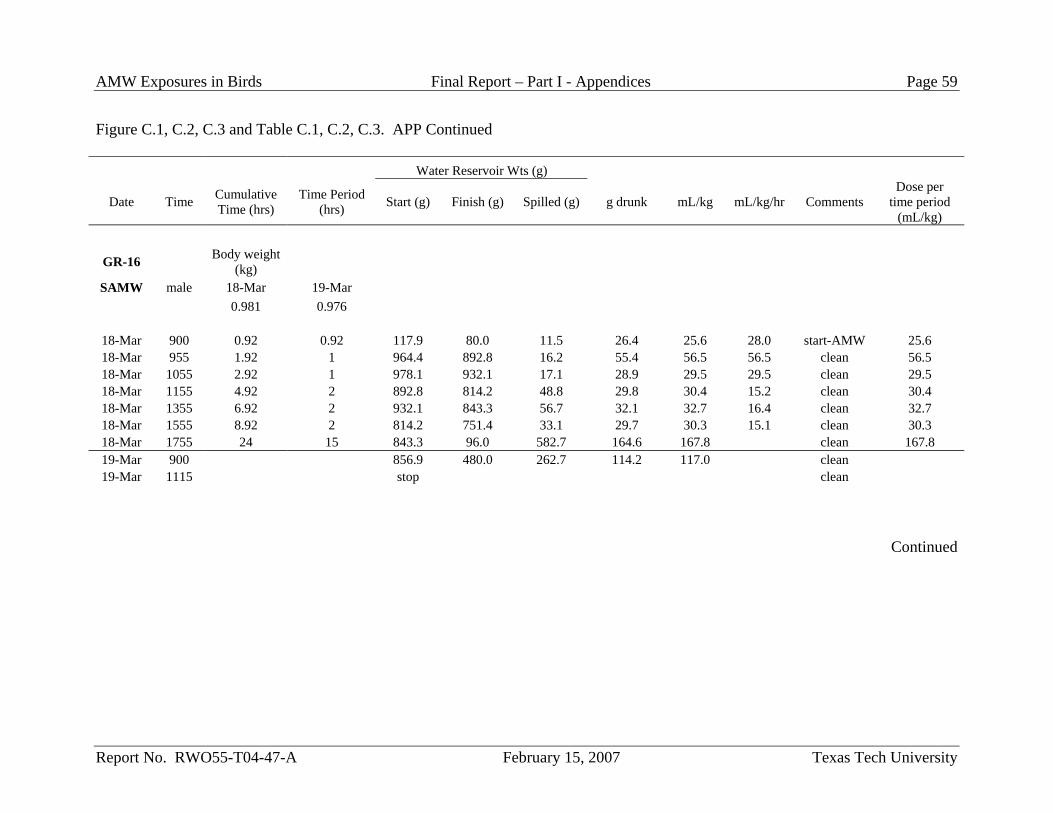
AMW Exposures in Birds Final Report – Part I - Appendices Page 59
Report No. RWO55-T04-47-A February 15, 2007 Texas Tech University
Figure C.1, C.2, C.3 and Table C.1, C.2, C.3. APP Continued
Water Reservoir Wts (g)
Date Time Cumulative Time (hrs)
Time Period (hrs) Start (g) Finish (g) Spilled (g) g drunk mL/kg mL/kg/hr Comments
Dose per time period
(mL/kg)
GR-16 Body weight (kg)
SAMW male 18-Mar 19-Mar 0.981 0.976
18-Mar 900 0.92 0.92 117.9 80.0 11.5 26.4 25.6 28.0 start-AMW 25.6 18-Mar 955 1.92 1 964.4 892.8 16.2 55.4 56.5 56.5 clean 56.5 18-Mar 1055 2.92 1 978.1 932.1 17.1 28.9 29.5 29.5 clean 29.5 18-Mar 1155 4.92 2 892.8 814.2 48.8 29.8 30.4 15.2 clean 30.4 18-Mar 1355 6.92 2 932.1 843.3 56.7 32.1 32.7 16.4 clean 32.7 18-Mar 1555 8.92 2 814.2 751.4 33.1 29.7 30.3 15.1 clean 30.3 18-Mar 1755 24 15 843.3 96.0 582.7 164.6 167.8 clean 167.8 19-Mar 900 856.9 480.0 262.7 114.2 117.0 clean 19-Mar 1115 stop clean
Continued
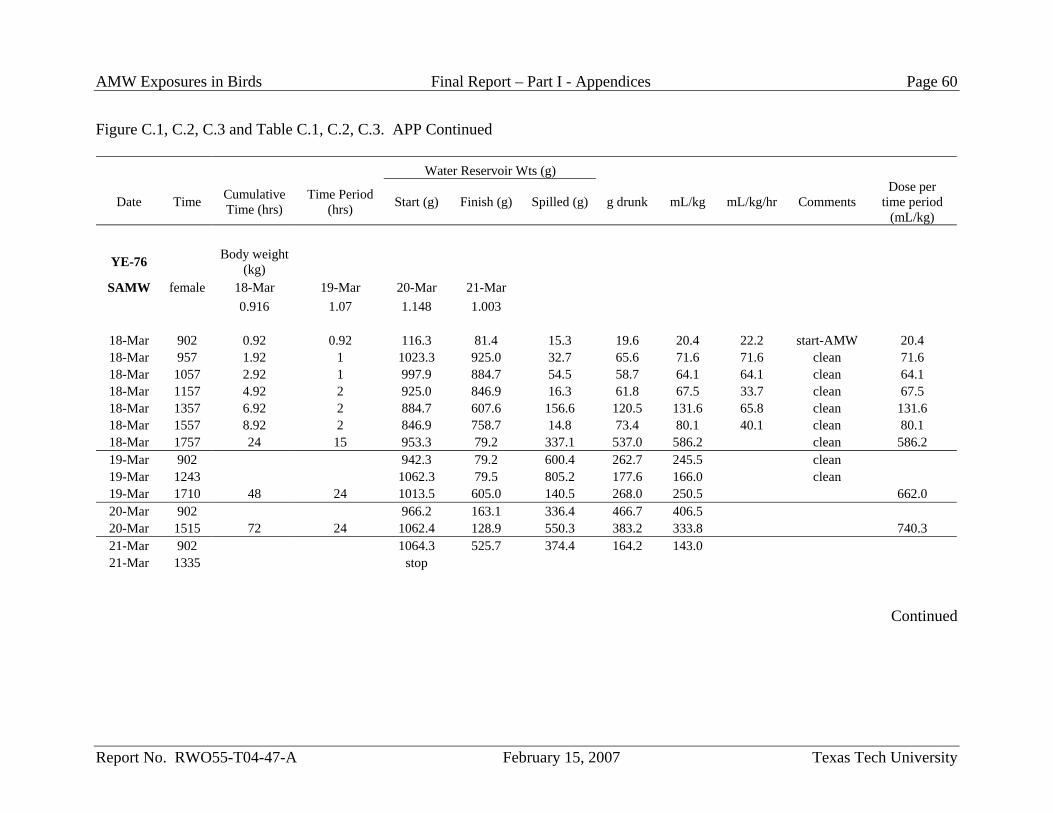
AMW Exposures in Birds Final Report – Part I - Appendices Page 60
Report No. RWO55-T04-47-A February 15, 2007 Texas Tech University
Figure C.1, C.2, C.3 and Table C.1, C.2, C.3. APP Continued
Water Reservoir Wts (g)
Date Time Cumulative Time (hrs)
Time Period (hrs) Start (g) Finish (g) Spilled (g) g drunk mL/kg mL/kg/hr Comments
Dose per time period
(mL/kg)
YE-76 Body weight (kg)
SAMW female 18-Mar 19-Mar 20-Mar 21-Mar 0.916 1.07 1.148 1.003
18-Mar 902 0.92 0.92 116.3 81.4 15.3 19.6 20.4 22.2 start-AMW 20.4 18-Mar 957 1.92 1 1023.3 925.0 32.7 65.6 71.6 71.6 clean 71.6 18-Mar 1057 2.92 1 997.9 884.7 54.5 58.7 64.1 64.1 clean 64.1 18-Mar 1157 4.92 2 925.0 846.9 16.3 61.8 67.5 33.7 clean 67.5 18-Mar 1357 6.92 2 884.7 607.6 156.6 120.5 131.6 65.8 clean 131.6 18-Mar 1557 8.92 2 846.9 758.7 14.8 73.4 80.1 40.1 clean 80.1 18-Mar 1757 24 15 953.3 79.2 337.1 537.0 586.2 clean 586.2 19-Mar 902 942.3 79.2 600.4 262.7 245.5 clean 19-Mar 1243 1062.3 79.5 805.2 177.6 166.0 clean 19-Mar 1710 48 24 1013.5 605.0 140.5 268.0 250.5 662.0 20-Mar 902 966.2 163.1 336.4 466.7 406.5 20-Mar 1515 72 24 1062.4 128.9 550.3 383.2 333.8 740.3 21-Mar 902 1064.3 525.7 374.4 164.2 143.0 21-Mar 1335 stop
Continued
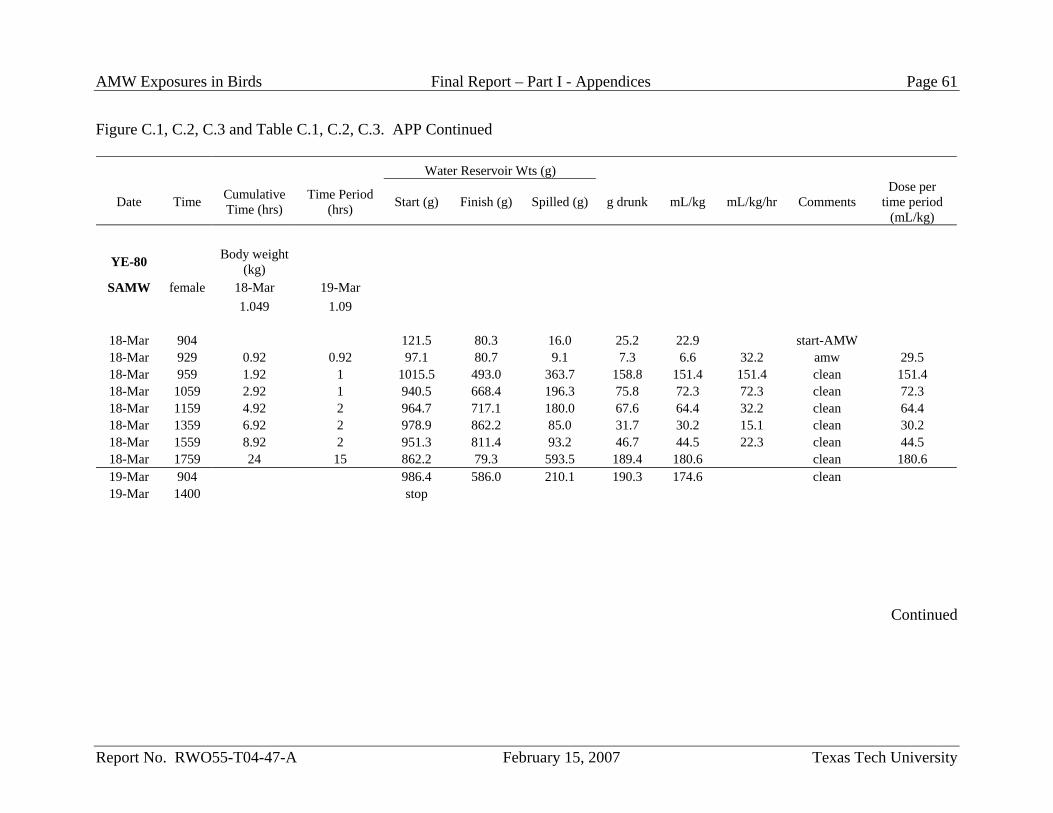
AMW Exposures in Birds Final Report – Part I - Appendices Page 61
Report No. RWO55-T04-47-A February 15, 2007 Texas Tech University
Figure C.1, C.2, C.3 and Table C.1, C.2, C.3. APP Continued
Water Reservoir Wts (g)
Date Time Cumulative Time (hrs)
Time Period (hrs) Start (g) Finish (g) Spilled (g) g drunk mL/kg mL/kg/hr Comments
Dose per time period
(mL/kg)
YE-80 Body weight (kg)
SAMW female 18-Mar 19-Mar 1.049 1.09
18-Mar 904 121.5 80.3 16.0 25.2 22.9 start-AMW 18-Mar 929 0.92 0.92 97.1 80.7 9.1 7.3 6.6 32.2 amw 29.5 18-Mar 959 1.92 1 1015.5 493.0 363.7 158.8 151.4 151.4 clean 151.4 18-Mar 1059 2.92 1 940.5 668.4 196.3 75.8 72.3 72.3 clean 72.3 18-Mar 1159 4.92 2 964.7 717.1 180.0 67.6 64.4 32.2 clean 64.4 18-Mar 1359 6.92 2 978.9 862.2 85.0 31.7 30.2 15.1 clean 30.2 18-Mar 1559 8.92 2 951.3 811.4 93.2 46.7 44.5 22.3 clean 44.5 18-Mar 1759 24 15 862.2 79.3 593.5 189.4 180.6 clean 180.6 19-Mar 904 986.4 586.0 210.1 190.3 174.6 clean 19-Mar 1400 stop
Continued
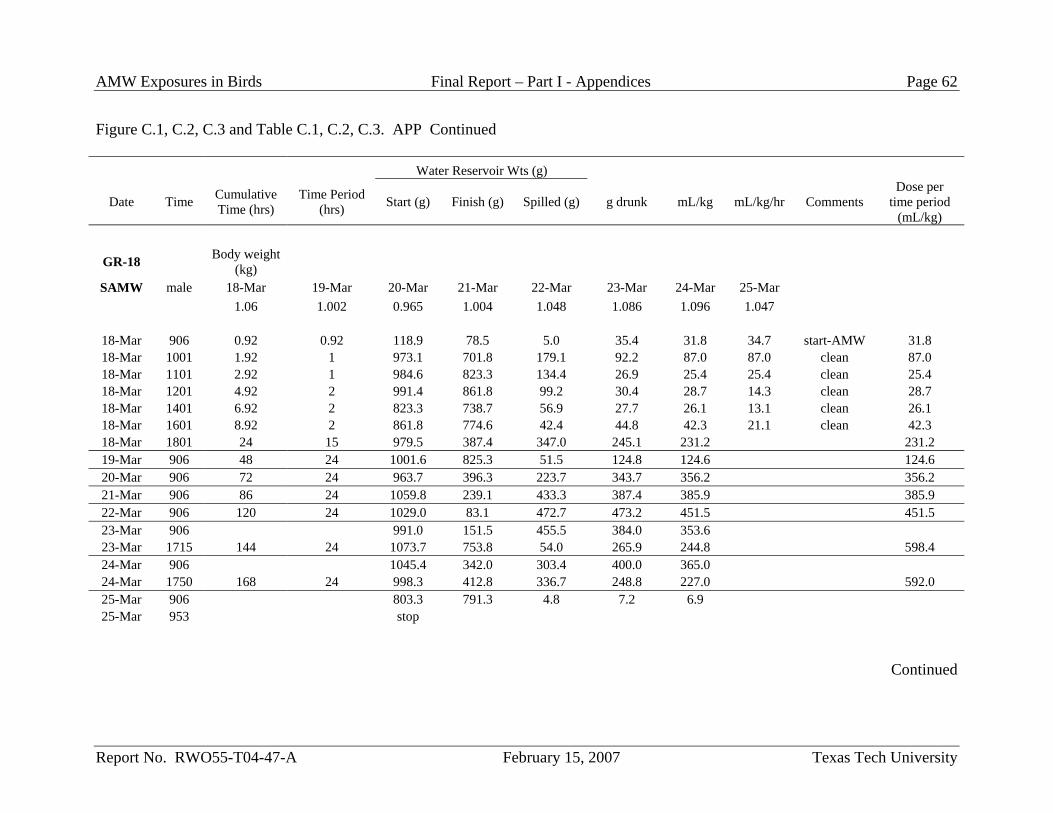
AMW Exposures in Birds Final Report – Part I - Appendices Page 62
Report No. RWO55-T04-47-A February 15, 2007 Texas Tech University
Figure C.1, C.2, C.3 and Table C.1, C.2, C.3. APP Continued
Water Reservoir Wts (g)
Date Time Cumulative Time (hrs)
Time Period (hrs) Start (g) Finish (g) Spilled (g) g drunk mL/kg mL/kg/hr Comments
Dose per time period
(mL/kg)
GR-18 Body weight (kg)
SAMW male 18-Mar 19-Mar 20-Mar 21-Mar 22-Mar 23-Mar 24-Mar 25-Mar 1.06 1.002 0.965 1.004 1.048 1.086 1.096 1.047
18-Mar 906 0.92 0.92 118.9 78.5 5.0 35.4 31.8 34.7 start-AMW 31.8 18-Mar 1001 1.92 1 973.1 701.8 179.1 92.2 87.0 87.0 clean 87.0 18-Mar 1101 2.92 1 984.6 823.3 134.4 26.9 25.4 25.4 clean 25.4 18-Mar 1201 4.92 2 991.4 861.8 99.2 30.4 28.7 14.3 clean 28.7 18-Mar 1401 6.92 2 823.3 738.7 56.9 27.7 26.1 13.1 clean 26.1 18-Mar 1601 8.92 2 861.8 774.6 42.4 44.8 42.3 21.1 clean 42.3 18-Mar 1801 24 15 979.5 387.4 347.0 245.1 231.2 231.2 19-Mar 906 48 24 1001.6 825.3 51.5 124.8 124.6 124.6 20-Mar 906 72 24 963.7 396.3 223.7 343.7 356.2 356.2 21-Mar 906 86 24 1059.8 239.1 433.3 387.4 385.9 385.9 22-Mar 906 120 24 1029.0 83.1 472.7 473.2 451.5 451.5 23-Mar 906 991.0 151.5 455.5 384.0 353.6 23-Mar 1715 144 24 1073.7 753.8 54.0 265.9 244.8 598.4 24-Mar 906 1045.4 342.0 303.4 400.0 365.0 24-Mar 1750 168 24 998.3 412.8 336.7 248.8 227.0 592.0 25-Mar 906 803.3 791.3 4.8 7.2 6.9 25-Mar 953 stop
Continued
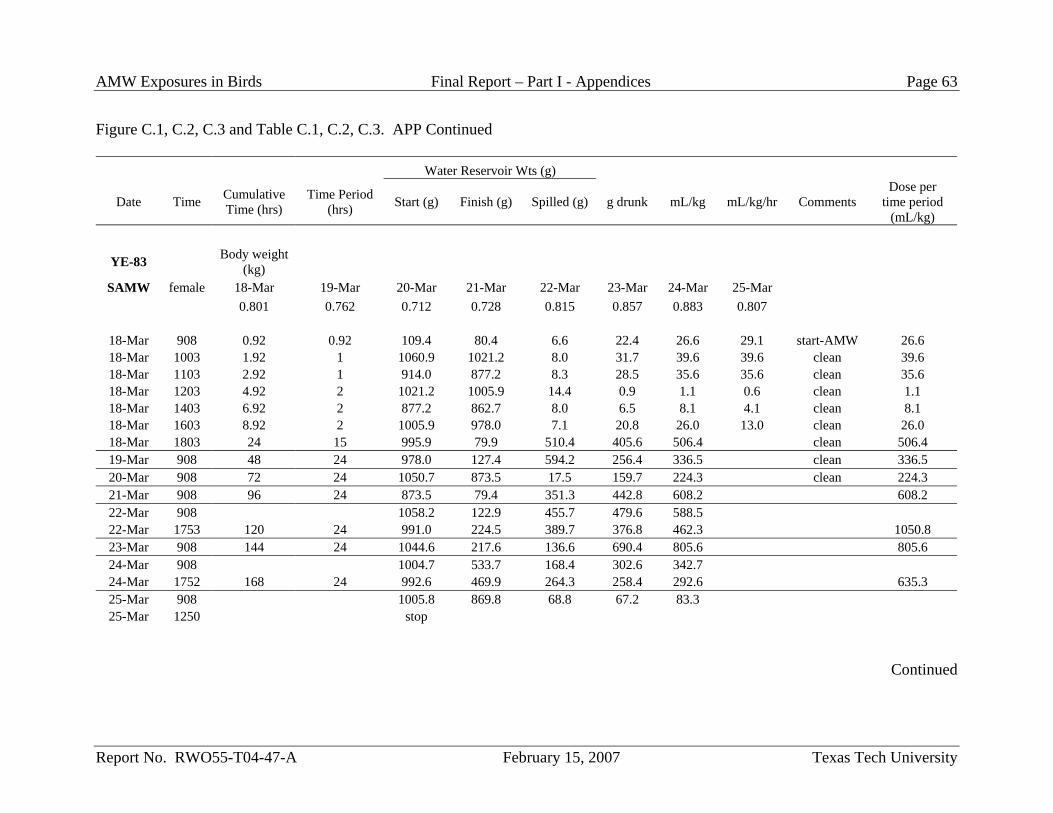
AMW Exposures in Birds Final Report – Part I - Appendices Page 63
Report No. RWO55-T04-47-A February 15, 2007 Texas Tech University
Figure C.1, C.2, C.3 and Table C.1, C.2, C.3. APP Continued
Water Reservoir Wts (g)
Date Time Cumulative Time (hrs)
Time Period (hrs) Start (g) Finish (g) Spilled (g) g drunk mL/kg mL/kg/hr Comments
Dose per time period
(mL/kg)
YE-83 Body weight (kg)
SAMW female 18-Mar 19-Mar 20-Mar 21-Mar 22-Mar 23-Mar 24-Mar 25-Mar 0.801 0.762 0.712 0.728 0.815 0.857 0.883 0.807
18-Mar 908 0.92 0.92 109.4 80.4 6.6 22.4 26.6 29.1 start-AMW 26.6 18-Mar 1003 1.92 1 1060.9 1021.2 8.0 31.7 39.6 39.6 clean 39.6 18-Mar 1103 2.92 1 914.0 877.2 8.3 28.5 35.6 35.6 clean 35.6 18-Mar 1203 4.92 2 1021.2 1005.9 14.4 0.9 1.1 0.6 clean 1.1 18-Mar 1403 6.92 2 877.2 862.7 8.0 6.5 8.1 4.1 clean 8.1 18-Mar 1603 8.92 2 1005.9 978.0 7.1 20.8 26.0 13.0 clean 26.0 18-Mar 1803 24 15 995.9 79.9 510.4 405.6 506.4 clean 506.4 19-Mar 908 48 24 978.0 127.4 594.2 256.4 336.5 clean 336.5 20-Mar 908 72 24 1050.7 873.5 17.5 159.7 224.3 clean 224.3 21-Mar 908 96 24 873.5 79.4 351.3 442.8 608.2 608.2 22-Mar 908 1058.2 122.9 455.7 479.6 588.5 22-Mar 1753 120 24 991.0 224.5 389.7 376.8 462.3 1050.8 23-Mar 908 144 24 1044.6 217.6 136.6 690.4 805.6 805.6 24-Mar 908 1004.7 533.7 168.4 302.6 342.7 24-Mar 1752 168 24 992.6 469.9 264.3 258.4 292.6 635.3 25-Mar 908 1005.8 869.8 68.8 67.2 83.3 25-Mar 1250 stop
Continued
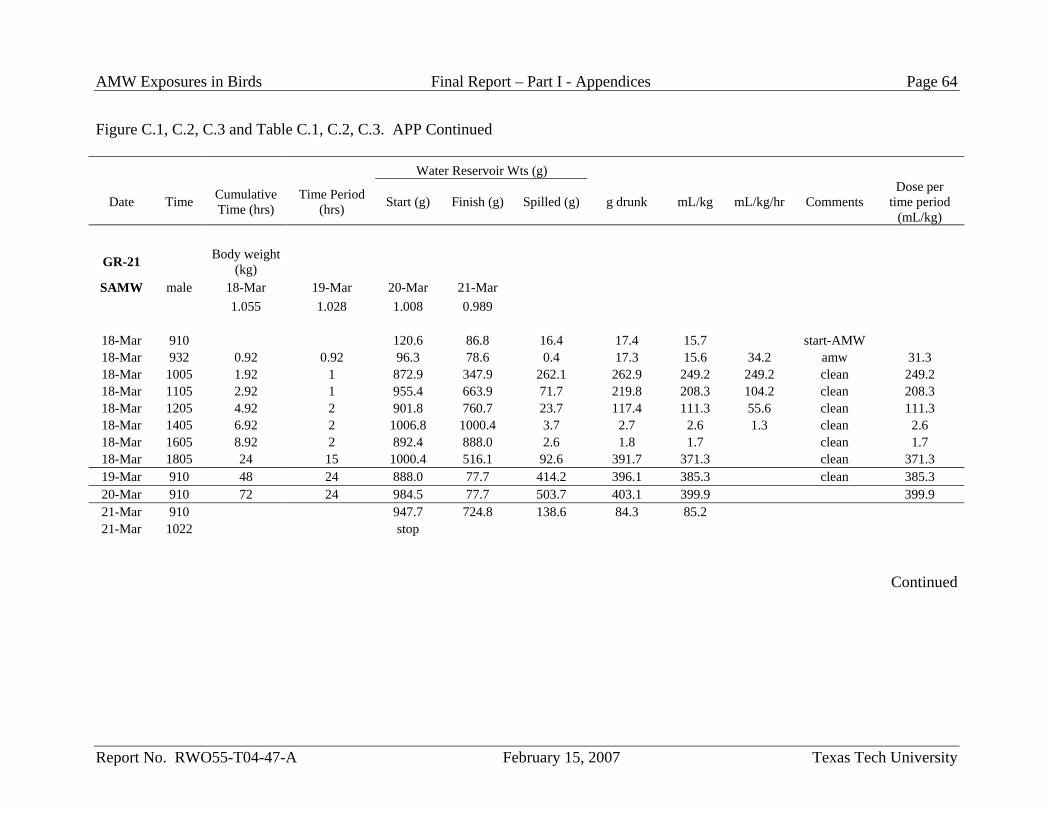
AMW Exposures in Birds Final Report – Part I - Appendices Page 64
Report No. RWO55-T04-47-A February 15, 2007 Texas Tech University
Figure C.1, C.2, C.3 and Table C.1, C.2, C.3. APP Continued
Water Reservoir Wts (g)
Date Time Cumulative Time (hrs)
Time Period (hrs) Start (g) Finish (g) Spilled (g) g drunk mL/kg mL/kg/hr Comments
Dose per time period
(mL/kg)
GR-21 Body weight (kg)
SAMW male 18-Mar 19-Mar 20-Mar 21-Mar 1.055 1.028 1.008 0.989
18-Mar 910 120.6 86.8 16.4 17.4 15.7 start-AMW 18-Mar 932 0.92 0.92 96.3 78.6 0.4 17.3 15.6 34.2 amw 31.3 18-Mar 1005 1.92 1 872.9 347.9 262.1 262.9 249.2 249.2 clean 249.2 18-Mar 1105 2.92 1 955.4 663.9 71.7 219.8 208.3 104.2 clean 208.3 18-Mar 1205 4.92 2 901.8 760.7 23.7 117.4 111.3 55.6 clean 111.3 18-Mar 1405 6.92 2 1006.8 1000.4 3.7 2.7 2.6 1.3 clean 2.6 18-Mar 1605 8.92 2 892.4 888.0 2.6 1.8 1.7 clean 1.7 18-Mar 1805 24 15 1000.4 516.1 92.6 391.7 371.3 clean 371.3 19-Mar 910 48 24 888.0 77.7 414.2 396.1 385.3 clean 385.3 20-Mar 910 72 24 984.5 77.7 503.7 403.1 399.9 399.9 21-Mar 910 947.7 724.8 138.6 84.3 85.2 21-Mar 1022 stop
Continued
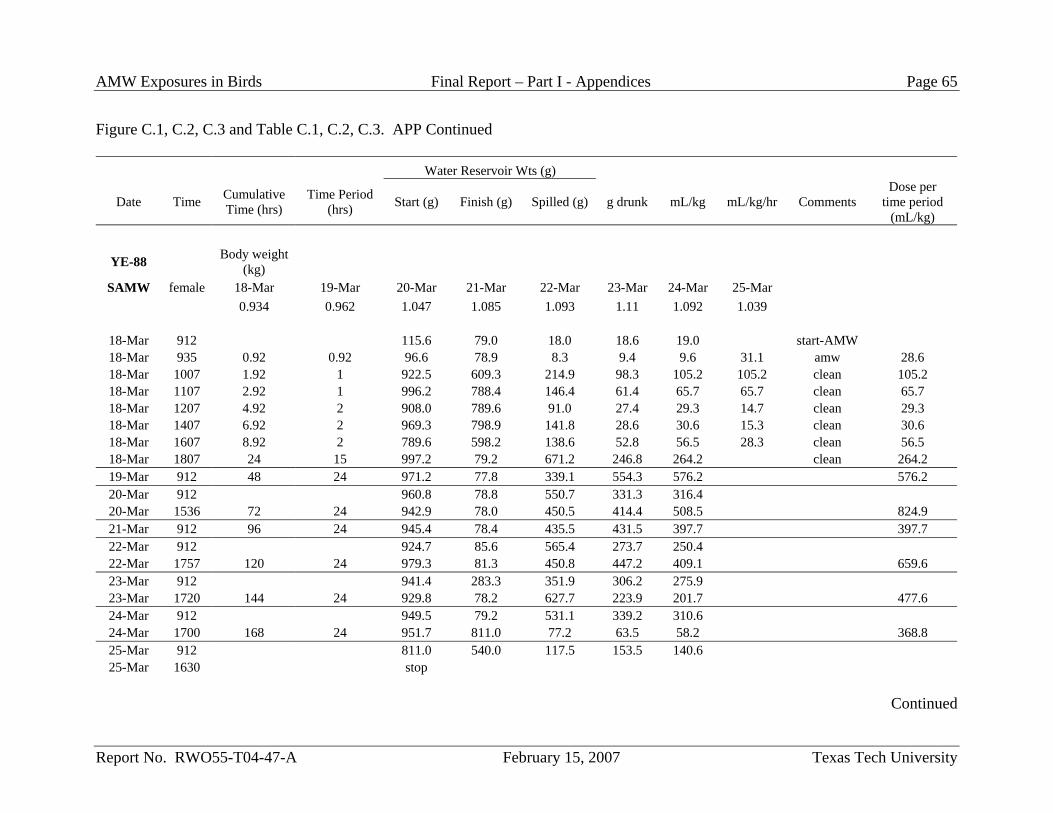
AMW Exposures in Birds Final Report – Part I - Appendices Page 65
Report No. RWO55-T04-47-A February 15, 2007 Texas Tech University
Figure C.1, C.2, C.3 and Table C.1, C.2, C.3. APP Continued
Water Reservoir Wts (g)
Date Time Cumulative Time (hrs)
Time Period (hrs) Start (g) Finish (g) Spilled (g) g drunk mL/kg mL/kg/hr Comments
Dose per time period
(mL/kg)
YE-88 Body weight (kg)
SAMW female 18-Mar 19-Mar 20-Mar 21-Mar 22-Mar 23-Mar 24-Mar 25-Mar 0.934 0.962 1.047 1.085 1.093 1.11 1.092 1.039
18-Mar 912 115.6 79.0 18.0 18.6 19.0 start-AMW 18-Mar 935 0.92 0.92 96.6 78.9 8.3 9.4 9.6 31.1 amw 28.6 18-Mar 1007 1.92 1 922.5 609.3 214.9 98.3 105.2 105.2 clean 105.2 18-Mar 1107 2.92 1 996.2 788.4 146.4 61.4 65.7 65.7 clean 65.7 18-Mar 1207 4.92 2 908.0 789.6 91.0 27.4 29.3 14.7 clean 29.3 18-Mar 1407 6.92 2 969.3 798.9 141.8 28.6 30.6 15.3 clean 30.6 18-Mar 1607 8.92 2 789.6 598.2 138.6 52.8 56.5 28.3 clean 56.5 18-Mar 1807 24 15 997.2 79.2 671.2 246.8 264.2 clean 264.2 19-Mar 912 48 24 971.2 77.8 339.1 554.3 576.2 576.2 20-Mar 912 960.8 78.8 550.7 331.3 316.4 20-Mar 1536 72 24 942.9 78.0 450.5 414.4 508.5 824.9 21-Mar 912 96 24 945.4 78.4 435.5 431.5 397.7 397.7 22-Mar 912 924.7 85.6 565.4 273.7 250.4 22-Mar 1757 120 24 979.3 81.3 450.8 447.2 409.1 659.6 23-Mar 912 941.4 283.3 351.9 306.2 275.9 23-Mar 1720 144 24 929.8 78.2 627.7 223.9 201.7 477.6 24-Mar 912 949.5 79.2 531.1 339.2 310.6 24-Mar 1700 168 24 951.7 811.0 77.2 63.5 58.2 368.8 25-Mar 912 811.0 540.0 117.5 153.5 140.6 25-Mar 1630 stop
Continued
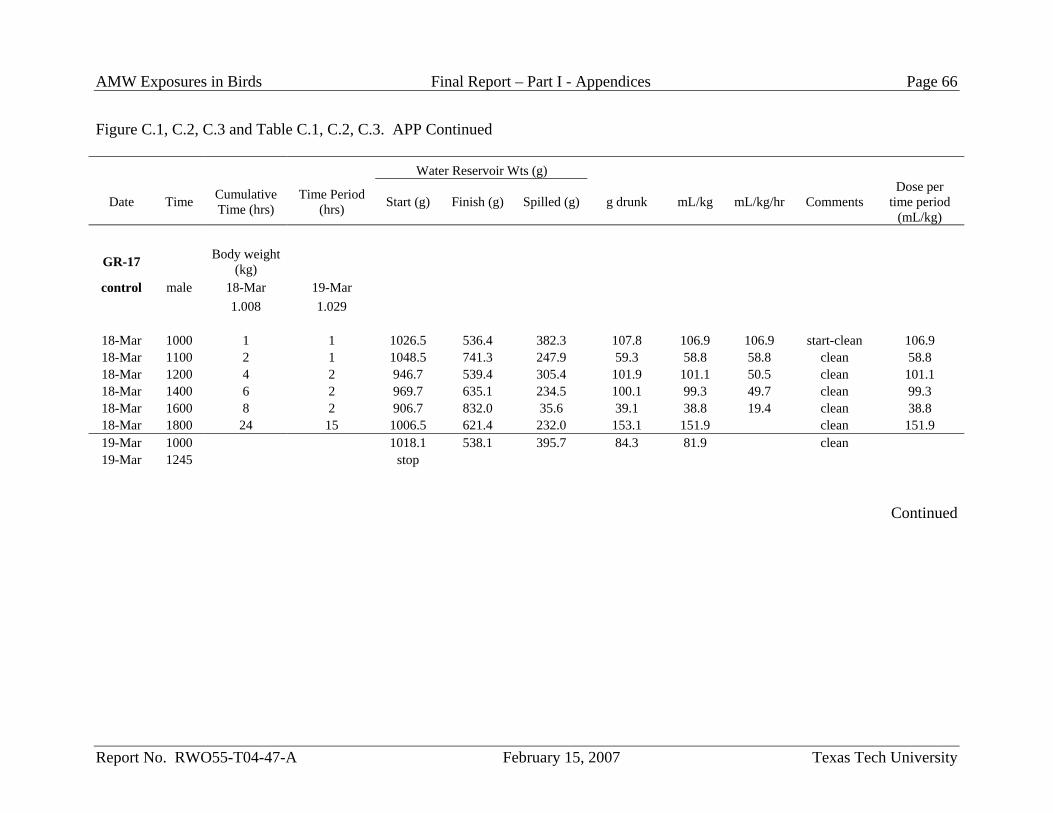
AMW Exposures in Birds Final Report – Part I - Appendices Page 66
Report No. RWO55-T04-47-A February 15, 2007 Texas Tech University
Figure C.1, C.2, C.3 and Table C.1, C.2, C.3. APP Continued
Water Reservoir Wts (g)
Date Time Cumulative Time (hrs)
Time Period (hrs) Start (g) Finish (g) Spilled (g) g drunk mL/kg mL/kg/hr Comments
Dose per time period
(mL/kg)
GR-17 Body weight (kg)
control male 18-Mar 19-Mar 1.008 1.029
18-Mar 1000 1 1 1026.5 536.4 382.3 107.8 106.9 106.9 start-clean 106.9 18-Mar 1100 2 1 1048.5 741.3 247.9 59.3 58.8 58.8 clean 58.8 18-Mar 1200 4 2 946.7 539.4 305.4 101.9 101.1 50.5 clean 101.1 18-Mar 1400 6 2 969.7 635.1 234.5 100.1 99.3 49.7 clean 99.3 18-Mar 1600 8 2 906.7 832.0 35.6 39.1 38.8 19.4 clean 38.8 18-Mar 1800 24 15 1006.5 621.4 232.0 153.1 151.9 clean 151.9 19-Mar 1000 1018.1 538.1 395.7 84.3 81.9 clean 19-Mar 1245 stop
Continued
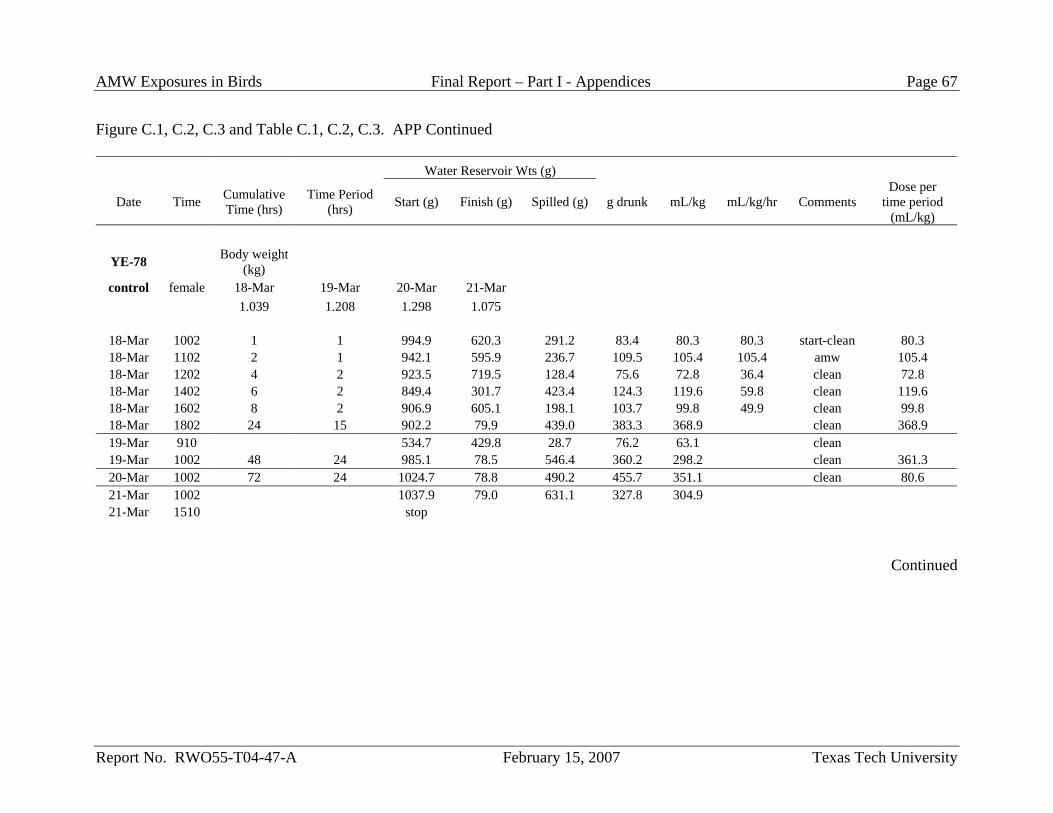
AMW Exposures in Birds Final Report – Part I - Appendices Page 67
Report No. RWO55-T04-47-A February 15, 2007 Texas Tech University
Figure C.1, C.2, C.3 and Table C.1, C.2, C.3. APP Continued
Water Reservoir Wts (g)
Date Time Cumulative Time (hrs)
Time Period (hrs) Start (g) Finish (g) Spilled (g) g drunk mL/kg mL/kg/hr Comments
Dose per time period
(mL/kg)
YE-78 Body weight (kg)
control female 18-Mar 19-Mar 20-Mar 21-Mar 1.039 1.208 1.298 1.075
18-Mar 1002 1 1 994.9 620.3 291.2 83.4 80.3 80.3 start-clean 80.3 18-Mar 1102 2 1 942.1 595.9 236.7 109.5 105.4 105.4 amw 105.4 18-Mar 1202 4 2 923.5 719.5 128.4 75.6 72.8 36.4 clean 72.8 18-Mar 1402 6 2 849.4 301.7 423.4 124.3 119.6 59.8 clean 119.6 18-Mar 1602 8 2 906.9 605.1 198.1 103.7 99.8 49.9 clean 99.8 18-Mar 1802 24 15 902.2 79.9 439.0 383.3 368.9 clean 368.9 19-Mar 910 534.7 429.8 28.7 76.2 63.1 clean 19-Mar 1002 48 24 985.1 78.5 546.4 360.2 298.2 clean 361.3 20-Mar 1002 72 24 1024.7 78.8 490.2 455.7 351.1 clean 80.6 21-Mar 1002 1037.9 79.0 631.1 327.8 304.9 21-Mar 1510 stop
Continued
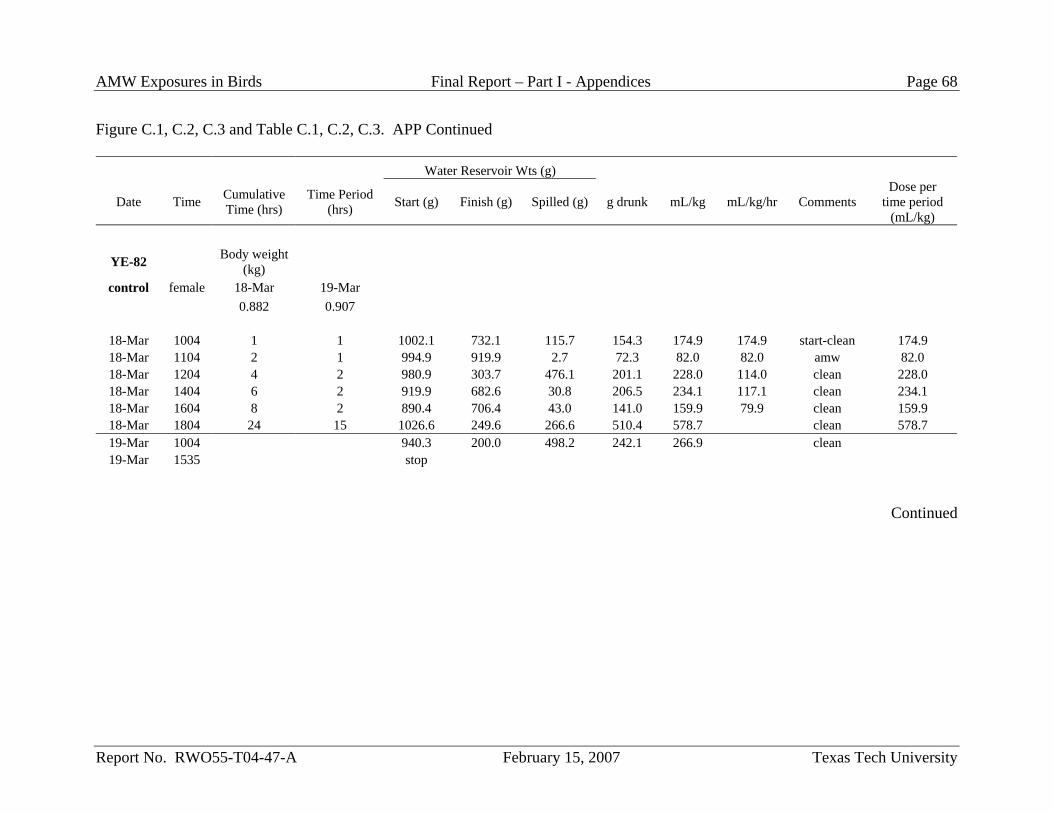
AMW Exposures in Birds Final Report – Part I - Appendices Page 68
Report No. RWO55-T04-47-A February 15, 2007 Texas Tech University
Figure C.1, C.2, C.3 and Table C.1, C.2, C.3. APP Continued
Water Reservoir Wts (g)
Date Time Cumulative Time (hrs)
Time Period (hrs) Start (g) Finish (g) Spilled (g) g drunk mL/kg mL/kg/hr Comments
Dose per time period
(mL/kg)
YE-82 Body weight (kg)
control female 18-Mar 19-Mar 0.882 0.907
18-Mar 1004 1 1 1002.1 732.1 115.7 154.3 174.9 174.9 start-clean 174.9 18-Mar 1104 2 1 994.9 919.9 2.7 72.3 82.0 82.0 amw 82.0 18-Mar 1204 4 2 980.9 303.7 476.1 201.1 228.0 114.0 clean 228.0 18-Mar 1404 6 2 919.9 682.6 30.8 206.5 234.1 117.1 clean 234.1 18-Mar 1604 8 2 890.4 706.4 43.0 141.0 159.9 79.9 clean 159.9 18-Mar 1804 24 15 1026.6 249.6 266.6 510.4 578.7 clean 578.7 19-Mar 1004 940.3 200.0 498.2 242.1 266.9 clean 19-Mar 1535 stop
Continued
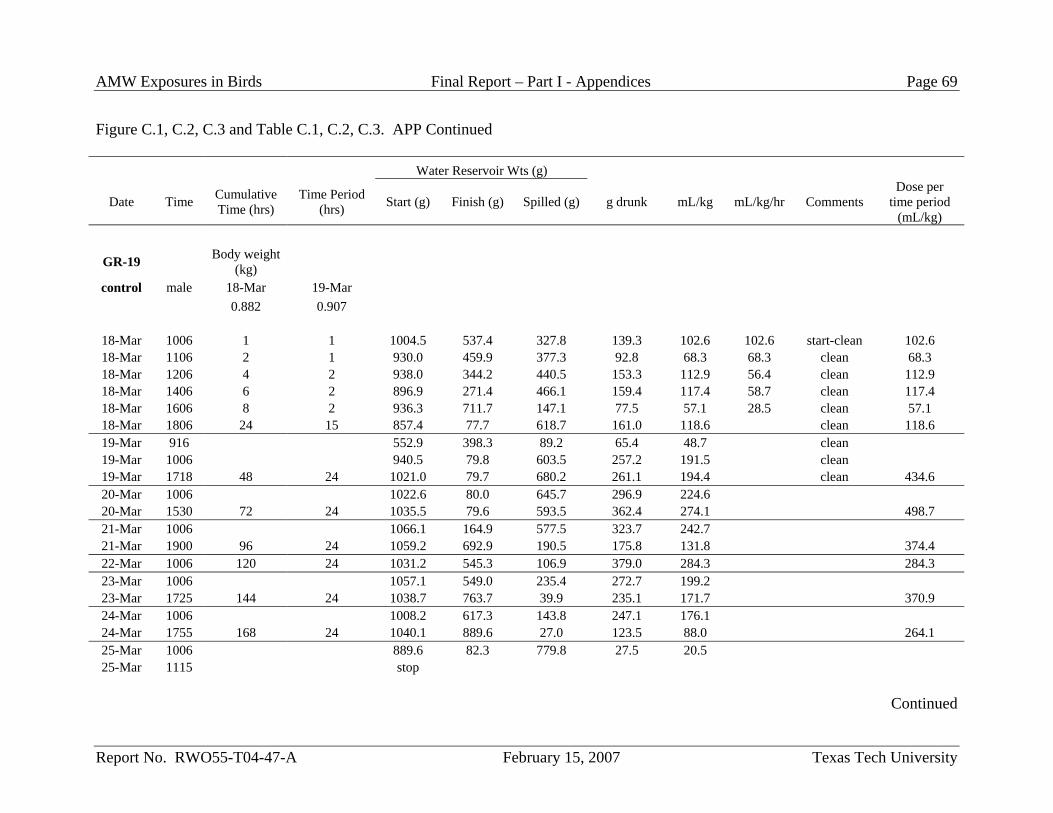
AMW Exposures in Birds Final Report – Part I - Appendices Page 69
Report No. RWO55-T04-47-A February 15, 2007 Texas Tech University
Figure C.1, C.2, C.3 and Table C.1, C.2, C.3. APP Continued
Water Reservoir Wts (g)
Date Time Cumulative Time (hrs)
Time Period (hrs) Start (g) Finish (g) Spilled (g) g drunk mL/kg mL/kg/hr Comments
Dose per time period
(mL/kg)
GR-19 Body weight (kg)
control male 18-Mar 19-Mar 0.882 0.907
18-Mar 1006 1 1 1004.5 537.4 327.8 139.3 102.6 102.6 start-clean 102.6 18-Mar 1106 2 1 930.0 459.9 377.3 92.8 68.3 68.3 clean 68.3 18-Mar 1206 4 2 938.0 344.2 440.5 153.3 112.9 56.4 clean 112.9 18-Mar 1406 6 2 896.9 271.4 466.1 159.4 117.4 58.7 clean 117.4 18-Mar 1606 8 2 936.3 711.7 147.1 77.5 57.1 28.5 clean 57.1 18-Mar 1806 24 15 857.4 77.7 618.7 161.0 118.6 clean 118.6 19-Mar 916 552.9 398.3 89.2 65.4 48.7 clean 19-Mar 1006 940.5 79.8 603.5 257.2 191.5 clean 19-Mar 1718 48 24 1021.0 79.7 680.2 261.1 194.4 clean 434.6 20-Mar 1006 1022.6 80.0 645.7 296.9 224.6 20-Mar 1530 72 24 1035.5 79.6 593.5 362.4 274.1 498.7 21-Mar 1006 1066.1 164.9 577.5 323.7 242.7 21-Mar 1900 96 24 1059.2 692.9 190.5 175.8 131.8 374.4 22-Mar 1006 120 24 1031.2 545.3 106.9 379.0 284.3 284.3 23-Mar 1006 1057.1 549.0 235.4 272.7 199.2 23-Mar 1725 144 24 1038.7 763.7 39.9 235.1 171.7 370.9 24-Mar 1006 1008.2 617.3 143.8 247.1 176.1 24-Mar 1755 168 24 1040.1 889.6 27.0 123.5 88.0 264.1 25-Mar 1006 889.6 82.3 779.8 27.5 20.5 25-Mar 1115 stop
Continued
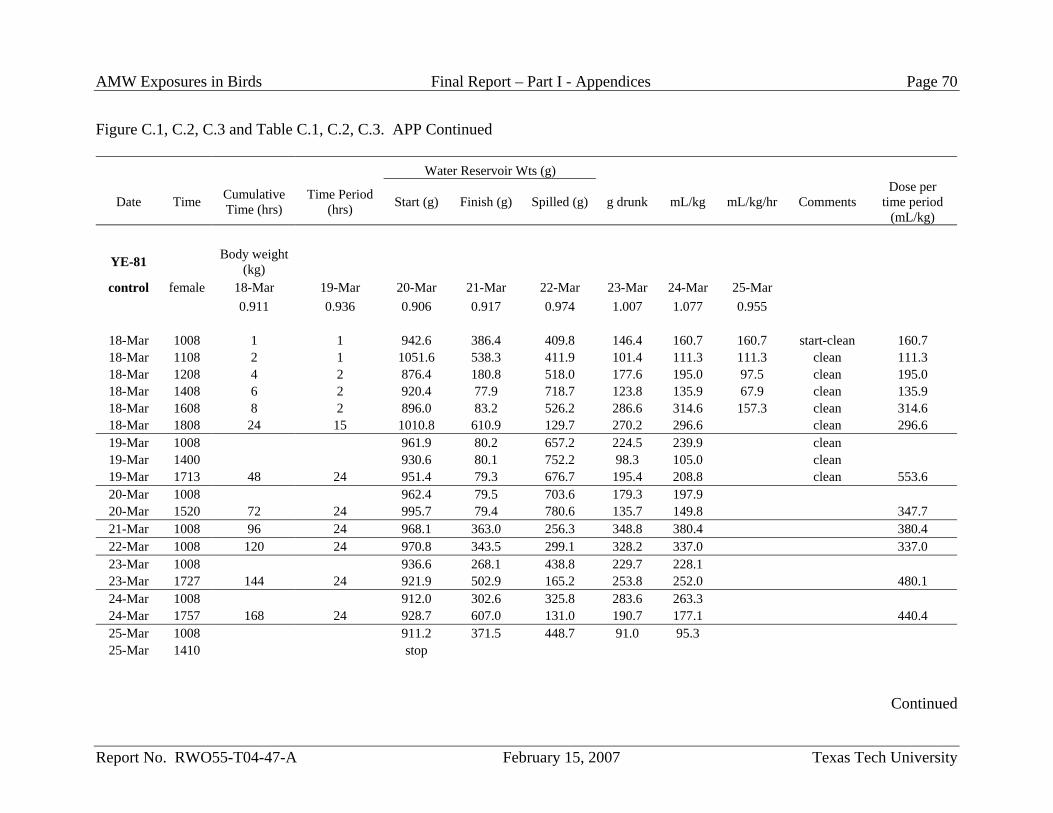
AMW Exposures in Birds Final Report – Part I - Appendices Page 70
Report No. RWO55-T04-47-A February 15, 2007 Texas Tech University
Figure C.1, C.2, C.3 and Table C.1, C.2, C.3. APP Continued
Water Reservoir Wts (g)
Date Time Cumulative Time (hrs)
Time Period (hrs) Start (g) Finish (g) Spilled (g) g drunk mL/kg mL/kg/hr Comments
Dose per time period
(mL/kg)
YE-81 Body weight (kg)
control female 18-Mar 19-Mar 20-Mar 21-Mar 22-Mar 23-Mar 24-Mar 25-Mar 0.911 0.936 0.906 0.917 0.974 1.007 1.077 0.955
18-Mar 1008 1 1 942.6 386.4 409.8 146.4 160.7 160.7 start-clean 160.7 18-Mar 1108 2 1 1051.6 538.3 411.9 101.4 111.3 111.3 clean 111.3 18-Mar 1208 4 2 876.4 180.8 518.0 177.6 195.0 97.5 clean 195.0 18-Mar 1408 6 2 920.4 77.9 718.7 123.8 135.9 67.9 clean 135.9 18-Mar 1608 8 2 896.0 83.2 526.2 286.6 314.6 157.3 clean 314.6 18-Mar 1808 24 15 1010.8 610.9 129.7 270.2 296.6 clean 296.6 19-Mar 1008 961.9 80.2 657.2 224.5 239.9 clean 19-Mar 1400 930.6 80.1 752.2 98.3 105.0 clean 19-Mar 1713 48 24 951.4 79.3 676.7 195.4 208.8 clean 553.6 20-Mar 1008 962.4 79.5 703.6 179.3 197.9 20-Mar 1520 72 24 995.7 79.4 780.6 135.7 149.8 347.7 21-Mar 1008 96 24 968.1 363.0 256.3 348.8 380.4 380.4 22-Mar 1008 120 24 970.8 343.5 299.1 328.2 337.0 337.0 23-Mar 1008 936.6 268.1 438.8 229.7 228.1 23-Mar 1727 144 24 921.9 502.9 165.2 253.8 252.0 480.1 24-Mar 1008 912.0 302.6 325.8 283.6 263.3 24-Mar 1757 168 24 928.7 607.0 131.0 190.7 177.1 440.4 25-Mar 1008 911.2 371.5 448.7 91.0 95.3 25-Mar 1410 stop
Continued
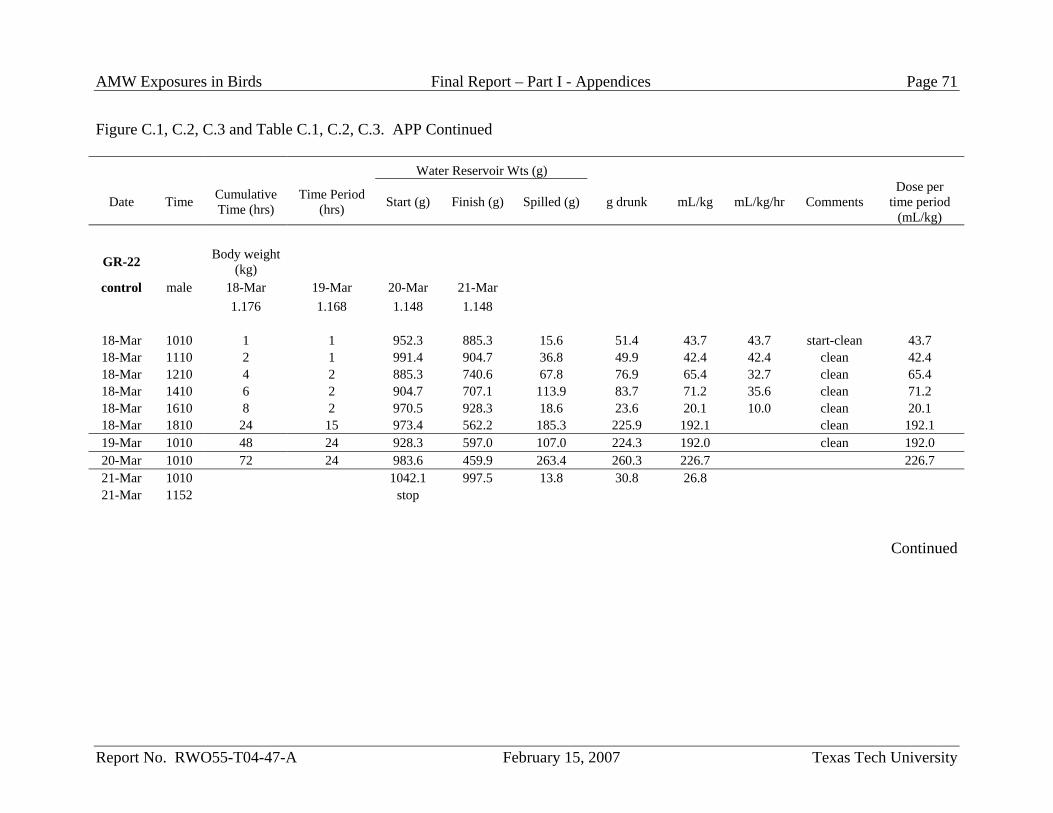
AMW Exposures in Birds Final Report – Part I - Appendices Page 71
Report No. RWO55-T04-47-A February 15, 2007 Texas Tech University
Figure C.1, C.2, C.3 and Table C.1, C.2, C.3. APP Continued
Water Reservoir Wts (g)
Date Time Cumulative Time (hrs)
Time Period (hrs) Start (g) Finish (g) Spilled (g) g drunk mL/kg mL/kg/hr Comments
Dose per time period
(mL/kg)
GR-22 Body weight (kg)
control male 18-Mar 19-Mar 20-Mar 21-Mar 1.176 1.168 1.148 1.148
18-Mar 1010 1 1 952.3 885.3 15.6 51.4 43.7 43.7 start-clean 43.7 18-Mar 1110 2 1 991.4 904.7 36.8 49.9 42.4 42.4 clean 42.4 18-Mar 1210 4 2 885.3 740.6 67.8 76.9 65.4 32.7 clean 65.4 18-Mar 1410 6 2 904.7 707.1 113.9 83.7 71.2 35.6 clean 71.2 18-Mar 1610 8 2 970.5 928.3 18.6 23.6 20.1 10.0 clean 20.1 18-Mar 1810 24 15 973.4 562.2 185.3 225.9 192.1 clean 192.1 19-Mar 1010 48 24 928.3 597.0 107.0 224.3 192.0 clean 192.0 20-Mar 1010 72 24 983.6 459.9 263.4 260.3 226.7 226.7 21-Mar 1010 1042.1 997.5 13.8 30.8 26.8 21-Mar 1152 stop
Continued
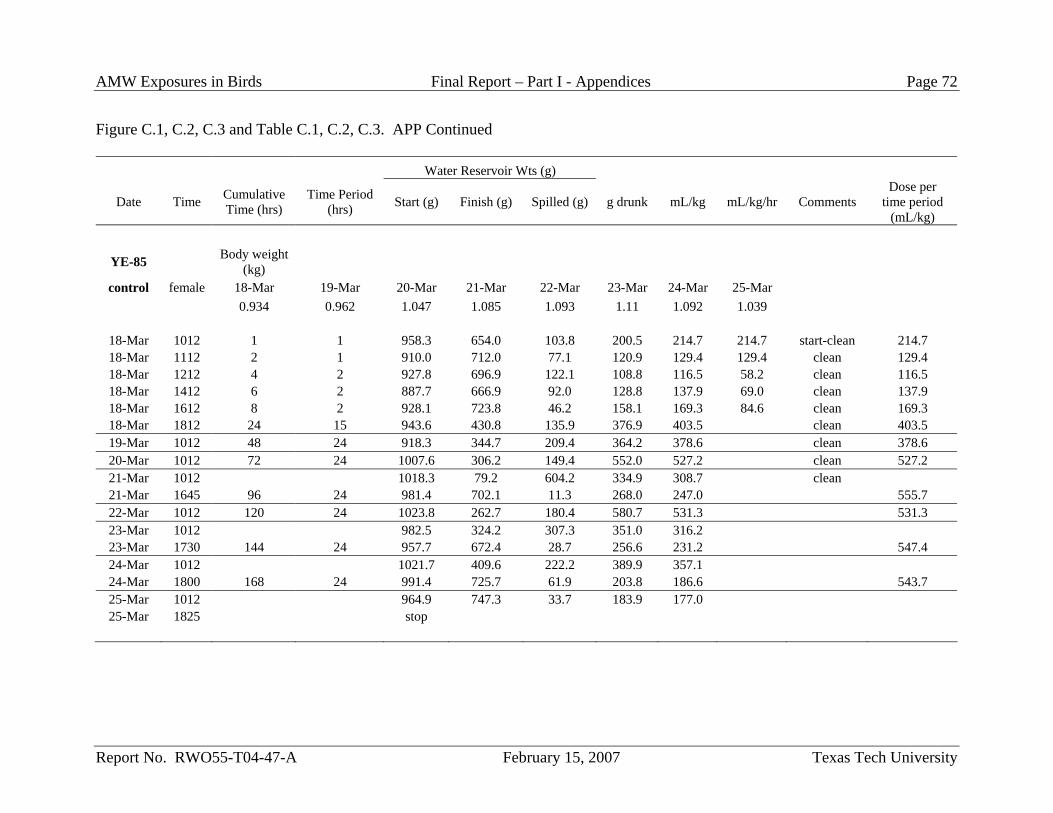
AMW Exposures in Birds Final Report – Part I - Appendices Page 72
Report No. RWO55-T04-47-A February 15, 2007 Texas Tech University
Figure C.1, C.2, C.3 and Table C.1, C.2, C.3. APP Continued
Water Reservoir Wts (g)
Date Time Cumulative Time (hrs)
Time Period (hrs) Start (g) Finish (g) Spilled (g) g drunk mL/kg mL/kg/hr Comments
Dose per time period
(mL/kg)
YE-85 Body weight (kg)
control female 18-Mar 19-Mar 20-Mar 21-Mar 22-Mar 23-Mar 24-Mar 25-Mar 0.934 0.962 1.047 1.085 1.093 1.11 1.092 1.039
18-Mar 1012 1 1 958.3 654.0 103.8 200.5 214.7 214.7 start-clean 214.7 18-Mar 1112 2 1 910.0 712.0 77.1 120.9 129.4 129.4 clean 129.4 18-Mar 1212 4 2 927.8 696.9 122.1 108.8 116.5 58.2 clean 116.5 18-Mar 1412 6 2 887.7 666.9 92.0 128.8 137.9 69.0 clean 137.9 18-Mar 1612 8 2 928.1 723.8 46.2 158.1 169.3 84.6 clean 169.3 18-Mar 1812 24 15 943.6 430.8 135.9 376.9 403.5 clean 403.5 19-Mar 1012 48 24 918.3 344.7 209.4 364.2 378.6 clean 378.6 20-Mar 1012 72 24 1007.6 306.2 149.4 552.0 527.2 clean 527.2 21-Mar 1012 1018.3 79.2 604.2 334.9 308.7 clean 21-Mar 1645 96 24 981.4 702.1 11.3 268.0 247.0 555.7 22-Mar 1012 120 24 1023.8 262.7 180.4 580.7 531.3 531.3 23-Mar 1012 982.5 324.2 307.3 351.0 316.2 23-Mar 1730 144 24 957.7 672.4 28.7 256.6 231.2 547.4 24-Mar 1012 1021.7 409.6 222.2 389.9 357.1 24-Mar 1800 168 24 991.4 725.7 61.9 203.8 186.6 543.7 25-Mar 1012 964.9 747.3 33.7 183.9 177.0 25-Mar 1825 stop
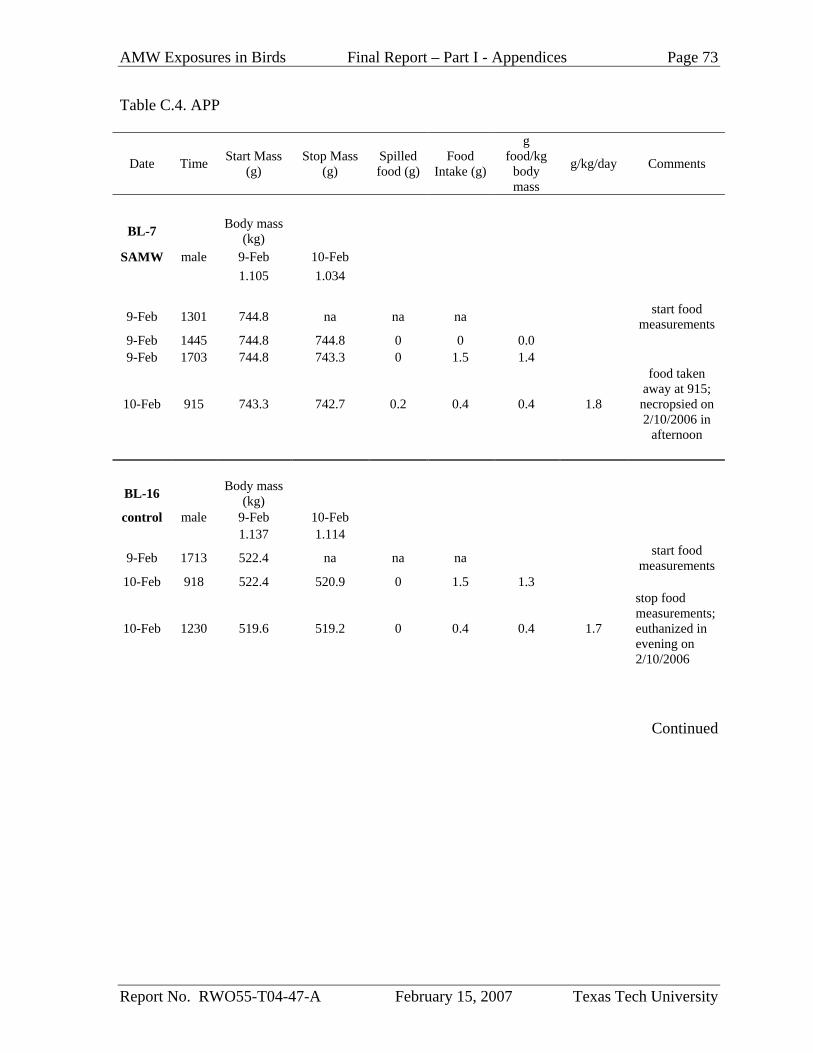
AMW Exposures in Birds Final Report – Part I - Appendices Page 73
Report No. RWO55-T04-47-A February 15, 2007 Texas Tech University
Table C.4. APP
Date Time Start Mass (g)
Stop Mass (g)
Spilled food (g)
Food Intake (g)
g food/kg
body mass
g/kg/day Comments
BL-7 Body mass (kg)
SAMW male 9-Feb 10-Feb 1.105 1.034
9-Feb 1301 744.8 na na na start food measurements
9-Feb 1445 744.8 744.8 0 0 0.0 9-Feb 1703 744.8 743.3 0 1.5 1.4
10-Feb 915 743.3 742.7 0.2 0.4 0.4 1.8
food taken away at 915; necropsied on 2/10/2006 in
afternoon
BL-16 Body mass (kg)
control male 9-Feb 10-Feb 1.137 1.114
9-Feb 1713 522.4 na na na start food measurements
10-Feb 918 522.4 520.9 0 1.5 1.3
10-Feb 1230 519.6 519.2 0 0.4 0.4 1.7
stop food measurements; euthanized in evening on 2/10/2006
Continued
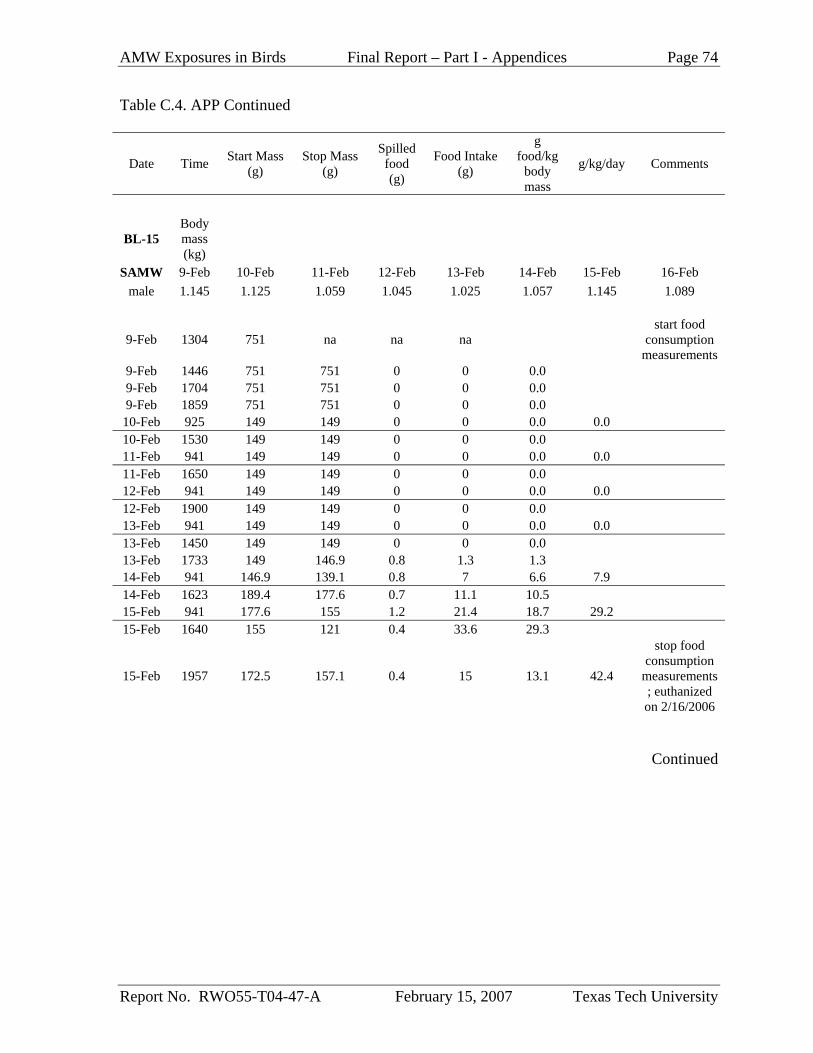
AMW Exposures in Birds Final Report – Part I - Appendices Page 74
Report No. RWO55-T04-47-A February 15, 2007 Texas Tech University
Table C.4. APP Continued
Date Time Start Mass (g)
Stop Mass (g)
Spilled food (g)
Food Intake (g)
g food/kg
body mass
g/kg/day Comments
BL-15 Body mass (kg)
SAMW 9-Feb 10-Feb 11-Feb 12-Feb 13-Feb 14-Feb 15-Feb 16-Feb male 1.145 1.125 1.059 1.045 1.025 1.057 1.145 1.089
9-Feb 1304 751 na na na start food
consumption measurements
9-Feb 1446 751 751 0 0 0.0 9-Feb 1704 751 751 0 0 0.0 9-Feb 1859 751 751 0 0 0.0 10-Feb 925 149 149 0 0 0.0 0.0 10-Feb 1530 149 149 0 0 0.0 11-Feb 941 149 149 0 0 0.0 0.0 11-Feb 1650 149 149 0 0 0.0 12-Feb 941 149 149 0 0 0.0 0.0 12-Feb 1900 149 149 0 0 0.0 13-Feb 941 149 149 0 0 0.0 0.0 13-Feb 1450 149 149 0 0 0.0 13-Feb 1733 149 146.9 0.8 1.3 1.3 14-Feb 941 146.9 139.1 0.8 7 6.6 7.9 14-Feb 1623 189.4 177.6 0.7 11.1 10.5 15-Feb 941 177.6 155 1.2 21.4 18.7 29.2 15-Feb 1640 155 121 0.4 33.6 29.3
15-Feb 1957 172.5 157.1 0.4 15 13.1 42.4
stop food consumption
measurements; euthanized on 2/16/2006
Continued
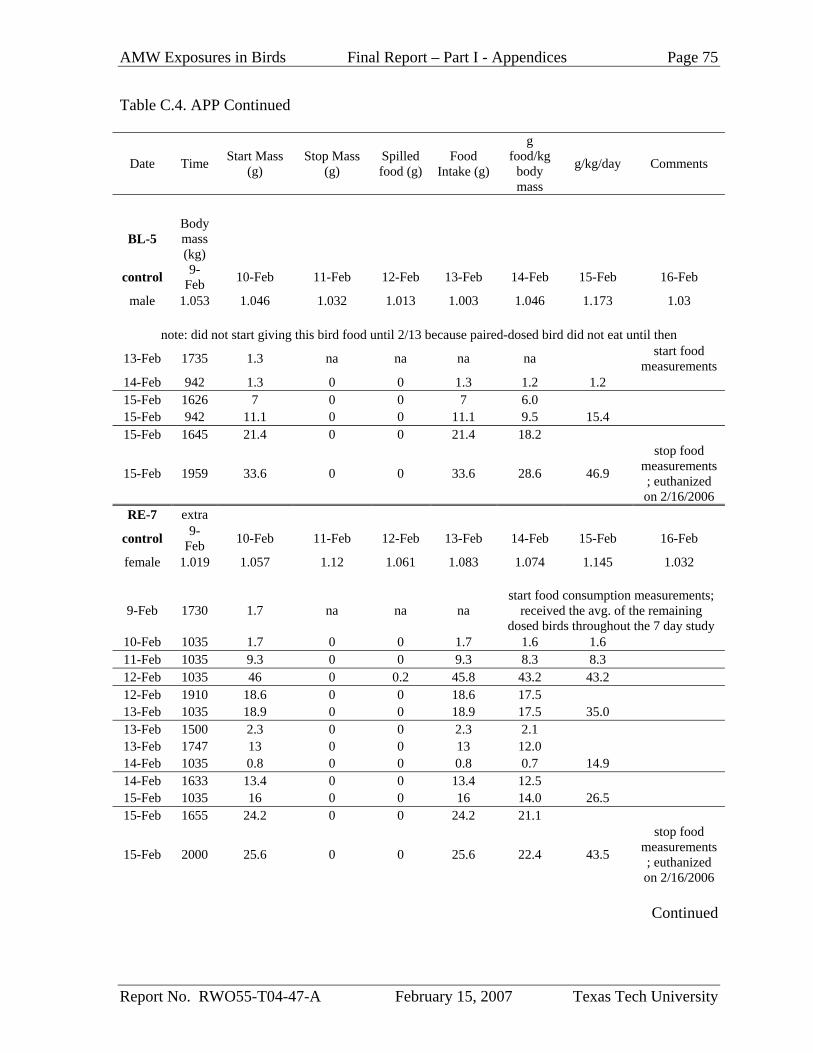
AMW Exposures in Birds Final Report – Part I - Appendices Page 75
Report No. RWO55-T04-47-A February 15, 2007 Texas Tech University
Table C.4. APP Continued
Date Time Start Mass (g)
Stop Mass (g)
Spilled food (g)
Food Intake (g)
g food/kg
body mass
g/kg/day Comments
BL-5 Body mass (kg)
control 9-Feb 10-Feb 11-Feb 12-Feb 13-Feb 14-Feb 15-Feb 16-Feb
male 1.053 1.046 1.032 1.013 1.003 1.046 1.173 1.03
note: did not start giving this bird food until 2/13 because paired-dosed bird did not eat until then
13-Feb 1735 1.3 na na na na start food measurements
14-Feb 942 1.3 0 0 1.3 1.2 1.2 15-Feb 1626 7 0 0 7 6.0 15-Feb 942 11.1 0 0 11.1 9.5 15.4 15-Feb 1645 21.4 0 0 21.4 18.2
15-Feb 1959 33.6 0 0 33.6 28.6 46.9
stop food measurements; euthanized on 2/16/2006
RE-7 extra
control 9-Feb 10-Feb 11-Feb 12-Feb 13-Feb 14-Feb 15-Feb 16-Feb
female 1.019 1.057 1.12 1.061 1.083 1.074 1.145 1.032
9-Feb 1730 1.7 na na na start food consumption measurements;
received the avg. of the remaining dosed birds throughout the 7 day study
10-Feb 1035 1.7 0 0 1.7 1.6 1.6 11-Feb 1035 9.3 0 0 9.3 8.3 8.3 12-Feb 1035 46 0 0.2 45.8 43.2 43.2 12-Feb 1910 18.6 0 0 18.6 17.5 13-Feb 1035 18.9 0 0 18.9 17.5 35.0 13-Feb 1500 2.3 0 0 2.3 2.1 13-Feb 1747 13 0 0 13 12.0 14-Feb 1035 0.8 0 0 0.8 0.7 14.9 14-Feb 1633 13.4 0 0 13.4 12.5 15-Feb 1035 16 0 0 16 14.0 26.5 15-Feb 1655 24.2 0 0 24.2 21.1
15-Feb 2000 25.6 0 0 25.6 22.4 43.5
stop food measurements; euthanized on 2/16/2006
Continued
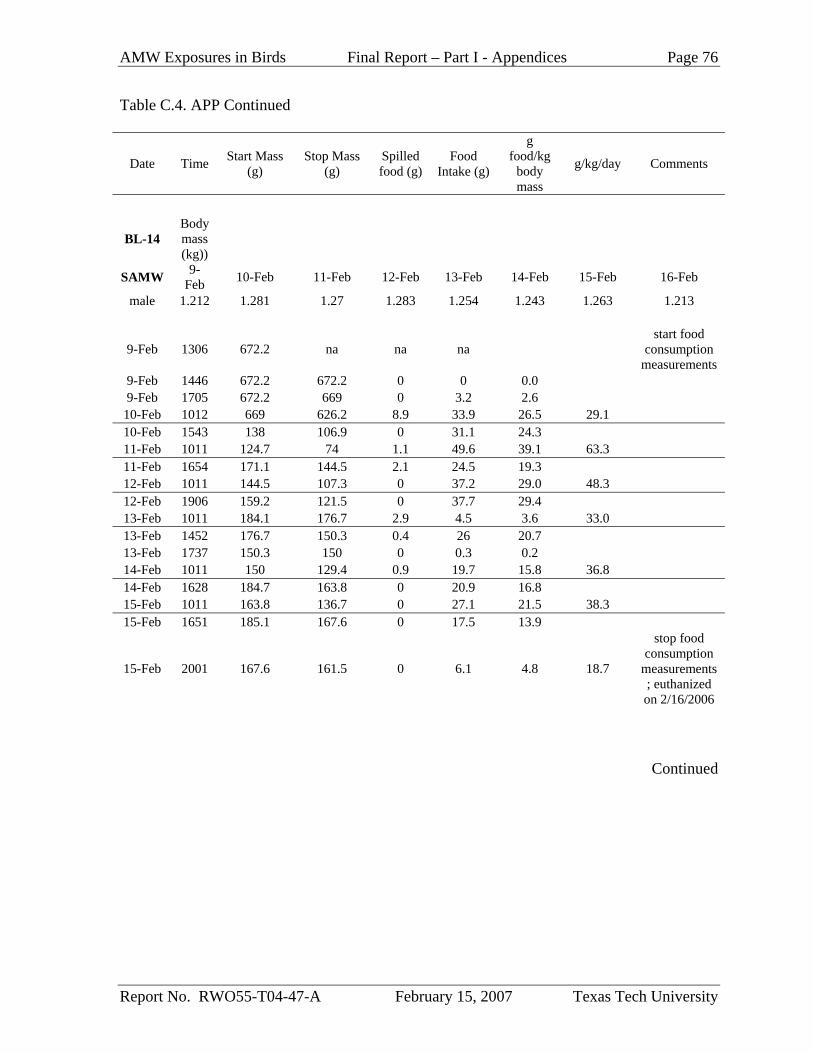
AMW Exposures in Birds Final Report – Part I - Appendices Page 76
Report No. RWO55-T04-47-A February 15, 2007 Texas Tech University
Table C.4. APP Continued
Date Time Start Mass (g)
Stop Mass (g)
Spilled food (g)
Food Intake (g)
g food/kg
body mass
g/kg/day Comments
BL-14 Body mass (kg))
SAMW 9-Feb 10-Feb 11-Feb 12-Feb 13-Feb 14-Feb 15-Feb 16-Feb
male 1.212 1.281 1.27 1.283 1.254 1.243 1.263 1.213
9-Feb 1306 672.2 na na na start food
consumption measurements
9-Feb 1446 672.2 672.2 0 0 0.0 9-Feb 1705 672.2 669 0 3.2 2.6
10-Feb 1012 669 626.2 8.9 33.9 26.5 29.1 10-Feb 1543 138 106.9 0 31.1 24.3 11-Feb 1011 124.7 74 1.1 49.6 39.1 63.3 11-Feb 1654 171.1 144.5 2.1 24.5 19.3 12-Feb 1011 144.5 107.3 0 37.2 29.0 48.3 12-Feb 1906 159.2 121.5 0 37.7 29.4 13-Feb 1011 184.1 176.7 2.9 4.5 3.6 33.0 13-Feb 1452 176.7 150.3 0.4 26 20.7 13-Feb 1737 150.3 150 0 0.3 0.2 14-Feb 1011 150 129.4 0.9 19.7 15.8 36.8 14-Feb 1628 184.7 163.8 0 20.9 16.8 15-Feb 1011 163.8 136.7 0 27.1 21.5 38.3 15-Feb 1651 185.1 167.6 0 17.5 13.9
15-Feb 2001 167.6 161.5 0 6.1 4.8 18.7
stop food consumption
measurements; euthanized on 2/16/2006
Continued
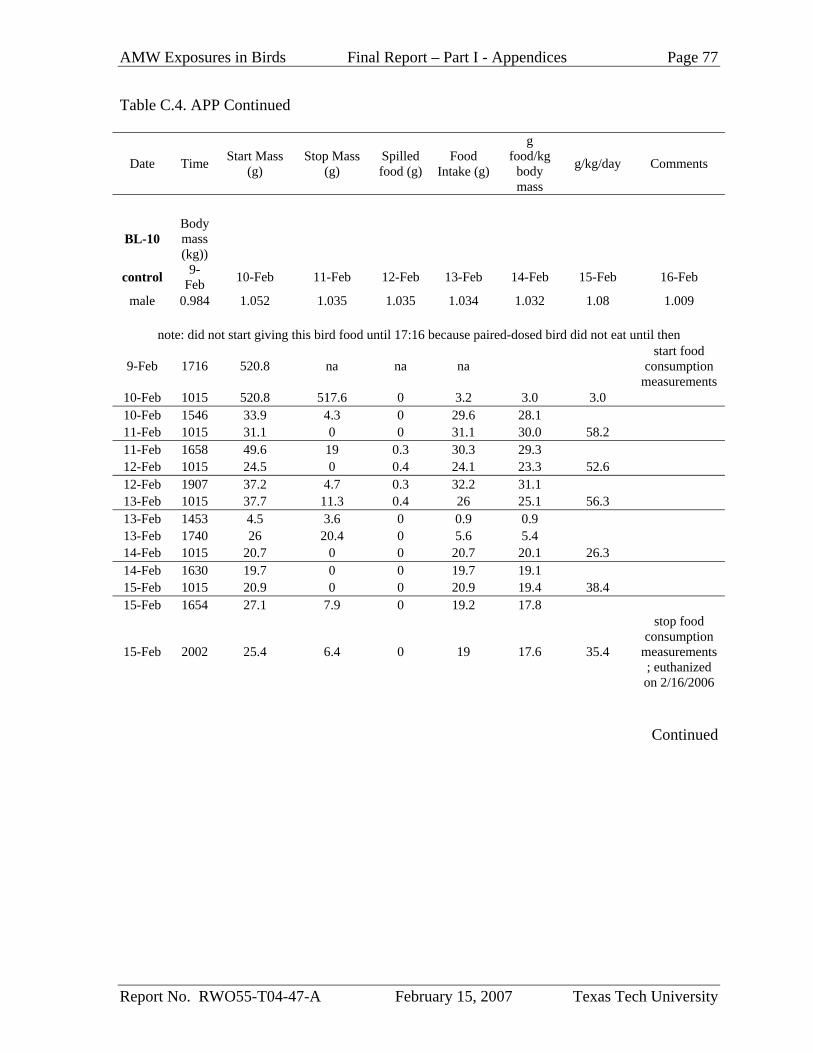
AMW Exposures in Birds Final Report – Part I - Appendices Page 77
Report No. RWO55-T04-47-A February 15, 2007 Texas Tech University
Table C.4. APP Continued
Date Time Start Mass (g)
Stop Mass (g)
Spilled food (g)
Food Intake (g)
g food/kg
body mass
g/kg/day Comments
BL-10 Body mass (kg))
control 9-Feb 10-Feb 11-Feb 12-Feb 13-Feb 14-Feb 15-Feb 16-Feb
male 0.984 1.052 1.035 1.035 1.034 1.032 1.08 1.009
note: did not start giving this bird food until 17:16 because paired-dosed bird did not eat until then
9-Feb 1716 520.8 na na na start food
consumption measurements
10-Feb 1015 520.8 517.6 0 3.2 3.0 3.0 10-Feb 1546 33.9 4.3 0 29.6 28.1 11-Feb 1015 31.1 0 0 31.1 30.0 58.2 11-Feb 1658 49.6 19 0.3 30.3 29.3 12-Feb 1015 24.5 0 0.4 24.1 23.3 52.6 12-Feb 1907 37.2 4.7 0.3 32.2 31.1 13-Feb 1015 37.7 11.3 0.4 26 25.1 56.3 13-Feb 1453 4.5 3.6 0 0.9 0.9 13-Feb 1740 26 20.4 0 5.6 5.4 14-Feb 1015 20.7 0 0 20.7 20.1 26.3 14-Feb 1630 19.7 0 0 19.7 19.1 15-Feb 1015 20.9 0 0 20.9 19.4 38.4 15-Feb 1654 27.1 7.9 0 19.2 17.8
15-Feb 2002 25.4 6.4 0 19 17.6 35.4
stop food consumption
measurements; euthanized on 2/16/2006
Continued
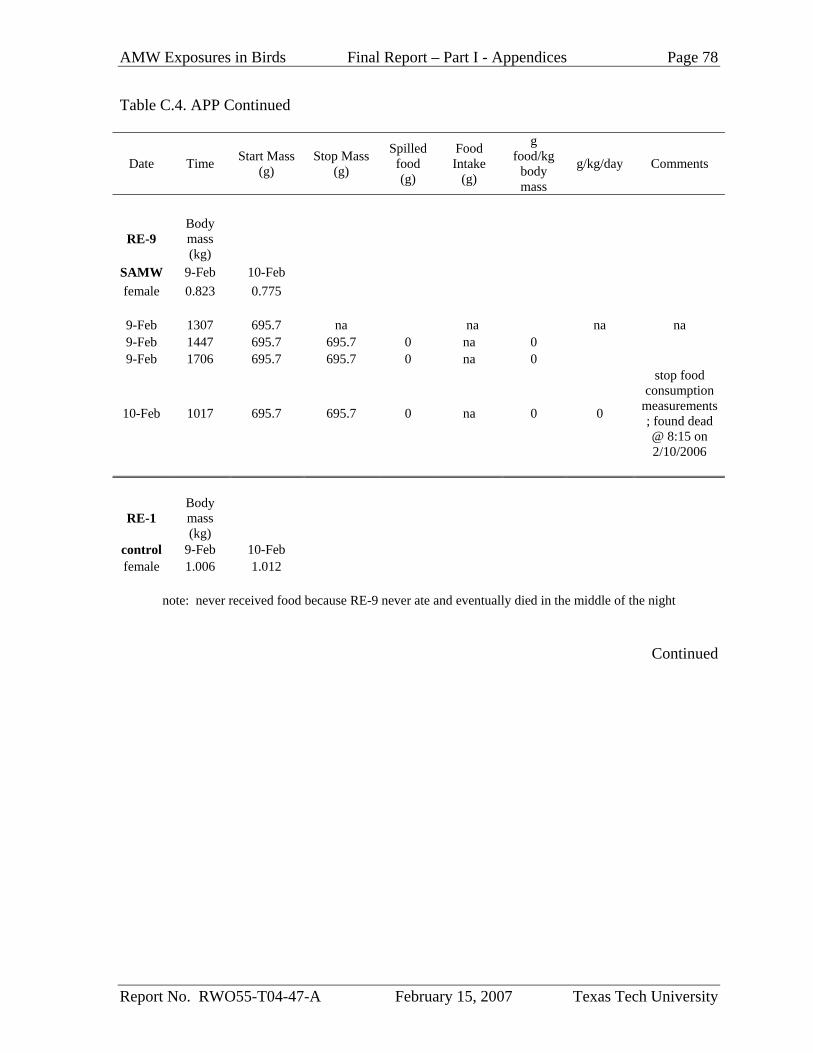
AMW Exposures in Birds Final Report – Part I - Appendices Page 78
Report No. RWO55-T04-47-A February 15, 2007 Texas Tech University
Table C.4. APP Continued
Date Time Start Mass (g)
Stop Mass (g)
Spilled food (g)
Food Intake
(g)
g food/kg
body mass
g/kg/day Comments
RE-9 Body mass (kg)
SAMW 9-Feb 10-Feb female 0.823 0.775
9-Feb 1307 695.7 na na na na 9-Feb 1447 695.7 695.7 0 na 0 9-Feb 1706 695.7 695.7 0 na 0
10-Feb 1017 695.7 695.7 0 na 0 0
stop food consumption
measurements; found dead @ 8:15 on 2/10/2006
RE-1 Body mass (kg)
control 9-Feb 10-Feb female 1.006 1.012
note: never received food because RE-9 never ate and eventually died in the middle of the night
Continued
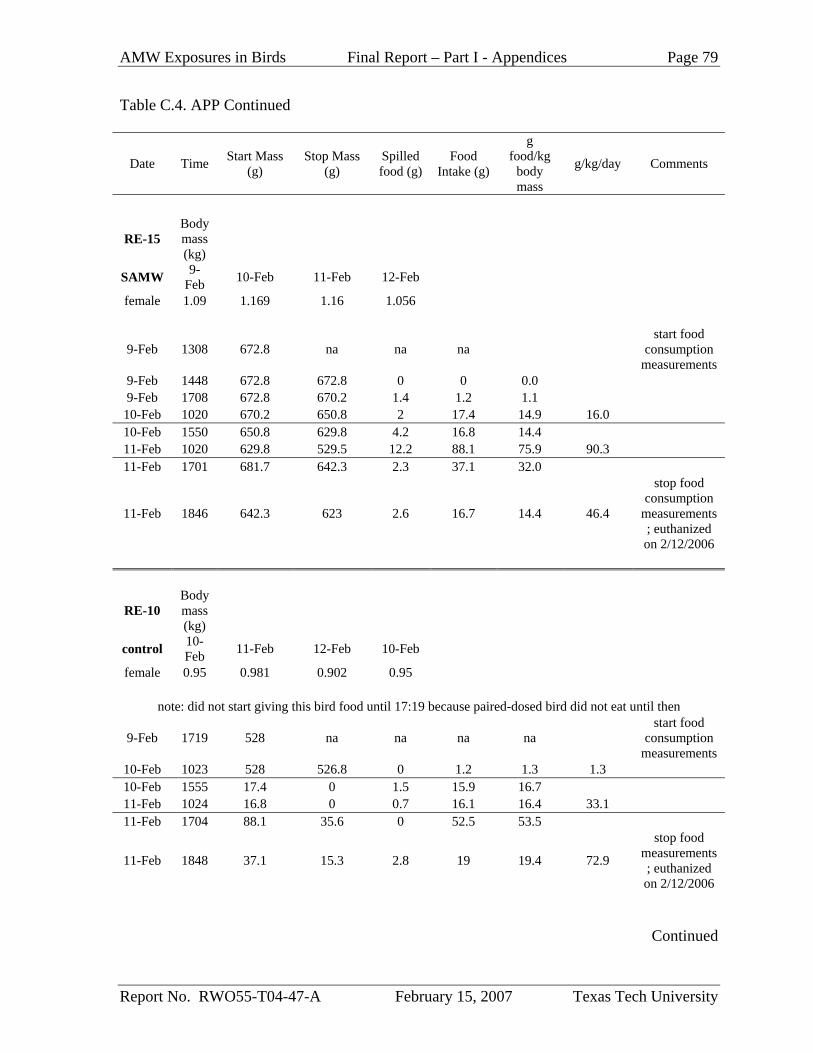
AMW Exposures in Birds Final Report – Part I - Appendices Page 79
Report No. RWO55-T04-47-A February 15, 2007 Texas Tech University
Table C.4. APP Continued
Date Time Start Mass (g)
Stop Mass (g)
Spilled food (g)
Food Intake (g)
g food/kg
body mass
g/kg/day Comments
RE-15 Body mass (kg)
SAMW 9-Feb 10-Feb 11-Feb 12-Feb
female 1.09 1.169 1.16 1.056
9-Feb 1308 672.8 na na na start food
consumption measurements
9-Feb 1448 672.8 672.8 0 0 0.0 9-Feb 1708 672.8 670.2 1.4 1.2 1.1
10-Feb 1020 670.2 650.8 2 17.4 14.9 16.0 10-Feb 1550 650.8 629.8 4.2 16.8 14.4 11-Feb 1020 629.8 529.5 12.2 88.1 75.9 90.3 11-Feb 1701 681.7 642.3 2.3 37.1 32.0
11-Feb 1846 642.3 623 2.6 16.7 14.4 46.4
stop food consumption
measurements; euthanized on 2/12/2006
RE-10 Body mass (kg)
control 10-Feb 11-Feb 12-Feb 10-Feb
female 0.95 0.981 0.902 0.95
note: did not start giving this bird food until 17:19 because paired-dosed bird did not eat until then
9-Feb 1719 528 na na na na start food
consumption measurements
10-Feb 1023 528 526.8 0 1.2 1.3 1.3 10-Feb 1555 17.4 0 1.5 15.9 16.7 11-Feb 1024 16.8 0 0.7 16.1 16.4 33.1 11-Feb 1704 88.1 35.6 0 52.5 53.5
11-Feb 1848 37.1 15.3 2.8 19 19.4 72.9
stop food measurements; euthanized on 2/12/2006
Continued
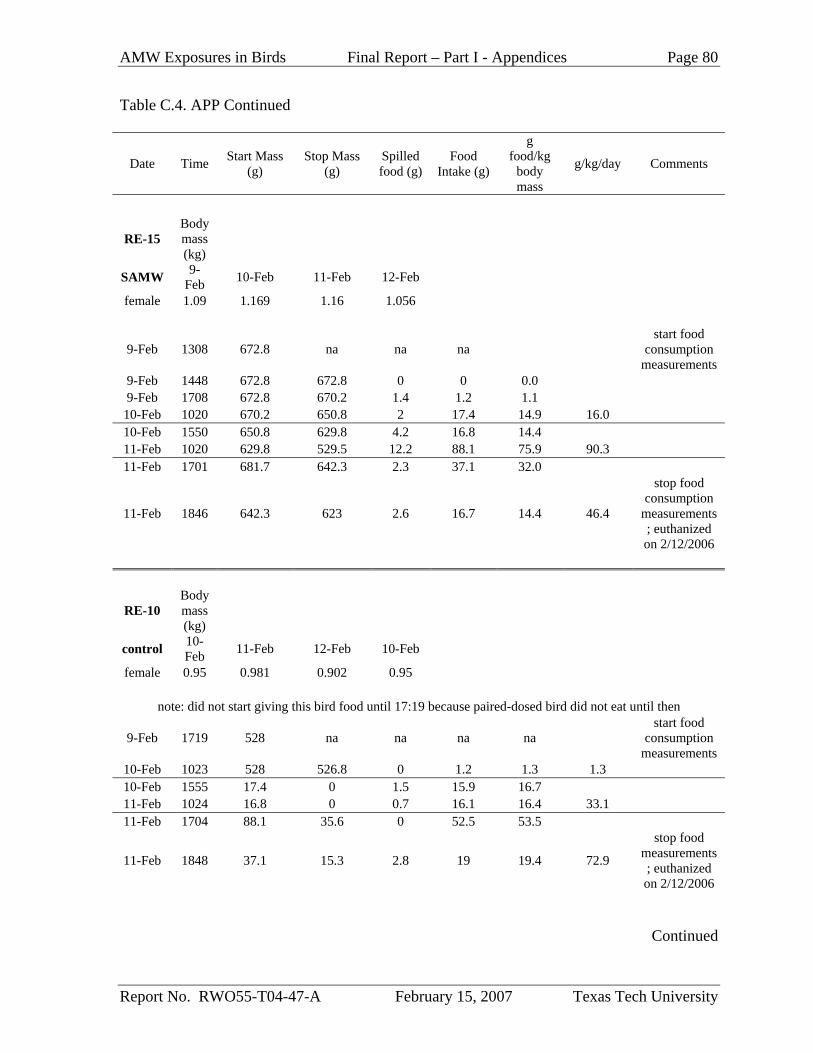
AMW Exposures in Birds Final Report – Part I - Appendices Page 80
Report No. RWO55-T04-47-A February 15, 2007 Texas Tech University
Table C.4. APP Continued
Date Time Start Mass (g)
Stop Mass (g)
Spilled food (g)
Food Intake (g)
g food/kg
body mass
g/kg/day Comments
RE-15 Body mass (kg)
SAMW 9-Feb 10-Feb 11-Feb 12-Feb
female 1.09 1.169 1.16 1.056
9-Feb 1308 672.8 na na na start food
consumption measurements
9-Feb 1448 672.8 672.8 0 0 0.0 9-Feb 1708 672.8 670.2 1.4 1.2 1.1
10-Feb 1020 670.2 650.8 2 17.4 14.9 16.0 10-Feb 1550 650.8 629.8 4.2 16.8 14.4 11-Feb 1020 629.8 529.5 12.2 88.1 75.9 90.3 11-Feb 1701 681.7 642.3 2.3 37.1 32.0
11-Feb 1846 642.3 623 2.6 16.7 14.4 46.4
stop food consumption
measurements; euthanized on 2/12/2006
RE-10 Body mass (kg)
control 10-Feb 11-Feb 12-Feb 10-Feb
female 0.95 0.981 0.902 0.95
note: did not start giving this bird food until 17:19 because paired-dosed bird did not eat until then
9-Feb 1719 528 na na na na start food
consumption measurements
10-Feb 1023 528 526.8 0 1.2 1.3 1.3 10-Feb 1555 17.4 0 1.5 15.9 16.7 11-Feb 1024 16.8 0 0.7 16.1 16.4 33.1 11-Feb 1704 88.1 35.6 0 52.5 53.5
11-Feb 1848 37.1 15.3 2.8 19 19.4 72.9
stop food measurements; euthanized on 2/12/2006
Continued
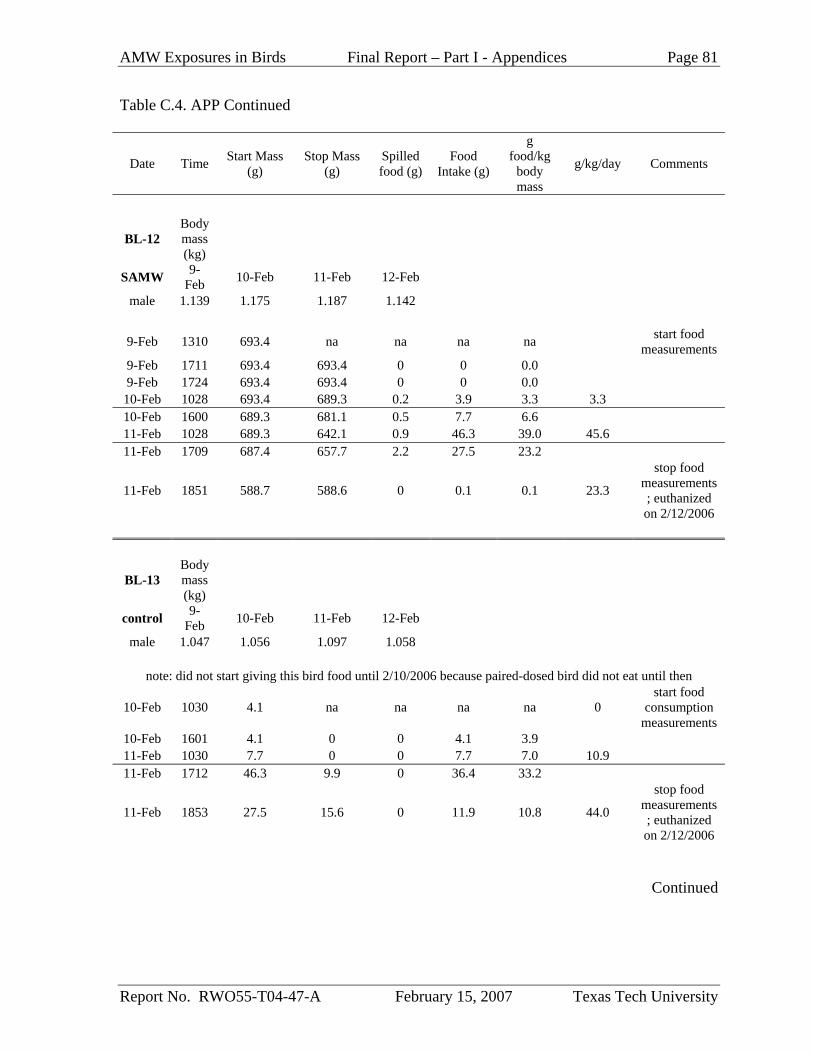
AMW Exposures in Birds Final Report – Part I - Appendices Page 81
Report No. RWO55-T04-47-A February 15, 2007 Texas Tech University
Table C.4. APP Continued
Date Time Start Mass (g)
Stop Mass (g)
Spilled food (g)
Food Intake (g)
g food/kg
body mass
g/kg/day Comments
BL-12 Body mass (kg)
SAMW 9-Feb 10-Feb 11-Feb 12-Feb
male 1.139 1.175 1.187 1.142
9-Feb 1310 693.4 na na na na start food measurements
9-Feb 1711 693.4 693.4 0 0 0.0 9-Feb 1724 693.4 693.4 0 0 0.0
10-Feb 1028 693.4 689.3 0.2 3.9 3.3 3.3 10-Feb 1600 689.3 681.1 0.5 7.7 6.6 11-Feb 1028 689.3 642.1 0.9 46.3 39.0 45.6 11-Feb 1709 687.4 657.7 2.2 27.5 23.2
11-Feb 1851 588.7 588.6 0 0.1 0.1 23.3
stop food measurements; euthanized on 2/12/2006
BL-13 Body mass (kg)
control 9-Feb 10-Feb 11-Feb 12-Feb
male 1.047 1.056 1.097 1.058 note: did not start giving this bird food until 2/10/2006 because paired-dosed bird did not eat until then
10-Feb 1030 4.1 na na na na 0 start food
consumption measurements
10-Feb 1601 4.1 0 0 4.1 3.9 11-Feb 1030 7.7 0 0 7.7 7.0 10.9 11-Feb 1712 46.3 9.9 0 36.4 33.2
11-Feb 1853 27.5 15.6 0 11.9 10.8 44.0
stop food measurements; euthanized on 2/12/2006
Continued
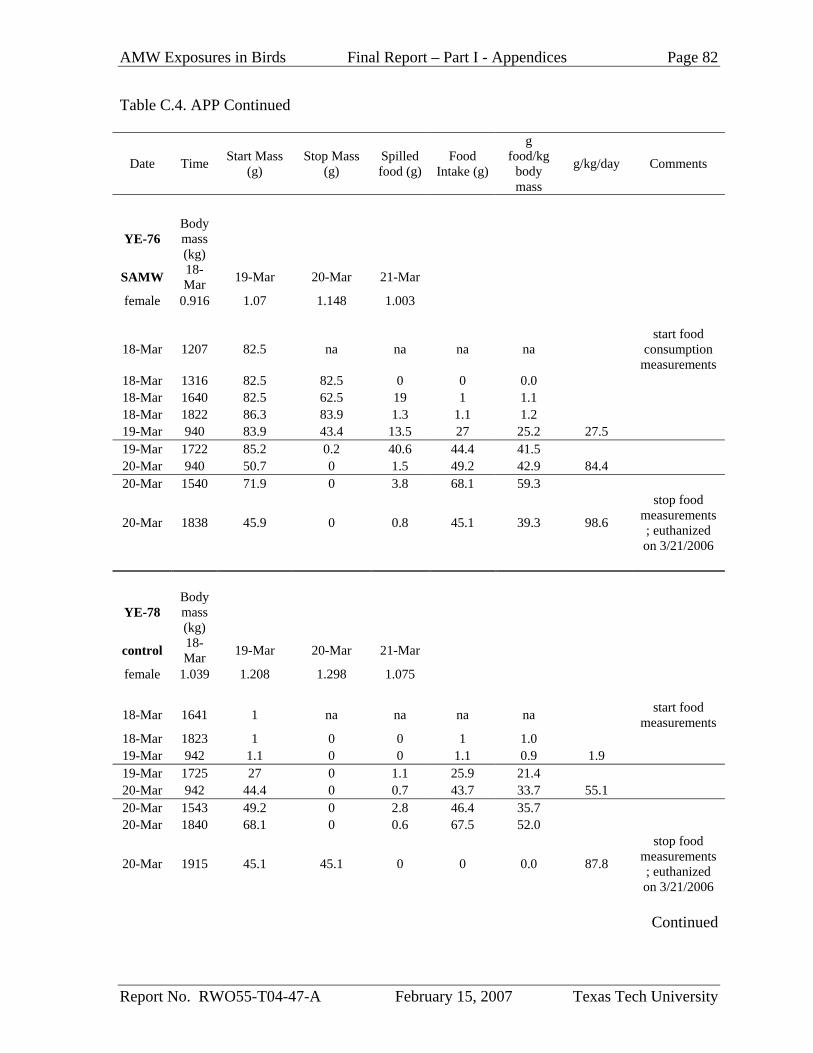
AMW Exposures in Birds Final Report – Part I - Appendices Page 82
Report No. RWO55-T04-47-A February 15, 2007 Texas Tech University
Table C.4. APP Continued
Date Time Start Mass (g)
Stop Mass (g)
Spilled food (g)
Food Intake (g)
g food/kg
body mass
g/kg/day Comments
YE-76 Body mass (kg)
SAMW 18-Mar 19-Mar 20-Mar 21-Mar
female 0.916 1.07 1.148 1.003
18-Mar 1207 82.5 na na na na start food
consumption measurements
18-Mar 1316 82.5 82.5 0 0 0.0 18-Mar 1640 82.5 62.5 19 1 1.1 18-Mar 1822 86.3 83.9 1.3 1.1 1.2 19-Mar 940 83.9 43.4 13.5 27 25.2 27.5 19-Mar 1722 85.2 0.2 40.6 44.4 41.5 20-Mar 940 50.7 0 1.5 49.2 42.9 84.4 20-Mar 1540 71.9 0 3.8 68.1 59.3
20-Mar 1838 45.9 0 0.8 45.1 39.3 98.6
stop food measurements; euthanized on 3/21/2006
YE-78 Body mass (kg)
control 18-Mar 19-Mar 20-Mar 21-Mar
female 1.039 1.208 1.298 1.075
18-Mar 1641 1 na na na na start food measurements
18-Mar 1823 1 0 0 1 1.0 19-Mar 942 1.1 0 0 1.1 0.9 1.9 19-Mar 1725 27 0 1.1 25.9 21.4 20-Mar 942 44.4 0 0.7 43.7 33.7 55.1 20-Mar 1543 49.2 0 2.8 46.4 35.7 20-Mar 1840 68.1 0 0.6 67.5 52.0
20-Mar 1915 45.1 45.1 0 0 0.0 87.8
stop food measurements; euthanized on 3/21/2006
Continued
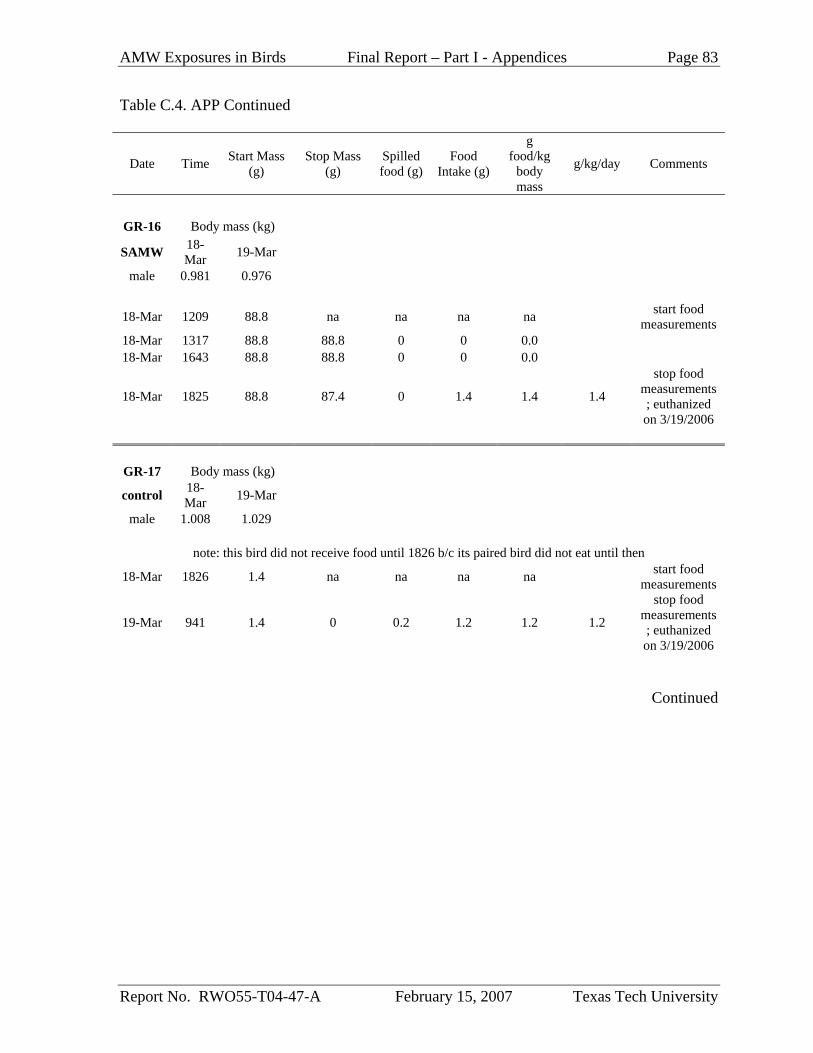
AMW Exposures in Birds Final Report – Part I - Appendices Page 83
Report No. RWO55-T04-47-A February 15, 2007 Texas Tech University
Table C.4. APP Continued
Date Time Start Mass (g)
Stop Mass (g)
Spilled food (g)
Food Intake (g)
g food/kg
body mass
g/kg/day Comments
GR-16 Body mass (kg)
SAMW 18-Mar 19-Mar
male 0.981 0.976
18-Mar 1209 88.8 na na na na start food measurements
18-Mar 1317 88.8 88.8 0 0 0.0 18-Mar 1643 88.8 88.8 0 0 0.0
18-Mar 1825 88.8 87.4 0 1.4 1.4 1.4
stop food measurements; euthanized on 3/19/2006
GR-17 Body mass (kg)
control 18-Mar 19-Mar
male 1.008 1.029
note: this bird did not receive food until 1826 b/c its paired bird did not eat until then
18-Mar 1826 1.4 na na na na start food measurements
19-Mar 941 1.4 0 0.2 1.2 1.2 1.2
stop food measurements; euthanized on 3/19/2006
Continued
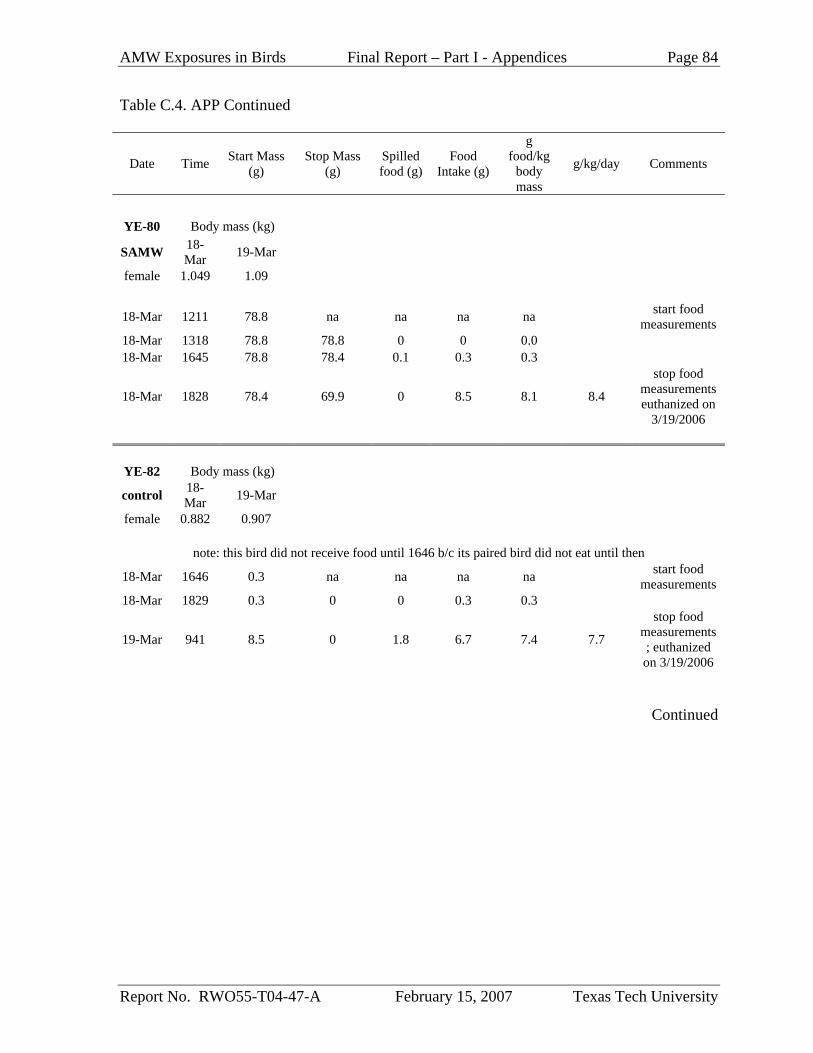
AMW Exposures in Birds Final Report – Part I - Appendices Page 84
Report No. RWO55-T04-47-A February 15, 2007 Texas Tech University
Table C.4. APP Continued
Date Time Start Mass (g)
Stop Mass (g)
Spilled food (g)
Food Intake (g)
g food/kg
body mass
g/kg/day Comments
YE-80 Body mass (kg)
SAMW 18-Mar 19-Mar
female 1.049 1.09
18-Mar 1211 78.8 na na na na start food measurements
18-Mar 1318 78.8 78.8 0 0 0.0 18-Mar 1645 78.8 78.4 0.1 0.3 0.3
18-Mar 1828 78.4 69.9 0 8.5 8.1 8.4
stop food measurements euthanized on
3/19/2006
YE-82 Body mass (kg)
control 18-Mar 19-Mar
female 0.882 0.907
note: this bird did not receive food until 1646 b/c its paired bird did not eat until then
18-Mar 1646 0.3 na na na na start food measurements
18-Mar 1829 0.3 0 0 0.3 0.3
19-Mar 941 8.5 0 1.8 6.7 7.4 7.7
stop food measurements; euthanized on 3/19/2006
Continued
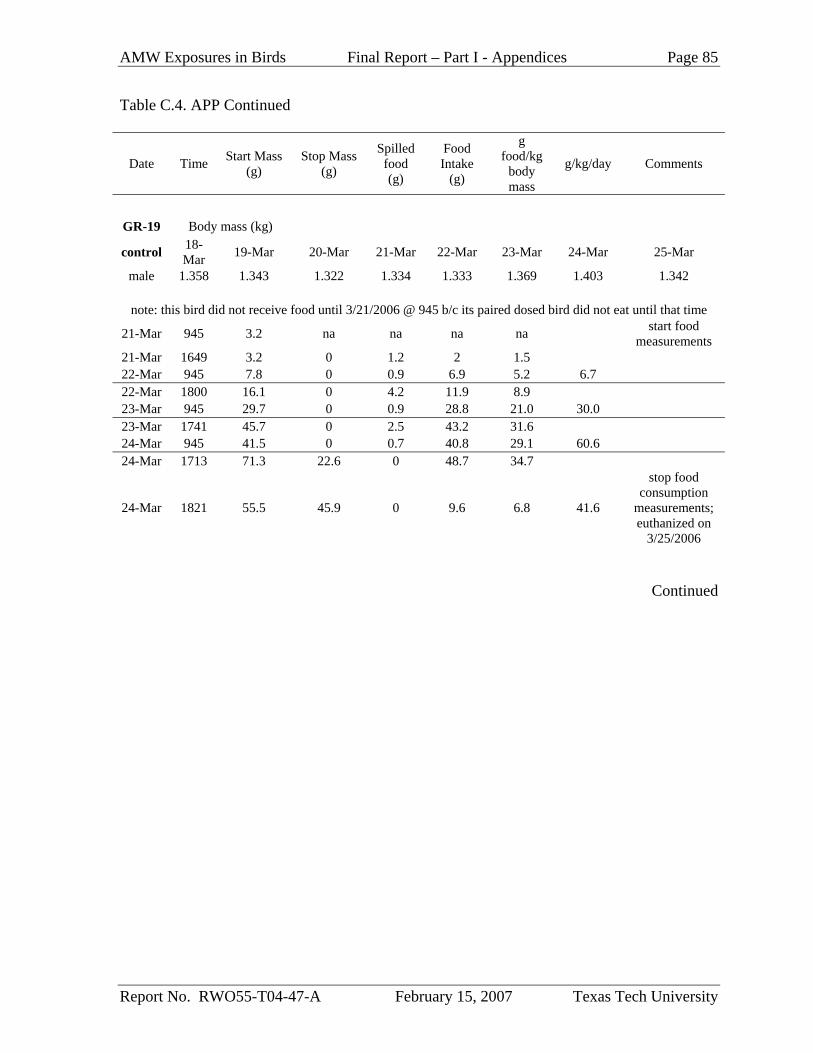
AMW Exposures in Birds Final Report – Part I - Appendices Page 85
Report No. RWO55-T04-47-A February 15, 2007 Texas Tech University
Table C.4. APP Continued
Date Time Start Mass (g)
Stop Mass (g)
Spilled food (g)
Food Intake
(g)
g food/kg
body mass
g/kg/day Comments
GR-19 Body mass (kg)
control 18-Mar 19-Mar 20-Mar 21-Mar 22-Mar 23-Mar 24-Mar 25-Mar
male 1.358 1.343 1.322 1.334 1.333 1.369 1.403 1.342
note: this bird did not receive food until 3/21/2006 @ 945 b/c its paired dosed bird did not eat until that time
21-Mar 945 3.2 na na na na start food measurements
21-Mar 1649 3.2 0 1.2 2 1.5 22-Mar 945 7.8 0 0.9 6.9 5.2 6.7 22-Mar 1800 16.1 0 4.2 11.9 8.9 23-Mar 945 29.7 0 0.9 28.8 21.0 30.0 23-Mar 1741 45.7 0 2.5 43.2 31.6 24-Mar 945 41.5 0 0.7 40.8 29.1 60.6 24-Mar 1713 71.3 22.6 0 48.7 34.7
24-Mar 1821 55.5 45.9 0 9.6 6.8 41.6
stop food consumption
measurements; euthanized on
3/25/2006
Continued

AMW Exposures in Birds Final Report – Part I - Appendices Page 86
Report No. RWO55-T04-47-A February 15, 2007 Texas Tech University
Table C.4. APP Continued
Date Time Start Mass (g)
Stop Mass (g)
Spilled food (g)
Food Intake
(g)
g food/kg
body mass
g/kg/day Comments
GR-19 Body mass (kg)
control 18-Mar 19-Mar 20-Mar 21-Mar 22-Mar 23-Mar 24-Mar 25-Mar
male 1.06 1.002 0.965 1.004 1.048 1.086 1.096 1.047
18-Mar 1213 81.3 na na na na start food measurements
18-Mar 1320 81.3 81.3 0 0 0.0 18-Mar 1648 81.3 81.3 0 0 0.0 18-Mar 1832 81.3 81.3 0 0 0.0 19-Mar 944 81.3 81.3 0 0 0.0 0 19-Mar 1727 81.3 81.3 0 0 0.0 20-Mar 944 81.3 81.3 0 0 0.0 0.0 20-Mar 1546 81.3 81.3 0 0 0.0 21-Mar 944 81.3 77.4 0.7 3.2 3.2 3.2 21-Mar 1647 77.4 68.2 1.4 7.8 7.8 22-Mar 944 68.2 49.3 2.8 16.1 15.4 23.1 22-Mar 1758 81.3 50.7 0.9 29.7 28.3 23-Mar 944 96 48.2 2.1 45.7 42.1 70.4 23-Mar 1739 89.4 46.2 1.7 41.5 38.2 24-Mar 944 74.4 0 3.1 71.3 65.1 103.3 24-Mar 1710 73.1 39.4 0.8 32.9 30.0
24-Mar 1820 39.4 33.3 0.3 5.8 5.3 35.3
stop food measurements; euthanized on
3/25/2006
Continued
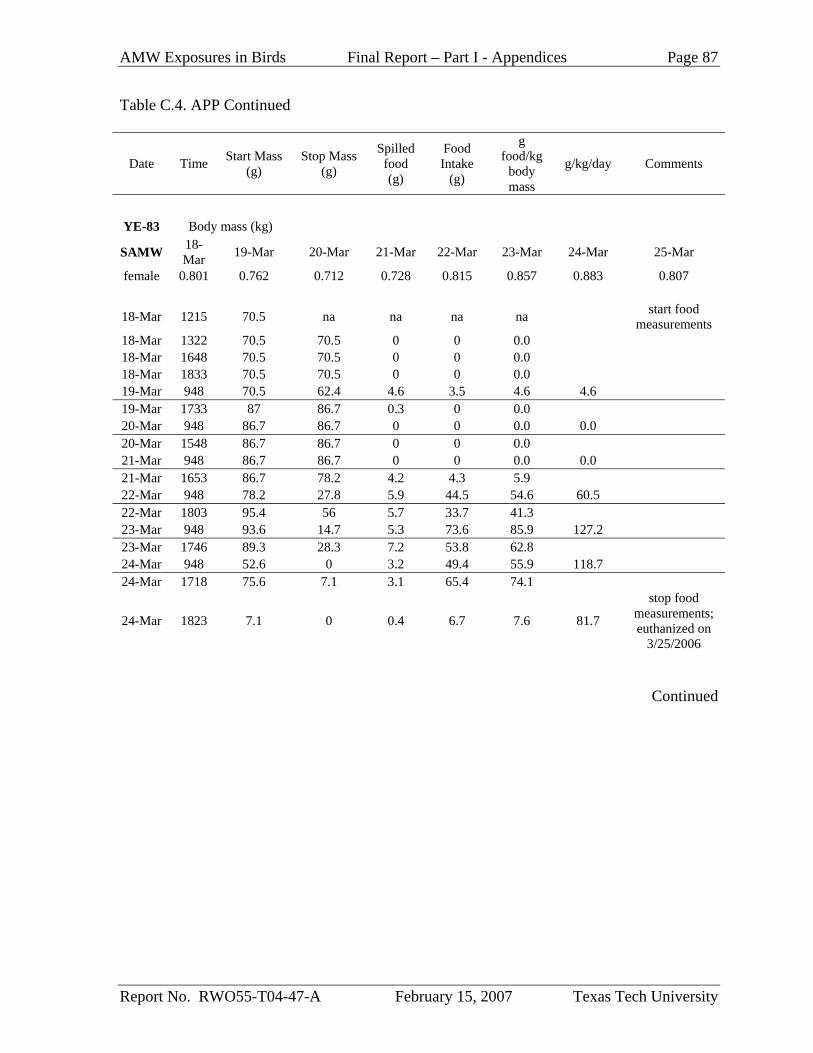
AMW Exposures in Birds Final Report – Part I - Appendices Page 87
Report No. RWO55-T04-47-A February 15, 2007 Texas Tech University
Table C.4. APP Continued
Date Time Start Mass (g)
Stop Mass (g)
Spilled food (g)
Food Intake
(g)
g food/kg
body mass
g/kg/day Comments
YE-83 Body mass (kg)
SAMW 18-Mar 19-Mar 20-Mar 21-Mar 22-Mar 23-Mar 24-Mar 25-Mar
female 0.801 0.762 0.712 0.728 0.815 0.857 0.883 0.807
18-Mar 1215 70.5 na na na na start food measurements
18-Mar 1322 70.5 70.5 0 0 0.0 18-Mar 1648 70.5 70.5 0 0 0.0 18-Mar 1833 70.5 70.5 0 0 0.0 19-Mar 948 70.5 62.4 4.6 3.5 4.6 4.6 19-Mar 1733 87 86.7 0.3 0 0.0 20-Mar 948 86.7 86.7 0 0 0.0 0.0 20-Mar 1548 86.7 86.7 0 0 0.0 21-Mar 948 86.7 86.7 0 0 0.0 0.0 21-Mar 1653 86.7 78.2 4.2 4.3 5.9 22-Mar 948 78.2 27.8 5.9 44.5 54.6 60.5 22-Mar 1803 95.4 56 5.7 33.7 41.3 23-Mar 948 93.6 14.7 5.3 73.6 85.9 127.2 23-Mar 1746 89.3 28.3 7.2 53.8 62.8 24-Mar 948 52.6 0 3.2 49.4 55.9 118.7 24-Mar 1718 75.6 7.1 3.1 65.4 74.1
24-Mar 1823 7.1 0 0.4 6.7 7.6 81.7
stop food measurements; euthanized on
3/25/2006
Continued
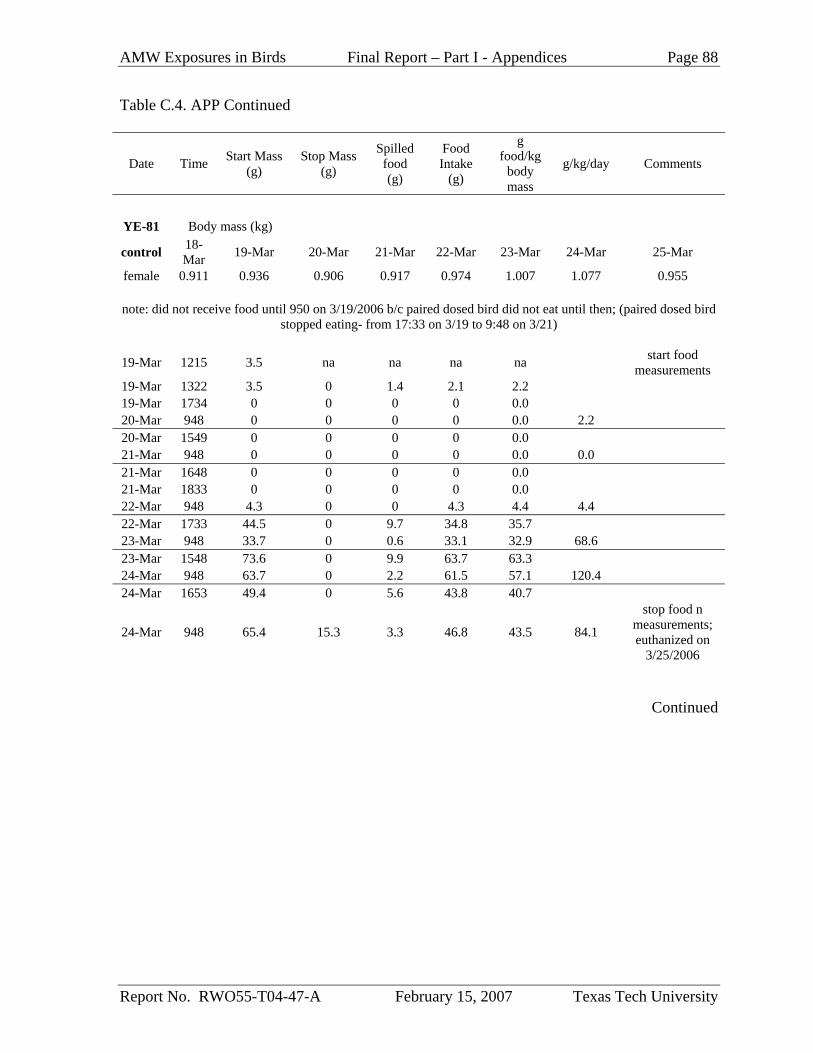
AMW Exposures in Birds Final Report – Part I - Appendices Page 88
Report No. RWO55-T04-47-A February 15, 2007 Texas Tech University
Table C.4. APP Continued
Date Time Start Mass (g)
Stop Mass (g)
Spilled food (g)
Food Intake
(g)
g food/kg
body mass
g/kg/day Comments
YE-81 Body mass (kg)
control 18-Mar 19-Mar 20-Mar 21-Mar 22-Mar 23-Mar 24-Mar 25-Mar
female 0.911 0.936 0.906 0.917 0.974 1.007 1.077 0.955
note: did not receive food until 950 on 3/19/2006 b/c paired dosed bird did not eat until then; (paired dosed bird stopped eating- from 17:33 on 3/19 to 9:48 on 3/21)
19-Mar 1215 3.5 na na na na start food measurements
19-Mar 1322 3.5 0 1.4 2.1 2.2 19-Mar 1734 0 0 0 0 0.0 20-Mar 948 0 0 0 0 0.0 2.2 20-Mar 1549 0 0 0 0 0.0 21-Mar 948 0 0 0 0 0.0 0.0 21-Mar 1648 0 0 0 0 0.0 21-Mar 1833 0 0 0 0 0.0 22-Mar 948 4.3 0 0 4.3 4.4 4.4 22-Mar 1733 44.5 0 9.7 34.8 35.7 23-Mar 948 33.7 0 0.6 33.1 32.9 68.6 23-Mar 1548 73.6 0 9.9 63.7 63.3 24-Mar 948 63.7 0 2.2 61.5 57.1 120.4 24-Mar 1653 49.4 0 5.6 43.8 40.7
24-Mar 948 65.4 15.3 3.3 46.8 43.5 84.1
stop food n measurements; euthanized on
3/25/2006
Continued
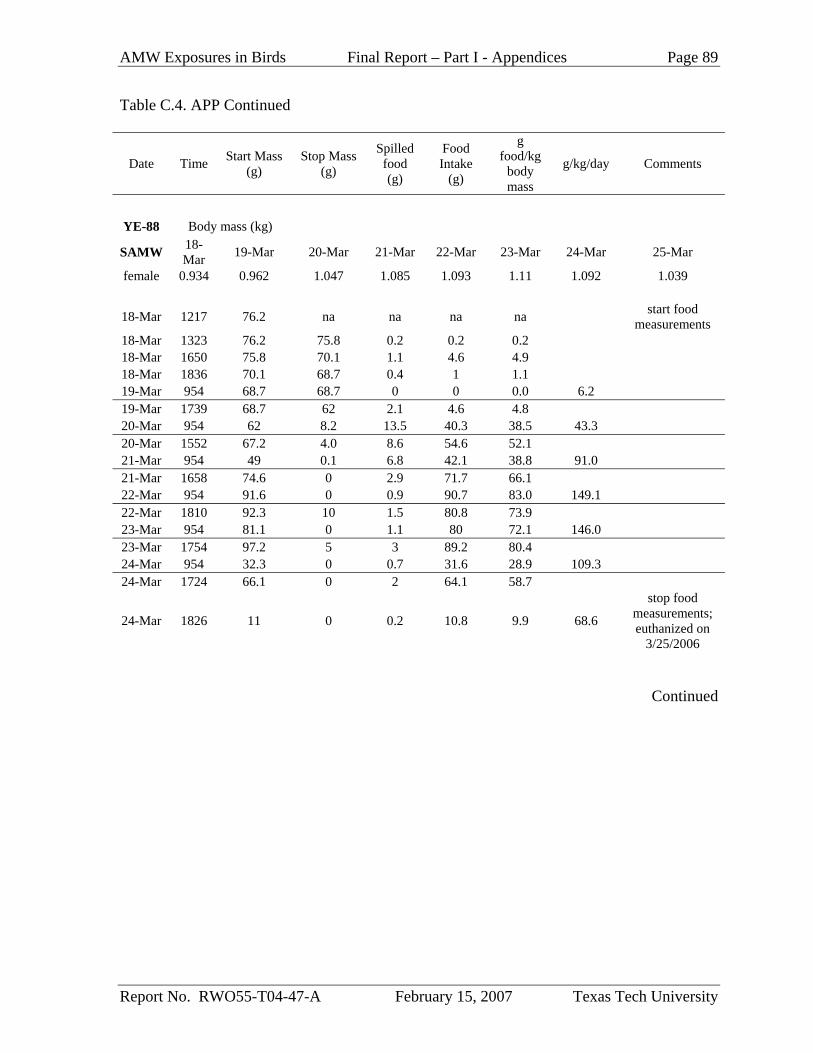
AMW Exposures in Birds Final Report – Part I - Appendices Page 89
Report No. RWO55-T04-47-A February 15, 2007 Texas Tech University
Table C.4. APP Continued
Date Time Start Mass (g)
Stop Mass (g)
Spilled food (g)
Food Intake
(g)
g food/kg
body mass
g/kg/day Comments
YE-88 Body mass (kg)
SAMW 18-Mar 19-Mar 20-Mar 21-Mar 22-Mar 23-Mar 24-Mar 25-Mar
female 0.934 0.962 1.047 1.085 1.093 1.11 1.092 1.039
18-Mar 1217 76.2 na na na na start food measurements
18-Mar 1323 76.2 75.8 0.2 0.2 0.2 18-Mar 1650 75.8 70.1 1.1 4.6 4.9 18-Mar 1836 70.1 68.7 0.4 1 1.1 19-Mar 954 68.7 68.7 0 0 0.0 6.2 19-Mar 1739 68.7 62 2.1 4.6 4.8 20-Mar 954 62 8.2 13.5 40.3 38.5 43.3 20-Mar 1552 67.2 4.0 8.6 54.6 52.1 21-Mar 954 49 0.1 6.8 42.1 38.8 91.0 21-Mar 1658 74.6 0 2.9 71.7 66.1 22-Mar 954 91.6 0 0.9 90.7 83.0 149.1 22-Mar 1810 92.3 10 1.5 80.8 73.9 23-Mar 954 81.1 0 1.1 80 72.1 146.0 23-Mar 1754 97.2 5 3 89.2 80.4 24-Mar 954 32.3 0 0.7 31.6 28.9 109.3 24-Mar 1724 66.1 0 2 64.1 58.7
24-Mar 1826 11 0 0.2 10.8 9.9 68.6
stop food measurements; euthanized on
3/25/2006
Continued
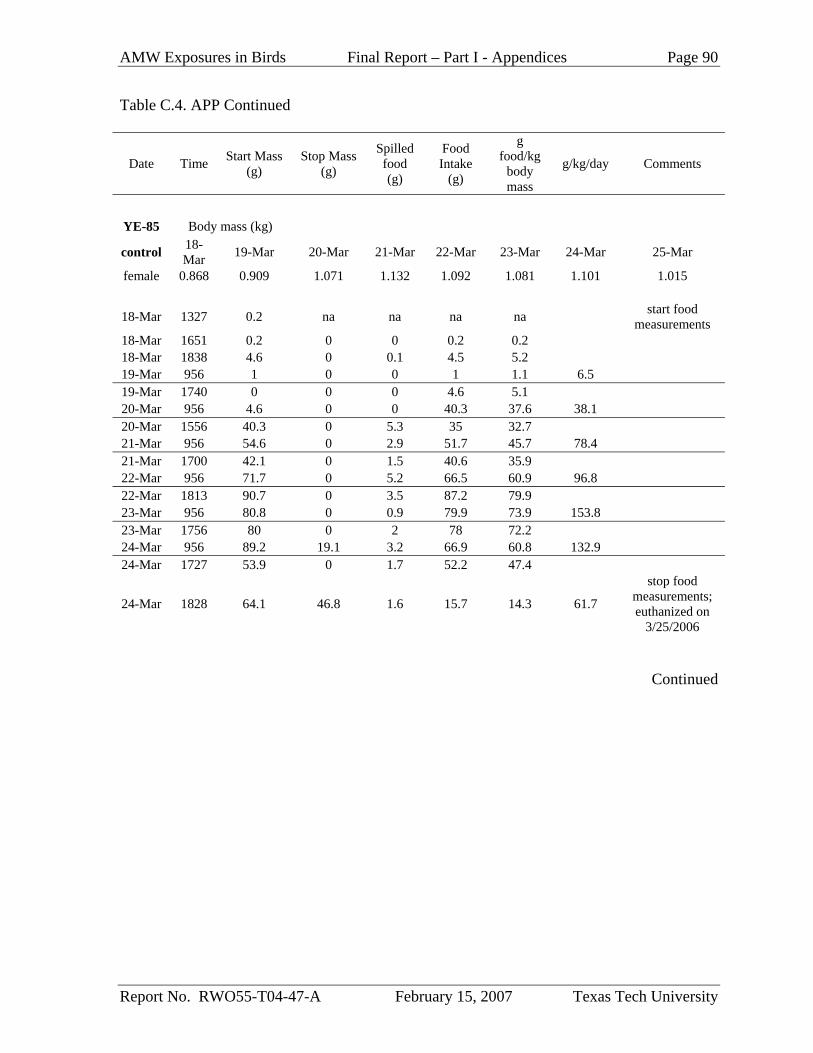
AMW Exposures in Birds Final Report – Part I - Appendices Page 90
Report No. RWO55-T04-47-A February 15, 2007 Texas Tech University
Table C.4. APP Continued
Date Time Start Mass (g)
Stop Mass (g)
Spilled food (g)
Food Intake
(g)
g food/kg
body mass
g/kg/day Comments
YE-85 Body mass (kg)
control 18-Mar 19-Mar 20-Mar 21-Mar 22-Mar 23-Mar 24-Mar 25-Mar
female 0.868 0.909 1.071 1.132 1.092 1.081 1.101 1.015
18-Mar 1327 0.2 na na na na start food measurements
18-Mar 1651 0.2 0 0 0.2 0.2 18-Mar 1838 4.6 0 0.1 4.5 5.2 19-Mar 956 1 0 0 1 1.1 6.5 19-Mar 1740 0 0 0 4.6 5.1 20-Mar 956 4.6 0 0 40.3 37.6 38.1 20-Mar 1556 40.3 0 5.3 35 32.7 21-Mar 956 54.6 0 2.9 51.7 45.7 78.4 21-Mar 1700 42.1 0 1.5 40.6 35.9 22-Mar 956 71.7 0 5.2 66.5 60.9 96.8 22-Mar 1813 90.7 0 3.5 87.2 79.9 23-Mar 956 80.8 0 0.9 79.9 73.9 153.8 23-Mar 1756 80 0 2 78 72.2 24-Mar 956 89.2 19.1 3.2 66.9 60.8 132.9 24-Mar 1727 53.9 0 1.7 52.2 47.4
24-Mar 1828 64.1 46.8 1.6 15.7 14.3 61.7
stop food measurements; euthanized on
3/25/2006
Continued
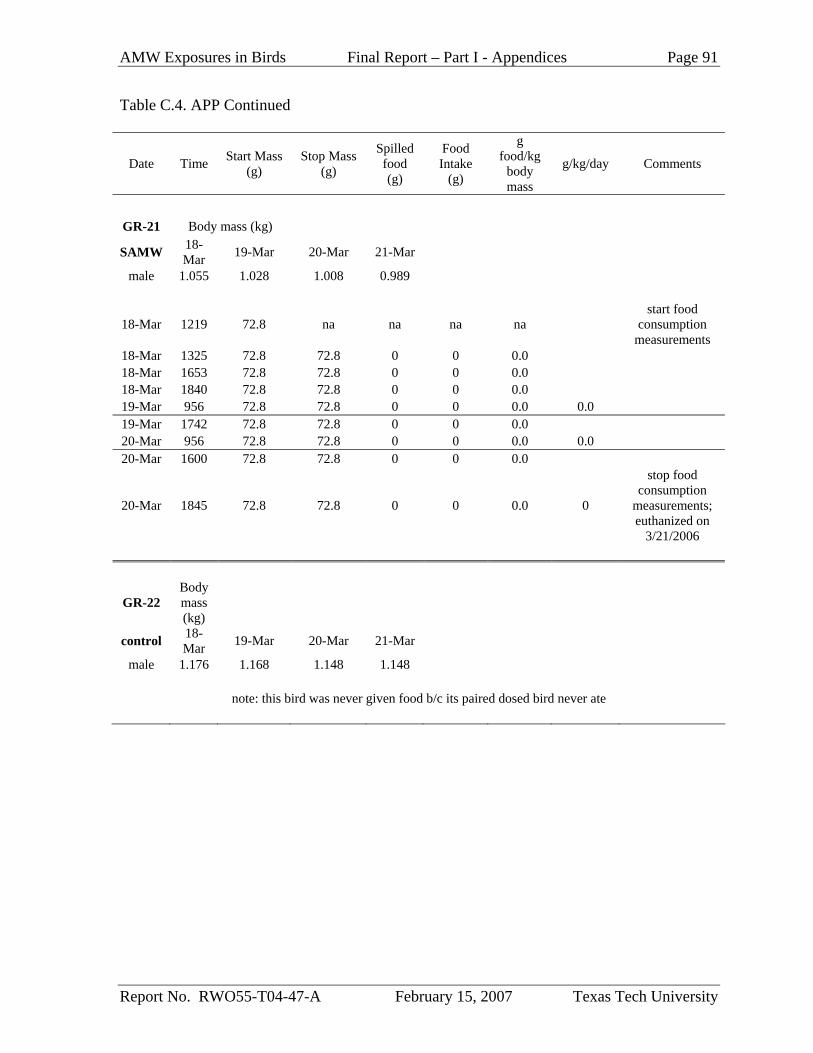
AMW Exposures in Birds Final Report – Part I - Appendices Page 91
Report No. RWO55-T04-47-A February 15, 2007 Texas Tech University
Table C.4. APP Continued
Date Time Start Mass (g)
Stop Mass (g)
Spilled food (g)
Food Intake
(g)
g food/kg
body mass
g/kg/day Comments
GR-21 Body mass (kg)
SAMW 18-Mar 19-Mar 20-Mar 21-Mar
male 1.055 1.028 1.008 0.989
18-Mar 1219 72.8 na na na na start food
consumption measurements
18-Mar 1325 72.8 72.8 0 0 0.0 18-Mar 1653 72.8 72.8 0 0 0.0 18-Mar 1840 72.8 72.8 0 0 0.0 19-Mar 956 72.8 72.8 0 0 0.0 0.0 19-Mar 1742 72.8 72.8 0 0 0.0 20-Mar 956 72.8 72.8 0 0 0.0 0.0 20-Mar 1600 72.8 72.8 0 0 0.0
20-Mar 1845 72.8 72.8 0 0 0.0 0
stop food consumption
measurements; euthanized on
3/21/2006
GR-22 Body mass (kg)
control 18-Mar 19-Mar 20-Mar 21-Mar
male 1.176 1.168 1.148 1.148
note: this bird was never given food b/c its paired dosed bird never ate
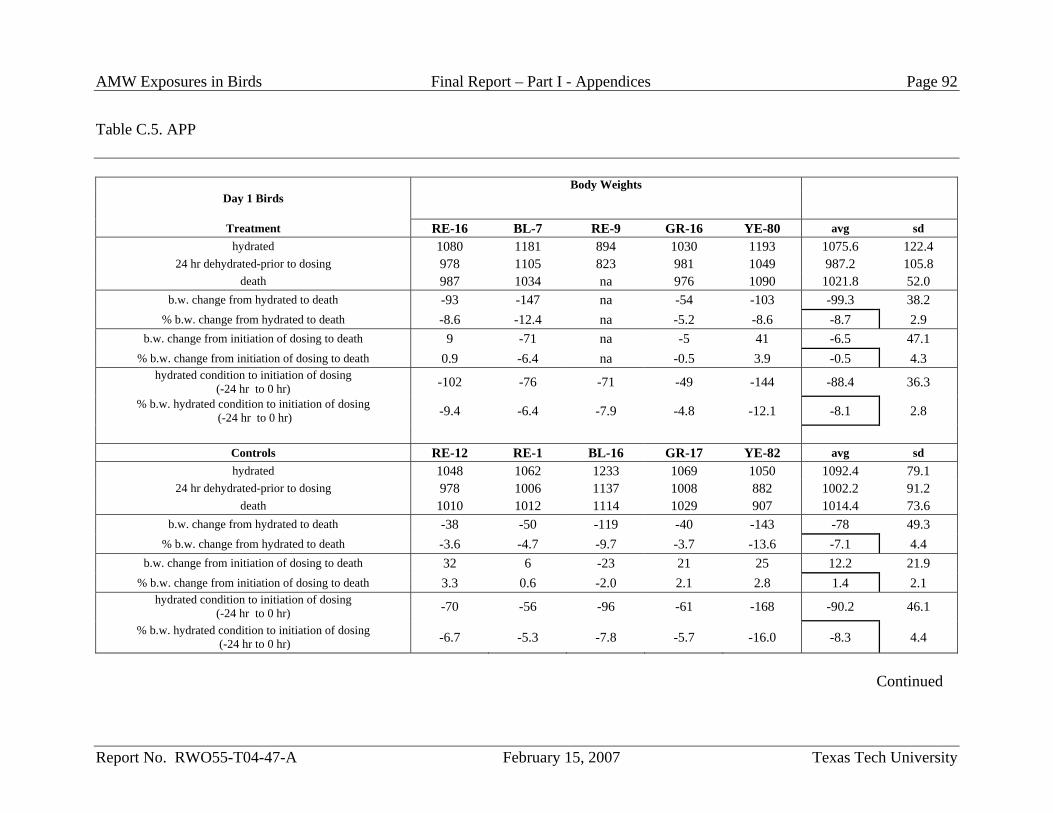
AMW Exposures in Birds Final Report – Part I - Appendices Page 92
Report No. RWO55-T04-47-A February 15, 2007 Texas Tech University
Table C.5. APP
Body Weights Day 1 Birds
Treatment RE-16 BL-7 RE-9 GR-16 YE-80 avg sd
hydrated 1080 1181 894 1030 1193 1075.6 122.4 24 hr dehydrated-prior to dosing 978 1105 823 981 1049 987.2 105.8
death 987 1034 na 976 1090 1021.8 52.0 b.w. change from hydrated to death -93 -147 na -54 -103 -99.3 38.2
% b.w. change from hydrated to death -8.6 -12.4 na -5.2 -8.6 -8.7 2.9 b.w. change from initiation of dosing to death 9 -71 na -5 41 -6.5 47.1
% b.w. change from initiation of dosing to death 0.9 -6.4 na -0.5 3.9 -0.5 4.3 hydrated condition to initiation of dosing
(-24 hr to 0 hr) -102 -76 -71 -49 -144 -88.4 36.3 % b.w. hydrated condition to initiation of dosing
(-24 hr to 0 hr) -9.4 -6.4 -7.9 -4.8 -12.1 -8.1 2.8
Controls RE-12 RE-1 BL-16 GR-17 YE-82 avg sd hydrated 1048 1062 1233 1069 1050 1092.4 79.1
24 hr dehydrated-prior to dosing 978 1006 1137 1008 882 1002.2 91.2 death 1010 1012 1114 1029 907 1014.4 73.6
b.w. change from hydrated to death -38 -50 -119 -40 -143 -78 49.3 % b.w. change from hydrated to death -3.6 -4.7 -9.7 -3.7 -13.6 -7.1 4.4
b.w. change from initiation of dosing to death 32 6 -23 21 25 12.2 21.9 % b.w. change from initiation of dosing to death 3.3 0.6 -2.0 2.1 2.8 1.4 2.1
hydrated condition to initiation of dosing (-24 hr to 0 hr) -70 -56 -96 -61 -168 -90.2 46.1
% b.w. hydrated condition to initiation of dosing (-24 hr to 0 hr) -6.7 -5.3 -7.8 -5.7 -16.0 -8.3 4.4
Continued
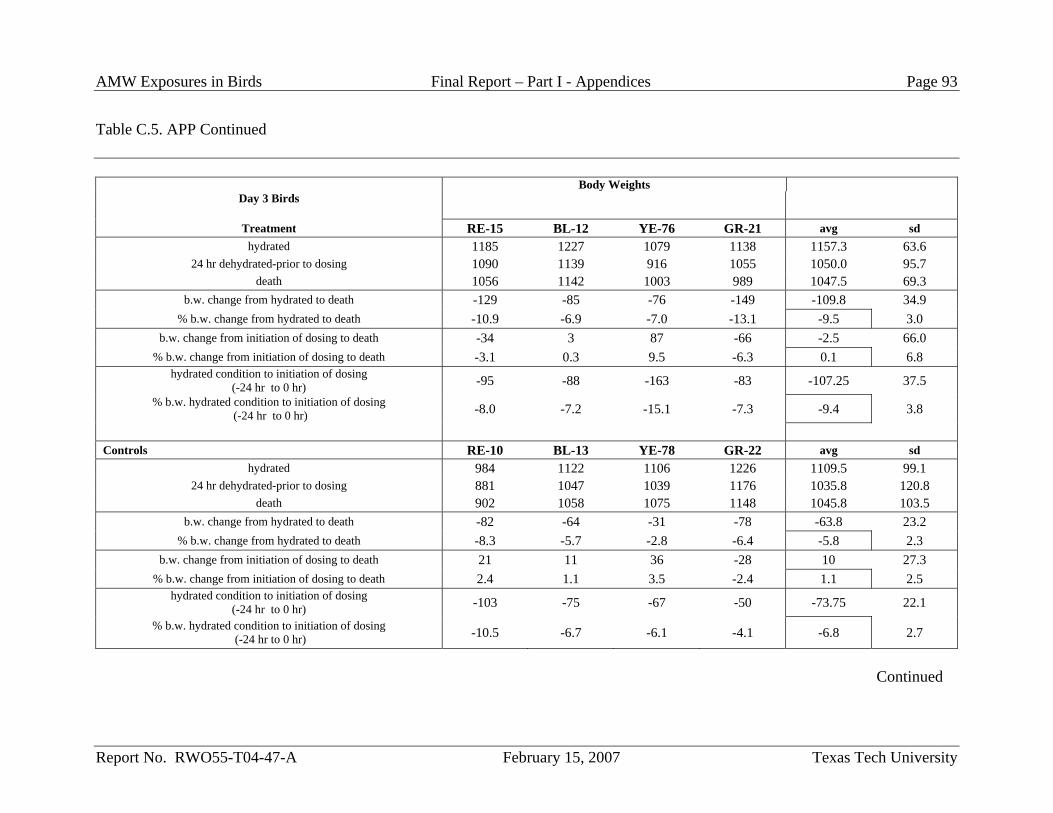
AMW Exposures in Birds Final Report – Part I - Appendices Page 93
Report No. RWO55-T04-47-A February 15, 2007 Texas Tech University
Table C.5. APP Continued
Body Weights Day 3 Birds
Treatment RE-15 BL-12 YE-76 GR-21 avg sd
hydrated 1185 1227 1079 1138 1157.3 63.6 24 hr dehydrated-prior to dosing 1090 1139 916 1055 1050.0 95.7
death 1056 1142 1003 989 1047.5 69.3 b.w. change from hydrated to death -129 -85 -76 -149 -109.8 34.9
% b.w. change from hydrated to death -10.9 -6.9 -7.0 -13.1 -9.5 3.0 b.w. change from initiation of dosing to death -34 3 87 -66 -2.5 66.0
% b.w. change from initiation of dosing to death -3.1 0.3 9.5 -6.3 0.1 6.8 hydrated condition to initiation of dosing
(-24 hr to 0 hr) -95 -88 -163 -83 -107.25 37.5 % b.w. hydrated condition to initiation of dosing
(-24 hr to 0 hr) -8.0 -7.2 -15.1 -7.3 -9.4 3.8
Controls RE-10 BL-13 YE-78 GR-22 avg sd
hydrated 984 1122 1106 1226 1109.5 99.1 24 hr dehydrated-prior to dosing 881 1047 1039 1176 1035.8 120.8
death 902 1058 1075 1148 1045.8 103.5 b.w. change from hydrated to death -82 -64 -31 -78 -63.8 23.2
% b.w. change from hydrated to death -8.3 -5.7 -2.8 -6.4 -5.8 2.3 b.w. change from initiation of dosing to death 21 11 36 -28 10 27.3
% b.w. change from initiation of dosing to death 2.4 1.1 3.5 -2.4 1.1 2.5 hydrated condition to initiation of dosing
(-24 hr to 0 hr) -103 -75 -67 -50 -73.75 22.1
% b.w. hydrated condition to initiation of dosing (-24 hr to 0 hr) -10.5 -6.7 -6.1 -4.1 -6.8 2.7
Continued
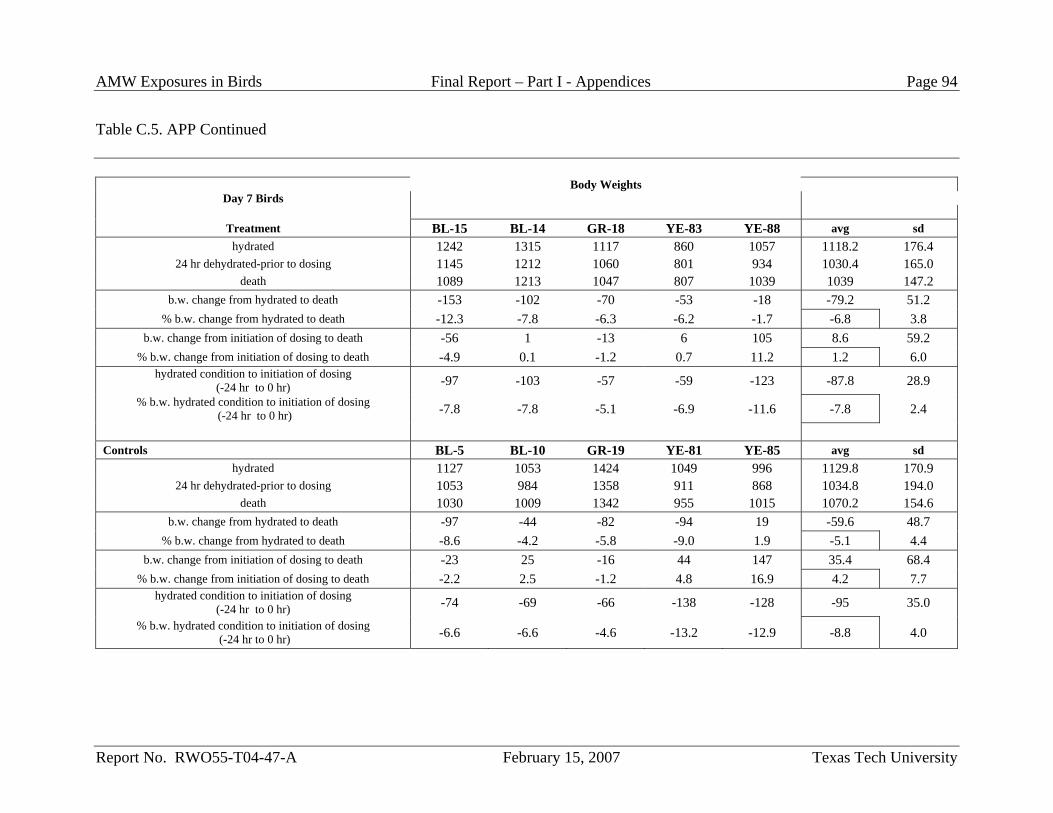
AMW Exposures in Birds Final Report – Part I - Appendices Page 94
Report No. RWO55-T04-47-A February 15, 2007 Texas Tech University
Table C.5. APP Continued
Body Weights Day 7 Birds
Treatment BL-15 BL-14 GR-18 YE-83 YE-88 avg sd
hydrated 1242 1315 1117 860 1057 1118.2 176.4 24 hr dehydrated-prior to dosing 1145 1212 1060 801 934 1030.4 165.0
death 1089 1213 1047 807 1039 1039 147.2 b.w. change from hydrated to death -153 -102 -70 -53 -18 -79.2 51.2
% b.w. change from hydrated to death -12.3 -7.8 -6.3 -6.2 -1.7 -6.8 3.8 b.w. change from initiation of dosing to death -56 1 -13 6 105 8.6 59.2
% b.w. change from initiation of dosing to death -4.9 0.1 -1.2 0.7 11.2 1.2 6.0 hydrated condition to initiation of dosing
(-24 hr to 0 hr) -97 -103 -57 -59 -123 -87.8 28.9 % b.w. hydrated condition to initiation of dosing
(-24 hr to 0 hr) -7.8 -7.8 -5.1 -6.9 -11.6 -7.8 2.4
Controls BL-5 BL-10 GR-19 YE-81 YE-85 avg sd
hydrated 1127 1053 1424 1049 996 1129.8 170.9 24 hr dehydrated-prior to dosing 1053 984 1358 911 868 1034.8 194.0
death 1030 1009 1342 955 1015 1070.2 154.6 b.w. change from hydrated to death -97 -44 -82 -94 19 -59.6 48.7
% b.w. change from hydrated to death -8.6 -4.2 -5.8 -9.0 1.9 -5.1 4.4 b.w. change from initiation of dosing to death -23 25 -16 44 147 35.4 68.4
% b.w. change from initiation of dosing to death -2.2 2.5 -1.2 4.8 16.9 4.2 7.7 hydrated condition to initiation of dosing
(-24 hr to 0 hr) -74 -69 -66 -138 -128 -95 35.0
% b.w. hydrated condition to initiation of dosing (-24 hr to 0 hr) -6.6 -6.6 -4.6 -13.2 -12.9 -8.8 4.0
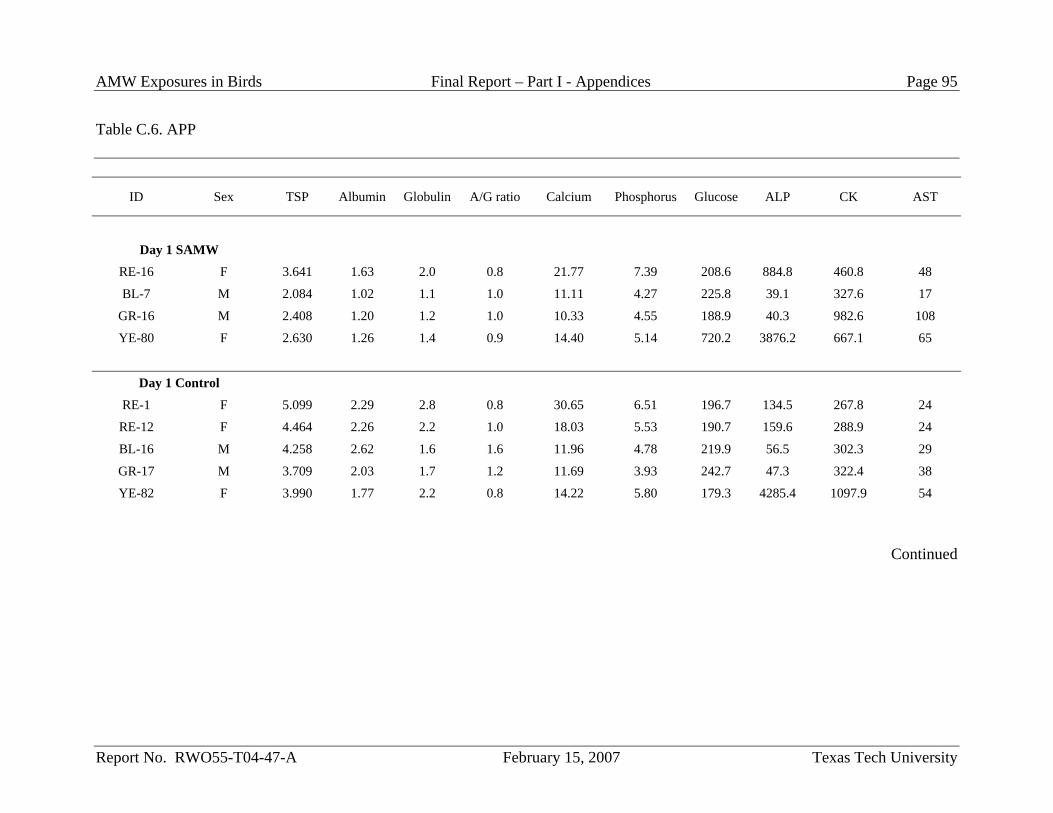
AMW Exposures in Birds Final Report – Part I - Appendices Page 95
Report No. RWO55-T04-47-A February 15, 2007 Texas Tech University
Table C.6. APP
ID Sex TSP Albumin Globulin A/G ratio Calcium Phosphorus Glucose ALP CK AST
Day 1 SAMW
RE-16 F 3.641 1.63 2.0 0.8 21.77 7.39 208.6 884.8 460.8 48
BL-7 M 2.084 1.02 1.1 1.0 11.11 4.27 225.8 39.1 327.6 17
GR-16 M 2.408 1.20 1.2 1.0 10.33 4.55 188.9 40.3 982.6 108
YE-80 F 2.630 1.26 1.4 0.9 14.40 5.14 720.2 3876.2 667.1 65
Day 1 Control RE-1 F 5.099 2.29 2.8 0.8 30.65 6.51 196.7 134.5 267.8 24
RE-12 F 4.464 2.26 2.2 1.0 18.03 5.53 190.7 159.6 288.9 24
BL-16 M 4.258 2.62 1.6 1.6 11.96 4.78 219.9 56.5 302.3 29
GR-17 M 3.709 2.03 1.7 1.2 11.69 3.93 242.7 47.3 322.4 38
YE-82 F 3.990 1.77 2.2 0.8 14.22 5.80 179.3 4285.4 1097.9 54
Continued

AMW Exposures in Birds Final Report – Part I - Appendices Page 96
Report No. RWO55-T04-47-A February 15, 2007 Texas Tech University
Table C.6. APP Continued
ID Sex Uric Acid Cholesterol Na K Cl
Day 1 SAMW
RE-16 F 4.44 93.3 161.2 6.14 113.1
BL-7 M 11.33 136.8 143.4 5.42 101.2
GR-16 M 3.59 189.6 149.6 4.01 100.9
YE-80 F 15.99 246.9 117.2 19.80 92.4
Day 1 Control
RE-1 F 2.8 180.1 167.7 3.92 115.5
RE-12 F 1.87 413.0 158.5 4.83 113.0
BL-16 M 3.21 290.2 156.3 4.36 109.2
GR-17 M 2.01 285.3 152.2 4.43 106.7
YE-82 F 2.8 180.1 167.7 3.92 115.5
Continued
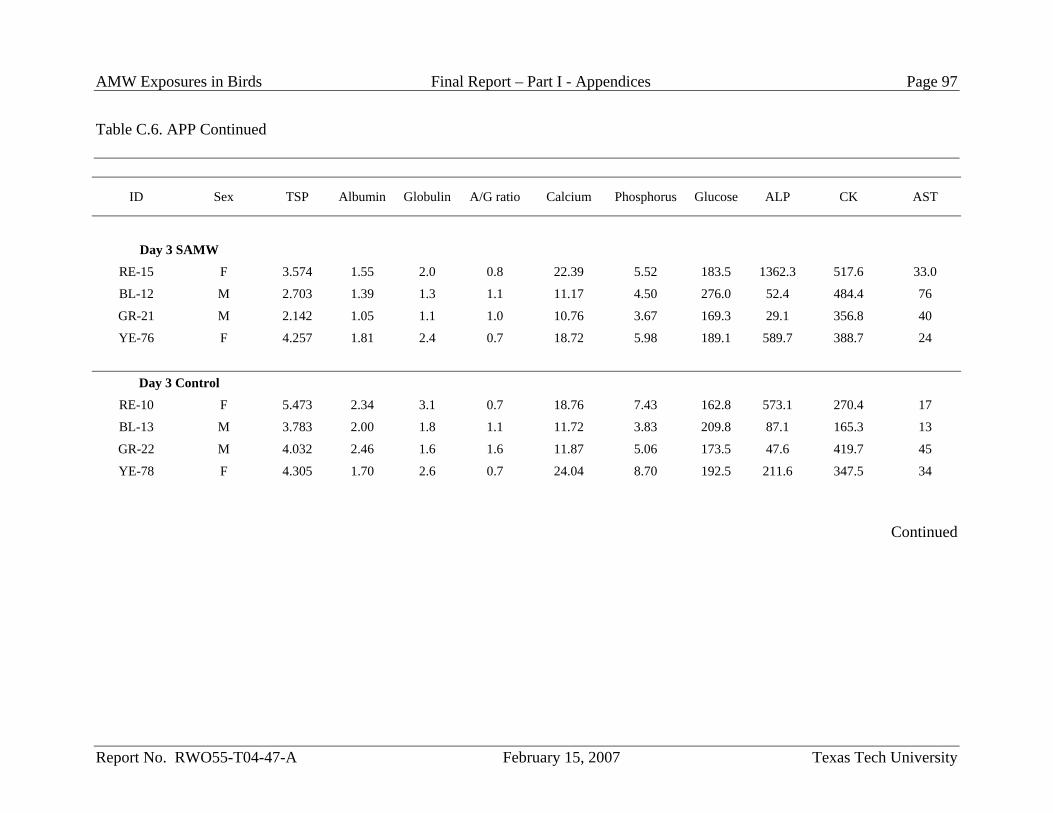
AMW Exposures in Birds Final Report – Part I - Appendices Page 97
Report No. RWO55-T04-47-A February 15, 2007 Texas Tech University
Table C.6. APP Continued
ID Sex TSP Albumin Globulin A/G ratio Calcium Phosphorus Glucose ALP CK AST
Day 3 SAMW
RE-15 F 3.574 1.55 2.0 0.8 22.39 5.52 183.5 1362.3 517.6 33.0
BL-12 M 2.703 1.39 1.3 1.1 11.17 4.50 276.0 52.4 484.4 76
GR-21 M 2.142 1.05 1.1 1.0 10.76 3.67 169.3 29.1 356.8 40
YE-76 F 4.257 1.81 2.4 0.7 18.72 5.98 189.1 589.7 388.7 24
Day 3 Control
RE-10 F 5.473 2.34 3.1 0.7 18.76 7.43 162.8 573.1 270.4 17
BL-13 M 3.783 2.00 1.8 1.1 11.72 3.83 209.8 87.1 165.3 13
GR-22 M 4.032 2.46 1.6 1.6 11.87 5.06 173.5 47.6 419.7 45
YE-78 F 4.305 1.70 2.6 0.7 24.04 8.70 192.5 211.6 347.5 34
Continued
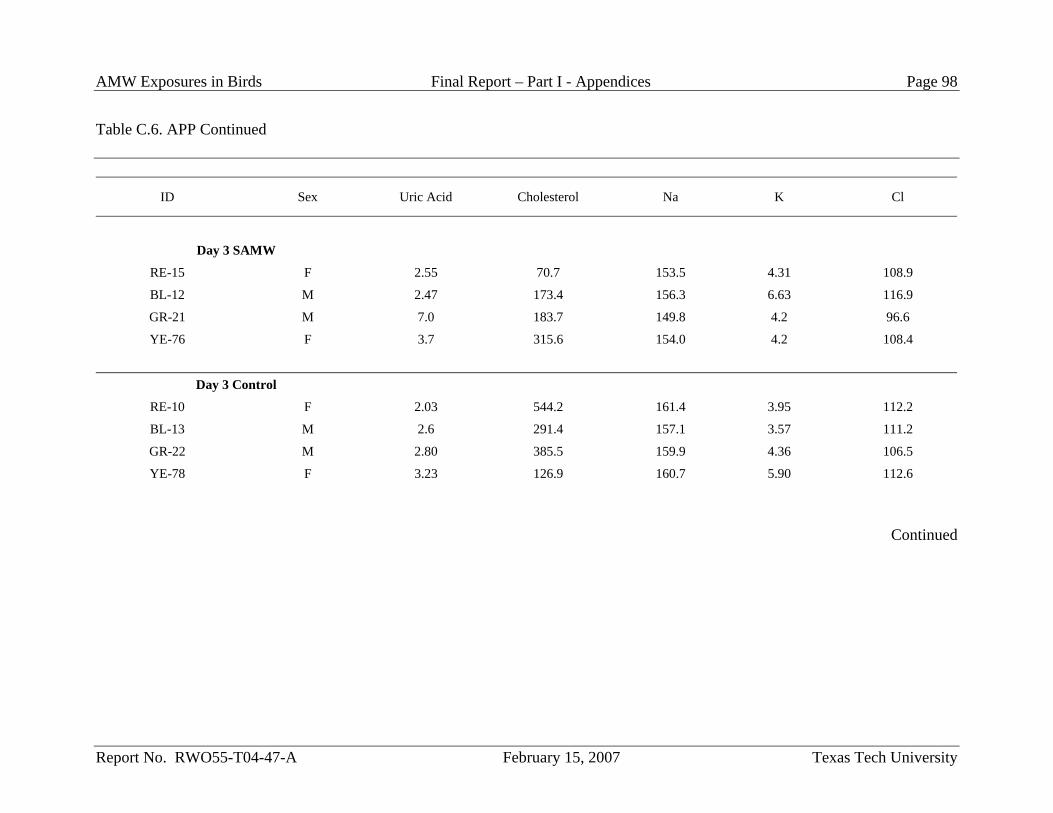
AMW Exposures in Birds Final Report – Part I - Appendices Page 98
Report No. RWO55-T04-47-A February 15, 2007 Texas Tech University
Table C.6. APP Continued
ID Sex Uric Acid Cholesterol Na K Cl
Day 3 SAMW
RE-15 F 2.55 70.7 153.5 4.31 108.9
BL-12 M 2.47 173.4 156.3 6.63 116.9
GR-21 M 7.0 183.7 149.8 4.2 96.6
YE-76 F 3.7 315.6 154.0 4.2 108.4
Day 3 Control
RE-10 F 2.03 544.2 161.4 3.95 112.2
BL-13 M 2.6 291.4 157.1 3.57 111.2
GR-22 M 2.80 385.5 159.9 4.36 106.5
YE-78 F 3.23 126.9 160.7 5.90 112.6
Continued
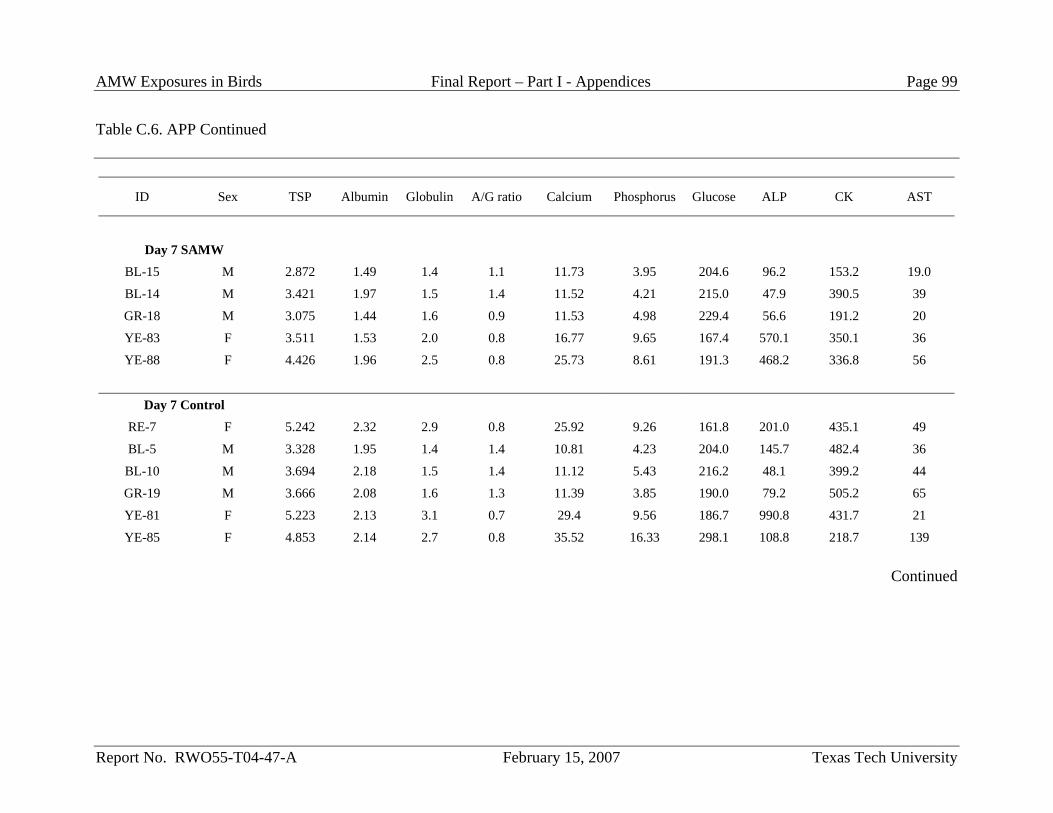
AMW Exposures in Birds Final Report – Part I - Appendices Page 99
Report No. RWO55-T04-47-A February 15, 2007 Texas Tech University
Table C.6. APP Continued
ID Sex TSP Albumin Globulin A/G ratio Calcium Phosphorus Glucose ALP CK AST
Day 7 SAMW
BL-15 M 2.872 1.49 1.4 1.1 11.73 3.95 204.6 96.2 153.2 19.0
BL-14 M 3.421 1.97 1.5 1.4 11.52 4.21 215.0 47.9 390.5 39
GR-18 M 3.075 1.44 1.6 0.9 11.53 4.98 229.4 56.6 191.2 20
YE-83 F 3.511 1.53 2.0 0.8 16.77 9.65 167.4 570.1 350.1 36
YE-88 F 4.426 1.96 2.5 0.8 25.73 8.61 191.3 468.2 336.8 56
Day 7 Control
RE-7 F 5.242 2.32 2.9 0.8 25.92 9.26 161.8 201.0 435.1 49
BL-5 M 3.328 1.95 1.4 1.4 10.81 4.23 204.0 145.7 482.4 36
BL-10 M 3.694 2.18 1.5 1.4 11.12 5.43 216.2 48.1 399.2 44
GR-19 M 3.666 2.08 1.6 1.3 11.39 3.85 190.0 79.2 505.2 65
YE-81 F 5.223 2.13 3.1 0.7 29.4 9.56 186.7 990.8 431.7 21
YE-85 F 4.853 2.14 2.7 0.8 35.52 16.33 298.1 108.8 218.7 139
Continued
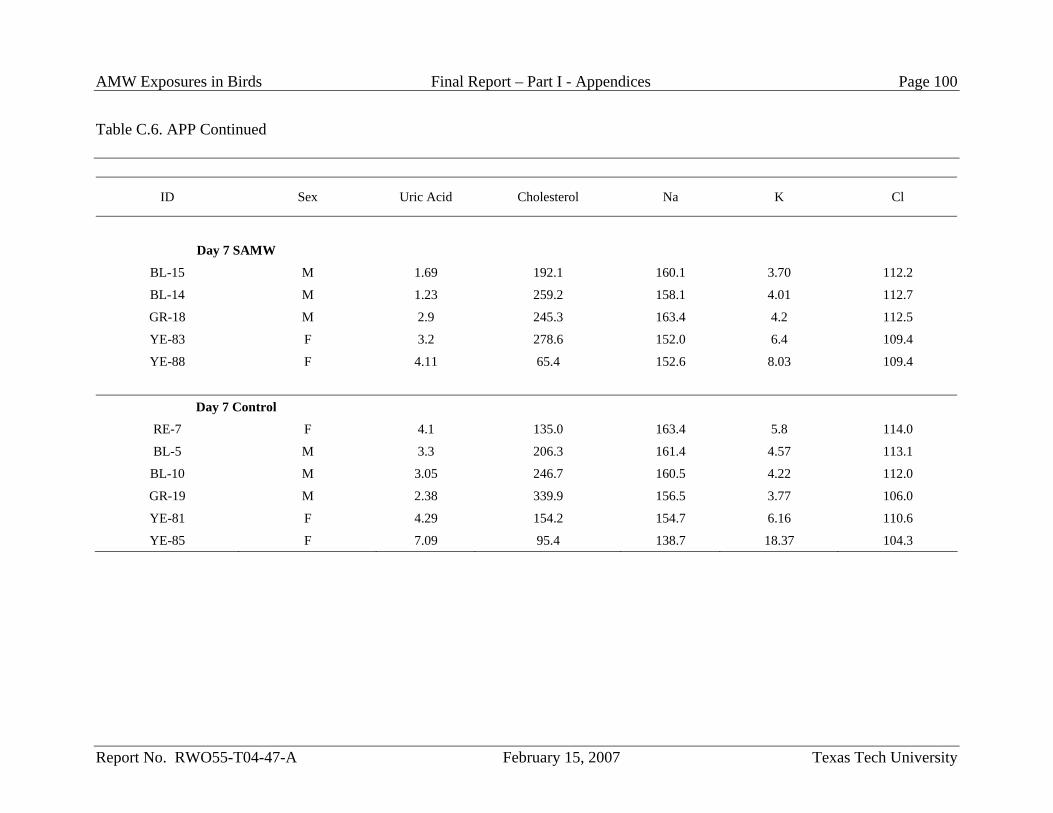
AMW Exposures in Birds Final Report – Part I - Appendices Page 100
Report No. RWO55-T04-47-A February 15, 2007 Texas Tech University
Table C.6. APP Continued
ID Sex Uric Acid Cholesterol Na K Cl
Day 7 SAMW
BL-15 M 1.69 192.1 160.1 3.70 112.2
BL-14 M 1.23 259.2 158.1 4.01 112.7
GR-18 M 2.9 245.3 163.4 4.2 112.5
YE-83 F 3.2 278.6 152.0 6.4 109.4
YE-88 F 4.11 65.4 152.6 8.03 109.4
Day 7 Control
RE-7 F 4.1 135.0 163.4 5.8 114.0
BL-5 M 3.3 206.3 161.4 4.57 113.1
BL-10 M 3.05 246.7 160.5 4.22 112.0
GR-19 M 2.38 339.9 156.5 3.77 106.0
YE-81 F 4.29 154.2 154.7 6.16 110.6
YE-85 F 7.09 95.4 138.7 18.37 104.3
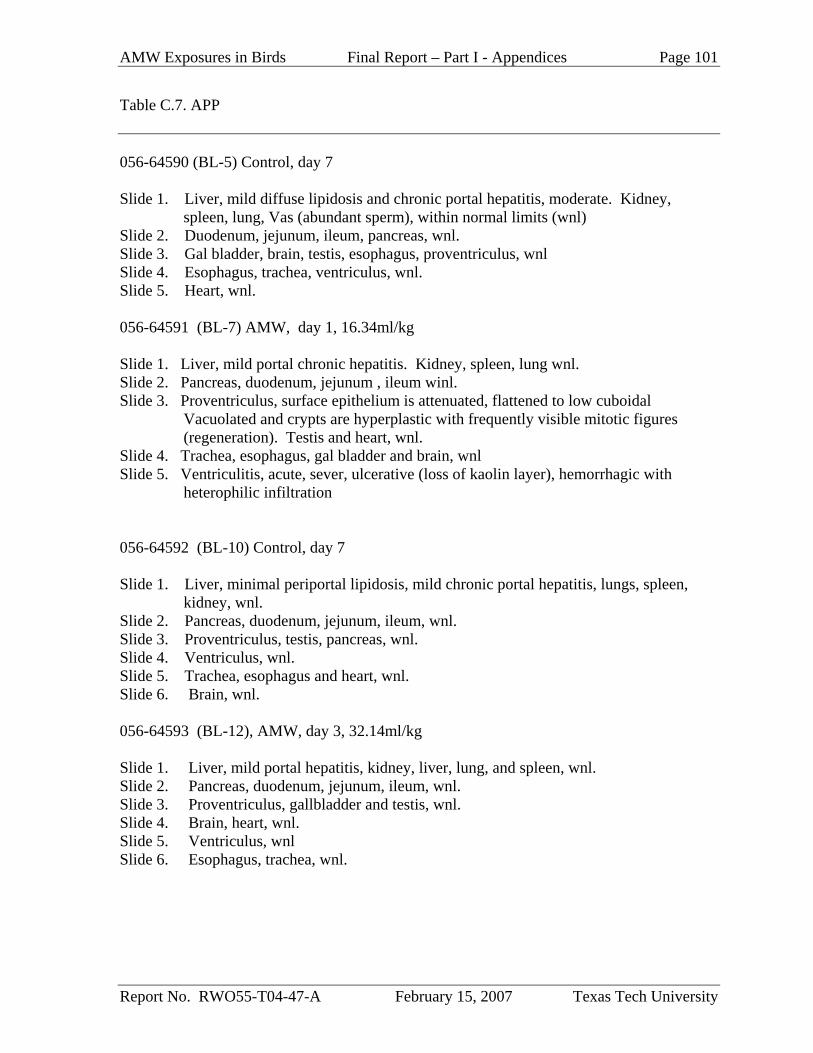
AMW Exposures in Birds Final Report – Part I - Appendices Page 101
Report No. RWO55-T04-47-A February 15, 2007 Texas Tech University
Table C.7. APP
056-64590 (BL-5) Control, day 7 Slide 1. Liver, mild diffuse lipidosis and chronic portal hepatitis, moderate. Kidney, spleen, lung, Vas (abundant sperm), within normal limits (wnl) Slide 2. Duodenum, jejunum, ileum, pancreas, wnl. Slide 3. Gal bladder, brain, testis, esophagus, proventriculus, wnl Slide 4. Esophagus, trachea, ventriculus, wnl. Slide 5. Heart, wnl. 056-64591 (BL-7) AMW, day 1, 16.34ml/kg Slide 1. Liver, mild portal chronic hepatitis. Kidney, spleen, lung wnl. Slide 2. Pancreas, duodenum, jejunum , ileum winl. Slide 3. Proventriculus, surface epithelium is attenuated, flattened to low cuboidal
Vacuolated and crypts are hyperplastic with frequently visible mitotic figures (regeneration). Testis and heart, wnl.
Slide 4. Trachea, esophagus, gal bladder and brain, wnl Slide 5. Ventriculitis, acute, sever, ulcerative (loss of kaolin layer), hemorrhagic with
heterophilic infiltration 056-64592 (BL-10) Control, day 7 Slide 1. Liver, minimal periportal lipidosis, mild chronic portal hepatitis, lungs, spleen, kidney, wnl. Slide 2. Pancreas, duodenum, jejunum, ileum, wnl. Slide 3. Proventriculus, testis, pancreas, wnl. Slide 4. Ventriculus, wnl. Slide 5. Trachea, esophagus and heart, wnl. Slide 6. Brain, wnl. 056-64593 (BL-12), AMW, day 3, 32.14ml/kg Slide 1. Liver, mild portal hepatitis, kidney, liver, lung, and spleen, wnl. Slide 2. Pancreas, duodenum, jejunum, ileum, wnl. Slide 3. Proventriculus, gallbladder and testis, wnl. Slide 4. Brain, heart, wnl. Slide 5. Ventriculus, wnl Slide 6. Esophagus, trachea, wnl.
AMW Exposures in Birds Final Report – Part I - Appendices Page 102
Report No. RWO55-T04-47-A February 15, 2007 Texas Tech University
Table C.7. APP Continued 056-64594 (BL-13), control, day 3 Slide 1. Liver, mild, chronic portal hepatitis, kidney, lung, and spleen, wnl. Slide 2. Pancreas, duodenum, jejunum, ileum, wnl. Slide 3. Proventriculus, testis, esophagus, trachea, wnl. Slide 4. Heart, brain, wnl. Slide 5. Ventriculus, gal bladder, wnl. 056-64595 (BL-14), AMW, day 7, 22.35ml/kg Slide 1. Liver, mild diffuse vacuolar change, mild chronic portal hepatitis. Kidney, spleen, lungs, wnl. Slide 2. Duodenum, pancreas, jejunum, ileum, wnl. Slide 3. Heart, brain, wnl. Slide 4. Testis, trachea, esophagus, Proventriculus - wnl. Slide 5. Gal Bladder, ventriculus, wnl. 056-64596 (BL-15), AMW, day 7, 37.39ml/kg Slide 1. Liver, moderate diffuse, vacuolar change and mild chronic portal hepatitis. Spleen, kidney and lungs, wnl. Slide 2. Pancreas, duodenum, jejunum, ileum and large intestine, wnl. Slide 3. Trachea, testis, esophagus, proventriculus, and gallbladder wnl. Slide 4. Brain and heart, wnl. Slide 5. Ventriculitis, ulcerative, heterophilic with loss of kaolin layer. There is loss of Glandular epithelium with replacement by fibrous tissue. 056-64597 (BL-16), Control, day 1 Slide 1. Liver, minimal chronic portal hepatitis, lungs, spleen and kidney, wnl. Slide 2. Pancreas, duodenum, jejunum, ileum wnl. Slide 3. Testis, proventriculus, gallbladder, wnl. Slide 4. Heart and brain, wnl. Slide 5. Ventriculus, wnl. Slide 6. Trachea and esophagus, wnl.
AMW Exposures in Birds Final Report – Part I - Appendices Page 103
Report No. RWO55-T04-47-A February 15, 2007 Texas Tech University
Table C.7. APP Continued 056-64598 (GR-16), AMW, day 1, 26.91ml/kg Slide 1. Liver, minimal chronic portal hepatitis. Kidney, vas , lungs, spleen, wnl. Slide 2. Pancreas, duodenum, jejunum, ileum, large intestine, wnl. Slide 3. Esophagus, trachea, proventriculus, testis, gallbladder, wnl. Slide 4. Brain, heart, wnl. Slide 5. Ventriculitis, hemorrhagic, heterophilic with degeneration of kaolin layer. 056-64599 (GR-17) control, day 1 Slide 1. Liver, minimal vacuolar change, diffuse and minimal chronic portal hepatitis. Lung, kidney and spleen, wnl. Slide 2. Pancreas, duodenum, jejunum, ileum, wnl. Slide 3. Trachea, gallbladder, testis, proventriculus, wnl. Slide 4. Brain, heart, wnl. Slide 5. Ventriculus, wnl. 056-64600 (GR-18) AMW, day 7, 33.4 ml/kg Slide 1. Liver, minimal chronic portal hepatitis, kidney, spleen, lungs, wnl. Slide 2. Pancreas, duodenum, jejunum, ileum, large intestine, wnl. Slide 3. Esophagus, proventriculus, trachea, wnl. Testis, seminiferous tubule necrosis, severe diffuse, subacute (approximately 4 days old) with intertstial infiltrates of macrophages, fibroblasts and heterophils. Slide 4. Heart, brain, wnl. Slide 5. Liver, ventriculus, gallbladder, wnl. 056-64601 (GR-19) Control, day 7 Slide 1. Liver, minimal diffuse fatty change, minimal chronic portal hepatitis. Kidney, vas, spleen, lungs, wnl. Slide 2. Pancreas, jejunum, ileum, duodenum, large intestine, wnl. Slide 3. Testis, glabladder, proventriculus, wnl. Slide 4. Brain, heart, wnl. Slide 5. Trachea, esophagus, wnl. Slide 6. Ventriculus, wnl.
AMW Exposures in Birds Final Report – Part I - Appendices Page 104
Report No. RWO55-T04-47-A February 15, 2007 Texas Tech University
Table C.7. APP Continued 056-64602 (GR-21) AMW, day 3, 32.89 ml/kg Slide 1. Kidney, lung, liver, and spleen, wnl. Slide 2. Pancreas, duodenum jejunum, large intestine, wnl. Slide 3. Proventriculus, minimal vacuolation in the surface epithelium. Testis, gallbladder, esophagus, wnl. Trachea, extensive artifact. Slide 4. Brain, heart, wnl. Slide 5. Ventriculus, ventriculitis, hemorrhagic and heterophilic, with degeneration and ulceration of kaolin with attenuation of glandular layer in the deepest part of the ulcer. 056-64603 (GR-22) Control, day 3 Slide 1. Liver, minimal chronic portal hepatitis. Spleen, kidney, lungs, wnl. Slide 2. Pancreas, duodenum, jejunum, ileum, large intestine. Slide 3. Trachea, esophagus, proventriculus, testis, wnl. Slide 4. Brain and heart, wnl. Slide 5. Gallbladder and ventriculus, wnl. 056-64604 (RE-1), control day 1. Slide 1. Liver, fatty change, periportal to midzonal, moderate with minimal chronic portal hepatitis. Spleen, lung, kidney, wnl. Slide 2. Pancreas, duodenum, jejunum, large intestine, wnl. Slide 3. Trachea, esophagus, proventriculus, gallbladder, wnl. Slide 4. Brain and heart, wnl. Slide 5. Ventriculus wnl. Slide 6. Ovary, wnl. 056-64605 (RE-6), AMW, day 0, 48.43ml/kg Slide 1. Liver, fatty change, mild periportal to midzonal with minimal chronic portal hepatitis. Lung, spleen, kidney, wnl. Slide 2. Pancreas, duodenum, jejunum, ileum, large intestine, wnl. Slide 3. Ovary and gallbladder wnl. Esophagus, isolated ectatic mucous gland with basophilic discoloration at ostia. Trachea, minimal submucosal mixed inflammation. Slide 4. Brain and heart, wnl Slide 5. Proventriculus, mucosal lining is extensively sloughed and surface covered by basophilic to amphophilic material. Some basophilic discoloration of connective tissue subjacent to the denuded mucosa. Ventriculus, wnl.
AMW Exposures in Birds Final Report – Part I - Appendices Page 105
Report No. RWO55-T04-47-A February 15, 2007 Texas Tech University
Table C.7. APP Continued 056-64606 (RE-7), control, day 0 Slide 1. Liver, fatty change, periportal to midzonal, mild. Minimal chronic portal hepatitis. Kidney, lungs, spleen, wnl. Slide 2. Pancreas, duodenum, jejunum, ileum, large intestine, wnl. Slide 3. Trachea, esophagus, ovary, wnl. Slide 4. Brain, heart, wnl. Slide 5. Proventriculus, ventriculus, wnl. 056-64607 (RE-9), AMW, day 0, 31.62 ml/kg Slide 1. Liver, chronic portal hepatitis, minimal. Kidney, lung, spleen, wnl. Slide 2. Pancreas, duodenum, jejunum, ileum, wnl. Slide 3. Esophagus, numerous dilated and ectatic submucosal mucous glands with presence of degenerate cells in the lumina. The ostia contain basophilic substance. Trachea, mucosa in attenuated in extensive areas (single layer of flattened cells. Marked heterophilic infiltrate in the lumen and submucosa. Galbladder, wnl. Slide 4. Brain, heart, wnl. Slide 5. Proventriculus, erosion to ulceration of surface epithelium. Many crypts are attenuated, dilated and filled with necrotic debris. Ventriculus, extensive ulceration of kaolin layer with subjacent hemorrhage and necrosis of glandular epithelium. Minimal inflammation (peracute condition). 056-64608 (RE-10), control, day 3. Slide 1. Liver, vacuolar change, mild diffuse. Kidney, spleen, lungs, wnl. Slide 2. Ovary, esophagus, trachea, wnl. Slide 3. Heart and brain, wnl. Slide 4. Proventriculus and ventriculus, wnl. Slide 5. Pancreas, duodenum, jejunum, ileum, wnl. 056-64609 (RE-12) control, day 1. Slide 1. Liver, minimal diffuse, vacuolar change and minimal chronic portal hepatitis. Lungs, spleen, kidney, wnl. Slide 2. Pancreas, duodenum, jejunum, large intestine, wnl. Slide 3. Ovary, trachea , esophagus, gallbladder, wnl. Slide 4. Heart wnl. Slide 5. Ventriculus and proventriculus, wnl.
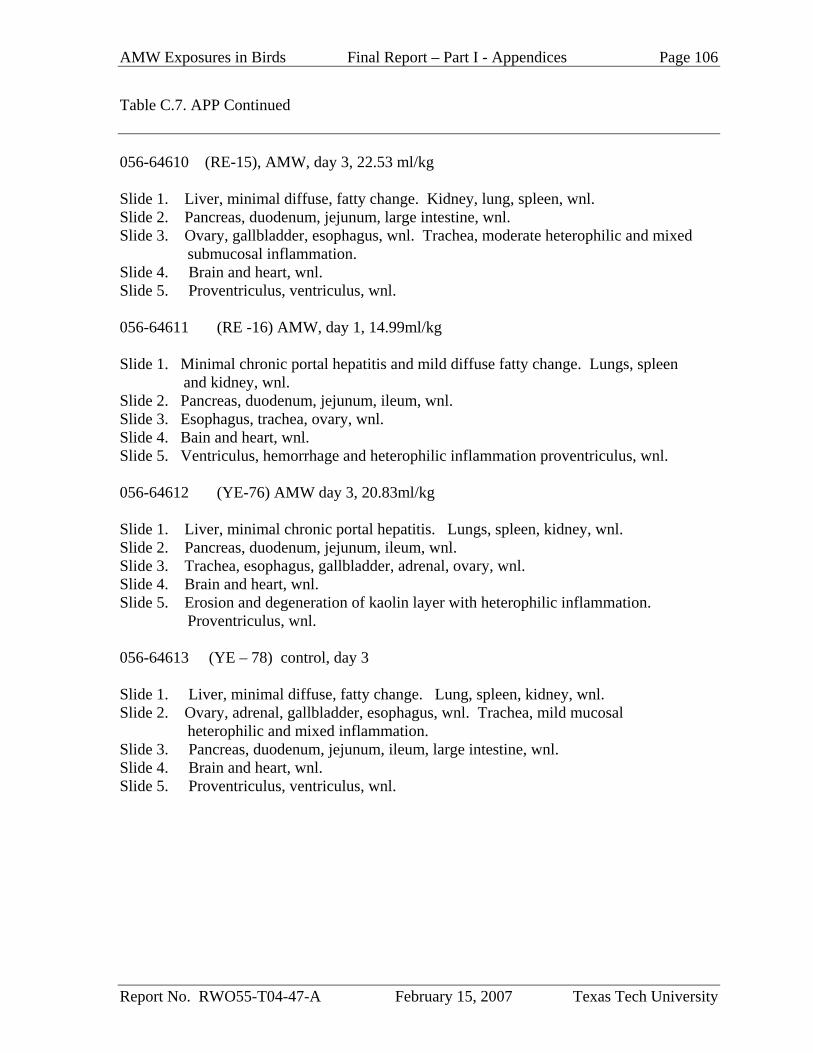
AMW Exposures in Birds Final Report – Part I - Appendices Page 106
Report No. RWO55-T04-47-A February 15, 2007 Texas Tech University
Table C.7. APP Continued 056-64610 (RE-15), AMW, day 3, 22.53 ml/kg Slide 1. Liver, minimal diffuse, fatty change. Kidney, lung, spleen, wnl. Slide 2. Pancreas, duodenum, jejunum, large intestine, wnl. Slide 3. Ovary, gallbladder, esophagus, wnl. Trachea, moderate heterophilic and mixed submucosal inflammation. Slide 4. Brain and heart, wnl. Slide 5. Proventriculus, ventriculus, wnl. 056-64611 (RE -16) AMW, day 1, 14.99ml/kg Slide 1. Minimal chronic portal hepatitis and mild diffuse fatty change. Lungs, spleen and kidney, wnl. Slide 2. Pancreas, duodenum, jejunum, ileum, wnl. Slide 3. Esophagus, trachea, ovary, wnl. Slide 4. Bain and heart, wnl. Slide 5. Ventriculus, hemorrhage and heterophilic inflammation proventriculus, wnl. 056-64612 (YE-76) AMW day 3, 20.83ml/kg Slide 1. Liver, minimal chronic portal hepatitis. Lungs, spleen, kidney, wnl. Slide 2. Pancreas, duodenum, jejunum, ileum, wnl. Slide 3. Trachea, esophagus, gallbladder, adrenal, ovary, wnl. Slide 4. Brain and heart, wnl. Slide 5. Erosion and degeneration of kaolin layer with heterophilic inflammation. Proventriculus, wnl. 056-64613 (YE – 78) control, day 3 Slide 1. Liver, minimal diffuse, fatty change. Lung, spleen, kidney, wnl. Slide 2. Ovary, adrenal, gallbladder, esophagus, wnl. Trachea, mild mucosal heterophilic and mixed inflammation. Slide 3. Pancreas, duodenum, jejunum, ileum, large intestine, wnl. Slide 4. Brain and heart, wnl. Slide 5. Proventriculus, ventriculus, wnl.
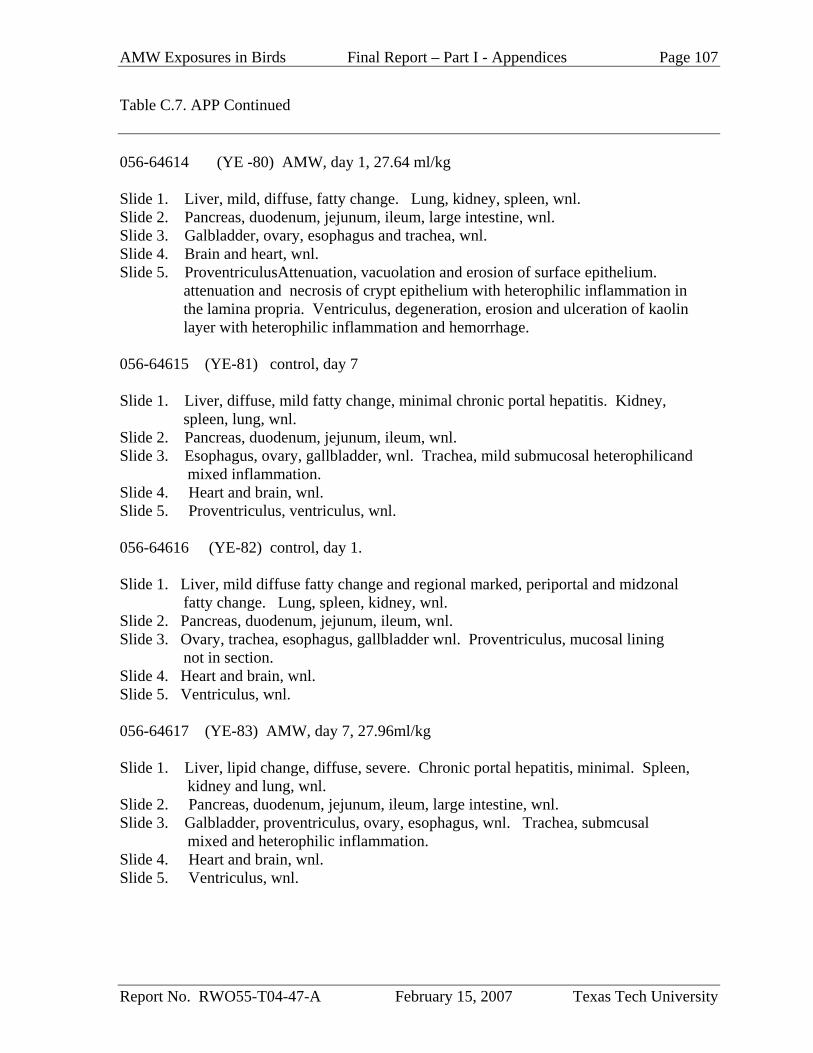
AMW Exposures in Birds Final Report – Part I - Appendices Page 107
Report No. RWO55-T04-47-A February 15, 2007 Texas Tech University
Table C.7. APP Continued 056-64614 (YE -80) AMW, day 1, 27.64 ml/kg Slide 1. Liver, mild, diffuse, fatty change. Lung, kidney, spleen, wnl. Slide 2. Pancreas, duodenum, jejunum, ileum, large intestine, wnl. Slide 3. Galbladder, ovary, esophagus and trachea, wnl. Slide 4. Brain and heart, wnl. Slide 5. ProventriculusAttenuation, vacuolation and erosion of surface epithelium.
attenuation and necrosis of crypt epithelium with heterophilic inflammation in the lamina propria. Ventriculus, degeneration, erosion and ulceration of kaolin layer with heterophilic inflammation and hemorrhage.
056-64615 (YE-81) control, day 7 Slide 1. Liver, diffuse, mild fatty change, minimal chronic portal hepatitis. Kidney, spleen, lung, wnl. Slide 2. Pancreas, duodenum, jejunum, ileum, wnl. Slide 3. Esophagus, ovary, gallbladder, wnl. Trachea, mild submucosal heterophilicand mixed inflammation. Slide 4. Heart and brain, wnl. Slide 5. Proventriculus, ventriculus, wnl. 056-64616 (YE-82) control, day 1. Slide 1. Liver, mild diffuse fatty change and regional marked, periportal and midzonal fatty change. Lung, spleen, kidney, wnl. Slide 2. Pancreas, duodenum, jejunum, ileum, wnl. Slide 3. Ovary, trachea, esophagus, gallbladder wnl. Proventriculus, mucosal lining not in section. Slide 4. Heart and brain, wnl. Slide 5. Ventriculus, wnl. 056-64617 (YE-83) AMW, day 7, 27.96ml/kg Slide 1. Liver, lipid change, diffuse, severe. Chronic portal hepatitis, minimal. Spleen, kidney and lung, wnl. Slide 2. Pancreas, duodenum, jejunum, ileum, large intestine, wnl. Slide 3. Galbladder, proventriculus, ovary, esophagus, wnl. Trachea, submcusal mixed and heterophilic inflammation. Slide 4. Heart and brain, wnl. Slide 5. Ventriculus, wnl.
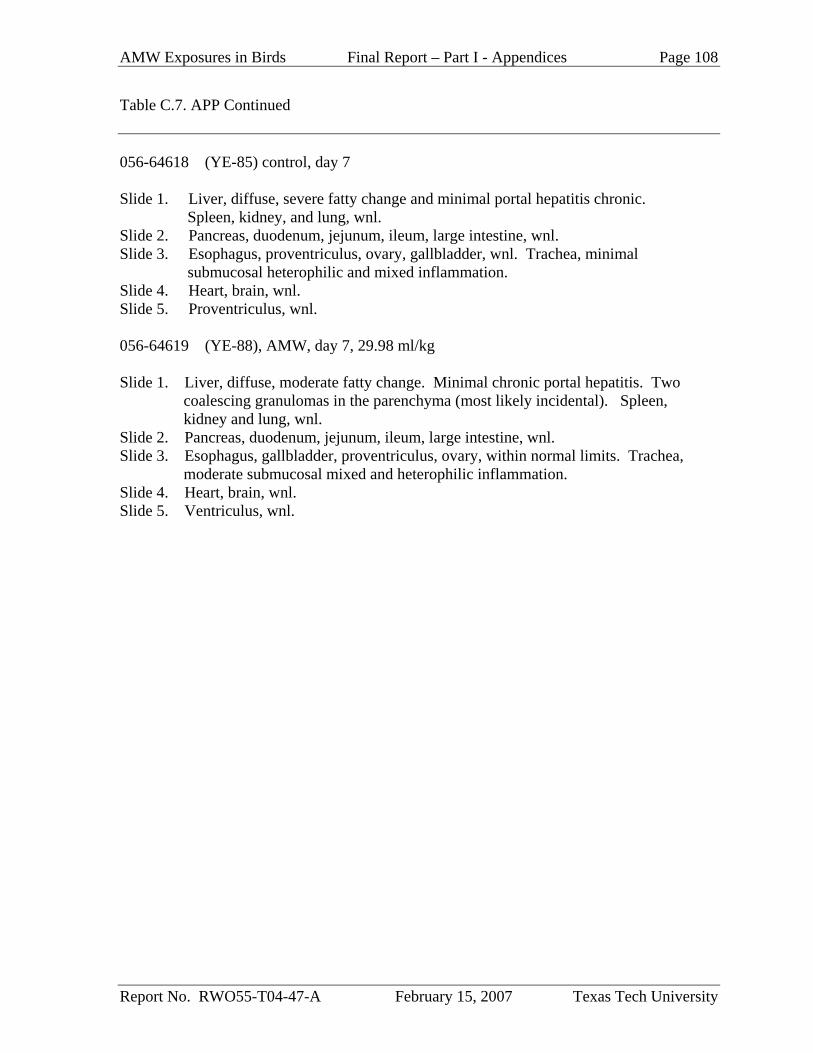
AMW Exposures in Birds Final Report – Part I - Appendices Page 108
Report No. RWO55-T04-47-A February 15, 2007 Texas Tech University
Table C.7. APP Continued 056-64618 (YE-85) control, day 7 Slide 1. Liver, diffuse, severe fatty change and minimal portal hepatitis chronic. Spleen, kidney, and lung, wnl. Slide 2. Pancreas, duodenum, jejunum, ileum, large intestine, wnl. Slide 3. Esophagus, proventriculus, ovary, gallbladder, wnl. Trachea, minimal submucosal heterophilic and mixed inflammation. Slide 4. Heart, brain, wnl. Slide 5. Proventriculus, wnl. 056-64619 (YE-88), AMW, day 7, 29.98 ml/kg Slide 1. Liver, diffuse, moderate fatty change. Minimal chronic portal hepatitis. Two coalescing granulomas in the parenchyma (most likely incidental). Spleen, kidney and lung, wnl. Slide 2. Pancreas, duodenum, jejunum, ileum, large intestine, wnl. Slide 3. Esophagus, gallbladder, proventriculus, ovary, within normal limits. Trachea, moderate submucosal mixed and heterophilic inflammation. Slide 4. Heart, brain, wnl. Slide 5. Ventriculus, wnl.
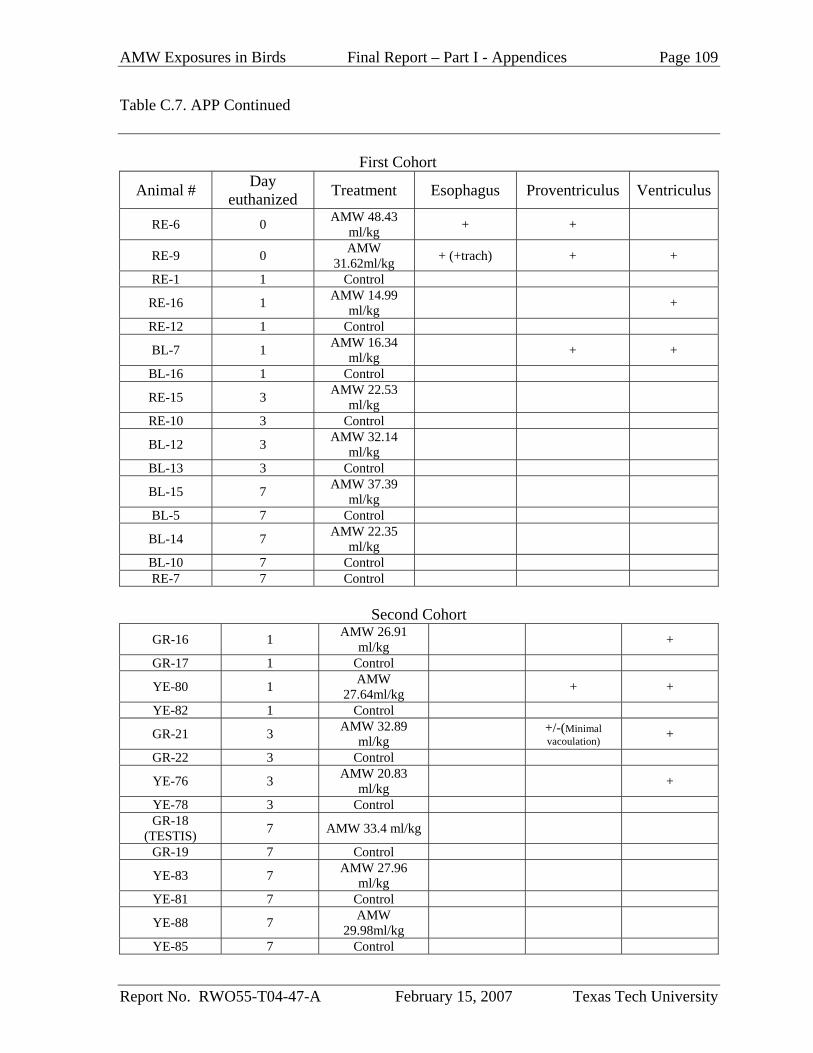
AMW Exposures in Birds Final Report – Part I - Appendices Page 109
Report No. RWO55-T04-47-A February 15, 2007 Texas Tech University
Table C.7. APP Continued First Cohort
Animal # Day euthanized Treatment Esophagus Proventriculus Ventriculus
RE-6 0 AMW 48.43 ml/kg + +
RE-9 0 AMW 31.62ml/kg + (+trach) + +
RE-1 1 Control
RE-16 1 AMW 14.99 ml/kg +
RE-12 1 Control
BL-7 1 AMW 16.34 ml/kg + +
BL-16 1 Control
RE-15 3 AMW 22.53 ml/kg
RE-10 3 Control
BL-12 3 AMW 32.14 ml/kg
BL-13 3 Control
BL-15 7 AMW 37.39 ml/kg
BL-5 7 Control
BL-14 7 AMW 22.35 ml/kg
BL-10 7 Control RE-7 7 Control
Second Cohort
GR-16 1 AMW 26.91 ml/kg +
GR-17 1 Control
YE-80 1 AMW 27.64ml/kg + +
YE-82 1 Control
GR-21 3 AMW 32.89 ml/kg +/-(Minimal
vacoulation) +
GR-22 3 Control
YE-76 3 AMW 20.83 ml/kg +
YE-78 3 Control GR-18
(TESTIS) 7 AMW 33.4 ml/kg
GR-19 7 Control
YE-83 7 AMW 27.96 ml/kg
YE-81 7 Control
YE-88 7 AMW 29.98ml/kg
YE-85 7 Control
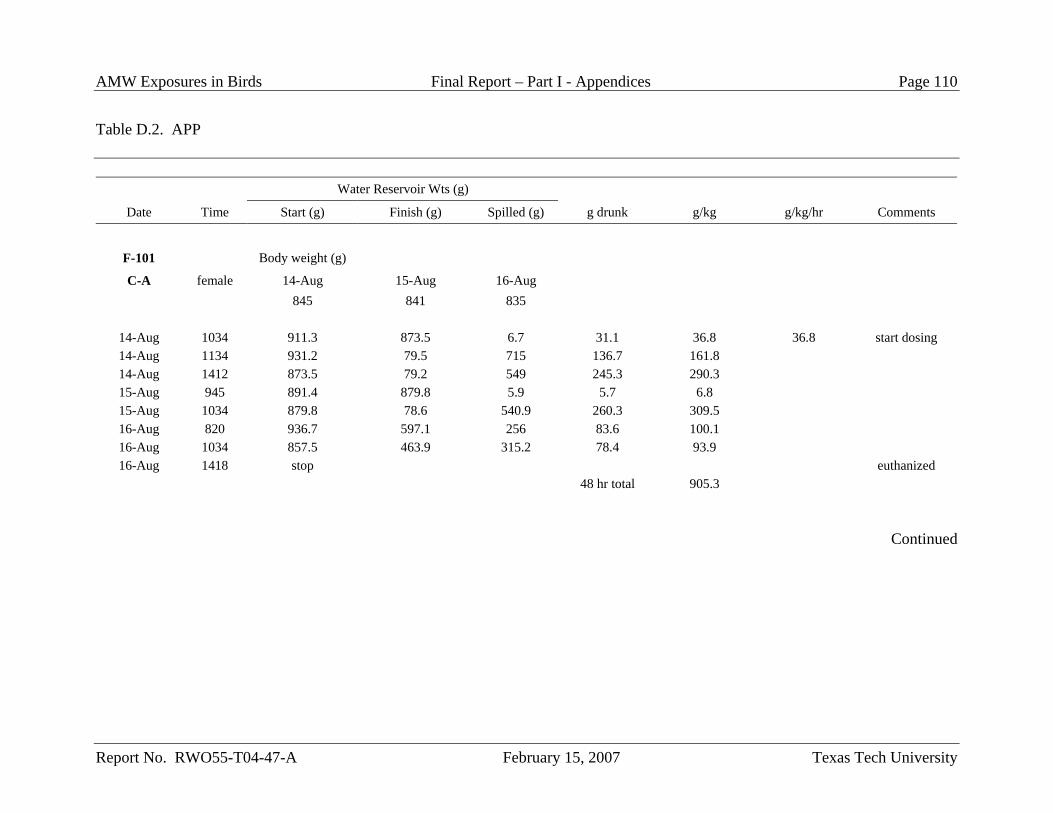
AMW Exposures in Birds Final Report – Part I - Appendices Page 110
Report No. RWO55-T04-47-A February 15, 2007 Texas Tech University
Table D.2. APP
Water Reservoir Wts (g)
Date Time Start (g) Finish (g) Spilled (g) g drunk g/kg g/kg/hr Comments
F-101 Body weight (g)
C-A female 14-Aug 15-Aug 16-Aug 845 841 835
14-Aug 1034 911.3 873.5 6.7 31.1 36.8 36.8 start dosing 14-Aug 1134 931.2 79.5 715 136.7 161.8 14-Aug 1412 873.5 79.2 549 245.3 290.3 15-Aug 945 891.4 879.8 5.9 5.7 6.8 15-Aug 1034 879.8 78.6 540.9 260.3 309.5 16-Aug 820 936.7 597.1 256 83.6 100.1 16-Aug 1034 857.5 463.9 315.2 78.4 93.9 16-Aug 1418 stop euthanized
48 hr total 905.3
Continued
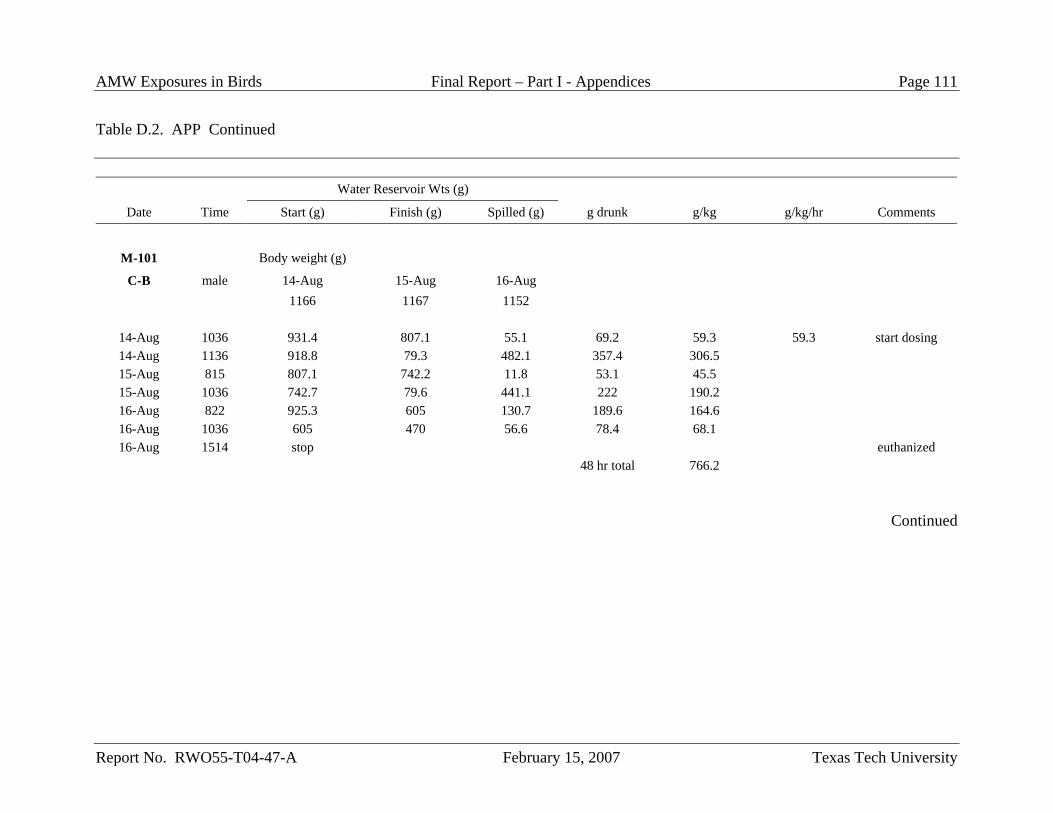
AMW Exposures in Birds Final Report – Part I - Appendices Page 111
Report No. RWO55-T04-47-A February 15, 2007 Texas Tech University
Table D.2. APP Continued
Water Reservoir Wts (g)
Date Time Start (g) Finish (g) Spilled (g) g drunk g/kg g/kg/hr Comments
M-101 Body weight (g)
C-B male 14-Aug 15-Aug 16-Aug 1166 1167 1152
14-Aug 1036 931.4 807.1 55.1 69.2 59.3 59.3 start dosing 14-Aug 1136 918.8 79.3 482.1 357.4 306.5 15-Aug 815 807.1 742.2 11.8 53.1 45.5 15-Aug 1036 742.7 79.6 441.1 222 190.2 16-Aug 822 925.3 605 130.7 189.6 164.6 16-Aug 1036 605 470 56.6 78.4 68.1 16-Aug 1514 stop euthanized
48 hr total 766.2
Continued
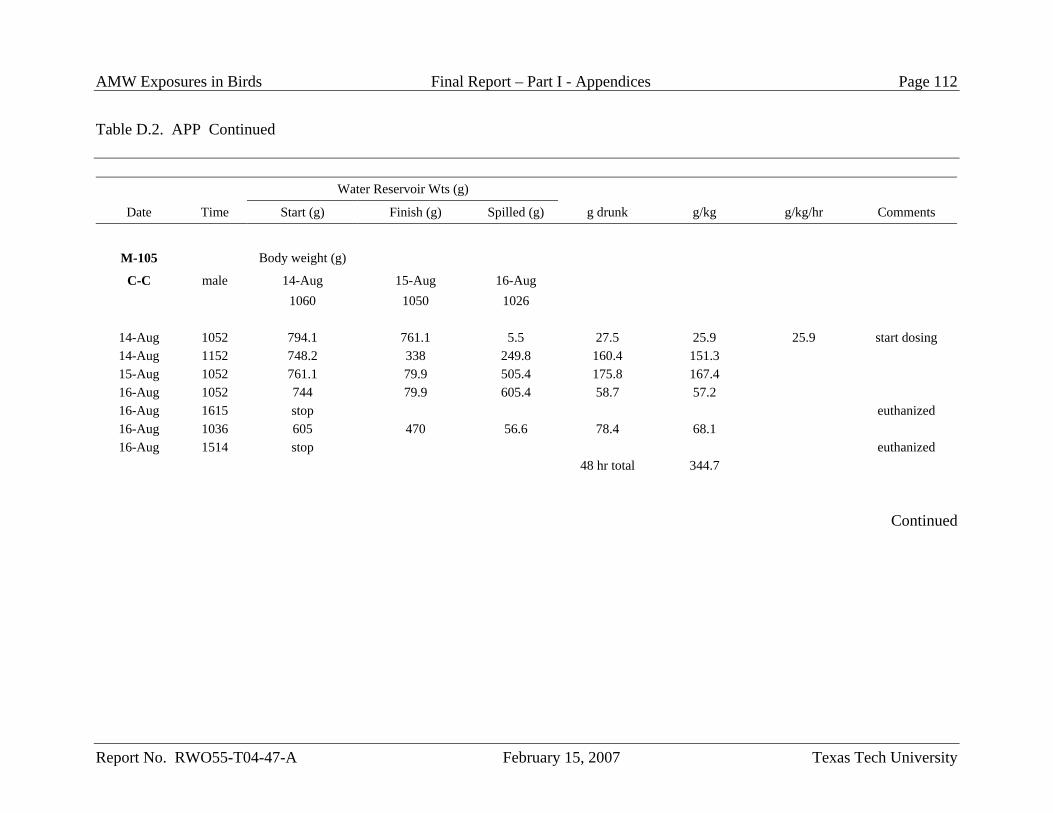
AMW Exposures in Birds Final Report – Part I - Appendices Page 112
Report No. RWO55-T04-47-A February 15, 2007 Texas Tech University
Table D.2. APP Continued
Water Reservoir Wts (g)
Date Time Start (g) Finish (g) Spilled (g) g drunk g/kg g/kg/hr Comments
M-105 Body weight (g)
C-C male 14-Aug 15-Aug 16-Aug 1060 1050 1026
14-Aug 1052 794.1 761.1 5.5 27.5 25.9 25.9 start dosing 14-Aug 1152 748.2 338 249.8 160.4 151.3 15-Aug 1052 761.1 79.9 505.4 175.8 167.4 16-Aug 1052 744 79.9 605.4 58.7 57.2 16-Aug 1615 stop euthanized 16-Aug 1036 605 470 56.6 78.4 68.1 16-Aug 1514 stop euthanized
48 hr total 344.7
Continued

AMW Exposures in Birds Final Report – Part I - Appendices Page 113
Report No. RWO55-T04-47-A February 15, 2007 Texas Tech University
Table D.2. APP Continued
Water Reservoir Wts (g)
Date Time Start (g) Finish (g) Spilled (g) g drunk g/kg g/kg/hr Comments
F-107 Body weight (g)
C-D male 14-Aug 15-Aug 16-Aug 1030 1021 1017
14-Aug 1056 919.3 889.8 1.5 28 27.2 27.2 start dosing 14-Aug 1156 875.3 249.8 221.4 404.1 392.3 15-Aug 1056 889.8 526.1 62.2 301.5 295.3 16-Aug 1056 526.1 476.4 2.5 47.2 46.4 16-Aug 1514 stop euthanized
48 hr total 714.8
Continued

AMW Exposures in Birds Final Report – Part I - Appendices Page 114
Report No. RWO55-T04-47-A February 15, 2007 Texas Tech University
Table D.2. APP Continued
Water Reservoir Wts (g)
Date Time Start (g) Finish (g) Spilled (g) g drunk g/kg g/kg/hr Comments
M-111 Body weight (g)
C-E male 22-Aug 23-Aug 24-Aug 1098 1094 1070
22-Aug 1014 845.3 803 9.5 32.8 29.9 29.9 start dosing 22-Aug 1114 894.7 396.1 207.7 290.9 264.9 23-Aug 1014 906.1 394.5 316.8 194.8 178.1 24-Aug 1014 394.5 353.5 13 28 26.2
24-Aug 1524 stop euthanzied @ 1524
48 hr total 472.9
Continued
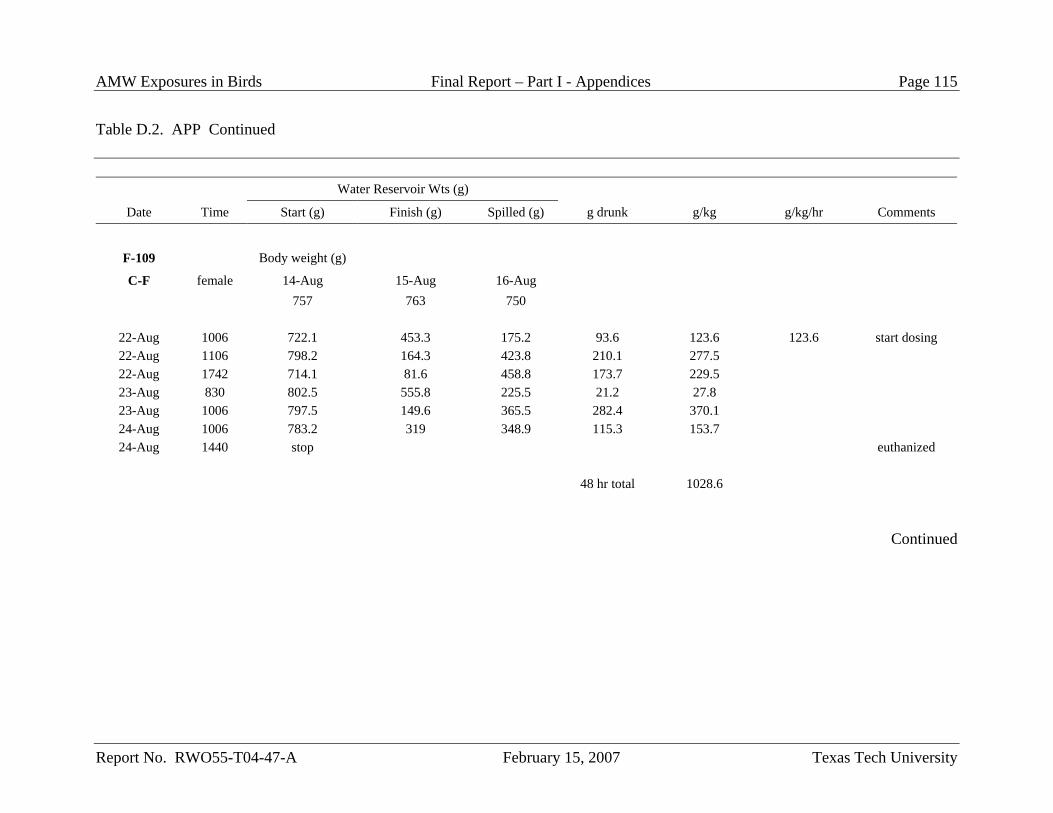
AMW Exposures in Birds Final Report – Part I - Appendices Page 115
Report No. RWO55-T04-47-A February 15, 2007 Texas Tech University
Table D.2. APP Continued
Water Reservoir Wts (g)
Date Time Start (g) Finish (g) Spilled (g) g drunk g/kg g/kg/hr Comments
F-109 Body weight (g)
C-F female 14-Aug 15-Aug 16-Aug 757 763 750
22-Aug 1006 722.1 453.3 175.2 93.6 123.6 123.6 start dosing 22-Aug 1106 798.2 164.3 423.8 210.1 277.5 22-Aug 1742 714.1 81.6 458.8 173.7 229.5 23-Aug 830 802.5 555.8 225.5 21.2 27.8 23-Aug 1006 797.5 149.6 365.5 282.4 370.1 24-Aug 1006 783.2 319 348.9 115.3 153.7 24-Aug 1440 stop euthanized
48 hr total 1028.6
Continued
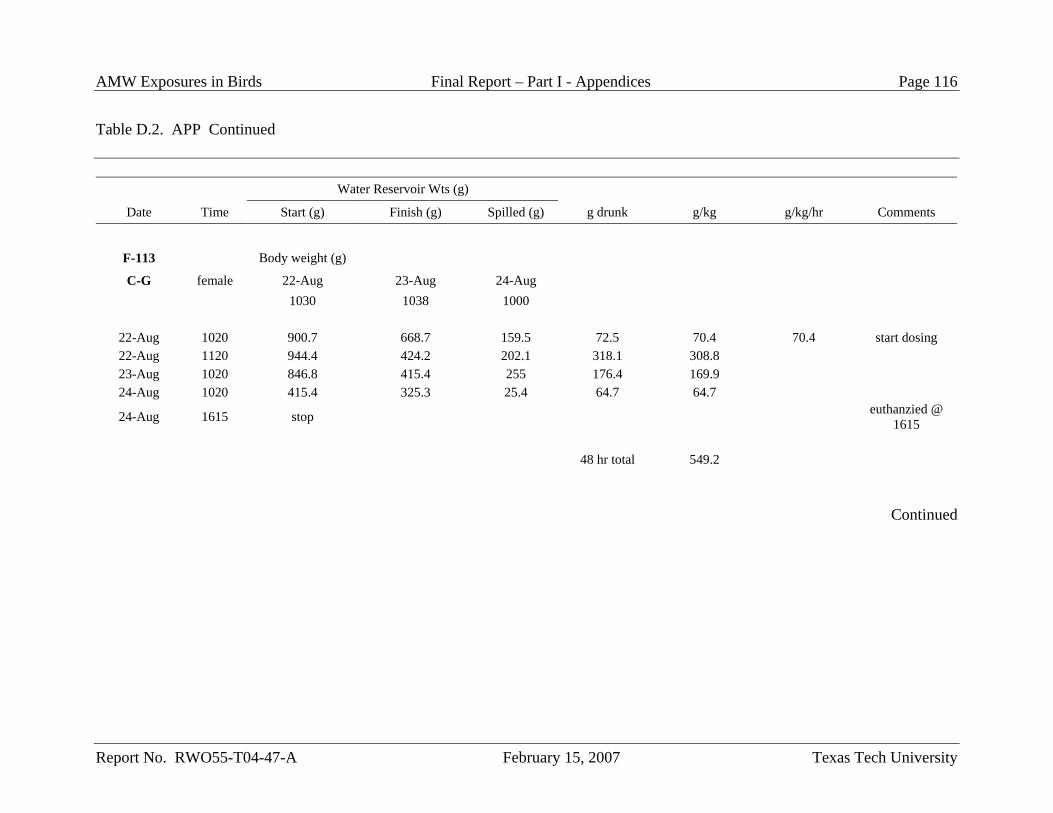
AMW Exposures in Birds Final Report – Part I - Appendices Page 116
Report No. RWO55-T04-47-A February 15, 2007 Texas Tech University
Table D.2. APP Continued
Water Reservoir Wts (g)
Date Time Start (g) Finish (g) Spilled (g) g drunk g/kg g/kg/hr Comments
F-113 Body weight (g)
C-G female 22-Aug 23-Aug 24-Aug 1030 1038 1000
22-Aug 1020 900.7 668.7 159.5 72.5 70.4 70.4 start dosing 22-Aug 1120 944.4 424.2 202.1 318.1 308.8 23-Aug 1020 846.8 415.4 255 176.4 169.9 24-Aug 1020 415.4 325.3 25.4 64.7 64.7
24-Aug 1615 stop euthanzied @ 1615
48 hr total 549.2
Continued
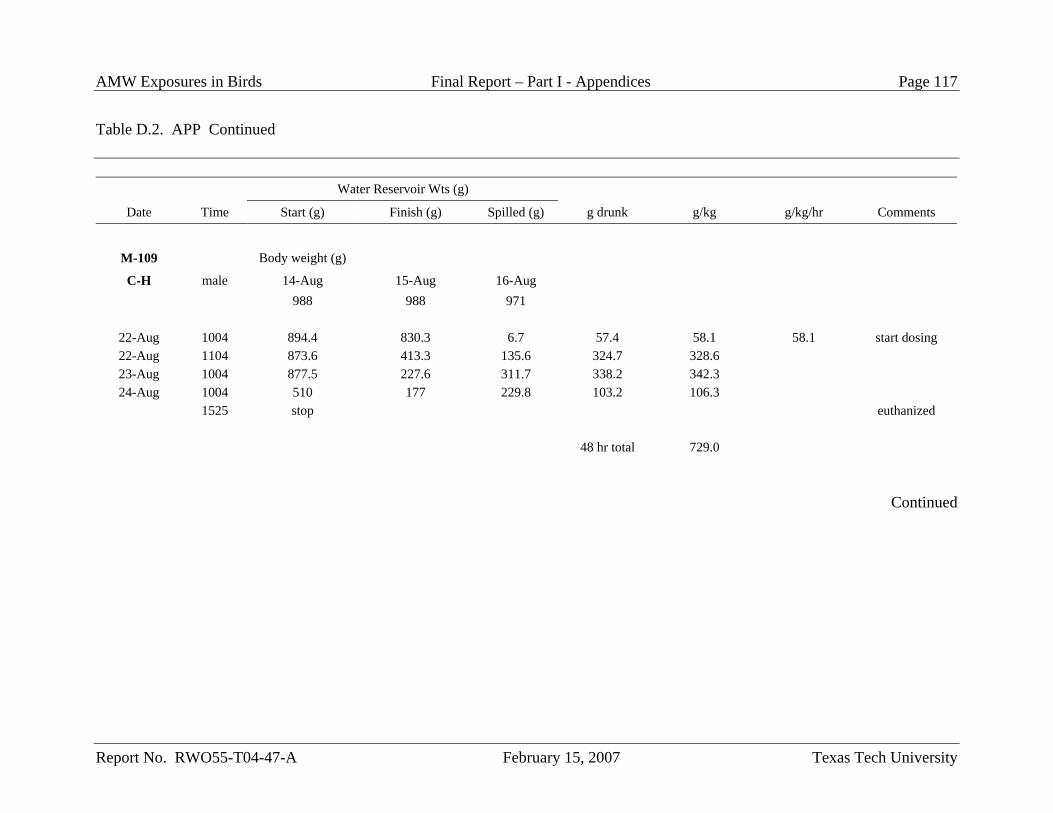
AMW Exposures in Birds Final Report – Part I - Appendices Page 117
Report No. RWO55-T04-47-A February 15, 2007 Texas Tech University
Table D.2. APP Continued
Water Reservoir Wts (g)
Date Time Start (g) Finish (g) Spilled (g) g drunk g/kg g/kg/hr Comments
M-109 Body weight (g)
C-H male 14-Aug 15-Aug 16-Aug 988 988 971
22-Aug 1004 894.4 830.3 6.7 57.4 58.1 58.1 start dosing 22-Aug 1104 873.6 413.3 135.6 324.7 328.6 23-Aug 1004 877.5 227.6 311.7 338.2 342.3 24-Aug 1004 510 177 229.8 103.2 106.3
1525 stop euthanized 48 hr total 729.0
Continued
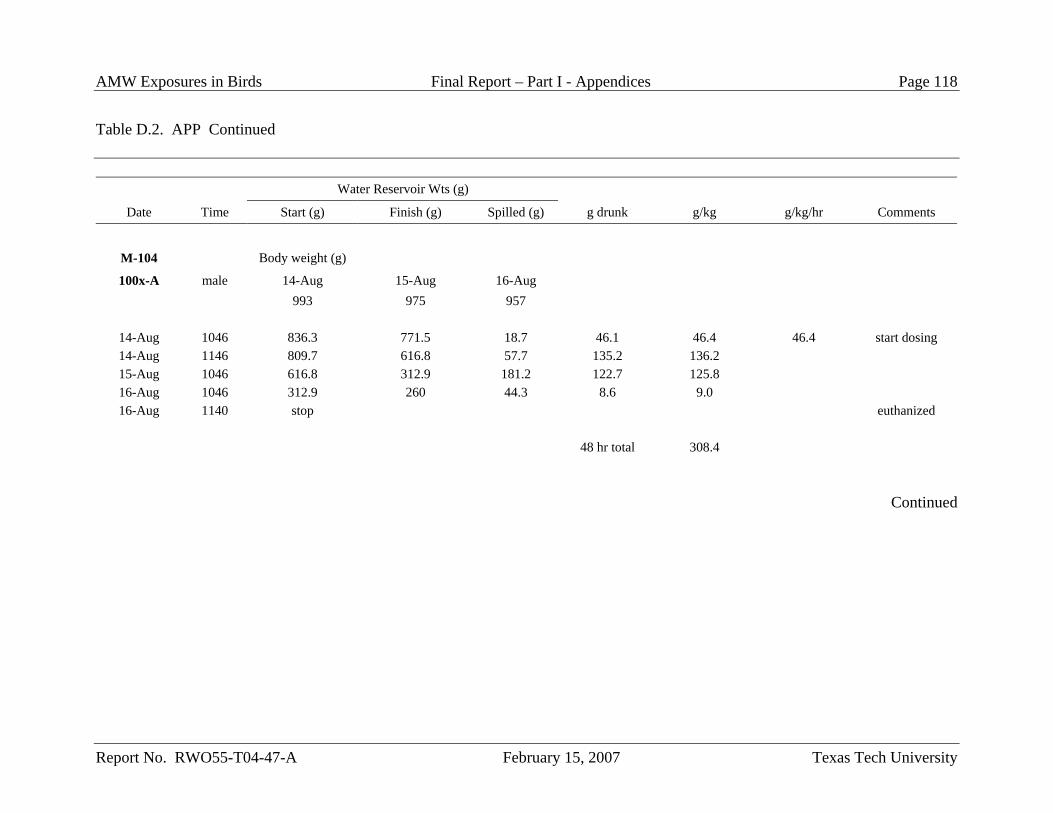
AMW Exposures in Birds Final Report – Part I - Appendices Page 118
Report No. RWO55-T04-47-A February 15, 2007 Texas Tech University
Table D.2. APP Continued
Water Reservoir Wts (g)
Date Time Start (g) Finish (g) Spilled (g) g drunk g/kg g/kg/hr Comments
M-104 Body weight (g)
100x-A male 14-Aug 15-Aug 16-Aug 993 975 957
14-Aug 1046 836.3 771.5 18.7 46.1 46.4 46.4 start dosing 14-Aug 1146 809.7 616.8 57.7 135.2 136.2 15-Aug 1046 616.8 312.9 181.2 122.7 125.8 16-Aug 1046 312.9 260 44.3 8.6 9.0 16-Aug 1140 stop euthanized
48 hr total 308.4
Continued
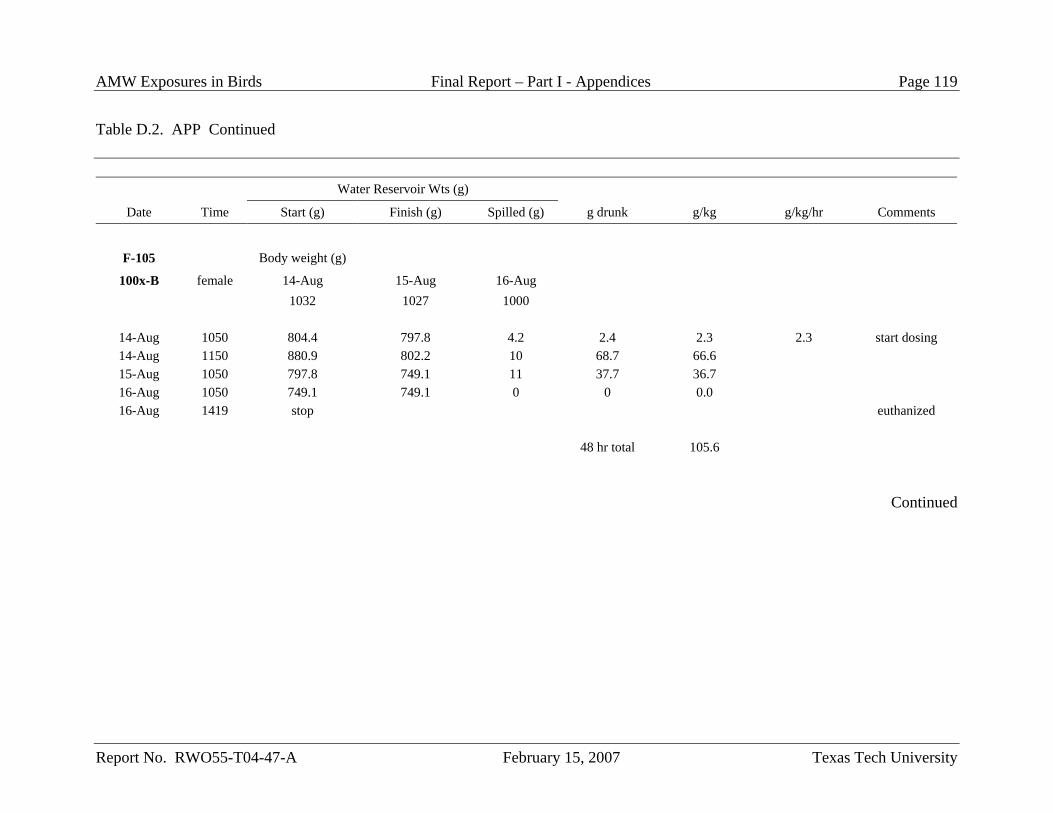
AMW Exposures in Birds Final Report – Part I - Appendices Page 119
Report No. RWO55-T04-47-A February 15, 2007 Texas Tech University
Table D.2. APP Continued
Water Reservoir Wts (g)
Date Time Start (g) Finish (g) Spilled (g) g drunk g/kg g/kg/hr Comments
F-105 Body weight (g)
100x-B female 14-Aug 15-Aug 16-Aug 1032 1027 1000
14-Aug 1050 804.4 797.8 4.2 2.4 2.3 2.3 start dosing 14-Aug 1150 880.9 802.2 10 68.7 66.6 15-Aug 1050 797.8 749.1 11 37.7 36.7 16-Aug 1050 749.1 749.1 0 0 0.0 16-Aug 1419 stop euthanized
48 hr total 105.6
Continued

AMW Exposures in Birds Final Report – Part I - Appendices Page 120
Report No. RWO55-T04-47-A February 15, 2007 Texas Tech University
Table D.2. APP Continued
Water Reservoir Wts (g)
Date Time Start (g) Finish (g) Spilled (g) g drunk g/kg g/kg/hr Comments
F-106 Body weight (g)
100x-C female 14-Aug 15-Aug 16-Aug 958 945 927
14-Aug 1058 916.8 860.5 41.4 14.9 15.6 15.6 start dosing 14-Aug 1158 888 710.6 82.8 94.6 98.7 15-Aug 1058 860.5 632.6 106.6 121.3 128.4 16-Aug 1058 632.6 530.2 86.1 16.3 17.6 16-Aug 1325 stop euthanized
48 hr total 242.7
Continued

AMW Exposures in Birds Final Report – Part I - Appendices Page 121
Report No. RWO55-T04-47-A February 15, 2007 Texas Tech University
Table D.2. APP Continued
Water Reservoir Wts (g)
Date Time Start (g) Finish (g) Spilled (g) g drunk g/kg g/kg/hr Comments
M-107 Body weight (g)
100x-D male 14-Aug 15-Aug 16-Aug 1244 1236 1226
14-Aug 1100 878.5 848.7 4.5 25.3 20.3 20.3 start dosing 14-Aug 1200 908.3 665 90.7 152.6 122.7 15-Aug 1100 848.7 654.4 72.2 122.1 98.8 16-Aug 1100 654.4 624.7 14.7 15 12.2 16-Aug 1330 stop euthanized
48 hr total 241.8
Continued

AMW Exposures in Birds Final Report – Part I - Appendices Page 122
Report No. RWO55-T04-47-A February 15, 2007 Texas Tech University
Table D.2. APP Continued
Water Reservoir Wts (g)
Date Time Start (g) Finish (g) Spilled (g) g drunk g/kg g/kg/hr Comments
M-112 Body weight (g)
100x-E male 22-Aug 23-Aug 24-Aug 968 944 918
22-Aug 1016 899.8 826.2 22.1 51.5 53.2 53.2 start dosing 22-Aug 1116 936.6 882 17.1 37.5 38.7 23-Aug 1016 882 831.1 15.5 35.4 37.5 24-Aug 1016 831.1 824.3 3.8 3 3.3
24-Aug 1339 stop euthanzied @ 1339
48 hr total 129.4
Continued

AMW Exposures in Birds Final Report – Part I - Appendices Page 123
Report No. RWO55-T04-47-A February 15, 2007 Texas Tech University
Table D.2. APP Continued
Water Reservoir Wts (g)
Date Time Start (g) Finish (g) Spilled (g) g drunk g/kg g/kg/hr Comments
F-114 Body weight (g)
100x-F female 22-Aug 23-Aug 24-Aug 1002 989 974
22-Aug 1024 930.6 877.8 19.5 33.3 33.2 33.2 start dosing 22-Aug 1124 821.2 644.3 35.7 141.2 140.9 23-Aug 1024 644.3 227.3 256.4 160.6 162.4 24-Aug 1024 227.3 136.1 17.7 73.5 75.5
24-Aug 1345 stop euthanzied @ 1345
48 hr total 336.5
Continued
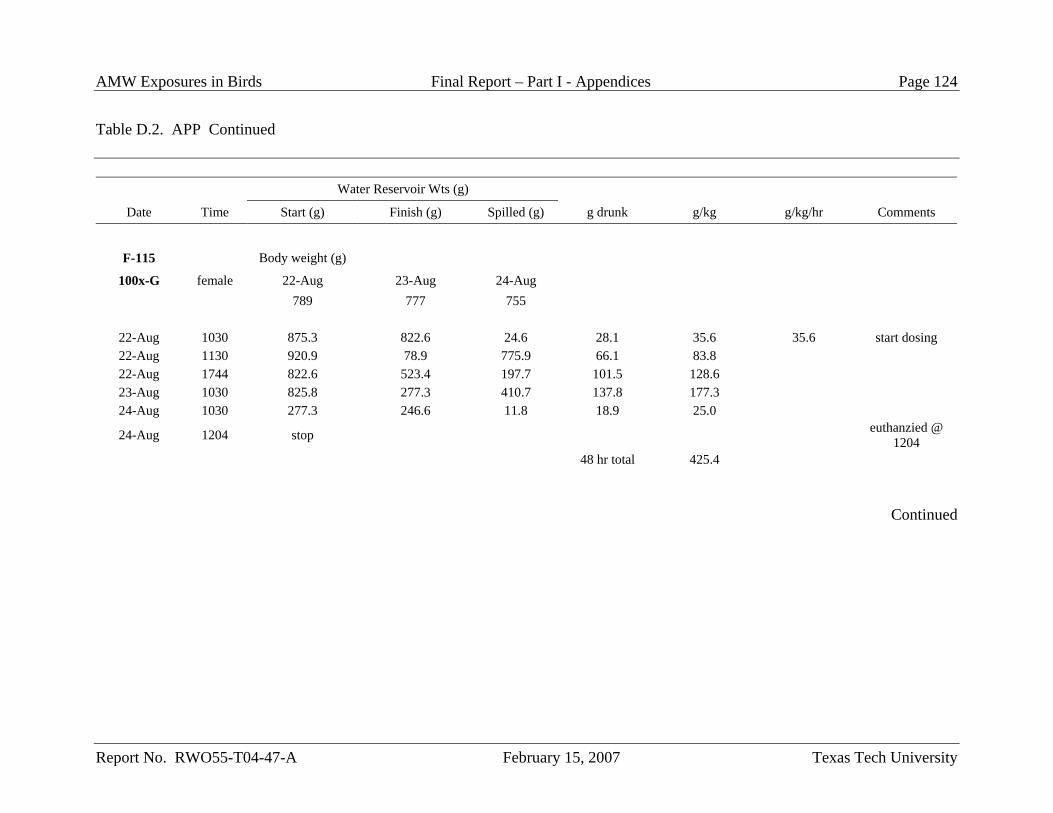
AMW Exposures in Birds Final Report – Part I - Appendices Page 124
Report No. RWO55-T04-47-A February 15, 2007 Texas Tech University
Table D.2. APP Continued
Water Reservoir Wts (g)
Date Time Start (g) Finish (g) Spilled (g) g drunk g/kg g/kg/hr Comments
F-115 Body weight (g)
100x-G female 22-Aug 23-Aug 24-Aug 789 777 755
22-Aug 1030 875.3 822.6 24.6 28.1 35.6 35.6 start dosing 22-Aug 1130 920.9 78.9 775.9 66.1 83.8 22-Aug 1744 822.6 523.4 197.7 101.5 128.6 23-Aug 1030 825.8 277.3 410.7 137.8 177.3 24-Aug 1030 277.3 246.6 11.8 18.9 25.0
24-Aug 1204 stop euthanzied @ 1204
48 hr total 425.4
Continued

AMW Exposures in Birds Final Report – Part I - Appendices Page 125
Report No. RWO55-T04-47-A February 15, 2007 Texas Tech University
Table D.2. APP Continued
Water Reservoir Wts (g)
Date Time Start (g) Finish (g) Spilled (g) g drunk g/kg g/kg/hr Comments
M-113 Body weight (g)
100x-H male 22-Aug 23-Aug 24-Aug 1086 1078 1056
22-Aug 1022 907.2 810.6 45.8 50.8 46.8 46.8 start dosing 22-Aug 1122 727 418.6 130.7 177.7 163.6 23-Aug 1022 877.4 468.6 244.2 164.6 152.7 24-Aug 1022 468.6 414.5 17.8 36.3 34.4
24-Aug 1427 stop euthanzied @ 1427
48 hr total 363.1
Continued
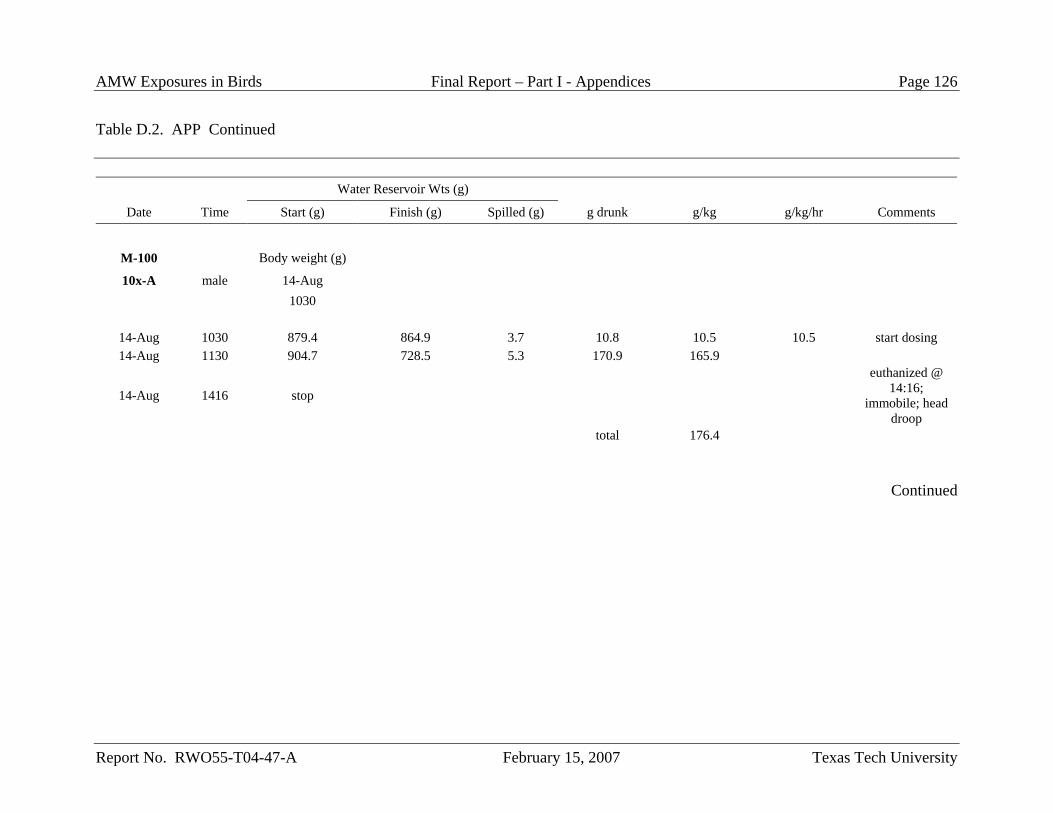
AMW Exposures in Birds Final Report – Part I - Appendices Page 126
Report No. RWO55-T04-47-A February 15, 2007 Texas Tech University
Table D.2. APP Continued
Water Reservoir Wts (g)
Date Time Start (g) Finish (g) Spilled (g) g drunk g/kg g/kg/hr Comments
M-100 Body weight (g)
10x-A male 14-Aug 1030
14-Aug 1030 879.4 864.9 3.7 10.8 10.5 10.5 start dosing 14-Aug 1130 904.7 728.5 5.3 170.9 165.9
14-Aug 1416 stop
euthanized @ 14:16;
immobile; head droop
total 176.4
Continued
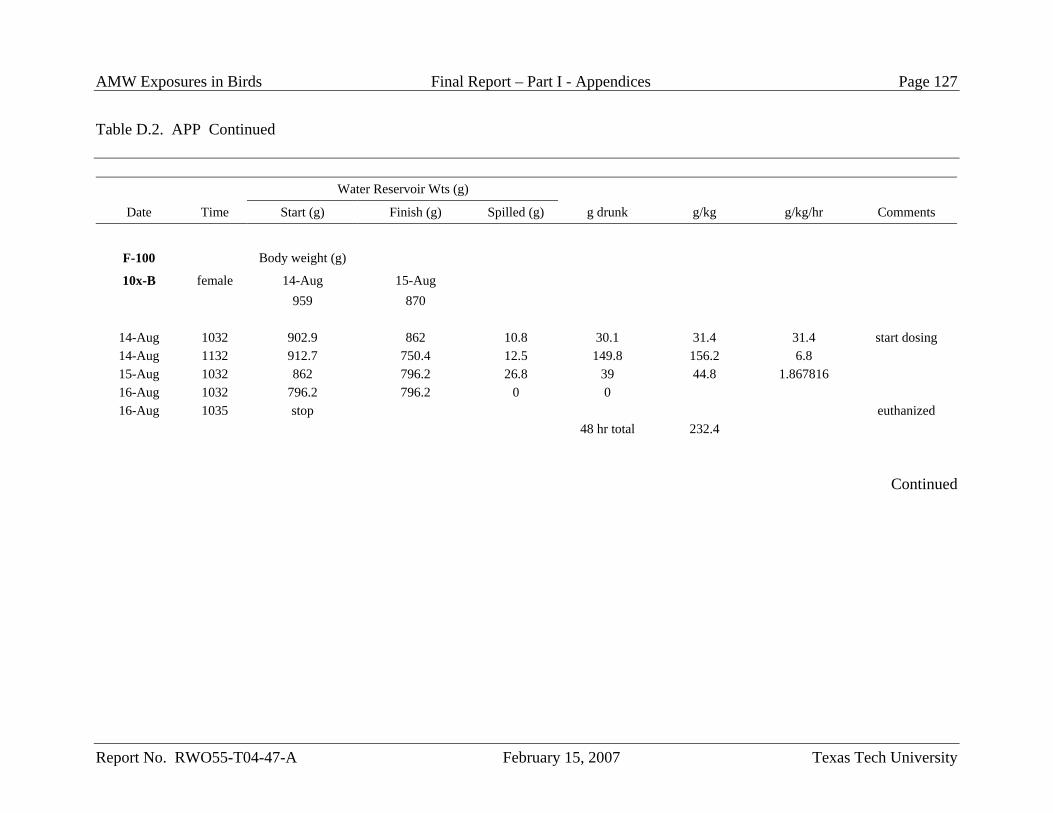
AMW Exposures in Birds Final Report – Part I - Appendices Page 127
Report No. RWO55-T04-47-A February 15, 2007 Texas Tech University
Table D.2. APP Continued
Water Reservoir Wts (g)
Date Time Start (g) Finish (g) Spilled (g) g drunk g/kg g/kg/hr Comments
F-100 Body weight (g)
10x-B female 14-Aug 15-Aug 959 870
14-Aug 1032 902.9 862 10.8 30.1 31.4 31.4 start dosing 14-Aug 1132 912.7 750.4 12.5 149.8 156.2 6.8 15-Aug 1032 862 796.2 26.8 39 44.8 1.867816 16-Aug 1032 796.2 796.2 0 0 16-Aug 1035 stop euthanized
48 hr total 232.4
Continued

AMW Exposures in Birds Final Report – Part I - Appendices Page 128
Report No. RWO55-T04-47-A February 15, 2007 Texas Tech University
Table D.2. APP Continued
Water Reservoir Wts (g)
Date Time Start (g) Finish (g) Spilled (g) g drunk g/kg g/kg/hr Comments
F-103 Body weight (g)
10x-C female 14-Aug 15-Aug 16-Aug 976 941 904
14-Aug 1042 829.7 791.9 16.2 21.6 22.1 22.1 start dosing 14-Aug 1142 861.6 800.9 33.6 27.1 27.8 15-Aug 1042 791.9 545 221.4 25.5 27.1 16-Aug 1042 545 545 0 0 0 euthanized
48 hr total 77.0
Continued

AMW Exposures in Birds Final Report – Part I - Appendices Page 129
Report No. RWO55-T04-47-A February 15, 2007 Texas Tech University
Table D.2. APP Continued
Water Reservoir Wts (g)
Date Time Start (g) Finish (g) Spilled (g) g drunk g/kg g/kg/hr Comments
M-103 Body weight (g)
10x-D male 14-Aug 15-Aug 16-Aug 1039 987 938
14-Aug 1044 704.3 654.9 15.5 33.9 32.6 32.6 start dosing 14-Aug 1144 799 455.5 167.8 175.7 169.1 15-Aug 1044 654.9 403.1 175 76.8 77.8 16-Aug 1044 403.1 395 5.1 3 3.2 16-Aug 1139 stop euthanized
48 hr total 279.5
Continued
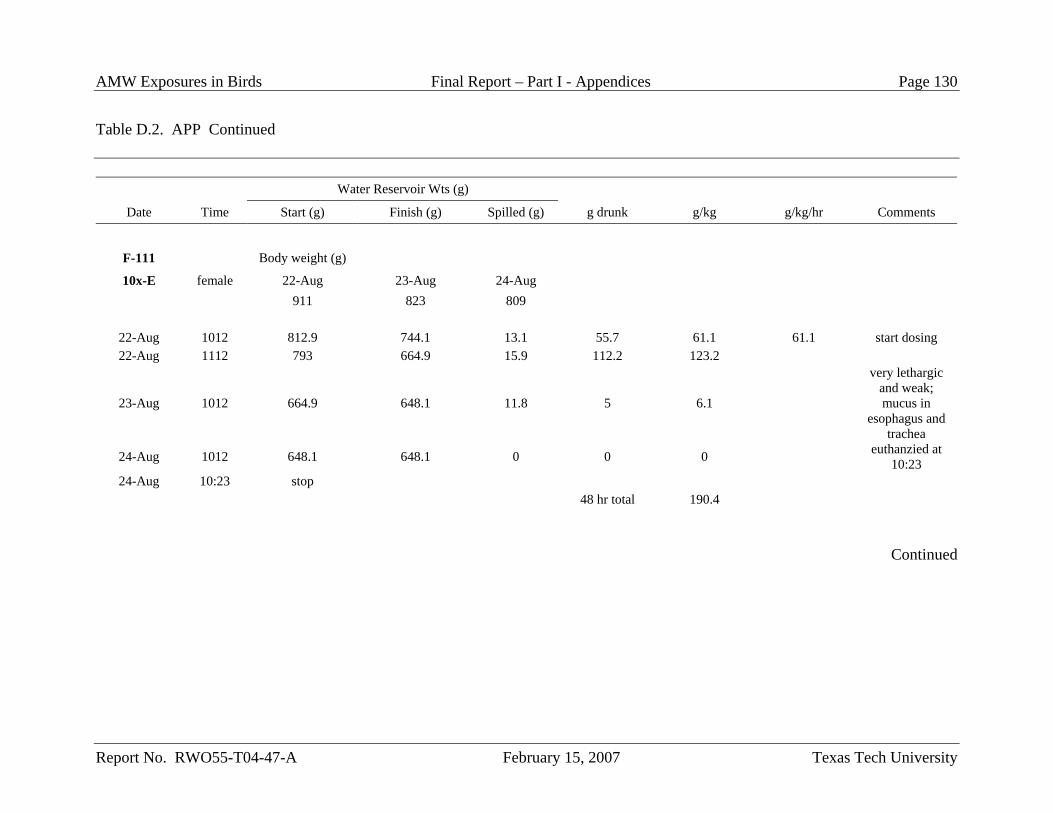
AMW Exposures in Birds Final Report – Part I - Appendices Page 130
Report No. RWO55-T04-47-A February 15, 2007 Texas Tech University
Table D.2. APP Continued
Water Reservoir Wts (g)
Date Time Start (g) Finish (g) Spilled (g) g drunk g/kg g/kg/hr Comments
F-111 Body weight (g)
10x-E female 22-Aug 23-Aug 24-Aug 911 823 809
22-Aug 1012 812.9 744.1 13.1 55.7 61.1 61.1 start dosing 22-Aug 1112 793 664.9 15.9 112.2 123.2
23-Aug 1012 664.9 648.1 11.8 5 6.1
very lethargic and weak; mucus in
esophagus and trachea
24-Aug 1012 648.1 648.1 0 0 0 euthanzied at 10:23
24-Aug 10:23 stop 48 hr total 190.4
Continued

AMW Exposures in Birds Final Report – Part I - Appendices Page 131
Report No. RWO55-T04-47-A February 15, 2007 Texas Tech University
Table D.2. APP Continued
Water Reservoir Wts (g)
Date Time Start (g) Finish (g) Spilled (g) g drunk g/kg g/kg/hr Comments
M-114 Body weight (g)
10x-F male 22-Aug 23-Aug 24-Aug 1036 937 883
22-Aug 1028 821.1 744.7 8 68.4 66.0 66.0 start dosing 22-Aug 1128 857.5 564.4 150 143.1 138.1 23-Aug 1028 876 719.2 135.6 21.2 22.6 24-Aug 1028 719.2 703 14.5 1.7 1.9
24-Aug 1103 stop euthanized @ 1103
48 hr total 226.8
Continued
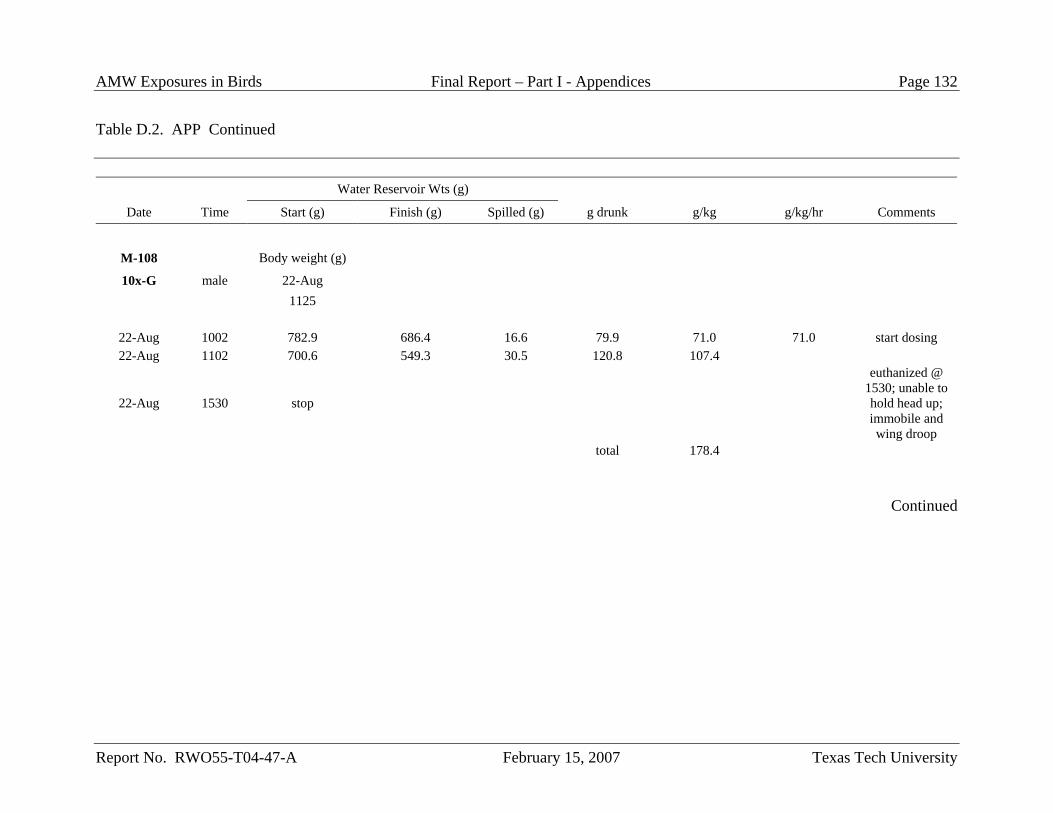
AMW Exposures in Birds Final Report – Part I - Appendices Page 132
Report No. RWO55-T04-47-A February 15, 2007 Texas Tech University
Table D.2. APP Continued
Water Reservoir Wts (g)
Date Time Start (g) Finish (g) Spilled (g) g drunk g/kg g/kg/hr Comments
M-108 Body weight (g)
10x-G male 22-Aug 1125
22-Aug 1002 782.9 686.4 16.6 79.9 71.0 71.0 start dosing 22-Aug 1102 700.6 549.3 30.5 120.8 107.4
22-Aug 1530 stop
euthanized @ 1530; unable to hold head up; immobile and wing droop
total 178.4
Continued
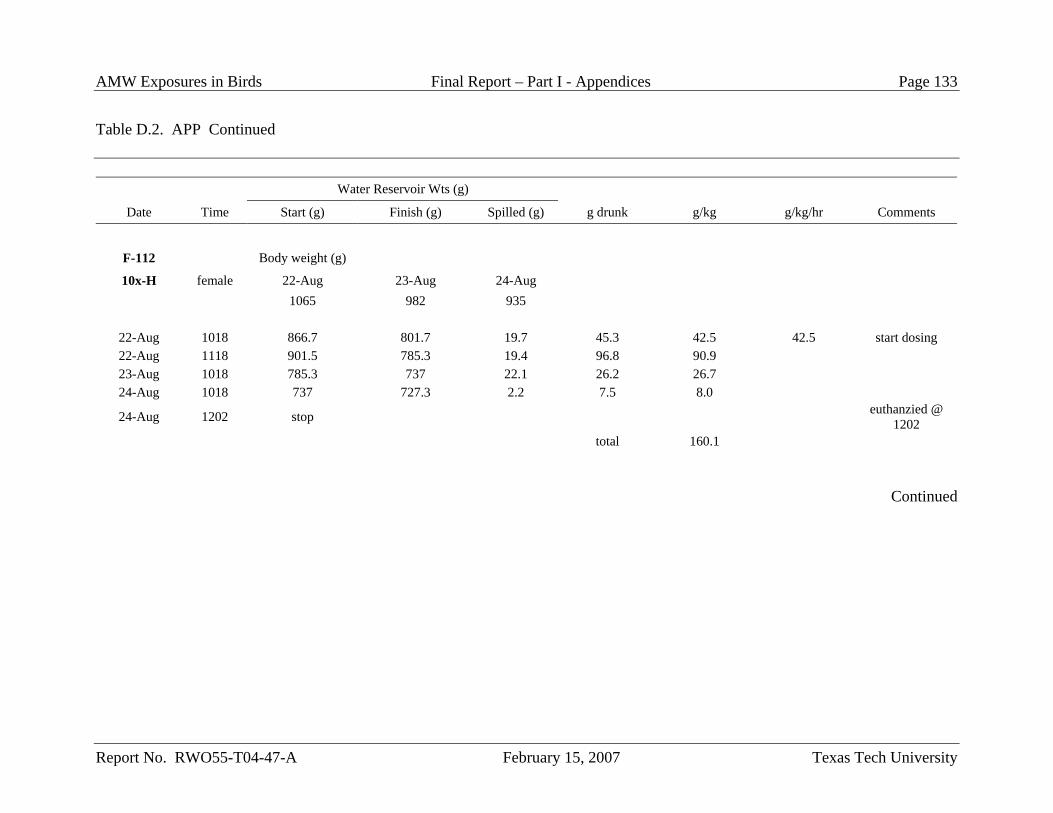
AMW Exposures in Birds Final Report – Part I - Appendices Page 133
Report No. RWO55-T04-47-A February 15, 2007 Texas Tech University
Table D.2. APP Continued
Water Reservoir Wts (g)
Date Time Start (g) Finish (g) Spilled (g) g drunk g/kg g/kg/hr Comments
F-112 Body weight (g)
10x-H female 22-Aug 23-Aug 24-Aug 1065 982 935
22-Aug 1018 866.7 801.7 19.7 45.3 42.5 42.5 start dosing 22-Aug 1118 901.5 785.3 19.4 96.8 90.9 23-Aug 1018 785.3 737 22.1 26.2 26.7 24-Aug 1018 737 727.3 2.2 7.5 8.0
24-Aug 1202 stop euthanzied @ 1202
total 160.1
Continued
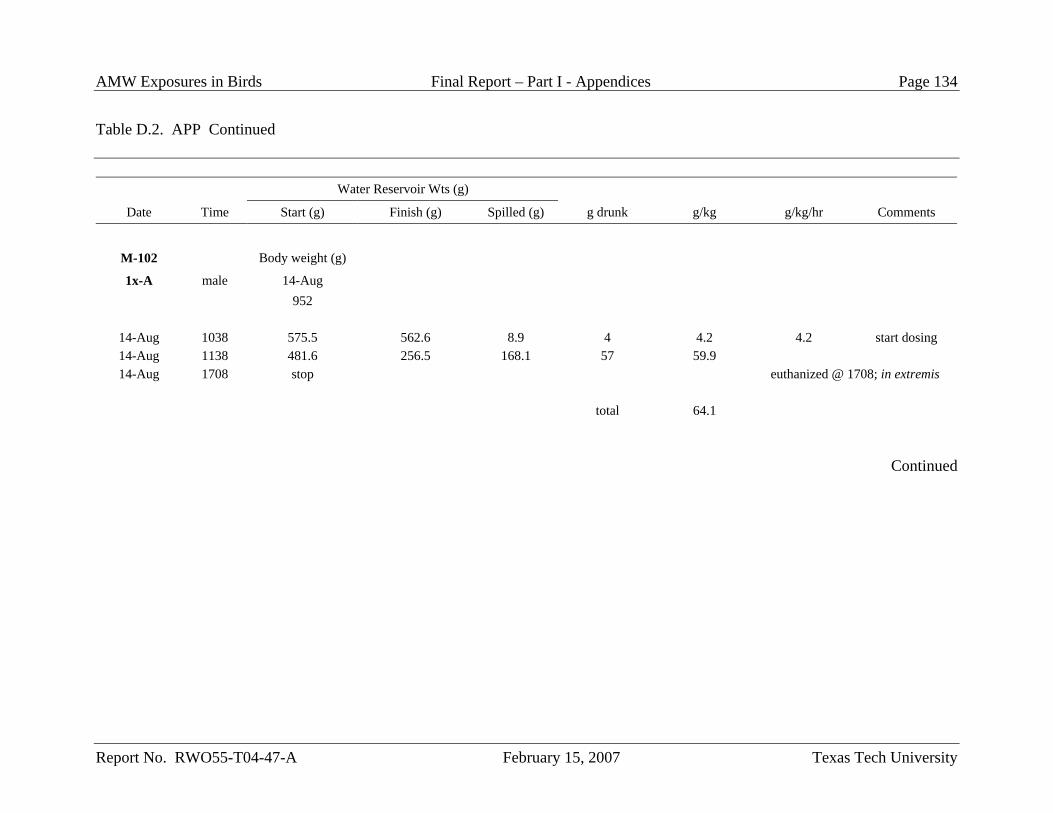
AMW Exposures in Birds Final Report – Part I - Appendices Page 134
Report No. RWO55-T04-47-A February 15, 2007 Texas Tech University
Table D.2. APP Continued
Water Reservoir Wts (g)
Date Time Start (g) Finish (g) Spilled (g) g drunk g/kg g/kg/hr Comments
M-102 Body weight (g)
1x-A male 14-Aug 952
14-Aug 1038 575.5 562.6 8.9 4 4.2 4.2 start dosing 14-Aug 1138 481.6 256.5 168.1 57 59.9 14-Aug 1708 stop euthanized @ 1708; in extremis
total 64.1
Continued

AMW Exposures in Birds Final Report – Part I - Appendices Page 135
Report No. RWO55-T04-47-A February 15, 2007 Texas Tech University
Table D.2. APP Continued
Water Reservoir Wts (g)
Date Time Start (g) Finish (g) Spilled (g) g drunk g/kg g/kg/hr Comments
F-102 Body weight (g)
1x-B female 14-Aug 975
14-Aug 1040 615.9 607.6 5.8 2.5 2.6 2.6 start dosing 14-Aug 1140 782.4 739.6 7 35.8 36.7
14-Aug 1845 stop euthanized @ 1845; head droop, immobile, rapid breathing
total 39.3
Continued
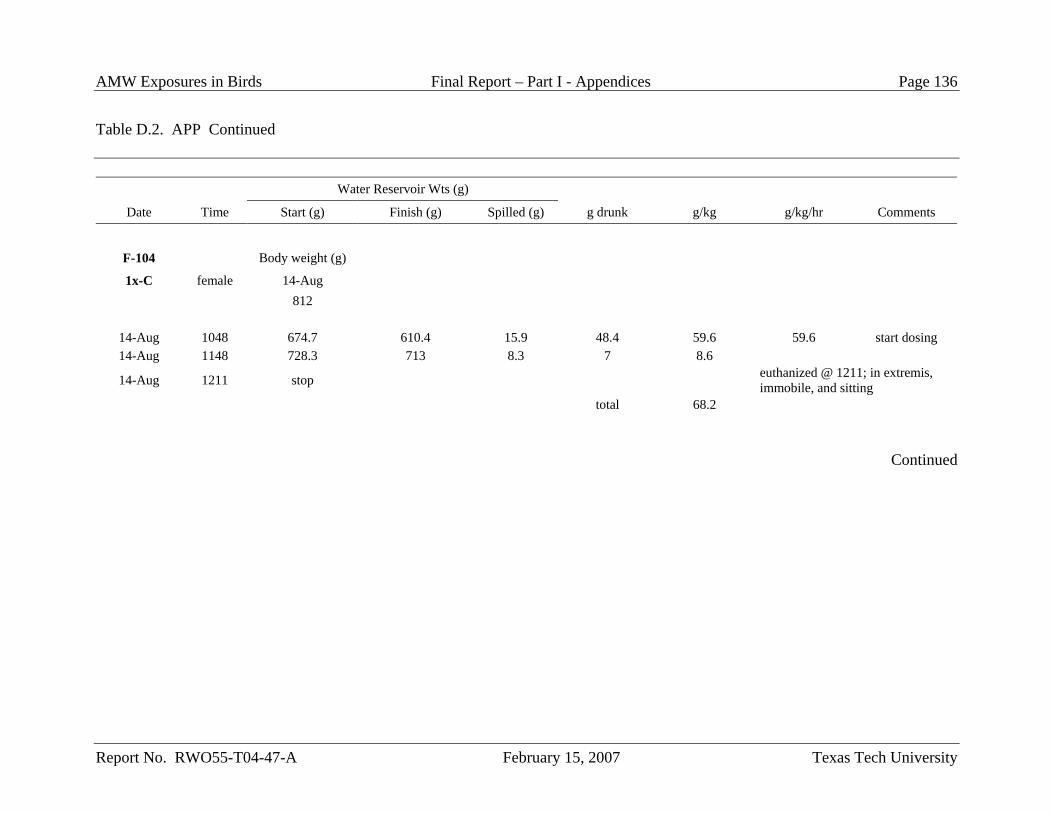
AMW Exposures in Birds Final Report – Part I - Appendices Page 136
Report No. RWO55-T04-47-A February 15, 2007 Texas Tech University
Table D.2. APP Continued
Water Reservoir Wts (g)
Date Time Start (g) Finish (g) Spilled (g) g drunk g/kg g/kg/hr Comments
F-104 Body weight (g)
1x-C female 14-Aug 812
14-Aug 1048 674.7 610.4 15.9 48.4 59.6 59.6 start dosing 14-Aug 1148 728.3 713 8.3 7 8.6
14-Aug 1211 stop euthanized @ 1211; in extremis, immobile, and sitting
total 68.2
Continued
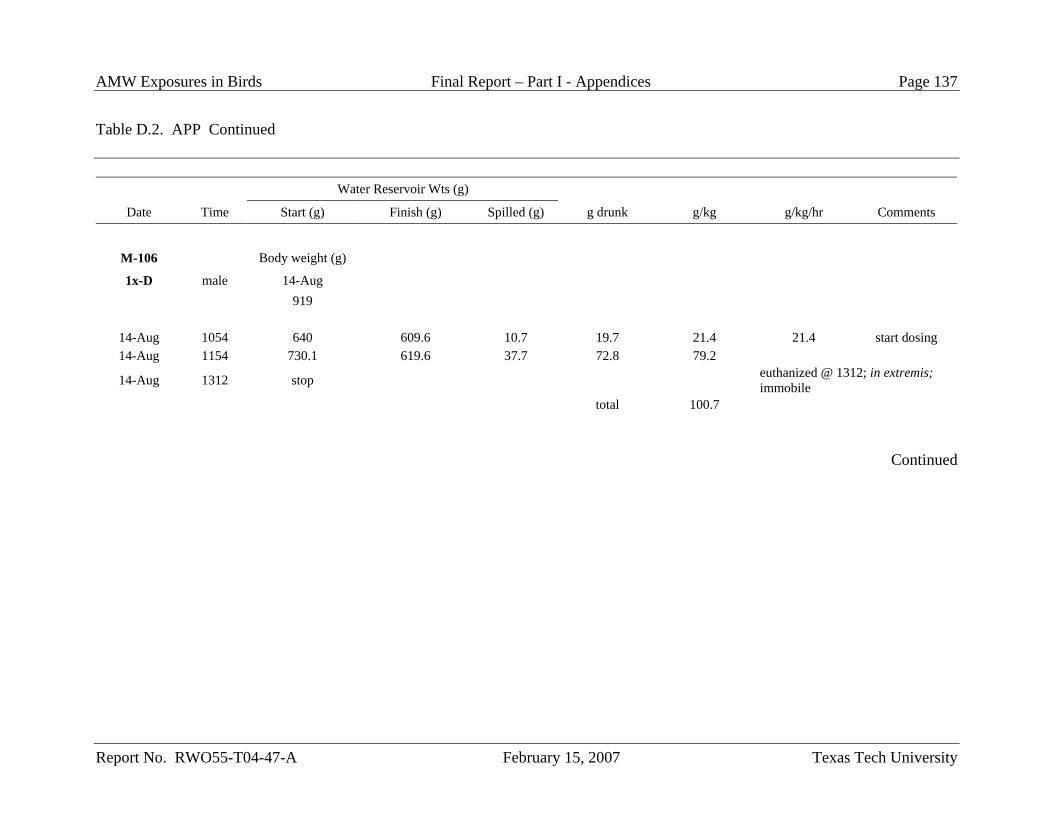
AMW Exposures in Birds Final Report – Part I - Appendices Page 137
Report No. RWO55-T04-47-A February 15, 2007 Texas Tech University
Table D.2. APP Continued
Water Reservoir Wts (g)
Date Time Start (g) Finish (g) Spilled (g) g drunk g/kg g/kg/hr Comments
M-106 Body weight (g)
1x-D male 14-Aug 919
14-Aug 1054 640 609.6 10.7 19.7 21.4 21.4 start dosing 14-Aug 1154 730.1 619.6 37.7 72.8 79.2
14-Aug 1312 stop euthanized @ 1312; in extremis; immobile
total 100.7
Continued

AMW Exposures in Birds Final Report – Part I - Appendices Page 138
Report No. RWO55-T04-47-A February 15, 2007 Texas Tech University
Table D.2. APP Continued
Water Reservoir Wts (g)
Date Time Start (g) Finish (g) Spilled (g) g drunk g/kg g/kg/hr Comments
F-110 Body weight (g)
1x-E female 22-Aug 892
22-Aug 1008 497.7 457.2 14 26.5 29.7 29.7 start dosing 22-Aug 1108 606.3 562.4 25.9 18 20.2
22-Aug 1344 stop euthanized @ 1344; head and
wing-droop, increased breathing rate
total 49.9
Continued
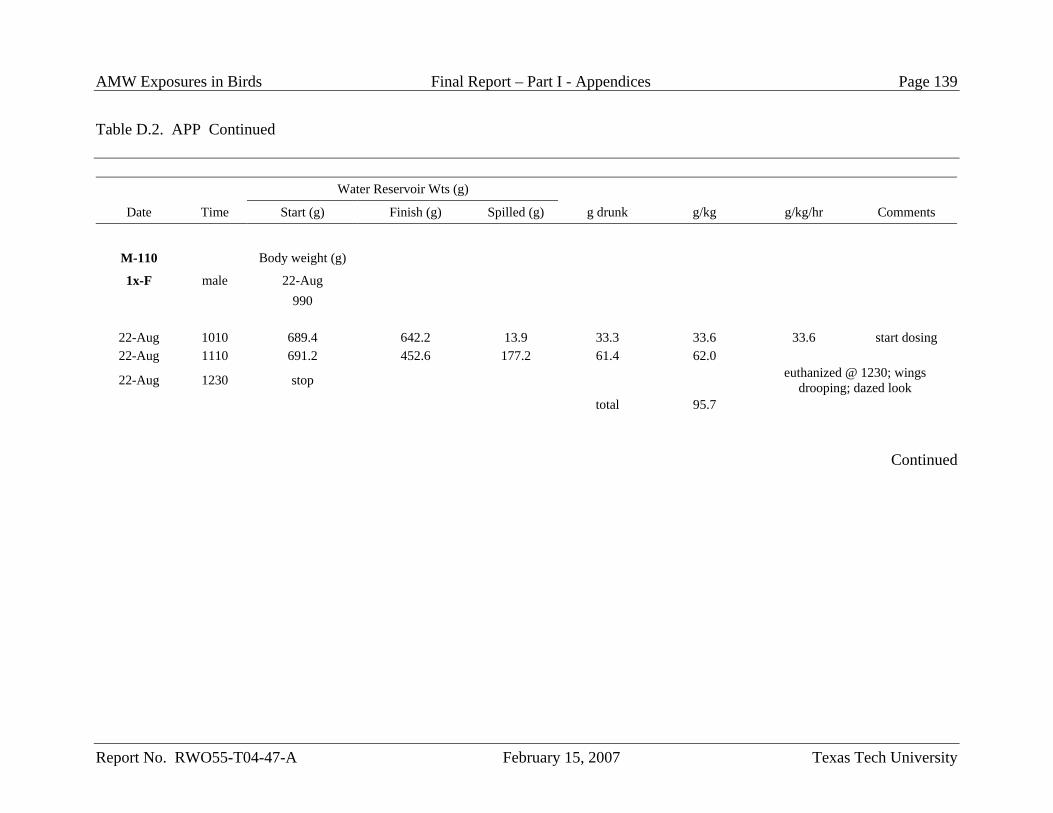
AMW Exposures in Birds Final Report – Part I - Appendices Page 139
Report No. RWO55-T04-47-A February 15, 2007 Texas Tech University
Table D.2. APP Continued
Water Reservoir Wts (g)
Date Time Start (g) Finish (g) Spilled (g) g drunk g/kg g/kg/hr Comments
M-110 Body weight (g)
1x-F male 22-Aug 990
22-Aug 1010 689.4 642.2 13.9 33.3 33.6 33.6 start dosing 22-Aug 1110 691.2 452.6 177.2 61.4 62.0
22-Aug 1230 stop euthanized @ 1230; wings drooping; dazed look
total 95.7
Continued
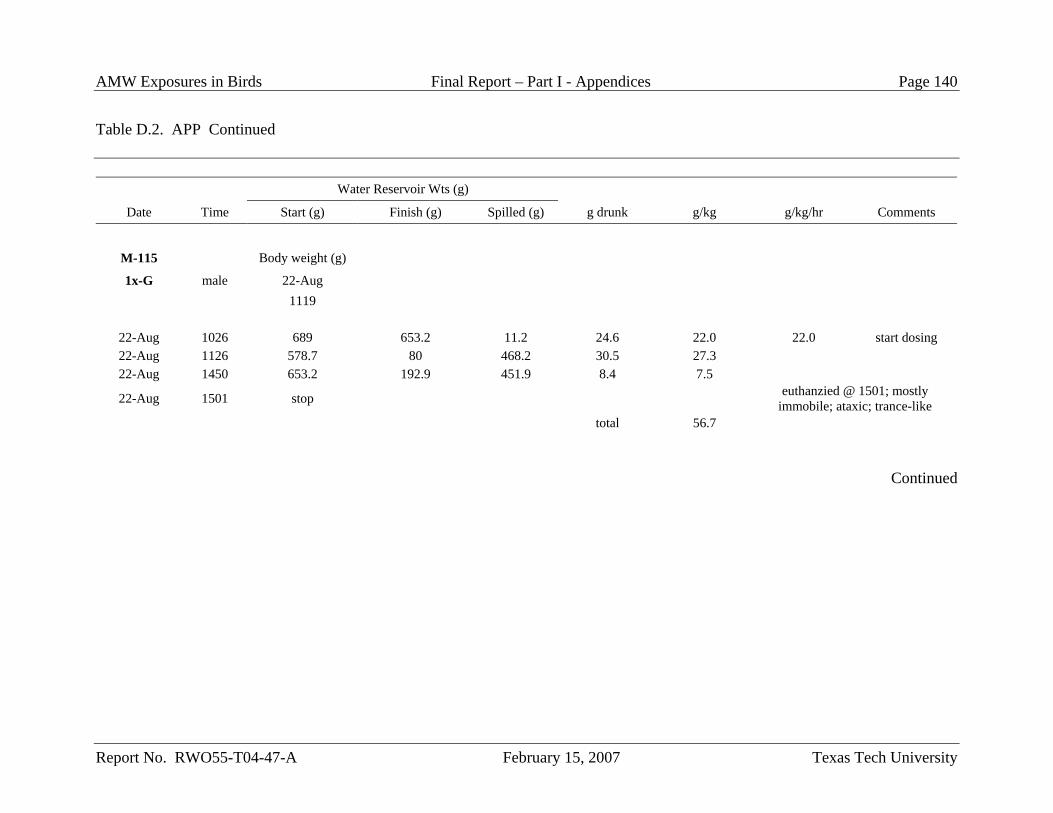
AMW Exposures in Birds Final Report – Part I - Appendices Page 140
Report No. RWO55-T04-47-A February 15, 2007 Texas Tech University
Table D.2. APP Continued
Water Reservoir Wts (g)
Date Time Start (g) Finish (g) Spilled (g) g drunk g/kg g/kg/hr Comments
M-115 Body weight (g)
1x-G male 22-Aug 1119
22-Aug 1026 689 653.2 11.2 24.6 22.0 22.0 start dosing 22-Aug 1126 578.7 80 468.2 30.5 27.3 22-Aug 1450 653.2 192.9 451.9 8.4 7.5
22-Aug 1501 stop euthanzied @ 1501; mostly immobile; ataxic; trance-like
total 56.7
Continued
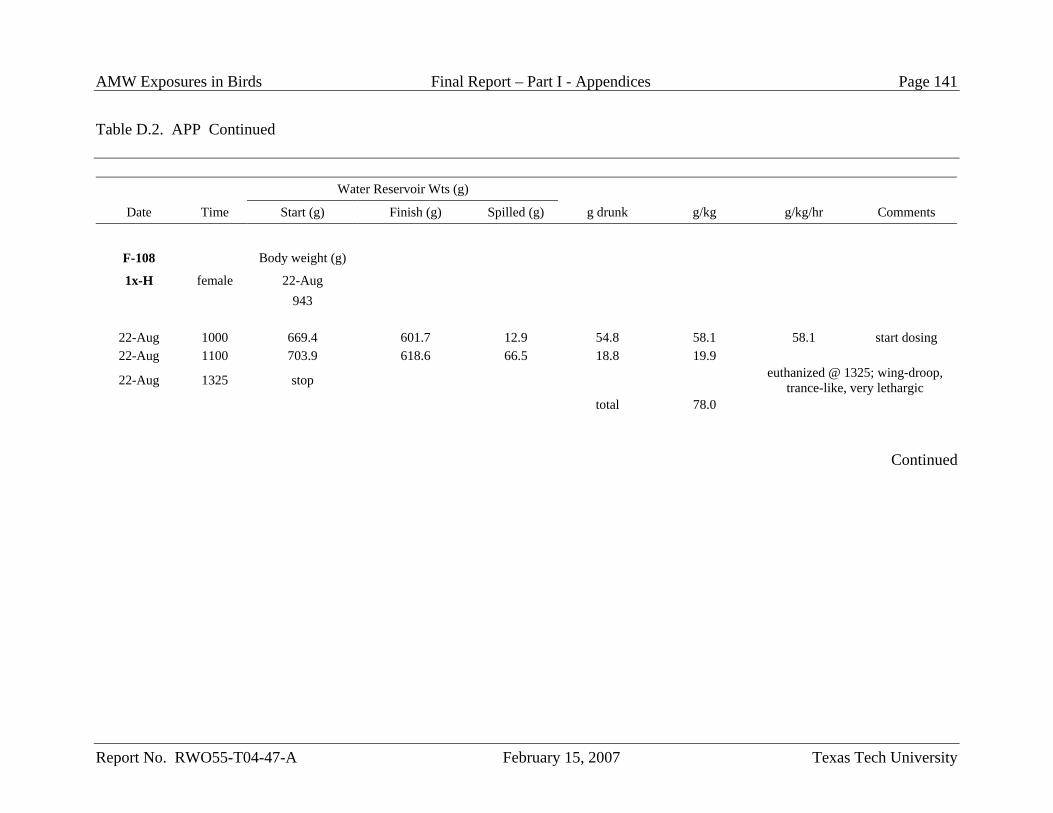
AMW Exposures in Birds Final Report – Part I - Appendices Page 141
Report No. RWO55-T04-47-A February 15, 2007 Texas Tech University
Table D.2. APP Continued
Water Reservoir Wts (g)
Date Time Start (g) Finish (g) Spilled (g) g drunk g/kg g/kg/hr Comments
F-108 Body weight (g)
1x-H female 22-Aug 943
22-Aug 1000 669.4 601.7 12.9 54.8 58.1 58.1 start dosing 22-Aug 1100 703.9 618.6 66.5 18.8 19.9
22-Aug 1325 stop euthanized @ 1325; wing-droop, trance-like, very lethargic
total 78.0
Continued
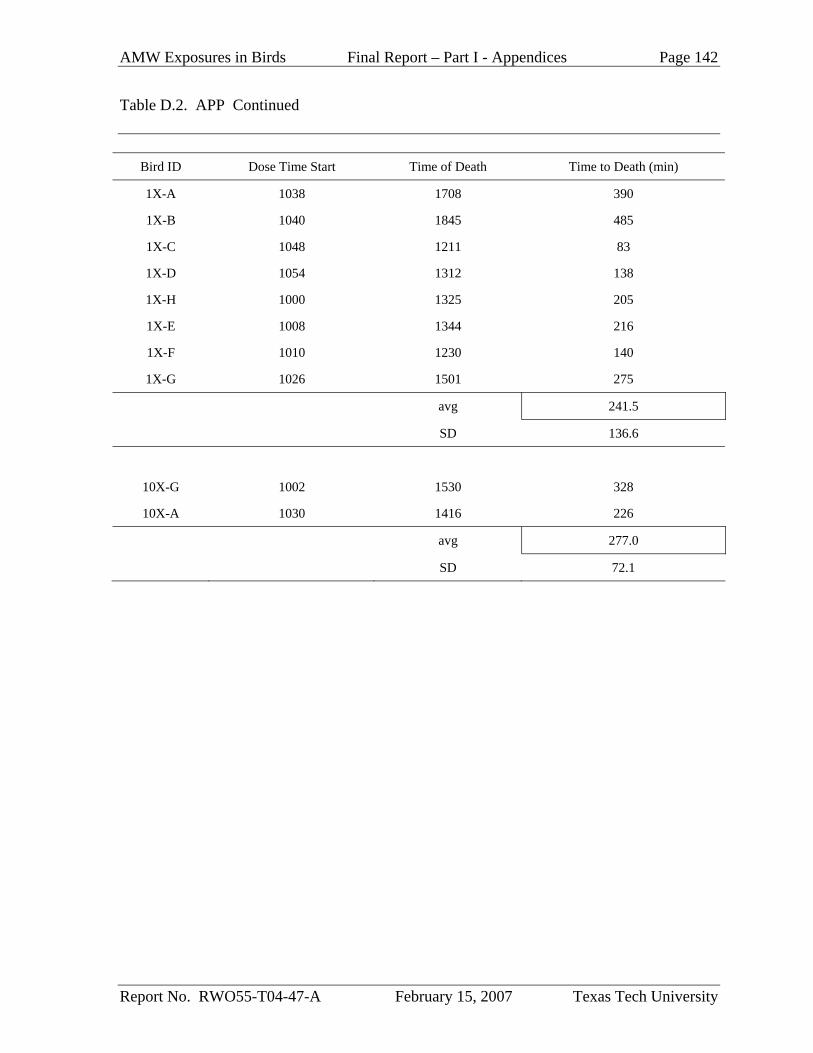
AMW Exposures in Birds Final Report – Part I - Appendices Page 142
Report No. RWO55-T04-47-A February 15, 2007 Texas Tech University
Table D.2. APP Continued
Bird ID Dose Time Start Time of Death Time to Death (min)
1X-A 1038 1708 390
1X-B 1040 1845 485
1X-C 1048 1211 83
1X-D 1054 1312 138
1X-H 1000 1325 205
1X-E 1008 1344 216
1X-F 1010 1230 140
1X-G 1026 1501 275
avg 241.5
SD 136.6
10X-G 1002 1530 328
10X-A 1030 1416 226
avg 277.0
SD 72.1
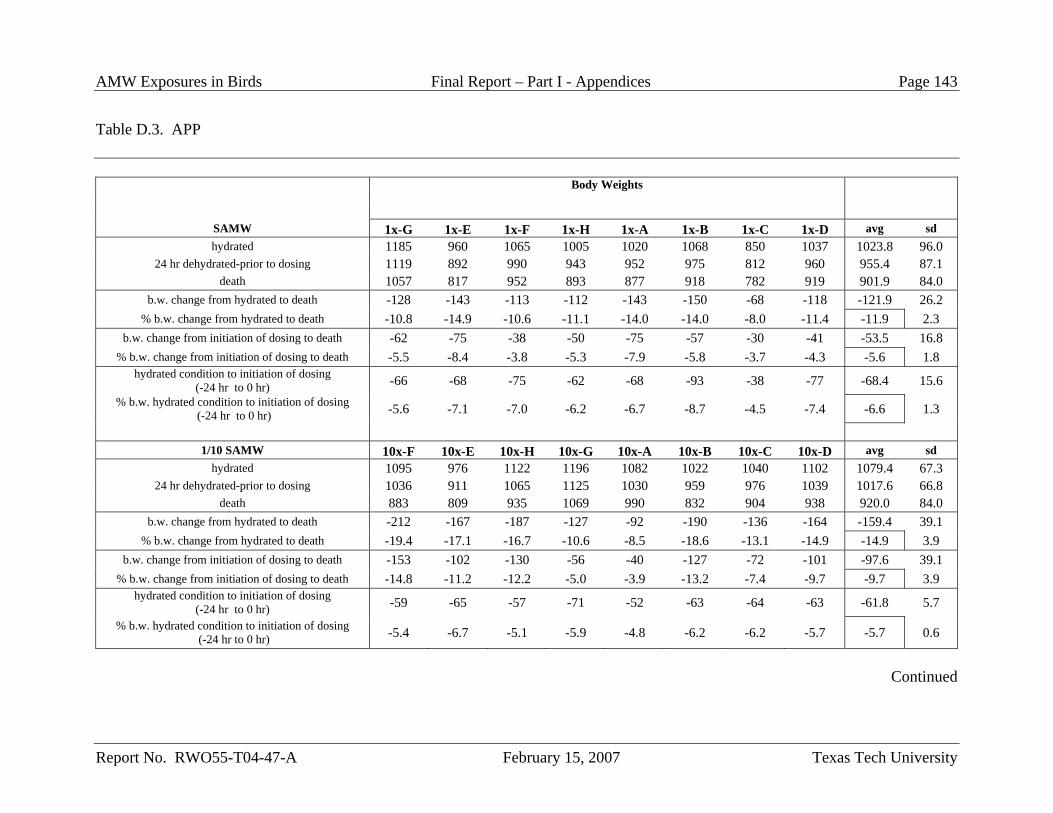
AMW Exposures in Birds Final Report – Part I - Appendices Page 143
Report No. RWO55-T04-47-A February 15, 2007 Texas Tech University
Table D.3. APP
Body Weights
SAMW 1x-G 1x-E 1x-F 1x-H 1x-A 1x-B 1x-C 1x-D avg sd hydrated 1185 960 1065 1005 1020 1068 850 1037 1023.8 96.0
24 hr dehydrated-prior to dosing 1119 892 990 943 952 975 812 960 955.4 87.1 death 1057 817 952 893 877 918 782 919 901.9 84.0
b.w. change from hydrated to death -128 -143 -113 -112 -143 -150 -68 -118 -121.9 26.2 % b.w. change from hydrated to death -10.8 -14.9 -10.6 -11.1 -14.0 -14.0 -8.0 -11.4 -11.9 2.3
b.w. change from initiation of dosing to death -62 -75 -38 -50 -75 -57 -30 -41 -53.5 16.8 % b.w. change from initiation of dosing to death -5.5 -8.4 -3.8 -5.3 -7.9 -5.8 -3.7 -4.3 -5.6 1.8
hydrated condition to initiation of dosing (-24 hr to 0 hr) -66 -68 -75 -62 -68 -93 -38 -77 -68.4 15.6
% b.w. hydrated condition to initiation of dosing (-24 hr to 0 hr) -5.6 -7.1 -7.0 -6.2 -6.7 -8.7 -4.5 -7.4 -6.6 1.3
1/10 SAMW 10x-F 10x-E 10x-H 10x-G 10x-A 10x-B 10x-C 10x-D avg sd
hydrated 1095 976 1122 1196 1082 1022 1040 1102 1079.4 67.3 24 hr dehydrated-prior to dosing 1036 911 1065 1125 1030 959 976 1039 1017.6 66.8
death 883 809 935 1069 990 832 904 938 920.0 84.0 b.w. change from hydrated to death -212 -167 -187 -127 -92 -190 -136 -164 -159.4 39.1
% b.w. change from hydrated to death -19.4 -17.1 -16.7 -10.6 -8.5 -18.6 -13.1 -14.9 -14.9 3.9 b.w. change from initiation of dosing to death -153 -102 -130 -56 -40 -127 -72 -101 -97.6 39.1
% b.w. change from initiation of dosing to death -14.8 -11.2 -12.2 -5.0 -3.9 -13.2 -7.4 -9.7 -9.7 3.9 hydrated condition to initiation of dosing
(-24 hr to 0 hr) -59 -65 -57 -71 -52 -63 -64 -63 -61.8 5.7
% b.w. hydrated condition to initiation of dosing (-24 hr to 0 hr) -5.4 -6.7 -5.1 -5.9 -4.8 -6.2 -6.2 -5.7 -5.7 0.6
Continued
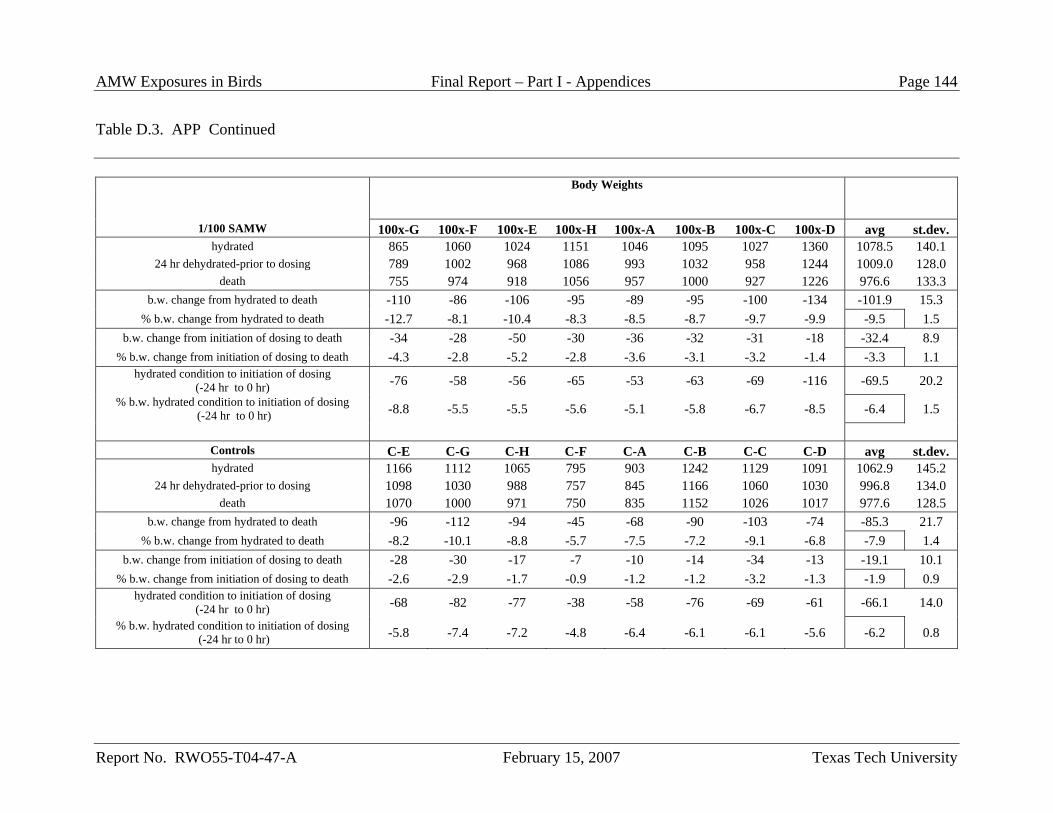
AMW Exposures in Birds Final Report – Part I - Appendices Page 144
Report No. RWO55-T04-47-A February 15, 2007 Texas Tech University
Table D.3. APP Continued
Body Weights
1/100 SAMW 100x-G 100x-F 100x-E 100x-H 100x-A 100x-B 100x-C 100x-D avg st.dev.
hydrated 865 1060 1024 1151 1046 1095 1027 1360 1078.5 140.1 24 hr dehydrated-prior to dosing 789 1002 968 1086 993 1032 958 1244 1009.0 128.0
death 755 974 918 1056 957 1000 927 1226 976.6 133.3 b.w. change from hydrated to death -110 -86 -106 -95 -89 -95 -100 -134 -101.9 15.3
% b.w. change from hydrated to death -12.7 -8.1 -10.4 -8.3 -8.5 -8.7 -9.7 -9.9 -9.5 1.5 b.w. change from initiation of dosing to death -34 -28 -50 -30 -36 -32 -31 -18 -32.4 8.9
% b.w. change from initiation of dosing to death -4.3 -2.8 -5.2 -2.8 -3.6 -3.1 -3.2 -1.4 -3.3 1.1 hydrated condition to initiation of dosing
(-24 hr to 0 hr) -76 -58 -56 -65 -53 -63 -69 -116 -69.5 20.2 % b.w. hydrated condition to initiation of dosing
(-24 hr to 0 hr) -8.8 -5.5 -5.5 -5.6 -5.1 -5.8 -6.7 -8.5 -6.4 1.5
Controls C-E C-G C-H C-F C-A C-B C-C C-D avg st.dev. hydrated 1166 1112 1065 795 903 1242 1129 1091 1062.9 145.2
24 hr dehydrated-prior to dosing 1098 1030 988 757 845 1166 1060 1030 996.8 134.0 death 1070 1000 971 750 835 1152 1026 1017 977.6 128.5
b.w. change from hydrated to death -96 -112 -94 -45 -68 -90 -103 -74 -85.3 21.7 % b.w. change from hydrated to death -8.2 -10.1 -8.8 -5.7 -7.5 -7.2 -9.1 -6.8 -7.9 1.4
b.w. change from initiation of dosing to death -28 -30 -17 -7 -10 -14 -34 -13 -19.1 10.1 % b.w. change from initiation of dosing to death -2.6 -2.9 -1.7 -0.9 -1.2 -1.2 -3.2 -1.3 -1.9 0.9
hydrated condition to initiation of dosing (-24 hr to 0 hr) -68 -82 -77 -38 -58 -76 -69 -61 -66.1 14.0
% b.w. hydrated condition to initiation of dosing (-24 hr to 0 hr) -5.8 -7.4 -7.2 -4.8 -6.4 -6.1 -6.1 -5.6 -6.2 0.8
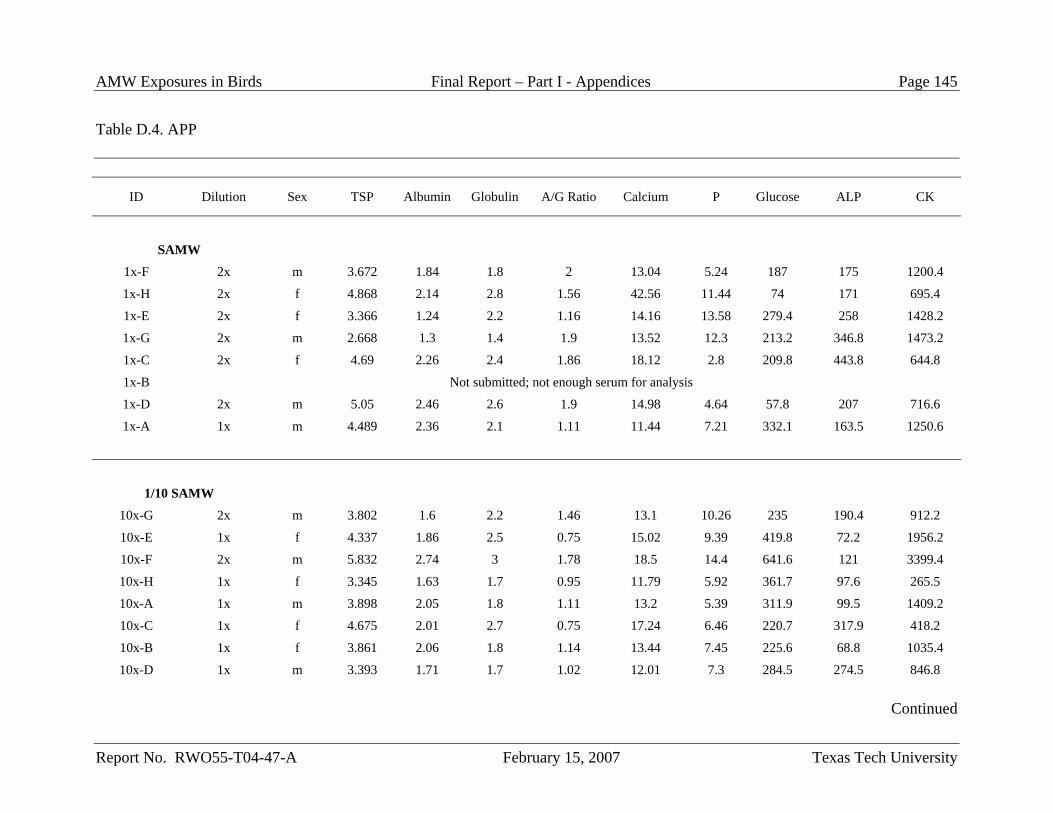
AMW Exposures in Birds Final Report – Part I - Appendices Page 145
Report No. RWO55-T04-47-A February 15, 2007 Texas Tech University
Table D.4. APP
ID Dilution Sex TSP Albumin Globulin A/G Ratio Calcium P Glucose ALP CK
SAMW
1x-F 2x m 3.672 1.84 1.8 2 13.04 5.24 187 175 1200.4
1x-H 2x f 4.868 2.14 2.8 1.56 42.56 11.44 74 171 695.4
1x-E 2x f 3.366 1.24 2.2 1.16 14.16 13.58 279.4 258 1428.2
1x-G 2x m 2.668 1.3 1.4 1.9 13.52 12.3 213.2 346.8 1473.2
1x-C 2x f 4.69 2.26 2.4 1.86 18.12 2.8 209.8 443.8 644.8
1x-B Not submitted; not enough serum for analysis
1x-D 2x m 5.05 2.46 2.6 1.9 14.98 4.64 57.8 207 716.6
1x-A 1x m 4.489 2.36 2.1 1.11 11.44 7.21 332.1 163.5 1250.6
1/10 SAMW
10x-G 2x m 3.802 1.6 2.2 1.46 13.1 10.26 235 190.4 912.2
10x-E 1x f 4.337 1.86 2.5 0.75 15.02 9.39 419.8 72.2 1956.2
10x-F 2x m 5.832 2.74 3 1.78 18.5 14.4 641.6 121 3399.4
10x-H 1x f 3.345 1.63 1.7 0.95 11.79 5.92 361.7 97.6 265.5
10x-A 1x m 3.898 2.05 1.8 1.11 13.2 5.39 311.9 99.5 1409.2
10x-C 1x f 4.675 2.01 2.7 0.75 17.24 6.46 220.7 317.9 418.2
10x-B 1x f 3.861 2.06 1.8 1.14 13.44 7.45 225.6 68.8 1035.4
10x-D 1x m 3.393 1.71 1.7 1.02 12.01 7.3 284.5 274.5 846.8
Continued
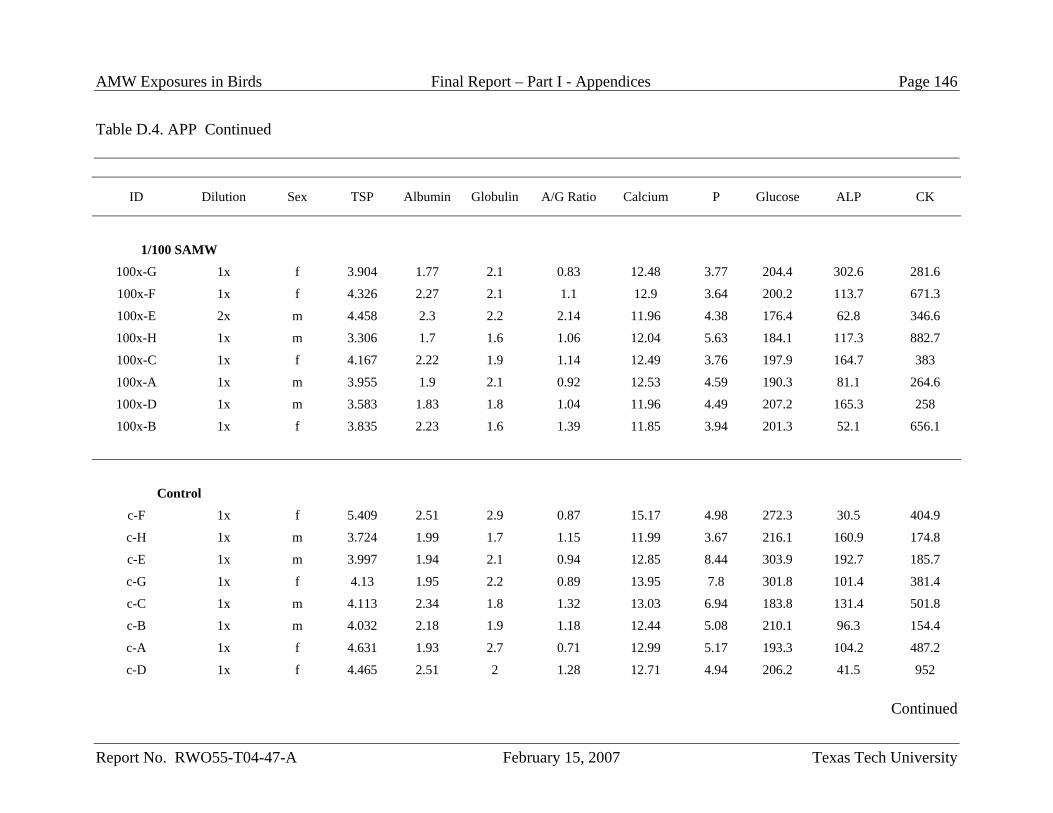
AMW Exposures in Birds Final Report – Part I - Appendices Page 146
Report No. RWO55-T04-47-A February 15, 2007 Texas Tech University
Table D.4. APP Continued
ID Dilution Sex TSP Albumin Globulin A/G Ratio Calcium P Glucose ALP CK
1/100 SAMW
100x-G 1x f 3.904 1.77 2.1 0.83 12.48 3.77 204.4 302.6 281.6
100x-F 1x f 4.326 2.27 2.1 1.1 12.9 3.64 200.2 113.7 671.3
100x-E 2x m 4.458 2.3 2.2 2.14 11.96 4.38 176.4 62.8 346.6
100x-H 1x m 3.306 1.7 1.6 1.06 12.04 5.63 184.1 117.3 882.7
100x-C 1x f 4.167 2.22 1.9 1.14 12.49 3.76 197.9 164.7 383
100x-A 1x m 3.955 1.9 2.1 0.92 12.53 4.59 190.3 81.1 264.6
100x-D 1x m 3.583 1.83 1.8 1.04 11.96 4.49 207.2 165.3 258
100x-B 1x f 3.835 2.23 1.6 1.39 11.85 3.94 201.3 52.1 656.1
Control
c-F 1x f 5.409 2.51 2.9 0.87 15.17 4.98 272.3 30.5 404.9
c-H 1x m 3.724 1.99 1.7 1.15 11.99 3.67 216.1 160.9 174.8
c-E 1x m 3.997 1.94 2.1 0.94 12.85 8.44 303.9 192.7 185.7
c-G 1x f 4.13 1.95 2.2 0.89 13.95 7.8 301.8 101.4 381.4
c-C 1x m 4.113 2.34 1.8 1.32 13.03 6.94 183.8 131.4 501.8
c-B 1x m 4.032 2.18 1.9 1.18 12.44 5.08 210.1 96.3 154.4
c-A 1x f 4.631 1.93 2.7 0.71 12.99 5.17 193.3 104.2 487.2
c-D 1x f 4.465 2.51 2 1.28 12.71 4.94 206.2 41.5 952
Continued
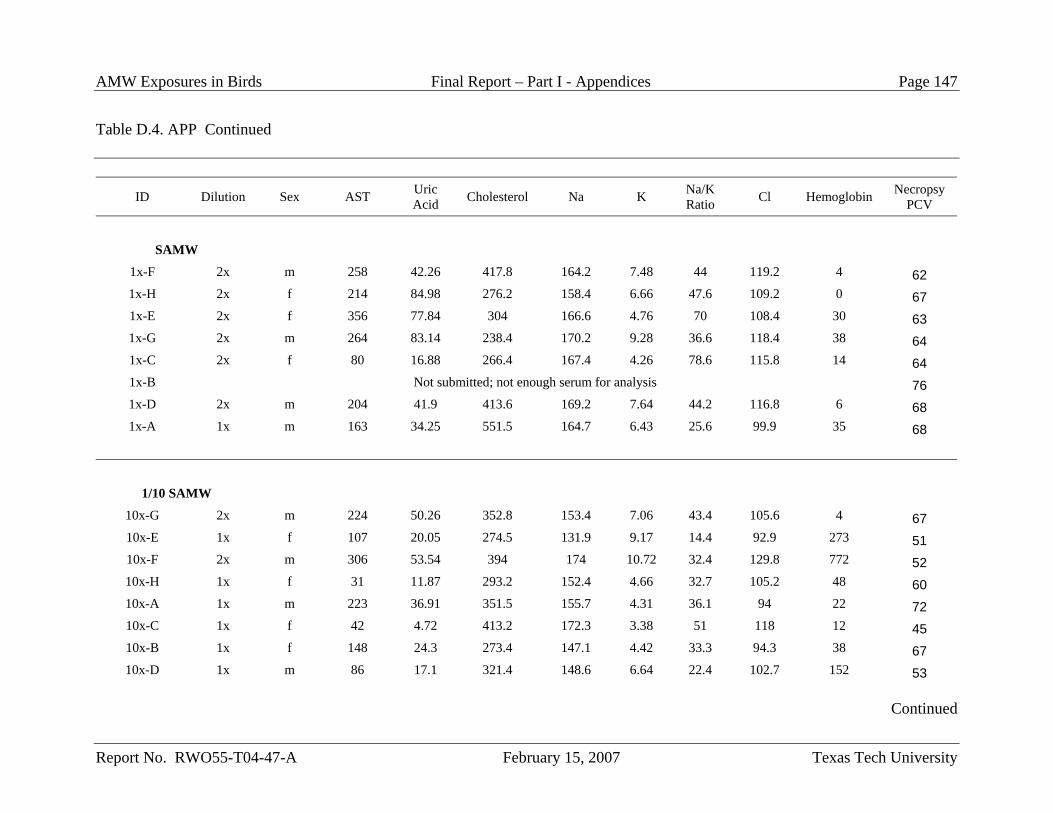
AMW Exposures in Birds Final Report – Part I - Appendices Page 147
Report No. RWO55-T04-47-A February 15, 2007 Texas Tech University
Table D.4. APP Continued
ID Dilution Sex AST Uric Acid Cholesterol Na K Na/K
Ratio Cl Hemoglobin Necropsy PCV
SAMW
1x-F 2x m 258 42.26 417.8 164.2 7.48 44 119.2 4 62 1x-H 2x f 214 84.98 276.2 158.4 6.66 47.6 109.2 0 67 1x-E 2x f 356 77.84 304 166.6 4.76 70 108.4 30 63 1x-G 2x m 264 83.14 238.4 170.2 9.28 36.6 118.4 38 64 1x-C 2x f 80 16.88 266.4 167.4 4.26 78.6 115.8 14 64 1x-B Not submitted; not enough serum for analysis 76 1x-D 2x m 204 41.9 413.6 169.2 7.64 44.2 116.8 6 68 1x-A 1x m 163 34.25 551.5 164.7 6.43 25.6 99.9 35 68
1/10 SAMW
10x-G 2x m 224 50.26 352.8 153.4 7.06 43.4 105.6 4 67 10x-E 1x f 107 20.05 274.5 131.9 9.17 14.4 92.9 273 51 10x-F 2x m 306 53.54 394 174 10.72 32.4 129.8 772 52 10x-H 1x f 31 11.87 293.2 152.4 4.66 32.7 105.2 48 60 10x-A 1x m 223 36.91 351.5 155.7 4.31 36.1 94 22 72 10x-C 1x f 42 4.72 413.2 172.3 3.38 51 118 12 45 10x-B 1x f 148 24.3 273.4 147.1 4.42 33.3 94.3 38 67 10x-D 1x m 86 17.1 321.4 148.6 6.64 22.4 102.7 152 53
Continued
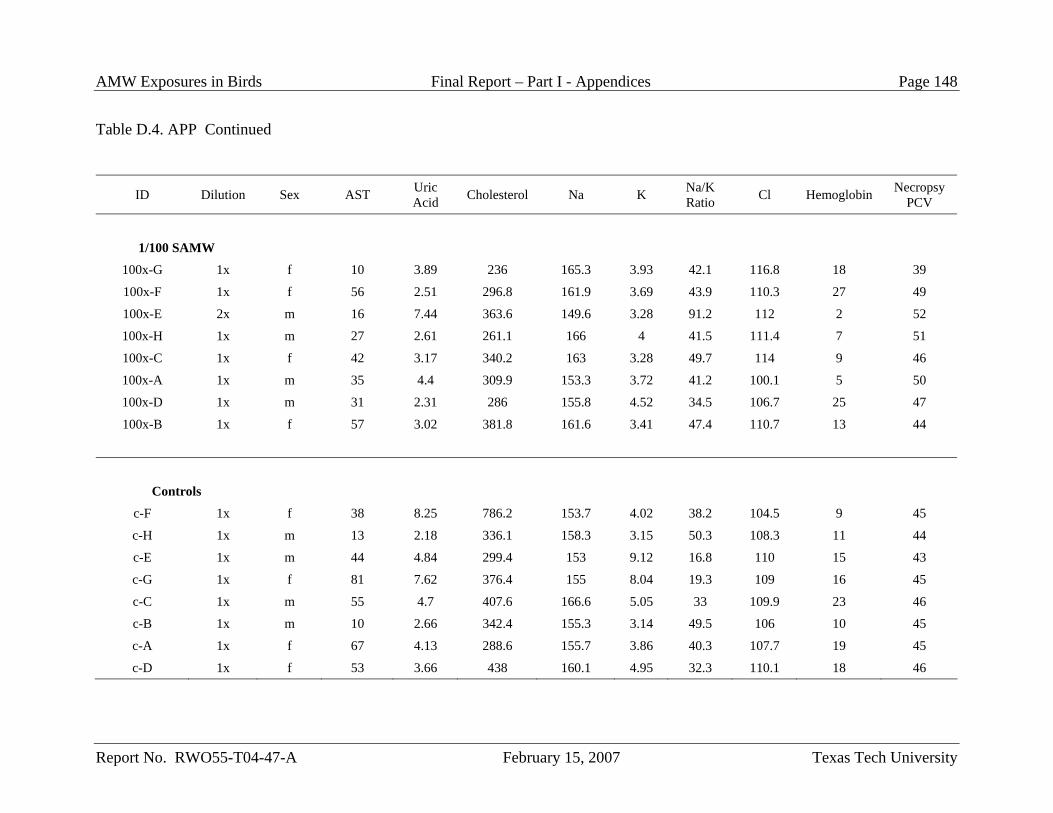
AMW Exposures in Birds Final Report – Part I - Appendices Page 148
Report No. RWO55-T04-47-A February 15, 2007 Texas Tech University
Table D.4. APP Continued
ID Dilution Sex AST Uric Acid Cholesterol Na K Na/K
Ratio Cl Hemoglobin Necropsy PCV
1/100 SAMW
100x-G 1x f 10 3.89 236 165.3 3.93 42.1 116.8 18 39
100x-F 1x f 56 2.51 296.8 161.9 3.69 43.9 110.3 27 49
100x-E 2x m 16 7.44 363.6 149.6 3.28 91.2 112 2 52
100x-H 1x m 27 2.61 261.1 166 4 41.5 111.4 7 51
100x-C 1x f 42 3.17 340.2 163 3.28 49.7 114 9 46
100x-A 1x m 35 4.4 309.9 153.3 3.72 41.2 100.1 5 50
100x-D 1x m 31 2.31 286 155.8 4.52 34.5 106.7 25 47
100x-B 1x f 57 3.02 381.8 161.6 3.41 47.4 110.7 13 44
Controls
c-F 1x f 38 8.25 786.2 153.7 4.02 38.2 104.5 9 45
c-H 1x m 13 2.18 336.1 158.3 3.15 50.3 108.3 11 44
c-E 1x m 44 4.84 299.4 153 9.12 16.8 110 15 43
c-G 1x f 81 7.62 376.4 155 8.04 19.3 109 16 45
c-C 1x m 55 4.7 407.6 166.6 5.05 33 109.9 23 46
c-B 1x m 10 2.66 342.4 155.3 3.14 49.5 106 10 45
c-A 1x f 67 4.13 288.6 155.7 3.86 40.3 107.7 19 45
c-D 1x f 53 3.66 438 160.1 4.95 32.3 110.1 18 46
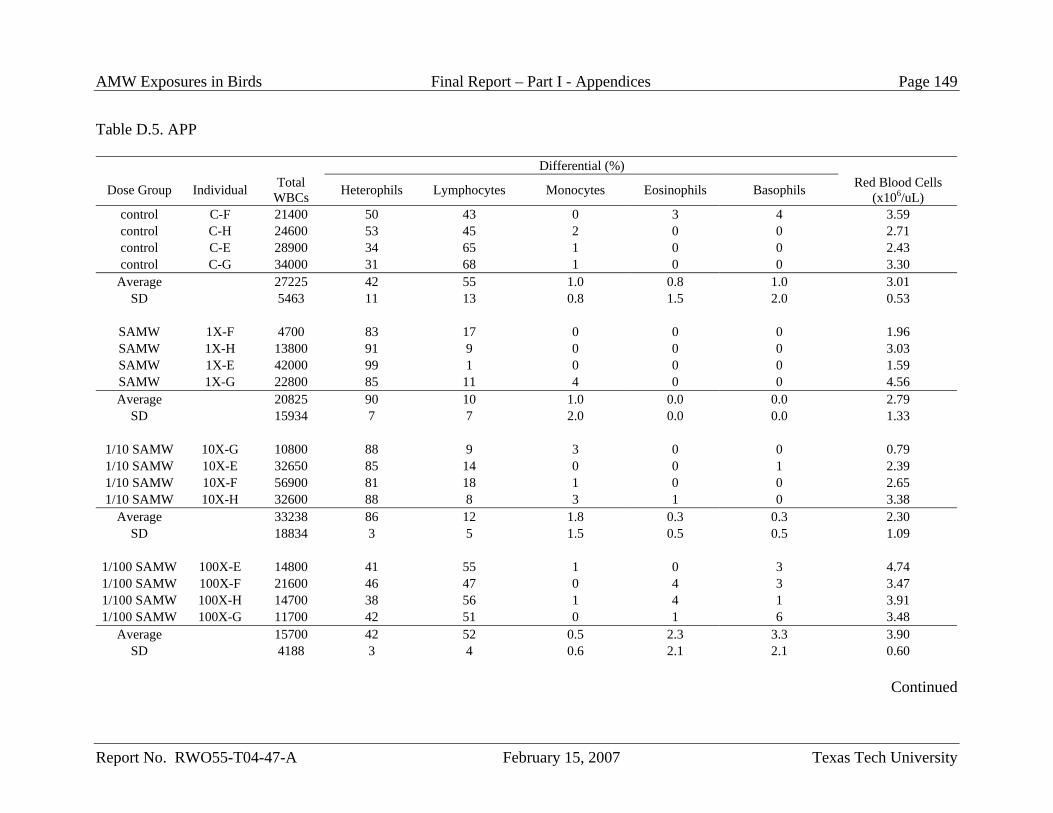
AMW Exposures in Birds Final Report – Part I - Appendices Page 149
Report No. RWO55-T04-47-A February 15, 2007 Texas Tech University
Table D.5. APP
Differential (%)
Dose Group Individual Total WBCs Heterophils Lymphocytes Monocytes Eosinophils Basophils Red Blood Cells
(x106/uL) control C-F 21400 50 43 0 3 4 3.59 control C-H 24600 53 45 2 0 0 2.71 control C-E 28900 34 65 1 0 0 2.43 control C-G 34000 31 68 1 0 0 3.30
Average 27225 42 55 1.0 0.8 1.0 3.01 SD 5463 11 13 0.8 1.5 2.0 0.53
SAMW 1X-F 4700 83 17 0 0 0 1.96 SAMW 1X-H 13800 91 9 0 0 0 3.03 SAMW 1X-E 42000 99 1 0 0 0 1.59 SAMW 1X-G 22800 85 11 4 0 0 4.56 Average 20825 90 10 1.0 0.0 0.0 2.79
SD 15934 7 7 2.0 0.0 0.0 1.33
1/10 SAMW 10X-G 10800 88 9 3 0 0 0.79 1/10 SAMW 10X-E 32650 85 14 0 0 1 2.39 1/10 SAMW 10X-F 56900 81 18 1 0 0 2.65 1/10 SAMW 10X-H 32600 88 8 3 1 0 3.38
Average 33238 86 12 1.8 0.3 0.3 2.30 SD 18834 3 5 1.5 0.5 0.5 1.09
1/100 SAMW 100X-E 14800 41 55 1 0 3 4.74 1/100 SAMW 100X-F 21600 46 47 0 4 3 3.47 1/100 SAMW 100X-H 14700 38 56 1 4 1 3.91 1/100 SAMW 100X-G 11700 42 51 0 1 6 3.48
Average 15700 42 52 0.5 2.3 3.3 3.90 SD 4188 3 4 0.6 2.1 2.1 0.60
Continued
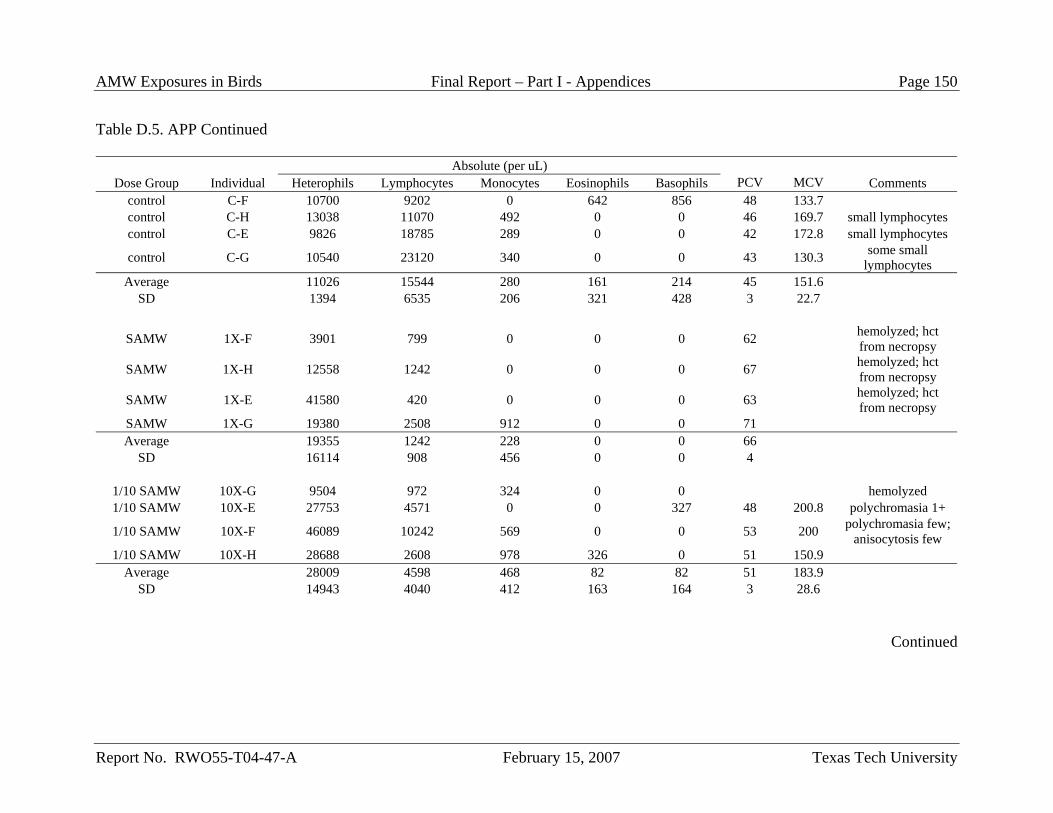
AMW Exposures in Birds Final Report – Part I - Appendices Page 150
Report No. RWO55-T04-47-A February 15, 2007 Texas Tech University
Table D.5. APP Continued
Absolute (per uL) Dose Group Individual Heterophils Lymphocytes Monocytes Eosinophils Basophils PCV MCV Comments
control C-F 10700 9202 0 642 856 48 133.7 control C-H 13038 11070 492 0 0 46 169.7 small lymphocytes control C-E 9826 18785 289 0 0 42 172.8 small lymphocytes
control C-G 10540 23120 340 0 0 43 130.3 some small lymphocytes
Average 11026 15544 280 161 214 45 151.6 SD 1394 6535 206 321 428 3 22.7
SAMW 1X-F 3901 799 0 0 0 62 hemolyzed; hct from necropsy
SAMW 1X-H 12558 1242 0 0 0 67 hemolyzed; hct from necropsy
SAMW 1X-E 41580 420 0 0 0 63 hemolyzed; hct from necropsy
SAMW 1X-G 19380 2508 912 0 0 71 Average 19355 1242 228 0 0 66
SD 16114 908 456 0 0 4
1/10 SAMW 10X-G 9504 972 324 0 0 hemolyzed 1/10 SAMW 10X-E 27753 4571 0 0 327 48 200.8 polychromasia 1+
1/10 SAMW 10X-F 46089 10242 569 0 0 53 200 polychromasia few; anisocytosis few
1/10 SAMW 10X-H 28688 2608 978 326 0 51 150.9 Average 28009 4598 468 82 82 51 183.9
SD 14943 4040 412 163 164 3 28.6
Continued
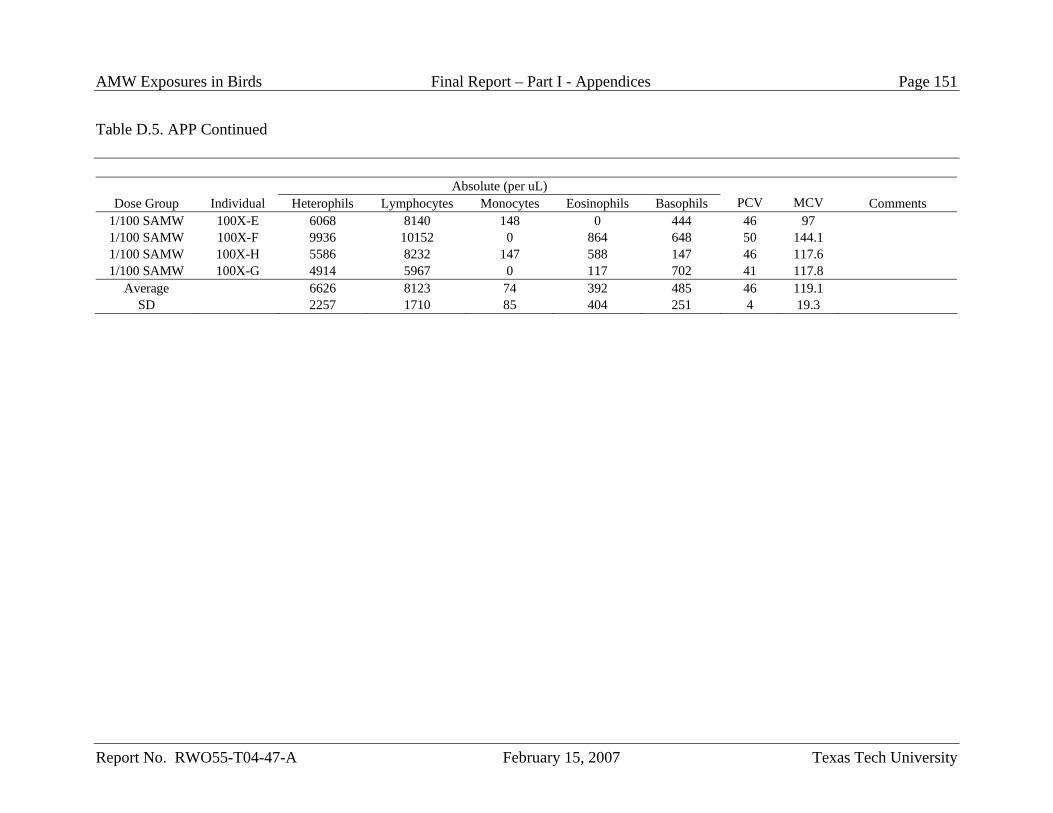
AMW Exposures in Birds Final Report – Part I - Appendices Page 151
Report No. RWO55-T04-47-A February 15, 2007 Texas Tech University
Table D.5. APP Continued
Absolute (per uL)
Dose Group Individual Heterophils Lymphocytes Monocytes Eosinophils Basophils PCV MCV Comments 1/100 SAMW 100X-E 6068 8140 148 0 444 46 97 1/100 SAMW 100X-F 9936 10152 0 864 648 50 144.1 1/100 SAMW 100X-H 5586 8232 147 588 147 46 117.6 1/100 SAMW 100X-G 4914 5967 0 117 702 41 117.8
Average 6626 8123 74 392 485 46 119.1 SD 2257 1710 85 404 251 4 19.3
AMW Exposures in Birds Final Report – Part I - Appendices Page 152
Report No. RWO55-T04-47-A February 15, 2007 Texas Tech University
Photographs of Animal Caging and Pathology
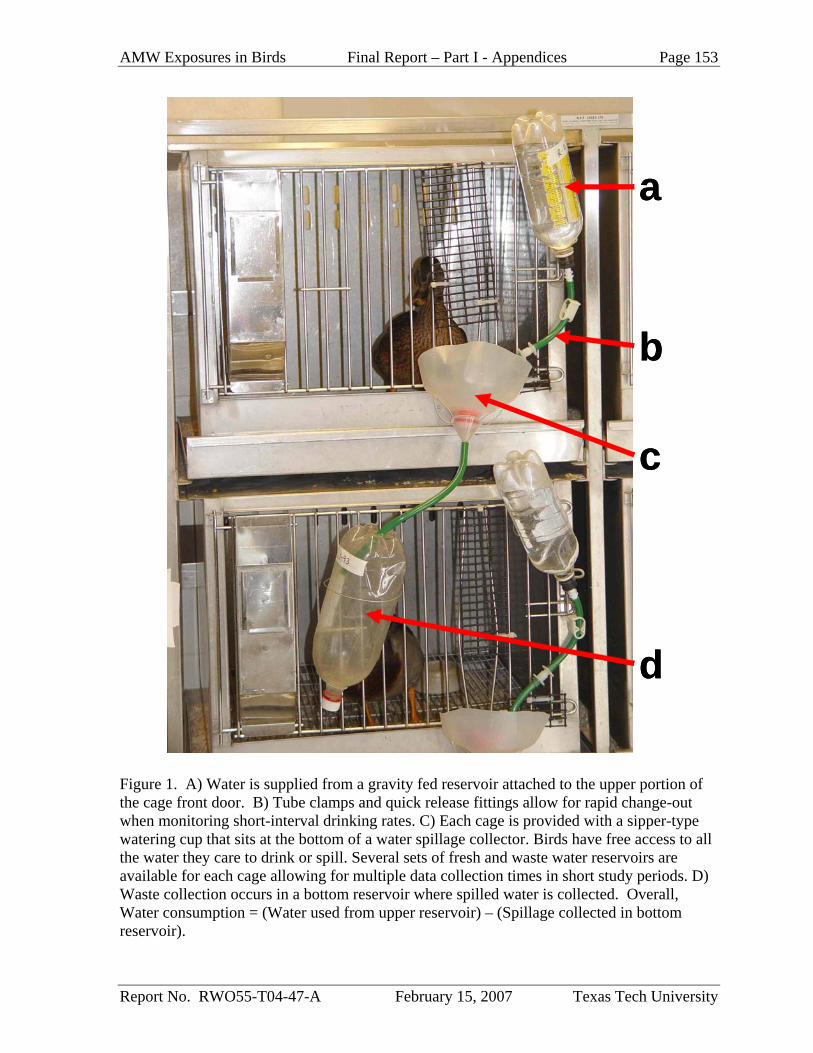
AMW Exposures in Birds Final Report – Part I - Appendices Page 153
Report No. RWO55-T04-47-A February 15, 2007 Texas Tech University
Figure 1. A) Water is supplied from a gravity fed reservoir attached to the upper portion of the cage front door. B) Tube clamps and quick release fittings allow for rapid change-out when monitoring short-interval drinking rates. C) Each cage is provided with a sipper-type watering cup that sits at the bottom of a water spillage collector. Birds have free access to all the water they care to drink or spill. Several sets of fresh and waste water reservoirs are available for each cage allowing for multiple data collection times in short study periods. D) Waste collection occurs in a bottom reservoir where spilled water is collected. Overall, Water consumption = (Water used from upper reservoir) – (Spillage collected in bottom reservoir).
a
b
c
d
a
b
c
d
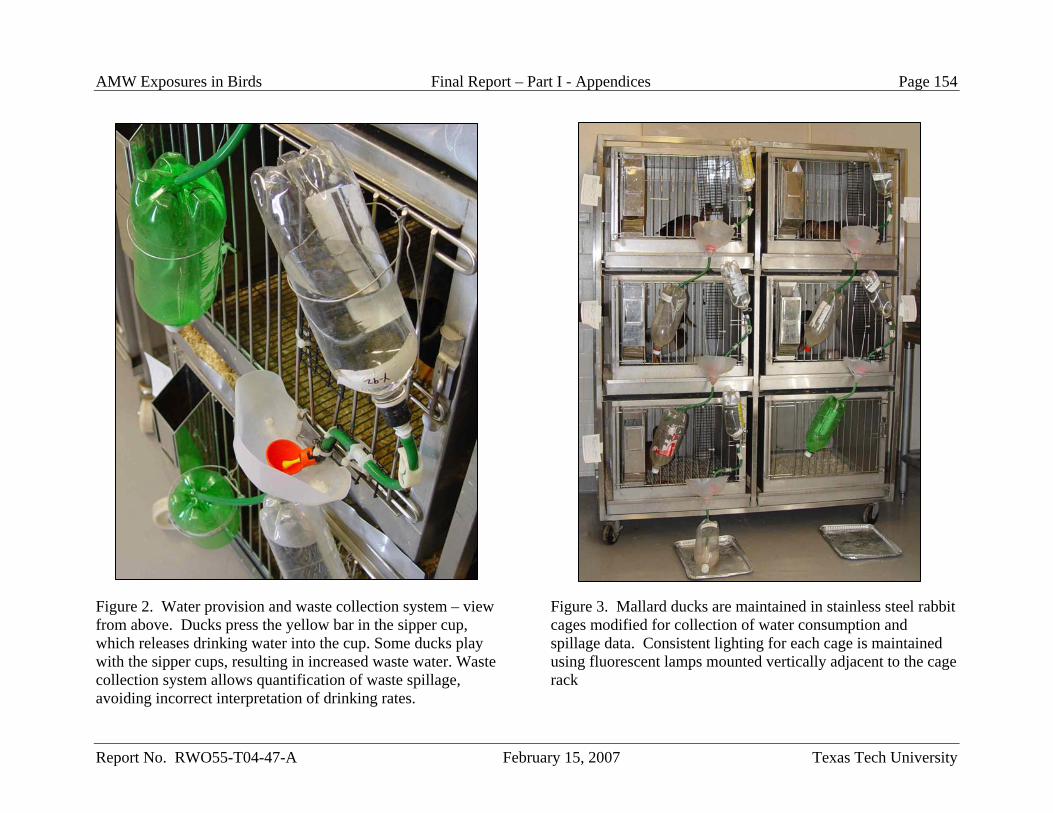
AMW Exposures in Birds Final Report – Part I - Appendices Page 154
Report No. RWO55-T04-47-A February 15, 2007 Texas Tech University
Figure 2. Water provision and waste collection system – view from above. Ducks press the yellow bar in the sipper cup, which releases drinking water into the cup. Some ducks play with the sipper cups, resulting in increased waste water. Waste collection system allows quantification of waste spillage, avoiding incorrect interpretation of drinking rates.
Figure 3. Mallard ducks are maintained in stainless steel rabbit cages modified for collection of water consumption and spillage data. Consistent lighting for each cage is maintained using fluorescent lamps mounted vertically adjacent to the cage rack
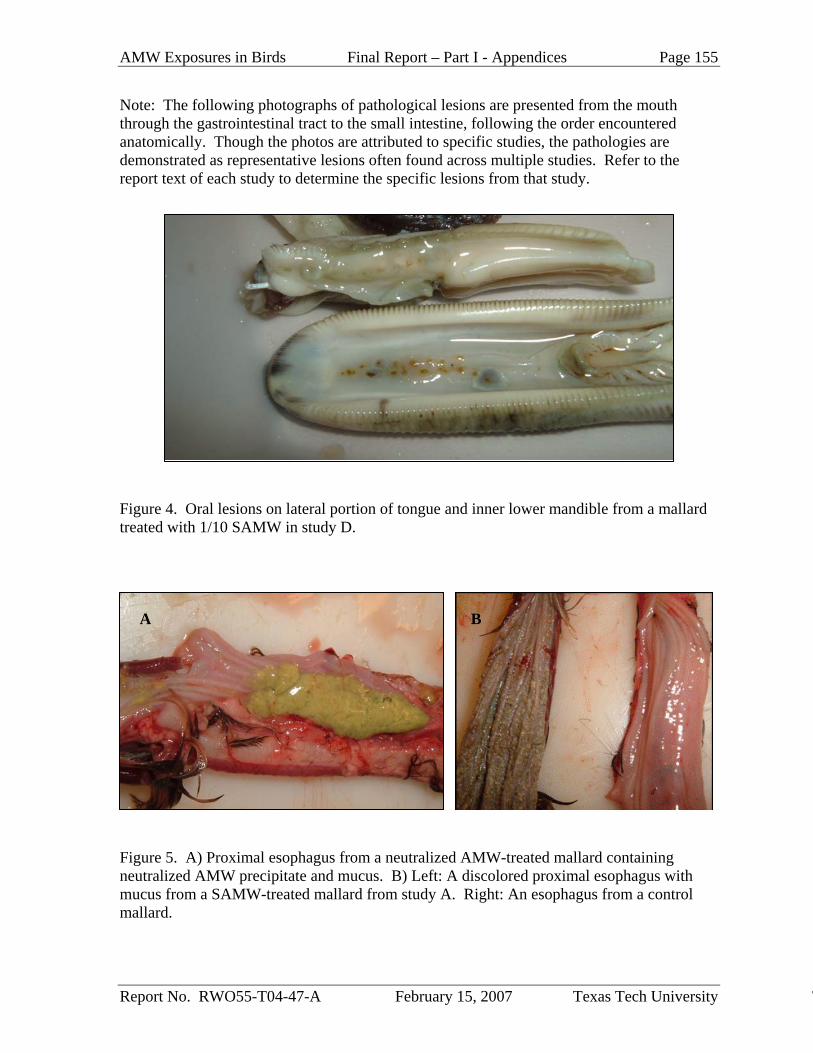
AMW Exposures in Birds Final Report – Part I - Appendices Page 155
Report No. RWO55-T04-47-A February 15, 2007 Texas Tech University T
Note: The following photographs of pathological lesions are presented from the mouth through the gastrointestinal tract to the small intestine, following the order encountered anatomically. Though the photos are attributed to specific studies, the pathologies are demonstrated as representative lesions often found across multiple studies. Refer to the report text of each study to determine the specific lesions from that study. Figure 4. Oral lesions on lateral portion of tongue and inner lower mandible from a mallard treated with 1/10 SAMW in study D.
A B Figure 5. A) Proximal esophagus from a neutralized AMW-treated mallard containing neutralized AMW precipitate and mucus. B) Left: A discolored proximal esophagus with mucus from a SAMW-treated mallard from study A. Right: An esophagus from a control mallard.
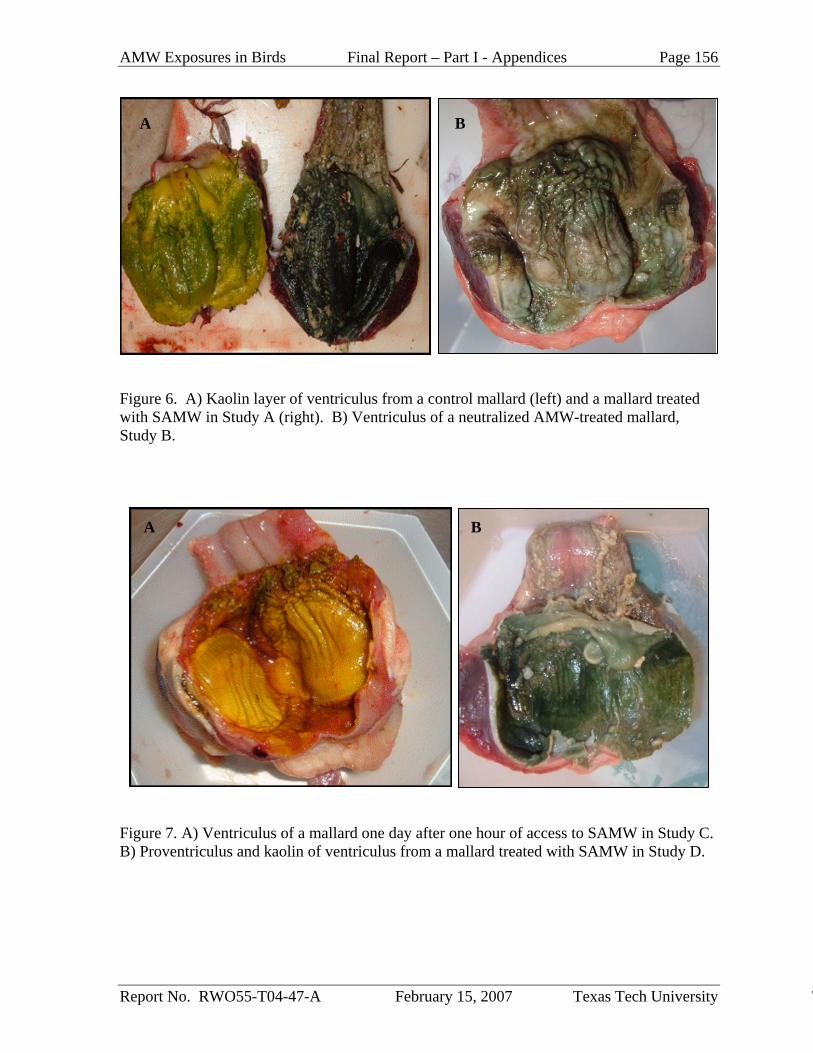
AMW Exposures in Birds Final Report – Part I - Appendices Page 156
Report No. RWO55-T04-47-A February 15, 2007 Texas Tech University T
A B Figure 6. A) Kaolin layer of ventriculus from a control mallard (left) and a mallard treated with SAMW in Study A (right). B) Ventriculus of a neutralized AMW-treated mallard, Study B. A B
Figure 7. A) Ventriculus of a mallard one day after one hour of access to SAMW in Study C. B) Proventriculus and kaolin of ventriculus from a mallard treated with SAMW in Study D.
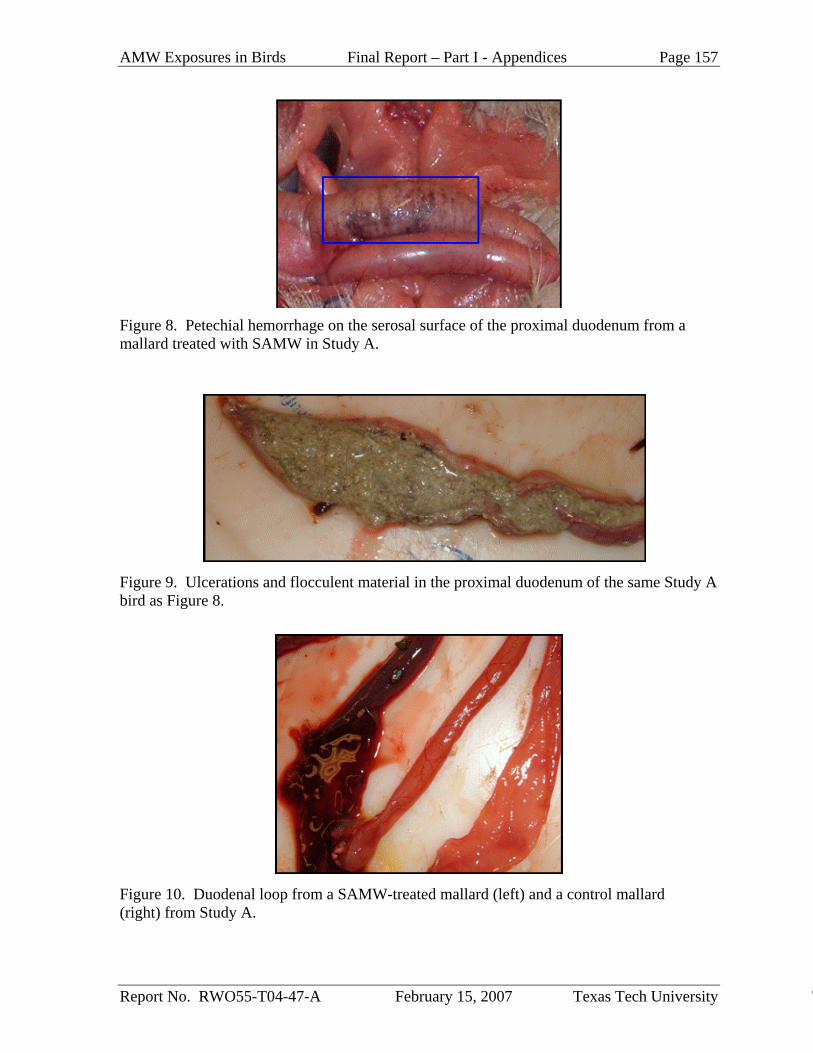
AMW Exposures in Birds Final Report – Part I - Appendices Page 157
Report No. RWO55-T04-47-A February 15, 2007 Texas Tech University T
Figure 8. Petechial hemorrhage on the serosal surface of the proximal duodenum from a mallard treated with SAMW in Study A. Figure 9. Ulcerations and flocculent material in the proximal duodenum of the same Study A bird as Figure 8. Figure 10. Duodenal loop from a SAMW-treated mallard (left) and a control mallard (right) from Study A.
Recommended


