
Phoebe A. Rollyson, Urska Cvek, Marjan Trutschl, J. Steven Alexander and Ikuo TsunodaSeiichi Omura, Eiichiro Kawai, Fumitaka Sato, Nicholas E. Martinez, Ganta V. Chaitanya,
Candidates in a Novel Mouse Model for Viral MyocarditisBioinformatics Multivariate Analysis Determined a Set of Phase-Specific Biomarker
Print ISSN: 1942-325X. Online ISSN: 1942-3268 Copyright © 2014 American Heart Association, Inc. All rights reserved.
Dallas, TX 75231is published by the American Heart Association, 7272 Greenville Avenue,Circulation: Cardiovascular Genetics
doi: 10.1161/CIRCGENETICS.114.0005052014;7:444-454; originally published online July 16, 2014;Circ Cardiovasc Genet.
http://circgenetics.ahajournals.org/content/7/4/444World Wide Web at:
The online version of this article, along with updated information and services, is located on the
http://circgenetics.ahajournals.org/content/suppl/2014/07/16/CIRCGENETICS.114.000505.DC1.htmlData Supplement (unedited) at:
http://circgenetics.ahajournals.org//subscriptions/
is online at: Circulation: Cardiovascular Genetics Information about subscribing to Subscriptions:
http://www.lww.com/reprints Information about reprints can be found online at: Reprints:
document. Permissions and Rights Question and Answer information about this process is available in the
requested is located, click Request Permissions in the middle column of the Web page under Services. FurtherCenter, not the Editorial Office. Once the online version of the published article for which permission is being
can be obtained via RightsLink, a service of the Copyright ClearanceCirculation: Cardiovascular Geneticsin Requests for permissions to reproduce figures, tables, or portions of articles originally publishedPermissions:
by guest on August 19, 2014http://circgenetics.ahajournals.org/Downloaded from by guest on August 19, 2014http://circgenetics.ahajournals.org/Downloaded from by guest on August 19, 2014http://circgenetics.ahajournals.org/Downloaded from by guest on August 19, 2014http://circgenetics.ahajournals.org/Downloaded from by guest on August 19, 2014http://circgenetics.ahajournals.org/Downloaded from by guest on August 19, 2014http://circgenetics.ahajournals.org/Downloaded from by guest on August 19, 2014http://circgenetics.ahajournals.org/Downloaded from by guest on August 19, 2014http://circgenetics.ahajournals.org/Downloaded from by guest on August 19, 2014http://circgenetics.ahajournals.org/Downloaded from by guest on August 19, 2014http://circgenetics.ahajournals.org/Downloaded from by guest on August 19, 2014http://circgenetics.ahajournals.org/Downloaded from by guest on August 19, 2014http://circgenetics.ahajournals.org/Downloaded from by guest on August 19, 2014http://circgenetics.ahajournals.org/Downloaded from by guest on August 19, 2014http://circgenetics.ahajournals.org/Downloaded from by guest on August 19, 2014http://circgenetics.ahajournals.org/Downloaded from by guest on August 19, 2014http://circgenetics.ahajournals.org/Downloaded from by guest on August 19, 2014http://circgenetics.ahajournals.org/Downloaded from by guest on August 19, 2014http://circgenetics.ahajournals.org/Downloaded from by guest on August 19, 2014http://circgenetics.ahajournals.org/Downloaded from by guest on August 19, 2014http://circgenetics.ahajournals.org/Downloaded from by guest on August 19, 2014http://circgenetics.ahajournals.org/Downloaded from by guest on August 19, 2014http://circgenetics.ahajournals.org/Downloaded from by guest on August 19, 2014http://circgenetics.ahajournals.org/Downloaded from by guest on August 19, 2014http://circgenetics.ahajournals.org/Downloaded from by guest on August 19, 2014http://circgenetics.ahajournals.org/Downloaded from by guest on August 19, 2014http://circgenetics.ahajournals.org/Downloaded from by guest on August 19, 2014http://circgenetics.ahajournals.org/Downloaded from by guest on August 19, 2014http://circgenetics.ahajournals.org/Downloaded from by guest on August 19, 2014http://circgenetics.ahajournals.org/Downloaded from by guest on August 19, 2014http://circgenetics.ahajournals.org/Downloaded from by guest on August 19, 2014http://circgenetics.ahajournals.org/Downloaded from by guest on August 19, 2014http://circgenetics.ahajournals.org/Downloaded from by guest on August 19, 2014http://circgenetics.ahajournals.org/Downloaded from by guest on August 19, 2014http://circgenetics.ahajournals.org/Downloaded from by guest on August 19, 2014http://circgenetics.ahajournals.org/Downloaded from by guest on August 19, 2014http://circgenetics.ahajournals.org/Downloaded from by guest on August 19, 2014http://circgenetics.ahajournals.org/Downloaded from by guest on August 19, 2014http://circgenetics.ahajournals.org/Downloaded from by guest on August 19, 2014http://circgenetics.ahajournals.org/Downloaded from by guest on August 19, 2014http://circgenetics.ahajournals.org/Downloaded from by guest on August 19, 2014http://circgenetics.ahajournals.org/Downloaded from by guest on August 19, 2014http://circgenetics.ahajournals.org/Downloaded from by guest on August 19, 2014http://circgenetics.ahajournals.org/Downloaded from by guest on August 19, 2014http://circgenetics.ahajournals.org/Downloaded from by guest on August 19, 2014http://circgenetics.ahajournals.org/Downloaded from by guest on August 19, 2014http://circgenetics.ahajournals.org/Downloaded from by guest on August 19, 2014http://circgenetics.ahajournals.org/Downloaded from by guest on August 19, 2014http://circgenetics.ahajournals.org/Downloaded from by guest on August 19, 2014http://circgenetics.ahajournals.org/Downloaded from by guest on August 19, 2014http://circgenetics.ahajournals.org/Downloaded from by guest on August 19, 2014http://circgenetics.ahajournals.org/Downloaded from by guest on August 19, 2014http://circgenetics.ahajournals.org/Downloaded from by guest on August 19, 2014http://circgenetics.ahajournals.org/Downloaded from by guest on August 19, 2014http://circgenetics.ahajournals.org/Downloaded from by guest on August 19, 2014http://circgenetics.ahajournals.org/Downloaded from by guest on August 19, 2014http://circgenetics.ahajournals.org/Downloaded from by guest on August 19, 2014http://circgenetics.ahajournals.org/Downloaded from by guest on August 19, 2014http://circgenetics.ahajournals.org/Downloaded from by guest on August 19, 2014http://circgenetics.ahajournals.org/Downloaded from by guest on August 19, 2014http://circgenetics.ahajournals.org/Downloaded from by guest on August 19, 2014http://circgenetics.ahajournals.org/Downloaded from by guest on August 19, 2014http://circgenetics.ahajournals.org/Downloaded from by guest on August 19, 2014http://circgenetics.ahajournals.org/Downloaded from by guest on August 19, 2014http://circgenetics.ahajournals.org/Downloaded from by guest on August 19, 2014http://circgenetics.ahajournals.org/Downloaded from by guest on August 19, 2014http://circgenetics.ahajournals.org/Downloaded from by guest on August 19, 2014http://circgenetics.ahajournals.org/Downloaded from by guest on August 19, 2014http://circgenetics.ahajournals.org/Downloaded from by guest on August 19, 2014http://circgenetics.ahajournals.org/Downloaded from by guest on August 19, 2014http://circgenetics.ahajournals.org/Downloaded from by guest on August 19, 2014http://circgenetics.ahajournals.org/Downloaded from by guest on August 19, 2014http://circgenetics.ahajournals.org/Downloaded from

444
Myocarditis, an inflammatory disease of the cardiac mus-cle, affects 2 million Americans and is a major cause
of sudden death (8%–20% of sudden deaths in adults).1–3 In addition, 21% of patients with myocarditis develop dilated cardiomyopathy, which can lead to cardiac failure, and some-times requires cardiac transplantation.1 Myocarditis most commonly results from virus infection4,5; in patients with histologically proven myocarditis or dilated cardiomyopathy, 56% of patients had an endomyocardial biopsy specimen test positive for viral genome.4,6
Clinical Perspective on p 454Although the precise pathomechanism is unclear, viral
myocarditis has been suggested to be divided into 3 phases.7 The proposed pathomechanism in each phase is as follows: in phase I, the cardiotropic virus infects and replicates in the
heart, leading to cardiac damage (viral pathology). Innate immune responses against the virus contribute to either viral clearance or recruitment of immune cells, the latter of which can lead to phase II pathology. In phase II, acquired antivi-ral immune responses can damage not only virus-infected but also uninfected cardiomyocytes (immunopathology) in a bystander fashion or through molecular mimicry between the virus and a cardiac antigen; release of cardiac antigens can induce autoimmune responses against cardiac antigens by determinant (or epitope) spreading. In phase III, the tissue damage from phases I and II results in cardiac remodeling and fibrosis, leading to dilated cardiomyopathy, in which immune cell infiltrates or virus persistence can be low or undetectable in the heart. Ideally, personalized medicine should be applied according to the phase of viral myocarditis: antiviral therapy in phase I, immune suppressive or modulating therapy in phase
Background—Myocarditis is an inflammatory disease of the cardiac muscle and is mainly caused by viral infections. Viral myocarditis has been proposed to be divided into 3 phases: the acute viral phase, the subacute immune phase, and the chronic cardiac remodeling phase. Although individualized therapy should be applied depending on the phase, no clinical or experimental studies have found biomarkers that distinguish between the 3 phases. Theiler’s murine encephalomyelitis virus belongs to the genus Cardiovirus and can cause myocarditis in susceptible mouse strains.
Methods and Results—Using this novel model for viral myocarditis induced with Theiler’s murine encephalomyelitis virus, we conducted multivariate analysis including echocardiography, serum troponin and viral RNA titration, and microarray to identify the biomarker candidates that can discriminate the 3 phases. Using C3H mice infected with Theiler’s murine encephalomyelitis virus on 4, 7, and 60 days post infection, we conducted bioinformatics analyses, including principal component analysis and k-means clustering of microarray data, because our traditional cardiac and serum assays, including 2-way comparison of microarray data, did not lead to the identification of a single biomarker. Principal component analysis separated heart samples clearly between the groups of 4, 7, and 60 days post infection. Representative genes contributing to the separation were as follows: 4 and 7 days post infection, innate immunity–related genes, such as Irf7 and Cxcl9; 7 and 60 days post infection, acquired immunity–related genes, such as Cd3g and H2-Aa; and cardiac remodeling–related genes, such as Mmp12 and Gpnmb.
Conclusions—Sets of molecules, not single molecules, identified by unsupervised principal component analysis, were found to be useful as phase-specific biomarkers. (Circ Cardiovasc Genet. 2014;7:444-454.)
Key Words: computational biology ◼ immunology ◼ interferons ◼ Picornaviridae infections ◼ systems biology ◼ T lymphocytes ◼ transcriptome
© 2014 American Heart Association, Inc.
Circ Cardiovasc Genet is available at http://circgenetics.ahajournals.org DOI: 10.1161/CIRCGENETICS.114.000505
Received January 7, 2014; accepted May 29, 2014.From the Departments of Microbiology and Immunology (S.O., E.K., F.S., N.E.M., I.T.) and Molecular and Cellular Physiology (G.V.C., J.S.A.),
Louisiana State University Health Sciences Center, Shreveport; and Department of Computer Science, Louisiana State University Shreveport (P.A.R., U.C., M.T.).
The Data Supplement is available at http://circgenetics.ahajournals.org/lookup/suppl/doi:10.1161/CIRCGENETICS.114.000505/-/DC1.Correspondence to Ikuo Tsunoda, MD, PhD, Department of Microbiology and Immunology, LSU Health Sciences Center, 1501 Kings Hwy, Shreveport,
LA 71130. E-mail [email protected]
Bioinformatics Multivariate Analysis Determined a Set of Phase-Specific Biomarker Candidates in a Novel Mouse
Model for Viral MyocarditisSeiichi Omura, PhD; Eiichiro Kawai, MD; Fumitaka Sato, PhD; Nicholas E. Martinez, PhD;
Ganta V. Chaitanya, PhD; Phoebe A. Rollyson, MS; Urska Cvek, ScD, MBA; Marjan Trutschl, ScD; J. Steven Alexander, PhD; Ikuo Tsunoda, MD, PhD
Original Article
by guest on August 19, 2014http://circgenetics.ahajournals.org/Downloaded from

Omura et al Phase-Specific Biomarkers for Viral Myocarditis 445
II, and ventricular unloading and prevention of mechanical and hormonal stresses in phase III.8 However, because there is no single biomarker that distinguishes all 3 phases, there are potential risks in viral myocarditis treatment. For example, although immunosuppressive therapy can be effective to block immunopathology in phase II, the same therapy in phase I may suppress antiviral immunity, leading to enhancement of viral replication.
Although there are several approaches to identify each phase of viral myocarditis, there are no standard methods to distinguish between all 3 phases. Cardiac troponin and cre-atine kinase in serum have been used as biomarkers for car-diac damage, including myocarditis.9 However, both troponin and creatine kinase lack specificity for myocarditis, because they can be released into serum, when cardiomyocytes are damaged, regardless of the cause.10 Troponin and creatine kinase are detectable in both phases I and II, but often unde-tectable in phase III, because dilated cardiomyopathy can develop without damage of cardiomyocytes themselves.11 Echocardiography has also been used to monitor myocarditis despite low sensitivity.1 Left ventricle dysfunction, abnormal segmental wall motion, and increased wall thickness can be observed in the early phase of myocarditis, although the pro-gression to dilated cardiomyopathy can be observed in phase III by echocardiography.1
Endomyocardial biopsy has been used as a standard in the diagnosis of myocarditis. Dallas criteria define myocarditis by inflammatory infiltrates and associated myocyte necrosis or damage not characteristic of an ischemic event in the biopsy samples.12 However, in theory, phase I may be undetectable by Dallas criteria, if there is no change in cardiac muscle (by definition, the viral phase I precedes infiltration of acquired immune cells in the immune phase II). Indeed, clinically, a large number of articles demonstrated that virus was present in the myocardium in the hearts that had no evidence of myo-carditis by Dallas criteria.13 In addition, sampling error and variations in the interpretation of histological samples often occur. Several reports suggested the failure of diagnosis by Dallas criteria in approximately one third of subjects.14 There has been dissociation between Dallas criteria myocarditis and response to immunomodulation therapy.13 Thus, identi-fying the phase-specific biomarkers with better specificity
and sensitivity is crucial for individualized medicine for viral myocarditis.
Gene expression analyses have been conducted to identify the biomarkers of myocarditis and several reports suggested that tenascin C would be a useful marker for coxsackievirus B–induced myocarditis in mice.15 However, tenascin C can-not be used to distinguish the 3 phases of viral myocarditis from each other because tenascin C was upregulated in the hearts of infected mice when compared with that in uninfected control mice throughout the disease course.16 Microarray anal-yses of myocarditis were also reported in several articles.17 Although Taylor et al18 reported the gene expression profiles in the hearts of coxsackievirus B–infected mice on 3, 9, and 30 days post infection (dpi) and showed the different expres-sion patterns among the time points, they did not identify phase-specific biomarkers. Szalay et al19 reported the different gene expression profiles among the hearts of coxsackievirus B susceptible and resistant mice at several time points and the upregulation of genes associated with immune responses. In summary, these transcriptome analyses using traditional supervised 2-way comparison of gene expressions in current animal models for myocarditis did not lead to the discovery of phase-specific biomarkers that distinguished between all 3 phases.
Theiler’s murine encephalomyelitis virus (TMEV) is a nonenveloped, single-stranded RNA virus that belongs to the genus Cardiovirus.20,21 Although intraperitoneal TMEV infec-tion causes myocarditis in adult mice and can be useful for a viral model for myocarditis, there have been only 2 studies on TMEV-induced myocarditis.22,23 Gómez et al22 reported that intraperitoneal infection of the DA strain of TMEV caused myocarditis in ABY/SnJ and SWR/J mouse strains. Rames23 demonstrated that intracerebral infection of the GDVII and Tex (DA strain-derived) strains of TMEV into CBA mice resulted in myocardial inflammation and interstitial fibrosis in the heart tissue.
We aimed to identify the biomarker candidates that dis-tinguish between the 3 phases of viral myocarditis using multivariate analyses with bioinformatics methods. We have established a novel model system using TMEV and unsu-pervised bioinformatics analyses, such as principal compo-nent analysis (PCA), that have not been applied to identify
4 dpi 7 dpi 60 dpi0
50
100
150
200
250
Hea
rt w
eigh
t (m
g)
4 dpi 7 dpi 60 dpi0
2
4
6
8
10
Hea
rt w
eigh
t (m
g)/B
ody
wei
ght (
g)
0 10 20 30 40 50 60
22
24
26
28
30
32
Mea
n bo
dy w
eigh
t (g/
mou
se)
Days post infection (dpi)
Control TMEV
** *
ControlTMEV **** **
** **
ControlTMEV
** **** **
A B C
Figure 1. Clinical courses of Theiler’s murine encephalomyelitis virus (TMEV)–induced myocarditis. A, Time courses of body weight of age-matched control and TMEV-infected mice. B, Heart weight. C, Heart weight/body weight. n=5 per group per day post infection (dpi). *P<0.05 and **P<0.01.
by guest on August 19, 2014http://circgenetics.ahajournals.org/Downloaded from

446 Circ Cardiovasc Genet August 2014
the phase-specific biomarkers for myocarditis. We found that PCA distinguished between all 3 phases with a set of mole-cules, but not a single molecule, contributing to the separation. Therefore, our model system is a powerful tool to identify phase-specific biomarker candidates of viral myocarditis.
Materials and MethodsDetailed methods are provided in the Data Supplement.
Animal ExperimentsAll experimental procedures involving the use of animals were reviewed and approved by the Institutional Animal Care and Use Committee of LSU and performed according to the criteria outlined by the National Institutes of Health. Samples were collected from 5 infected animals and 5 age-matched controls at each time point in all experiments, un-less otherwise noted. Male C3H/HeNTac mice (5-week-old) were in-fected with TMEV intraperitoneally. On 0, 4, 7, 14, 30, and 60 dpi, we
conducted echocardiography using the Vevo 770 High-Resolution In vivo Micro-Imaging System (VisualSonics). The levels of cardiac tro-ponin I in the sera were measured by ELISA using the Ultra Sensitive Mouse Cardiac Troponin-I ELISA Kit (Life Diagnostics).
Microarray Analysis and Real-Time Polymerase Chain ReactionTotal RNA was processed and hybridized to the GeneChip Mouse 1.0ST Array (Affymetrix).24 The data were normalized by robust multi-array average. The data have been deposited into the Gene Expression Omnibus repository in National Center for Biotechnology Information (accession number: GSE53607). Real-time polymerase chain reaction (PCR) was conducted by the MyiQ2 Real-Time PCR Detection System (Bio-Rad). The results were normalized using a housekeeping gene Gapd.
Bioinformatics and Statistics AnalysesWe drew a volcano plot, using the OriginPro 8.1 (OriginLab Corporation) to assess significance together with fold change of tran-scriptome data.25 K-means clustering was conducted to clarify the variances of gene expression patterns during the disease course, using the R version 2.15.1.26 PCA can reduce the dimensionality of a data set consisting of a large number of interrelated variables, whereas retaining as much as possible of the variation present in the data set.27 PCA was also conducted using the R package prcomp. The data were showed as mean+SEM. Statistical comparisons were conducted using Student t test or ANOVA in the OriginPro 8.1. P<0.05 was considered as a significant difference.
ResultsClinical Signs and Echocardiograms of Viral MyocarditisWe induced viral myocarditis in C3H mice by intraperito-neal TMEV injection and monitored body weight changes for 2 months (Figure 1). Infected mice gained weight slower than uninfected control mice significantly from 13 to 29 dpi (P<0.05). Infected mice developed no clinical signs that sug-gest heart failure, such as low activity and ankle edema.28 On 4, 7, and 60 dpi, we killed 5 infected and control mice and weighed their hearts. In infected mice, the heart weight was significantly lighter on 4 dpi (P<0.05), heavier on 7 dpi (P<0.05), and same on 60 dpi compared with control mice. The heart/body weight ratio, which is an indicator of cardiac hypertrophy,29 showed a similar trend to the heart weight.
We monitored the development of myocarditis for 2 months by echocardiography starting 4 dpi. On 4 dpi, we observed no morphological abnormalities in 90% of mice, using B-mode of echocardiography; only 10% (1 of 10 mice) of infected mice showed small high-intensity lesions in the left ventricle wall of the heart (Figure 2). On 7 dpi, several high-intensity lesions were observed inside the left ventricle wall of the hearts in all infected mice. On 60 dpi, multiple high-intensity lesions were observed in all hearts of infected mice. Although we also moni-tored cardiac functions using M-mode, no mice showed signifi-cant abnormality that suggests heart failure (data not shown).
Macroscopically, we found white lesions on the sur-face of the hearts, which corresponded to high-intensity lesions observed in echocardiography on 7 and 60 dpi. Histologically, high-intensity lesions corresponded to inflammation, eosinophilic degeneration, calcification, or fibrosis (data not shown).
A
C
E
D
F
B4 dpi
7 dpi 7 dpi
60 dpi 60 dpi
Figure 2. Echocardiograms of the hearts of Theiler’s murine encephalomyelitis virus (TMEV)–infected mice. A, C, and E, Echo-cardiograms (B-mode) of TMEV-infected mice on 4 (A), 7 (C), and 60 days post infection (dpi; E). B, Schematic diagram of long axis echocardiogram. There were several high-intensity lesions (arrows) in the heart on 7 and 60 dpi. White lesions (arrowheads) on the heart were observed macroscopically on 7 (D) and 60 dpi (F).
by guest on August 19, 2014http://circgenetics.ahajournals.org/Downloaded from

Omura et al Phase-Specific Biomarkers for Viral Myocarditis 447
Correlation Between the Levels of Cardiac Troponin and Viral RNAWe determined the levels of cardiac troponin I in the serum as an indicator for cardiomyocyte damage (Figure 3).10 Serum troponin I was detectable in the TMEV-infected group on 4 dpi, reached a peak at 7 dpi, and became undetectable by 14 dpi. No serum troponin I was detected in control mice. We also quantified the levels of viral RNA in the hearts by real-time PCR. Interestingly, in contrast to serum troponin I levels, we detected higher levels of viral RNA on 4 dpi than on 7 dpi (10-fold; P<0.05). No viral RNA was detected on 60 dpi. To clarify whether virus replication was associated with cardio-myocyte damage on 4 and 7 dpi, we examined a correlation between the levels of serum troponin I and viral RNA. Levels of serum troponin I and viral RNA were correlated on 4 dpi (r=0.79; P<0.05), but not on 7 dpi (r=0.53; P=0.12). This sug-gested that cardiomyocyte damage was associated with viral replication on 4 dpi, but not on 7 dpi.
Two-Way Supervised Analyses and k-Means Clustering of Gene Expression Profiles in TMEV InfectionTo determine which gene expressions could be altered in the hearts of TMEV-infected mice compared with age-matched control mice during disease, we conducted supervised analy-sis using 2-way comparison of microarray data between the infected and control groups on 4, 7, and 60 dpi. We visualized the numbers of up- or downregulated genes of the hearts from
infected mice, compared with controls, using a volcano plot (Figure 4). At all time points, interestingly, the numbers of genes that were upregulated >2-fold far exceeded the numbers of genes that were downregulated <0.5-fold. Gene upregula-tions were most prominent on 7 dpi, where 570 genes were upregulated, whereas 169 and 38 genes were upregulated on 4 and 60 dpi, respectively. The numbers of downregulated genes were relatively small at all 3 time points; 4 dpi, 15 genes; 7 dpi, 13 genes; and 60 dpi, 7 genes. Among the up- or down-regulated genes, more than half of the genes were unidentified by the databases of Mouse Genome Informatics and NetAffx.
To compare the gene expressions between the 3 time points, we drew the heat maps for highly up- or downregulated genes (Figure 5A; Figure I in the Data Supplement). However, the heat maps did not distinguish gene expression patterns clearly between the time points. To identify genes that changed over time with similar patterns, we conducted k-means clustering (Figure 5B; Figure III in the Data Supplement). Among 20 clusters, 6 clusters showed differentially expressed patterns (Figure 5B). Radar chart visualized the different expression patterns of cluster centers in each cluster (Figure 5C; Figure IV in the Data Supplement). Genes in cluster 2 were upregu-lated only on 60 dpi and included cardiac remodeling–related genes, such as Mmp12 and Gpnmb, and immunoglobulin-related genes, such as Igkv10-96, Igj, and Igkv6-15 (Table II in the Data Supplement). Genes in cluster 9 were highly upregu-lated on 4 and 7 dpi, but not on 60 dpi, and included innate immunity–related genes, such as Irf7, Ifit1, and Ifit3, and
A B C*
n.d.
Figure 3. Cardiac troponin in the serum and viral RNA in the heart in Theiler’s murine encephalomyelitis virus (TMEV) infection. A, Serum troponin I levels in control and TMEV-infected mice. B, Viral RNA levels. C, Correlation between the levels of troponin I and viral RNA. n=5 per day post infection (dpi). *P<0.05. n.d. indicates not detectable.
A B C4 dpi 7 dpi 60 dpi
Figure 4. Volcano plots of microarray analyses of the hearts from Theiler’s murine encephalomyelitis virus–infected mice, compared with control mice on 4 (A), 7 (B), and 60 days post infection (dpi; C).
by guest on August 19, 2014http://circgenetics.ahajournals.org/Downloaded from

448 Circ Cardiovasc Genet August 2014
chemokines, such as Cxcl9, Cxcl10, and Ccl5 (Table IV in the Data Supplement). Genes in cluster 19 were slightly upregu-lated only on 7 dpi and included acquired immunity–related genes, such as Cd3g and major histocompatibility complex (MHC) class II–related molecules (H2-Ea-ps, H2-Ab1, and H2-Aa; Table VI in the Data Supplement). Clusters 8 and 20 included substantial downregulated genes only on 60 dpi and cluster 15 included genes downregulated on 4 dpi, whereas these clusters 8, 15, and 20 were mainly composed of non-immune response–related genes (Tables III, V, and VII in the Data Supplement). Although these results showed the different expression patterns of genes in the hearts of TMEV-infected mice, we could not specify the phase-specific biomarkers to distinguish between the 3 phases of viral myocarditis.
Principal Component Analyses to Identify Phase-Specific BiomarkersTo find the phase-specific biomarkers of viral myocarditis, we conducted unsupervised analysis using PCA by entering microarray data from the heart samples without labeling of grouping. In PCA, each principal component (PC) is deter-mined automatically, and PC values for each sample data can be plotted, for example, PC1 as an x axis and PC2 as a y axis. When the data of all samples from 4, 7, and 60 dpi were entered, we found that the samples were separated into 3 distinct populations (Figure 6A). The 3 populations sepa-rated by PC1 values corresponded to the 3 groups from dif-ferent time points completely. The samples from 7 dpi had the highest PC1 values, whereas the samples from 60 dpi had the
A B
CCardiac remodeling and
immunoglobulin
Acquired immunity
Innate immunity
Figure 5. Heat map and k-means clustering of gene expression profiles in the hearts of Theiler’s murine encephalomyelitis virus (TMEV)–infected mice. A, Heat map of 20 upregulated and 16 downregulated genes based on 4 days post infection (dpi) data. Red, blue, and white indicate upregulation, downregulation, and no change, compared with control mice, respectively. Each column represents the data from 1 mouse (5 mice/dpi). A list of abbreviations of genes is shown in Table I in the Data Supplement. B, Clusters of gene with differ-ent expression patterns by k-means clustering. Shown are 6 clusters whose log ratios of cluster centers were >1 or <−1 among the total 20 clusters identified by k-means clustering (all 20 clusters are shown in Figure III in the Data Supplement). The genes in the 6 clusters are listed in Tables II to VII in the Data Supplement. Clusters 2, 9, and 19 included cardiac remodeling–related, innate immunity–related, and acquired immunity–related genes, respectively. C, Radar chart based on the values of cluster centers. The number at each vertex is the cluster number (2, 8, 9, 15, 19, and 20), whereas the numbers along the axis (−2 to 4) are log ratios, compared with age-matched controls.
by guest on August 19, 2014http://circgenetics.ahajournals.org/Downloaded from

Omura et al Phase-Specific Biomarkers for Viral Myocarditis 449
lowest PC1 values. PC1 seemed to associate with the changes in serum troponin I levels; we confirmed that the PC1 val-ues correlated strongly with serum troponin I levels (r=0.81; P<0.001; Figure V in the Data Supplement). Thus, PC1 could reflect cardiomyocyte damage or viral replication. The pro-portions of variance of PCs showed that PC1 explained 28% of variance among 15 samples (Figure 6B). By identifying positive and negative top 10 genes of the factor loading for
PC1, we determined which molecules contributed to PC1 values positively and negatively (Figure 6C). Gzmb, Irf7, and Cxcl9 contributed positively, whereas bone morphogeneic protein 10 (Bmp10), Mmp12, and other molecules contributed negatively.
Using sample data from 4 and 7 dpi, not from 60 dpi, we tested whether PCA could separate the samples into 2 dis-tinct populations. Again without grouping, we entered the
-0.15 -0.10 -0.05 0.00 0.05Factor loading for PC1
-0.10 -0.05 0.00 0.05 0.10Factor loading for PC1
-0.10 -0.05 0.00 0.05 0.10Factor loading for PC1
Cd3gGm12185Ccl8Nkg7Spp1Timp1H2-Ea-psH2-AaGzmbIgkv6-32Fam107aAngptl7UnidentfiedUnidentfiedUnidentfiedLrrc52Mettl21eUnidentfiedUnidentfiedBmp10
Gm4841Gm4841Gm12185GzmbBC023105Gm12250Irf7Cxcl9IgtpIrgm1PahInmtPenkGpnmbRetnlaUnidentfiedAtp6v0d2HampMmp12Bmp10
Mmp12Bmp10Atp6v0d2HampUnidentfiedGpnmbRetnlaPenkInmtPahIrgm1Cxcl9IgtpGm12250Irf7BC023105GzmbGm12185Gm4841Gm4841
1 2 3 4 5 6 7 8 9 10Principal component
Prop
ortio
n of
var
ianc
e (%
)
0
10
20
30
40
1 2 3 4 5 6 7 8 9 10Principal component
11 12 1314 15
Prop
ortio
n of
var
ianc
e (%
)
25
20
15
10
5
0
C
Prop
ortio
n of
var
ianc
e (%
)
25
20
15
10
5
01 2 3 4 5 6 7 8 9 10
Principal component
F
I
4 dpi60 dpi
PC1
PC2
7 dpi
A
4 dpi 7 dpi
PC1
PC2
D
60 dpi7 dpi
PC1
PC2
G
B
H
E
Figure 6. Principal component (PC) analyses of microarray data of the hearts from Theiler’s murine encephalomyelitis virus–infected mice. A to C, Analysis of the data from 4, 7, and 60 days post infection (dpi) without grouping. D to F, Analysis of the data from 4 and 7 dpi. G to I, Analysis of the data from 7 and 60 dpi. A, D, and G, PC1 and PC2 values of each sample, which are shown as a symbol; ▲, samples on 4 dpi; ◊, 7 dpi; and ▽, 60 dpi. B, E, and H, Proportion of variance. C, F, and I, Factor loading for the PC1.
by guest on August 19, 2014http://circgenetics.ahajournals.org/Downloaded from

450 Circ Cardiovasc Genet August 2014
microarray data from 4 and 7 dpi for PCA (Figure 6D). PC1 separated the samples into 2 populations, where a population with higher PC1 values corresponded to 7 dpi samples and one with lower PC1 values was composed of 4 dpi samples. PC1 explained 27% of variance of 10 samples (Figure 6E). The factor loading for PC1 showed acquired cellular and humoral immunity–related genes, including CD3 γ-subunit (Cd3g, a T-cell marker), H2-Aa, and Igkv6-32 in the positive top 10 (Figure 6F). These results suggested that the samples between 4 and 7 dpi were distinguishable based on the expressions of a set of acquired immunity–related genes. Importantly, none of these acquired immunity–related genes were ranked among top 20 in supervised 2-way comparison analysis (Figure IB in the Data Supplement); only Nkg7 and Gzmb, which can play a role in both innate and acquired immunities, were listed in top 10 molecules in Figure 6F and Figure IB in the Data Supplement.
Next, we conducted PCA by entering the microarray data from samples on 7 and 60 dpi (Figure 6G). Again, PC1 sep-arated the samples into 2 populations, where populations with higher and lower PC1 values corresponded to 7 and 60 dpi samples, respectively. PC1 explained 40% of variance
among 10 samples (Figure 6H). The factor loading for PC1 showed remodeling-related genes, such as Mmp12, Bmp10, and Gpnmb, in the positive top 10 genes (Figure 6I), whereas immune-associated genes contributed to PC1 negatively. Thus, this set of remodeling genes could distinguish between the samples on 7 and 60 dpi.
Validation of the Microarray Results by Real-Time PCRTo validate the results of microarray analyses and PCAs, we conducted real-time PCR for the representative genes listed in the factor loadings (Figure 7): 2 genes each from innate immune responses (Cxcl9 and Tlr3), acquired immune responses (Gzmb and Cd3g), and cardiac remodeling (Mmp12 and Gpnmb). The expression patterns of Cxcl9, Tlr3, and Gzmb in both microarray analysis and real-time PCR were similar; their expressions were the highest on 7 dpi and the lowest on 60 dpi (Figures 5A and 7). Cd3g was upregulated only on 7 dpi. Mmp12 and Gpnmb were upregulated on 60 dpi. All of the gene expression levels were significantly different between the 3 time points.
4 dpi 7 dpi 60 dpi0
5
10
15
200
300
400
Fold
cha
nge
Mmp12E
A
4 dpi 7 dpi 60 dpi0
50
300
400
500
Fold
cha
nge
Cxcl9** **
B
4 dpi 7 dpi 60 dpi1
2
3
4
5
6
7
8
Fold
cha
nge
Tlr3* **
C
4 dpi 7 dpi 60 dpi0
50
100
150
1000
1500
Fold
cha
nge
Gzmb** **
D
4 dpi 7 dpi 60 dpi
10
20
30
40
50
Fold
cha
nge
Cd3g** **
F
4 dpi 7 dpi 60 dpi0
5
40
60
80
100
Fold
cha
nge
Gpnmb****
Figure 7. Differential gene expres-sions related to innate immunity (A and B), cellular immunity (C and D), and remodeling (E and F) during the disease course. Fold changes were calculated using the age-matched uninfected control mice. n=5 per day post infection (dpi). *P<0.05 and **P<0.01.
by guest on August 19, 2014http://circgenetics.ahajournals.org/Downloaded from

Omura et al Phase-Specific Biomarkers for Viral Myocarditis 451
To clarify whether each gene expression was induced in response to heart damage, a correlation between serum tropo-nin I levels and each gene expression ratios was determined (Figure VI in the Data Supplement). The expressions of Cxcl9 and Tlr3 were correlated with troponin I levels on 4 dpi. The expression of Gzmb was correlated significantly with troponin I levels on 7 dpi, whereas the correlation between Cd3g expres-sion and troponin I levels did not reach statistical significance.
DiscussionTo date, although several markers are helpful to diagnose viral myocarditis, no markers can be used to discriminate all 3 phases by itself. In the present study, we conducted multivariate analysis using echocardiography, serum troponin I ELISA, viral RNA real-time PCR, and transcriptome assays on 4 (phase I), 7 (phase II), and 60 (phase III) dpi (Table). Echocardiography did not visualize cardiomyocyte damage on 4 dpi. Serum troponin I and viral RNA were not detectable on 60 dpi. We conducted the gene expression pattern analyses on 4, 7, and 60 dpi, using 2-way comparison of microarray data and Ingenuite Pathway Analysis (IPA; in the Data Supplement) as well as k-means clustering, and then attempted to identify the phase-specific biomarkers to discriminate the 3 phases of viral myocarditis using PCA. We found that a PCA of microar-ray data clearly separated samples from all 3 phases and identified a set of biomarker candidate genes that could contribute to dis-tinguishing between the 3 phases. However, the traditional 2-way comparison of microarray data (heat map) and k-means clustering showed that innate immunity–related genes were upregulated on both 4 and 7 dpi, acquired immunity–related genes were upregu-lated on both 7 and 60 dpi, and cardiac remodeling–related genes were upregulated on 60 dpi. Here, the traditional transcriptome analysis was useful to characterize gene expression profiles in each phase, but not useful to distinguish between the 3 phases.
Similarly, Seok et al30 raised several issues on traditional transcriptome analysis based on the extent of fold changes of samples of interest compared with controls. Using peripheral blood transcriptome data from humans and mice with 3 dis-eases: trauma, burn, and endotoxemia, Seok et al showed that gene expression changes between humans and mouse models did not correlate. Interestingly, they also demonstrated that the transcriptome patterns, such as using heat map, among the samples from humans with the 3 diseases were similar; it
seemed that traditional transcriptome analyses were not use-ful to discriminate the different disease samples. In our current experiment, we also found that transcriptome analyses based on the extent of fold change were not useful to discriminate the samples from 3 phases of myocarditis; heat maps between 4 and 7 dpi samples or between 7 and 60 dpi samples showed similar patterns. Seok et al and other research groups suggested that improvements of current animal model systems (rather than use of a single model) as well as several factors need to be considered in evaluating interspecies data, such as variations in sensitivity among different probe sets for genes on the microar-rays31 and identification of orthologues.32 Our current article has addressed several issues above. First, we used transcriptome data from affected organs, not from peripheral blood cells; high degree of correlation between the transcriptome data in affected organs between humans and mouse models has been reported.33 Second, our unsupervised PCA is not based on the order of lev-els of up- or downregulation of genes; our PCA led to identifi-cation of biomarker candidates, unlike our 2-way comparison based on the levels of up- or downregulation of genes. Third, our new TMEV-induced myocarditis model provides a clini-cally more relevant myocarditis model to existing model sys-tems that have been sometimes shown to be inconsistent with findings in human cases. For example, interferon (IFN)-γ seems to play an effector role in human cases34,35 and the TMEV model (Table IX in the Data Supplement), whereas IFN-γ is protective in a coxsackievirus model.36,37 Reovirus-induced cardiac dam-age in neonatal mice is caused by a direct cytopathic effect on cardiomyocytes, and not immune-mediated; the reovirus model represents phase I, but not phase II or III.38
On 4 dpi, the low levels of serum troponin I and high levels of viral RNA were detected in the hearts of infected mice, whereas microarray analyses showed upregulation of innate immunity–related genes. In phase I of viral myocarditis, viral entry/repli-cation as well as innate immune responses for viral clearance have been proposed to contribute to cardiomyocyte damage, resulting in cardiac troponin release in serum.7 A significant decrease in heart weight in infected mice could be because of cardiomyocyte loss caused by direct virus lytic infection with-out recruitment of acquired immune cells or edema in the heart.
TMEV is a single-stranded RNA virus that has been shown to be recognized by melanoma differentiation–associated protein 5 (MDA5), which is also known as IFN induced with helicase C domain 1 (Ifih1), and toll-like receptors (Tlr3 and Tlr7).39–41 Our current transcriptome data showed significant upregula-tion of MDA5 and toll-like receptors on both 4 and 7 dpi (Ifih1, 2.7- and 4.4-fold; Tlr3, 2.2- and 2.8-fold; and Tlr7, 1.4- and 1.7-fold, compared with control mice on 4 and 7 dpi, respectively; P<0.001). Although we did not find the change in the expres-sion of mitochondrial antiviral signaling protein (Mavs), a key molecule in the signaling from MDA5, we detected significant upregulation of Irf7, downstream gene of Mavs, on both 4 and 7 dpi (17.3-fold on 4 dpi and 24.4-fold on 7 dpi; P<0.001). Thus, the pathway of innate immune responses mediated by MDA5 seemed to be involved in in vivo TMEV infection in the heart. An interesting result of 4 dpi transcriptome data was that although there was a strong interferon-stimulated gene signature, upregu-lation of type I IFN genes themselves were curiously completely missing (Figure VII in the Data Supplement). This gene patterns
Table. Phase-Specific Biomarkers in Theiler’s Murine Encephalomyelitis Virus–Induced Myocarditis
4 dpi (Phase I) 7 dpi (Phase II) 60 dpi (Phase III)
Echocardiography − + +
Serum troponin I + ++ −
Viral replication ++ + −
Microarray
Innate immunity ++ +++ −
Acquired immunity
− ++ +
Cardiac remodeling
− + ++
− indicates undetectable; +, above the sensitivity limit; ++, moderately positive; +++, highly positive; and dpi indicates days post infection.
by guest on August 19, 2014http://circgenetics.ahajournals.org/Downloaded from

452 Circ Cardiovasc Genet August 2014
suggest that interferon regulatory factor (IRF)-dependent induc-tion of interferon-stimulated gene that is independent of type I IFN production. Similar patterns have been reported by oth-ers.42,43 However, we also found upregulation of other pattern recognition receptors, such as retinoic acid–inducible gene-I (RIG-I) gene (DEAD [Asp-Glu-Ala-Asp] box polypeptide 58 [Ddx58]) and laboratory of genetics and physiology 2 (LGP2) gene (DEXH [Asp-Glu-X-His] box polypeptide 58 [Dhx58]; Ddx58, 2.7- and 3.7-fold; Dhx58, 3.0- and 4.4-fold, compared with control mice on 4 and 7 dpi, respectively; P<0.001). Thus, TMEV might be recognized by toll-like receptors and MDA5, stimulating expressions of other receptors.44
On 7 dpi, we detected high levels of troponin I in serum and reduced levels of viral RNA in the hearts of infected mice. Granzyme B (Gzmb) was the most highly upregulated gene in the heat map on 7 dpi, whereas Gzmb was also upregulated on 4 dpi. Granzyme B belongs to a family of neutral serine proteases and can be produced by natural killer (NK) cells, cytotoxic T lymphocytes, and natural killer T (NKT) cells.45–47 NK cells and cytotoxic T lymphocytes are innate and acquired immune cells, respectively, whereas NKT cells can bridge between innate and acquired immune responses. In viral infections, granzyme B produced by NK cells and cytotoxic T lymphocytes has been reported to contribute to killing of infected cells, leading to viral clearance.45 The expression levels of Gzmb were correlated with serum troponin I levels, suggesting that Gzmb could be an effector molecule that damages cardiomyocytes. In addition, NK cell group 7 sequence (Nkg7), which is a cytotoxic gran-ule protein found in activated NK cells and a subpopulation of CD8+ T cells, was also upregulated (2.5-fold on 4 dpi and 15.6-fold on 7 dpi; P<0.001).48 This also supports the effector roles of NK cells and cytotoxic T lymphocytes in viral clearance on 4 and 7 dpi, respectively. Innate immunity–related genes were also ranked among highly upregulated genes on 7 dpi, although we initially expected that acquired immunity–related genes should be ranked among highly upregulated genes, because virus-specific T- and B-cell responses (acquired immunities) play pathogenic roles in viral myocarditis on 7 dpi (phase II) mainly.7 Here, high upregulation of innate immunity–related genes masked the modest upregulation of acquired immunity–related genes. Thus, using standard 2-way comparison and their ranking, acquired immune response genes were not identified as major molecules that distinguish phase II from other phases.
By analyzing samples from 4 and 7 dpi with PCA, we were able to find that upregulation of a set of acquired immunity–related genes that contributed to the separation of the 2 groups. In PCA, Cd3g, which encodes for the γ-subunit of the CD3-T-cell recep-tor (TCR) complex, was listed as the most contributing to the sep-aration (ie, PC1 value). CD3 antigens (Cd3d, Cd3e, and Cd3g), which are markers for T cells and NKT cells,49 were upregulated only on 7 dpi (Cd3d, 1.5-fold; Cd3e, 2.7-fold; and Cd3g, 8.8-fold; P<0.001). The expression levels of Cd3g were not correlated with serum troponin I levels, suggesting that CD3+ T-and NKT cell–mediated cytotoxicity was not the only effector mechanism to damage cardiomyocytes. Several MHC class II–related genes, such as H2-Ea-ps and H2-Aa, and immunoglobulin variant chain (Igkv6-32) were also listed as contributing genes. Spp1, which is also known as osteopontin, can play a role in the differentiation of T-helper 1 and T-helper 17 cells, which can cause tissue damage
by producing proinflammatory cytokines (immunopathology).50 These results suggested that acquired immune responses, par-ticularly T-helper 1 and T-helper 17 responses, could be active in the hearts of infected mice, because MHC class II molecules on antigen-presenting cells contribute to the activation of MHC class II–restricted CD4+ T cells, which can promote immuno-globulin production from B cells. Thus, in this phase, both innate and acquired immune responses, particularly cellular immunity (T cells, NK cells, and NKT cells), rather than humoral immunity or viral replication, seemed to play effector roles. A significant increase in heart weight on 7 dpi could be because of infiltration of immune cells and edema in the heart.
On 60 dpi, we did not detect serum troponin I or viral RNA in the heart, suggesting neither ongoing cardiomyocyte dam-age nor viral replication contributes to the pathogenesis in phase III. The findings in our model are consistent with those in phase III of human myocarditis, because ongoing cardio-myocyte damage or active virus replication is not required for the progression to phase III.10 In the heat map, remodel-ing-related genes, such as Mmp12 and Gpnmb, were the most highly upregulated genes. Mmp12 may contribute to fibrosis, because we found fibrillar collagen in the hearts of infected mice but not age-matched control mice histologically (data not shown). However, Gpnmb may act as a feedback regulator of cardiac inflammation and fibrosis in mice with TMEV-induced myocarditis, because Gpnmb has been shown to regulate proin-flammatory responses and hepatic fibrosis in vivo.51,52 In PCA, Bmp10 contributed most to PC1 values based on the factor loading for PC1. Bmp10 is a member of transforming growth factor-β and plays a critical role in regulating the development of the heart.53 Cybb, which is also known as NADPH oxidase 2 (Nox2) and is associated with cardiac remodeling and car-diac fibrosis, was listed as a cardiac fibrosis–related gene.54,55 These data suggested that cardiac remodeling was active on 60 dpi. Of note, MHC class II–related (H2-Ea-ps, H2-Aa, and H2-Ab1) and immunoglobulin genes (Igkv10-96, Ighv1-43, and Igj) were upregulated during phase III, suggesting the presence of B cells and dendritic cells in the heart. Because B cells express MHC class II molecules and contribute to immunoglobulin production, humoral immunity, but not cel-lular immunity mediated by T cells, may play a role in phase III. A pathogenic role of autoantibodies in myocarditis has been shown in human myocarditis and its animal models.8,56,57 Thus, in our model, there may be residual viral or cardiac anti-gens, driving some antibody-dependent immunopathology. Dendritic cells may play a role in tissue protection and repair.58 This will be addressed in our future experiments.
PCA is an unsupervised approach to analyze large data sets, such as microarray data to find the key molecules for the variance among data without grouping.59 Thus, PCA can be used to iden-tify an unbiased set of molecules; this is in contrast to a supervised approach that identifies a single molecule with significant expres-sion ratio by comparing 2 sets of data (experimental group ver-sus control group). In this study, PCA resulted in clear separation of samples from all 3 phases of viral myocarditis. Factor loading for PC1 identified a set of phase-specific biomarker candidates to distinguish the phases. In most clinical setting in viral myocardi-tis, determinations of the phase or transition from one phase to another phase in individual patients are currently difficult. Here, a
by guest on August 19, 2014http://circgenetics.ahajournals.org/Downloaded from

Omura et al Phase-Specific Biomarkers for Viral Myocarditis 453
traditional 2-way comparison between the phases is not applicable. Using microarray and PCA, we may be able to discriminate the phases of viral myocarditis in humans, which will set the stage for phase-specific treatments for patients in the future. Determination of the myocarditis phase by PCA might have limitation depending on the phase, because the proportion of variance of PC1 in the cur-rent study was higher when we analyzed the samples from phases II and III (41%) than the samples from all 3 phases (28%) or sam-ples from phases I and II (27%). Thus, PCA could be most pow-erful for discrimination between phases II and III. Once the roles of immune effector cells in our TMEV model and phase-specific immunopathomechanisms (and their biomarker candidates) are elucidated, information can be applied clinically to patients with myocarditis, as a means of personalized medicine in prediction of disease courses (eg, development of cardiomyopathy) or determi-nation of treatment (eg, responses to therapies, which depend on the disease phase and the roles of immune effector cells).
To diagnose viral myocarditis, Dallas criteria have been used as a standard method. Dallas criteria require the inflammatory cel-lular infiltrate with or without associated myocyte necrosis on the heart tissue sections (at least 4–5 samples of 1–2 mm3) stained by immunohistochemistry against surface antigens, such as CD3.5,60 However, sampling error and variation in expert interpretation occur. As shown in our results, CD3+ T cells may be not present in phase I or III. We also found that myocyte necrosis or CD3+ T cells were not detectable histologically on 4 dpi (data not shown). In our microarray analysis, we required 2 mg of heart samples, which is obtainable in human biopsy. Here, innate immune responses against viral infection can be detectable from 2 mg of heart tissue, even in the area where no abnormality is detected in echocardiography or histology in phase I. Although the limita-tions of microarray are high cost and investment of time (≥3 days), these limitations would be resolved using custom arrays that are less expensive and more sensitive to diagnose viral myocarditis.
In summary, we successfully separated samples from all 3 phases of viral myocarditis and identified the sets of genes contributing to separation, using a bioinformatics approach. Only innate immunity–related genes were upregulated signifi-cantly in phase I, whereas both innate immunity–related and acquired immunity–related genes were upregulated in phase II. Both acquired immunity–related and cardiac remodeling–related genes were upregulated in phase III. The set of genes that was identified in our model may be useful as phase-spe-cific biomarkers. The translational application of information about the sets of the biomarker candidates from our model system and bioinformatics approach will aid the development of phase-specific therapy for viral myocarditis.
AcknowledgmentsWe thank Drs Matthew D. Woolard, Michelle M. Arnold, Viromi Fernando, Pratap C. Reddy, D. Neil Granger, Fereidoon Shafiei, and Liam A. Morris for helpful discussions and Sadie Faith Elliott, Lesya Ekshyyan, and Paula Polk for excellent technical assistance. We also thank Dr Paola Sebastiani, Department of Biostatistics, Boston University, for helpful statistical comments.
Sources of FundingThis work was supported by the fellowships (to Drs Omura and Sato) from the Malcolm Feist Cardiovascular Research Endowment, Louisiana State University Health Sciences Center-Shreveport,
and grant from the National Institute of General medical Sciences Centers of Biomedical Research Excellence (COBRE) Grant (8P20GM103433 and P30GM110703).
DisclosuresNone.
References 1. Kindermann I, Barth C, Mahfoud F, Ukena C, Lenski M, Yilmaz A, et al.
Update on myocarditis. J Am Coll Cardiol. 2012;59:779–792. 2. Fabre A, Sheppard MN. Sudden adult death syndrome and other non-isch-
aemic causes of sudden cardiac death. Heart. 2006;92:316–320. 3. Liu ZL, Liu ZJ, Liu JP, Kwong JS. Herbal medicines for viral myocarditis.
Cochrane Database Syst Rev. 2013;8:CD003711. 4. Guglin M, Nallamshetty L. Myocarditis: diagnosis and treatment. Curr
Treat Options Cardiovasc Med. 2012;14:637–651. 5. Cooper LT Jr. Myocarditis. N Engl J Med. 2009;360:1526–1538. 6. Archard LC, Richardson PJ, Olsen EG, Dubowitz V, Sewry C, Bowles
NE. The role of Coxsackie B viruses in the pathogenesis of myocarditis, dilated cardiomyopathy and inflammatory muscle disease. Biochem Soc Symp. 1987;53:51–62.
7. Martinez NE, Sato F, Kawai E, Omura S, Chervenak RP, Tsunoda I. Regu-latory T cells and Th17 cells in viral infections: implications for multiple sclerosis and myocarditis. Future Virol. 2012;7:593–608.
8. Liu PP, Mason JW. Advances in the understanding of myocarditis. Circu-lation. 2001;104:1076–1082.
9. Shauer A, Gotsman I, Keren A, Zwas DR, Hellman Y, Durst R, et al. Acute viral myocarditis: current concepts in diagnosis and treatment. Isr Med Assoc J. 2013;15:180–185.
10. Elamm C, Fairweather D, Cooper LT. Pathogenesis and diagnosis of myo-carditis. Heart. 2012;98:835–840.
11. Smith SC, Ladenson JH, Mason JW, Jaffe AS. Elevations of cardiac tro-ponin I associated with myocarditis. Experimental and clinical correlates. Circulation. 1997;95:163–168.
12. Aretz HT. Myocarditis: the Dallas criteria. Hum Pathol. 1987;18:619–624. 13. Baughman KL. Diagnosis of myocarditis: death of Dallas criteria. Circu-
lation. 2006;113:593–595. 14. Chow LH, Radio SJ, Sears TD, McManus BM. Insensitivity of right ven-
tricular endomyocardial biopsy in the diagnosis of myocarditis. J Am Coll Cardiol. 1989;14:915–920.
15. Imanaka-Yoshida K, Hiroe M, Yasutomi Y, Toyozaki T, Tsuchiya T, Noda N, et al. Tenascin-C is a useful marker for disease activity in myocarditis. J Pathol. 2002;197:388–394.
16. Ruppert V, Meyer T, Pankuweit S, Jonsdottir T, Maisch B. Activation of STAT1 transcription factor precedes up-regulation of coxsackievirus-adeno-virus receptor during viral myocarditis. Cardiovasc Pathol. 2008;17:81–92.
17. Ruppert V, Maisch B. Molecular signatures and the study of gene expres-sion profiles in inflammatory heart diseases. Herz. 2012;37:619–626.
18. Taylor LA, Carthy CM, Yang D, Saad K, Wong D, Schreiner G, et al. Host gene regulation during coxsackievirus B3 infection in mice: assessment by microarrays. Circ Res. 2000;87:328–334.
19. Szalay G, Meiners S, Voigt A, Lauber J, Spieth C, Speer N, et al. Ongoing coxsackievirus myocarditis is associated with increased formation and activ-ity of myocardial immunoproteasomes. Am J Pathol. 2006;168:1542–1552.
20. Knowles NJ, Hovi T, Hyypiä T, King AMQ, Lindberg AM, Pallansch MA, et al. Part II - The Positive Sense Single Stranded RNA Viruses: Genus Cardiovirus. King AMQ, Adams MJ, Carstens EB, Lefkowiz EJ, eds. Virus Taxonomy: Classification and Nomenclature of Viruses, Ninth Re-port of the International Committee on Taxonomy of Viruses. Virology Di-vision, International Union of Microbiological Societies. Waltham, MA: Elsevier Academic Press. 2012:862–863.
21. Sato F, Tanaka H, Hasanovic F, Tsunoda I. Theiler’s virus infection: patho-physiology of demyelination and neurodegeneration. Pathophysiology. 2011;18:31–41.
22. Gómez RM, Rinehart JE, Wollmann R, Roos RP. Theiler’s murine en-cephalomyelitis virus-induced cardiac and skeletal muscle disease. J Virol. 1996;70:8926–8933.
23. Rames DS. The Etiopthogenesis of Theiler’s Murine Encephalomyelitis Virus (TMEV)-Induced Cardiomyopathy, Including Characterization of New Strain of TMEV [doctoral thesis]. College Station, TX: Texas A&M University; 1995.
24. Omura S, Koike E, Kobayashi T. Microarray analysis of gene expression in rat alveolar epithelial cells exposed to fractionated organic extracts of diesel exhaust particles. Toxicology. 2009;262:65–72.
by guest on August 19, 2014http://circgenetics.ahajournals.org/Downloaded from

454 Circ Cardiovasc Genet August 2014
25. Li W. Volcano plots in analyzing differential expressions with mRNA mi-croarrays. J Bioinform Comput Biol. 2012;10:1231003.
26. R Core Team. R: A Language and Environment for Statistical Computing. Vienna, Austria: R Foundation for Statistical Computing. ISBN 3-900051-07-0. http://www.R-project.org/.
27. Jolliffe IT. Principal Component Analysis. Briefings in Bioinfomatics. 2nd ed. New York: Springer. 2011;12:714–722.
28. Kim J, Jacobs DR Jr, Luepker RV, Shahar E, Margolis KL, Becker MP. Prognostic value of a novel classification scheme for heart failure: the Minnesota Heart Failure Criteria. Am J Epidemiol. 2006;164:184–193.
29. Greer JJ, Ware DP, Lefer DJ. Myocardial infarction and heart failure in the db/db diabetic mouse. Am J Physiol Heart Circ Physiol. 2006;290:H146–H153.
30. Seok J, Warren HS, Cuenca AG, Mindrinos MN, Baker HV, Xu W, et al; Inflammation and Host Response to Injury, Large Scale Collaborative Re-search Program. Genomic responses in mouse models poorly mimic human inflammatory diseases. Proc Natl Acad Sci USA. 2013;110:3507–3512.
31. Osterburg AR, Hexley P, Supp DM, Robinson CT, Noel G, Ogle C, et al. Concerns over interspecies transcriptional comparisons in mice and hu-mans after trauma. Proc Natl Acad Sci USA. 2013;110:E3370.
32. Perlman H, Budinger GRS, Ward PA. Humanizing the mouse: in defense of mu-rine models of critical illness. Am J Respir Crit Care Med. 2013;187:898–900.
33. Yu M, Eckart MR, Morgan AA, Mukai K, Butte AJ, Tsai M, et al. Identi-fication of an IFN-γ/mast cell axis in a mouse model of chronic asthma. J Clin Invest. 2011;121:3133–3143.
34. Noutsias M, Rohde M, Göldner K, Block A, Blunert K, Hemaidan L, et al. Expression of functional T-cell markers and T-cell receptor Vbeta reper-toire in endomyocardial biopsies from patients presenting with acute myo-carditis and dilated cardiomyopathy. Eur J Heart Fail. 2011;13:611–618.
35. Fuse K, Kodama M, Aizawa Y, Yamaura M, Tanabe Y, Takahashi K, et al. Th1/Th2 balance alteration in the clinical course of a patient with acute viral myocarditis. Jpn Circ J. 2001;65:1082–1084.
36. Fairweather D, Stafford KA, Sung YK. Update on coxsackievirus B3 myocarditis. Curr Opin Rheumatol. 2012;24:401–407.
37. Yuan J, Yu M, Lin QW, Cao AL, Yu X, Dong JH, et al. Th17 cells contrib-ute to viral replication in coxsackievirus B3-induced acute viral myocar-ditis. J Immunol. 2010;185:4004–4010.
38. Dermody TS, Parker JSL, Sherry B. Orthoreoviruses: heart, chap 44. Knipe DM, Howley PM, eds. Fields Virology, vol. II. 6th ed. Philadelphia, PA: Wolters Kluwer/Lippincott Williams & Wilkins. 2013:1335–1336.
39. Kato H, Takeuchi O, Sato S, Yoneyama M, Yamamoto M, Matsui K, et al. Differential roles of MDA5 and RIG-I helicases in the recognition of RNA viruses. Nature. 2006;441:101–105.
40. Schulz O, Pichlmair A, Rehwinkel J, Rogers NC, Scheuner D, Kato H, et al. Protein kinase R contributes to immunity against specific viruses by reg-ulating interferon mRNA integrity. Cell Host Microbe. 2010;7:354–361.
41. Jin YH, Kim SJ, So EY, Meng L, Colonna M, Kim BS. Melanoma dif-ferentiation-associated gene 5 is critical for protection against Theiler’s virus-induced demyelinating disease. J Virol. 2012;86:1531–1543.
42. Dixit E, Boulant S, Zhang Y, Lee AS, Odendall C, Shum B, et al. Peroxisomes are signaling platforms for antiviral innate immunity. Cell. 2010;141:668–681.
43. Hasan M, Koch J, Rakheja D, Pattnaik AK, Brugarolas J, Dozmorov I, et al. Trex1 regulates lysosomal biogenesis and interferon-independent acti-vation of antiviral genes. Nat Immunol. 2013;14:61–71.
44. Bowie AG, Unterholzner L. Viral evasion and subversion of pattern-recog-nition receptor signalling. Nat Rev Immunol. 2008;8:911–922.
45. Edwards KM, Davis JE, Browne KA, Sutton VR, Trapani JA. Anti-viral strat-egies of cytotoxic T lymphocytes are manifested through a variety of granule-bound pathways of apoptosis induction. Immunol Cell Biol. 1999;77:76–89.
46. Pham CTN, Ley TJ. The role of granzyme B cluster proteases in cell-mediated cytotoxicity. Semin Immunol. 1997;9:127–133.
47. Metelitsa LS, Weinberg KI, Emanuel PD, Seeger RC. Expression of CD1d by myelomonocytic leukemias provides a target for cytotoxic NKT cells. Leukemia. 2003;17:1068–1077.
48. Zhou L, Li X, Church RL. The mouse lens fiber-cell intrinsic membrane protein MP19 gene (Lim2) and granule membrane protein GMP-17 gene (Nkg7): Isolation and sequence analysis of two neighboring genes. Mol Vis. 2001;7:79–88.
49. Tsunoda I, Libbey JE, Fujinami RS. TGF-β1 suppresses T cell infiltration and VP2 puff B mutation enhances apoptosis in acute polioencephalitis induced by Theiler’s virus. J Neuroimmunol. 2007;190:80–89.
50. Santamaría MH, Corral RS. Osteopontin-dependent regulation of Th1 and Th17 cytokine responses in Trypanosoma cruzi-infected C57BL/6 mice. Cytokine. 2013;61:491–498.
51. Ripoll VM, Irvine KM, Ravasi T, Sweet MJ, Hume DA. Gpnmb is induced in macrophages by IFN-γ and lipopolysaccharide and acts as a feedback regulator of proinflammatory responses. J Immunol. 2007;178:6557–6566.
52. Abe H, Uto H, Takami Y, Takahama Y, Hasuike S, Kodama M, et al. Trans-genic expression of osteoactivin in the liver attenuates hepatic fibrosis in rats. Biochem Biophys Res Commun. 2007;356:610–615.
53. Huang J, Elicker J, Bowens N, Liu X, Cheng L, Cappola TP, et al. Myo-cardin regulates BMP10 expression and is required for heart development. J Clin Invest. 2012;122:3678–3691.
54. Johar S, Cave AC, Narayanapanicker A, Grieve DJ, Shah AM. Aldoste-rone mediates angiotensin II-induced interstitial cardiac fibrosis via a Nox2-containing NADPH oxidase. FASEB J. 2006;20:1546–1548.
55. Zhao Y, McLaughlin D, Robinson E, Harvey AP, Hookham MB, Shah AM, et al. Nox2 NADPH oxidase promotes pathologic cardiac remodeling asso-ciated with Doxorubicin chemotherapy. Cancer Res. 2010;70:9287–9297.
56. Yu M, Wen S, Wang M, Liang W, Li HH, Long Q, et al. TNF-α-secreting B cells contribute to myocardial fibrosis in dilated cardiomyopathy. J Clin Immunol. 2013;33:1002–1008.
57. Matsumori A. Lessons learned from experimental myocarditis. Herz. 2012;37:817–821.
58. Iwasaki A, Medzhitov R. Regulation of adaptive immunity by the innate immune system. Science. 2010;327:291–295.
59. Loke P, Favre D, Hunt PW, Leung JM, Kanwar B, Martin JN, et al. Cor-relating cellular and molecular signatures of mucosal immunity that dis-tinguish HIV controllers from noncontrollers. Blood. 2010;115:e20–e32.
60. Andréoletti L, Lévêque N, Boulagnon C, Brasselet C, Fornes P. Viral causes of human myocarditis. Arch Cardiovasc Dis. 2009;102:559–568.
CLINICAL PERSPECTIVEMyocarditis most commonly results from virus infections, affects 2 million Americans, and is a major cause of sudden death. Viral myocarditis has been proposed to be a triphasic disease: in phase I, the disease is triggered by viral infection in the heart; in phase II, uncontrolled antiviral immune and autoimmune responses damage cardiomyocytes; and in phase III, as a result of phases I and II, cardiac remodeling leads to dilated cardiomyopathy. Ideally, each patient with myocarditis should be treated depending on the phase: phase I, antiviral; phase II, immunomodulation; and phase III, standard heart failure therapy (eg, immunosuppression may be appropriate for phase II but will enhance virus replication in phase I). For appropriate treatment of myocarditis, the identification of phase-specific biomarkers is crucial to develop effective phase-specific therapy. Although most human and experimental myocarditis studies have used traditional supervised transcriptome analyses with 2-way comparison based on P values between controls versus predefined myocarditis samples, they did not lead to a discovery of the phase-specific biomarkers that clearly distinguish all 3 phases of myocarditis. Using a novel mouse model for viral myocarditis induced with cardiovirus, we conducted unsupervised bioinformatics transcriptome analyses (eg, principal component analysis) along with multivariate conventional analyses that have been used clinically (eg, echo-cardiography, viral titration, cardiac troponin, and histology). We found a set of phase-specific biomarkers in the heart. Our approach can be applied clinically to patients with myocarditis, as a means of personalized medicine in prediction of disease course (eg, development of cardiomyopathy) or determination of treatment.
by guest on August 19, 2014http://circgenetics.ahajournals.org/Downloaded from

Supplemental Material

2
I. Supplemental Methods
Animal experiments
Male C3H/HeN mice (4-week-old) were purchased from Taconic Farms (Hudson, NY). Mice
were maintained on 12/12-hour light/dark cycles in standard animal cages with filter tops under specific
pathogen-free conditions in the animal care facility at Louisiana State University Health Sciences Center
(LSUHSC)-Shreveport. Mice were given standard laboratory rodent chow and water ad libitum. All
experimental procedures involving the use of animals were reviewed and approved by the Institutional
Animal Care and Use Committee of LSUHSC and performed according to the criteria outlined by the
National Institutes of Health.
We infected 5-week-old mice with 2 × 10⁷ plaque forming units (PFUs) of the DA strain of
TMEV intraperitoneally. We used age-matched uninfected mice as controls. Mice were monitored and
weighed daily for up to 2 months. On 0, 4, 7, 14, 30, and 60 days post infection (dpi), we conducted
echocardiography using the Vevo 770 High-Resolution In Vivo Micro-Imaging System (VisualSonics,
Toronto, Ontario, Canada). We used B- and M-modes of echocardiography to monitor longitudinal
morphological and functional changes, without killing mice. On 4, 7, and 60 dpi, we anesthetized five
mice per group, using IsoSolTM
(isoflurane, USP, Vedco, Saint Joseph, MO), and harvested the hearts.
Enzyme-linked immunosorbent assay (ELISA) of serum troponin I
Blood samples were collected from five infected mice by submandibular bleeding61
on 4, 7, 14,
and 30 dpi and the sera were separated by centrifugation. The levels of cardiac troponin I in the sera were
measured by ELISA using the Ultra Sensitive Mouse Cardiac Troponin-I ELISA Kit (Life Diagnostics,
West Chester, PA), according to the manufacturer’s instructions.
RNA preparation
The hearts were homogenized in TRI Reagent® (Molecular Research Center, Cincinnati, OH),
using the Kinematica PolytronTM
homogenizer (Kinematica, Bohemia, NY). Total RNA was extracted
3
from the homogenate, using the RNeasy Mini Kit (Qiagen, Valencia, CA), according to the
manufacturer’s instructions.62
DNase treatment was performed during RNA isolation using the RNase-
Free DNase Set (Qiagen). All samples were purified to an absorbance ratio (A260/A280) between 1.9
and 2.1. Samples were collected from five infected animals and five age-matched controls at each time
point (4, 7, and 60 dpi).
Microarray analysis
We reverse-transcribed 100 ng of total RNA to first-stranded cDNA, using the Poly-A RNA
Control (Affymetrix, Santa Clara, CA) and Ambion® WT Expression Kit (Life Technologies Corporation,
Carlsbad, CA).62
The double-stranded cDNA was generated from single-stranded cDNA and transcribed
in vitro into cRNA. The resulting cRNA was purified and 10 μg of purified cRNA was reverse-
transcribed into 2nd
-cycle cDNA. Second-cycle cDNA was fragmented and labeled with terminal
deoxynucleotidyl transferase using the Affymetrix proprietary DNA Labeling Reagent (Affymetrix).
Labeled cDNA was hybridized to the GeneChip® Mouse 1.0ST Array (Affymetrix) that includes 28,853
transcripts. Mouse Gene 1.0ST array contains 50-60 microRNA probe sequences, although it is not
designed for microRNA study. Hybridized arrays were washed and stained using the GeneChip®
Hybridization Wash and Stain Kit (Affymetrix) and Fluidics station 450 (Affymetrix), and scanned using
the GeneChip® Scanner 3000 (Affymetrix). The data was visualized and quantified by the Affymetrix
GeneChip® Command Console (AGCC), and normalized by Robust Multi-array Average (RMA), using
Expression ConsoleTM
(Affymetrix). Fold changes were calculated as ratios of signal value, compared
with the age-matched controls. Log ratios were calculated by the logarithm of fold changes to base 2.
Microarray results were filtered by 2-fold cutoff and P value threshold.63
Only transcripts that pass this
filter (fold change > 2 and P < 0.05) are considered statistically significant. The microarray results were
analyzed using the Ingenuity Pathway Analysis® (IPA, Ingenuity Systems, www.ingenuity.com), NetAffx
database (Affymetrix, www.affymetrix.com/index.affx), and Mouse Genome Informatics (Jackson
Laboratory, Bar Harbor, ME, www.informatics.jax.org/). The data have been deposited into the Gene
4
Expression Omnibus (GEO) repository in National Center for Biotechnology Information (NCBI)
(Accession number: GSE53607). We analyzed samples from five infected animals and five age-matched
controls at each time point (4, 7, and 60 dpi) (total 15 infected and 15 control samples).
Real-time polymerase chain reaction (PCR)
We reverse-transcribed 1 µg of total RNA into cDNA, using the ImProm-IITM
Reverse
Transcription System (Promega, Madison, WI). Using 50 ng of cDNA, real-time PCR was conducted by
the MyiQTM
2 Real Time PCR Detection System (Bio-Rad, Hercules, CA). Primer sets of Cxcl9, Tlr3,
Gzmb, Cd3g, Mmp12, Gpnmb, and Gapd were purchased from RealTimePrimers.com (Elkins Park, PA).
VP2 capsid protein of TMEV was used to detect the viral RNA in heart tissue samples. The primer
sequences of VP2 are as follows: forward; 5’-TGGTCGACTCTGTGGTTACG-3’ and reverse; 5’-
GCCGGTCTTGCAAAGATAGT-3’.64
The results were normalized using a housekeeping gene Gapd.
The expression of housekeeping gene Gapd did not change with the stages of viral infection (data not
shown). Fold changes were calculated by the ΔΔCt method. We analyzed samples from five infected
animals and five age-matched controls at each time point (4, 7, and 60 dpi) (total 15 infected and 15
control samples).
Bioinformatics and statistics analyses
Volcano plot. We drew a volcano plot, using the OriginPro 8.1 (OriginLab Corporation,
Northampton, MA), to assess significance together with log ratio of transcriptome data.65-67
In the
volcano plot, log ratios of gene expression in the heart of TMEV-infected mice compared with control
mice were used as the x-axis and the logarithms of P values to base 10 were used as the y-axis.
Heat map. Heat maps were drawn to determine the expression patterns of top 20 up- or
downregulated genes at each time point and compare the expression levels with the other time points,
using R version 2.15.1 and the R packages ‘gplots’ and ‘genefilter’.68

5
K-means clustering. To find the differences of gene expression profiles between the time points,
we conducted k-means clustering using an R package ‘cclust’. We used Davies-Bouldin index69
to
determine the optimum number of clusters and obtained the lowest score (0.51) when microarray data
were separated into 20 clusters (Online Figure 2). Graphs were drawn using 240 genes (top 80, middle 80,
and bottom 80 genes) in each cluster. Radar chart was drawn using the expression patterns of cluster
center genes.
IPA. To classify the genes functionally, we used IPA where we entered the genes whose fold
changes were more than 2-fold and P values were less than 0.05. IPA shows possible networks involved
in microarray profiles by the IPA Network Generation Algorithm.70
Genes were clustered and classified
by the IPA Network Generation algorithm and the networks were ranked by the network score. The
network score was calculated based on the tight-tailed Fisher’s Exact Test that takes into account: 1) the
number of Network Eligible molecules in the network, 2) size of the network, 3) the total number of
Network Eligible molecules in the given dataset, and 4) the number of molecules in the IPA database that
could potentially be included in the networks.71,72
In the networks, solid and dashed lines indicated direct
and indirect interactions, respectively. Direct interactions require the two molecules make direct physical
contact with each other; there is no intermediate step. Indirect interactions do not require that there is
physical contact between the two molecules, such as a signaling cascade instead of the two molecules
making physical contact with each other.
PCA. PCA can reduce the dimensionality of a data set (e.g. microarray data) consisting of a large
number of interrelated variables, while retaining as much as possible of the variation present in the data
set.73
PCA was conducted as an “unsupervised” analysis to clarify the variance among microarray data
from heart samples using R. To clarify the variances among samples, microarray data were calculated
using a Q-mode PCA package ‘prcomp’of R. The proportion of variance and factor loading were also
calculated.
Statistics. The data were showed as mean + standard error of the mean (SEM). Statistical
comparisons were conducted using Student t test or analysis of variance (ANOVA) in the OriginPro 8.1.

6
P < 0.05 was considered as significant difference. Correlation analysis was conducted using the
Microsoft Excel (Microsoft Corporation, Redmond, WA).

7
II. Supplemental Results
Two-way supervised analyses of gene expression profiles in TMEV infection
Among the downregulated genes in the volcano plots (Figure 4), we were able to identify 16
genes on 4 dpi, 7 genes on 7 dpi, and 4 genes on 60 dpi. The expression levels of these downregulated
genes together with top 20 upregulated genes at each phase were visualized using heat maps: Online
Figure 1A, 20 upregulated and 16 downregulated genes on 4 dpi; Online Figure 1B, 20 upregulated and 7
downregulated genes on 7 dpi; Online Figure 1C, 20 upregulated and 4 downregulated genes on 60 dpi.
These gene expression patterns in each time point were compared with those at the other two time points.
On 4 dpi, interferon (IFN)-induced genes, such as IFN regulatory factor 7 (Irf7), IFN-induced
protein with tetratricopeptide repeats (Ifit1 and Ifit3), and IFN-γ induced GTPase (Igtp), were upregulated
significantly (Online Figure 1A). In contrast, myosin, light polypeptide 7, regulatory (Myl7), myosin
binding protein H-like (Mybphl), and microRNA 690 (Mir690) were downregulated.
On 7 dpi, similar to 4 dpi, IFN-induced genes, including chemokine (C-X-C motif) ligand 9
(Cxcl9) and Igtp, were upregulated. In addition, granzyme B (Gzmb), natural killer cell group 7 sequence
(Nkg7), and CD274 antigen (Cd274) were also upregulated significantly (Online Figure 1B). All top 20
upregulated genes on 4 dpi, which were associated with innate immune responses, were also upregulated
on 7 dpi. On the other hand, angiopoietin-like 7 (Angptl7), Ras association (RalGDS/AF-6) domain
family (N-terminal) member 9 (Rassf9), and methyltransferase like 21E (Mettl21e) were downregulated
on 7 dpi.
On 60 dpi, we found significant upregulation of genes associated with cardiac remodeling and
fibrosis, such as matrix metallopeptidase 12 (Mmp12), glycoprotein (transmembrane) nmb (Gpnmb,
osteoactivin), and secreted phosphoprotein 1 (Spp1, osteopontin) (Online Figure 1C). Although this
suggested that cardiac remodeling was active on 60 dpi, these genes were also upregulated on 7 dpi. We
also found upregulation of immunoglobulins (Igkv10-96, Igkv1-43, and Igj), complement component
(C1s), CD74 antigen (Cd74), and MHC class II-related antigens (H2-Ea-ps and H2-Aa). Although this
indicated that acquired immune responses associated with B cells were present on 60 dpi, most of the

8
genes were also upregulated on 7 dpi, thus their expression on the heat map did not distinguish between 7
and 60 dpi. On the other hand, downregulations of nuclear receptor subfamily 4, group A, member 3
(Nr4a3), leucine rich repeat containing 52 (Lrrc52), and a disintegrin-like and metallopeptidase
(reprolysin type) with thrombospondin type 1 motif, 9 (Adamts9) were shown in the hearts of infected
mice.
Thus, although the heat maps of significantly expressed genes between 4 and 60 dpi showed
distinct patterns, the heat maps did not show different patterns between 4 and 7 dpi as well as 7 and 60 dpi.
This could be due to the upregulation of many genes associated with innate immunity, acquired immunity,
and cardiac remodeling on 7 dpi.
The lists of differentially expressed genes for each time point
Up- or downregulated genes in the hearts of TMEV-infected mice at each time point were listed
in Online Tables 8 to 10. Red background indicates upregulation and blue indicates downregulation at
each time point.
Categorization of up- or down-regulated genes in the hearts of TMEV-infected mice
To categorize genes that were up- or down-regulated in the hearts of TMEV-infected mice by
function, we uploaded the microarray results into the IPA that shows possible networks involved in
microarray profiles by IPA Network Generation Algorithm (Online Table 11). On 4 dpi, the top network
was associated with ‘Infectious Disease’, ‘Antimicrobial Response’, and ‘Inflammatory Response’. This
network was composed of IFN-α/β-related genes (Online Figure 7). On 7 dpi, the top network was
associated with ‘Infectious Disease’, ‘Cellular Function and Maintenance’, and ‘Antimicrobial Response’.
This network was composed of pattern recognition receptors and interleukin 6- and 12-associated genes
(Online Figure 8). On 60 dpi, the top networks were ‘Cellular Function and Maintenance’, ‘Inflammatory
Response’, and ‘Cellular Movement’, composed of remodeling- and immune response-related genes
(Online Figure 9). Remodeling-related genes [Mmp12, Spp1, and cytochrome b-245, beta polypeptide

9
(Cybb)] were included in the network. The network associated with ‘Antimicrobial Responses’ was listed
on both 4 and 7 dpi, but not on 60 dpi. The network associated with ‘Cellular Function and Maintenance’
was listed on both 7 and 60 dpi. These networks shown in Online Figures 7-9 included both direct (solid
lines) and indirect interactions (dashed lines). Thus, we conducted IPA using only direct interactions.
Significant networks identified allowing only for direct connections were as follows: the top network on 4
dpi was associated with ‘Endocrine System Disorders’, ‘Gastrointestinal Disease’, and ‘Immunological
Disease’; the top network on 7 dpi was associated with ‘Hematological System Development and
Function, ‘Tissue Morphology’, and ‘Cellular Movement’; the top network on 60 dpi was not connected
well among up- or down-regulated genes. While IPA using only direct interaction is supposed to be
stringent, identified networks contained pathways irrelevant to our myocarditis models, including
‘Endocrine System Disorders’, ‘Gastrointestinal Disease’ and ‘Hematological System Development and
Function’.
Using IPA, we also ranked the top five canonical pathways involved in each time point (Online
Figure 10). Among the pathways, the top two highly induced pathways in each phase were as follows: on
4 dpi, the pathways associated with ‘Activation of IFN Regulatory Factor by Cytosolic Pattern
Recognition Receptors’ and ‘IFN Signaling’; on 7 dpi, the ‘Antigen Presenting Pathway’ and a pathway
associated with ‘Communication Between Innate and Adaptive Immune Cells’; and on 60 dpi, the ‘B Cell
Development Pathway’ and ‘Antigen Presenting Pathway’.
IPA also showed upregulated genes that could be associated with cardiotoxicity (Online Table 12).
Cardiac inflammation was listed as the top toxicity function on both 4 and 7 dpi, where chemokines
(Ccl13, Ccl2, and Ccl3l1), toll-like receptor (Tlr3), and IFN-γ (Ifng) were upregulated. Cardiac necrosis,
dysfunction, and dilation were listed on 7 and 60 dpi because of upregulation of Cybb and Spp1. These
results suggested the presence of inflammation in the heart on both 4 and 7 dpi and cardiac dysfunction
and dilation on 7 and 60 dpi. Thus, the categorization of the genes based on supervised analyses showed
involvement of different pathways in each phase to some extent. However, this approach did not identify
molecules that can be used to distinguish between the different phases.

10
III. Supplemental References
61. Golde WT, Gollobin P, Rodriguez LL. A rapid, simple, and humane method for submandibular
bleeding of mice using a lancet. Lab Anim (NY). 2005;34:39-43.
62. Omura S, Koike E, Kobayashi T. Microarray analysis of gene expression in rat alveolar epithelial
cells exposed to fractionated organic extracts of diesel exhaust particles. Toxicology.
2009;262:65-72.
63. Vacha SJ. Pitfall 7: Paying more attention to the magnitude of the log ratio than significance of
the log ratio. Ten Pitfalls of Microarray Analysis. Agilent in Life Sciences.
64. Deb C, Lafrance-Corey RG, Zoecklein L, Papke L, Rodriguez M, Howe CL. Demyelinated axons
and motor function are protected by genetic deletion of perforin in a mouse model of multiple
sclerosis. J Neuropathol Exp Neurol. 2009;68:1037-1048.
65. Li WT. Volcano Plots in Analyzing Differential Expressions with Mrna Microarrays. Journal of
Bioinformatics and Computational Biology. 2012;10.
66. Chen JJ, Wang SJ, Tsai CA, Lin CJ. Selection of differentially expressed genes in microarray
data analysis. Pharmacogenomics J. 2007;7:212-220.
67. Oberg AL, Mahoney DW, Eckel-Passow JE, Malone CJ, Wolfinger RD, Hill EG, et al. Statistical
analysis of relative labeled mass spectrometry data from complex samples using ANOVA. J
Proteome Res. 2008;7:225-233.
68. R Core Team (2012) R: A language and environment for statistical computing. R Foundation for
Statistical Computing, Vienna, Austria. ISBN 3-900051-07-0, URL http://www.R-project.org/.
69. Davies DL, Bouldin DW. A cluster separation measure. IEEE Trans Pattern Anal Mach Intell.
1979;1:224-227.
70. Savli H, Szendroi A, Romics I, Nagy B. Gene network and canonical pathway analysis in prostate
cancer: a microarray study. Exp Mol Med. 2008;40:176-185.

11
71. Naito Y, Kuroda M, Mizushima K, Takagi T, Handa O, Kokura S, et al. Transcriptome Analysis
for Cytoprotective Actions of Rebamipide against Indomethacin-Induced Gastric Mucosal Injury
in Rats. J Clin Biochem Nutr. 2007;41:202-210.
72. Kaveh F, Edvardsen H, Borresen-Dale AL, V NK, Solvang HK. Allele-specific disparity in breast
cancer. BMC Med Genomics. 2011;4:85.
73. Jolliffe IT. Principal Component Analysis, Second Edition. New York: Springer. Briefings in
bioinfomatics. 2011;12:714-722.

12
IV. Online Tables
Online Table 1. Gene abbreviations
Gene symbol Gene name
Adamts8 a disintegrin-like and metallopeptidase (reprolysin type) with thrombospondin type 1 motif, 8
Adamts9 a disintegrin-like and metallopeptidase (reprolysin type) with thrombospondin type 1 motif, 9
Angptl7 angiopoietin-like 7
Atp6v0d2 ATPase, H+ transporting, lysosomal V0 subunit D2
Bmp10 bone morphogenetic protein 10 (TGFβ family)
C1s complement component 1, s subcomponent
Car3 carbonic anhydrase 3
Casp1 caspase 1
Ccl2 chemokine (C-C motif) ligand 2
Ccl3 chemokine (C-C motif) ligand 3
Ccl5 chemokine (C-C motif) ligand 5
Ccl8 chemokine (C-C motif) ligand 8
Ccna2 cyclin A2
Ccr5 chemokine (C-C motif) receptor 5
Cd274 CD274 antigen (B7-H1, PD-L1)
Cd3d CD3 antigen, δ polypeptide
Cd3e CD3 antigen, ε polypeptide
Cd3g CD3 antigen, γ polypeptide
Cd74 CD74 antigen (invariant polypeptide of major histocompatibility complex, class II antigen-associated)
Cfd complement factor D (adipsin)
Clec7a C-type lectin domain family 7, member a
Ctsk cathepsin K
Cxcl9 chemokine (C-X-C motif) ligand 9 (Mig)
Cybb cytochrome b-245, beta polypeptide (Nox2)
Cyp2e1 cytochrome P450, family 2, subfamily e, polypeptide 1
Ddx58 DEAD (Asp-Glu-Ala-Asp) box polypeptide 58 (RIG-I)
Dhx58 DEXH (Asp-Glu-X-His) box polypeptide 58 (LGP2)
Dkk3 dickkopf homolog 3 (Xenopus laevis)
Elovl3 elongation of very long chain fatty acids (FEN1/Elo2, SUR4/Elo3, yeast)-like 3
Fam107a family with sequence similarity 107, member A
Fasn fatty acid synthase
Fcer1g Fc receptor, IgE, high affinity I, γ polypeptide
Fgf12 fibroblast growth factor 12
Gapd glyceraldehyde-3-phosphate dehydrogenase
Gbp11 guanylate binding protein 11
Gbp2b guanylate binding protein 2b
Gbp3 guanylate binding protein 3
Glipr1 GLI pathogenesis-related 1 (glioma)
Gpnmb glycoprotein (transmembrane) nmb (osteoactivin)
Gzmb granzyme B
H2-Aa major histocompatibility 2, class II antigen A, α
H2-Ab1 major histocompatibility 2, class II antigen A, β1
H2-Ea-ps major histocompatibility 2, class II antigen E α, pseudogene
Hamp hepcidin antimicrobial peptide
Hp haptoglobin
Ifi44 interferon-induced protein 44
Ifi44l interferon-induced protein 44 like
Ifih1 interferon induced with helicase C domain 1 (MDA5)
Ifit1 interferon-induced protein with tetratricopeptide repeats 1
Ifit2 interferon-induced protein with tetratricopeptide repeats 2
Ifit3 interferon-induced protein with tetratricopeptide repeats 3
Ighv1-43 immunoglobulin heavy variable V1-43
Ighv1-61 immunoglobulin heavy variable 1-61
Igj immunoglobulin joining chain
Igkv10-96 immunoglobulin κ variable 10-96

13
Igkv6-32 immunoglobulin κ variable 6-32
Igtp interferon γ induced GTPase
Iigp1 interferon inducible GTPase 1
Il1b interleukin 1β
Il1rn interleukin 1 receptor antagonist
Il6 interleukin 6
Inmt indolethylamine N-methyltransferase
Irf7 interferon regulatory factor 7
Irgm1 immunity-related GTPase family M member 1
Itgal integrin αL
Itgam integrin αM
Itgax integrin αX
Itgb2 integrin β2
Lck lymphocyte protein tyrosine kinase
Lcn2 lipocalin 2
Lgals3 lectin, galactose binding, soluble 3
Lgi1 leucine-rich repeat LGI family, member 1
Lrrc52 leucine rich repeat containing 52
Mavs mitochondrial antiviral signaling protein
Mettl21e methyltransferase like 21E
Mir690 microRNA 690
Mmp12 matrix metallopeptidase 12
Ms4a4c membrane-spanning 4-domains, subfamily A, member 4C
Mybphl myosin binding protein H-like
Myl7 myosin, light polypeptide 7, regulatory
Nkg7 natural killer cell group 7 sequence
Nr4a3 nuclear receptor subfamily 4, group A, member 3
Pah phenylalanine hydroxylase
Penk preproenkephalin
Pfkfb1 6-phosphofructo-2-kinase/fructose-2,6-biphosphatase 1
Phf11d PHD finger protein 11D
Pkhd1l1 polycystic kidney and hepatic disease 1-like 1
Plac8 placenta-specific 8
Plau plasminogen activator, urokinase
Ppargc1a peroxisome proliferative activated receptor γ, coactivator 1α
Prf1 perforin 1 (pore forming protein)
Pyhin1 pyrin and HIN domain family, member 1
Rassf9 Ras association (RalGDS/AF-6) domain family (N-terminal) member 9
Retnla resistin like α
Rsad2 radical S-adenosyl methionine domain containing 2
Sln sarcolipin
Sox7 SRY-box containing gene 7
Spp1 secreted phosphoprotein 1 (osteopontin)
Sprr1a small proline-rich protein 1A
Stap1 signal transducing adaptor family member 1
Stard10 START domain containing 10
Stat1 signal transducer and activator of transcription 1
Stat4 signal transducer and activator of transcription 4
Tgtp1 T cell specific GTPase 1
Timp1 tissue inhibitor of metalloproteinase 1
Tlr3 toll-like receptor 3
Tlr7 toll-like receptor 7
Tnfaip3 tumor necrosis factor, α-induced protein 3
Tnfsf10 tumor necrosis factor (ligand) superfamily, member 10
Usp18 ubiquitin specific peptidase 18

14
Online Table 2. Gene list of cluster 2 Cluster Probe Set ID Day 4 Day 7 Day 60 Symbol Entrez Gene Name
2 10583056 -0.0392816 0.241738 3.4960326 MMP12 matrix metallopeptidase 12 (macrophage elastase)
2 10538187 -0.066586 1.2876936 3.1650604 GPNMB glycoprotein (transmembrane) nmb
2 10511779 0.2294848 0.3602788 2.9750388 ATP6V0D2 ATPase, H+ transporting, lysosomal 38kDa, V0 subunit d2
2 10545237 -0.1361568 -0.067529 2.0623402
2 10545175 -0.052077 0.9486478 1.7071394 Igk-J1 immunoglobulin kappa joining 1
2 10547740 1.4358614 0.2003274 1.6863684 C1S complement component 1, s subcomponent
2 10545173 -0.095812 0.6494674 1.5954512 Igk immunoglobulin kappa chain complex
2 10494262 -0.3787916 0.1369422 1.5008528 CTSK cathepsin K
2 10538882 -0.1900148 -0.006567 1.4665974
2 10403021 0.1299884 0.3088364 1.3770836
2 10531126 -0.2783984 0.5021218 1.3460858 IGJ immunoglobulin J polypeptide, linker protein for
immunoglobulin alpha and mu polypeptides
2 10338640 0.9966784 -0.32691 1.3380414
2 10557895 0.0705552 1.280888 1.3302184 ITGAX integrin, alpha X (complement component 3 receptor 4
subunit)
2 10403038 -0.1089806 0.4155 1.1938834
2 10548375 -0.011575 1.052778 1.1820744 CLEC7A C-type lectin domain family 7, member A
2 10403069 -0.2337452 0.1563804 1.1816562 IGHM immunoglobulin heavy constant mu
2 10338365 0.1495842 0.4229512 1.1044422
2 10545247 0.2576838 0.3979584 1.0589932 Igkv6-15 immunoglobulin kappa variable 6-14
2 10545198 -0.2593444 0.0025162 1.0287108
2 10341488 -0.085396 0.3632384 0.98846
2 10523128 -0.2019334 0.4205996 0.9853106 PPBP pro-platelet basic protein (chemokine (C-X-C motif) ligand 7)
2 10339525 0.0073388 0.1754834 0.9570168
2 10545215 0.0340812 0.0750176 0.8951984 Igk-V28 immunoglobulin kappa chain variable 28 (V28)
2 10403018 -0.1739206 0.2330356 0.8843548 AI324046 expressed sequence AI324046
2 10339025 -0.1649434 0.0354696 0.8558128
2 10523359 -0.7706774 0.0794764 0.851305 CXCL13 chemokine (C-X-C motif) ligand 13
2 10339941 -0.1160354 0.0745046 0.8334982
2 10538921 -0.1330676 0.4694028 0.828054
2 10343595 0.0891906 -0.2639426 0.8266714
2 10341654 -0.7300586 0.475328 0.821276
2 10339870 0.0483848 0.2322026 0.8127254
2 10545190 0.300976 0.1443338 0.8058268
2 10538903 -0.1147284 0.3407664 0.8052908 Igkv8-30 immunoglobulin kappa chain variable 28 (V28)
2 10403028 -0.1004406 0.4395714 0.7976784
2 10343187 0.5628796 0.665346 0.794683
2 10358421 -0.1254366 0.6664756 0.789772 RGS18 regulator of G-protein signaling 18
2 10545184 -0.0250938 0.0930944 0.7864136
2 10545862 -0.2290526 -0.1370138 0.7836834 Cml3/Gm4477 camello-like 3
2 10403015 0.1046814 0.1404718 0.7698862 AI324046 expressed sequence AI324046
2 10419934 0.0568668 0.3467786 0.7662178 MYH7 myosin, heavy chain 7, cardiac muscle, beta
2 10591739 -0.2079734 0.6678674 0.7590626 ACP5 acid phosphatase 5, tartrate resistant
2 10350473 -0.0225758 0.0532318 0.750761 B3GALT2 UDP-Gal:betaGlcNAc beta 1,3-galactosyltransferase,
polypeptide 2
2 10492798 -0.2841524 0.0995462 0.7417692 SFRP2 secreted frizzled-related protein 2
2 10341453 0.610481 0.349168 0.7381912
2 10545869 -0.2882584 -0.0452272 0.7361532 Cml3/Gm4477 camello-like 3
2 10341089 -0.0412908 0.1667672 0.7333504
2 10338976 0.191292 0.138382 0.7246336
2 10338165 -0.3136412 -0.1215916 0.7232488
2 10564818 -0.323219 0.3850666 0.7192478 ANPEP alanyl (membrane) aminopeptidase
2 10341001 -0.2865824 0.1558054 0.7161202
2 10340173 -0.4694412 -0.095255 0.7027516
2 10545865 -0.1828148 -0.1209574 0.6947052 Cml3/Gm4477 camello-like 3
2 10545196 -0.205896 0.0505448 0.693595
2 10339305 -0.0885026 0.077951 0.6852978
2 10343889 -0.1562914 0.5248406 0.6834124
2 10462442 0.111467 0.6132776 0.6746374 IL33 interleukin 33
2 10341243 -0.3177444 0.0417542 0.6704908
2 10340884 -0.227121 -0.1288554 0.6631158
2 10445781 -0.0277506 0.1798908 0.661405 TREM2 triggering receptor expressed on myeloid cells 2
2 10339171 -0.425703 0.6999032 0.6598412
2 10340594 -0.283164 -0.0585778 0.656075
2 10342563 -0.0007634 -0.001319 0.655842
2 10395273 0.0007438 0.5410032 0.645488 Gdap10 ganglioside-induced differentiation-associated-protein 10
2 10343700 -0.171202 0.246582 0.6445726
2 10435043 0.0218306 0.4911668 0.6433614 TM4SF19 transmembrane 4 L six family member 19
2 10403048 -0.056381 0.3094678 0.6390022
2 10504127 0.292127 0.3561266 0.6327726 CCL21 chemokine (C-C motif) ligand 21
2 10504154 0.292127 0.3561266 0.6327726 CCL21 chemokine (C-C motif) ligand 21
2 10504183 0.292127 0.3561266 0.6327726 CCL21 chemokine (C-C motif) ligand 21
2 10512377 0.292127 0.3561266 0.6327726 CCL21 chemokine (C-C motif) ligand 21
2 10338332 -0.1862604 0.0724472 0.626833
2 10545205 -0.0629944 0.3353452 0.6266194 Gm1418 immunoglobulin kappa variable 4-57-1
2 10339626 0.2172436 0.3965274 0.6230718
2 10545187 -0.064152 0.093604 0.61922 Gm1502 predicted gene 1502
2 10340840 0.1259392 -0.0043936 0.612312
2 10341148 -0.4386734 0.264262 0.61065
2 10340070 0.2296546 0.5199256 0.6095988
2 10419568 -0.1874534 0.0152962 0.6027982 RNASE2 ribonuclease, RNase A family, 2 (liver, eosinophil-derived
neurotoxin)
2 10370000 -0.1777124 0.1178444 0.5985182 GSTT1 glutathione S-transferase theta 1
2 10339622 -0.4800984 0.3703308 0.5949622
2 10343323 -0.150792 -0.0271844 0.5918356

15
2 10342102 0.269756 0.183977 0.591503
2 10538880 -0.0375536 0.205469 0.5838978
2 10338872 -0.254688 0.0788602 0.5835852
2 10519998 -0.4282306 0.0257682 0.5796416 LRRC17 leucine rich repeat containing 17
2 10338676 -0.2461476 0.4030146 0.5773306
2 10547752 0.5518134 0.3649818 0.5760028 C1S complement component 1, s subcomponent
2 10342867 0.0706604 0.2041016 0.5743686
2 10342275 -0.0165772 0.3326464 0.5719828
2 10450369 0.2145322 0.2540182 0.5716578 HSPA1A/HSPA1B heat shock 70kDa protein 1A
2 10557175 -0.2737868 0.0926244 0.571169
2 10403060 -0.0087198 0.2787722 0.5635208
2 10343820 -0.2387554 0.0591568 0.5547106
2 10341259 -0.4340426 0.2240006 0.5542188
2 10339130 0.0752054 0.0929756 0.54716
2 10358597 -0.2788662 0.0270332 0.5450396 Hmcn1 hemicentin 1
2 10340963 -0.0122214 0.0185678 0.5443816
2 10339636 -0.1617256 0.0688568 0.5440882
2 10341138 -0.0730652 0.0999904 0.5347006
2 10403054 0.0251384 0.1963096 0.5334576 LOC435333 similar to monoclonal antibody heavy chain
2 10342411 -0.1360698 0.094731 0.5318112
2 10514275 -0.3487288 0.4313314 0.5248414 PTPLAD2 protein tyrosine phosphatase-like A domain containing 2
2 10438405 -0.0999018 0.1139124 0.5232862 Igl-V1 immunoglobulin lambda variable 1
2 10339701 -0.1907344 0.255432 0.5207038
2 10343852 -0.2831682 0.2589402 0.5181406
2 10341176 -0.1827082 0.0170758 0.516327
2 10407803 -0.4183238 0.3232694 0.5154 GPR137B G protein-coupled receptor 137B
2 10428376 -0.1964356 0.1281504 0.5150654 ANGPT1 angiopoietin 1
2 10525365 -0.0844586 0.4382686 0.513776 HVCN1 hydrogen voltage-gated channel 1
2 10344498 -0.098598 0.019697 0.5125674
2 10340641 -0.1823064 0.3971678 0.5103816
2 10341856 0.0394748 0.6117738 0.5099288
2 10341404 0.4446882 0.3058046 0.5086178
2 10341424 -0.0363316 0.605655 0.507274
2 10593499 0.1906922 0.2947926 0.5027192 C11orf87 chromosome 11 open reading frame 87
2 10554599 -0.0138944 0.045797 0.5023502 ADAMTSL3 ADAMTS-like 3
2 10342825 0.0919492 0.12097 0.5006594
2 10514185 -0.1280094 0.121993 0.4984276
2 10343375 -0.2763744 0.5417344 0.4982356
2 10387821 -0.2005068 0.1055504 0.4945546 ALOX12 arachidonate 12-lipoxygenase
2 10341902 -0.189241 0.12061 0.4942444
2 10411373 -0.112559 0.2547298 0.4907994 HEXB hexosaminidase B (beta polypeptide)
2 10372648 0.073996 0.508846 0.49076 Lyz1/Lyz2 lysozyme 2
2 10339368 -0.188901 0.1598632 0.4904694
2 10341472 -0.0834932 0.0515348 0.484064
2 10581151 0.149494 0.2003284 0.4825694 RRAD Ras-related associated with diabetes
2 10538871 -0.081158 0.054819 0.4748436
2 10340944 -0.1083164 0.122037 0.474302
2 10538868 -0.0319804 0.0941336 0.471769
2 10342258 -0.0886528 0.2759672 0.4612006
2 10342615 -0.2178104 0.2196296 0.4513272

16
Online Table 3. Gene list of cluster 8 Cluster Probe Set ID Day 4 Day 7 Day 60 Symbol Entrez Gene Name
8 10343814 0.057474 -0.260061 -1.044283
8 10343210 -0.006554 0.29227 -0.906136
8 10343359 0.0335406 -0.114459 -0.898168
8 10340089 -0.069631 -0.447173 -0.842473
8 10340454 -0.176305 -0.150989 -0.813968
8 10342440 -0.165801 -0.459581 -0.810953
8 10342239 -0.22637 -0.365949 -0.807563
8 10340111 -0.691877 0.2855862 -0.800236
8 10339482 -0.19713 0.125478 -0.797052
8 10344438 -0.609841 -0.075026 -0.794139
8 10584870 -0.061601 0.3343204 -0.783085 TMPRSS13 transmembrane protease, serine 13
8 10546450 -0.186072 0.2033814 -0.7797 ADAMTS9 ADAM metallopeptidase with thrombospondin type 1 motif, 9
8 10546454 -0.173559 0.2577978 -0.762913 ADAMTS9 ADAM metallopeptidase with thrombospondin type 1 motif, 9
8 10339483 0.086864 -0.05119 -0.742528
8 10339551 -0.413509 -0.546079 -0.736669
8 10409876 0.0430542 0.150188 -0.73402 Ctla2a cytotoxic T lymphocyte-associated protein 2 alpha
8 10339687 -0.155523 0.046138 -0.734003
8 10343997 -0.057852 0.0413066 -0.728557
8 10341429 0.0724998 -0.040937 -0.726538
8 10343609 -0.134781 -0.052952 -0.718581
8 10374558 -0.123948 -0.17435 -0.710369
8 10338694 -0.149355 0.3857772 -0.685437
8 10341953 -0.029092 0.3241066 -0.663133
8 10338444 -0.576996 -0.573967 -0.657339
8 10339112 -0.070495 0.170341 -0.652994
8 10342899 -0.060883 0.0534208 -0.652899
8 10344097 -0.030691 -0.108291 -0.644524
8 10338454 -0.610685 -0.490796 -0.643212
8 10342346 0.0911672 -0.152515 -0.638822
8 10582658 -0.159881 -0.299674 -0.634761 AGT angiotensinogen (serpin peptidase inhibitor, clade A, member
8)
8 10343687 -0.873226 -0.119928 -0.632122
8 10343669 -0.098684 0.0694318 -0.626682
8 10342759 -0.112837 0.1364118 -0.624105
8 10342055 -0.232442 -0.121436 -0.618854
8 10339575 -0.503908 -0.169805 -0.614889
8 10343523 -0.265503 0.2772682 -0.611669
8 10343668 -0.171751 0.2788828 -0.61049
8 10338735 -0.247834 -0.153316 -0.600365
8 10341481 -0.222642 0.054183 -0.592426
8 10344406 -0.117725 0.1935422 -0.591294
8 10339466 0.0199036 0.038895 -0.583974
8 10340328 -0.133862 0.0259804 -0.575554
8 10342225 -0.089146 -0.036936 -0.568064
8 10340891 -0.47981 -0.134343 -0.561921
8 10344349 -0.017971 -0.046669 -0.560743
8 10342818 -0.161457 -0.152445 -0.558365
8 10343751 -0.237626 0.2536828 -0.55621
8 10342379 0.048178 -0.1463 -0.555147
8 10379840 -0.044166 0.0759032 -0.553581 MYO19 myosin XIX
8 10341924 -0.406748 0.3219298 -0.537201
8 10343789 -0.15811 -0.06754 -0.536874
8 10339730 -0.041331 0.047343 -0.533815
8 10339258 -0.037248 -0.143286 -0.532816
8 10342679 -0.250192 -0.137234 -0.532184
8 10343243 -0.245494 -0.405605 -0.530705
8 10582896 -0.317428 0.1010356 -0.529798
8 10342033 -0.222276 -0.247679 -0.52553
8 10343890 -0.081156 0.0355814 -0.524317
8 10341708 -0.208428 -0.418306 -0.523708
8 10342564 -0.069737 -0.21409 -0.522057
8 10339927 -0.128385 -0.299444 -0.516851
8 10546452 -0.221495 -0.007042 -0.512991 ADAMTS9 ADAM metallopeptidase with thrombospondin type 1 motif, 9
8 10339543 -0.181043 -0.196952 -0.51234
8 10582888 -0.33681 -0.006591 -0.509682
8 10338511 0.002489 -0.12981 -0.507331
8 10344560 -0.147628 -0.12679 -0.499866
8 10342541 -0.32466 -0.230056 -0.499548
8 10343527 -0.300646 0.1084552 -0.499098
8 10339085 -0.116887 -0.225779 -0.496338
8 10375313 0.0136774 -0.202263 -0.493559 CCNJL cyclin J-like
8 10342207 -0.245279 -0.236198 -0.492659
8 10338941 -0.31031 -0.144122 -0.489919
8 10342075 -0.12968 -0.131082 -0.48744
8 10417235 -0.236034 0.0386916 -0.485718 Gm16440 (includes
others)
predicted gene 16440
8 10417315 -0.236034 0.0386916 -0.485718 Gm16440 (includes
others)
predicted gene 16440
8 10341415 -0.153661 -0.040949 -0.485596
8 10338115 -0.213307 0.413667 -0.483695
8 10417226 -0.288499 -0.038072 -0.481924 Gm16440 (includes
others)
predicted gene 16440
8 10342500 -0.208908 -0.094152 -0.48061
8 10341394 -0.249291 0.1178438 -0.480173
8 10340451 -0.308496 -0.026275 -0.479864

17
8 10342849 -0.172329 -0.263163 -0.479368
8 10344129 -0.290719 -0.216272 -0.479095
8 10343349 -0.340894 -0.313825 -0.478528
8 10341292 -0.592945 0.0272726 -0.478418
8 10406334 -0.132724 0.386618 -0.474837 MCTP1 multiple C2 domains, transmembrane 1
8 10343656 -0.334096 -0.101618 -0.471975
8 10344514 -0.516229 0.1883406 -0.471427
8 10340714 -0.255807 -0.043323 -0.470382
8 10343952 0.016714 -0.208138 -0.469359
8 10485840 -0.458445 -0.192511 -0.467961 RYR3 ryanodine receptor 3
8 10340397 -0.551116 0.1849844 -0.466994
8 10338304 -0.089312 0.3853574 -0.466588
8 10341972 -0.238572 -0.092749 -0.460335
8 10343689 -0.233525 -0.18641 -0.459112
8 10342626 -0.062494 0.024749 -0.458706
8 10340400 -0.452172 -0.313471 -0.4577
8 10338336 -0.260591 0.284172 -0.457535
8 10340346 -0.138686 0.193348 -0.456546
8 10412517 -0.221063 0.106317 -0.456167
8 10340896 -0.289683 0.1137688 -0.454815
8 10338740 -0.035458 -0.054936 -0.45337
8 10338775 -0.321407 -0.270201 -0.451961
8 10338183 -0.491491 -0.087994 -0.451764
8 10338467 -0.16067 -0.351098 -0.449783
8 10417408 -0.300479 -0.246387 -0.448749 Gm16440 (includes
others)
predicted gene 16440
8 10342231 -0.278965 0.0384412 -0.446843
8 10342097 -0.37157 -0.352113 -0.443872
8 10342311 -0.048637 -0.212998 -0.443197
8 10343765 -0.055235 -0.006336 -0.442502
8 10338445 -0.033066 0.0142492 -0.44242
8 10339992 -0.118933 0.0115622 -0.440094
8 10341887 -0.366725 -0.067226 -0.440001
8 10343309 -0.299251 0.0887494 -0.439257
8 10417258 -0.297422 -0.104262 -0.439031 Gm16440 (includes
others)
predicted gene 16440
8 10417371 -0.294654 0.0717922 -0.438682 Gm2897 predicted gene 2897
8 10479047 -0.599109 -0.38376 -0.438358 PCK1 phosphoenolpyruvate carboxykinase 1 (soluble)
8 10417302 -0.315854 -0.093141 -0.438228 Gm16440 (includes
others)
predicted gene 16440
8 10343655 -0.189866 0.1208892 -0.437892
8 10417446 -0.286566 -0.07533 -0.436575 Gm16440 (includes
others)
predicted gene 16440
8 10417452 -0.286566 -0.07533 -0.436575 Gm16440 (includes
others)
predicted gene 16440
8 10343193 -0.265318 -0.147605 -0.434836
8 10344077 -0.346702 0.1751756 -0.432688
8 10582882 -0.279818 -0.059763 -0.430957
8 10417319 -0.304108 -0.225864 -0.429823 Gm16440 (includes
others)
predicted gene 16440
8 10343171 -0.106573 0.0688612 -0.429037
8 10343256 -0.172659 -0.106678 -0.428571
8 10342340 -0.394726 -0.140377 -0.426665
8 10338859 -0.168585 -0.166341 -0.425653
8 10344255 -0.359483 0.2479562 -0.424418
8 10342695 -0.238759 -0.202227 -0.423707
8 10339552 -0.002391 -0.184565 -0.42336
8 10339700 -0.32304 -0.247053 -0.422909
8 10560719 -0.156289 -0.018259 -0.422552 LOC147710 hypothetical protein LOC147710
8 10541644 -0.223554 -0.144275 -0.420935 CD163 CD163 molecule
8 10417421 -0.303026 -0.032895 -0.418581 Gm16440 (includes
others)
predicted gene 16440
8 10569870 -0.578125 -0.095982 -0.417666 RETN resistin
8 10412549 -0.319118 -0.271854 -0.417528 Gm16440 (includes
others)
predicted gene 16440
8 10412491 -0.348178 0.0461062 -0.416952
8 10417458 -0.366682 -0.136461 -0.416151 Gm16440 (includes
others)
predicted gene 16440
8 10343485 -0.303343 -0.068276 -0.412863
8 10344138 -0.390965 -0.176965 -0.412505
8 10566205 -0.599107 -0.221109 -0.412316 USP17L2 (includes
others)
ubiquitin specific peptidase 17-like 2
8 10343044 -0.229195 0.2471892 -0.411114
8 10341330 -0.117604 -0.224287 -0.410309
8 10525831 -0.101296 -0.062671 -0.409452
8 10342602 -0.263089 -0.101726 -0.402354
8 10341042 -0.310178 0.1062262 -0.402248
8 10342132 -0.218116 -0.367014 -0.401276
8 10472514 -0.157265 0.1591126 -0.400952 NOSTRIN nitric oxide synthase trafficker
8 10417286 -0.2538 -0.065725 -0.399924
8 10516910 -0.071214 -0.21553 -0.39839 PHACTR4 phosphatase and actin regulator 4
8 10417269 -0.259373 0.0708936 -0.396012
8 10417239 -0.291879 -0.156488 -0.394771 Gm16440 (includes
others)
predicted gene 16440
8 10412537 -0.273151 -0.049177 -0.394336 Gm16440 (includes
others)
predicted gene 16440
8 10571860 -0.146354 0.0049078 -0.394139 HAND2 heart and neural crest derivatives expressed 2
8 10343964 -0.23063 -0.286814 -0.392593

18
8 10592044 -0.470623 -0.291752 -0.392409 TMEM45B transmembrane protein 45B
8 10556297 -0.02382 -0.128412 -0.39186 ADM adrenomedullin
8 10417366 -0.300055 -0.133695 -0.389423 Gm16440 (includes
others)
predicted gene 16440
8 10485117 -0.177666 0.1404688 -0.388722 CREB3L1 cAMP responsive element binding protein 3-like 1
8 10339204 -0.227876 -0.08941 -0.386793
8 10412520 -0.230829 -0.080682 -0.386179 Gm16440 (includes
others)
predicted gene 16440
8 10343321 -0.42069 0.2130392 -0.381301
8 10341310 -0.125914 -0.024266 -0.381157
8 10417373 -0.260023 -0.048878 -0.380417 Gm16440 (includes
others)
predicted gene 16440
8 10344103 -0.121463 0.1500182 -0.380258
8 10340011 -0.355634 -0.264917 -0.380123
8 10338990 -0.237975 -0.331808 -0.380043
8 10340500 -0.15484 0.0716388 -0.379108
8 10338606 -0.055807 -0.194168 -0.378679
8 10339445 -0.113983 -0.0665 -0.378632
8 10343231 -0.134982 -0.044001 -0.378569
8 10344296 -0.088777 0.0959224 -0.377986
8 10344222 -0.435427 0.2020756 -0.376073
8 10343450 -0.568889 0.1000554 -0.374765
8 10417461 -0.273723 -0.052921 -0.374539 Gm16440 (includes
others)
predicted gene 16440
8 10340868 -0.172004 0.0062092 -0.374411
8 10340348 -0.095527 -0.253397 -0.373329
8 10417264 -0.289424 -0.026723 -0.372672 Gm16440 (includes
others)
predicted gene 16440
8 10421730 -0.140118 -0.172687 -0.371971 C13orf30 chromosome 13 open reading frame 30
8 10364702 -0.08798 -0.009696 -0.371656 MIDN midnolin
8 10341514 -0.189421 -0.047354 -0.371555
8 10341689 -0.163101 -0.130894 -0.371229
8 10340196 -0.238356 -0.042083 -0.370474
8 10608100 -0.056955 -0.103744 -0.370319 Zfy1/Zfy2 zinc finger protein 1, Y linked
8 10340264 -0.23117 0.0832176 -0.370211
8 10417245 -0.295934 -0.253074 -0.370194 Gm16440 (includes
others)
predicted gene 16440
8 10369290 -0.037997 -0.186712 -0.370011 DDIT4 DNA-damage-inducible transcript 4
8 10417411 -0.328547 -0.194052 -0.367151 HN1L hematological and neurological expressed 1-like
8 10344065 -0.121017 -0.143936 -0.367079
8 10344295 -0.482019 0.2227288 -0.367053
8 10409866 -0.10078 0.0492606 -0.364796 Ctla2b cytotoxic T lymphocyte-associated protein 2 beta
8 10338378 -0.367165 -0.284667 -0.36229
8 10341207 -0.2916 -0.14443 -0.357818
8 10343681 -0.170371 -0.151064 -0.35779
8 10342223 -0.256812 -0.124895 -0.356855
8 10343209 -0.201601 -0.035445 -0.356663
8 10340459 -0.175355 -0.268712 -0.354854
8 10362628 -0.074213 0.0396628 -0.353916
8 10342751 -0.277966 -0.212993 -0.352302
8 10341130 -0.074885 -0.264668 -0.350977
8 10338685 -0.243043 0.0613576 -0.349644
8 10342384 -0.298297 -0.235433 -0.349317
8 10344199 -0.09449 0.0420494 -0.349027
8 10417326 -0.242191 -0.024587 -0.348913 Gm16440 (includes
others)
predicted gene 16440
8 10341152 -0.318506 0.101641 -0.348157
8 10339531 -0.180499 -0.037833 -0.347827
8 10343645 -0.173245 0.2145328 -0.346607
8 10341666 -0.051049 -0.063908 -0.343754
8 10344499 -0.310503 0.000494 -0.343519
8 10497323 -0.142723 -0.089847 -0.343112 Gm10745 predicted gene 10745
8 10339800 -0.106697 -0.0159 -0.342907
8 10342038 -0.140026 0.1191986 -0.342625
8 10344398 -0.312625 -0.009168 -0.342559
8 10342941 -0.162702 -0.113457 -0.342449
8 10342767 -0.052148 -0.08102 -0.340488
8 10340771 -0.104352 0.1323156 -0.339692
8 10344537 -0.218055 -0.086577 -0.339665
8 10471018 -0.136093 -0.167839 -0.339611 FAM73B family with sequence similarity 73, member B
8 10340696 -0.449799 -0.314795 -0.338799
8 10338620 -0.393238 0.1009024 -0.337971
8 10417769 -0.179688 0.0953506 -0.33757 Gm2897 predicted gene 2897
8 10344342 -0.25722 0.1943124 -0.337142
8 10340160 -0.1109 0.0775744 -0.337112
8 10608693 -0.275379 -0.28359 -0.335815
8 10342670 -0.461336 0.1803992 -0.335271
8 10340859 -0.181561 -0.308287 -0.333946
8 10338742 -0.248499 -0.182399 -0.333668
8 10403248 -0.079034 0.0098688 -0.333619 Speer6-ps1 spermatogenesis associated glutamate (E)-rich protein 6,
pseudogene 1
8 10339105 -0.159482 0.0787314 -0.332771
8 10342845 -0.238552 -0.062155 -0.33151
8 10340552 -0.196721 0.1220386 -0.331385
8 10504986 -0.158237 -0.310626 -0.331338
8 10344381 -0.242594 -0.00442 -0.331263
8 10342585 -0.336986 0.2043106 -0.331244
8 10338438 -0.100256 0.0943342 -0.330074

19
8 10398362 -0.554912 0.0890954 -0.329338 AF357355 snoRNA AF357355
8 10343513 -0.43054 -0.07914 -0.328909
8 10341676 -0.130463 -0.025333 -0.32889
8 10339082 -0.399683 -0.200451 -0.328882
8 10341248 -0.214827 0.1217572 -0.328337
8 10362937 -0.136109 -0.24487 -0.327643
8 10344283 -0.228082 0.0533264 -0.32753
8 10342159 -0.175223 -0.197507 -0.326965
8 10412495 -0.327985 0.0251292 -0.326112
8 10417359 -0.316844 -0.083124 -0.32568 Gm16440 (includes
others)
predicted gene 16440
8 10488804 -0.081785 -0.191367 -0.325504
8 10339119 -0.316348 0.0557388 -0.323799
8 10509947 -0.184982 0.1048454 -0.323165 ARHGEF19 Rho guanine nucleotide exchange factor (GEF) 19
8 10602038 -0.078705 -0.216869 -0.322588 CXorf41 chromosome X open reading frame 41
8 10339346 -0.232927 -0.171761 -0.322413
8 10342691 -0.125132 -0.087516 -0.322204
8 10343429 -0.329688 0.0106798 -0.322012
8 10339063 -0.139756 0.012978 -0.321805
8 10392221 -0.12925 -0.145632 -0.320681 PECAM1 platelet/endothelial cell adhesion molecule
8 10563943 -0.137742 -0.231032 -0.319765
8 10338314 -0.143217 -0.113702 -0.319326
8 10342471 -0.204236 0.053316 -0.318421
8 10417504 -0.245995 -0.16544 -0.316812 Gm16440 (includes
others)
predicted gene 16440
8 10340093 -0.067578 -0.071574 -0.31665
8 10342731 -0.401167 0.0184874 -0.314487
8 10448131 -0.070439 -0.062383 -0.31382 EG224552 (includes
others)
vomeronasal 2, receptor 107
8 10605633 -0.074906 -0.114926 -0.313755 Pet2 plasmacytoma expressed transcript 2
8 10341578 -0.21565 -0.122194 -0.313207
8 10344396 -0.065553 -0.080023 -0.313019
8 10340664 -0.230705 -0.159785 -0.311764
8 10525837 -0.1362 0.128989 -0.311179 DNAH10 dynein, axonemal, heavy chain 10
8 10479740 -0.150688 -0.146352 -0.310289
8 10342414 -0.186483 -0.08339 -0.309966
8 10343892 -0.17809 -0.288905 -0.308562
8 10343174 -0.266691 -0.192188 -0.308538
8 10340239 -0.327378 -0.333815 -0.307884
8 10342305 -0.078939 -0.229537 -0.307066
8 10498568 -0.338753 0.0581608 -0.306609 SHOX2 short stature homeobox 2
8 10564795 -0.396624 -0.252961 -0.305425 PLIN1 perilipin 1
8 10347291 -0.240868 0.213194 -0.305303 CXCR2 chemokine (C-X-C motif) receptor 2
8 10339089 -0.538814 -0.249183 -0.303939
8 10341060 -0.327688 0.2547564 -0.303341
8 10338238 -0.135645 -0.124075 -0.302628
8 10510604 -0.103529 0.058184 -0.301402 DNAJC11 DnaJ (Hsp40) homolog, subfamily C, member 11
8 10340839 -0.299516 -0.205938 -0.300026
8 10338499 -0.482279 -0.354847 -0.298715
8 10364030 -0.084806 -0.020635 -0.29857 ADORA2A adenosine A2a receptor
8 10358991 -0.100347 0.026636 -0.29652 KIAA1614 KIAA1614
8 10338617 -0.153139 -0.107193 -0.296359
8 10413416 -0.25307 -0.178073 -0.296208 IL17RD interleukin 17 receptor D
8 10340159 -0.22935 -0.06575 -0.295973
8 10343224 -0.228365 -0.113099 -0.295951
8 10345527 -0.211699 0.0507954 -0.293646
8 10340817 -0.347658 -0.147173 -0.29318
8 10340350 -0.403138 -0.04769 -0.292836
8 10489451 -0.090254 -0.223507 -0.292627 Svs2 seminal vesicle secretory protein 2
8 10606654 -0.224125 0.2120846 -0.292399 XKRX XK, Kell blood group complex subunit-related, X-linked
8 10344303 -0.22335 0.0436574 -0.292107
8 10340463 -0.231815 -0.278607 -0.291566
8 10338901 -0.175605 0.2313366 -0.29147
8 10341347 -0.328009 -0.203693 -0.291083
8 10343411 -0.091389 -0.003119 -0.290966
8 10590383 -0.168881 -0.302088 -0.290547 SS18L2 synovial sarcoma translocation gene on chromosome 18-like 2
8 10339837 -0.190296 0.13286 -0.290389
8 10354598 -0.130874 -0.214024 -0.290258 HECW2 HECT, C2 and WW domain containing E3 ubiquitin protein
ligase 2
8 10340142 -0.084988 -0.036424 -0.290198
8 10417253 -0.191799 -0.23945 -0.289662 Gm16440 (includes
others)
predicted gene 16440
8 10417281 -0.191799 -0.23945 -0.289662 Gm16440 (includes
others)
predicted gene 16440
8 10343507 -0.375351 0.1357864 -0.289082
8 10340323 -0.370184 -0.226815 -0.288734
8 10466359 -0.244784 0.0306732 -0.288587 Olfr1472/Olfr1475 olfactory receptor 1475
8 10529091 -0.344295 -0.154936 -0.288149
8 10340762 -0.427294 0.0084886 -0.288007
8 10338143 -0.099759 -0.20656 -0.287093
8 10513186 -0.140472 -0.070741 -0.287081 Gm12538 predicted gene 12538
8 10400803 -0.179707 -0.107481 -0.286171
8 10344536 -0.087497 -0.164715 -0.285821
8 10340390 -0.521609 -0.070476 -0.284241
8 10338564 -0.121147 -0.016374 -0.282849
8 10564165 -0.54 -0.161959 -0.282184 PWCR1 small nucleolar RNA, C/D box 116 cluster
8 10338721 -0.317571 -0.187175 -0.281839
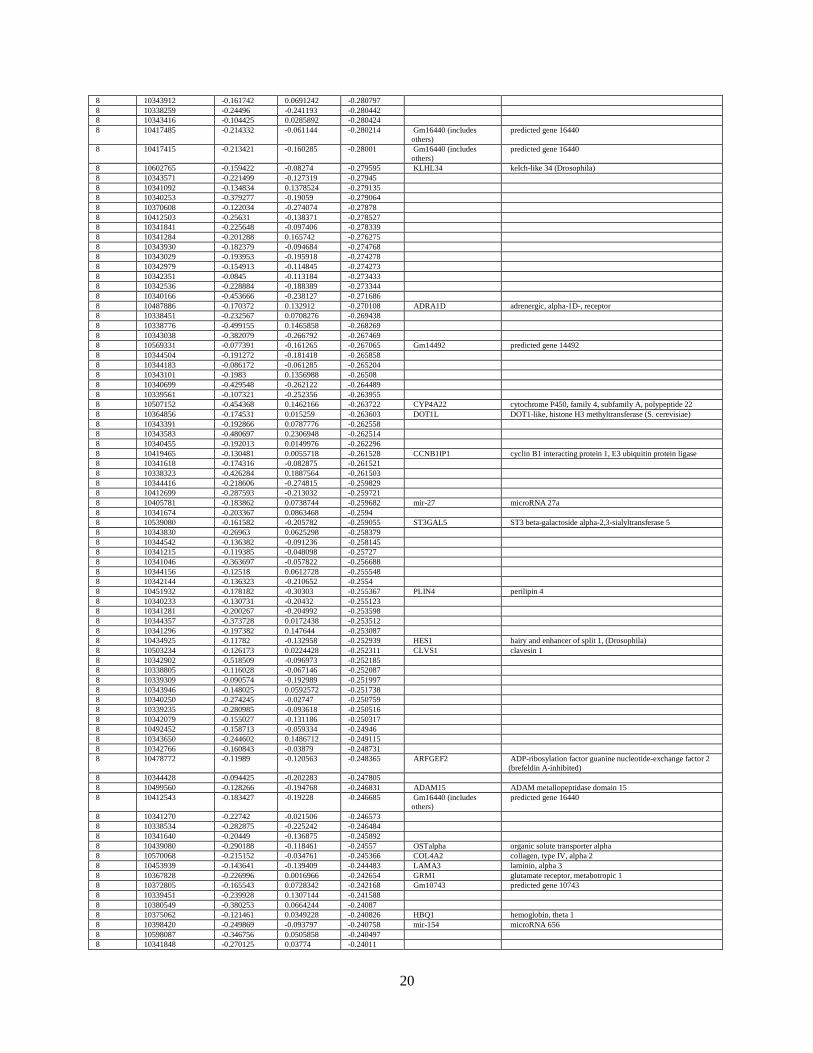
20
8 10343912 -0.161742 0.0691242 -0.280797
8 10338259 -0.24496 -0.241193 -0.280442
8 10343416 -0.104425 0.0285892 -0.280424
8 10417485 -0.214332 -0.061144 -0.280214 Gm16440 (includes
others)
predicted gene 16440
8 10417415 -0.213421 -0.160285 -0.28001 Gm16440 (includes
others)
predicted gene 16440
8 10602765 -0.159422 -0.08274 -0.279595 KLHL34 kelch-like 34 (Drosophila)
8 10343571 -0.221499 -0.127319 -0.27945
8 10341092 -0.134834 0.1378524 -0.279135
8 10340253 -0.379277 -0.19059 -0.279064
8 10370608 -0.122034 -0.274074 -0.27878
8 10412503 -0.25631 -0.138371 -0.278527
8 10341841 -0.225648 -0.097406 -0.278339
8 10341284 -0.201288 0.165742 -0.276275
8 10343930 -0.182379 -0.094684 -0.274768
8 10343029 -0.193953 -0.195918 -0.274278
8 10342979 -0.154913 -0.114845 -0.274273
8 10342351 -0.0845 -0.113184 -0.273433
8 10342536 -0.228884 -0.188389 -0.273344
8 10340166 -0.453666 -0.238127 -0.271686
8 10487886 -0.170372 0.132912 -0.270108 ADRA1D adrenergic, alpha-1D-, receptor
8 10338451 -0.232567 0.0708276 -0.269438
8 10338776 -0.499155 0.1465858 -0.268269
8 10343038 -0.382079 -0.266792 -0.267469
8 10569331 -0.077391 -0.161265 -0.267065 Gm14492 predicted gene 14492
8 10344504 -0.191272 -0.181418 -0.265858
8 10344183 -0.086172 -0.061285 -0.265204
8 10343101 -0.1983 0.1356988 -0.26508
8 10340699 -0.429548 -0.262122 -0.264489
8 10339561 -0.107321 -0.252356 -0.263955
8 10507152 -0.454368 0.1462166 -0.263722 CYP4A22 cytochrome P450, family 4, subfamily A, polypeptide 22
8 10364856 -0.174531 0.015259 -0.263603 DOT1L DOT1-like, histone H3 methyltransferase (S. cerevisiae)
8 10343391 -0.192866 0.0787776 -0.262558
8 10343583 -0.480697 0.2306948 -0.262514
8 10340455 -0.192013 0.0149976 -0.262296
8 10419465 -0.130481 0.0055718 -0.261528 CCNB1IP1 cyclin B1 interacting protein 1, E3 ubiquitin protein ligase
8 10341618 -0.174316 -0.082875 -0.261521
8 10338323 -0.426284 0.1887564 -0.261503
8 10344416 -0.218606 -0.274815 -0.259829
8 10412699 -0.287593 -0.213032 -0.259721
8 10405781 -0.183862 0.0738744 -0.259682 mir-27 microRNA 27a
8 10341674 -0.203367 0.0863468 -0.2594
8 10539080 -0.161582 -0.205782 -0.259055 ST3GAL5 ST3 beta-galactoside alpha-2,3-sialyltransferase 5
8 10343830 -0.26963 0.0625298 -0.258379
8 10344542 -0.136382 -0.091236 -0.258145
8 10341215 -0.119385 -0.048098 -0.25727
8 10341046 -0.363697 -0.057822 -0.256688
8 10344156 -0.12518 0.0612728 -0.255548
8 10342144 -0.136323 -0.210652 -0.2554
8 10451932 -0.178182 -0.30303 -0.255367 PLIN4 perilipin 4
8 10340233 -0.130731 -0.20432 -0.255123
8 10341281 -0.200267 -0.204992 -0.253598
8 10344357 -0.373728 0.0172438 -0.253512
8 10341296 -0.197382 0.147644 -0.253087
8 10434925 -0.11782 -0.132958 -0.252939 HES1 hairy and enhancer of split 1, (Drosophila)
8 10503234 -0.126173 0.0224428 -0.252311 CLVS1 clavesin 1
8 10342902 -0.518509 -0.096973 -0.252185
8 10338805 -0.116028 -0.067146 -0.252087
8 10339309 -0.090574 -0.192989 -0.251997
8 10343946 -0.148025 0.0592572 -0.251738
8 10340250 -0.274245 -0.02747 -0.250759
8 10339235 -0.280985 -0.093618 -0.250516
8 10342079 -0.155027 -0.131186 -0.250317
8 10492452 -0.158713 -0.059334 -0.24946
8 10343650 -0.244602 0.1486712 -0.249115
8 10342766 -0.160843 -0.03879 -0.248731
8 10478772 -0.11989 -0.120563 -0.248365 ARFGEF2 ADP-ribosylation factor guanine nucleotide-exchange factor 2
(brefeldin A-inhibited)
8 10344428 -0.094425 -0.202283 -0.247805
8 10499560 -0.128266 -0.194768 -0.246831 ADAM15 ADAM metallopeptidase domain 15
8 10412543 -0.183427 -0.19228 -0.246685 Gm16440 (includes
others)
predicted gene 16440
8 10341270 -0.22742 -0.021506 -0.246573
8 10338534 -0.282875 -0.225242 -0.246484
8 10341640 -0.20449 -0.136875 -0.245892
8 10439080 -0.290188 -0.118461 -0.24557 OSTalpha organic solute transporter alpha
8 10570068 -0.215152 -0.034761 -0.245366 COL4A2 collagen, type IV, alpha 2
8 10453939 -0.143641 -0.139409 -0.244483 LAMA3 laminin, alpha 3
8 10367828 -0.226996 0.0016966 -0.242654 GRM1 glutamate receptor, metabotropic 1
8 10372805 -0.165543 0.0728342 -0.242168 Gm10743 predicted gene 10743
8 10339451 -0.239928 0.1307144 -0.241588
8 10380549 -0.380253 0.0664244 -0.24087
8 10375062 -0.121461 0.0349228 -0.240826 HBQ1 hemoglobin, theta 1
8 10398420 -0.249869 -0.093797 -0.240758 mir-154 microRNA 656
8 10598087 -0.346756 0.0505858 -0.240497
8 10341848 -0.270125 0.03774 -0.24011

21
8 10564169 -0.421228 -0.1985 -0.239041 PWCR1 small nucleolar RNA, C/D box 116 cluster
8 10603252 -0.17863 -0.102166 -0.238612 LARP4 La ribonucleoprotein domain family, member 4
8 10417773 -0.256633 -0.162403 -0.237971 Gm16440 (includes
others)
predicted gene 16440
8 10343759 -0.151292 -0.283123 -0.237319
8 10339428 -0.300562 0.0704936 -0.236979
8 10339484 -0.303885 -0.124769 -0.236865
8 10342284 -0.185752 0.0533684 -0.236204
8 10343093 -0.128842 -0.186408 -0.236134
8 10460194 -0.153186 -0.268086 -0.236128
8 10567739 -0.168187 -0.162766 -0.234747 4933440M02Rik RIKEN cDNA 4933440M02 gene
8 10339783 -0.109908 -0.143389 -0.23405
8 10371844 -0.209545 -0.039877 -0.23397
8 10576835 -0.32464 -0.001306 -0.233753 Cd209f/Cd209g CD209g antigen
8 10420171 -0.141882 -0.112938 -0.232734 ADCY4 adenylate cyclase 4
8 10341994 -0.293669 0.0187494 -0.232671
8 10341135 -0.232101 0.045258 -0.232361
8 10344022 -0.214864 -0.232948 -0.232291
8 10532592 -0.251064 -0.127217 -0.231579 MYO18B myosin XVIIIB
8 10543870 -0.111617 -0.086006 -0.231556 Npn2 neoplastic progression 2
8 10454235 -0.264465 -0.118204 -0.231452 ASXL3 additional sex combs like 3 (Drosophila)
8 10407416 -0.096805 -0.08297 -0.230378 CALML3 calmodulin-like 3
8 10338717 -0.196079 -0.169528 -0.230183
8 10343087 -0.383043 -0.255052 -0.229685
8 10497077 -0.246855 -0.117059 -0.229463 mir-186 microRNA 186
8 10576680 -0.172341 -0.216136 -0.228931 ZNF821 zinc finger protein 821
8 10341506 -0.121456 0.0402508 -0.22892
8 10468415 -0.110675 -0.180605 -0.228686 WDR96 WD repeat domain 96
8 10410235 -0.177822 -0.044917 -0.227669
8 10340085 -0.421906 -0.094255 -0.227081
8 10402997 -0.158691 -0.225727 -0.22696 LOC630837 ig heavy chain V region 5-84-like
8 10508788 -0.122615 -0.062374 -0.22647 AHDC1 AT hook, DNA binding motif, containing 1
8 10342048 -0.104357 -0.157793 -0.225663
8 10422164 -0.23054 -0.19178 -0.225622 EDNRB endothelin receptor type B
8 10343451 -0.502599 -0.080583 -0.225084
8 10343752 -0.231035 -0.016829 -0.224774
8 10584309 -0.175753 -0.023137 -0.223771 C11orf61 chromosome 11 open reading frame 61
8 10605355 -0.130288 -0.205801 -0.223591
8 10339058 -0.162668 -0.017862 -0.223552
8 10341313 -0.14936 0.0626136 -0.222563
8 10412513 -0.227094 -0.252989 -0.222423 Gm16440 (includes
others)
predicted gene 16440
8 10510908 -0.091757 -0.135669 -0.222413
8 10570972 -0.094254 -0.141394 -0.222328 A730045E13Rik RIKEN cDNA A730045E13 gene
8 10549265 -0.115275 -0.096711 -0.221914 IFLTD1 intermediate filament tail domain containing 1
8 10395849 -0.134856 -0.019873 -0.221616 PAX9 paired box 9
8 10344496 -0.443335 0.1398238 -0.220675
8 10471550 -0.16645 0.0576694 -0.220449 Rpl12 ribosomal protein L12
8 10515974 -0.144439 -0.142086 -0.220267 NFYC nuclear transcription factor Y, gamma
8 10340396 -0.544263 0.1212022 -0.220031
8 10367471 -0.161757 0.0440228 -0.219606 Olfr763/Olfr9 olfactory receptor 9
8 10427879 -0.263447 0.0958018 -0.217993
8 10341500 -0.490407 -0.084223 -0.217945
8 10427659 -0.151985 -0.19669 -0.217386
8 10448350 -0.117633 -0.116959 -0.217224 PAQR4 progestin and adipoQ receptor family member IV
8 10490845 -0.165375 -0.198912 -0.217102 CHMP4C chromatin modifying protein 4C
8 10563931 -0.14396 -0.191815 -0.217073
8 10338301 -0.517518 -0.079925 -0.21705
8 10493307 -0.298185 -0.197765 -0.216896
8 10552288 -0.130438 -0.115579 -0.216438 VSTM2B V-set and transmembrane domain containing 2B
8 10517067 -0.134084 -0.092445 -0.215499 SFN stratifin
8 10473363 -0.345935 0.1896584 -0.215355 TIMM10 translocase of inner mitochondrial membrane 10 homolog
(yeast)
8 10340869 -0.385066 -0.112162 -0.215222
8 10398354 -0.435925 0.078274 -0.214984
8 10470392 -0.352137 -0.210214 -0.214704 ADAMTSL2 ADAMTS-like 2
8 10551421 -0.284097 0.0742338 -0.214049 Zfp60 (includes others) zinc finger protein 60
8 10531675 -0.155424 0.028196 -0.21378 SEC31A SEC31 homolog A (S. cerevisiae)
8 10339935 -0.221859 -0.179159 -0.213566
8 10338469 -0.279198 -0.225112 -0.213272
8 10342175 -0.170098 -0.183305 -0.213103
8 10354370 -0.166035 -0.204998 -0.212821
8 10341598 -0.222546 -0.144559 -0.211102
8 10338823 -0.227717 -0.220252 -0.211031
8 10340445 -0.462918 -0.124705 -0.210592
8 10339496 -0.20754 -0.233672 -0.210258
8 10581266 -0.17067 -0.13141 -0.209591 TPPP3 tubulin polymerization-promoting protein family member 3
8 10341158 -0.182291 -0.047074 -0.209235
8 10354003 -0.165563 -0.134562 -0.208936 MGAT4A mannosyl (alpha-1,3-)-glycoprotein beta-1,4-N-
acetylglucosaminyltransferase, isozyme A
8 10447079 -0.30529 -0.292102 -0.207367 LOC100502965 hypothetical protein LOC100502965
8 10342614 -0.24877 -0.107097 -0.207199
8 10595848 -0.294923 0.1457502 -0.207077 SPSB4 splA/ryanodine receptor domain and SOCS box containing 4
8 10343486 -0.140262 -0.163923 -0.206499
8 10339433 -0.487406 0.0857854 -0.206482
8 10339200 -0.126697 -0.138939 -0.205829
8 10489357 -0.155555 -0.136334 -0.205367 JPH2 junctophilin 2

22
8 10563764 -0.15293 -0.148619 -0.204904 Mrgprb3 (includes
EG:292928)
MAS-related GPR, member B3
8 10480379 -0.145376 -0.116415 -0.204663 MRPS5 mitochondrial ribosomal protein S5
8 10489355 -0.328134 -0.122406 -0.204465 JPH2 junctophilin 2
8 10341821 -0.356074 -0.109092 -0.204462
8 10366163 -0.144536 -0.180706 -0.204377 SLC6A15 solute carrier family 6 (neutral amino acid transporter), member
15
8 10342114 -0.417156 -0.229549 -0.204246
8 10601768 -0.221899 -0.2589 -0.204067 ARMCX4 armadillo repeat containing, X-linked 4
8 10339747 -0.201718 0.0117166 -0.204054
8 10392464 -0.166157 0.025509 -0.203737 FAM20A family with sequence similarity 20, member A
8 10563989 -0.311615 -0.12134 -0.203678
8 10460879 -0.147927 -0.09504 -0.203535 MEN1 multiple endocrine neoplasia I
8 10581643 -0.140322 -0.112104 -0.203372
8 10594301 -0.22898 -0.240603 -0.202219 CORO2B coronin, actin binding protein, 2B
8 10420437 -0.320742 -0.046138 -0.201935 ZDHHC20 zinc finger, DHHC-type containing 20
8 10559790 -0.234197 -0.200671 -0.201166 Zim1 zinc finger, imprinted 1
8 10582890 -0.294369 -0.041459 -0.200622
8 10340938 -0.212447 -0.132549 -0.200114
8 10491858 -0.284056 -0.112619 -0.200097
8 10442254 -0.289371 -0.154774 -0.199925
8 10430127 -0.134596 -0.082904 -0.199388 ZNF251 zinc finger protein 251
8 10394798 -0.192683 -0.081493 -0.198928
8 10404336 -0.248431 -0.066713 -0.197722
8 10338631 -0.234799 -0.221083 -0.197322
8 10602271 -0.268202 -0.162147 -0.197085
8 10576495 -0.163572 -0.161988 -0.196948 TRIM67 tripartite motif containing 67
8 10340974 -0.183563 -0.21089 -0.196549
8 10417501 -0.334936 -0.198439 -0.196023 Gm16440 (includes
others)
predicted gene 16440
8 10576218 -0.186349 -0.219848 -0.195902 CPNE7 copine VII
8 10566800 -0.181325 -0.153887 -0.195742 ASCL3 achaete-scute complex homolog 3 (Drosophila)
8 10338289 -0.16204 -0.144913 -0.195665
8 10523277 -0.222296 -0.173408 -0.194927 ANKRD56 ankyrin repeat domain 56
8 10461100 -0.15006 0.0087234 -0.194109 HRASLS5 HRAS-like suppressor family, member 5
8 10596135 -0.174444 -0.042668 -0.192841
8 10440647 -0.159573 0.0266334 -0.192374 CLDN8 claudin 8
8 10343180 -0.312017 -0.056468 -0.192032
8 10344544 -0.461764 -0.221578 -0.191844
8 10592856 -0.162201 -0.078854 -0.191816 RPS25 ribosomal protein S25
8 10341675 -0.299296 -0.06617 -0.191368
8 10339723 -0.307543 0.0746594 -0.191056
8 10491773 -0.221109 0.0983504 -0.190942 SLC25A31 solute carrier family 25 (mitochondrial carrier; adenine
nucleotide translocator), member 31
8 10361250 -0.205227 0.0794396 -0.190784 CAMK1G calcium/calmodulin-dependent protein kinase IG
8 10484886 -0.197231 -0.180662 -0.190705 Olfr1272/Olfr1273-ps olfactory receptor 1272
8 10339720 -0.393693 -0.026985 -0.190477
8 10340508 -0.368699 0.018861 -0.190211
8 10473261 -0.180748 0.0053478 -0.190109 FSIP2 fibrous sheath interacting protein 2
8 10343265 -0.168164 -0.066676 -0.189427
8 10341737 -0.492329 0.010091 -0.188461
8 10578413 -0.157728 -0.038237 -0.188384 Adam34 (includes
others)
a disintegrin and metallopeptidase domain 34
8 10591668 -0.158496 -0.134116 -0.187883 RGL3 ral guanine nucleotide dissociation stimulator-like 3
8 10572755 -0.284376 0.1300696 -0.187734
8 10339539 -0.260429 -0.160332 -0.186763
8 10387257 -0.328299 -0.180602 -0.18663 ALOX15B arachidonate 15-lipoxygenase, type B
8 10339467 -0.349107 -0.193788 -0.186523
8 10342133 -0.23931 -0.10236 -0.185616
8 10444717 -0.22616 -0.064759 -0.185553 C6orf47 chromosome 6 open reading frame 47
8 10344355 -0.383942 0.0436264 -0.185403
8 10484555 -0.14987 -0.128719 -0.184832 Olfr1037 olfactory receptor 1037
8 10344411 -0.257262 -0.239261 -0.184731
8 10563527 -0.302414 -0.074121 -0.184034 USH1C Usher syndrome 1C (autosomal recessive, severe)
8 10342167 -0.337313 0.0503388 -0.183927
8 10343372 -0.155085 0.0066144 -0.183607
8 10345167 -0.18296 0.0371888 -0.183606
8 10342985 -0.322365 -0.034603 -0.183369
8 10448916 -0.282699 -0.069342 -0.183281 Tpsab1 tryptase alpha/beta 1
8 10476512 -0.4292 0.0093482 -0.183256 SNAP25 synaptosomal-associated protein, 25kDa
8 10583291 -0.202073 -0.215991 -0.182962 C11orf90 chromosome 11 open reading frame 90
8 10344408 -0.256562 -0.074193 -0.182925
8 10367513 -0.125158 -0.094086 -0.182559 Olfr777/Olfr800 olfactory receptor 777
8 10519028 -0.180272 0.04633 -0.182325 PRDM16 PR domain containing 16
8 10376938 -0.268292 -0.261037 -0.182252 CDRT4 CMT1A duplicated region transcript 4
8 10488382 -0.347352 -0.039446 -0.18143 CD93 CD93 molecule
8 10407704 -0.222314 0.073607 -0.181115
8 10390022 -0.17594 0.0336058 -0.179354 RSAD1 radical S-adenosyl methionine domain containing 1
8 10412488 -0.144104 -0.057546 -0.179021
8 10340120 -0.421564 -0.048129 -0.178712
8 10338897 -0.294011 -0.207964 -0.178505
8 10559516 -0.148333 -0.069309 -0.178239 RDH13 retinol dehydrogenase 13 (all-trans/9-cis)
8 10493498 -0.188188 -0.131864 -0.178039 DCST1 DC-STAMP domain containing 1
8 10590031 -0.217657 0.0174478 -0.177453 ITGA9 integrin, alpha 9
8 10478109 -0.305947 -0.201601 -0.177187 ADIG adipogenin
8 10343489 -0.376028 -0.057386 -0.177129
8 10343262 -0.357342 -0.171605 -0.177036

23
8 10342765 -0.21631 0.0053532 -0.176265
8 10413615 -0.223517 -0.034536 -0.176001 ITIH4 inter-alpha (globulin) inhibitor H4 (plasma Kallikrein-sensitive
glycoprotein)
8 10530393 -0.154607 -0.012829 -0.175865 GABRG1 gamma-aminobutyric acid (GABA) A receptor, gamma 1
8 10343690 -0.27588 0.0026398 -0.175794
8 10339243 -0.263969 -0.256079 -0.175694
8 10344467 -0.240654 -0.185711 -0.175603
8 10399581 -0.200002 -0.10393 -0.175084 3110053B16Rik RIKEN cDNA 3110053B16 gene
8 10497012 -0.268173 -0.083684 -0.174075 C1orf173 chromosome 1 open reading frame 173
8 10338203 -0.430777 0.026665 -0.173771
8 10410317 -0.233575 -0.008979 -0.173725 Zfp459 zinc finger protein 459
8 10607366 -0.129326 -0.049113 -0.173286 SHROOM2 shroom family member 2
8 10522661 -0.314947 -0.209268 -0.172975 KIAA1211 KIAA1211
8 10339160 -0.201851 0.0312372 -0.172916
8 10582899 -0.383528 0.001306 -0.172889
8 10339486 -0.152183 -0.077126 -0.172828
8 10338811 -0.257351 0.0711324 -0.172715
8 10342906 -0.218907 -0.156758 -0.172609
8 10537406 -0.211062 -0.191172 -0.172445 CLEC2L C-type lectin domain family 2, member L
8 10340030 -0.292248 0.052939 -0.171789
8 10338827 -0.298392 -0.245593 -0.17147
8 10411274 -0.137321 -0.074024 -0.17138 SV2C synaptic vesicle glycoprotein 2C
8 10513002 -0.172843 -0.118107 -0.17069 Gm12471 predicted gene 12471
8 10463138 -0.162647 -0.053301 -0.170526 DPPA2 developmental pluripotency associated 2
8 10408900 -0.174968 -0.022994 -0.170362
8 10341897 -0.300439 -0.055409 -0.169861
8 10588509 -0.141228 -0.065886 -0.169558 PCBP4 poly(rC) binding protein 4
8 10508800 -0.185139 -0.081353 -0.168798 Gm3579 predicted gene 3579
8 10573865 -0.185139 -0.081353 -0.168798 Gm3579 predicted gene 3579
8 10340225 -0.365348 0.1520552 -0.168649
8 10577782 -0.28276 -0.031168 -0.167588 HTRA4 HtrA serine peptidase 4
8 10341685 -0.242699 -0.173371 -0.166765
8 10383358 -0.185822 -0.079687 -0.166718
8 10398130 -0.24767 -0.02524 -0.166558 AK7 adenylate kinase 7
8 10427075 -0.187904 -0.010871 -0.166062 KRT18 keratin 18
8 10524345 -0.210537 -0.116297 -0.165863 TPST2 tyrosylprotein sulfotransferase 2
8 10383785 -0.172846 -0.027582 -0.165801 C5orf52 chromosome 5 open reading frame 52
8 10571198 -0.269069 -0.069969 -0.165631 Gm1698 predicted gene 1698
8 10492341 -0.285352 -0.09126 -0.165624 ARHGEF26 Rho guanine nucleotide exchange factor (GEF) 26
8 10502519 -0.146047 -0.076811 -0.164697
8 10342483 -0.227912 -0.176177 -0.164492
8 10528036 -0.255168 -0.161103 -0.164432
8 10550931 -0.203071 -0.11142 -0.163846 IRGQ immunity-related GTPase family, Q
8 10345911 -0.273466 -0.032046 -0.163707 Gm8211 predicted gene 8211
8 10481577 -0.242149 -0.123986 -0.163406 UCK1 uridine-cytidine kinase 1
8 10543065 -0.245721 -0.235828 -0.163051
8 10339797 -0.2244 -0.203748 -0.162904
8 10344554 -0.311818 0.1049666 -0.162463
8 10343554 -0.433781 0.0105858 -0.162382
8 10338198 -0.4248 -0.267158 -0.162032
8 10341103 -0.154253 -0.057558 -0.161785
8 10576189 -0.203769 -0.169596 -0.161097
8 10342262 -0.376449 0.0304478 -0.160764
8 10344140 -0.407843 0.0600582 -0.16052
8 10424075 -0.168292 -0.014246 -0.160354
8 10338440 -0.146351 -0.055625 -0.159812
8 10341170 -0.236377 0.021074 -0.159123
8 10474073 -0.345967 -0.091855 -0.158401
8 10340671 -0.191805 -0.021583 -0.158397
8 10493889 -0.300356 -0.031934 -0.156074 LCE1B late cornified envelope 1B
8 10341740 -0.388692 -0.126514 -0.155849
8 10480849 -0.163965 -0.049947 -0.155386 Fcna ficolin A
8 10447880 -0.236248 -0.190782 -0.155268 MRPL18 mitochondrial ribosomal protein L18
8 10600703 -0.398885 -0.154836 -0.155195 1700072E05Rik RIKEN cDNA 1700072E05 gene
8 10343305 -0.335202 -0.092936 -0.154703
8 10603425 -0.147247 -0.05162 -0.154038 GLOD5 glyoxalase domain containing 5
8 10341457 -0.302657 -0.209247 -0.153842
8 10441899 -0.267229 -0.222618 -0.153839 4930488N24Rik
(includes others)
RIKEN cDNA 4930488N24 gene
8 10340386 -0.367564 -0.098845 -0.153178
8 10522944 -0.248409 -0.190602 -0.153164
8 10506254 -0.306372 -0.052062 -0.153034 RAVER2 ribonucleoprotein, PTB-binding 2
8 10340737 -0.278937 -0.080999 -0.152706
8 10604761 -0.186136 -0.095378 -0.152052 mir-504 microRNA 504
8 10339049 -0.419972 -0.189499 -0.152003
8 10433795 -0.193204 -0.098259 -0.15182
8 10349828 -0.182657 -0.000242 -0.151488 LRRN2 leucine rich repeat neuronal 2
8 10413338 -0.171944 -0.024522 -0.150788
8 10468419 -0.253399 -0.167824 -0.150452 WDR96 WD repeat domain 96
8 10378649 -0.174968 -0.046198 -0.150384 SLC43A2 solute carrier family 43, member 2
8 10567456 -0.22443 -0.166277 -0.150268 DNAH3 dynein, axonemal, heavy chain 3
8 10339027 -0.191095 -0.046054 -0.148907
8 10339079 -0.372364 0.0248342 -0.148849
8 10477715 -0.258223 -0.001525 -0.148393 mir-499 microRNA 499
8 10338106 -0.32429 0.0217172 -0.148381
8 10526541 -0.185353 -0.04728 -0.148146
8 10343784 -0.392612 -0.030413 -0.148078

24
8 10339969 -0.304955 0.0306362 -0.147554
8 10342313 -0.16177 -0.033094 -0.147033
8 10477167 -0.27789 -0.018603 -0.146826 Mcts2 malignant T cell amplified sequence 2
8 10342300 -0.341892 0.1283944 -0.146637
8 10342790 -0.235858 0.0269998 -0.146375
8 10465185 -0.252837 -0.07708 -0.14592 EHBP1L1 EH domain binding protein 1-like 1
8 10380303 -0.194526 -0.085784 -0.14539 CA10 carbonic anhydrase X
8 10466351 -0.233963 0.0433786 -0.144967 Olfr1459 olfactory receptor 1459
8 10364888 -0.27757 0.0034734 -0.144852 DOT1L DOT1-like, histone H3 methyltransferase (S. cerevisiae)
8 10599461 -0.171033 -0.056966 -0.144181 Calm1 (includes others) calmodulin 1
8 10506736 -0.261029 0.0544352 -0.144111 MAGOH mago-nashi homolog, proliferation-associated (Drosophila)
8 10385542 -0.29288 -0.124045 -0.143665 BTNL9 butyrophilin-like 9
8 10343797 -0.23986 0.0586098 -0.143563
8 10343012 -0.216731 -0.087678 -0.14337
8 10365926 -0.239767 -0.076363 -0.142717 4732465J04Rik RIKEN cDNA 4732465J04 gene
8 10344184 -0.384985 -0.003214 -0.141137
8 10585703 -0.254061 -0.111891 -0.141077 RPP25 ribonuclease P/MRP 25kDa subunit
8 10341498 -0.323174 -0.187013 -0.140955
8 10404012 -0.307003 0.0397752 -0.139844 Vmn1r188 (includes
others)
vomeronasal 1 receptor 194
8 10586433 -0.212314 -0.092251 -0.138931 RBPMS2 RNA binding protein with multiple splicing 2
8 10342309 -0.224615 -0.134538 -0.138389
8 10371006 -0.230448 -0.054346 -0.138056 TIMM13 translocase of inner mitochondrial membrane 13 homolog
(yeast)
8 10513504 -0.276707 -0.179967 -0.137775 Mup1 (includes others) major urinary protein 1
8 10356876 -0.237916 -0.024498 -0.137402
8 10344045 -0.248426 0.0239014 -0.136621
8 10341871 -0.295595 -0.240091 -0.136617
8 10404898 -0.258799 -0.194043 -0.136225 FLJ23152 hypothetical protein LOC401236
8 10559916 -0.215014 -0.023751 -0.136157
8 10357239 -0.251248 -0.177358 -0.135299 TMEM37 transmembrane protein 37
8 10522784 -0.266081 0.0576836 -0.135224
8 10346150 -0.25995 -0.122171 -0.135017 TMEFF2 transmembrane protein with EGF-like and two follistatin-like
domains 2
8 10407072 -0.266328 0.026732 -0.134443 ELOVL7 ELOVL family member 7, elongation of long chain fatty acids
(yeast)
8 10343547 -0.418964 0.0683108 -0.134127
8 10340052 -0.342951 -0.238559 -0.133378
8 10353794 -0.19715 -0.016017 -0.13266 FAM168B family with sequence similarity 168, member B
8 10532630 -0.262021 0.0596818 -0.132499 ADRBK2 adrenergic, beta, receptor kinase 2
8 10339010 -0.355882 -0.012739 -0.132498
8 10340034 -0.213512 0.007784 -0.131717
8 10394534 -0.211602 -0.058781 -0.131656 OSR1 odd-skipped related 1 (Drosophila)
8 10340115 -0.250358 0.0365924 -0.131313
8 10601648 -0.219175 -0.063152 -0.130661 TNMD tenomodulin
8 10497319 -0.394797 0.0009582 -0.130639
8 10522494 -0.229195 -0.081864 -0.130513
8 10344229 -0.371902 0.0248098 -0.13045
8 10413598 -0.265887 -0.001654 -0.129054 TMEM110 transmembrane protein 110
8 10383819 -0.217943 -0.06955 -0.126522 SEC14L2 SEC14-like 2 (S. cerevisiae)
8 10405779 -0.352316 0.0777996 -0.126475 mir-23 microRNA 23a
8 10515277 -0.198482 -0.062722 -0.126198 C1orf190 chromosome 1 open reading frame 190
8 10342319 -0.399642 -0.007539 -0.123178
8 10344815 -0.258324 -0.085949 -0.122875 CSPP1 centrosome and spindle pole associated protein 1
8 10593776 -0.365291 -0.162203 -0.122784 NRG4 neuregulin 4
8 10522388 -0.272278 -0.069377 -0.121957 SLC10A4 solute carrier family 10 (sodium/bile acid cotransporter family),
member 4
8 10503008 -0.312501 -0.0419 -0.121788
8 10581388 -0.315231 0.0853754 -0.120772 LCAT lecithin-cholesterol acyltransferase
8 10569335 -0.233889 0.0081914 -0.118936 H19 H19, imprinted maternally expressed transcript (non-protein
coding)
8 10341512 -0.334161 -0.246212 -0.118648
8 10435543 -0.214131 -0.066368 -0.117498 GOLGB1 golgin B1
8 10562181 -0.218691 -0.062964 -0.116952 LSR lipolysis stimulated lipoprotein receptor
8 10513467 -0.316349 -0.156031 -0.113816 Mup1 (includes others) major urinary protein 1
8 10512332 -0.289104 -0.049 -0.113407 4930466F19Rik RIKEN cDNA 4930466F19 gene
8 10512354 -0.289104 -0.049 -0.113407 4930466F19Rik RIKEN cDNA 4930466F19 gene
8 10507143 -0.293161 -0.159971 -0.111485 CYP4A22 cytochrome P450, family 4, subfamily A, polypeptide 22
8 10475314 -0.439013 0.052199 -0.110167 MAP1A microtubule-associated protein 1A
8 10499160 -0.380511 -0.213707 -0.104239 CD1D CD1d molecule
8 10545014 -0.356304 -0.041719 -0.104052 VOPP1 vesicular, overexpressed in cancer, prosurvival protein 1
8 10465701 -0.29889 -0.103965 -0.103983 LGALS12 lectin, galactoside-binding, soluble, 12
8 10340564 -0.386181 -0.063664 -0.103704
8 10479185 -0.324799 -0.06893 -0.101131
8 10490248 -0.324799 -0.06893 -0.101131
8 10343334 -0.309086 -0.119324 -0.097288
8 10339150 -0.373083 -0.112068 -0.093319
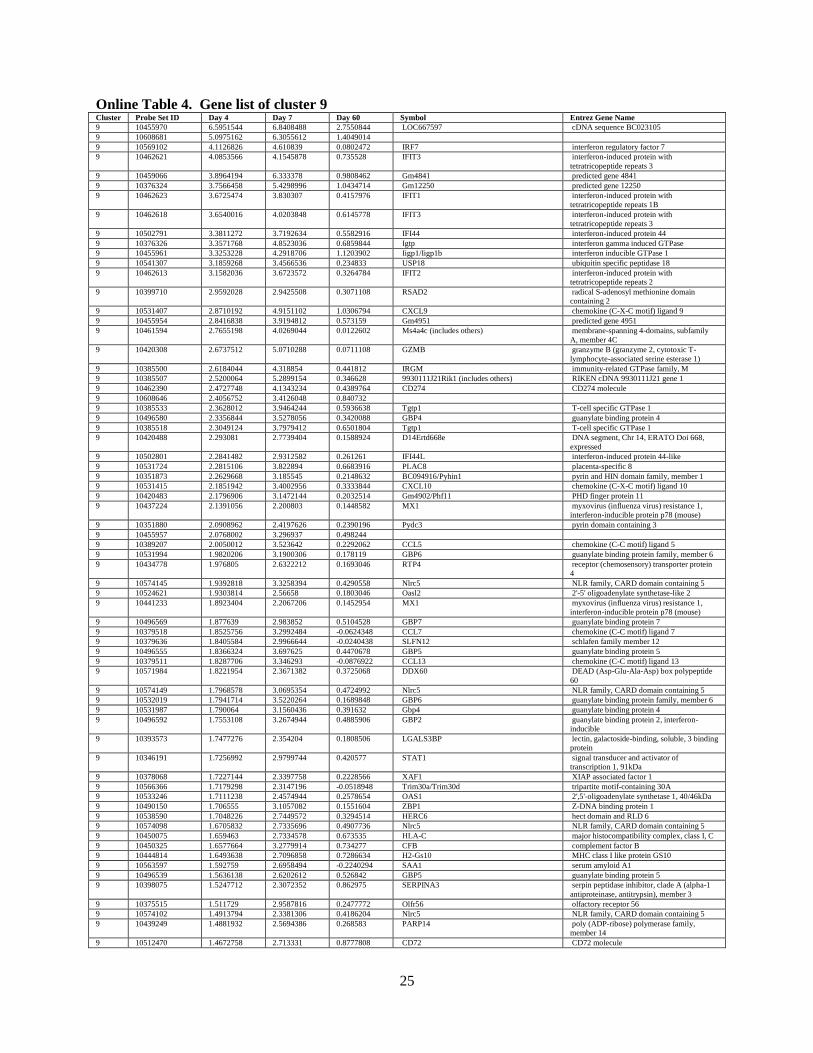
25
Online Table 4. Gene list of cluster 9 Cluster Probe Set ID Day 4 Day 7 Day 60 Symbol Entrez Gene Name
9 10455970 6.5951544 6.8408488 2.7550844 LOC667597 cDNA sequence BC023105
9 10608681 5.0975162 6.3055612 1.4049014
9 10569102 4.1126826 4.610839 0.0802472 IRF7 interferon regulatory factor 7
9 10462621 4.0853566 4.1545878 0.735528 IFIT3 interferon-induced protein with
tetratricopeptide repeats 3
9 10459066 3.8964194 6.333378 0.9808462 Gm4841 predicted gene 4841
9 10376324 3.7566458 5.4298996 1.0434714 Gm12250 predicted gene 12250
9 10462623 3.6725474 3.830307 0.4157976 IFIT1 interferon-induced protein with
tetratricopeptide repeats 1B
9 10462618 3.6540016 4.0203848 0.6145778 IFIT3 interferon-induced protein with
tetratricopeptide repeats 3
9 10502791 3.3811272 3.7192634 0.5582916 IFI44 interferon-induced protein 44
9 10376326 3.3571768 4.8523036 0.6859844 Igtp interferon gamma induced GTPase
9 10455961 3.3253228 4.2918706 1.1203902 Iigp1/Iigp1b interferon inducible GTPase 1
9 10541307 3.1859268 3.4566536 0.234833 USP18 ubiquitin specific peptidase 18
9 10462613 3.1582036 3.6723572 0.3264784 IFIT2 interferon-induced protein with
tetratricopeptide repeats 2
9 10399710 2.9592028 2.9425508 0.3071108 RSAD2 radical S-adenosyl methionine domain
containing 2
9 10531407 2.8710192 4.9151102 1.0306794 CXCL9 chemokine (C-X-C motif) ligand 9
9 10455954 2.8416838 3.9194812 0.573159 Gm4951 predicted gene 4951
9 10461594 2.7655198 4.0269044 0.0122602 Ms4a4c (includes others) membrane-spanning 4-domains, subfamily
A, member 4C
9 10420308 2.6737512 5.0710288 0.0711108 GZMB granzyme B (granzyme 2, cytotoxic T-
lymphocyte-associated serine esterase 1)
9 10385500 2.6184044 4.318854 0.441812 IRGM immunity-related GTPase family, M
9 10385507 2.5200064 5.2899154 0.346628 9930111J21Rik1 (includes others) RIKEN cDNA 9930111J21 gene 1
9 10462390 2.4727748 4.1343234 0.4389764 CD274 CD274 molecule
9 10608646 2.4056752 3.4126048 0.840732
9 10385533 2.3628012 3.9464244 0.5936638 Tgtp1 T-cell specific GTPase 1
9 10496580 2.3356844 3.5278056 0.3420088 GBP4 guanylate binding protein 4
9 10385518 2.3049124 3.7979412 0.6501804 Tgtp1 T-cell specific GTPase 1
9 10420488 2.293081 2.7739404 0.1588924 D14Ertd668e DNA segment, Chr 14, ERATO Doi 668,
expressed
9 10502801 2.2841482 2.9312582 0.261261 IFI44L interferon-induced protein 44-like
9 10531724 2.2815106 3.822894 0.6683916 PLAC8 placenta-specific 8
9 10351873 2.2629668 3.185545 0.2148632 BC094916/Pyhin1 pyrin and HIN domain family, member 1
9 10531415 2.1851942 3.4002956 0.3333844 CXCL10 chemokine (C-X-C motif) ligand 10
9 10420483 2.1796906 3.1472144 0.2032514 Gm4902/Phf11 PHD finger protein 11
9 10437224 2.1391056 2.200803 0.1448582 MX1 myxovirus (influenza virus) resistance 1,
interferon-inducible protein p78 (mouse)
9 10351880 2.0908962 2.4197626 0.2390196 Pydc3 pyrin domain containing 3
9 10455957 2.0768002 3.296937 0.498244
9 10389207 2.0050012 3.523642 0.2292062 CCL5 chemokine (C-C motif) ligand 5
9 10531994 1.9820206 3.1900306 0.178119 GBP6 guanylate binding protein family, member 6
9 10434778 1.976805 2.6322212 0.1693046 RTP4 receptor (chemosensory) transporter protein
4
9 10574145 1.9392818 3.3258394 0.4290558 Nlrc5 NLR family, CARD domain containing 5
9 10524621 1.9303814 2.56658 0.1803046 Oasl2 2'-5' oligoadenylate synthetase-like 2
9 10441233 1.8923404 2.2067206 0.1452954 MX1 myxovirus (influenza virus) resistance 1,
interferon-inducible protein p78 (mouse)
9 10496569 1.877639 2.983852 0.5104528 GBP7 guanylate binding protein 7
9 10379518 1.8525756 3.2992484 -0.0624348 CCL7 chemokine (C-C motif) ligand 7
9 10379636 1.8405584 2.9966644 -0.0240438 SLFN12 schlafen family member 12
9 10496555 1.8366324 3.697625 0.4470678 GBP5 guanylate binding protein 5
9 10379511 1.8287706 3.346293 -0.0876922 CCL13 chemokine (C-C motif) ligand 13
9 10571984 1.8221954 2.3671382 0.3725068 DDX60 DEAD (Asp-Glu-Ala-Asp) box polypeptide
60
9 10574149 1.7968578 3.0695354 0.4724992 Nlrc5 NLR family, CARD domain containing 5
9 10532019 1.7941714 3.5220264 0.1689848 GBP6 guanylate binding protein family, member 6
9 10531987 1.790064 3.1560436 0.391632 Gbp4 guanylate binding protein 4
9 10496592 1.7553108 3.2674944 0.4885906 GBP2 guanylate binding protein 2, interferon-
inducible
9 10393573 1.7477276 2.354204 0.1808506 LGALS3BP lectin, galactoside-binding, soluble, 3 binding
protein
9 10346191 1.7256992 2.9799744 0.420577 STAT1 signal transducer and activator of
transcription 1, 91kDa
9 10378068 1.7227144 2.3397758 0.2228566 XAF1 XIAP associated factor 1
9 10566366 1.7179298 2.3147196 -0.0518948 Trim30a/Trim30d tripartite motif-containing 30A
9 10533246 1.7111238 2.4574944 0.2578654 OAS1 2',5'-oligoadenylate synthetase 1, 40/46kDa
9 10490150 1.706555 3.1057082 0.1551604 ZBP1 Z-DNA binding protein 1
9 10538590 1.7048226 2.7449572 0.3294514 HERC6 hect domain and RLD 6
9 10574098 1.6705832 2.7335696 0.4907736 Nlrc5 NLR family, CARD domain containing 5
9 10450075 1.659463 2.7334578 0.673535 HLA-C major histocompatibility complex, class I, C
9 10450325 1.6577664 3.2779914 0.734277 CFB complement factor B
9 10444814 1.6493638 2.7096858 0.7286634 H2-Gs10 MHC class I like protein GS10
9 10563597 1.592759 2.6958494 -0.2240294 SAA1 serum amyloid A1
9 10496539 1.5636138 2.6202612 0.526842 GBP5 guanylate binding protein 5
9 10398075 1.5247712 2.3072352 0.862975 SERPINA3 serpin peptidase inhibitor, clade A (alpha-1
antiproteinase, antitrypsin), member 3
9 10375515 1.511729 2.9587816 0.2477772 Olfr56 olfactory receptor 56
9 10574102 1.4913794 2.3381306 0.4186204 Nlrc5 NLR family, CARD domain containing 5
9 10439249 1.4881932 2.5694386 0.268583 PARP14 poly (ADP-ribose) polymerase family,
member 14
9 10512470 1.4672758 2.713331 0.8777808 CD72 CD72 molecule

26
9 10531980 1.3998878 2.8079486 0.4323052 GBP6 guanylate binding protein family, member 6
9 10444244 1.3898032 2.82886 0.3361584 TAP1 transporter 1, ATP-binding cassette, sub-
family B (MDR/TAP)
9 10531420 1.373296 2.7521388 0.1020954 CXCL11 chemokine (C-X-C motif) ligand 11
9 10574135 1.3660986 2.7838982 0.3928514 Nlrc5 NLR family, CARD domain containing 5
9 10379633 1.3600938 2.6242244 -0.0063712 Slfn1 schlafen 1
9 10574104 1.3326482 2.4592106 0.43494 Nlrc5 NLR family, CARD domain containing 5
9 10552406 1.3129002 3.9631866 0.2317442 NKG7 natural killer cell group 7 sequence
9 10412211 1.3109074 2.7028486 0.043377 GZMA granzyme A (granzyme 1, cytotoxic T-
lymphocyte-associated serine esterase 3)
9 10574139 1.266601 2.5442016 0.4044042 Nlrc5 NLR family, CARD domain containing 5
9 10389231 1.241656 2.6696048 0.5231642 CCL3L1/CCL3L3 chemokine (C-C motif) ligand 3-like 1
9 10444258 1.2360028 3.1446588 0.310859 PSMB8 proteasome (prosome, macropain) subunit,
beta type, 8 (large multifunctional peptidase
7)
9 10351509 1.1382366 3.2340278 0.5539904 FCGR3A Fc fragment of IgG, low affinity IIIa,
receptor (CD16a)
9 10398039 1.1319066 3.09938 0.2524934 Serpina3g (includes others) serine (or cysteine) peptidase inhibitor, clade
A, member 3G
9 10590635 1.1121718 3.1067198 0.4734302 CCR5 chemokine (C-C motif) receptor 5
9 10598013 1.1121718 3.1067198 0.4734302 CCR5 chemokine (C-C motif) receptor 5
9 10598976 1.1008642 3.34966 0.202005 TIMP1 TIMP metallopeptidase inhibitor 1
9 10360173 1.0780114 2.6692734 0.5169692 SLAMF7 SLAM family member 7
9 10517165 1.0225362 3.0034194 1.0157522 CD52 CD52 molecule
9 10406928 0.9670856 2.8278394 0.9209294 CD180 CD180 molecule
9 10379535 0.8391164 3.4532374 0.8826676 CCL8 chemokine (C-C motif) ligand 8
9 10461605 0.8125756 2.924889 0.2364798 Ms4a4c (includes others) membrane-spanning 4-domains, subfamily
A, member 4C

27
Online Table 5. Gene list of cluster 15 Cluster Probe Set ID Day 4 Day 7 Day 60 Symbol Entrez Gene Name
15 10465840 -2.2956392 0.5069734 -0.1592758 SCGB1A1 secretoglobin, family 1A, member 1 (uteroglobin)
15 10477475 -1.9624504 0.6485402 0.0085248 PLUNC palate, lung and nasal epithelium associated
15 10559698 -1.5803518 -0.5150376 0.2130634
15 10384044 -1.5290928 -1.0592308 -0.2904826 MYL7 myosin, light chain 7, regulatory
15 10551293 -1.5033586 0.132909 -0.1104016 CYP2F1 cytochrome P450, family 2, subfamily F,
polypeptide 1
15 10495306 -1.4696242 -0.8238158 -0.2067764 MYBPHL myosin binding protein H-like
15 10438813 -1.461875 -0.3215578 -0.2862966 Mir690 microRNA 690
15 10343452 -1.3793982 0.4214158 0.477727
15 10438801 -1.272881 -0.7286604 -0.2572798 FGF12 fibroblast growth factor 12
15 10545569 -1.2333692 0.0831254 -0.055882 REG3A regenerating islet-derived 3 alpha
15 10341006 -1.2295416 0.5526588 0.7657264
15 10551226 -1.092523 0.1502732 0.080991 CYP2A6 (includes others) cytochrome P450, family 2, subfamily A,
polypeptide 6
15 10340401 -1.056792 -0.2263494 0.1509078
15 10581605 -1.043173 0.0246328 0.0310348 HP haptoglobin
15 10490913 -1.0196648 -0.4262078 -0.6297108 CA3 carbonic anhydrase III, muscle specific
15 10558673 -1.0071206 -0.5332772 -0.0576994 CYP2E1 cytochrome P450, family 2, subfamily E,
polypeptide 1
15 10463551 -1.0064976 -0.8150412 -0.4083922 ELOVL3 elongation of very long chain fatty acids
(FEN1/Elo2, SUR4/Elo3, yeast)-like 3
15 10467979 -1.0015662 -0.7415896 -0.7367598 SCD stearoyl-CoA desaturase (delta-9-desaturase)
15 10585390 -0.998934 -0.2365078 -0.233866 SLN sarcolipin
15 10344101 -0.9953794 0.0645112 -0.2127962
15 10340043 -0.9779604 -0.3457098 0.0430692
15 10584047 -0.9581856 -0.5313074 -0.3420212 ADAMTS8 ADAM metallopeptidase with thrombospondin type
1 motif, 8
15 10339357 -0.941271 -0.3391036 -0.1856724
15 10339283 -0.9412686 0.040212 -0.0093682
15 10364542 -0.9295686 -0.0475666 -0.2764278 CFD complement factor D (adipsin)
15 10342781 -0.891894 0.0451544 -0.0015708
15 10393970 -0.88474 -0.3832922 -0.165098 FASN fatty acid synthase
15 10340912 -0.8830934 0.1461882 -0.14105
15 10567010 -0.8826092 -0.5083008 0.2189958 DKK3 dickkopf homolog 3 (Xenopus laevis)
15 10455015 -0.8822134 0.1051976 -0.0270132 Vaultrc5 vault RNA component 5
15 10555460 -0.8815882 -0.4265174 -0.0482752 STARD10 StAR-related lipid transfer (START) domain
containing 10
15 10423971 -0.8711336 -0.0461542 0.2713584 PKHD1L1 polycystic kidney and hepatic disease 1 (autosomal
recessive)-like 1
15 10544932 -0.865147 -0.5935824 0.7039278 INMT indolethylamine N-methyltransferase
15 10581011 -0.8552584 -0.6304278 -0.2204044
15 10342619 -0.8527634 0.0910836 -0.2701002
15 10341442 -0.8461204 -0.161685 0.049025
15 10359593 -0.846087 -0.6952236 -0.0108932 FMO3 flavin containing monooxygenase 3
15 10342202 -0.8341682 -0.1359126 0.0720194
15 10341620 -0.8332534 -0.326992 -0.2424374
15 10338149 -0.8285372 0.0771772 -0.2625344
15 10338338 -0.8070274 -0.0816116 -0.0397952
15 10339294 -0.805873 -0.2382392 0.109409
15 10339847 -0.8023556 -0.2012496 0.488191
15 10546929 -0.8010954 -0.3809128 -0.3583322 CIDEC cell death-inducing DFFA-like effector c
15 10479852 -0.8002542 0.2082754 0.1551466 CAMK1D calcium/calmodulin-dependent protein kinase ID
15 10341005 -0.7999998 -0.2713018 -0.0929068
15 10342355 -0.7973892 -0.2810516 -0.377012
15 10559694 -0.7907846 -0.243225 0.1487572 SBK2 SH3-binding domain kinase family, member 2
15 10564203 -0.7901094 -0.219156 -0.2525038
15 10338296 -0.7811626 0.0092496 -0.1007944
15 10476321 -0.775281 -0.2188836 0.2742436 PRND prion protein 2 (dublet)
15 10344243 -0.7749226 0.099985 -0.1589342
15 10375261 -0.7743786 -0.2073936 0.4387006 GABRB2 gamma-aminobutyric acid (GABA) A receptor, beta
2
15 10498852 -0.7713674 -0.240725 -0.0728406 RXFP1 relaxin/insulin-like family peptide receptor 1
15 10542983 -0.7679158 -0.3579208 -0.1578324 PON1 paraoxonase 1
15 10399407 -0.766469 -0.5161166 -0.0276582 VSNL1 visinin-like 1
15 10341860 -0.766002 -0.0136452 0.099293
15 10342070 -0.765101 0.077392 -0.3484024
15 10339977 -0.7620848 0.2181792 0.4023774
15 10512499 -0.759286 -0.354252 -0.0057074 TPM2 tropomyosin 2 (beta)
15 10339214 -0.7504284 -0.040816 -0.162133
15 10341691 -0.7487936 -0.0073434 -0.4036284
15 10483131 -0.7446606 -0.233467 0.1928198 KCNH7 potassium voltage-gated channel, subfamily H (eag-
related), member 7
15 10357371 -0.7415082 -0.2376742 0.0072202 TMEM163 transmembrane protein 163
15 10559796 -0.7391714 -0.2200308 0.0916782 PEG3 paternally expressed 3
15 10339028 -0.7383398 -0.097584 0.1155432
15 10342469 -0.7342964 -0.1719774 0.2388244
15 10340743 -0.7324662 0.1324836 0.0606104
15 10349947 -0.7294244 -0.586905 0.14617 FMOD fibromodulin
15 10342257 -0.728917 -0.3162386 0.3090518
15 10526441 -0.7285922 -0.2112744 0.0366402 UPK3B uroplakin 3B
15 10343426 -0.725131 -0.171054 0.260365
15 10371740 -0.7243954 0.0534942 0.1366136 ANO4 anoctamin 4
15 10545180 -0.717027 0.117737 0.283135
15 10514939 -0.713054 -0.1509262 0.2566822 PODN podocan
15 10439500 -0.7055502 0.0297604 0.0167674 UPK1B uroplakin 1B

28
15 10344523 -0.7003158 -0.2100398 -0.2264324
15 10339818 -0.6978396 0.0627052 0.1002826
15 10344365 -0.6927648 -0.363878 0.1490812
15 10434747 -0.6911724 -0.4027102 -0.44772 ADIPOQ adiponectin, C1Q and collagen domain containing
15 10338826 -0.6868322 0.2527106 0.0771428
15 10578986 -0.6849572 -0.3329448 0.1572596 PSD3 pleckstrin and Sec7 domain containing 3
15 10462435 -0.6832826 -0.2263314 0.1227912 MLANA melan-A
15 10549877 -0.6816468 -0.2826532 0.0500024
15 10339284 -0.6814454 -0.1330862 0.1275216
15 10375259 -0.6777006 -0.2298238 0.706073 GABRB2 gamma-aminobutyric acid (GABA) A receptor, beta
2
15 10463355 -0.6751864 0.007469 0.1176028 Scd2 stearoyl-Coenzyme A desaturase 2
15 10361186 -0.6731044 -0.2319286 0.1385664 SERTAD4 SERTA domain containing 4
15 10341583 -0.672145 -0.15081 -0.005701
15 10454807 -0.6718818 -0.154624 0.0892842 SNORA74A small nucleolar RNA, H/ACA box 74A
15 10604576 -0.6672268 -0.4279352 -0.0103998 GPC3 glypican 3
15 10342753 -0.661519 -0.0742532 -0.0553512
15 10342029 -0.6597642 0.1923698 -0.046069
15 10343059 -0.6576826 -0.0770446 0.0266754
15 10476353 -0.6566752 -0.1671524 0.3916594
15 10476401 -0.656306 -0.0500812 0.3150764 PLCB1 phospholipase C, beta 1 (phosphoinositide-specific)
15 10341599 -0.6544618 0.0154676 0.299438
15 10341210 -0.6528634 -0.1732748 -0.0039846
15 10531100 -0.6492672 0.0680276 -0.0307268 Sult1d1 sulfotransferase family 1D, member 1
15 10341772 -0.6475636 -0.0756704 0.0323998
15 10341621 -0.6474788 -0.409102 -0.1624958
15 10338312 -0.6452806 -0.1888264 0.507192
15 10339263 -0.6447964 -0.1647512 -0.0662924
15 10343106 -0.6415206 0.15405 0.504682
15 10358531 -0.6365948 -0.2055716 0.4162144 Hmcn1 hemicentin 1
15 10343336 -0.635782 0.166135 0.151082
15 10341318 -0.6351848 -0.1335428 0.238071
15 10341438 -0.6329922 -0.0391888 -0.1007348
15 10343900 -0.6305448 -0.0680562 -0.0452292
15 10342433 -0.6302448 -0.4435564 0.2766938
15 10339979 -0.6263072 -0.0941376 -0.1343062
15 10523376 -0.6255668 0.0264256 0.1390666 FRAS1 Fraser syndrome 1
15 10342203 -0.6251876 -0.1605242 0.0237994
15 10344223 -0.6150312 -0.064594 -0.0061608
15 10340398 -0.6141948 -0.085211 0.0088488
15 10339644 -0.613872 -0.0354892 -0.039445
15 10341350 -0.6121466 -0.2180362 0.0148188
15 10341610 -0.6098502 0.0402924 0.0109952
15 10344569 -0.6075752 0.0306298 0.2473168
15 10340504 -0.6052114 0.115599 0.0431448
15 10338153 -0.6043226 -0.2610942 -0.2737684
15 10339554 -0.6038936 -0.0582088 -0.0771268
15 10338362 -0.6032732 -0.4120548 -0.0040402
15 10564183 -0.6026968 -0.1842118 -0.2242214 PWCR1 small nucleolar RNA, C/D box 116 cluster
15 10343835 -0.602062 -0.0751876 0.1600992
15 10571815 -0.6020494 -0.1630078 0.5179504 GPM6A glycoprotein M6A
15 10564161 -0.6018794 -0.241563 -0.2066542 PWCR1 small nucleolar RNA, C/D box 116 cluster
15 10344161 -0.60183 -0.036852 0.124944
15 10502805 -0.5995024 -0.2544794 0.1432198 PTGFR prostaglandin F receptor (FP)
15 10399908 -0.5991376 -0.4501954 -0.1050954 PRKAR2B protein kinase, cAMP-dependent, regulatory, type II,
beta
15 10427796 -0.5984588 -0.2948742 0.25344 NPR3 natriuretic peptide receptor C/guanylate cyclase C
(atrionatriuretic peptide receptor C)
15 10564177 -0.5981568 -0.2496334 -0.245196 PWCR1 small nucleolar RNA, C/D box 116 cluster
15 10460253 -0.5981044 -0.2727442 0.12765 Aldh3b2 aldehyde dehydrogenase 3 family, member B2
15 10342681 -0.595462 0.206372 -0.017176
15 10599530 -0.5952852 -0.3725764 -0.208679 RAB33A RAB33A, member RAS oncogene family
15 10537062 -0.5947484 -0.1443504 0.1652448 MEST mesoderm specific transcript homolog (mouse)
15 10340697 -0.5936514 -0.480459 0.4308308
15 10352916 -0.5936212 -0.0993702 0.0840374 A330023F24Rik RIKEN cDNA A330023F24 gene
15 10564163 -0.593094 -0.2315066 -0.2668876 PWCR1 small nucleolar RNA, C/D box 116 cluster
15 10564167 -0.593094 -0.2315066 -0.2668876 PWCR1 small nucleolar RNA, C/D box 116 cluster
15 10564171 -0.593094 -0.2315066 -0.2668876 PWCR1 small nucleolar RNA, C/D box 116 cluster
15 10564173 -0.593094 -0.2315066 -0.2668876 PWCR1 small nucleolar RNA, C/D box 116 cluster
15 10564175 -0.593094 -0.2315066 -0.2668876 PWCR1 small nucleolar RNA, C/D box 116 cluster
15 10564179 -0.593094 -0.2315066 -0.2668876 PWCR1 small nucleolar RNA, C/D box 116 cluster
15 10564181 -0.593094 -0.2315066 -0.2668876 PWCR1 small nucleolar RNA, C/D box 116 cluster
15 10564185 -0.593094 -0.2315066 -0.2668876 PWCR1 small nucleolar RNA, C/D box 116 cluster
15 10564187 -0.593094 -0.2315066 -0.2668876 PWCR1 small nucleolar RNA, C/D box 116 cluster
15 10564189 -0.593094 -0.2315066 -0.2668876 PWCR1 small nucleolar RNA, C/D box 116 cluster
15 10564191 -0.593094 -0.2315066 -0.2668876 PWCR1 small nucleolar RNA, C/D box 116 cluster
15 10564193 -0.593094 -0.2315066 -0.2668876 PWCR1 small nucleolar RNA, C/D box 116 cluster
15 10564195 -0.593094 -0.2315066 -0.2668876 PWCR1 small nucleolar RNA, C/D box 116 cluster
15 10564197 -0.593094 -0.2315066 -0.2668876 PWCR1 small nucleolar RNA, C/D box 116 cluster
15 10564199 -0.593094 -0.2315066 -0.2668876 PWCR1 small nucleolar RNA, C/D box 116 cluster
15 10564201 -0.593094 -0.2315066 -0.2668876 PWCR1 small nucleolar RNA, C/D box 116 cluster
15 10564205 -0.593094 -0.2315066 -0.2668876 PWCR1 small nucleolar RNA, C/D box 116 cluster
15 10564207 -0.593094 -0.2315066 -0.2668876 PWCR1 small nucleolar RNA, C/D box 116 cluster
15 10339683 -0.5927726 -0.0019282 0.417323
15 10340830 -0.5918724 0.1879816 -0.1568012
15 10342181 -0.589525 0.182476 -0.178547
15 10338929 -0.589183 0.0181158 0.1578098

29
15 10564159 -0.5878142 -0.193827 -0.2370974 PWCR1 small nucleolar RNA, C/D box 116 cluster
15 10341619 -0.5862432 -0.4147102 0.064426
15 10343114 -0.5846328 -0.243109 -0.1247486
15 10342316 -0.583578 -0.2806516 0.0934592
15 10387797 -0.5802202 0.1830602 -0.1532592 BCL6B B-cell CLL/lymphoma 6, member B
15 10376778 -0.5797336 -0.2714492 0.0990338 MFAP4 microfibrillar-associated protein 4
15 10338854 -0.5783688 -0.0129544 0.1750374
15 10343102 -0.5776454 -0.0534068 0.0021764
15 10339897 -0.5752488 0.1842976 -0.1179972
15 10341190 -0.5709786 0.0624272 0.108368
15 10356154 -0.5709158 -0.0836988 0.0999184 SPHKAP SPHK1 interactor, AKAP domain containing
15 10341781 -0.57091 -0.2926012 0.1445288
15 10338538 -0.5689276 -0.1551536 -0.2185734
15 10343772 -0.5687894 0.012318 0.3778168
15 10525076 -0.5685774 -0.2203972 0.4024862 SDS serine dehydratase
15 10343484 -0.5674898 -0.0904158 -0.0072704
15 10445078 -0.5632046 -0.2880596 -0.2215066 GABBR1 gamma-aminobutyric acid (GABA) B receptor, 1
15 10343055 -0.5578384 -0.3197886 0.223676
15 10340900 -0.5536864 -0.068072 0.0694474
15 10502770 -0.5529858 -0.0842992 0.2460052 LPHN2 latrophilin 2
15 10338389 -0.5524678 -0.2582182 0.2454212
15 10593123 -0.5520694 -0.4458724 -0.0102698 TAGLN transgelin
15 10578989 -0.5514234 -0.1628992 0.0860516 PSD3 pleckstrin and Sec7 domain containing 3
15 10340392 -0.550297 -0.3547862 0.0755544
15 10572070 -0.5492288 -0.3876624 0.40219 NPY1R neuropeptide Y receptor Y1
15 10374929 -0.5488596 -0.287085 0.2545858 LOC100289085 protein fem-1 homolog A-like
15 10524308 -0.5487498 -0.295248 0.0570668 Mir701 microRNA 701
15 10342934 -0.5486424 -0.2061196 0.2065986
15 10341540 -0.5482438 0.1488496 0.4171384
15 10428302 -0.54528 -0.2563392 0.1533626 KLF10 Kruppel-like factor 10
15 10344018 -0.5439694 -0.3235654 0.122912
15 10355500 -0.5436762 -0.1624658 -0.01942 IGFBP5 insulin-like growth factor binding protein 5
15 10341157 -0.5417404 -0.227787 -0.1421526
15 10397835 -0.5391888 -0.0739312 0.1564226 SLC24A4 solute carrier family 24 (sodium/potassium/calcium
exchanger), member 4
15 10486403 -0.5368332 0.006502 0.1314696 PLA2G4E phospholipase A2, group IVE
15 10342772 -0.5356348 -0.290951 0.1621438
15 10358577 -0.5341718 -0.0636786 0.3990358 Hmcn1 hemicentin 1
15 10572378 -0.5341268 -0.4250414 0.538208 COMP cartilage oligomeric matrix protein
15 10505438 -0.5338752 -0.3108636 -0.1614116 ORM1/ORM2 orosomucoid 1
15 10342773 -0.5316084 0.0171828 -0.0059806
15 10395103 -0.5313978 0.1330212 0.1052046 PXDN peroxidasin homolog (Drosophila)
15 10343370 -0.5312452 0.0412164 -0.179915
15 10411519 -0.5288676 0.0688928 0.160208 MAP1B microtubule-associated protein 1B
15 10341246 -0.528814 -0.0157192 0.3693832
15 10478525 -0.5275228 -0.074484 -0.1244834 WFDC2 WAP four-disulfide core domain 2
15 10340739 -0.526661 0.0681462 0.0203622
15 10474064 -0.524422 -0.039046 0.0113192 TP53I11 tumor protein p53 inducible protein 11
15 10338437 -0.5228256 0.1444666 0.0568242
15 10586718 -0.5224748 -0.2101674 0.2898426 9530091C08Rik RIKEN cDNA 9530091C08 gene
15 10338450 -0.5221092 -0.3192872 0.189177
15 10601519 -0.5218808 0.0107242 0.2787996 KLHL4 kelch-like 4 (Drosophila)
15 10343949 -0.5216276 0.1507026 -0.1197944
15 10342816 -0.5214536 -0.3104336 -0.202339
15 10358529 -0.5187262 -0.1621222 0.354732 Hmcn1 hemicentin 1
15 10551282 -0.5160582 0.0444344 0.0168864 CYP2A6 (includes others) cytochrome P450, family 2, subfamily A,
polypeptide 6
15 10344216 -0.514146 -0.2708818 0.015782
15 10427125 -0.5135312 -0.2942712 0.0409294 IGFBP6 insulin-like growth factor binding protein 6
15 10343834 -0.512598 -0.1688934 0.2423448
15 10341468 -0.511433 -0.288258 0.1785044
15 10343498 -0.510802 -0.3197762 0.4931538
15 10342547 -0.5107824 -0.0970698 0.161848
15 10344274 -0.5105182 0.0316052 0.21227
15 10369702 -0.5105026 -0.0687848 0.1223294 TET1 tet oncogene 1
15 10339013 -0.5087892 0.1287268 -0.0409896
15 10596148 -0.5073158 -0.4017566 0.1319624 TF transferrin
15 10339943 -0.5064012 0.0808442 0.0287998
15 10472398 -0.5047618 -0.0299858 0.0886018 SCN2A sodium channel, voltage-gated, type II, alpha subunit
15 10374202 -0.5043794 -0.0724094 -0.1038296 ADCY1 adenylate cyclase 1 (brain)
15 10339646 -0.5036946 0.009057 -0.0375272
15 10459905 -0.5018498 0.1307 0.0904772 SETBP1 SET binding protein 1
15 10513420 -0.5012336 -0.1280988 -0.060874 Mup1 (includes others) major urinary protein 1
15 10477069 -0.5012002 -0.1828464 0.0365854 TCF15 transcription factor 15 (basic helix-loop-helix)
15 10358515 -0.5009404 0.152703 0.3434002 Hmcn1 hemicentin 1
15 10358621 -0.5004512 -0.1075242 0.229847 Hmcn1 hemicentin 1
15 10355403 -0.4995658 0.060508 0.4579366 FN1 fibronectin 1
15 10340037 -0.496505 -6.32E-05 0.1552282
15 10358527 -0.4963606 -0.2105526 0.3798042 Hmcn1 hemicentin 1
15 10341272 -0.4955972 -0.2600412 0.0591286
15 10547404 -0.4955278 -0.0343426 0.2015428 ERC1 ELKS/RAB6-interacting/CAST family member 1
15 10495206 -0.495076 -0.054637 0.3853118 SLC16A4 solute carrier family 16, member 4 (monocarboxylic
acid transporter 5)
15 10341830 -0.4935744 0.0813578 0.1701708
15 10340889 -0.49345 -0.2209052 -0.0115394
15 10552857 -0.4916616 -0.320385 -0.1318964 SLC17A7 solute carrier family 17 (sodium-dependent
inorganic phosphate cotransporter), member 7

30
15 10504137 -0.4914844 -0.1705168 0.239486 ENSMUSG00000073868 predicted gene 10590
15 10504201 -0.4914844 -0.1705168 0.239486 ENSMUSG00000073868 predicted gene 10590
15 10512350 -0.4914844 -0.1705168 0.239486 4933409K07Rik RIKEN cDNA 4933409K07 gene
15 10512352 -0.4914844 -0.1705168 0.239486 ENSMUSG00000073868 predicted gene 10590
15 10522024 -0.4906026 0.0099836 0.022899 TBC1D1 TBC1 (tre-2/USP6, BUB2, cdc16) domain family,
member 1
15 10537296 -0.4899162 0.0020456 0.0055712 mir-490 microRNA 490
15 10569618 -0.4898964 -0.2219676 0.1293174 ANO1 anoctamin 1, calcium activated chloride channel
15 10342519 -0.4898032 -0.1330716 0.364536
15 10339493 -0.4895916 -0.0902304 -0.1528628
15 10458764 -0.4892398 -0.0333594 -0.0272702
15 10418506 -0.488914 -0.0430702 0.1473962 STAB1 stabilin 1
15 10340336 -0.4884332 0.0572964 -0.1072362
15 10343470 -0.4881638 -0.3156976 0.2381994
15 10360418 -0.4860076 -0.2445636 0.1174414 RGS7 regulator of G-protein signaling 7
15 10495285 -0.4856428 -0.207142 0.0373982 SORT1 sortilin 1
15 10344573 -0.4846726 -0.0528472 0.3985652
15 10339861 -0.484644 -0.0013196 0.3051692
15 10339231 -0.4844578 0.1155618 0.0432108
15 10559702 -0.4835648 0.110475 0.092486 ZNF579 zinc finger protein 579
15 10339179 -0.48352 0.021374 0.2813186
15 10338736 -0.4821186 0.0492548 0.3745982
15 10342333 -0.4807066 -0.2527356 -0.0572074
15 10391036 -0.480433 -0.0646436 0.0127948 Krt19 keratin 19
15 10340309 -0.479189 -0.1065724 0.1240324
15 10358533 -0.477346 -0.1884918 0.3563526 Hmcn1 hemicentin 1
15 10339087 -0.4755778 -0.4057834 0.2801968
15 10518781 -0.475147 -0.0898828 0.4661848 PER3 period homolog 3 (Drosophila)
15 10339896 -0.474165 -0.2111804 0.0431722
15 10338981 -0.4736194 -0.174735 -0.078084
15 10472757 -0.4733682 -0.1782552 0.1310222 CYBRD1 cytochrome b reductase 1
15 10348299 -0.4724384 -0.1052132 -0.0111792 5830472F04Rik RIKEN cDNA 5830472F04 gene
15 10578207 -0.4717056 0.0121318 0.2870122 LONRF1 LON peptidase N-terminal domain and ring finger 1
15 10343317 -0.4715052 -0.0218298 -0.003351
15 10343606 -0.4714186 0.0238078 0.0478108
15 10340802 -0.46941 -0.1244284 0.2781372
15 10338255 -0.468918 -0.1379084 0.1576414
15 10343998 -0.4688786 -0.164483 0.0509916
15 10341625 -0.4686234 -0.1121662 -0.0317636
15 10339395 -0.4681412 -0.0390346 0.248171
15 10338494 -0.467775 0.0919058 -0.0441702
15 10341688 -0.4672728 0.1101452 0.3750346
15 10340942 -0.4666964 0.109623 0.1451346
15 10338822 -0.4662164 -0.2424192 0.0056498
15 10494548 -0.4661592 0.116879 0.0687426 GJA5 gap junction protein, alpha 5, 40kDa
15 10339988 -0.465986 -0.0423416 0.038215
15 10425799 -0.4634066 -0.1795578 -0.1422542 RNU12 RNA, U12 small nuclear
15 10441813 -0.4625452 -0.0585852 0.003301 Snora20 small nucleolar RNA, H/ACA box 20
15 10502783 -0.4624324 -0.06917 0.1346768 Gm9912 predicted gene 9912
15 10588592 -0.4624258 -0.3715388 0.0141932 CACNA2D2 calcium channel, voltage-dependent, alpha 2/delta
subunit 2
15 10585982 -0.4621548 0.0223794 0.1571454 MYO9A myosin IXA
15 10538408 -0.4619636 -0.4376616 0.2377674 C7orf41 chromosome 7 open reading frame 41
15 10343388 -0.4617446 -0.2157948 0.0719972
15 10395201 -0.4603808 -0.1306144 -0.1119378 SLC26A3 solute carrier family 26, member 3
15 10338226 -0.4594242 -0.1082558 0.1570382
15 10383731 -0.4593718 -0.229204 0.0137558 SMTN smoothelin
15 10513472 -0.4593682 -0.1272044 -0.049519 Mup1 (includes others) major urinary protein 1
15 10340569 -0.459244 -0.088217 0.0491702
15 10339019 -0.4579408 -0.3504302 0.3355804
15 10339544 -0.4574282 0.035807 0.316243
15 10358517 -0.4554662 -0.0100392 0.3110802 Hmcn1 hemicentin 1
15 10599696 -0.4553666 0.0640964 0.1841906 DDX26B DEAD/H (Asp-Glu-Ala-Asp/His) box polypeptide
26B
15 10471721 -0.454629 -0.3796134 0.2281408 PTGS1 prostaglandin-endoperoxide synthase 1
(prostaglandin G/H synthase and cyclooxygenase)
15 10338169 -0.453847 -0.0703328 -0.119985
15 10358549 -0.4529196 -0.0819464 0.450674 Hmcn1 hemicentin 1
15 10586722 -0.4526796 -0.106645 0.2476708 F830001A07Rik RIKEN cDNA F830001A07 gene
15 10358575 -0.4526128 -0.1450598 0.3928966 Hmcn1 hemicentin 1
15 10358656 -0.4517864 0.0203552 0.4445454 Hmcn1 hemicentin 1
15 10396606 -0.4514894 -0.0493434 0.1335 SYNE2 spectrin repeat containing, nuclear envelope 2
15 10344166 -0.4511974 -0.342465 0.097029
15 10343190 -0.4509566 -0.1833448 -0.0824146
15 10396936 -0.450783 -0.3529578 0.020492 SMOC1 SPARC related modular calcium binding 1
15 10343438 -0.4503734 -0.0436154 -0.0694042
15 10525030 -0.4483902 -0.1710602 -0.0287152 TBX5 T-box 5
15 10341287 -0.447455 -0.2913028 0.1028708
15 10467319 -0.4466646 -0.2159646 -0.1304528 RBP4 retinol binding protein 4, plasma
15 10590267 -0.4438492 -0.1258352 0.0301786 SNORA62 small nucleolar RNA, H/ACA box 62
15 10519527 -0.4434186 -0.1263726 0.240507 ABCB1 ATP-binding cassette, sub-family B (MDR/TAP),
member 1
15 10494413 -0.4421264 -0.0946072 0.0411978 Rnu1b2 U1b2 small nuclear RNA
15 10494421 -0.4421264 -0.0946072 0.0411978 Rnu1b2 U1b2 small nuclear RNA
15 10500343 -0.4421264 -0.0946072 0.0411978 Rnu1b2 U1b2 small nuclear RNA
15 10500358 -0.4421264 -0.0946072 0.0411978 Rnu1b2 U1b2 small nuclear RNA
15 10512937 -0.4421264 -0.0946072 0.0411978 Rnu1b2 U1b2 small nuclear RNA

31
15 10340257 -0.4420148 -0.0619408 0.0714312
15 10379344 -0.4400408 -0.195761 -0.0065278 Gm10387 predicted gene 10387
15 10358535 -0.4399056 -0.1955388 0.3365866 Hmcn1 hemicentin 1
15 10340339 -0.4378502 -0.0412488 0.236903
15 10343557 -0.43785 -0.173654 0.1795968
15 10343308 -0.4378084 -0.2769808 -0.056518
15 10508723 -0.4369044 -0.1437388 0.0309766 Snora61 small nucleolar RNA, H/ACA box 61
15 10378401 -0.4366566 -0.264627 0.096374
15 10341861 -0.4348926 -0.2154898 -0.0935654
15 10343177 -0.4342074 0.0167368 -0.0939954
15 10358541 -0.4341392 -0.0834404 0.420207 Hmcn1 hemicentin 1
15 10344459 -0.4335802 -0.137125 0.0404724
15 10340388 -0.4327964 -0.0308124 0.097679
15 10547100 -0.4324998 -0.009184 0.137206 PLXND1 plexin D1
15 10343685 -0.432038 -0.0462002 0.0223228
15 10343225 -0.4308718 -0.0753966 0.413791
15 10338333 -0.4305648 -0.1902276 0.1351592
15 10358547 -0.4267698 -0.0718046 0.4392614 Hmcn1 hemicentin 1
15 10341325 -0.4258618 -0.0737204 0.1687856
15 10358490 -0.4258408 -0.089891 0.4208328 Hmcn1 hemicentin 1
15 10352918 -0.425259 -0.2145568 -0.0730966 A330023F24Rik RIKEN cDNA A330023F24 gene
15 10449551 -0.4229138 -0.3143672 0.0472532 CPNE5 copine V
15 10580663 -0.4225344 -0.2592942 0.0045618 Ces1f (includes EG:234564) carboxylesterase 1F
15 10587778 -0.4206114 -0.0860468 -0.0417602
15 10342667 -0.4204194 -0.0716392 -0.0826946
15 10339240 -0.4193576 -0.1209868 0.011484
15 10591169 -0.4175498 -0.1241396 0.094997 MUC16 mucin 16, cell surface associated
15 10528227 -0.4168436 -0.2753578 0.0391534 GNAI1 guanine nucleotide binding protein (G protein),
alpha inhibiting activity polypeptide 1
15 10591135 -0.4163462 -0.1902936 -0.01159 FAT3 FAT tumor suppressor homolog 3 (Drosophila)
15 10338501 -0.4162972 -0.2035726 0.0611648
15 10394538 -0.4160552 -0.052931 0.0185354 ACACA acetyl-CoA carboxylase alpha
15 10392484 -0.4136938 -0.2394992 0.1425384 ABCA8 ATP-binding cassette, sub-family A (ABC1),
member 8
15 10358559 -0.4133774 -0.0798972 0.3469512 Hmcn1 hemicentin 1
15 10339244 -0.4129868 -0.0631664 -0.0717936
15 10449000 -0.4128266 -0.046486 -0.0525818 MSLN mesothelin
15 10341406 -0.412467 -0.167585 0.2807686
15 10358581 -0.4122294 -0.0816556 0.3880142 Hmcn1 hemicentin 1
15 10513437 -0.4119528 -0.1471168 -0.0803012 Mup1 (includes others) major urinary protein 1
15 10356968 -0.411688 -0.137094 -0.019762 PAM peptidylglycine alpha-amidating monooxygenase
15 10340403 -0.4112786 -0.2033238 -0.0733946
15 10343682 -0.4107152 -0.232107 0.0254828
15 10513455 -0.4100202 -0.1375302 -0.0643184 Mup1 (includes others) major urinary protein 1
15 10339424 -0.4098396 -0.1959366 0.2119132
15 10366864 -0.407544 -0.0953952 -0.053778 F420014N23Rik RIKEN cDNA F420014N23 gene
15 10436941 -0.4066296 -0.1540982 -0.0755712 MRPS6 mitochondrial ribosomal protein S6
15 10380059 -0.4060166 -0.0910194 -0.056454
15 10380061 -0.4060166 -0.0910194 -0.056454
15 10380063 -0.4060166 -0.0910194 -0.056454
15 10380065 -0.4060166 -0.0910194 -0.056454
15 10341254 -0.4049014 -0.0946186 -0.0889144
15 10588037 -0.4045118 -0.1163054 0.2173052 RBP1 retinol binding protein 1, cellular
15 10340497 -0.404464 -0.0746 -0.045976
15 10338177 -0.4036762 -0.178779 0.1440142
15 10585186 -0.4033492 -0.094621 0.000394 1600029D21Rik RIKEN cDNA 1600029D21 gene
15 10339384 -0.4020136 -0.0834362 -0.0243928
15 10570278 -0.4001286 -0.1790364 0.1352
15 10343660 -0.3999912 -0.2778722 0.1620338
15 10591630 -0.3987732 -0.304261 0.2032776 DOCK6 dedicator of cytokinesis 6
15 10349571 -0.3985188 -0.2721284 0.1127192 FCAMR Fc receptor, IgA, IgM, high affinity
15 10504234 -0.3973194 -0.1931308 0.1768128 UNC13B unc-13 homolog B (C. elegans)
15 10339845 -0.3973138 -0.1741706 0.2427338
15 10366293 -0.3963488 -0.2879794 0.0270198 CSRP2 cysteine and glycine-rich protein 2
15 10338909 -0.3899306 -0.2696494 -0.0217598
15 10338117 -0.3871986 -0.137728 -0.0670892
15 10341661 -0.38552 -0.1830642 0.0783734
15 10515771 -0.3840634 -0.3048904 0.1212654 TIE1 tyrosine kinase with immunoglobulin-like and EGF-
like domains 1
15 10339051 -0.3828988 -0.1886708 0.1952834
15 10493114 -0.3823254 -0.1777848 0.0885988 NES nestin
15 10387368 -0.3806668 -0.1574054 -0.0084686 TMEM88 transmembrane protein 88
15 10548038 -0.3799928 -0.2497324 0.1918192 NTF3 neurotrophin 3
15 10342560 -0.376793 -0.2563336 0.07224
15 10519693 -0.3758342 -0.174617 0.1351606 SEMA3D sema domain, immunoglobulin domain (Ig), short
basic domain, secreted, (semaphorin) 3D
15 10566172 -0.3718938 -0.2262286 0.1303532 OR51E2 olfactory receptor, family 51, subfamily E, member
2
15 10361267 -0.3712352 -0.1984992 0.0204888
15 10460116 -0.371235 -0.2309408 -0.095756 SOCS6 suppressor of cytokine signaling 6
15 10512145 -0.3683578 -0.2454408 0.0592752 AQP7 aquaporin 7
15 10375058 -0.368294 -0.239566 0.041034 HBA1/HBA2 hemoglobin, alpha 1
15 10478219 -0.368026 -0.2145802 0.1125184 PLCG1 phospholipase C, gamma 1
15 10375051 -0.363592 -0.218702 0.042956 HBA1/HBA2 hemoglobin, alpha 1
15 10579114 -0.3621598 -0.2284382 0.0250042 YJEFN3 YjeF N-terminal domain containing 3
15 10545742 -0.3570266 -0.2314426 -0.0289736 CD207 CD207 molecule, langerin
15 10338796 -0.3564406 -0.2639478 0.1178706

32
15 10423379 -0.3512282 -0.273178 0.1013072 Tiaf2 TGF-beta1-induced anti-apoptotic factor 2

33
Online Table 6. Gene list of cluster 19 Cluster Probe Set ID Day 4 Day 7 Day 60 Symbol Entrez Gene Name
19 10593015 0.4421494 3.1317374 0.2995788 CD3G CD3g molecule, gamma (CD3-TCR
complex)
19 10531972 0.975506 2.7344248 0.159272 Gbp8 guanylate-binding protein 8
19 10581378 0.9756478 2.6932842 0.2039484 PSMB10 proteasome (prosome, macropain) subunit,
beta type, 10
19 10450161 0.1799426 2.6400372 1.725007 H2-Ea-ps major histocompatibility complex, class II,
DR alpha
19 10523717 0.3610268 2.5940596 1.977796 SPP1 secreted phosphoprotein 1
19 10590631 0.3531702 2.572978 0.3026312 CCR2 chemokine (C-C motif) receptor 2
19 10461721 0.6971236 2.5383322 1.0606978 MPEG1 macrophage expressed 1
19 10513739 0.5525402 2.5272676 0.2815386 TNC tenascin C
19 10456005 0.104702 2.5244304 1.553092 CD74 CD74 molecule, major histocompatibility
complex, class II invariant chain
19 10444291 0.0979178 2.511373 1.086062 H2-Ab1 major histocompatibility complex, class II,
DQ beta 1
19 10541564 0.7464494 2.4722832 0.3443094 Clec4a3 C-type lectin domain family 4, member a3
19 10542164 0.5480114 2.4502562 1.1052172 CLEC12A C-type lectin domain family 12, member A
19 10450694 1.283448 2.4501724 0.5557134 H2-T22 histocompatibility 2, T region locus 10
19 10574157 1.3049558 2.4474742 0.2223566 Nlrc5 NLR family, CARD domain containing 5
19 10450154 0.0553464 2.4472182 1.5266352 H2-Aa major histocompatibility complex, class II,
DQ alpha 1
19 10450145 0.7637532 2.435735 0.2729004 PSMB9 proteasome (prosome, macropain) subunit,
beta type, 9 (large multifunctional peptidase
2)
19 10608650 1.2253204 2.3571572 0.5479072
19 10467136 0.9961334 2.3453586 0.0655276 CH25H cholesterol 25-hydroxylase
19 10494271 0.8863408 2.3397738 0.9578114 CTSS cathepsin S
19 10430344 0.7892776 2.339561 0.3294114 IL2RB interleukin 2 receptor, beta
19 10542214 0.8568258 2.3356938 0.3147028 KLRD1 killer cell lectin-like receptor subfamily D,
member 1
19 10548409 0.5555734 2.321605 0.258718 KLRC1 killer cell lectin-like receptor subfamily C,
member 1
19 10545231 0.112162 2.3115278 1.2174252
19 10450682 1.1968086 2.3070544 0.5163656 H2-T23 major histocompatibility complex, class I, E
19 10499899 0.3411854 2.2756336 0.430861 Sprr1a small proline-rich protein 1A
19 10566358 1.4552558 2.2619232 0.3253804 Trim30a/Trim30d tripartite motif-containing 30A
19 10358408 0.5463968 2.25218 1.0736032 RGS1 regulator of G-protein signaling 1
19 10500335 1.0418258 2.2285576 0.0730666 FCGR1A Fc fragment of IgG, high affinity Ia,
receptor (CD64)
19 10358224 0.5411394 2.2280782 0.391751 PTPRC protein tyrosine phosphatase, receptor type,
C
19 10376060 0.6354092 2.2272594 0.273665 IRF1 interferon regulatory factor 1
19 10360370 1.4681804 2.1829292 -0.0354692 BC094916/Pyhin1 pyrin and HIN domain family, member 1
19 10482802 0.1173006 2.1749958 0.1873466 CYTIP cytohesin 1 interacting protein
19 10483110 1.430762 2.1434404 0.2088794 IFIH1 interferon induced with helicase C domain 1
19 10391207 1.5878618 2.1416922 0.1567764 DHX58 DEXH (Asp-Glu-X-His) box polypeptide
58
19 10360398 1.7179874 2.1286288 0.1429086 Ifi202b interferon activated gene 202B
19 10469816 0.534669 2.114779 0.7450546 IL1RN interleukin 1 receptor antagonist
19 10586865 0.4116198 2.1073 0.4162836 ALDH1A2 aldehyde dehydrogenase 1 family, member
A2
19 10416437 0.6751552 2.096989 0.5377088 LCP1 lymphocyte cytosolic protein 1 (L-plastin)
19 10522788 0.6406626 2.0893718 1.4313376 STAP1 signal transducing adaptor family member 1
19 10608680 1.0686368 2.063397 0.5170938
19 10574137 0.8125618 2.038502 0.1257696 Nlrc5 NLR family, CARD domain containing 5
19 10541555 0.68506 2.0369386 0.2454676 Clec4a1 C-type lectin domain family 4, member a1
19 10439268 1.3933982 2.0361166 0.2693444
19 10383198 1.3722304 2.03025 0.2341492
19 10489107 0.9496202 2.0174686 0.193735 SAMHD1 SAM domain and HD domain 1
19 10547664 0.652098 2.0117958 -0.0777252 CLEC4E C-type lectin domain family 4, member E
19 10473356 1.2483616 2.0110876 0.2273504 UBE2L6 ubiquitin-conjugating enzyme E2L 6
19 10545672 1.073653 2.009689 -0.223924 MTHFD2 methylenetetrahydrofolate dehydrogenase
(NADP+ dependent) 2,
methenyltetrahydrofolate cyclohydrolase
19 10501063 0.92232 2.0042782 0.5883946 CD53 CD53 molecule
19 10548333 0.5087908 2.003942 0.0924392 CD69 CD69 molecule
19 10346168 0.3006652 2.0011018 0.2653532 STAT4 signal transducer and activator of
transcription 4
19 10444229 -0.0841386 1.9972962 0.5102066 H2-DMa major histocompatibility complex, class II,
DM alpha
19 10383202 1.2170374 1.9899976 0.1971992
19 10383212 1.2807078 1.9794812 0.1379936
19 10427628 0.2020662 1.9776476 1.0536282 IL7R interleukin 7 receptor
19 10450699 1.1703178 1.9724508 0.4997466 H2-t9 MHC class Ib T9
19 10383200 1.2727822 1.9718344 0.1916054
19 10582997 1.0521214 1.9663418 0.2881812 CASP4 caspase 4, apoptosis-related cysteine
peptidase
19 10363070 0.4972668 1.964941 0.6533532 Gp49a/Lilrb4 leukocyte immunoglobulin-like receptor,
subfamily B, member 4
19 10566050 0.8505664 1.9609576 0.1040406 IL18BP interleukin 18 binding protein
19 10387985 0.8071282 1.9576576 0.2166224 C17orf87 chromosome 17 open reading frame 87
19 10379530 0.8658914 1.9443636 0.1128612 CCL2 chemokine (C-C motif) ligand 2
19 10383204 1.1357078 1.9425306 0.2457926
19 10347928 1.1627542 1.9413008 0.2504984 SP110 SP110 nuclear body protein
19 10582874 1.1627542 1.9413008 0.2504984 SP110 SP110 nuclear body protein
19 10383168 1.2321966 1.9387588 0.224844

34
19 10439009 1.6160874 1.9293578 0.3396058 APOD apolipoprotein D
19 10466210 1.3308214 1.9272124 -0.2145274 Ms4a6d membrane-spanning 4-domains, subfamily
A, member 6D
19 10383214 1.2460008 1.9243842 0.155819 RNF213 ring finger protein 213
19 10590623 0.1569208 1.9074108 0.3690986 CXCR6 chemokine (C-X-C motif) receptor 6
19 10444821 1.18119 1.8987912 0.345559 H2-Q8 histocompatibility 2, Q region locus 8
19 10516620 0.3329464 1.895378 -0.0414716 LCK lymphocyte-specific protein tyrosine kinase
19 10576034 0.3441756 1.8938428 0.228497 IRF8 interferon regulatory factor 8
19 10543067 0.8924464 1.8921396 -0.1612068 ASNS asparagine synthetase (glutamine-
hydrolyzing)
19 10385504 1.3345508 1.8849688 0.0609972 9930111J21Rik1 (includes others) RIKEN cDNA 9930111J21 gene 1
19 10512067 1.4561762 1.882034 0.1562328 DDX58 DEAD (Asp-Glu-Ala-Asp) box polypeptide
58
19 10371082 0.2148154 1.8804068 -0.460633 ITGB1BP3 integrin beta 1 binding protein 3
19 10346799 0.0043482 1.8797438 0.1659624 ICOS inducible T-cell co-stimulator
19 10375145 0.6974618 1.8792452 0.1815292 LCP2 lymphocyte cytosolic protein 2 (SH2
domain containing leukocyte protein of
76kDa)
19 10450675 1.287698 1.8782556 0.251955 H2-T24 histocompatibility 2, T region locus 24
19 10451287 1.1796362 1.876985 0.080637 ISG15 ISG15 ubiquitin-like modifier
19 10383206 1.4657144 1.8769186 0.1973942
19 10544133 1.217127 1.866139 0.1714104 PARP12 poly (ADP-ribose) polymerase family,
member 12
19 10383208 1.27534 1.8656074 0.0859574
19 10587323 0.2530728 1.8571534 0.030345 GSTA5 glutathione S-transferase alpha 5
19 10547621 0.718058 1.854566 0.6046294 APOBEC1 apolipoprotein B mRNA editing enzyme,
catalytic polypeptide 1
19 10578264 0.8405288 1.8510092 0.181129 MSR1 macrophage scavenger receptor 1
19 10497358 0.440363 1.8461006 0.105642 SIRPB1 signal-regulatory protein beta 1
19 10508392 0.6191052 1.8327338 0.0518754 RNF19B ring finger protein 19B
19 10383196 1.239303 1.8305924 0.1384022
19 10404606 0.7732084 1.826795 0.798668 LY86 lymphocyte antigen 86
19 10416837 0.4658074 1.819301 0.0892956 IRG1 immunoresponsive 1 homolog (mouse)
19 10384458 0.4738072 1.8126064 0.5662866 PLEK pleckstrin
19 10430174 0.9298544 1.8121148 -0.0424356 Apol9a/Apol9b apolipoprotein L 9b
19 10422760 0.3261818 1.8113256 0.3297336 FYB FYN binding protein
19 10444780 0.8865558 1.8096416 0.3486722 H2-D1 major histocompatibility complex, class I, C
19 10587683 0.224268 1.8088916 0.460044 BCL2A1 BCL2-related protein A1
19 10494978 0.461454 1.8025842 0.103349 PTPN22 protein tyrosine phosphatase, non-receptor
type 22 (lymphoid)
19 10548345 0.6456856 1.790527 0.1088762 KLRK1 killer cell lectin-like receptor subfamily K,
member 1
19 10383152 1.2251342 1.7822882 0.1650364
19 10466127 0.7595704 1.7729404 0.2949266 AW112010 expressed sequence AW112010
19 10534909 1.0012986 1.7727008 0.274811 SP110 SP110 nuclear body protein
19 10566144 1.0783222 1.765984 0.0399148 TRIM21 tripartite motif containing 21
19 10547657 0.592161 1.7624398 0.7489586 C3AR1 complement component 3a receptor 1
19 10341146 0.955206 1.757856 0.2708486
19 10398907 0.6186054 1.7508612 0.2368952 PLD4 phospholipase D family, member 4
19 10364262 0.3280914 1.7493698 0.5955638 ITGB2 integrin, beta 2 (complement component 3
receptor 3 and 4 subunit)
19 10383233 1.1444914 1.7484898 0.1143688 RNF213 ring finger protein 213
19 10467578 0.5865978 1.737426 0.2986214 PIK3AP1 phosphoinositide-3-kinase adaptor protein 1
19 10538979 0.039099 1.7373972 0.0898172 CD8B CD8b molecule
19 10351658 0.27022 1.7345502 0.348607 CD48 CD48 molecule
19 10583008 0.5963556 1.731618 0.7944984 CASP12 caspase 12 (gene/pseudogene)
19 10533213 0.952913 1.7272632 0.028116 OAS3 2'-5'-oligoadenylate synthetase 3, 100kDa
19 10579532 0.9742552 1.7251682 0.015638 BST2 bone marrow stromal cell antigen 2
19 10601456 0.4274258 1.7217426 0.0632648 Gm6377 predicted gene 6377
19 10367224 1.1219454 1.7212156 0.1063028 STAT2 signal transducer and activator of
transcription 2, 113kDa
19 10473125 0.2624998 1.7191564 0.2741498 ITGA4 integrin, alpha 4 (antigen CD49D, alpha 4
subunit of VLA-4 receptor)
19 10577655 0.6809258 1.7177706 -0.0897372 IDO1 indoleamine 2,3-dioxygenase 1
19 10587331 0.2273104 1.71706 0.0388082 GSTA5 glutathione S-transferase alpha 5
19 10414360 0.2304294 1.7160434 1.2752646 LGALS3 lectin, galactoside-binding, soluble, 3
19 10420030 0.544547 1.7142812 0.1313866 PSME2 proteasome (prosome, macropain) activator
subunit 2 (PA28 beta)
19 10601385 0.8437128 1.7139096 0.5232028 Tlr13 toll-like receptor 13
19 10404429 0.548754 1.7086388 0.3013378 SERPINB9 serpin peptidase inhibitor, clade B
(ovalbumin), member 9
19 10363082 0.674021 1.7064604 0.6561414 Gp49a/Lilrb4 leukocyte immunoglobulin-like receptor,
subfamily B, member 4
19 10466314 1.0620346 1.701901 -0.047045 Gm6545 predicted gene 6545
19 10581813 0.770091 1.701732 -0.0969206 MLKL mixed lineage kinase domain-like
19 10532744 0.3363368 1.69874 0.2439462 SELPLG selectin P ligand
19 10372410 0.522368 1.698527 1.1243976 KRR1 KRR1, small subunit (SSU) processome
component, homolog (yeast)
19 10397975 1.0263038 1.6912854 0.423526 IFI27 interferon, alpha-inducible protein 27
19 10452980 1.4950454 1.6912818 0.096311 EIF2AK2 eukaryotic translation initiation factor 2-
alpha kinase 2
19 10385511 0.7952632 1.690896 0.2082678 PSME2 proteasome (prosome, macropain) activator
subunit 2 (PA28 beta)
19 10554240 1.2615106 1.690042 0.1112326 ISG20 interferon stimulated exonuclease gene
20kDa
19 10360070 0.9638368 1.6841486 0.5139922 FCER1G Fc fragment of IgE, high affinity I, receptor
for; gamma polypeptide
19 10559486 0.318287 1.683363 0.6118422 LAIR1 leukocyte-associated immunoglobulin-like

35
receptor 1
19 10402347 1.1685306 1.668541 -0.1304298 IFI27L2 interferon, alpha-inducible protein 27-like 2
19 10547976 0.3606576 1.662027 0.1520756 TAPBPL TAP binding protein-like
19 10595633 0.2980066 1.6600914 0.463966 BCL2A1 BCL2-related protein A1
19 10477250 0.593416 1.6578754 0.1589558 HCK hemopoietic cell kinase
19 10497372 0.077279 1.6482618 0.061407 Gm5150 predicted gene 5150
19 10360373 1.4103408 1.6441048 0.2734026 Gm4955/Pydc4 predicted gene 4955
19 10341698 0.710026 1.6433962 -0.2208912
19 10458314 0.3242682 1.6420458 0.2020784 TMEM173 transmembrane protein 173
19 10388958 0.5125318 1.6375792 0.3854556 EVI2A ecotropic viral integration site 2A
19 10383210 1.1383424 1.6337102 0.0069638
19 10603551 0.4223812 1.625549 1.159192 CYBB cytochrome b-245, beta polypeptide
19 10351197 0.5833314 1.6165604 -0.1720524 SELL selectin L
19 10430372 0.2766366 1.612696 0.2249314 RAC2 ras-related C3 botulinum toxin substrate 2
(rho family, small GTP binding protein
Rac2)
19 10466200 0.4040966 1.6093924 0.6076166 MS4A7 membrane-spanning 4-domains, subfamily
A, member 7
19 10424676 1.074176 1.60709 0.089556 LY6E lymphocyte antigen 6 complex, locus E
19 10533198 1.2649732 1.601928 0.2665056 OAS2 2'-5'-oligoadenylate synthetase 2, 69/71kDa
19 10385118 0.4048064 1.6018698 0.4297698 DOCK2 dedicator of cytokinesis 2
19 10446253 0.3505632 1.5963008 0.1871464 VAV1 vav 1 guanine nucleotide exchange factor
19 10525158 1.2726552 1.5929634 0.0155286 Oas1b 2'-5' oligoadenylate synthetase 1B
19 10574163 0.7109762 1.592793 0.1357792 Nlrc5 NLR family, CARD domain containing 5
19 10598004 0.072844 1.5914776 0.1603672 CCR1 chemokine (C-C motif) receptor 1
19 10601416 0.0707 1.5850616 0.146496 P2RY10 purinergic receptor P2Y, G-protein coupled,
10
19 10587690 0.2873218 1.5840334 0.422429 BCL2A1 BCL2-related protein A1
19 10516966 0.5500444 1.5819754 0.1381296 C1orf38 chromosome 1 open reading frame 38
19 10549647 0.7043544 1.5800114 0.3322452 NCR1 natural cytotoxicity triggering receptor 1
19 10356278 0.8293982 1.579104 0.2295122
19 10444830 0.9216016 1.5748188 0.3971792 H2-Q7 major histocompatibility complex, class I, B
19 10542140 0.474192 1.5670996 0.176973 Klrb1f killer cell lectin-like receptor subfamily B
member 1F
19 10444298 -0.0366592 1.5648672 0.7938668 H2-Eb1 major histocompatibility complex, class II,
DR beta 1
19 10544588 -0.0606966 1.5635748 0.2281696 Gimap3 GTPase, IMAP family member 3
19 10389134 0.7427074 1.5557914 0.2019718 SLFN13 schlafen family member 13
19 10557862 0.3038222 1.5469754 0.1986446 ITGAM integrin, alpha M (complement component
3 receptor 3 subunit)
19 10461622 0.7415382 1.5460996 -0.1543084 MS4A6A membrane-spanning 4-domains, subfamily
A, member 6A
19 10381408 0.8406186 1.5359778 0.076773 IFI35 interferon-induced protein 35
19 10574151 0.7058892 1.535274 0.017785 Nlrc5 NLR family, CARD domain containing 5
19 10344031 0.601693 1.5296286 0.3844464
19 10383194 1.0963808 1.5263516 0.0543994
19 10539135 0.3874618 1.5245522 0.4551148 CAPG capping protein (actin filament), gelsolin-
like
19 10379630 0.9251714 1.5240792 0.211215 LOC100506736/SLFN12L schlafen family member 12-like
19 10343267 0.38988 1.5193044 0.3863932
19 10460767 0.4964744 1.5171568 0.0798446 BATF2 basic leucine zipper transcription factor,
ATF-like 2
19 10495186 0.3895426 1.5164114 0.2865824 AI504432 expressed sequence AI504432
19 10383192 1.0434578 1.5140986 -0.0689554
19 10473809 0.6935322 1.5085088 0.3719016 SPI1 spleen focus forming virus (SFFV) proviral
integration oncogene spi1
19 10343969 0.8470774 1.5062906 0.0323934
19 10444268 0.5573244 1.5039722 0.2411812 TAP2 transporter 2, ATP-binding cassette, sub-
family B (MDR/TAP)
19 10578493 1.1026004 1.502504 0.069727 TLR3 toll-like receptor 3
19 10559467 0.2746832 1.5013596 0.3916788 Lilrb3 (includes others) leukocyte immunoglobulin-like receptor,
subfamily B (with TM and ITIM domains),
member 3
19 10360382 1.113058 1.4970968 -0.0960994
19 10557591 0.2612154 1.484938 0.0962942 ITGAL integrin, alpha L (antigen CD11A (p180),
lymphocyte function-associated antigen 1;
alpha polypeptide)
19 10566583 0.7771216 1.484039 0.1683282 A630026L20 predicted gene 8995
19 10351691 0.1576404 1.4828854 0.0857722 SLAMF6 SLAM family member 6
19 10342250 0.6374548 1.4822284 -0.1968016
19 10524631 1.6460816 1.4800312 -0.0082242 OASL 2'-5'-oligoadenylate synthetase-like
19 10508663 0.2615698 1.474983 0.4539704 LAPTM5 lysosomal protein transmembrane 5
19 10352000 0.2421598 1.4732024 0.1845638 KMO kynurenine 3-monooxygenase (kynurenine
3-hydroxylase)
19 10395039 1.9141296 1.4696918 0.1989334 CMPK2 cytidine monophosphate (UMP-CMP)
kinase 2, mitochondrial
19 10385513 0.7977336 1.46827 0.1571774 9930111J21Rik2 RIKEN cDNA 9930111J21 gene 2
19 10425049 0.885278 1.4578154 0.0038998 Apol9a/Apol9b apolipoprotein L 9b
19 10339750 0.6767434 1.4569978 0.0487598
19 10534927 0.573481 1.456305 0.337669 PILRA paired immunoglobin-like type 2 receptor
alpha
19 10491091 1.0070048 1.4562698 0.4677006 TNFSF10 tumor necrosis factor (ligand) superfamily,
member 10
19 10343290 0.6155766 1.4531214 -0.0887452
19 10531737 0.2531144 1.4524198 0.4214542 HPSE heparanase
19 10392839 0.4517374 1.4475472 0.1387038 CD300E CD300e molecule
19 10606016 0.43968 1.4448968 0.0556836 IL2RG interleukin 2 receptor, gamma
19 10341587 0.653113 1.4434846 0.3446022

36
19 10588479 0.448144 1.4411098 0.1625784 TLR9 toll-like receptor 9
19 10459772 0.3656014 1.4394276 -0.0398924 LIPG lipase, endothelial
19 10427336 0.1455786 1.4353166 0.5366498 NCKAP1L NCK-associated protein 1-like
19 10429128 0.2684102 1.4342246 0.154483 SLA Src-like-adaptor
19 10385526 0.7593058 1.4337874 0.170925 9930111J21Rik2 RIKEN cDNA 9930111J21 gene 2
19 10444236 0.0472272 1.4301082 0.3940302 H2-DMb2 major histocompatibility complex, class II,
DM beta
19 10404061 0.240023 1.4277124 0.060515 HIST1H2BM histone cluster 1, H2bm
19 10593024 -0.0129024 1.4223468 0.0332308 CD3E CD3e molecule, epsilon (CD3-TCR
complex)
19 10435457 0.8965184 1.4128956 0.2355468 PARP9 poly (ADP-ribose) polymerase family,
member 9
19 10347925 1.0641064 1.4110846 0.5541396 Csprs (includes others) component of Sp100-rs
19 10343468 0.7004286 1.4107288 0.132326
19 10487208 0.5014866 1.4104722 0.3125408 ATP8B4 ATPase, class I, type 8B, member 4
19 10446282 0.4914846 1.4084476 0.4135968 EMR1 egf-like module containing, mucin-like,
hormone receptor-like 1
19 10347915 1.1219024 1.4075254 0.5349144 Csprs (includes others) component of Sp100-rs
19 10588786 0.6018798 1.406173 0.1428684 UBA7 ubiquitin-like modifier activating enzyme 7
19 10432640 0.333436 1.4047486 -0.000527 BIN2 bridging integrator 2
19 10461614 0.961888 1.4014132 -0.2155936 Ms4a6c membrane-spanning 4-domains, subfamily
A, member 6C
19 10338492 0.5095478 1.3989682 0.0855698
19 10466190 0.1068396 1.3979732 0.3058532 MS4A14 membrane-spanning 4-domains, subfamily
A, member 14
19 10533256 0.9298928 1.3964458 -0.0836834 OAS1 2',5'-oligoadenylate synthetase 1, 40/46kDa
19 10574133 0.522839 1.3949696 0.2162864 Nlrc5 NLR family, CARD domain containing 5
19 10425092 0.0750874 1.390971 0.4081618 CYTH4 cytohesin 4
19 10397645 0.4072416 1.3895768 0.2572878 GPR65 G protein-coupled receptor 65
19 10416566 0.6688464 1.3865894 0.06489 EPSTI1 epithelial stromal interaction 1 (breast)
19 10415319 1.1973094 1.384173 0.2033798 IRF9 interferon regulatory factor 9
19 10340317 0.5451872 1.382322 0.0440246
19 10363475 0.4745612 1.3818068 -0.1199382 PRF1 perforin 1 (pore forming protein)
19 10541587 0.3294138 1.3817326 0.2952782 CLEC4A C-type lectin domain family 4, member A
19 10486061 0.2594004 1.3733332 0.0726536 RASGRP1 RAS guanyl releasing protein 1 (calcium
and DAG-regulated)
19 10494405 -0.020348 1.371182 0.2621112
19 10342553 0.5957916 1.3669464 -0.1149076
19 10566578 1.037822 1.3646458 0.2069368 GVIN1 GTPase, very large interferon inducible
pseudogene 1
19 10339951 0.3897564 1.3509698 0.0952652
19 10408239 -0.014304 1.348348 0.256996 HIST1H3A (includes others) histone cluster 1, H3a
19 10404065 -0.020466 1.346584 0.26231
19 10341222 0.4446238 1.3458018 0.1773594
19 10404049 -0.031654 1.344784 0.255568 HIST3H3 histone cluster 3, H3
19 10559446 0.1278364 1.3425096 0.1234242 Lilrb3 (includes others) leukocyte immunoglobulin-like receptor,
subfamily B (with TM and ITIM domains),
member 3
19 10404028 -0.021226 1.341852 0.261474
19 10568024 0.085763 1.3407108 0.0754376 CORO1A coronin, actin binding protein, 1A
19 10412218 0.246929 1.3405814 0.0922118 GZMK granzyme K (granzyme 3; tryptase II)
19 10338116 0.5032076 1.3396406 0.1213958
19 10341395 0.6270404 1.3378844 0.1173654
19 10353844 0.2429408 1.333679 0.2992638 LINCR neuralized homolog 3 (Drosophila)
pseudogene
19 10566571 0.9780742 1.3315022 0.205392 GVIN1 GTPase, very large interferon inducible
pseudogene 1
19 10551883 0.4396744 1.330637 0.6743776 TYROBP TYRO protein tyrosine kinase binding
protein
19 10374333 0.3390056 1.3290564 0.0976656 IKZF1 IKAROS family zinc finger 1 (Ikaros)
19 10574159 0.7214016 1.3265116 0.145912 Nlrc5 NLR family, CARD domain containing 5
19 10408246 -0.015718 1.325692 0.245507
19 10498345 0.0917886 1.324675 0.0081468 GPR171 G protein-coupled receptor 171
19 10403941 -0.04412 1.320704 0.255596
19 10439527 0.3021902 1.315349 0.1007632 TIGIT T cell immunoreceptor with Ig and ITIM
domains
19 10408083 -0.007942 1.31222 0.253824
19 10359181 1.178489 1.3080828 0.3061894 TOR3A torsin family 3, member A
19 10541683 0.5615392 1.3078052 0.619202 C1R complement component 1, r subcomponent
19 10465059 0.351004 1.3016886 0.0989552 CTSW cathepsin W
19 10494402 0.018493 1.2996292 0.2561438
19 10443980 0.0734448 1.2986444 0.3442004 MYO1F myosin IF
19 10461636 0.9397984 1.296475 -0.2190182
19 10439312 0.421205 1.2959762 0.2275316 CD86 CD86 molecule
19 10476945 0.1432678 1.2932402 -0.0150944 CST7 cystatin F (leukocystatin)
19 10429843 0.6822778 1.2925336 0.185145 PARP10 poly (ADP-ribose) polymerase family,
member 10
19 10341905 0.3699916 1.2906664 0.1438182
19 10424400 0.3867162 1.2881278 0.0683688 MYC v-myc myelocytomatosis viral oncogene
homolog (avian)
19 10444068 0.387153 1.2855764 0.1565016 TAPBP TAP binding protein (tapasin)
19 10351679 0.1049966 1.283378 0.7502694 CD84 CD84 molecule
19 10530145 0.2903852 1.2805916 0.1836964 TLR1 toll-like receptor 1
19 10593050 0.3111306 1.2747598 0.233196 IL10RA interleukin 10 receptor, alpha
19 10482517 0.4592992 1.2700728 0.19648 NMI N-myc (and STAT) interactor
19 10340164 0.970162 1.268731 0.136533
19 10441003 0.1841896 1.2679018 0.386084 Runx1 runt related transcription factor 1
19 10344300 0.4637748 1.2664564 0.3330754

37
19 10356262 0.7599434 1.2638648 0.3805486 Csprs (includes others) component of Sp100-rs
19 10338280 0.767899 1.260463 0.1806542
19 10581434 0.4151294 1.2577828 0.6114122 DPEP2 dipeptidase 2
19 10450484 0.2926204 1.2544966 0.3261892 AIF1 allograft inflammatory factor 1
19 10583669 0.2381194 1.253789 0.1980792 C19orf38 chromosome 19 open reading frame 38
19 10521667 0.327503 1.252063 0.2547964 BST1 bone marrow stromal cell antigen 1
19 10452316 0.200302 1.251358 0.455166 C3 complement component 3
19 10580754 0.540463 1.2510904 0.0598304 9330175E14Rik RIKEN cDNA 9330175E14 gene
19 10542040 0.5443804 1.2499434 0.1510554 PARP11 poly (ADP-ribose) polymerase family,
member 11
19 10420497 0.8798182 1.249821 -0.348363 PHF11 PHD finger protein 11
19 10566346 0.8833828 1.2497776 0.2051118 TRIM5 tripartite motif containing 5
19 10347948 0.7803866 1.2487958 0.2957984 Sp100 nuclear antigen Sp100
19 10339327 0.8099732 1.2386216 0.2516898
19 10429560 0.4708498 1.238127 -0.1571372 Ly6a (includes others) lymphocyte antigen 6 complex, locus A
19 10461765 0.5092338 1.2373714 0.1299998 LPXN leupaxin
19 10366586 0.2604464 1.2370944 -0.032477 IFNG interferon, gamma
19 10589884 0.674914 1.2364032 0.2063814 Bcl2a1c B-cell leukemia/lymphoma 2 related protein
A1c
19 10520452 0.3085278 1.2344378 -0.016623 IL6 interleukin 6 (interferon, beta 2)
19 10574143 0.396912 1.2337408 0.091473 Nlrc5 NLR family, CARD domain containing 5
19 10542911 0.8911856 1.226798 0.221653 SAMD9L sterile alpha motif domain containing 9-like
19 10359851 0.548288 1.223848 -0.483796 UCK2 uridine-cytidine kinase 2
19 10403871 0.3765194 1.21935 0.3465268 AOAH acyloxyacyl hydrolase (neutrophil)
19 10381445 0.4599564 1.2148456 0.2474696 TMEM106A transmembrane protein 106A
19 10548535 0.4885794 1.2130834 -0.0444708 Klra4 (includes others) killer cell lectin-like receptor, subfamily A,
member 4
19 10338178 1.01608 1.2127464 0.1513468
19 10339765 0.7645518 1.2113492 0.094755
19 10450344 0.2722964 1.2109044 0.0437848 C2 complement component 2
19 10388902 1.0430218 1.206333 0.0834354 LGALS9B lectin, galactoside-binding, soluble, 9B
19 10440393 0.2722946 1.1941854 0.0443434 SAMSN1 SAM domain, SH3 domain and nuclear
localization signals 1
19 10487823 0.6965748 1.1939224 0.1820418 SIGLEC1 sialic acid binding Ig-like lectin 1,
sialoadhesin
19 10461558 0.3451984 1.1929978 0.2245666 SLC15A3 solute carrier family 15, member 3
19 10582985 0.4341582 1.1912892 0.3020038 CASP1 caspase 1, apoptosis-related cysteine
peptidase (interleukin 1, beta, convertase)
19 10402585 0.5813128 1.1908234 0.0745218 WARS tryptophanyl-tRNA synthetase
19 10387536 0.097804 1.1906194 0.6908104 CD68 CD68 molecule
19 10343192 0.7152414 1.1902338 0.2045428
19 10342761 0.7804614 1.1895216 0.0579658
19 10342539 1.0484072 1.1816892 -0.1711614
19 10435920 0.352199 1.1808902 0.2778492
19 10338367 0.519272 1.1806316 -0.0498678
19 10406205 0.3361118 1.1708208 0.0557072 ERAP1 endoplasmic reticulum aminopeptidase 1
19 10466130 0.4850486 1.1697002 0.007417 MS4A8B membrane-spanning 4-domains, subfamily
A, member 8B
19 10339254 0.5823024 1.1682196 0.4186956
19 10375443 0.359144 1.1672862 0.1080574 MED7 mediator complex subunit 7
19 10545135 0.391756 1.1655688 0.0244014 IL12RB2 interleukin 12 receptor, beta 2
19 10398052 0.4181428 1.1646914 0.122733 Serpina3g (includes others) serine (or cysteine) peptidase inhibitor,
clade A, member 3G
19 10582879 0.8689342 1.1643276 0.5951274 Csprs (includes others) component of Sp100-rs
19 10501608 0.3361964 1.1628268 0.2990952 VCAM1 vascular cell adhesion molecule 1
19 10339726 0.7792976 1.145073 -0.0004674
19 10342216 0.5117702 1.144153 0.2796604
19 10343134 0.5623222 1.143999 -0.0098542
19 10340782 0.549048 1.1399344 0.4230836
19 10445119 0.518179 1.1362588 0.2081838 H2-M3 major histocompatibility complex, class I, G
19 10340809 0.564832 1.136208 0.103614
19 10339017 0.4761248 1.1312168 0.0982066
19 10450069 0.7635142 1.1293436 0.2062068 H2-K2 major histocompatibility complex, class I, B
19 10421697 0.4191708 1.115433 0.2113622 Lacc1 laccase (multicopper oxidoreductase)
domain containing 1
19 10461629 0.6942788 1.1130892 0.331865 Ms4a4c (includes others) membrane-spanning 4-domains, subfamily
A, member 4C
19 10340391 0.6651832 1.1085034 0.4850126
19 10450242 0.4702188 1.1008612 0.2129744 C4B (includes others) complement component 4B (Chido blood
group)
19 10356274 0.7974278 1.0985676 0.5549746 Csprs (includes others) component of Sp100-rs
19 10429564 0.90183 1.09786 -0.052366 Ly6a (includes others) lymphocyte antigen 6 complex, locus A
19 10566574 0.7283606 1.0948416 0.1557008 GVIN1 GTPase, very large interferon inducible
pseudogene 1
19 10343442 0.4726248 1.09018 0.1831102
19 10366881 0.6531048 1.0875162 0.0846756 DDIT3 DNA-damage-inducible transcript 3
19 10450723 0.4209714 1.0864318 0.308931 H2-T10/H2-T22 histocompatibility 2, T region locus 10
19 10360406 0.841702 1.081448 -0.205472 Ifi204 (includes others) interferon activated gene 204
19 10534935 0.495244 1.0788632 0.4150748 PILRB paired immunoglobin-like type 2 receptor
beta
19 10567580 0.4745284 1.0553076 0.5345208 IGSF6 immunoglobulin superfamily, member 6
19 10338660 0.7315254 1.03689 0.4647834
19 10340154 0.5433788 1.0345178 0.151647
19 10382106 0.6473176 1.0337026 0.280278 Gm885 predicted gene 885
19 10341908 0.74903 1.0101088 -0.0618252
19 10569017 0.841266 1.008492 0.097096 IFITM3 interferon induced transmembrane protein 3
(1-8U)
19 10343761 0.5782492 0.9717006 0.5957856

38
19 10475414 0.882482 0.970194 0.252234 B2M beta-2-microglobulin
19 10339990 0.7696598 0.9679708 0.043207

39
Online Table 7. Gene list of cluster 20 x Probe Set ID Day 4 Day 7 Day 60 Symbol Entrez Gene Name
20 10504838 0.6466026 -0.6764438 -2.052271 NR4A3 nuclear receptor subfamily 4, group A, member 3
20 10342166 0.9021222 -0.8550704 -1.6644466
20 10343939 0.314155 0.1882482 -1.4222714
20 10338097 0.5650608 0.5527936 -1.2691318
20 10359867 0.606477 -0.8260516 -1.116918 LRRC52 leucine rich repeat containing 52
20 10344291 0.4266474 0.0811516 -0.9558072
20 10457487 0.8814756 -0.1995982 -0.9044162 mir-1 microRNA 1-1
20 10529977 0.580624 -0.635134 -0.86866 PPARGC1A peroxisome proliferator-activated receptor
gamma, coactivator 1 alpha
20 10339095 0.32861 -0.3504168 -0.8404696
20 10343420 0.1987402 -0.1892846 -0.7776266
20 10443463 0.6108856 0.3413 -0.7749558 CDKN1A cyclin-dependent kinase inhibitor 1A (p21, Cip1)
20 10529979 0.549544 -0.499744 -0.771078 PPARGC1A peroxisome proliferator-activated receptor
gamma, coactivator 1 alpha
20 10448307 0.3367444 0.531072 -0.7708702 TNFRSF12A tumor necrosis factor receptor superfamily,
member 12A
20 10341968 0.358779 -0.0575052 -0.7682682
20 10342975 0.1286276 -0.0392738 -0.7137612
20 10400304 0.437786 -0.01601 -0.66923 EGLN3 egl nine homolog 3 (C. elegans)
20 10583100 0.3015062 0.2588274 -0.6682986 MMP8 matrix metallopeptidase 8 (neutrophil
collagenase)
20 10343228 0.1612522 -0.2218376 -0.6650314
20 10343840 0.1762094 -0.0432734 -0.658523
20 10339900 0.7079828 0.5340342 -0.6476118
20 10582916 0.2449188 0.0514598 -0.6399298
20 10343366 0.6619412 -0.4192234 -0.6398
20 10339167 0.4555178 -0.3477428 -0.6389084
20 10342609 0.552077 -0.1596658 -0.5920258
20 10342933 0.6354876 -0.229319 -0.5832938
20 10343582 0.2264012 0.1701006 -0.577129
20 10343410 0.372617 -0.38625 -0.5760238
20 10344571 0.4679986 -0.4765338 -0.5749398
20 10338949 0.2009184 0.1414942 -0.5677778
20 10340626 0.1738014 -0.0001566 -0.567402
20 10574023 0.471064 0.425368 -0.554394 MT2A metallothionein 2A
20 10343628 0.4820224 -0.52959 -0.5527058
20 10340357 0.4543644 -0.309628 -0.5450722
20 10344013 0.3851834 -0.1298612 -0.5315274
20 10338731 0.6644404 -0.4519762 -0.531523
20 10419966 0.1586162 -0.1106324 -0.5313798 LOC100505868/ZFHX2 zinc finger homeobox 2
20 10436100 0.1852876 0.136416 -0.5308612 RETNLB resistin like beta
20 10340126 0.5333784 -0.599984 -0.5293894
20 10343871 0.2381114 0.03443 -0.5227972
20 10344419 0.1697334 -0.0888344 -0.5221626
20 10342575 0.259648 -0.1477532 -0.5218994
20 10342758 0.2108672 0.2106526 -0.5181104
20 10543017 0.5463 -0.434924 -0.517146 PDK4 pyruvate dehydrogenase kinase, isozyme 4
20 10338277 0.4394526 -0.3904224 -0.5108288
20 10414514 0.2738508 0.410077 -0.510096 PNP purine nucleoside phosphorylase
20 10425283 0.263011 -0.1440026 -0.4981352 MAFF v-maf musculoaponeurotic fibrosarcoma
oncogene homolog F (avian)
20 10338384 1.562577 -0.6781792 -0.4977346
20 10343057 0.5579906 0.063359 -0.4958374
20 10339351 0.2974774 -0.107412 -0.491899
20 10341532 0.4281916 -0.2276126 -0.4895334
20 10340505 0.4760996 0.4413078 -0.4864232
20 10338864 0.3702562 -0.2694676 -0.4850074
20 10338464 0.3137844 -0.049937 -0.472538
20 10343925 0.9744814 -0.2944796 -0.471071
20 10344121 1.0337716 0.030855 -0.4673632
20 10338189 0.2269412 0.1143066 -0.4661642
20 10339712 0.4709908 -0.1682244 -0.4658618
20 10587639 0.187552 -0.099332 -0.46563 NT5E 5'-nucleotidase, ecto (CD73)
20 10341044 0.9763624 0.2941172 -0.4642174
20 10339398 0.2193054 0.0181552 -0.4628092
20 10341118 0.3467926 0.041155 -0.4624514
20 10341975 0.23731 -0.0824482 -0.4623538
20 10338693 0.5927138 -0.0987502 -0.4585404
20 10341107 0.2274096 -0.1342748 -0.4556472
20 10340452 0.2701234 -0.1106524 -0.4523214
20 10375173 0.5234528 -0.1691866 -0.4500748
20 10341219 0.3028466 -0.3348456 -0.4416082
20 10339580 0.6129774 -0.2412416 -0.4385158
20 10341764 0.1703188 -0.1097836 -0.4381568
20 10340267 0.4720832 -0.076333 -0.4381288
20 10339555 0.5828206 -0.0510268 -0.4361538
20 10338102 0.3505742 0.1970672 -0.4345094
20 10338348 0.334739 0.2341354 -0.4342006
20 10338252 0.4856104 0.1670512 -0.4326426
20 10342797 0.8363162 0.4265398 -0.4316902
20 10362418 0.3127912 -0.3111002 -0.4290378 TRDN triadin
20 10343831 0.2374426 -0.0641066 -0.4287364
20 10338199 0.4758932 -0.1411322 -0.4264754
20 10338799 0.383455 -0.1096402 -0.4253344
20 10342925 0.5813664 -0.0592264 -0.4242466

40
20 10341067 0.2976188 -0.1810948 -0.4210958
20 10339142 0.2285536 -0.2278086 -0.4210024
20 10343167 0.4315168 0.0456108 -0.4162398
20 10340649 0.6075474 0.0939018 -0.4159858
20 10458340 0.394086 -0.120517 -0.4154666 HBEGF heparin-binding EGF-like growth factor
20 10478283 0.4991718 0.0184522 -0.4128608 MPHOSPH6 M-phase phosphoprotein 6
20 10339994 0.5266396 -0.4158492 -0.412145
20 10339780 0.3365926 0.2569392 -0.4098466
20 10338989 0.6465246 -0.6638872 -0.4060278
20 10362428 0.53231 -0.365892 -0.403662 TRDN triadin
20 10339958 0.2094872 -0.226427 -0.4002024
20 10342477 0.5679884 -0.0265002 -0.3959038
20 10343406 0.5448574 -0.1319472 -0.3946708
20 10490946 0.230758 0.176938 -0.3917798 HSP90AA1 heat shock protein 90kDa alpha (cytosolic), class
A member 1
20 10344444 0.4563744 -0.3777998 -0.3909098
20 10598018 0.6095922 -0.0297206 -0.3900832
20 10342072 0.2141818 -0.1634178 -0.388622
20 10517587 0.2706716 -0.114425 -0.3876294 ALPL alkaline phosphatase, liver/bone/kidney
20 10362416 0.6518874 -0.3528262 -0.3800158 TRDN triadin
20 10386455 0.3108338 0.1159476 -0.3794284 RASD1 RAS, dexamethasone-induced 1
20 10340629 0.430837 -0.1919464 -0.3780716
20 10341672 0.4958586 -0.149113 -0.3780256
20 10341906 0.3848366 0.0241032 -0.3748144
20 10351491 0.2311638 -0.0747234 -0.3744514 OLFML2B olfactomedin-like 2B
20 10341943 0.465354 0.1273792 -0.3735342
20 10342481 0.2636796 -0.107209 -0.3694492
20 10338256 0.2001066 -0.1792948 -0.3669922
20 10340821 0.4197158 0.3292636 -0.3663652
20 10343663 0.2495552 -0.2222516 -0.3659642
20 10480087 0.6360562 -0.3486038 -0.3655598 Gm13310 karyopherin (importin) alpha 2 pseudogene
20 10341258 0.5104874 0.2429788 -0.3641016
20 10341486 0.5024092 0.3532854 -0.363378
20 10343847 0.2309142 -0.1924114 -0.3622578
20 10546725 0.2655284 0.0011786 -0.362254 PDZRN3 PDZ domain containing ring finger 3
20 10535759 0.2798422 -0.2407582 -0.3622442 LNX2 ligand of numb-protein X 2
20 10554839 0.237164 -0.097786 -0.361844 PICALM phosphatidylinositol binding clathrin assembly
protein
20 10508887 0.504226 0.0266234 -0.3596724 NR0B2 nuclear receptor subfamily 0, group B, member 2
20 10338912 0.2287932 0.0015392 -0.3552054
20 10497703 0.2541964 0.1987722 -0.3546882 MRPL47 mitochondrial ribosomal protein L47
20 10338263 0.980338 -0.7446428 -0.3533042
20 10341813 0.4079336 -0.3281372 -0.3531508
20 10362440 0.2318646 -0.148573 -0.351924 TRDN triadin
20 10342331 0.2835282 -0.2438488 -0.3503836
20 10339107 0.3491866 -0.3671802 -0.3488292
20 10568521 0.2836492 0.0567514 -0.3469452 C10orf88 chromosome 10 open reading frame 88
20 10343017 0.3203094 0.199494 -0.3462
20 10340778 0.211222 -0.1643596 -0.3452888
20 10339909 0.3177412 -0.0916206 -0.3419212
20 10338241 0.2566804 -0.0654764 -0.3399122
20 10343702 0.2664206 0.1678698 -0.3395154
20 10338756 0.2966314 -0.0715898 -0.3386224
20 10344054 0.2399916 -0.111099 -0.3380212
20 10338816 0.5296906 -0.5589852 -0.3338036
20 10492598 0.3445658 0.147439 -0.3330144 NMD3 NMD3 homolog (S. cerevisiae)
20 10342142 0.529543 -0.2637208 -0.3320708
20 10343845 0.3095974 -0.2382986 -0.3320534
20 10558740 0.255596 0.0360934 -0.3292526
20 10338379 0.4398998 0.0656206 -0.3281644
20 10338133 0.3178272 -0.15564 -0.3277312
20 10343929 0.2806872 -0.114874 -0.3276234
20 10339952 0.2097328 -0.0276578 -0.3263398
20 10572161 0.3246518 0.2603094 -0.3258862 ZNF440/ZNF808 zinc finger protein 440
20 10472589 0.3723498 -0.033817 -0.3257978 PHOSPHO2 phosphatase, orphan 2
20 10386622 0.3027248 -0.1168884 -0.3255366 Gm12618 predicted gene 12618
20 10343326 0.5007962 -0.058772 -0.324937
20 10497503 0.473796 -0.198218 -0.323924 KPNA2 karyopherin alpha 2 (RAG cohort 1, importin
alpha 1)
20 10479761 0.6120444 -0.2749928 -0.3218364 MEIG1 meiosis expressed gene 1 homolog (mouse)
20 10448212 0.2916872 0.198233 -0.321343
20 10392284 0.47657 -0.224428 -0.3211 KPNA2 karyopherin alpha 2 (RAG cohort 1, importin
alpha 1)
20 10342954 0.2564738 -0.1586146 -0.3207736
20 10343538 0.31169 -0.126509 -0.3207678
20 10453512 0.521456 -0.21619 -0.320422 KPNA2 karyopherin alpha 2 (RAG cohort 1, importin
alpha 1)
20 10554733 0.2926772 -0.2801242 -0.3198218 Olfr292 (includes others) olfactory receptor 295
20 10556463 0.3617934 0.0626656 -0.3192186 ARNTL aryl hydrocarbon receptor nuclear translocator-
like
20 10344136 0.6177462 -0.2347244 -0.317568
20 10343546 0.5458966 -0.1054428 -0.3169026
20 10397541 0.4853912 0.2960084 -0.3168666 EG544883 (includes others) predicted gene 8300
20 10505917 0.2561528 0.0375116 -0.3160828
20 10342637 0.2651132 -0.1432048 -0.3160302
20 10343033 0.3045594 -0.075381 -0.3148448
20 10338975 0.4134052 -0.3140874 -0.3117558

41
20 10401829 0.4341516 0.3559566 -0.3110054 EIF1AY eukaryotic translation initiation factor 1A, Y-
linked
20 10405160 0.2677966 -0.0544282 -0.3088274
20 10341751 0.36525 -0.3430948 -0.3050218
20 10338078 0.226738 0.087915 -0.3042024
20 10446617 0.252704 -0.2106294 -0.302814
20 10561787 0.2826048 -0.026994 -0.30199 ZNF585A zinc finger protein 585A
20 10564015 0.2123024 -0.0919588 -0.3019384
20 10486026 0.3478704 -0.046448 -0.300158 ZNF770 zinc finger protein 770
20 10341483 0.50961 0.4178068 -0.2993896
20 10479833 0.2091502 -0.171265 -0.2991524 OPTN optineurin
20 10343152 0.4707652 -0.0117906 -0.2983712
20 10341308 0.4586628 0.4238358 -0.2976106
20 10376555 0.3884326 -0.262665 -0.2969252 COPS3 COP9 constitutive photomorphogenic homolog
subunit 3 (Arabidopsis)
20 10359888 0.2475466 -0.044394 -0.2963442 Gm5265 predicted pseudogene 5265
20 10506125 0.397109 -0.199631 -0.295652 ANGPTL3 angiopoietin-like 3
20 10340000 0.2523664 -0.0949048 -0.2953142
20 10338699 0.3521438 -0.2200492 -0.294761
20 10338770 0.441216 0.1014248 -0.2910876
20 10366737 0.257942 -0.0633168 -0.2906514
20 10338113 0.7282536 -0.0818906 -0.2896872
20 10343263 0.2260384 0.0259664 -0.2894444
20 10595909 0.3923746 0.267524 -0.2890164
20 10407124 0.564428 -0.2966796 -0.2867788 PDE4D phosphodiesterase 4D, cAMP-specific
20 10510254 0.3346426 -0.0830886 -0.2864916 AU040096/Fv1 Friend virus susceptibility 1
20 10341290 0.3884472 0.3200552 -0.2848336
20 10338795 0.39399 0.0526006 -0.2843264
20 10341090 0.3199266 0.1323048 -0.2833218
20 10342652 0.4845652 0.0189762 -0.2826234
20 10353750 0.2648568 -0.0261606 -0.2806998 BAG2 BCL2-associated athanogene 2
20 10339714 0.3777556 -0.2116314 -0.2805014
20 10343558 0.632146 0.044108 -0.280047
20 10342256 0.4002872 -0.0240036 -0.2792786
20 10344513 0.665013 0.4402642 -0.2779754
20 10340334 0.6289096 -0.1060048 -0.27795
20 10414179 0.5251626 -0.0279104 -0.2778366
20 10404996 0.2325064 -0.03296 -0.276548 NINJ1 ninjurin 1
20 10489343 0.3075664 -0.0994946 -0.2746374 PTPLA protein tyrosine phosphatase-like (proline instead
of catalytic arginine), member A
20 10539015 0.4682866 -0.114757 -0.273701
20 10342569 0.3060498 0.1482588 -0.2733694
20 10340813 0.4497486 -0.0036072 -0.2724442
20 10479221 0.3039088 -0.2767886 -0.270272 2010315B03Rik (includes others) zinc finger protein 781
20 10340042 0.3276582 -0.2271098 -0.2696182
20 10343501 0.7053814 -0.0700242 -0.2648274
20 10340588 0.4251332 -0.0234164 -0.2647014
20 10606436 0.3521406 -0.159795 -0.2628976 HMGN5 high-mobility group nucleosome binding domain
5
20 10394532 0.2352676 0.0248222 -0.2624684 UBE2F ubiquitin-conjugating enzyme E2F (putative)
20 10344397 0.9440408 -0.0594226 -0.2610256
20 10425299 0.3154304 -0.1615668 -0.2597062 TOMM22 translocase of outer mitochondrial membrane 22
homolog (yeast)
20 10342715 0.2475508 0.08976 -0.2595522
20 10374450 0.3248384 0.0399424 -0.2575436
20 10605828 0.32769 -0.1794206 -0.2552532 1700010D01Rik (includes others) RIKEN cDNA 1700010D01 gene
20 10598837 0.4648872 -0.0145822 -0.253024
20 10338337 0.394141 -0.0526072 -0.2518934
20 10339382 0.4738318 0.13854 -0.251284
20 10340002 0.364307 -0.3007348 -0.2512508
20 10586170 0.247895 0.0143348 -0.2509784
20 10338604 0.487776 0.146976 -0.250478
20 10598041 0.649572 -0.14326 -0.249606
20 10343819 0.317844 -0.008284 -0.2495306
20 10343273 0.6801512 -0.4329952 -0.249347
20 10343586 0.5869242 -0.2636704 -0.248635
20 10342246 0.6124502 0.1023462 -0.247503
20 10338407 0.2472068 -0.092372 -0.2462408
20 10582969 0.2653332 -0.0190964 -0.2439236
20 10532315 0.316247 0.0510548 -0.243059 AB010352 cDNA sequence AB010352
20 10340735 0.3456258 0.1593414 -0.242604
20 10484584 0.3267332 -0.1513266 -0.2424556
20 10338462 0.3350362 -0.1480482 -0.2422654
20 10548563 0.526318 -0.040072 -0.241824 EG667723/Ptp4a1 protein tyrosine phosphatase 4a1
20 10340559 0.5259034 -0.451817 -0.2416974
20 10604656 0.252109 0.0592874 -0.2389208 Xlr (includes others) X-linked lymphocyte-regulated complex
20 10366407 0.2508278 0.0305574 -0.2383078 Gm10752 predicted gene 10752
20 10364091 0.6105248 -0.3406658 -0.2368674
20 10397891 0.3968864 -0.0587104 -0.2362366 C14orf109 chromosome 14 open reading frame 109
20 10344563 0.4312332 -0.2565666 -0.236055
20 10463068 0.510622 -0.041008 -0.236034 EG667723/Ptp4a1 protein tyrosine phosphatase 4a1
20 10418002 0.396267 0.0420786 -0.233875 EG620119 H3 histone, family 3A pseudogene
20 10342605 0.3180748 -0.0805846 -0.2338394
20 10338726 0.326642 -0.301374 -0.2335006
20 10344582 0.2817582 -0.1855718 -0.2329368
20 10344566 1.7022998 -0.0414816 -0.2320412
20 10343895 0.303694 -0.0397352 -0.2317912

42
20 10343551 1.1123732 -0.525175 -0.2313878
20 10440284 0.2962486 -0.0529352 -0.231024 C3orf38 chromosome 3 open reading frame 38
20 10603254 0.2467368 -0.0565962 -0.2309192 LARP4 La ribonucleoprotein domain family, member 4
20 10340143 0.5078258 0.053435 -0.2293402
20 10338574 0.2973928 -0.0039226 -0.2292
20 10461671 0.271901 -0.054972 -0.2281144 PATL1 protein associated with topoisomerase II homolog
1 (yeast)
20 10346250 0.460129 -0.2501092 -0.2277082 MSTN myostatin
20 10409259 0.2561638 -0.1095338 -0.227662
20 10548616 0.2869606 -0.1738994 -0.2260602
20 10442219 0.270268 -0.001999 -0.225536 Zfp52 zinc finger protein 52
20 10371830 0.533686 -0.1496332 -0.2251336 ACTR6 ARP6 actin-related protein 6 homolog (yeast)
20 10543779 0.3486996 -0.0700148 -0.2250426 mir-29 microRNA 29a
20 10338920 0.37544 -0.102884 -0.224462
20 10399426 0.2563668 -0.045225 -0.2232704
20 10344506 0.377921 -0.3132704 -0.2231796
20 10339794 0.7022134 -0.47803 -0.221982
20 10340665 0.3950986 -0.056859 -0.2214364
20 10343240 0.2731104 -0.121437 -0.2211664
20 10565962 0.2612216 -0.0473884 -0.2198064 P2RY2 purinergic receptor P2Y, G-protein coupled, 2
20 10469575 0.4489004 -0.08709 -0.219806 EG667723/Ptp4a1 protein tyrosine phosphatase 4a1
20 10457400 0.318034 -0.1962598 -0.2196394
20 10338647 0.5111746 -0.190961 -0.2194612
20 10341566 0.6362822 0.329554 -0.2183302
20 10339808 0.6504954 0.3666534 -0.2182886
20 10385081 0.3495016 -0.232445 -0.2181372 ANP32C acidic (leucine-rich) nuclear phosphoprotein 32
family, member C
20 10342901 0.5488752 0.148699 -0.2167812
20 10340147 0.5044524 -0.0143524 -0.216544
20 10467489 0.417562 -0.095854 -0.216514 EG667723/Ptp4a1 protein tyrosine phosphatase 4a1
20 10419116 0.2479178 -0.033169 -0.2163342 1700001F09Rik (includes others) predicted gene 8207
20 10373832 0.5112614 -0.0564748 -0.215092
20 10395198 0.35201 -0.0940894 -0.2148404
20 10504884 0.251631 0.0197154 -0.213143 C9orf30 chromosome 9 open reading frame 30
20 10353707 0.408492 -0.10051 -0.21133 EG667723/Ptp4a1 protein tyrosine phosphatase 4a1
20 10338838 0.3582894 -0.1862962 -0.210714
20 10342063 0.3439312 -0.115718 -0.210568
20 10343675 0.3843236 -0.0217372 -0.2103654
20 10342140 0.431682 0.177564 -0.209968
20 10344589 0.3245888 -0.0161794 -0.2099448
20 10343223 0.2661232 -0.0698268 -0.209499
20 10340921 0.6442204 -0.1737922 -0.207783
20 10340756 0.4530948 -0.3905794 -0.2073322
20 10341181 0.4758146 0.0051352 -0.2053178
20 10338386 0.6479334 -0.0755566 -0.2052294
20 10340834 0.331538 -0.1519852 -0.2050796
20 10344265 0.3024488 0.0080764 -0.2047568
20 10340332 0.3009744 0.0070794 -0.204087
20 10341368 0.2836078 -0.0826884 -0.2030754
20 10489870 0.4866326 -0.0004382 -0.2029494 Gm11472 ribosomal protein L17 pseudogene
20 10339630 0.64187 0.3509704 -0.2020006
20 10426827 0.343527 -0.0979552 -0.2004002 LARP4 La ribonucleoprotein domain family, member 4
20 10442057 0.3515622 0.1166926 -0.1996802 RIOK2 RIO kinase 2 (yeast)
20 10344553 0.4116396 -0.083162 -0.1992284
20 10405911 0.356437 -0.2154884 -0.197982 Zfp595/Zfp759 zinc finger protein 759
20 10342315 0.5383944 0.2053484 -0.1970136
20 10342682 0.6011086 0.240776 -0.1963092
20 10408008 0.3704206 -0.0893206 -0.1961144
20 10339819 0.2689412 -0.03096 -0.1945246
20 10339523 0.628278 0.064476 -0.191138
20 10454543 0.2632724 -0.0131296 -0.189973
20 10338935 0.5625414 -0.3714554 -0.1896158
20 10338110 0.5843548 -0.1036262 -0.189376
20 10340984 0.5107782 0.0501608 -0.1876676
20 10481111 0.4071512 0.1608202 -0.1861356
20 10604842 0.437677 0.082548 -0.1845662
20 10608709 0.3662556 -0.0380956 -0.1843648
20 10362434 0.386882 -0.234366 -0.183384 TRDN triadin
20 10503180 0.3411832 -0.212259 -0.182661 CHD7 chromodomain helicase DNA binding protein 7
20 10531887 0.4279476 0.2101506 -0.1825986 SLC10A6 solute carrier family 10 (sodium/bile acid
cotransporter family), member 6
20 10341553 0.272189 0.009042 -0.1822324
20 10510191 0.8052642 0.1337214 -0.1821594 ZNF600/ZNF888 zinc finger protein 600
20 10496621 0.3214902 -0.0466086 -0.181638 GTF2B general transcription factor IIB
20 10340155 0.704931 -0.379694 -0.18152
20 10340187 0.5637264 -0.0756206 -0.177712
20 10427718 0.4464534 0.1101344 -0.1774128 BRIX1 BRX1, biogenesis of ribosomes, homolog (S.
cerevisiae)
20 10424335 0.2650014 -0.026686 -0.177356 RNF139 ring finger protein 139
20 10532157 0.4233972 -0.1233208 -0.1773106 TMED5 transmembrane emp24 protein transport domain
containing 5
20 10412607 0.2990356 -0.1969768 -0.1772468 ABHD6 abhydrolase domain containing 6
20 10384579 0.33005 -0.088416 -0.17675 UGP2 UDP-glucose pyrophosphorylase 2
20 10564448 0.315868 0.0492062 -0.1760754 ASB7 ankyrin repeat and SOCS box containing 7
20 10375893 0.286024 -0.169912 -0.174676 SAR1B SAR1 homolog B (S. cerevisiae)
20 10547858 0.489723 -0.1406042 -0.1729604 GNB3 guanine nucleotide binding protein (G protein),
beta polypeptide 3

43
20 10338964 0.5116012 -0.2699386 -0.1727404
20 10338443 0.3419726 -0.0455902 -0.172658
20 10586484 0.477402 -0.141504 -0.171782 FAM96A family with sequence similarity 96, member A
20 10339526 0.3908352 -0.294585 -0.1693396
20 10351430 0.446162 0.116796 -0.169288 RXRG retinoid X receptor, gamma
20 10560089 0.3365618 -0.2127626 -0.1688942 Vmn1r86 vomeronasal 1 receptor 86
20 10540544 0.445642 0.2031182 -0.1683276 THUMPD3 THUMP domain containing 3
20 10552118 0.5541726 -0.2718264 -0.1679856 Gm12755 predicted gene 12755
20 10589087 0.296672 -0.1448874 -0.1679338 PRKAR2A protein kinase, cAMP-dependent, regulatory, type
II, alpha
20 10341266 0.3106046 -0.0162336 -0.1667396
20 10344026 0.4488932 -0.3766104 -0.166661
20 10344208 0.3668412 -0.0422856 -0.1655322
20 10339232 0.3956608 0.1401024 -0.1653
20 10529730 0.3330946 -0.0648652 -0.165062
20 10594186 0.2788388 -0.0697086 -0.164956
20 10493086 0.3579562 -0.0752234 -0.1643782 HDGF hepatoma-derived growth factor
20 10373355 0.335262 -0.0140498 -0.1629598 SPRYD4 SPRY domain containing 4
20 10416791 0.3449834 -0.107756 -0.1624826
20 10490302 0.5885336 -0.324808 -0.1619158 ZNF844 zinc finger protein 844
20 10338870 0.4663534 0.0461542 -0.161914
20 10436046 0.3651512 -0.0060084 -0.1615962
20 10340116 0.4728642 -0.1623046 -0.1607372
20 10341981 0.6197348 0.3130374 -0.1607192
20 10342794 0.2735846 -0.107767 -0.1599756
20 10578155 0.3268254 -0.1905038 -0.1588396
20 10351259 0.2846822 -0.0805408 -0.1586188 SLC19A2 solute carrier family 19 (thiamine transporter),
member 2
20 10415784 0.5427994 -0.1498442 -0.1579394 TRIM13 tripartite motif containing 13
20 10342484 0.6037316 0.1926258 -0.1578374
20 10342994 0.5057786 -0.3300474 -0.1575352
20 10512061 0.3318592 -0.074238 -0.1561212 TAF9 TAF9 RNA polymerase II, TATA box binding
protein (TBP)-associated factor, 32kDa
20 10448030 0.439968 0.0826306 -0.1547432
20 10505532 0.3598238 0.0534804 -0.1545564
20 10565341 0.432667 -0.1064054 -0.154162 Gm6155 predicted pseudogene 6155
20 10428066 0.463638 0.1211974 -0.1539634 1700084J12Rik RIKEN cDNA 1700084J12 gene
20 10578763 0.5785008 0.2280154 -0.1532012 SAP30 Sin3A-associated protein, 30kDa
20 10338205 0.368721 -0.0835972 -0.1528422
20 10460114 0.3133202 -0.022919 -0.1517882
20 10458245 0.4079354 -0.0393346 -0.1504936
20 10338514 0.817792 -0.25683 -0.15032
20 10339122 0.4513984 0.0768154 -0.1502898
20 10476941 0.3301932 -0.0286262 -0.1481326
20 10362939 0.3512334 -0.162687 -0.1472706 EG215974 glyceraldehyde-3-phosphate dehydrogenase
pseudogene
20 10338076 0.4625404 -0.2332684 -0.1470302
20 10344160 0.48324 0.278914 -0.146742
20 10392259 0.437614 -0.1966554 -0.1466318 SMURF2 SMAD specific E3 ubiquitin protein ligase 2
20 10564567 0.289396 -0.1234958 -0.1452768
20 10598081 0.676514 -0.4412286 -0.1446956
20 10340099 0.411182 0.0379058 -0.1443744
20 10338088 0.332159 0.0363044 -0.1439792
20 10484720 0.2896198 -0.0313542 -0.1432822 Olfr1166 olfactory receptor 1166
20 10342593 0.6859476 -0.4213654 -0.1431742
20 10583376 0.3241384 -0.1140238 -0.1428612 Olfr829 olfactory receptor 829
20 10341051 0.8256572 0.111041 -0.1425394
20 10427603 0.2961026 -0.0359052 -0.1393286
20 10341982 0.4710402 -0.1775274 -0.1377452
20 10362432 0.408006 -0.135282 -0.137314 TRDN triadin
20 10579047 0.4332096 -0.1116074 -0.1368314 LZTS1 leucine zipper, putative tumor suppressor 1
20 10574595 0.3144558 -0.1199104 -0.1365442
20 10340680 0.5429532 -0.0747878 -0.1351196
20 10343481 0.5149364 -0.1399546 -0.1343692
20 10340752 0.511668 0.1071522 -0.1340268
20 10565514 0.326048 -0.18798 -0.132666 TMEM126A transmembrane protein 126A
20 10598062 0.7708504 -0.2339634 -0.1322978
20 10344252 0.332487 -0.2113676 -0.1302538
20 10439634 0.34333 -0.0418246 -0.129813 GTPBP8 GTP-binding protein 8 (putative)
20 10468275 0.4533306 0.2081274 -0.1296886 PCGF6 polycomb group ring finger 6
20 10338120 0.439432 0.085132 -0.12876
20 10339394 0.3739452 0.0351744 -0.1287392
20 10341179 0.639894 -0.3670022 -0.1284212
20 10473592 0.303059 -0.0347958 -0.1281328 Olfr1183 olfactory receptor 1183
20 10343633 0.4393228 0.0870318 -0.1274854
20 10343080 0.4145872 0.0606494 -0.126826
20 10474477 0.3379834 -0.1013642 -0.1255444
20 10355996 0.324212 -0.066718 -0.125184 SLC25A6 solute carrier family 25 (mitochondrial carrier;
adenine nucleotide translocator), member 6
20 10340586 0.5570352 0.099532 -0.1247026
20 10420503 0.6233122 0.3045638 -0.1240812 SETDB2 SET domain, bifurcated 2
20 10450904 0.6512008 -0.1975366 -0.1238382 SCOC short coiled-coil protein
20 10339705 0.4561256 0.052212 -0.1232954
20 10552260 0.3187918 -0.1002628 -0.1226174
20 10345174 0.3114848 -0.1438432 -0.1175596 Gm9884 predicted gene 9884
20 10572613 0.378118 -0.034932 -0.117492 MRPL34 mitochondrial ribosomal protein L34
20 10354732 0.4018124 -0.195804 -0.117076 HSPD1 heat shock 60kDa protein 1 (chaperonin)

44
20 10381345 0.3581856 -0.00755 -0.116478 PSME3 proteasome (prosome, macropain) activator
subunit 3 (PA28 gamma; Ki)
20 10355452 0.4480898 -0.1694406 -0.1157968
20 10528691 0.5019378 -0.135054 -0.115794 Rheb (mouse) Ras homolog enriched in brain
20 10583347 0.3930876 0.0196402 -0.115688 CHORDC1 cysteine and histidine-rich domain (CHORD)
containing 1
20 10339757 0.6614656 -0.1151198 -0.1154322
20 10342486 0.383622 -0.206866 -0.115226
20 10342763 0.370554 -0.025328 -0.115128
20 10605552 0.3420016 -0.083252 -0.1148512
20 10368739 0.3311324 0.0012366 -0.1146298 GTF3C6 general transcription factor IIIC, polypeptide 6,
alpha 35kDa
20 10343509 0.4224812 0.0041972 -0.1128628
20 10379627 0.3923338 -0.1686 -0.1118916
20 10600588 0.4549734 -0.1500438 -0.1116676
20 10369890 0.3422736 -0.163334 -0.1097722 CISD1 CDGSH iron sulfur domain 1
20 10340032 0.8241944 0.4563344 -0.1077386
20 10339101 0.5539822 -0.078086 -0.10691
20 10518679 0.5057334 -0.1409794 -0.1057906 NMNAT1 nicotinamide nucleotide adenylyltransferase 1
20 10535623 0.3988052 0.0037796 -0.1057822 1700001J03Rik (includes others) RIKEN cDNA 1700123K08 gene
20 10342860 0.411124 -0.061116 -0.10526
20 10369604 0.423583 -0.1665968 -0.1052346 VPS26A vacuolar protein sorting 26 homolog A (S.
pombe)
20 10341819 0.424844 -0.2266818 -0.1049486
20 10344118 0.3174466 -0.0596546 -0.1034402
20 10457927 0.6362774 -0.0124284 -0.1022158
20 10342960 0.4785154 -0.2215686 -0.101964
20 10339881 0.7222704 -0.0124696 -0.1004908
20 10503176 0.325241 -0.0981758 -0.1001332 CHD7 chromodomain helicase DNA binding protein 7
20 10475405 0.3805114 -0.118998 -0.097606 EIF3J eukaryotic translation initiation factor 3, subunit J
20 10339110 0.4048998 0.0436752 -0.0964794
20 10338085 0.4394274 -0.04336 -0.0949726
20 10503172 0.4802296 -0.2222028 -0.0926554 CHD7 chromodomain helicase DNA binding protein 7
20 10341569 0.6243144 0.0504196 -0.091793
20 10340607 0.395543 0.0401196 -0.09132
20 10587746 0.3757024 -0.01927 -0.091072 TMEM41B transmembrane protein 41B
20 10339913 0.3579364 -0.0750344 -0.0904062
20 10354418 0.3484304 -0.0598606 -0.0864406 OBFC2A oligonucleotide/oligosaccharide-binding fold
containing 2A
20 10342350 0.557064 -0.1862 -0.0860212
20 10344114 0.4212298 0.064964 -0.0848634
20 10342646 0.6016912 0.104009 -0.083795
20 10374793 0.6811498 0.4103276 -0.0836438 PNPT1 polyribonucleotide nucleotidyltransferase 1
20 10339698 0.6993828 -0.2716138 -0.0833668
20 10361790 0.425616 0.02688 -0.080446 FUCA2 fucosidase, alpha-L- 2, plasma
20 10511865 0.40034 0.01834 -0.079754 PTGES3 prostaglandin E synthase 3 (cytosolic)
20 10482323 0.466557 -0.1702808 -0.0781854 PPP6C protein phosphatase 6, catalytic subunit
20 10539649 0.3814502 0.002222 -0.075546 PTGES3 prostaglandin E synthase 3 (cytosolic)
20 10340558 0.5843748 0.1657176 -0.0751892
20 10485811 0.3726266 -0.014166 -0.0745212 Olfr1313 olfactory receptor 1313
20 10482073 0.3703906 -0.0907354 -0.074358
20 10456904 0.4835962 -0.1025052 -0.0722584 PSTPIP2 proline-serine-threonine phosphatase interacting
protein 2
20 10339251 0.355416 -0.036472 -0.071092
20 10339471 0.4594668 0.011628 -0.069144
20 10424347 0.4809562 0.0939558 -0.06528 Gm7691 ribosomal protein L17 pseudogene
20 10340870 0.6448888 0.1668276 -0.0647374
20 10341369 0.678152 -0.13765 -0.063558
20 10340875 0.4267644 0.022312 -0.0611472
20 10608710 0.5257508 0.1081174 -0.0584548
20 10385466 0.390633 -0.0190428 -0.049913 SGCD sarcoglycan, delta (35kDa dystrophin-associated
glycoprotein)
20 10341729 0.5369276 0.1953082 -0.0439568
20 10340828 0.5882534 0.0167084 -0.0371442
20 10532989 0.5041298 0.0390602 -0.036244 GATC glutamyl-tRNA(Gln) amidotransferase, subunit C
homolog (bacterial)
20 10342828 0.55565 -0.115256 -0.031172
20 10438690 0.4602944 0.0027208 -0.0282524 RFC4 replication factor C (activator 1) 4, 37kDa
20 10343385 1.1086562 0.4540988 -0.0146048
20 10344301 1.0129848 0.5253624 -0.0119822
20 10400395 0.501193 0.0827344 -0.0014052 PPP2R3C protein phosphatase 2, regulatory subunit B'',
gamma
20 10446771 0.505998 0.02285 0.003388 LCLAT1 lysocardiolipin acyltransferase 1
20 10447349 0.6428122 0.014972 0.009698 CRIPT cysteine-rich PDZ-binding protein
20 10343047 0.8830632 0.3467506 0.012497
20 10343995 0.6400986 0.060398 0.0532252
20 10343324 0.6063256 0.0454408 0.0540828
20 10601326 0.653302 0.0937466 0.055639 UPRT uracil phosphoribosyltransferase (FUR1)
homolog (S. cerevisiae)
20 10338710 0.7532364 0.0567162 0.0565778
20 10598064 1.0858592 -0.130216 0.0733384
20 10340048 0.6877526 0.0690378 0.0796044
20 10601328 0.9130072 0.1088154 0.094026 UPRT uracil phosphoribosyltransferase (FUR1)
homolog (S. cerevisiae)
20 10342604 0.9727096 0.037674 0.133467
20 10341030 0.8904632 0.156412 0.1347218

45
Online Table 8. List of differentially expressed genes on 4 dpi (log ratio > 1 or < -1, P value < 0.05) 4 dpi 7 dpi 60 dpi
Probe Set ID Log ratio P values (t-test) Log ratio P values (t-test) Log ratio P values (t-test) Symbol Entrez Gene Name
10455970 6.6 0.00 6.8 0.00 2.8 0.00
10608681 5.1 0.00 6.3 0.00 1.4 0.00 Gm4841 predicted gene 4841
10569102 4.1 0.00 4.6 0.00 0.1 0.72 IRF7 interferon regulatory factor 7
10462621 4.1 0.00 4.2 0.00 0.7 0.03 IFIT3 interferon-induced protein with
tetratricopeptide repeats 3
10459066 3.9 0.00 6.3 0.00 1.0 0.00 Gm4841 predicted gene 4841
10376324 3.8 0.00 5.4 0.00 1.0 0.00 Gm12250 predicted gene 12250
10462623 3.7 0.00 3.8 0.00 0.4 0.18 IFIT1B interferon-induced protein with
tetratricopeptide repeats 1B
10462618 3.7 0.00 4.0 0.00 0.6 0.03 IFIT3 interferon-induced protein with
tetratricopeptide repeats 3
10502791 3.4 0.00 3.7 0.00 0.6 0.02 IFI44 interferon-induced protein 44
10376326 3.4 0.00 4.9 0.00 0.7 0.01
10455961 3.3 0.00 4.3 0.00 1.1 0.00 Iigp1 interferon inducible GTPase 1
10541307 3.2 0.00 3.5 0.00 0.2 0.15 USP18 ubiquitin specific peptidase 18
10462613 3.2 0.00 3.7 0.00 0.3 0.05 IFIT2 interferon-induced protein with
tetratricopeptide repeats 2
10399710 3.0 0.00 2.9 0.00 0.3 0.13 RSAD2 radical S-adenosyl methionine
domain containing 2
10531407 2.9 0.00 4.9 0.00 1.0 0.00 CXCL9 chemokine (C-X-C motif) ligand 9
10455954 2.8 0.00 3.9 0.00 0.6 0.03 Gm4951 predicted gene 4951
10461594 2.8 0.00 4.0 0.00 0.0 0.91 Ms4a4b (includes others) membrane-spanning 4-domains,
subfamily A, member 4B
10420308 2.7 0.00 5.1 0.00 0.1 0.44 GZMB granzyme B (granzyme 2, cytotoxic
T-lymphocyte-associated serine
esterase 1)
10385500 2.6 0.00 4.3 0.00 0.4 0.06 IRGM immunity-related GTPase family, M
10385507 2.5 0.00 5.3 0.00 0.3 0.02 9930111J21Rik1/Gm12185 predicted gene 12185
10462390 2.5 0.00 4.1 0.00 0.4 0.08 CD274 CD274 molecule
10608646 2.4 0.00 3.4 0.00 0.8 0.00
10385533 2.4 0.00 3.9 0.00 0.6 0.04 9930111J21Rik1/Gm12185 predicted gene 12185
10496580 2.3 0.00 3.5 0.00 0.3 0.02 GBP4 guanylate binding protein 4
10385518 2.3 0.00 3.8 0.00 0.7 0.03 Tgtp1/Tgtp2 T cell specific GTPase 1
10420488 2.3 0.00 2.8 0.00 0.2 0.44 PHF11 PHD finger protein 11
10502801 2.3 0.00 2.9 0.00 0.3 0.21 IFI44L interferon-induced protein 44-like
10531724 2.3 0.00 3.8 0.00 0.7 0.00 PLAC8 placenta-specific 8
10351873 2.3 0.00 3.2 0.00 0.2 0.09 Ifi204 (includes others) interferon activated gene 204
10531415 2.2 0.00 3.4 0.00 0.3 0.05 CXCL10 chemokine (C-X-C motif) ligand 10
10420483 2.2 0.00 3.1 0.00 0.2 0.14 Phf11a/Phf11b PHD finger protein 11A
10437224 2.1 0.00 2.2 0.00 0.1 0.44 Mx1/Mx2 myxovirus (influenza virus) resistance
1
10351880 2.1 0.00 2.4 0.00 0.2 0.24 Pydc3/Pydc4 pyrin domain containing 4
10455957 2.1 0.00 3.3 0.00 0.5 0.06
10389207 2.0 0.00 3.5 0.00 0.2 0.02 CCL5 chemokine (C-C motif) ligand 5
10531994 2.0 0.00 3.2 0.00 0.2 0.26
10434778 2.0 0.00 2.6 0.00 0.2 0.51 RTP4 receptor (chemosensory) transporter
protein 4
10574145 1.9 0.00 3.3 0.00 0.4 0.01 NLRC5 NLR family, CARD domain
containing 5
10524621 1.9 0.00 2.6 0.00 0.2 0.23 Oasl2 2'-5' oligoadenylate synthetase-like 2
10395039 1.9 0.00 1.5 0.00 0.2 0.25 CMPK2 cytidine monophosphate (UMP-CMP)
kinase 2, mitochondrial
10441233 1.9 0.00 2.2 0.00 0.1 0.25 Mx1/Mx2 myxovirus (influenza virus) resistance
1
10496569 1.9 0.00 3.0 0.00 0.5 0.03 GBP7 guanylate binding protein 7
10379518 1.9 0.00 3.3 0.00 -0.1 0.70 CCL7 chemokine (C-C motif) ligand 7
10379636 1.8 0.00 3.0 0.00 0.0 0.80 SLFN12L schlafen family member 12-like
10496555 1.8 0.00 3.7 0.00 0.4 0.09 GBP2 guanylate binding protein 2,
interferon-inducible
10379511 1.8 0.00 3.3 0.00 -0.1 0.43 Ccl2 chemokine (C-C motif) ligand 2
10571984 1.8 0.00 2.4 0.00 0.4 0.05 DDX60 DEAD (Asp-Glu-Ala-Asp) box
polypeptide 60
10574149 1.8 0.00 3.1 0.00 0.5 0.00 NLRC5 NLR family, CARD domain
containing 5
10532019 1.8 0.00 3.5 0.00 0.2 0.15 Gbp6 (includes others) guanylate binding protein 6
10531987 1.8 0.00 3.2 0.00 0.4 0.09 Gbp6 (includes others) guanylate binding protein 6
10496592 1.8 0.00 3.3 0.00 0.5 0.05
10393573 1.7 0.00 2.4 0.00 0.2 0.47 LGALS3BP lectin, galactoside-binding, soluble, 3
binding protein
10346191 1.7 0.00 3.0 0.00 0.4 0.00 STAT1 signal transducer and activator of
transcription 1, 91kDa
10378068 1.7 0.00 2.3 0.00 0.2 0.07 XAF1 XIAP associated factor 1
10360398 1.7 0.00 2.1 0.00 0.1 0.34 Ifi202b interferon activated gene 202B
10566366 1.7 0.00 2.3 0.00 -0.1 0.80 Trim30a/Trim30d tripartite motif-containing 30A
10533246 1.7 0.00 2.5 0.00 0.3 0.20 OAS1 2'-5'-oligoadenylate synthetase 1,
40/46kDa
10490150 1.7 0.00 3.1 0.00 0.2 0.07 ZBP1 Z-DNA binding protein 1
10538590 1.7 0.00 2.7 0.00 0.3 0.14 HERC6 HECT and RLD domain containing
E3 ubiquitin protein ligase family
member 6
10344566 1.7 0.01 0.0 0.93 -0.2 0.58
10574098 1.7 0.00 2.7 0.00 0.5 0.00 NLRC5 NLR family, CARD domain
containing 5
10450075 1.7 0.00 2.7 0.00 0.7 0.00 HLA-B major histocompatibility complex,

46
class I, B
10450325 1.7 0.00 3.3 0.00 0.7 0.00 CFB complement factor B
10444814 1.6 0.00 2.7 0.00 0.7 0.00 HLA-B major histocompatibility complex,
class I, B
10524631 1.6 0.00 1.5 0.00 0.0 0.92 OASL 2'-5'-oligoadenylate synthetase-like
10439009 1.6 0.00 1.9 0.00 0.3 0.16 APOD apolipoprotein D
10563597 1.6 0.00 2.7 0.00 -0.2 0.23 Saa3 serum amyloid A 3
10391207 1.6 0.00 2.1 0.00 0.2 0.25 DHX58 DEXH (Asp-Glu-X-His) box
polypeptide 58
10496539 1.6 0.00 2.6 0.00 0.5 0.01 GBP5 guanylate binding protein 5
10338384 1.6 0.02 -0.7 0.24 -0.5 0.21
10398075 1.5 0.00 2.3 0.00 0.9 0.01 SERPINA3 serpin peptidase inhibitor, clade A
(alpha-1 antiproteinase, antitrypsin),
member 3
10375515 1.5 0.00 3.0 0.00 0.2 0.02
10452980 1.5 0.00 1.7 0.00 0.1 0.52 EIF2AK2 eukaryotic translation initiation factor
2-alpha kinase 2
10574102 1.5 0.00 2.3 0.00 0.4 0.01 NLRC5 NLR family, CARD domain
containing 5
10439249 1.5 0.00 2.6 0.00 0.3 0.06 PARP14 poly (ADP-ribose) polymerase
family, member 14
10360370 1.5 0.00 2.2 0.00 0.0 0.85 Ifi204 (includes others) interferon activated gene 204
10512470 1.5 0.00 2.7 0.00 0.9 0.00 CD72 CD72 molecule
10383206 1.5 0.00 1.9 0.00 0.2 0.40
10512067 1.5 0.00 1.9 0.00 0.2 0.27 DDX58 DEAD (Asp-Glu-Ala-Asp) box
polypeptide 58
10566358 1.5 0.00 2.3 0.00 0.3 0.07 Trim30a/Trim30d tripartite motif-containing 30A
10547740 1.4 0.04 0.2 0.86 1.7 0.04 C1S complement component 1, s
subcomponent
10483110 1.4 0.00 2.1 0.00 0.2 0.12 IFIH1 interferon induced with helicase C
domain 1
10360373 1.4 0.00 1.6 0.00 0.3 0.07 Pydc3/Pydc4 pyrin domain containing 4
10531980 1.4 0.00 2.8 0.00 0.4 0.03 Gbp6 (includes others) guanylate binding protein 6
10439268 1.4 0.00 2.0 0.00 0.3 0.07 DTX3L deltex 3-like (Drosophila)
10444244 1.4 0.00 2.8 0.00 0.3 0.01 TAP1 transporter 1, ATP-binding cassette,
sub-family B (MDR/TAP)
10531420 1.4 0.00 2.8 0.00 0.1 0.28 Cxcl11 chemokine (C-X-C motif) ligand 11
10383198 1.4 0.00 2.0 0.00 0.2 0.28
10574135 1.4 0.00 2.8 0.00 0.4 0.03 NLRC5 NLR family, CARD domain
containing 5
10379633 1.4 0.00 2.6 0.00 0.0 0.98 Slfn1 schlafen 1
10385504 1.3 0.00 1.9 0.00 0.1 0.67 Gm5431 predicted gene 5431
10574104 1.3 0.00 2.5 0.00 0.4 0.00 NLRC5 NLR family, CARD domain
containing 5
10466210 1.3 0.00 1.9 0.00 -0.2 0.25 MS4A6A membrane-spanning 4-domains,
subfamily A, member 6A
10552406 1.3 0.00 4.0 0.00 0.2 0.05 NKG7 natural killer cell group 7 sequence
10412211 1.3 0.00 2.7 0.00 0.0 0.64 GZMA granzyme A (granzyme 1, cytotoxic
T-lymphocyte-associated serine
esterase 3)
10574157 1.3 0.00 2.4 0.00 0.2 0.06 NLRC5 NLR family, CARD domain
containing 5
10450675 1.3 0.00 1.9 0.00 0.3 0.06 H2-T24 histocompatibility 2, T region locus
24
10450694 1.3 0.00 2.5 0.00 0.6 0.00 H2-T22 histocompatibility 2, T region locus
22
10383212 1.3 0.00 2.0 0.00 0.1 0.08 Rnf213 ring finger protein 213
10383208 1.3 0.00 1.9 0.00 0.1 0.52
10383200 1.3 0.00 2.0 0.00 0.2 0.26
10525158 1.3 0.00 1.6 0.00 0.0 0.92 Oas1b 2'-5' oligoadenylate synthetase 1B
10574139 1.3 0.00 2.5 0.00 0.4 0.00 NLRC5 NLR family, CARD domain
containing 5
10533198 1.3 0.00 1.6 0.00 0.3 0.11 OAS2 2'-5'-oligoadenylate synthetase 2,
69/71kDa
10554240 1.3 0.00 1.7 0.00 0.1 0.17 ISG20 interferon stimulated exonuclease
gene 20kDa
10473356 1.2 0.00 2.0 0.00 0.2 0.16 UBE2L6 ubiquitin-conjugating enzyme E2L 6
10383214 1.2 0.00 1.9 0.00 0.2 0.15 Rnf213 ring finger protein 213
10389231 1.2 0.00 2.7 0.00 0.5 0.20 CCL3L1/CCL3L3 chemokine (C-C motif) ligand 3-like
1
10383196 1.2 0.00 1.8 0.00 0.1 0.40 Rnf213 ring finger protein 213
10444258 1.2 0.00 3.1 0.00 0.3 0.00 PSMB8 proteasome (prosome, macropain)
subunit, beta type, 8
10383168 1.2 0.00 1.9 0.00 0.2 0.04
10608650 1.2 0.00 2.4 0.00 0.5 0.00
10383152 1.2 0.00 1.8 0.00 0.2 0.18 Rnf213 ring finger protein 213
10544133 1.2 0.00 1.9 0.00 0.2 0.10 PARP12 poly (ADP-ribose) polymerase
family, member 12
10383202 1.2 0.00 2.0 0.00 0.2 0.11 Rnf213 ring finger protein 213
10415319 1.2 0.00 1.4 0.00 0.2 0.15 IRF9 interferon regulatory factor 9
10450682 1.2 0.00 2.3 0.00 0.5 0.00 HLA-E major histocompatibility complex,
class I, E
10444821 1.2 0.00 1.9 0.00 0.3 0.02 H2-Q5 histocompatibility 2, Q region locus 5
10451287 1.2 0.00 1.9 0.00 0.1 0.54
10359181 1.2 0.00 1.3 0.00 0.3 0.03 TOR3A torsin family 3, member A
10450699 1.2 0.00 2.0 0.00 0.5 0.00 HLA-F major histocompatibility complex,
class I, F
10402347 1.2 0.00 1.7 0.00 -0.1 0.44 IFI27L2 interferon, alpha-inducible protein 27-
like 2

47
10347928 1.2 0.00 1.9 0.00 0.3 0.13 SP110 SP110 nuclear body protein
10582874 1.2 0.00 1.9 0.00 0.3 0.13 SP110 SP110 nuclear body protein
10383233 1.1 0.00 1.7 0.00 0.1 0.33 Rnf213 ring finger protein 213
10383210 1.1 0.00 1.6 0.00 0.0 0.92 Rnf213 ring finger protein 213
10351509 1.1 0.00 3.2 0.00 0.6 0.01 FCGR3A Fc fragment of IgG, low affinity IIIa,
receptor (CD16a)
10383204 1.1 0.00 1.9 0.00 0.2 0.12 Rnf213 ring finger protein 213
10398039 1.1 0.00 3.1 0.00 0.3 0.02
10367224 1.1 0.00 1.7 0.00 0.1 0.48 STAT2 signal transducer and activator of
transcription 2, 113kDa
10347915 1.1 0.00 1.4 0.00 0.5 0.02 Csprs (includes others) component of Sp100-rs
10360382 1.1 0.00 1.5 0.00 -0.1 0.38 Ifi204 (includes others) interferon activated gene 204
10590635 1.1 0.00 3.1 0.00 0.5 0.03 CCR5 chemokine (C-C motif) receptor 5
(gene/pseudogene)
10598013 1.1 0.00 3.1 0.00 0.5 0.03 CCR5 chemokine (C-C motif) receptor 5
(gene/pseudogene)
10578493 1.1 0.00 1.5 0.00 0.1 0.39 TLR3 toll-like receptor 3
10598976 1.1 0.01 3.3 0.00 0.2 0.48 TIMP1 TIMP metallopeptidase inhibitor 1
10383194 1.1 0.01 1.5 0.00 0.1 0.70 Rnf213 ring finger protein 213
10598064 1.1 0.04 -0.1 0.71 0.1 0.86
10566144 1.1 0.00 1.8 0.00 0.0 0.72 TRIM21 tripartite motif containing 21
10360173 1.1 0.00 2.7 0.00 0.5 0.01 SLAMF7 SLAM family member 7
10424676 1.1 0.00 1.6 0.00 0.1 0.52 LY6E lymphocyte antigen 6 complex, locus
E
10545672 1.1 0.00 2.0 0.00 -0.2 0.02 MTHFD2 methylenetetrahydrofolate
dehydrogenase (NADP+ dependent)
2, methenyltetrahydrofolate
cyclohydrolase
10608680 1.1 0.00 2.1 0.00 0.5 0.00 H2-T22 histocompatibility 2, T region locus
22
10347925 1.1 0.00 1.4 0.00 0.6 0.02 Csprs (includes others) component of Sp100-rs
10466314 1.1 0.00 1.7 0.00 0.0 0.67
10582997 1.1 0.00 2.0 0.00 0.3 0.09 CASP4 caspase 4, apoptosis-related cysteine
peptidase
10383192 1.0 0.00 1.5 0.00 -0.1 0.56
10388902 1.0 0.00 1.2 0.00 0.1 0.24 LGALS9 lectin, galactoside-binding, soluble, 9
10500335 1.0 0.00 2.2 0.00 0.1 0.31 FCGR1A Fc fragment of IgG, high affinity Ia,
receptor (CD64)
10566578 1.0 0.00 1.4 0.00 0.2 0.19 Gm8979 very large inducible GTPase 1
pseudogene
10344121 1.0 0.01 0.0 0.94 -0.5 0.44
10397975 1.0 0.00 1.7 0.00 0.4 0.00 IFI27 interferon, alpha-inducible protein 27
10517165 1.0 0.00 3.0 0.00 1.0 0.00 Cd52 CD52 antigen
10338178 1.0 0.00 1.2 0.00 0.2 0.61
10344301 1.0 0.04 0.5 0.24 0.0 0.98
10491091 1.0 0.01 1.5 0.00 0.5 0.06 TNFSF10 tumor necrosis factor (ligand)
superfamily, member 10
10534909 1.0 0.00 1.8 0.00 0.3 0.02 SP110 SP110 nuclear body protein
10467136 1.0 0.00 2.3 0.00 0.1 0.56 CH25H cholesterol 25-hydroxylase
10566571 1.0 0.00 1.3 0.00 0.2 0.17
10341044 1.0 0.02 0.3 0.55 -0.5 0.48
10581378 1.0 0.00 2.7 0.00 0.2 0.01 PSMB10 proteasome (prosome, macropain)
subunit, beta type, 10
10531972 1.0 0.00 2.7 0.00 0.2 0.18 Gbp8 guanylate-binding protein 8
10343925 1.0 0.03 -0.3 0.46 -0.5 0.14
10579532 1.0 0.00 1.7 0.00 0.0 0.89 BST2 bone marrow stromal cell antigen 2
10340164 1.0 0.01 1.3 0.00 0.1 0.72
10406928 1.0 0.00 2.8 0.00 0.9 0.01 CD180 CD180 molecule
10360070 1.0 0.00 1.7 0.00 0.5 0.01 FCER1G Fc fragment of IgE, high affinity I,
receptor for; gamma polypeptide
10461614 1.0 0.00 1.4 0.00 -0.2 0.22 Ms4a6c membrane-spanning 4-domains,
subfamily A, member 6C
10533213 1.0 0.00 1.7 0.00 0.0 0.84 OAS3 2'-5'-oligoadenylate synthetase 3,
100kDa
10584047 -1.0 0.03 -0.5 0.08 -0.3 0.18 ADAMTS8 ADAM metallopeptidase with
thrombospondin type 1 motif, 8
10340043 -1.0 0.03 -0.3 0.37 0.0 0.90
10585390 -1.0 0.00 -0.2 0.45 -0.2 0.72 Sln sarcolipin
10463551 -1.0 0.02 -0.8 0.37 -0.4 0.25 ELOVL3 ELOVL fatty acid elongase 3
10558673 -1.0 0.01 -0.5 0.32 -0.1 0.87 CYP2E1 cytochrome P450, family 2,
subfamily E, polypeptide 1
10490913 -1.0 0.04 -0.4 0.56 -0.6 0.10 CA3 carbonic anhydrase III, muscle
specific
10581605 -1.0 0.00 0.0 0.94 0.0 0.88 HP haptoglobin
10340401 -1.1 0.00 -0.2 0.52 0.2 0.65
10341006 -1.2 0.01 0.6 0.28 0.8 0.11
10438801 -1.3 0.03 -0.7 0.34 -0.3 0.74 FGF12 fibroblast growth factor 12
10343452 -1.4 0.02 0.4 0.31 0.5 0.51
10438813 -1.5 0.02 -0.3 0.67 -0.3 0.70 Mir690 microRNA 690
10495306 -1.5 0.04 -0.8 0.38 -0.2 0.83 MYBPHL myosin binding protein H-like
10384044 -1.5 0.05 -1.1 0.35 -0.3 0.74 MYL7 myosin, light chain 7, regulatory
10559698 -1.6 0.01 -0.5 0.42 0.2 0.80 SGK110 putative uncharacterized
serine/threonine-protein kinase
SgK110-like

48
Online Table 9. List of differentially expressed genes on 7 dpi (log ratio > 1 or < -1, P value < 0.05) 4 dpi 7 dpi 60 dpi
Probe Set ID Log ratio P values (t-test) Log ratio P values (t-test) Log ratio P values (t-test) Symbol Entrez Gene Name
10455970 6.6 0.00 6.8 0.00 2.8 0.00
10459066 3.9 0.00 6.3 0.00 1.0 0.00 Gm4841 predicted gene 4841
10608681 5.1 0.00 6.3 0.00 1.4 0.00 Gm4841 predicted gene 4841
10376324 3.8 0.00 5.4 0.00 1.0 0.00 Gm12250 predicted gene 12250
10385507 2.5 0.00 5.3 0.00 0.3 0.02 9930111J21Rik1/Gm12185 predicted gene 12185
10420308 2.7 0.00 5.1 0.00 0.1 0.44 GZMB granzyme B (granzyme 2, cytotoxic
T-lymphocyte-associated serine
esterase 1)
10531407 2.9 0.00 4.9 0.00 1.0 0.00 CXCL9 chemokine (C-X-C motif) ligand 9
10376326 3.4 0.00 4.9 0.00 0.7 0.01
10569102 4.1 0.00 4.6 0.00 0.1 0.72 IRF7 interferon regulatory factor 7
10385500 2.6 0.00 4.3 0.00 0.4 0.06 IRGM immunity-related GTPase family, M
10455961 3.3 0.00 4.3 0.00 1.1 0.00 Iigp1 interferon inducible GTPase 1
10462621 4.1 0.00 4.2 0.00 0.7 0.03 IFIT3 interferon-induced protein with
tetratricopeptide repeats 3
10462390 2.5 0.00 4.1 0.00 0.4 0.08 CD274 CD274 molecule
10461594 2.8 0.00 4.0 0.00 0.0 0.91 Ms4a4b (includes others) membrane-spanning 4-domains,
subfamily A, member 4B
10462618 3.7 0.00 4.0 0.00 0.6 0.03 IFIT3 interferon-induced protein with
tetratricopeptide repeats 3
10552406 1.3 0.00 4.0 0.00 0.2 0.05 NKG7 natural killer cell group 7 sequence
10385533 2.4 0.00 3.9 0.00 0.6 0.04 9930111J21Rik1/Gm12185 predicted gene 12185
10455954 2.8 0.00 3.9 0.00 0.6 0.03 Gm4951 predicted gene 4951
10462623 3.7 0.00 3.8 0.00 0.4 0.18 IFIT1B interferon-induced protein with
tetratricopeptide repeats 1B
10531724 2.3 0.00 3.8 0.00 0.7 0.00 PLAC8 placenta-specific 8
10385518 2.3 0.00 3.8 0.00 0.7 0.03 Tgtp1/Tgtp2 T cell specific GTPase 1
10502791 3.4 0.00 3.7 0.00 0.6 0.02 IFI44 interferon-induced protein 44
10496555 1.8 0.00 3.7 0.00 0.4 0.09 GBP2 guanylate binding protein 2,
interferon-inducible
10462613 3.2 0.00 3.7 0.00 0.3 0.05 IFIT2 interferon-induced protein with
tetratricopeptide repeats 2
10496580 2.3 0.00 3.5 0.00 0.3 0.02 GBP4 guanylate binding protein 4
10389207 2.0 0.00 3.5 0.00 0.2 0.02 CCL5 chemokine (C-C motif) ligand 5
10532019 1.8 0.00 3.5 0.00 0.2 0.15 Gbp6 (includes others) guanylate binding protein 6
10541307 3.2 0.00 3.5 0.00 0.2 0.15 USP18 ubiquitin specific peptidase 18
10379535 0.8 0.00 3.5 0.00 0.9 0.01 Ccl8 chemokine (C-C motif) ligand 8
10608646 2.4 0.00 3.4 0.00 0.8 0.00
10531415 2.2 0.00 3.4 0.00 0.3 0.05 CXCL10 chemokine (C-X-C motif) ligand 10
10598976 1.1 0.01 3.3 0.00 0.2 0.48 TIMP1 TIMP metallopeptidase inhibitor 1
10379511 1.8 0.00 3.3 0.00 -0.1 0.43 Ccl2 chemokine (C-C motif) ligand 2
10574145 1.9 0.00 3.3 0.00 0.4 0.01 NLRC5 NLR family, CARD domain
containing 5
10379518 1.9 0.00 3.3 0.00 -0.1 0.70 CCL7 chemokine (C-C motif) ligand 7
10455957 2.1 0.00 3.3 0.00 0.5 0.06
10450325 1.7 0.00 3.3 0.00 0.7 0.00 CFB complement factor B
10496592 1.8 0.00 3.3 0.00 0.5 0.05
10351509 1.1 0.00 3.2 0.00 0.6 0.01 FCGR3A Fc fragment of IgG, low affinity IIIa,
receptor (CD16a)
10531994 2.0 0.00 3.2 0.00 0.2 0.26
10351873 2.3 0.00 3.2 0.00 0.2 0.09 Ifi204 (includes others) interferon activated gene 204
10531987 1.8 0.00 3.2 0.00 0.4 0.09 Gbp6 (includes others) guanylate binding protein 6
10420483 2.2 0.00 3.1 0.00 0.2 0.14 Phf11a/Phf11b PHD finger protein 11A
10444258 1.2 0.00 3.1 0.00 0.3 0.00 PSMB8 proteasome (prosome, macropain)
subunit, beta type, 8
10593015 0.4 0.00 3.1 0.00 0.3 0.11 CD3G CD3g molecule, gamma (CD3-TCR
complex)
10590635 1.1 0.00 3.1 0.00 0.5 0.03 CCR5 chemokine (C-C motif) receptor 5
(gene/pseudogene)
10598013 1.1 0.00 3.1 0.00 0.5 0.03 CCR5 chemokine (C-C motif) receptor 5
(gene/pseudogene)
10490150 1.7 0.00 3.1 0.00 0.2 0.07 ZBP1 Z-DNA binding protein 1
10398039 1.1 0.00 3.1 0.00 0.3 0.02
10574149 1.8 0.00 3.1 0.00 0.5 0.00 NLRC5 NLR family, CARD domain
containing 5
10517165 1.0 0.00 3.0 0.00 1.0 0.00 Cd52 CD52 antigen
10379636 1.8 0.00 3.0 0.00 0.0 0.80 SLFN12L schlafen family member 12-like
10496569 1.9 0.00 3.0 0.00 0.5 0.03 GBP7 guanylate binding protein 7
10346191 1.7 0.00 3.0 0.00 0.4 0.00 STAT1 signal transducer and activator of
transcription 1, 91kDa
10375515 1.5 0.00 3.0 0.00 0.2 0.02
10399710 3.0 0.00 2.9 0.00 0.3 0.13 RSAD2 radical S-adenosyl methionine
domain containing 2
10502801 2.3 0.00 2.9 0.00 0.3 0.21 IFI44L interferon-induced protein 44-like
10461605 0.8 0.00 2.9 0.00 0.2 0.00 Ms4a4b (includes others) membrane-spanning 4-domains,
subfamily A, member 4B
10444244 1.4 0.00 2.8 0.00 0.3 0.01 TAP1 transporter 1, ATP-binding cassette,
sub-family B (MDR/TAP)
10406928 1.0 0.00 2.8 0.00 0.9 0.01 CD180 CD180 molecule
10531980 1.4 0.00 2.8 0.00 0.4 0.03 Gbp6 (includes others) guanylate binding protein 6
10574135 1.4 0.00 2.8 0.00 0.4 0.03 NLRC5 NLR family, CARD domain
containing 5
10420488 2.3 0.00 2.8 0.00 0.2 0.44 PHF11 PHD finger protein 11
10531420 1.4 0.00 2.8 0.00 0.1 0.28 Cxcl11 chemokine (C-X-C motif) ligand 11

49
10538590 1.7 0.00 2.7 0.00 0.3 0.14 HERC6 HECT and RLD domain containing
E3 ubiquitin protein ligase family
member 6
10531972 1.0 0.00 2.7 0.00 0.2 0.18 Gbp8 guanylate-binding protein 8
10574098 1.7 0.00 2.7 0.00 0.5 0.00 NLRC5 NLR family, CARD domain
containing 5
10450075 1.7 0.00 2.7 0.00 0.7 0.00 HLA-B major histocompatibility complex,
class I, B
10512470 1.5 0.00 2.7 0.00 0.9 0.00 CD72 CD72 molecule
10444814 1.6 0.00 2.7 0.00 0.7 0.00 HLA-B major histocompatibility complex,
class I, B
10412211 1.3 0.00 2.7 0.00 0.0 0.64 GZMA granzyme A (granzyme 1, cytotoxic
T-lymphocyte-associated serine
esterase 3)
10563597 1.6 0.00 2.7 0.00 -0.2 0.23 Saa3 serum amyloid A 3
10581378 1.0 0.00 2.7 0.00 0.2 0.01 PSMB10 proteasome (prosome, macropain)
subunit, beta type, 10
10389231 1.2 0.00 2.7 0.00 0.5 0.20 CCL3L1/CCL3L3 chemokine (C-C motif) ligand 3-like
1
10360173 1.1 0.00 2.7 0.00 0.5 0.01 SLAMF7 SLAM family member 7
10450161 0.2 0.19 2.6 0.00 1.7 0.00 HLA-DRA major histocompatibility complex,
class II, DR alpha
10434778 2.0 0.00 2.6 0.00 0.2 0.51 RTP4 receptor (chemosensory) transporter
protein 4
10379633 1.4 0.00 2.6 0.00 0.0 0.98 Slfn1 schlafen 1
10496539 1.6 0.00 2.6 0.00 0.5 0.01 GBP5 guanylate binding protein 5
10523717 0.4 0.03 2.6 0.00 2.0 0.00 SPP1 secreted phosphoprotein 1
10590631 0.4 0.00 2.6 0.00 0.3 0.10 CCR2 chemokine (C-C motif) receptor 2
10439249 1.5 0.00 2.6 0.00 0.3 0.06 PARP14 poly (ADP-ribose) polymerase
family, member 14
10524621 1.9 0.00 2.6 0.00 0.2 0.23 Oasl2 2'-5' oligoadenylate synthetase-like 2
10574139 1.3 0.00 2.5 0.00 0.4 0.00 NLRC5 NLR family, CARD domain
containing 5
10461721 0.7 0.00 2.5 0.00 1.1 0.00 MPEG1 macrophage expressed 1
10513739 0.6 0.00 2.5 0.00 0.3 0.14 TNC tenascin C
10456005 0.1 0.47 2.5 0.00 1.6 0.00 CD74 CD74 molecule, major
histocompatibility complex, class II
invariant chain
10444291 0.1 0.46 2.5 0.00 1.1 0.00 HLA-DQB1 major histocompatibility complex,
class II, DQ beta 1
10541564 0.7 0.00 2.5 0.00 0.3 0.07 Clec4a3 C-type lectin domain family 4,
member a3
10574104 1.3 0.00 2.5 0.00 0.4 0.00 NLRC5 NLR family, CARD domain
containing 5
10533246 1.7 0.00 2.5 0.00 0.3 0.20 OAS1 2'-5'-oligoadenylate synthetase 1,
40/46kDa
10542164 0.5 0.00 2.5 0.00 1.1 0.00 CLEC12A C-type lectin domain family 12,
member A
10450694 1.3 0.00 2.5 0.00 0.6 0.00 H2-T22 histocompatibility 2, T region locus
22
10574157 1.3 0.00 2.4 0.00 0.2 0.06 NLRC5 NLR family, CARD domain
containing 5
10450154 0.1 0.69 2.4 0.00 1.5 0.00 HLA-DQA1 major histocompatibility complex,
class II, DQ alpha 1
10450145 0.8 0.00 2.4 0.00 0.3 0.00 PSMB9 proteasome (prosome, macropain)
subunit, beta type, 9
10351880 2.1 0.00 2.4 0.00 0.2 0.24 Pydc3/Pydc4 pyrin domain containing 4
10571984 1.8 0.00 2.4 0.00 0.4 0.05 DDX60 DEAD (Asp-Glu-Ala-Asp) box
polypeptide 60
10608650 1.2 0.00 2.4 0.00 0.5 0.00
10393573 1.7 0.00 2.4 0.00 0.2 0.47 LGALS3BP lectin, galactoside-binding, soluble, 3
binding protein
10467136 1.0 0.00 2.3 0.00 0.1 0.56 CH25H cholesterol 25-hydroxylase
10378068 1.7 0.00 2.3 0.00 0.2 0.07 XAF1 XIAP associated factor 1
10494271 0.9 0.00 2.3 0.00 1.0 0.01 CTSS cathepsin S
10430344 0.8 0.00 2.3 0.00 0.3 0.00 IL2RB interleukin 2 receptor, beta
10574102 1.5 0.00 2.3 0.00 0.4 0.01 NLRC5 NLR family, CARD domain
containing 5
10542214 0.9 0.00 2.3 0.00 0.3 0.01 KLRD1 killer cell lectin-like receptor
subfamily D, member 1
10548409 0.6 0.00 2.3 0.00 0.3 0.04 KLRC1 killer cell lectin-like receptor
subfamily C, member 1
10566366 1.7 0.00 2.3 0.00 -0.1 0.80 Trim30a/Trim30d tripartite motif-containing 30A
10545231 0.1 0.56 2.3 0.00 1.2 0.02
10398075 1.5 0.00 2.3 0.00 0.9 0.01 SERPINA3 serpin peptidase inhibitor, clade A
(alpha-1 antiproteinase, antitrypsin),
member 3
10450682 1.2 0.00 2.3 0.00 0.5 0.00 HLA-E major histocompatibility complex,
class I, E
10499899 0.3 0.02 2.3 0.00 0.4 0.00 Sprr1a small proline-rich protein 1A
10566358 1.5 0.00 2.3 0.00 0.3 0.07 Trim30a/Trim30d tripartite motif-containing 30A
10358408 0.5 0.00 2.3 0.00 1.1 0.00 RGS1 regulator of G-protein signaling 1
10500335 1.0 0.00 2.2 0.00 0.1 0.31 FCGR1A Fc fragment of IgG, high affinity Ia,
receptor (CD64)
10358224 0.5 0.00 2.2 0.00 0.4 0.02 PTPRC protein tyrosine phosphatase,
receptor type, C
10376060 0.6 0.01 2.2 0.00 0.3 0.02 IRF1 interferon regulatory factor 1
10441233 1.9 0.00 2.2 0.00 0.1 0.25 Mx1/Mx2 myxovirus (influenza virus)
resistance 1

50
10437224 2.1 0.00 2.2 0.00 0.1 0.44 Mx1/Mx2 myxovirus (influenza virus)
resistance 1
10360370 1.5 0.00 2.2 0.00 0.0 0.85 Ifi204 (includes others) interferon activated gene 204
10482802 0.1 0.41 2.2 0.00 0.2 0.32 CYTIP cytohesin 1 interacting protein
10483110 1.4 0.00 2.1 0.00 0.2 0.12 IFIH1 interferon induced with helicase C
domain 1
10391207 1.6 0.00 2.1 0.00 0.2 0.25 DHX58 DEXH (Asp-Glu-X-His) box
polypeptide 58
10360398 1.7 0.00 2.1 0.00 0.1 0.34 Ifi202b interferon activated gene 202B
10469816 0.5 0.00 2.1 0.00 0.7 0.01 IL1RN interleukin 1 receptor antagonist
10586865 0.4 0.05 2.1 0.00 0.4 0.01 ALDH1A2 aldehyde dehydrogenase 1 family,
member A2
10416437 0.7 0.00 2.1 0.00 0.5 0.03 LCP1 lymphocyte cytosolic protein 1 (L-
plastin)
10522788 0.6 0.00 2.1 0.00 1.4 0.00 STAP1 signal transducing adaptor family
member 1
10608680 1.1 0.00 2.1 0.00 0.5 0.00 H2-T22 histocompatibility 2, T region locus
22
10574137 0.8 0.00 2.0 0.00 0.1 0.05 NLRC5 NLR family, CARD domain
containing 5
10541555 0.7 0.00 2.0 0.00 0.2 0.10 Clec4a1 C-type lectin domain family 4,
member a1
10439268 1.4 0.00 2.0 0.00 0.3 0.07 DTX3L deltex 3-like (Drosophila)
10383198 1.4 0.00 2.0 0.00 0.2 0.28
10489107 0.9 0.00 2.0 0.00 0.2 0.11 SAMHD1 SAM domain and HD domain 1
10547664 0.7 0.01 2.0 0.00 -0.1 0.75 CLEC4E C-type lectin domain family 4,
member E
10473356 1.2 0.00 2.0 0.00 0.2 0.16 UBE2L6 ubiquitin-conjugating enzyme E2L 6
10545672 1.1 0.00 2.0 0.00 -0.2 0.02 MTHFD2 methylenetetrahydrofolate
dehydrogenase (NADP+ dependent)
2, methenyltetrahydrofolate
cyclohydrolase
10501063 0.9 0.00 2.0 0.00 0.6 0.03 CD53 CD53 molecule
10548333 0.5 0.02 2.0 0.00 0.1 0.18 CD69 CD69 molecule
10346168 0.3 0.02 2.0 0.00 0.3 0.00 STAT4 signal transducer and activator of
transcription 4
10444229 -0.1 0.50 2.0 0.00 0.5 0.00 HLA-DMA major histocompatibility complex,
class II, DM alpha
10383202 1.2 0.00 2.0 0.00 0.2 0.11 Rnf213 ring finger protein 213
10383212 1.3 0.00 2.0 0.00 0.1 0.08 Rnf213 ring finger protein 213
10427628 0.2 0.09 2.0 0.00 1.1 0.00 IL7R interleukin 7 receptor
10450699 1.2 0.00 2.0 0.00 0.5 0.00 HLA-F major histocompatibility complex,
class I, F
10383200 1.3 0.00 2.0 0.00 0.2 0.26
10582997 1.1 0.00 2.0 0.00 0.3 0.09 CASP4 caspase 4, apoptosis-related cysteine
peptidase
10363070 0.5 0.00 2.0 0.00 0.7 0.04 Gp49a/Lilrb4 leukocyte immunoglobulin-like
receptor, subfamily B, member 4
10566050 0.9 0.00 2.0 0.00 0.1 0.08 IL18BP interleukin 18 binding protein
10387985 0.8 0.00 2.0 0.00 0.2 0.07 SCIMP SLP adaptor and CSK interacting
membrane protein
10379530 0.9 0.00 1.9 0.00 0.1 0.52 CCL2 chemokine (C-C motif) ligand 2
10383204 1.1 0.00 1.9 0.00 0.2 0.12 Rnf213 ring finger protein 213
10347928 1.2 0.00 1.9 0.00 0.3 0.13 SP110 SP110 nuclear body protein
10582874 1.2 0.00 1.9 0.00 0.3 0.13 SP110 SP110 nuclear body protein
10383168 1.2 0.00 1.9 0.00 0.2 0.04
10439009 1.6 0.00 1.9 0.00 0.3 0.16 APOD apolipoprotein D
10466210 1.3 0.00 1.9 0.00 -0.2 0.25 MS4A6A membrane-spanning 4-domains,
subfamily A, member 6A
10383214 1.2 0.00 1.9 0.00 0.2 0.15 Rnf213 ring finger protein 213
10590623 0.2 0.12 1.9 0.00 0.4 0.03 CXCR6 chemokine (C-X-C motif) receptor 6
10444821 1.2 0.00 1.9 0.00 0.3 0.02 H2-Q5 histocompatibility 2, Q region locus
5
10516620 0.3 0.01 1.9 0.00 0.0 0.71 LCK lymphocyte-specific protein tyrosine
kinase
10576034 0.3 0.01 1.9 0.00 0.2 0.01 IRF8 interferon regulatory factor 8
10543067 0.9 0.00 1.9 0.00 -0.2 0.35 ASNS asparagine synthetase (glutamine-
hydrolyzing)
10385504 1.3 0.00 1.9 0.00 0.1 0.67 Gm5431 predicted gene 5431
10512067 1.5 0.00 1.9 0.00 0.2 0.27 DDX58 DEAD (Asp-Glu-Ala-Asp) box
polypeptide 58
10371082 0.2 0.17 1.9 0.00 -0.5 0.03 NMRK2 nicotinamide riboside kinase 2
10346799 0.0 0.94 1.9 0.00 0.2 0.05 ICOS inducible T-cell co-stimulator
10375145 0.7 0.00 1.9 0.00 0.2 0.21 LCP2 lymphocyte cytosolic protein 2 (SH2
domain containing leukocyte protein
of 76kDa)
10450675 1.3 0.00 1.9 0.00 0.3 0.06 H2-T24 histocompatibility 2, T region locus
24
10451287 1.2 0.00 1.9 0.00 0.1 0.54
10383206 1.5 0.00 1.9 0.00 0.2 0.40
10544133 1.2 0.00 1.9 0.00 0.2 0.10 PARP12 poly (ADP-ribose) polymerase
family, member 12
10383208 1.3 0.00 1.9 0.00 0.1 0.52
10587323 0.3 0.07 1.9 0.00 0.0 0.65
10547621 0.7 0.00 1.9 0.00 0.6 0.06 APOBEC1 apolipoprotein B mRNA editing
enzyme, catalytic polypeptide 1
10578264 0.8 0.00 1.9 0.00 0.2 0.43 MSR1 macrophage scavenger receptor 1
10497358 0.4 0.01 1.8 0.00 0.1 0.29 Sirpb1a (includes others) signal-regulatory protein beta 1A
10508392 0.6 0.00 1.8 0.00 0.1 0.47 RNF19B ring finger protein 19B

51
10383196 1.2 0.00 1.8 0.00 0.1 0.40 Rnf213 ring finger protein 213
10404606 0.8 0.01 1.8 0.00 0.8 0.01 LY86 lymphocyte antigen 86
10416837 0.5 0.00 1.8 0.00 0.1 0.51 Irg1 immunoresponsive gene 1
10384458 0.5 0.02 1.8 0.00 0.6 0.04 PLEK pleckstrin
10430174 0.9 0.00 1.8 0.00 0.0 0.72 Apol9a/Apol9b apolipoprotein L 9b
10422760 0.3 0.01 1.8 0.00 0.3 0.08 FYB FYN binding protein
10444780 0.9 0.00 1.8 0.00 0.3 0.00 HLA-B major histocompatibility complex,
class I, B
10587683 0.2 0.03 1.8 0.00 0.5 0.02 BCL2A1 BCL2-related protein A1
10494978 0.5 0.01 1.8 0.00 0.1 0.37 PTPN22 protein tyrosine phosphatase, non-
receptor type 22 (lymphoid)
10548345 0.6 0.00 1.8 0.00 0.1 0.44
10383152 1.2 0.00 1.8 0.00 0.2 0.18 Rnf213 ring finger protein 213
10466127 0.8 0.01 1.8 0.00 0.3 0.02 AW112010 expressed sequence AW112010
10534909 1.0 0.00 1.8 0.00 0.3 0.02 SP110 SP110 nuclear body protein
10566144 1.1 0.00 1.8 0.00 0.0 0.72 TRIM21 tripartite motif containing 21
10547657 0.6 0.01 1.8 0.00 0.7 0.04 C3AR1 complement component 3a receptor
1
10341146 1.0 0.07 1.8 0.00 0.3 0.23
10398907 0.6 0.00 1.8 0.00 0.2 0.15 PLD4 phospholipase D family, member 4
10364262 0.3 0.00 1.7 0.00 0.6 0.05 ITGB2 integrin, beta 2 (complement
component 3 receptor 3 and 4
subunit)
10383233 1.1 0.00 1.7 0.00 0.1 0.33 Rnf213 ring finger protein 213
10467578 0.6 0.00 1.7 0.00 0.3 0.00 PIK3AP1 phosphoinositide-3-kinase adaptor
protein 1
10538979 0.0 0.62 1.7 0.00 0.1 0.22 CD8B CD8b molecule
10351658 0.3 0.03 1.7 0.00 0.3 0.02 CD48 CD48 molecule
10583008 0.6 0.00 1.7 0.00 0.8 0.00 CASP12 caspase 12 (gene/pseudogene)
10533213 1.0 0.00 1.7 0.00 0.0 0.84 OAS3 2'-5'-oligoadenylate synthetase 3,
100kDa
10579532 1.0 0.00 1.7 0.00 0.0 0.89 BST2 bone marrow stromal cell antigen 2
10601456 0.4 0.00 1.7 0.00 0.1 0.39 Gm6377 predicted gene 6377
10367224 1.1 0.00 1.7 0.00 0.1 0.48 STAT2 signal transducer and activator of
transcription 2, 113kDa
10473125 0.3 0.00 1.7 0.00 0.3 0.01 ITGA4 integrin, alpha 4 (antigen CD49D,
alpha 4 subunit of VLA-4 receptor)
10577655 0.7 0.00 1.7 0.00 -0.1 0.46 IDO1 indoleamine 2,3-dioxygenase 1
10587331 0.2 0.09 1.7 0.00 0.0 0.49
10414360 0.2 0.02 1.7 0.00 1.3 0.00 LGALS3 lectin, galactoside-binding, soluble, 3
10420030 0.5 0.00 1.7 0.00 0.1 0.17 PSME2 proteasome (prosome, macropain)
activator subunit 2 (PA28 beta)
10601385 0.8 0.00 1.7 0.00 0.5 0.05 Tlr13 toll-like receptor 13
10404429 0.5 0.01 1.7 0.00 0.3 0.21 SERPINB9 serpin peptidase inhibitor, clade B
(ovalbumin), member 9
10363082 0.7 0.00 1.7 0.00 0.7 0.03 Gp49a/Lilrb4 leukocyte immunoglobulin-like
receptor, subfamily B, member 4
10466314 1.1 0.00 1.7 0.00 0.0 0.67
10581813 0.8 0.00 1.7 0.00 -0.1 0.44 MLKL mixed lineage kinase domain-like
10532744 0.3 0.01 1.7 0.00 0.2 0.02 SELPLG selectin P ligand
10372410 0.5 0.00 1.7 0.00 1.1 0.00 GLIPR1 GLI pathogenesis-related 1
10397975 1.0 0.00 1.7 0.00 0.4 0.00 IFI27 interferon, alpha-inducible protein 27
10452980 1.5 0.00 1.7 0.00 0.1 0.52 EIF2AK2 eukaryotic translation initiation
factor 2-alpha kinase 2
10385511 0.8 0.00 1.7 0.00 0.2 0.12 Psme2b protease (prosome, macropain)
activator subunit 2B
10554240 1.3 0.00 1.7 0.00 0.1 0.17 ISG20 interferon stimulated exonuclease
gene 20kDa
10360070 1.0 0.00 1.7 0.00 0.5 0.01 FCER1G Fc fragment of IgE, high affinity I,
receptor for; gamma polypeptide
10559486 0.3 0.04 1.7 0.00 0.6 0.01 LAIR1 leukocyte-associated
immunoglobulin-like receptor 1
10402347 1.2 0.00 1.7 0.00 -0.1 0.44 IFI27L2 interferon, alpha-inducible protein
27-like 2
10547976 0.4 0.03 1.7 0.00 0.2 0.16 TAPBPL TAP binding protein-like
10595633 0.3 0.00 1.7 0.00 0.5 0.01 BCL2A1 BCL2-related protein A1
10477250 0.6 0.00 1.7 0.00 0.2 0.27 HCK hemopoietic cell kinase
10497372 0.1 0.25 1.6 0.00 0.1 0.61 Gm5150 predicted gene 5150
10360373 1.4 0.00 1.6 0.00 0.3 0.07 Pydc3/Pydc4 pyrin domain containing 4
10341698 0.7 0.03 1.6 0.00 -0.2 0.30
10458314 0.3 0.11 1.6 0.00 0.2 0.22 TMEM173 transmembrane protein 173
10388958 0.5 0.00 1.6 0.00 0.4 0.08
10383210 1.1 0.00 1.6 0.00 0.0 0.92 Rnf213 ring finger protein 213
10603551 0.4 0.01 1.6 0.00 1.2 0.00 CYBB cytochrome b-245, beta polypeptide
10351197 0.6 0.01 1.6 0.00 -0.2 0.37 SELL selectin L
10430372 0.3 0.04 1.6 0.00 0.2 0.05 RAC2 ras-related C3 botulinum toxin
substrate 2 (rho family, small GTP
binding protein Rac2)
10466200 0.4 0.00 1.6 0.00 0.6 0.01 MS4A7 membrane-spanning 4-domains,
subfamily A, member 7
10424676 1.1 0.00 1.6 0.00 0.1 0.52 LY6E lymphocyte antigen 6 complex, locus
E
10533198 1.3 0.00 1.6 0.00 0.3 0.11 OAS2 2'-5'-oligoadenylate synthetase 2,
69/71kDa
10385118 0.4 0.00 1.6 0.00 0.4 0.01 DOCK2 dedicator of cytokinesis 2
10446253 0.4 0.00 1.6 0.00 0.2 0.05 VAV1 vav 1 guanine nucleotide exchange
factor
10525158 1.3 0.00 1.6 0.00 0.0 0.92 Oas1b 2'-5' oligoadenylate synthetase 1B
10574163 0.7 0.00 1.6 0.00 0.1 0.09 NLRC5 NLR family, CARD domain

52
containing 5
10598004 0.1 0.63 1.6 0.00 0.2 0.15 CCR1 chemokine (C-C motif) receptor 1
10601416 0.1 0.53 1.6 0.00 0.1 0.20 P2RY10 purinergic receptor P2Y, G-protein
coupled, 10
10587690 0.3 0.00 1.6 0.00 0.4 0.01 BCL2A1 BCL2-related protein A1
10516966 0.6 0.01 1.6 0.00 0.1 0.20 THEMIS2 thymocyte selection associated
family member 2
10549647 0.7 0.00 1.6 0.00 0.3 0.02 NCR1 natural cytotoxicity triggering
receptor 1
10356278 0.8 0.00 1.6 0.00 0.2 0.02 SP110 SP110 nuclear body protein
10444830 0.9 0.00 1.6 0.00 0.4 0.00 H2-K2/H2-Q9 histocompatibility 2, K region locus
2
10542140 0.5 0.01 1.6 0.00 0.2 0.19 Klrb1f killer cell lectin-like receptor
subfamily B member 1F
10444298 0.0 0.66 1.6 0.00 0.8 0.00 HLA-DRB1 major histocompatibility complex,
class II, DR beta 1
10544588 -0.1 0.52 1.6 0.00 0.2 0.02 GIMAP5 GTPase, IMAP family member 5
10389134 0.7 0.01 1.6 0.00 0.2 0.07 SLFN13 schlafen family member 13
10557862 0.3 0.01 1.5 0.00 0.2 0.28 ITGAM integrin, alpha M (complement
component 3 receptor 3 subunit)
10461622 0.7 0.00 1.5 0.00 -0.2 0.34 Ms4a6b membrane-spanning 4-domains,
subfamily A, member 6B
10381408 0.8 0.00 1.5 0.00 0.1 0.31 IFI35 interferon-induced protein 35
10574151 0.7 0.00 1.5 0.00 0.0 0.86 NLRC5 NLR family, CARD domain
containing 5
10344031 0.6 0.01 1.5 0.00 0.4 0.15
10383194 1.1 0.01 1.5 0.00 0.1 0.70 Rnf213 ring finger protein 213
10539135 0.4 0.01 1.5 0.00 0.5 0.04 CAPG capping protein (actin filament),
gelsolin-like
10379630 0.9 0.00 1.5 0.00 0.2 0.05 Slfn2 schlafen 2
10343267 0.4 0.13 1.5 0.00 0.4 0.15
10460767 0.5 0.01 1.5 0.00 0.1 0.31 BATF2 basic leucine zipper transcription
factor, ATF-like 2
10495186 0.4 0.00 1.5 0.00 0.3 0.02 AI504432 expressed sequence AI504432
10383192 1.0 0.00 1.5 0.00 -0.1 0.56
10473809 0.7 0.00 1.5 0.00 0.4 0.08 SPI1 spleen focus forming virus (SFFV)
proviral integration oncogene
10343969 0.8 0.04 1.5 0.00 0.0 0.92
10444268 0.6 0.00 1.5 0.00 0.2 0.00 TAP2 transporter 2, ATP-binding cassette,
sub-family B (MDR/TAP)
10578493 1.1 0.00 1.5 0.00 0.1 0.39 TLR3 toll-like receptor 3
10559467 0.3 0.02 1.5 0.00 0.4 0.06
10360382 1.1 0.00 1.5 0.00 -0.1 0.38 Ifi204 (includes others) interferon activated gene 204
10557591 0.3 0.02 1.5 0.00 0.1 0.24 ITGAL integrin, alpha L (antigen CD11A
(p180), lymphocyte function-
associated antigen 1; alpha
polypeptide)
10566583 0.8 0.00 1.5 0.00 0.2 0.16 Gm8995 predicted gene 8995
10351691 0.2 0.02 1.5 0.00 0.1 0.15 SLAMF6 SLAM family member 6
10342250 0.6 0.05 1.5 0.00 -0.2 0.67
10524631 1.6 0.00 1.5 0.00 0.0 0.92 OASL 2'-5'-oligoadenylate synthetase-like
10508663 0.3 0.05 1.5 0.00 0.5 0.02 LAPTM5 lysosomal protein transmembrane 5
10352000 0.2 0.14 1.5 0.00 0.2 0.17 KMO kynurenine 3-monooxygenase
(kynurenine 3-hydroxylase)
10395039 1.9 0.00 1.5 0.00 0.2 0.25 CMPK2 cytidine monophosphate (UMP-
CMP) kinase 2, mitochondrial
10385513 0.8 0.00 1.5 0.00 0.2 0.15 9930111J21Rik2 RIKEN cDNA 9930111J21 gene 2
10425049 0.9 0.00 1.5 0.00 0.0 0.97 Apol9a/Apol9b apolipoprotein L 9b
10339750 0.7 0.00 1.5 0.00 0.0 0.84
10534927 0.6 0.01 1.5 0.00 0.3 0.03 PILRA paired immunoglobin-like type 2
receptor alpha
10491091 1.0 0.01 1.5 0.00 0.5 0.06 TNFSF10 tumor necrosis factor (ligand)
superfamily, member 10
10343290 0.6 0.11 1.5 0.01 -0.1 0.85
10531737 0.3 0.03 1.5 0.00 0.4 0.00 HPSE heparanase
10392839 0.5 0.00 1.4 0.00 0.1 0.04 CD300E CD300e molecule
10606016 0.4 0.01 1.4 0.00 0.1 0.75 IL2RG interleukin 2 receptor, gamma
10341587 0.7 0.02 1.4 0.00 0.3 0.21
10588479 0.4 0.01 1.4 0.00 0.2 0.04 TLR9 toll-like receptor 9
10459772 0.4 0.04 1.4 0.00 0.0 0.66 LIPG lipase, endothelial
10427336 0.1 0.27 1.4 0.00 0.5 0.01 NCKAP1L NCK-associated protein 1-like
10429128 0.3 0.06 1.4 0.00 0.2 0.22 SLA Src-like-adaptor
10385526 0.8 0.00 1.4 0.00 0.2 0.13
10444236 0.0 0.56 1.4 0.00 0.4 0.00 HLA-DMB major histocompatibility complex,
class II, DM beta
10404061 0.2 0.05 1.4 0.00 0.1 0.65 HIST1H2BB histone cluster 1, H2bb
10593024 0.0 0.92 1.4 0.00 0.0 0.60 CD3E CD3e molecule, epsilon (CD3-TCR
complex)
10435457 0.9 0.00 1.4 0.00 0.2 0.08 PARP9 poly (ADP-ribose) polymerase
family, member 9
10347925 1.1 0.00 1.4 0.00 0.6 0.02 Csprs (includes others) component of Sp100-rs
10343468 0.7 0.02 1.4 0.00 0.1 0.40
10487208 0.5 0.00 1.4 0.00 0.3 0.05 ATP8B4 ATPase, class I, type 8B, member 4
10446282 0.5 0.01 1.4 0.00 0.4 0.04 EMR1 egf-like module containing, mucin-
like, hormone receptor-like 1
10347915 1.1 0.00 1.4 0.00 0.5 0.02 Csprs (includes others) component of Sp100-rs
10588786 0.6 0.00 1.4 0.00 0.1 0.00
10432640 0.3 0.02 1.4 0.00 0.0 0.99
10461614 1.0 0.00 1.4 0.00 -0.2 0.22 Ms4a6c membrane-spanning 4-domains,

53
subfamily A, member 6C
10338492 0.5 0.00 1.4 0.00 0.1 0.68
10466190 0.1 0.40 1.4 0.00 0.3 0.14 MS4A14 membrane-spanning 4-domains,
subfamily A, member 14
10533256 0.9 0.00 1.4 0.00 -0.1 0.61 OAS1 2'-5'-oligoadenylate synthetase 1,
40/46kDa
10574133 0.5 0.01 1.4 0.00 0.2 0.07 NLRC5 NLR family, CARD domain
containing 5
10425092 0.1 0.41 1.4 0.00 0.4 0.03 CYTH4 cytohesin 4
10397645 0.4 0.02 1.4 0.00 0.3 0.07 GPR65 G protein-coupled receptor 65
10407327 -0.2 0.33 1.4 0.00 0.2 0.30 EMB embigin
10416566 0.7 0.00 1.4 0.00 0.1 0.30 Epsti1 epithelial stromal interaction 1
(breast)
10415319 1.2 0.00 1.4 0.00 0.2 0.15 IRF9 interferon regulatory factor 9
10340317 0.5 0.03 1.4 0.00 0.0 0.84
10363475 0.5 0.01 1.4 0.00 -0.1 0.28 PRF1 perforin 1 (pore forming protein)
10541587 0.3 0.08 1.4 0.00 0.3 0.12 CLEC4A C-type lectin domain family 4,
member A
10486061 0.3 0.01 1.4 0.00 0.1 0.33 RASGRP1 RAS guanyl releasing protein 1
(calcium and DAG-regulated)
10494405 0.0 0.86 1.4 0.00 0.3 0.09
10342553 0.6 0.02 1.4 0.00 -0.1 0.48
10566578 1.0 0.00 1.4 0.00 0.2 0.19 Gm8979 very large inducible GTPase 1
pseudogene
10339951 0.4 0.12 1.4 0.00 0.1 0.65
10408239 0.0 0.90 1.3 0.00 0.3 0.08 HIST2H3C (includes
others)
histone cluster 2, H3c
10404065 0.0 0.86 1.3 0.00 0.3 0.08
10341222 0.4 0.01 1.3 0.00 0.2 0.27
10404049 0.0 0.78 1.3 0.00 0.3 0.09
10559446 0.1 0.35 1.3 0.00 0.1 0.38 LILRB3 leukocyte immunoglobulin-like
receptor, subfamily B (with TM and
ITIM domains), member 3
10404028 0.0 0.86 1.3 0.00 0.3 0.08
10568024 0.1 0.07 1.3 0.00 0.1 0.48 CORO1A coronin, actin binding protein, 1A
10412218 0.2 0.07 1.3 0.00 0.1 0.38 GZMK granzyme K (granzyme 3; tryptase
II)
10338116 0.5 0.01 1.3 0.00 0.1 0.25
10341395 0.6 0.01 1.3 0.00 0.1 0.25
10353844 0.2 0.05 1.3 0.00 0.3 0.00 Neurl3 neuralized homolog 3 homolog
(Drosophila)
10566571 1.0 0.00 1.3 0.00 0.2 0.17
10551883 0.4 0.02 1.3 0.00 0.7 0.01 TYROBP TYRO protein tyrosine kinase
binding protein
10362350 -0.1 0.59 1.3 0.00 0.1 0.60 THEMIS thymocyte selection associated
10374333 0.3 0.00 1.3 0.00 0.1 0.19 IKZF1 IKAROS family zinc finger 1
(Ikaros)
10574159 0.7 0.00 1.3 0.00 0.1 0.07 NLRC5 NLR family, CARD domain
containing 5
10408246 0.0 0.89 1.3 0.00 0.2 0.09
10498345 0.1 0.38 1.3 0.00 0.0 0.92 GPR171 G protein-coupled receptor 171
10403941 0.0 0.71 1.3 0.00 0.3 0.09
10439527 0.3 0.01 1.3 0.00 0.1 0.40 TIGIT T cell immunoreceptor with Ig and
ITIM domains
10408083 0.0 0.94 1.3 0.00 0.3 0.09
10359181 1.2 0.00 1.3 0.00 0.3 0.03 TOR3A torsin family 3, member A
10541683 0.6 0.02 1.3 0.00 0.6 0.01
10465059 0.4 0.00 1.3 0.00 0.1 0.45 CTSW cathepsin W
10494402 0.0 0.87 1.3 0.00 0.3 0.06
10443980 0.1 0.40 1.3 0.00 0.3 0.11 MYO1F myosin IF
10461636 0.9 0.00 1.3 0.00 -0.2 0.24
10439312 0.4 0.00 1.3 0.00 0.2 0.08 CD86 CD86 molecule
10476945 0.1 0.39 1.3 0.00 0.0 0.88 CST7 cystatin F (leukocystatin)
10564539 0.2 0.06 1.3 0.00 -0.2 0.10 MCTP2 multiple C2 domains, transmembrane
2
10429843 0.7 0.00 1.3 0.00 0.2 0.01 PARP10 poly (ADP-ribose) polymerase
family, member 10
10341905 0.4 0.14 1.3 0.00 0.1 0.61
10424400 0.4 0.01 1.3 0.00 0.1 0.56 MYC v-myc avian myelocytomatosis viral
oncogene homolog
10538187 -0.1 0.47 1.3 0.00 3.2 0.00 GPNMB glycoprotein (transmembrane) nmb
10444068 0.4 0.00 1.3 0.00 0.2 0.03 TAPBP TAP binding protein (tapasin)
10351679 0.1 0.40 1.3 0.00 0.8 0.02 CD84 CD84 molecule
10557895 0.1 0.60 1.3 0.00 1.3 0.01 ITGAX integrin, alpha X (complement
component 3 receptor 4 subunit)
10530145 0.3 0.07 1.3 0.00 0.2 0.23 TLR1 toll-like receptor 1
10408202 0.0 0.74 1.3 0.00 0.2 0.08 HIST2H3C (includes
others)
histone cluster 2, H3c
10593050 0.3 0.02 1.3 0.00 0.2 0.00 IL10RA interleukin 10 receptor, alpha
10482517 0.5 0.01 1.3 0.00 0.2 0.12 NMI N-myc (and STAT) interactor
10340164 1.0 0.01 1.3 0.00 0.1 0.72
10441003 0.2 0.05 1.3 0.00 0.4 0.03 RUNX1 runt-related transcription factor 1
10344300 0.5 0.23 1.3 0.01 0.3 0.01
10356262 0.8 0.01 1.3 0.00 0.4 0.09 Csprs (includes others) component of Sp100-rs
10338280 0.8 0.01 1.3 0.00 0.2 0.51
10581434 0.4 0.01 1.3 0.00 0.6 0.02 DPEP2 dipeptidase 2
10568714 -0.1 0.48 1.3 0.00 0.1 0.09 MKI67 antigen identified by monoclonal
antibody Ki-67

54
10450484 0.3 0.03 1.3 0.00 0.3 0.04 AIF1 allograft inflammatory factor 1
10583669 0.2 0.08 1.3 0.00 0.2 0.01 C19orf38 chromosome 19 open reading frame
38
10521667 0.3 0.01 1.3 0.00 0.3 0.11 BST1 bone marrow stromal cell antigen 1
10452316 0.2 0.08 1.3 0.00 0.5 0.01 C3 complement component 3
10580754 0.5 0.01 1.3 0.00 0.1 0.68 9330175E14Rik RIKEN cDNA 9330175E14 gene
10542040 0.5 0.01 1.2 0.00 0.2 0.03 PARP11 poly (ADP-ribose) polymerase
family, member 11
10420497 0.9 0.01 1.2 0.00 -0.3 0.08 Phf11c PHD finger protein 11C
10566346 0.9 0.00 1.2 0.00 0.2 0.25 TRIM5 tripartite motif containing 5
10347948 0.8 0.00 1.2 0.00 0.3 0.06 Sp100 nuclear antigen Sp100
10548552 0.2 0.22 1.2 0.00 0.0 0.66 Klra2 killer cell lectin-like receptor,
subfamily A, member 2
10339327 0.8 0.02 1.2 0.00 0.3 0.42
10429560 0.5 0.00 1.2 0.00 -0.2 0.20 Ly6a (includes others) lymphocyte antigen 6 complex, locus
A
10461765 0.5 0.00 1.2 0.00 0.1 0.25 LPXN leupaxin
10366586 0.3 0.02 1.2 0.00 0.0 0.73 IFNG interferon, gamma
10589884 0.7 0.00 1.2 0.00 0.2 0.25 Bcl2a1c B cell leukemia/lymphoma 2 related
protein A1c
10520452 0.3 0.08 1.2 0.00 0.0 0.88 IL6 interleukin 6 (interferon, beta 2)
10574143 0.4 0.07 1.2 0.00 0.1 0.36 NLRC5 NLR family, CARD domain
containing 5
10457168 -0.2 0.57 1.2 0.00 0.2 0.16 CD226 CD226 molecule
10542911 0.9 0.00 1.2 0.00 0.2 0.12 SAMD9L sterile alpha motif domain containing
9-like
10359851 0.5 0.01 1.2 0.00 -0.5 0.00 UCK2 uridine-cytidine kinase 2
10403871 0.4 0.00 1.2 0.00 0.3 0.01 AOAH acyloxyacyl hydrolase (neutrophil)
10381445 0.5 0.00 1.2 0.00 0.2 0.03 TMEM106A transmembrane protein 106A
10548535 0.5 0.00 1.2 0.00 0.0 0.82 Klra4 (includes others) killer cell lectin-like receptor,
subfamily A, member 4
10338178 1.0 0.00 1.2 0.00 0.2 0.61
10339765 0.8 0.02 1.2 0.00 0.1 0.62
10450344 0.3 0.07 1.2 0.00 0.0 0.70 C2 complement component 2
10388902 1.0 0.00 1.2 0.00 0.1 0.24 LGALS9 lectin, galactoside-binding, soluble, 9
10497364 0.2 0.03 1.2 0.00 0.0 0.58 Sirpb1a (includes others) signal-regulatory protein beta 1A
10440393 0.3 0.03 1.2 0.00 0.0 0.51 SAMSN1 SAM domain, SH3 domain and
nuclear localization signals 1
10487823 0.7 0.00 1.2 0.00 0.2 0.07 SIGLEC1 sialic acid binding Ig-like lectin 1,
sialoadhesin
10461558 0.3 0.02 1.2 0.00 0.2 0.11 SLC15A3 solute carrier family 15 (oligopeptide
transporter), member 3
10582985 0.4 0.00 1.2 0.00 0.3 0.05 CASP1 caspase 1, apoptosis-related cysteine
peptidase
10402585 0.6 0.00 1.2 0.00 0.1 0.58 WARS tryptophanyl-tRNA synthetase
10387536 0.1 0.19 1.2 0.00 0.7 0.02 CD68 CD68 molecule
10343192 0.7 0.01 1.2 0.02 0.2 0.49
10342761 0.8 0.01 1.2 0.00 0.1 0.77
10342539 1.0 0.07 1.2 0.02 -0.2 0.68
10408077 0.1 0.47 1.2 0.00 0.2 0.35 HIST1H2AD histone cluster 1, H2ad
10435920 0.4 0.03 1.2 0.00 0.3 0.14 CD200R1L CD200 receptor 1-like
10338367 0.5 0.01 1.2 0.00 0.0 0.79
10390707 -0.1 0.15 1.2 0.00 0.2 0.12 TOP2A topoisomerase (DNA) II alpha
170kDa
10519951 0.0 0.88 1.2 0.00 0.3 0.01 GSAP gamma-secretase activating protein
10414548 0.1 0.43 1.2 0.00 0.1 0.46 RNASE6 ribonuclease, RNase A family, k6
10406205 0.3 0.00 1.2 0.00 0.1 0.45 ERAP1 endoplasmic reticulum
aminopeptidase 1
10430302 0.2 0.00 1.2 0.00 0.3 0.11 CSF2RB colony stimulating factor 2 receptor,
beta, low-affinity (granulocyte-
macrophage)
10466130 0.5 0.00 1.2 0.00 0.0 0.91 MS4A8 membrane-spanning 4-domains,
subfamily A, member 8
10415015 0.0 0.71 1.2 0.00 -0.1 0.53 Trav7-4 T cell receptor alpha variable 7-4
10339254 0.6 0.08 1.2 0.01 0.4 0.26
10375443 0.4 0.01 1.2 0.01 0.1 0.37 HAVCR2 hepatitis A virus cellular receptor 2
10545135 0.4 0.00 1.2 0.00 0.0 0.78 IL12RB2 interleukin 12 receptor, beta 2
10398052 0.4 0.00 1.2 0.00 0.1 0.26 Serpina3h serine (or cysteine) peptidase
inhibitor, clade A, member 3H
10582879 0.9 0.00 1.2 0.00 0.6 0.00 Csprs (includes others) component of Sp100-rs
10356020 -0.1 0.32 1.2 0.00 0.4 0.02 DOCK10 dedicator of cytokinesis 10
10501608 0.3 0.00 1.2 0.00 0.3 0.05 VCAM1 vascular cell adhesion molecule 1
10449303 0.2 0.07 1.2 0.00 0.0 0.59 BAK1 BCL2-antagonist/killer 1
10387890 0.1 0.24 1.2 0.00 0.4 0.03 CXCL16 chemokine (C-X-C motif) ligand 16
10606058 0.0 0.81 1.2 0.00 0.0 0.91 CXCR3 chemokine (C-X-C motif) receptor 3
10384154 0.3 0.00 1.1 0.00 0.2 0.04 MYO1G myosin IG
10390640 0.2 0.02 1.1 0.00 -0.1 0.19 IKZF3 IKAROS family zinc finger 3
(Aiolos)
10339726 0.8 0.00 1.1 0.00 0.0 1.00
10342216 0.5 0.00 1.1 0.00 0.3 0.10
10485405 0.2 0.03 1.1 0.00 0.2 0.22 CD44 CD44 molecule (Indian blood group)
10343134 0.6 0.00 1.1 0.00 0.0 0.95
10340782 0.5 0.05 1.1 0.00 0.4 0.23
10344149 0.3 0.25 1.1 0.00 -0.8 0.02
10445119 0.5 0.01 1.1 0.00 0.2 0.03 HLA-G major histocompatibility complex,
class I, G
10340809 0.6 0.00 1.1 0.00 0.1 0.30
10425066 0.1 0.03 1.1 0.00 0.2 0.26 CSF2RB colony stimulating factor 2 receptor,

55
beta, low-affinity (granulocyte-
macrophage)
10339017 0.5 0.17 1.1 0.00 0.1 0.72
10450069 0.8 0.00 1.1 0.00 0.2 0.01 H2-K2/H2-Q9 histocompatibility 2, K region locus
2
10567825 0.1 0.10 1.1 0.00 0.1 0.34 LAT linker for activation of T cells
10350516 0.1 0.43 1.1 0.00 -0.2 0.17 PTGS2 prostaglandin-endoperoxide synthase
2 (prostaglandin G/H synthase and
cyclooxygenase)
10355967 0.1 0.06 1.1 0.00 0.1 0.22 AP1S3 adaptor-related protein complex 1,
sigma 3 subunit
10374236 0.4 0.01 1.1 0.00 -0.2 0.01 UPP1 uridine phosphorylase 1
10466410 0.1 0.24 1.1 0.00 -0.1 0.22 PSAT1 phosphoserine aminotransferase 1
10342565 0.4 0.33 1.1 0.00 -0.1 0.83
10421697 0.4 0.01 1.1 0.00 0.2 0.03 LACC1 laccase (multicopper oxidoreductase)
domain containing 1
10497831 -0.3 0.03 1.1 0.00 0.1 0.27 CCNA2 cyclin A2
10461629 0.7 0.00 1.1 0.00 0.3 0.00 Ms4a4b (includes others) membrane-spanning 4-domains,
subfamily A, member 4B
10559454 0.2 0.10 1.1 0.00 0.3 0.02 Pira11 paired-Ig-like receptor A11
10542981 0.2 0.07 1.1 0.00 0.1 0.63 GMFG glia maturation factor, gamma
10404063 0.2 0.18 1.1 0.00 0.1 0.63 Hist1h2ab (includes others) histone cluster 1, H2ab
10340391 0.7 0.04 1.1 0.01 0.5 0.17
10360306 0.2 0.16 1.1 0.00 0.3 0.01 SLAMF8 SLAM family member 8
10394054 0.3 0.02 1.1 0.00 0.0 0.99 CD7 CD7 molecule
10482929 0.0 0.62 1.1 0.00 0.2 0.03 LY75 lymphocyte antigen 75
10574141 0.4 0.01 1.1 0.00 0.0 0.74 NLRC5 NLR family, CARD domain
containing 5
10351099 0.3 0.07 1.1 0.00 0.0 0.67 TNFSF18 tumor necrosis factor (ligand)
superfamily, member 18
10450242 0.5 0.00 1.1 0.00 0.2 0.10 C4A/C4B complement component 4B (Chido
blood group)
10425053 0.3 0.00 1.1 0.00 0.3 0.07 NCF4 neutrophil cytosolic factor 4, 40kDa
10356274 0.8 0.00 1.1 0.00 0.6 0.00 Csprs (includes others) component of Sp100-rs
10429564 0.9 0.00 1.1 0.00 -0.1 0.59 Ly6a (includes others) lymphocyte antigen 6 complex, locus
A
10489127 0.3 0.05 1.1 0.00 0.3 0.06 RBL1 retinoblastoma-like 1 (p107)
10566574 0.7 0.00 1.1 0.00 0.2 0.36 Gvin1 (includes others) GTPase, very large interferon
inducible 1
10343442 0.5 0.17 1.1 0.01 0.2 0.43
10544273 0.2 0.13 1.1 0.00 0.4 0.09 CLEC5A C-type lectin domain family 5,
member A
10366881 0.7 0.00 1.1 0.00 0.1 0.18 DDIT3 DNA-damage-inducible transcript 3
10538753 0.2 0.16 1.1 0.00 0.1 0.42
10450723 0.4 0.01 1.1 0.00 0.3 0.04 H2-T10 histocompatibility 2, T region locus
10
10347335 0.2 0.08 1.1 0.00 0.4 0.03 SLC11A1 solute carrier family 11 (proton-
coupled divalent metal ion
transporter), member 1
10360406 0.8 0.00 1.1 0.00 -0.2 0.16 Ifi204 (includes others) interferon activated gene 204
10408572 0.3 0.20 1.1 0.01 0.0 0.92
10487480 -0.1 0.29 1.1 0.00 0.2 0.02 BUB1 BUB1 mitotic checkpoint
serine/threonine kinase
10534935 0.5 0.01 1.1 0.00 0.4 0.02 PILRB paired immunoglobin-like type 2
receptor beta
10454782 0.3 0.05 1.1 0.00 0.1 0.59 EGR1 early growth response 1
10531370 0.1 0.30 1.1 0.00 0.3 0.05 NAAA N-acylethanolamine acid amidase
10574155 0.4 0.03 1.1 0.00 0.1 0.64 NLRC5 NLR family, CARD domain
containing 5
10340949 0.4 0.10 1.1 0.01 0.1 0.64
10497349 0.2 0.02 1.1 0.00 0.0 0.49 Sirpb1a (includes others) signal-regulatory protein beta 1A
10569020 0.3 0.21 1.1 0.00 0.1 0.19 Ifitm6 interferon induced transmembrane
protein 6
10425410 0.2 0.11 1.1 0.00 0.1 0.52 GRAP2 GRB2-related adaptor protein 2
10393449 0.3 0.03 1.1 0.00 -0.1 0.23 SOCS3 suppressor of cytokine signaling 3
10475517 0.1 0.22 1.1 0.00 0.0 0.95 C15orf48 chromosome 15 open reading frame
48
10343490 0.5 0.15 1.1 0.00 -0.5 0.18
10554789 0.2 0.06 1.1 0.00 0.1 0.48 CTSC cathepsin C
10356248 0.4 0.01 1.1 0.00 0.3 0.01 C130026I21Rik (includes
others)
RIKEN cDNA C130026I21 gene
10567580 0.5 0.01 1.1 0.00 0.5 0.05 IGSF6 immunoglobulin superfamily,
member 6
10385428 0.2 0.00 1.1 0.00 0.2 0.04 ITK IL2-inducible T-cell kinase
10489891 0.4 0.00 1.1 0.00 0.1 0.39 B4GALT5 UDP-Gal:betaGlcNAc beta 1,4-
galactosyltransferase, polypeptide 5
10548375 0.0 0.88 1.1 0.00 1.2 0.00 CLEC7A C-type lectin domain family 7,
member A
10538290 0.3 0.00 1.1 0.00 0.1 0.43 SNX10 sorting nexin 10
10481949 0.1 0.26 1.1 0.00 0.0 0.65 TRAF1 TNF receptor-associated factor 1
10435704 0.2 0.10 1.0 0.00 -0.1 0.66 CD80 CD80 molecule
10538135 0.1 0.43 1.0 0.00 0.0 0.91 GIMAP7 GTPase, IMAP family member 7
10487011 0.0 0.72 1.0 0.00 0.5 0.02 GATM glycine amidinotransferase (L-
arginine:glycine amidinotransferase)
10487597 0.1 0.67 1.0 0.00 0.0 0.77 IL1B interleukin 1, beta
10601581 0.5 0.00 1.0 0.00 0.1 0.02
10500677 0.0 0.85 1.0 0.00 -0.1 0.18 CD2 CD2 molecule
10481627 0.8 0.00 1.0 0.00 -0.8 0.00 LCN2 lipocalin 2
10548892 0.2 0.05 1.0 0.00 0.2 0.02 ARHGDIB Rho GDP dissociation inhibitor

56
(GDI) beta
10582862 0.4 0.01 1.0 0.00 0.2 0.35 SP140 SP140 nuclear body protein
10340154 0.5 0.01 1.0 0.00 0.2 0.44
10382106 0.6 0.00 1.0 0.00 0.3 0.12 Milr1 mast cell immunoglobulin like
receptor 1
10595148 0.1 0.57 1.0 0.00 0.0 0.72
10547985 0.0 0.88 1.0 0.00 0.0 0.97 CD27 CD27 molecule
10357875 -0.3 0.26 1.0 0.00 0.2 0.31 BTG2 BTG family, member 2
10413047 0.0 0.81 1.0 0.00 0.3 0.05 PLAU plasminogen activator, urokinase
10344052 0.6 0.22 1.0 0.02 0.0 0.91
10562637 -0.1 0.33 1.0 0.00 -0.2 0.07 Ccnb1/Gm5593 cyclin B1
10341593 0.4 0.08 1.0 0.00 0.1 0.62
10559478 0.4 0.04 1.0 0.00 0.1 0.32 LILRB3 leukocyte immunoglobulin-like
receptor, subfamily B (with TM and
ITIM domains), member 3
10366848 0.1 0.09 1.0 0.00 0.1 0.48 B4GALNT1 beta-1,4-N-acetyl-galactosaminyl
transferase 1
10411739 0.0 0.84 1.0 0.00 -0.2 0.02 Ccnb1/Gm5593 cyclin B1
10342412 0.4 0.11 1.0 0.00 0.4 0.10
10368144 0.1 0.10 1.0 0.00 0.0 0.73 TNFAIP3 tumor necrosis factor, alpha-induced
protein 3
10490903 0.3 0.01 1.0 0.00 0.2 0.08 CA13 carbonic anhydrase XIII
10444824 0.4 0.00 1.0 0.00 0.3 0.01 HLA-B major histocompatibility complex,
class I, B
10480035 0.4 0.00 1.0 0.00 0.1 0.10 PFKFB3 6-phosphofructo-2-kinase/fructose-
2,6-biphosphatase 3
10344592 -0.5 0.12 1.0 0.01 0.1 0.84
10547590 0.4 0.01 1.0 0.00 0.1 0.51 KLRG1 killer cell lectin-like receptor
subfamily G, member 1
10471929 0.0 0.88 1.0 0.00 0.1 0.26 ARHGAP15 Rho GTPase activating protein 15
10510260 0.1 0.74 1.0 0.00 -0.2 0.39 Nppb natriuretic peptide type B
10341908 0.7 0.01 1.0 0.00 -0.1 0.85
10569017 0.8 0.00 1.0 0.00 0.1 0.15 IFITM2 interferon induced transmembrane
protein 2
10554162 0.0 0.64 1.0 0.00 -0.2 0.19
10405587 0.0 0.72 1.0 0.00 0.2 0.06 TGFBI transforming growth factor, beta-
induced, 68kDa
10433507 0.1 0.50 1.0 0.00 0.1 0.56 CIITA class II, major histocompatibility
complex, transactivator
10587339 0.1 0.13 1.0 0.00 0.1 0.17
10367532 0.1 0.50 1.0 0.00 0.0 0.56 TESPA1 thymocyte expressed, positive
selection associated 1
10566333 0.6 0.00 1.0 0.00 0.1 0.12 TRIM5 tripartite motif containing 5
10597648 0.4 0.00 1.0 0.00 0.1 0.01 MYD88 myeloid differentiation primary
response 88
10390763 0.1 0.49 1.0 0.00 -0.1 0.50 CCR7 chemokine (C-C motif) receptor 7
10360158 0.3 0.03 1.0 0.00 0.3 0.05 LY9 lymphocyte antigen 9
10338225 0.4 0.10 1.0 0.00 0.5 0.05
10347933 0.4 0.02 1.0 0.00 0.2 0.37 SP140 SP140 nuclear body protein
10342214 0.2 0.60 1.0 0.00 -0.1 0.71
10351667 -0.1 0.82 1.0 0.00 0.1 0.35 SLAMF1 signaling lymphocytic activation
molecule family member 1
10450374 0.3 0.09 1.0 0.00 0.1 0.33
10601424 0.2 0.27 1.0 0.00 0.0 0.83 GPR174 G protein-coupled receptor 174
10344407 0.2 0.48 1.0 0.00 0.4 0.03
10515836 0.0 0.77 1.0 0.00 -0.1 0.16 Ccnb1/Gm5593 cyclin B1
10342377 -0.1 0.78 1.0 0.01 0.5 0.05
10541605 0.5 0.02 1.0 0.00 0.1 0.77 CLEC6A C-type lectin domain family 6,
member A
10504755 0.3 0.01 1.0 0.00 0.1 0.20 BC057193 cDNA sequence BC057193
10548415 0.4 0.02 1.0 0.00 -0.1 0.40 Klri1 killer cell lectin-like receptor family
I member 1
10340199 0.1 0.84 1.0 0.00 -0.5 0.08
10356866 0.0 0.71 1.0 0.00 0.0 1.00 PDCD1 programmed cell death 1
10363161 0.3 0.06 1.0 0.00 0.2 0.18 TMEM229B transmembrane protein 229B
10507908 0.0 0.66 1.0 0.00 0.0 0.77 FHL3 four and a half LIM domains 3
10343761 0.6 0.03 1.0 0.00 0.6 0.06
10475414 0.9 0.00 1.0 0.00 0.3 0.01 B2M beta-2-microglobulin
10361133 0.5 0.00 1.0 0.00 0.0 0.96
10339990 0.8 0.00 1.0 0.00 0.0 0.84
10508734 0.0 0.85 1.0 0.00 0.5 0.02 PTAFR platelet-activating factor receptor
10536898 0.2 0.02 1.0 0.00 0.1 0.28 IRF5 interferon regulatory factor 5
10582868 0.2 0.12 1.0 0.00 0.1 0.51
10407985 0.1 0.33 1.0 0.01 0.1 0.67 GPR141 G protein-coupled receptor 141
10338478 0.3 0.29 1.0 0.02 0.2 0.41
10461723 0.1 0.50 1.0 0.00 0.0 0.77 FAM111A family with sequence similarity 111,
member A
10342606 0.4 0.15 1.0 0.01 0.3 0.28
10608649 0.6 0.00 1.0 0.00 0.1 0.21
10351792 0.3 0.04 1.0 0.00 0.3 0.01 SLAMF9 SLAM family member 9
10601421 0.3 0.01 1.0 0.01 -0.1 0.82 A630033H20Rik RIKEN cDNA A630033H20 gene
10474875 -0.3 0.03 1.0 0.00 0.1 0.48 CASC5 cancer susceptibility candidate 5
10349401 0.0 0.66 1.0 0.00 0.2 0.16 GPR39 G protein-coupled receptor 39
10430190 0.0 0.69 1.0 0.00 0.2 0.07 Apol10a (includes others) apolipoprotein L 11a
10586448 0.0 0.79 1.0 0.00 0.3 0.12 KIAA0101 KIAA0101
10594053 0.6 0.01 1.0 0.00 0.0 0.88 PML promyelocytic leukemia
10602385 -0.1 0.69 -1.0 0.00 0.1 0.63 PFKFB1 6-phosphofructo-2-kinase/fructose-
2,6-biphosphatase 1

57
10340749 0.2 0.58 -1.0 0.05 -0.4 0.31
10339035 -0.2 0.53 -1.0 0.00 0.0 0.86
10338755 0.3 0.35 -1.0 0.00 -0.3 0.32
10436095 -0.2 0.52 -1.0 0.03 0.7 0.02 Retnla resistin like alpha
10354299 0.1 0.58 -1.1 0.00 -0.6 0.00 Mettl21e methyltransferase like 21E
10344113 -0.4 0.37 -1.1 0.02 0.0 0.91
10340272 -0.6 0.18 -1.1 0.04 0.2 0.67
10342598 0.3 0.58 -1.1 0.05 -0.1 0.82
10341361 0.0 0.97 -1.1 0.01 -0.5 0.09
10341762 -0.3 0.43 -1.1 0.05 0.5 0.28
10340062 0.0 0.95 -1.2 0.00 -0.8 0.02
10518526 -0.5 0.04 -1.3 0.00 0.3 0.24 ANGPTL7 angiopoietin-like 7

58
Online Table 10. List of differentially expressed genes on 60 dpi (log ratio > 1 or < -1, P value <
0.05) 4 dpi 7 dpi 60 dpi
Probe Set ID Log ratio P values (t-test) Log ratio P values (t-test) Log ratio P values (t-test) Symbol Entrez Gene Name
10583056 0.0 0.83 0.2 0.24 3.5 0.00 MMP12 matrix metallopeptidase 12 (macrophage elastase)
10538187 -0.1 0.47 1.3 0.00 3.2 0.00 GPNMB glycoprotein (transmembrane) nmb
10511779 0.2 0.14 0.4 0.05 3.0 0.00 ATP6V0D2 ATPase, H+ transporting, lysosomal 38kDa, V0
subunit d2
10455970 6.6 0.00 6.8 0.00 2.8 0.00
10545237 -0.1 0.46 -0.1 0.74 2.1 0.05
10523717 0.4 0.03 2.6 0.00 2.0 0.00 SPP1 secreted phosphoprotein 1
10450161 0.2 0.19 2.6 0.00 1.7 0.00 HLA-DRA major histocompatibility complex, class II, DR alpha
10547740 1.4 0.04 0.2 0.86 1.7 0.04 C1S complement component 1, s subcomponent
10545173 -0.1 0.56 0.6 0.06 1.6 0.01
10456005 0.1 0.47 2.5 0.00 1.6 0.00 CD74 CD74 molecule, major histocompatibility complex,
class II invariant chain
10450154 0.1 0.69 2.4 0.00 1.5 0.00 HLA-
DQA1
major histocompatibility complex, class II, DQ alpha
1
10494262 -0.4 0.05 0.1 0.31 1.5 0.00 CTSK cathepsin K
10522788 0.6 0.00 2.1 0.00 1.4 0.00 STAP1 signal transducing adaptor family member 1
10608681 5.1 0.00 6.3 0.00 1.4 0.00 Gm4841 predicted gene 4841
10403021 0.1 0.20 0.3 0.01 1.4 0.00
10531126 -0.3 0.21 0.5 0.00 1.3 0.00 IGJ immunoglobulin J polypeptide, linker protein for
immunoglobulin alpha and mu polypeptides
10338640 1.0 0.16 -0.3 0.64 1.3 0.02
10557895 0.1 0.60 1.3 0.00 1.3 0.01 ITGAX integrin, alpha X (complement component 3 receptor
4 subunit)
10414360 0.2 0.02 1.7 0.00 1.3 0.00 LGALS3 lectin, galactoside-binding, soluble, 3
10545231 0.1 0.56 2.3 0.00 1.2 0.02
10403038 -0.1 0.07 0.4 0.01 1.2 0.01
10548375 0.0 0.88 1.1 0.00 1.2 0.00 CLEC7A C-type lectin domain family 7, member A
10603551 0.4 0.01 1.6 0.00 1.2 0.00 CYBB cytochrome b-245, beta polypeptide
10372410 0.5 0.00 1.7 0.00 1.1 0.00 GLIPR1 GLI pathogenesis-related 1
10455961 3.3 0.00 4.3 0.00 1.1 0.00 Iigp1 interferon inducible GTPase 1
10542164 0.5 0.00 2.5 0.00 1.1 0.00 CLEC12A C-type lectin domain family 12, member A
10444291 0.1 0.46 2.5 0.00 1.1 0.00 HLA-
DQB1
major histocompatibility complex, class II, DQ beta 1
10358408 0.5 0.00 2.3 0.00 1.1 0.00 RGS1 regulator of G-protein signaling 1
10461721 0.7 0.00 2.5 0.00 1.1 0.00 MPEG1 macrophage expressed 1
10545247 0.3 0.10 0.4 0.05 1.1 0.02
10427628 0.2 0.09 2.0 0.00 1.1 0.00 IL7R interleukin 7 receptor
10376324 3.8 0.00 5.4 0.00 1.0 0.00 Gm12250 predicted gene 12250
10531407 2.9 0.00 4.9 0.00 1.0 0.00 CXCL9 chemokine (C-X-C motif) ligand 9
10545198 -0.3 0.15 0.0 0.98 1.0 0.01
10517165 1.0 0.00 3.0 0.00 1.0 0.00 Cd52 CD52 antigen
10459066 3.9 0.00 6.3 0.00 1.0 0.00 Gm4841 predicted gene 4841
10494271 0.9 0.00 2.3 0.00 1.0 0.01 CTSS cathepsin S
10339525 0.0 0.97 0.2 0.59 1.0 0.01
10344291 0.4 0.55 0.1 0.90 -1.0 0.01
10546432 0.2 0.51 -0.6 0.03 -1.0 0.00 ADAMTS9 ADAM metallopeptidase with thrombospondin type
1 motif, 9
10343814 0.1 0.85 -0.3 0.66 -1.0 0.01
10359867 0.6 0.06 -0.8 0.00 -1.1 0.00 LRRC52 leucine rich repeat containing 52
10338097 0.6 0.34 0.6 0.12 -1.3 0.02
10343939 0.3 0.42 0.2 0.62 -1.4 0.01
10504838 0.6 0.03 -0.7 0.00 -2.1 0.00 NR4A3 nuclear receptor subfamily 4, group A, member 3

59
Online Table 11. Top networks identified by IPA of microarray data of heart samples from
TMEV-infected mice*
ID Associated Network Functions Score†
4 dpi
1 Infectious Disease, Antimicrobial Response, Inflammatory Response 43
2 Antimicrobial Response, Inflammatory Response, Infectious Disease 43
3 Infectious Disease, Humoral Immune Response, Protein Synthesis 34
4 Cell-To-Cell Signaling and Interaction, Cellular Movement, Immune Cell Trafficking 31
5 Dermatological Diseases and Conditions, Cellular Movement, Immune Cell Trafficking 23
7 dpi
1 Infectious Disease, Cellular Function and Maintenance, Antimicrobial Response 47
2 Cell Death and Survival, Antigen Presentation, Protein Synthesis 38
3 Lymphoid Tissue Structure and Development, Tissue Morphology, Antimicrobial
Response
35
4 Infectious Disease, Antimicrobial Response, Inflammatory Response 35
5 Infectious Disease, Cell Death and Survival, Cell-To-Cell Signaling and Interaction 33
60 dpi
1 Cellular Function and Maintenance, Inflammatory Response, Cellular Movement 33
2 Cellular Movement, Immune Cell Trafficking, Hematological System Development and
Function
12
3 Ophthalmic Disease, DNA Replication, Recombination, and Repair, Cell Death and Survival 2
4 Cellular Assembly and Organization, Neurological Disease, Cardiovascular Disease 2 *Genes were clustered by Ingenuity Pathway Analysis (IPA) Network Generation Algorithm.
†Network score was calculated based on the tight-tailed Fisher’s Exact Test that takes into account: 1) the
number of Network Eligible molecules in the network, 2) size of the network, 3) the total number of
Network Eligible molecules in the given dataset, and 4) the number of molecules in the IPA database that
could potentially be included in the networks.

60
Online Table 12. Top toxicity functions (cardiotoxicity)
Name P value # of
molecules
Molecules
4 dpi
1 Cardiac Inflammation 0.0001 – 0.22 4 Ccl2, Ccl3, Ccr5, Tlr3
2 Cardiac Infarction 0.01 – 0.01 3 Ccl2, Ccl3, Stat1
3 Cardiac Dysfunction 0.01 – 0.01 2 Ccl2, Timp1
4 Cardiac Output 0.03 – 0.16 1 Tnfsf10
5 Pulmonary Hypertension 0.03 – 0.03 1 Tnfsf10
7 dpi
1 Cardiac Inflammation 7E-11 – 0.57 11 Ccl2, Ccl3, Ccr2, Ccr5, Ifng, Itgal,
Itgam, Itgb2, Prf1, Stat4, Tlr3
2 Cardiac Infarction 0.0003 – 0.15 8 Ccl2, Ccl3, Cd44, Cybb, Fcer1g, Il6,
Stat1, Lck
3 Cardiac Dysfunction 0.001 – 0.07 5 Ccl2, Cybb, Plau, Timp1, Ifng
4 Cardiac Dilation 0.002 – 0.002 5 Ccna2, Ifng, Plau, Spp1, Timp1
5 Cardiac Necrosis/Cell Death 0.003 – 0.005 8 Casp1, Cybb, Il1b, Il1rn, Lcn2,
Sprr1a, Stat1, Tnfaip3
60 dpi
1 Cardiac Dysfunction 0.005 – 0.005 2 Cybb, Ppargc1a
2 Cardiac Fibrosis 0.01 – 0.01 2 Cybb, Spp1
3 Cardiac Dilation 0.07 – 0.07 1 Spp1
4 Cardiac Infarction 0.10 – 0.10 1 Cybb
5 Cardiac Necrosis/Cell Death 0.15 – 0.15 1 Cybb
Cardiotoxicities were ranked by IPA. P values were calculated by Fisher’s Exact Test.

61
V. Online Figures
Online Figure 1. Heat maps of most highly up- or down-regulated genes in the hearts of TMEV-infected
mice on 4 (A), 7 (B), and 60 dpi (C). A) On 4 dpi, 20 upregulated and 16 downregulated genes. B) On 7
dpi, 20 upregulated and 7 downregulated genes. C) On 60 dpi, 20 upregulated and 4 downregulated genes.
Gene expression patterns of (A) and (B) were similar between 4 and 7 dpi, while those in (C) were similar
between 7 and 60 dpi. Red, blue, and white indicate upregulation, downregulation, and no change,
compared with control mice, respectively. Each column represents the data from one mouse. n = 5/dpi.
A list of abbreviations of genes is shown in Online Table 1.

62
Online Figure 2. Davies-Bouldin index of k-means clustering for microarray data of the hearts from
TMEV-infected mice (total number of mice = 15, five mice/dpi). We used Davies-Bouldin index to
determine the optimum number of clusters in k-means clustering and obtained the lowest score (0.51)
when microarray data were separated into 20 clusters.

63
Online Figure 3. The gene expression patterns of 20 clusters separated by k-means clustering. Graphs
were drawn using the genes of top 80, middle 80, and bottom 80 (total 240 genes) in each cluster. The
number next to a cluster number indicated the number of genes in each cluster.
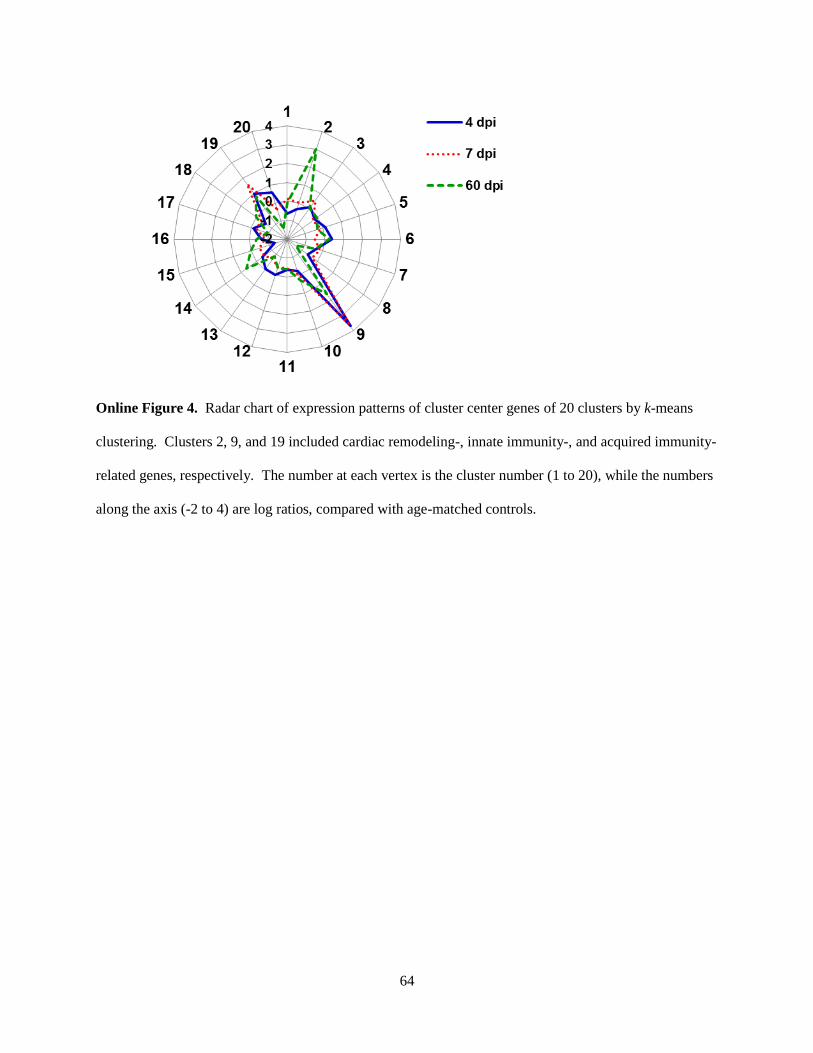
64
Online Figure 4. Radar chart of expression patterns of cluster center genes of 20 clusters by k-means
clustering. Clusters 2, 9, and 19 included cardiac remodeling-, innate immunity-, and acquired immunity-
related genes, respectively. The number at each vertex is the cluster number (1 to 20), while the numbers
along the axis (-2 to 4) are log ratios, compared with age-matched controls.

65
Online Figure 5. Correlation between disease activity and PC1 values. As an indicator of disease
activity, cardiac troponin I levels in sera determined by ELISA were used. The PC1 values were
calculated using microarray data by R and R package ‘prcomp’. There was a strong correlation between
troponin levels and PC1 values (r = 0.81, P < 0.001). This suggested that the PC1 value reflected the
disease activity. ∇: 60 days post infection (dpi), ▲: 4 dpi, ◊: 7 dpi.

66
Online Figure 6. Correlations between serum troponin I levels and gene expression ratios (real-time
PCR). There were strong correlations between troponin I levels and gene expression ratios of Chemokine
(C-X-C motif) ligand 9 (Cxcl9) (A) or toll-like receptor 3 (Tlr3) (B) on 4 dpi. There was also a strong
correlation between troponin I levels and gene expression ratios of granzyme B (Gzmb) (C), but not CD3
γ subunit (Cd3g) (D), on 7 dpi.

67
Online Figure 7. The network associated with ‘Infectious Disease’, ‘Antimicrobial Response’, and
‘Inflammatory Response’. This is the top network listed on Ingenuity Pathway Analysis® (IPA) on 4 dpi.
Red nodes indicate genes upregulated in the hearts of TMEV-infected mice compared with control mice.
Gray nodes indicate genes whose expression levels were less than 2-fold or P values were more than 0.05.
P values were determined comparing the signal values of each probe between five samples from infected
mice and five samples from age-matched controls, using Student t test.

68
Online Figure 8. The network associated with ‘Infectious Disease’, ‘Cellular Function and Maintenance’,
and ‘Antimicrobial Response’. This is the top network listed on IPA on 7 dpi. Red nodes indicate genes
upregulated in the hearts of TMEV-infected mice compared with control mice. Gray nodes indicate genes
whose expression levels were less than 2-fold or P values were more than 0.05. P values were
determined comparing the signal values of each probe between five samples from infected mice and five
samples from age-matched controls, using Student t test.

69
Online Figure 9. The network associated with ‘Cellular Function and Maintenance’, ‘Inflammatory
Response’, and ‘Cellular Movement’. This is the top network listed on IPA on 60 dpi. Red nodes
indicate genes upregulated in the hearts of TMEV-infected mice compared with control mice. Blue nodes
indicate downregulated genes. Gray nodes indicate genes whose expression levels were less than 2-fold
or P values were more than 0.05. P values were determined comparing the signal values of each probe
between five samples from infected mice and five samples from age-matched controls, using Student t
test.

70
Online Figure 10. The top 5 canonical pathways ranked by IPA on 4 (A), 7 (B), and 60 dpi (C). The
numbers on the lines indicate the number of overlapped genes between two pathways. The values under
the nodes indicate P values calculated by Fisher’s Exact Test.
Recommended


