Business Research Methods
S. SreejeshSanjay MohapatraM. R. Anusree
An Applied Orientation

Business Research Methods

S. Sreejesh • Sanjay MohapatraM. R. Anusree
Business Research Methods
An Applied Orientation
123

S. SreejeshIBS HyderabadIFHE UniversityHyderabadIndia
Sanjay MohapatraXavier Institute of ManagementBhubaneswar, OrissaIndia
M. R. AnusreeDepartment of StatisticsUniversity of KeralaTrivandrum, KeralaIndia
ISBN 978-3-319-00538-6 ISBN 978-3-319-00539-3 (eBook)DOI 10.1007/978-3-319-00539-3Springer Cham Heidelberg New York Dordrecht London
Library of Congress Control Number: 2013940441
� Springer International Publishing Switzerland 2014This work is subject to copyright. All rights are reserved by the Publisher, whether the whole or part ofthe material is concerned, specifically the rights of translation, reprinting, reuse of illustrations,recitation, broadcasting, reproduction on microfilms or in any other physical way, and transmission orinformation storage and retrieval, electronic adaptation, computer software, or by similar or dissimilarmethodology now known or hereafter developed. Exempted from this legal reservation are briefexcerpts in connection with reviews or scholarly analysis or material supplied specifically for thepurpose of being entered and executed on a computer system, for exclusive use by the purchaser of thework. Duplication of this publication or parts thereof is permitted only under the provisions ofthe Copyright Law of the Publisher’s location, in its current version, and permission for use mustalways be obtained from Springer. Permissions for use may be obtained through RightsLink at theCopyright Clearance Center. Violations are liable to prosecution under the respective Copyright Law.The use of general descriptive names, registered names, trademarks, service marks, etc. in thispublication does not imply, even in the absence of a specific statement, that such names are exemptfrom the relevant protective laws and regulations and therefore free for general use.While the advice and information in this book are believed to be true and accurate at the date ofpublication, neither the authors nor the editors nor the publisher can accept any legal responsibility forany errors or omissions that may be made. The publisher makes no warranty, express or implied, withrespect to the material contained herein.
Printed on acid-free paper
Springer is part of Springer Science+Business Media (www.springer.com)
Additional material to this book can be downloaded from http://extras.springer.com/

Dedicated to our elders who shaped our livesLate Parmananda Mishra,Late Dr. Sushila Mishra,Dr. B. C. Mohapatra,H. K. Mohapatra,Kanyakumari Mohapatra (Bou)
and
Late Surendran Pillai P. (Father)Radhamani Amma (Mother) finally,inspiration behind all my success
Suresh S. (Brother), Sreeja Sudharman(Sister), and Sudharman Pillai
Preface
In the globalized economy, business faces challenges that require knowledge-based solutions. The products and services that they offer need to be decisive, andprecise value propositions that would meet customer’s explicit and latentrequirements. This means the managers need to use tools and techniques that willuse research-based information to be part of decision support system. This book isabout creating that information from research that can help managers to takedecisions that will provide competitive edge.
This textbook provides an in-depth knowledge in the field of business researchfor students. Those who have made a career in practical research will also getbenefits from the concepts illustrated here. It addresses all the concepts that aretaught in MBA classes, explaining theoretical concepts and mapping these con-cepts to practical cases.
The pedagogy has been developed based on experience in teaching the subjectto many batches of students. The methodologies depicted here have been used inseveral consulting assignments and have been proven to be useful for marketresearchers.
Organization of the Book
The book has been prepared in five parts. The first part explains topics related toconcepts that are related to business research, second part consists of descriptiveand exploratory research methodology, third part consists of causal researchdesign, and the fourth part illustrates the approach for writing business reports.Detailed contents in the book are as follows:
vii
Part I: Overview of Business Research
Chapter 1: Introduction to Business Research: Scope of Business Research—BasicResearch and Applied Research—Role of Business Research in Decision-Making:Problem/Opportunity Identification, Problem/Opportunity Prioritization andSelection, Problem/Opportunity Resolution, Implementing the Course of Action—Factors Affecting Business Research: Time Constraint, Availability of Resources,Nature of Information Sought, Benefits Versus Cost—Globalization and BusinessResearch—Business Research and the Internet: Primary Research and SecondaryResearch.
Case Study 1
Chapter 2: Business Research Process: Steps in the Research Process—Identifyingand defining the Problem/Opportunity Exploratory Research, Preparing theStatement of Research Objectives, Developing the Hypotheses. Planning theResearch Design, Selecting the Research Method—Surveys, Experiments, Sec-ondary Data Studies, Observation Techniques, Analyzing Research Designs,Selecting the Sampling Procedure, Data Collection, Evaluating the Data, Analysis,Preparing, and Presenting the Research Report.
Part II: Research Design
Case Study 2
Chapter 3: Business Research Design: Exploratory, Descriptive and CausalDesigns: The Meaning of Business Research Design—Need for ResearchDesign—Characteristics of a Good Research Design.
Case Study 3: J & J and Cause-Related Marketing Initiatives
Part I: Exploratory Research Design: Exploratory Research Design with SecondaryData: Classification of Secondary Data, Internal Secondary Data and PublishedExternal Secondary Data, Syndicated Data; Exploratory Research Design: Quali-tative Research; Rationale for Using Qualitative Research, Classification, FocusGroup, In-depth Interviews, and Projective Techniques.
viii Preface
Video: How to Do In-depth Interviews
Part II: Descriptive Research Design: Survey methods—Telephone Methods,Personal Methods, Mail Methods, Electronic Methods; Observation Methods—Personal Observation, Mechanical Observation, Audit, Content Analysis andTrace Analysis.
Part III: Causal Research Design: Experimentation: Research Design Concepts:Dependent and Independent Variables, Extraneous Variable, Control, ConfoundedRelationship, Research Hypothesis, Experimental and Non-experimentalHypothesis Testing Research, Experimental and Control Groups, Treatments,Experiment, Experimental Units—Classification of Research Designs: ExploratoryStudies, Descriptive Studies, Causal Studies—Choosing a Research Design—Benefits of Research Designs. Issues In Experimentation: Treatment or Indepen-dent Variable, Experimental Groups and Control Groups, Selection and Mea-surement of the Dependent Variable, Control of Extraneous Variables—Experimental Validity: Internal Validity, External Validity—Experimental Envi-ronment: Laboratory Environment, Field Environment—Types of ExperimentalDesigns: Pre-experimental Designs, True Experimental Designs, Quasi-Experi-mental Designs, Statistical Designs, Completely Randomized Design (CBD),Randomized Block Design, Latin Square Design, Factorial Design.
Part III: Sources and Methods of Data Collection:Qualitative and Quantitative Data
Case Study 6: Launching Fruit Flavoured Soft Drinksat Fresh Cola (A)
Chapter 4: Scales and Measurement: Identifying and Deciding on the Variables tobe Measured—Development of Measurement Scales—Types of MeasurementScales: Nominal Scale, Ordinal Scale, Interval Scale, Ratio Scale—Criteria ForGood Measurement: Reliability, Test-Retest Reliability, Equivalent form Reli-ability, Internal Consistency, Validity, Face Validity, Content Validity, Criterion-Related Validity, Construct Validity, Sensitivity, Generalizability, Relevance—Sources of Measurement Problems: Respondent Associated Errors, Non-responseErrors, Response Bias, Instrument Associated Errors, Situational Errors, Measureras Error Source.
Chapter 5: Questionnaire Design: Preliminary Decisions: Required Information,Target Respondents, Interviewing Technique—Question Content—The Utility ofData, Effectiveness in Producing Data, The Participant’s Ability to AnswerAccurately, The Respondent’s Willingness to Answer Accurately, Effect ofExternal Events—Response Format-Open-Ended Questions, Close-ended
Preface ix
Questions—Question Wording: Shared Vocabulary, Unsupported Assumptions,Frame of Reference, Biased Wording, Adequate Alternatives, Double-BarrelledQuestions, Generalizations and Estimates—Questionnaire Sequence: Lead-inQuestions, Qualifying Questions, Warm-up Questions, Specific Questions,Demographic Questions—Questionnaire Pretesting, Revision and Final Draft.
Part IV: Multivariate Data Analysis Using IBM SPSS 20.0
Chapter 6: Data Preparation and Preliminary Analysis: Validating and Editing:Treatment of Unsatisfactory Responses—Coding: Categorization Rules, CodeBook, Coding Close-Ended Questions, Coding Open-Ended Questions—DataEntry: Optical Scanning, Barcode Reader, Voice Recognition—Data Cleaning—Tabulation of Survey Results: One-Way Frequency Tabulation, Cross Tabulation—Data Mining: Data Mining in Management Research, The Data Mining Process.
Chapter 7: Experimental Analysis of Variance (ANOVA): Objectives, overview,relationship among techniques, statistics associated with one-way analysis ofvariance, Analysis of randomized block, Latin square and factorial design.
Case Study 10: Launching Fruit Flavoured Soft Drinksat Fresh Cola (B)
Chapter 8: Multiple Regression: Statistics associated with multiple regressions,assumptions of regression-normality, linearity, multicollinearity, heteroscedastic-ity, autocorrelation. How to do regression analysis using SPSS.
Case Study: ABC Group: Analysis of Sales
Videos: How to Do Regression Using SPSS
Chapter 9: Exploratory Factor and Principal Component Analysis: Basic concept,factor analysis model, statistics associated with factor analysis, assumptions offactor analysis, How to do factor analysis using SPSS.
x Preface
Case Study: Aaron Group of Companies:A Consumer Perception Analysis
Videos: How to Do Factor Analysis Using SPSS
Chapter 10: Cluster Analysis: Objectives, basic concept, statistics associated withcluster analysis, steps to conduct cluster analysis. How to do cluster analysis usingSPSS.
Case Study: ABC Group: Identifying Exploratory BuyerBehaviour Tendency
Video: How to Do Cluster Analysis Using SPSS
Chapter 11: Binary Logistic Regression: Chapter Overview, Logistic Regression,An example of logistic regression, SPSS procedure for logistic regression.
Case Study: Defaulter Prediction
Part V: Data Presentation
Chapter 12: Business Research Reports: Types of Research Reports: ShortReports, Long Reports—Components of Research Reports: Prefatory information,Introduction, Methodology, Findings, Conclusions and Recommendations,Appendices, Bibliography—Written Presentation: Pre-writing Concerns, Writingthe Draft, Presentation of the Research Report—Oral Presentations: Initial Plan-ning, Preparation, Making the Presentation, Delivery—Visual Aids: Tables, Chartsand Graphs.
S. SreejeshSanjay Mohapatra
M. R. Anusree
Preface xi

Acknowledgments
The book has been written after being ‘class tested’. The manuscript has beenpossible because of class notes and several comments that we have received fromdifferent sources. As a result, the book is complete with concepts, examples andcases. We hope this will be liked by readers.
We would also like to thank our family members for their unstinted and con-tinued support in every walk of our lives.
Finally to God, who graced us with his blessing so that we could make it allpossible.
Dr. S. SreejeshDr. Sanjay Mohapatra
Dr. M. R. Anusree
xiii
Contents
Part I Overview of Business Research
1 Introduction to Business Research. . . . . . . . . . . . . . . . . . . . . . . . 31.1 Scope of Business Research . . . . . . . . . . . . . . . . . . . . . . . . 31.2 Basic Research and Applied Research . . . . . . . . . . . . . . . . . 41.3 Role of Business Research in Decision-Making . . . . . . . . . . 4
1.3.1 Problem/Opportunity Identification . . . . . . . . . . . . 51.3.2 Problem/Opportunity Prioritization
and Selection . . . . . . . . . . . . . . . . . . . . . . . . . . . 61.3.3 Problem/Opportunity Resolution . . . . . . . . . . . . . . 61.3.4 Implementing the Course of Action. . . . . . . . . . . . 7
1.4 Factors Affecting Business Research . . . . . . . . . . . . . . . . . . 71.4.1 Time Constraint . . . . . . . . . . . . . . . . . . . . . . . . . 71.4.2 Availability of Resources . . . . . . . . . . . . . . . . . . . 81.4.3 Nature of Information Sought . . . . . . . . . . . . . . . . 81.4.4 Benefits Versus Cost . . . . . . . . . . . . . . . . . . . . . . 9
1.5 Globalization and Business Research. . . . . . . . . . . . . . . . . . 91.6 Business Research and the Internet . . . . . . . . . . . . . . . . . . . 10
1.6.1 Primary Research . . . . . . . . . . . . . . . . . . . . . . . . 101.6.2 Secondary Research. . . . . . . . . . . . . . . . . . . . . . . 11
1.7 Summary . . . . . . . . . . . . . . . . . . . . . . . . . . . . . . . . . . . . . 11
2 Business Research Process . . . . . . . . . . . . . . . . . . . . . . . . . . . . . 132.1 Steps in the Research Process. . . . . . . . . . . . . . . . . . . . . . . 13
2.1.1 Identifying and Definingthe Problem/Opportunity . . . . . . . . . . . . . . . . . . . 13
2.1.2 Exploratory Research. . . . . . . . . . . . . . . . . . . . . . 142.1.3 Preparing the Statement of Research Objectives . . . 152.1.4 Developing the Hypotheses . . . . . . . . . . . . . . . . . 152.1.5 Planning the Research Design. . . . . . . . . . . . . . . . 162.1.6 Selecting the Research Method . . . . . . . . . . . . . . . 172.1.7 Surveys . . . . . . . . . . . . . . . . . . . . . . . . . . . . . . . 172.1.8 Experiments . . . . . . . . . . . . . . . . . . . . . . . . . . . . 18
xv
2.1.9 Secondary Data Studies . . . . . . . . . . . . . . . . . . . . 182.1.10 Observation Techniques . . . . . . . . . . . . . . . . . . . . 182.1.11 Analysing Research Designs. . . . . . . . . . . . . . . . . 182.1.12 Selecting the Sampling Procedure . . . . . . . . . . . . . 192.1.13 Data Collection. . . . . . . . . . . . . . . . . . . . . . . . . . 202.1.14 Evaluating the Data . . . . . . . . . . . . . . . . . . . . . . . 202.1.15 Analysis . . . . . . . . . . . . . . . . . . . . . . . . . . . . . . . 212.1.16 Preparing and Presenting the Research Report . . . . 21
2.2 Summary . . . . . . . . . . . . . . . . . . . . . . . . . . . . . . . . . . . . . 22
Part II Research Design
3 Business Research Design: Exploratory, Descriptiveand Causal Designs. . . . . . . . . . . . . . . . . . . . . . . . . . . . . . . . . . . 253.1 Introduction . . . . . . . . . . . . . . . . . . . . . . . . . . . . . . . . . . . 273.2 Part I: Exploratory Research Design . . . . . . . . . . . . . . . . . . 31
3.2.1 Exploratory Research Design: Secondary Data . . . . 313.2.2 Exploratory Research: Qualitative Data . . . . . . . . . 463.2.3 Depth Interviews. . . . . . . . . . . . . . . . . . . . . . . . . 473.2.4 Focus Group Interview . . . . . . . . . . . . . . . . . . . . 513.2.5 Projective Techniques . . . . . . . . . . . . . . . . . . . . . 54
3.3 Part II: Descriptive Research Design . . . . . . . . . . . . . . . . . . 583.3.1 Descriptive Research Design: Survey
and Observation . . . . . . . . . . . . . . . . . . . . . . . . . 583.3.2 Classifying Survey Research Methods . . . . . . . . . . 583.3.3 Questionnaire Design. . . . . . . . . . . . . . . . . . . . . . 583.3.4 Cross-Sectional and Longitudinal Studies. . . . . . . . 613.3.5 Survey Methods . . . . . . . . . . . . . . . . . . . . . . . . . 623.3.6 Personal Interviews . . . . . . . . . . . . . . . . . . . . . . . 623.3.7 Telephonic Interviews . . . . . . . . . . . . . . . . . . . . . 66
3.4 Self-Administered Interviews . . . . . . . . . . . . . . . . . . . . . . . 693.5 Mail Surveys . . . . . . . . . . . . . . . . . . . . . . . . . . . . . . . . . . 70
3.5.1 Factors Determining the Choiceof Survey Research . . . . . . . . . . . . . . . . . . . . . . . 71
3.5.2 Need to Expose the Respondentto Various Stimuli . . . . . . . . . . . . . . . . . . . . . . . . 72
3.5.3 Incidence Rate . . . . . . . . . . . . . . . . . . . . . . . . . . 723.5.4 Accuracy of the Resultant Data. . . . . . . . . . . . . . . 73
3.6 Errors in Survey Research . . . . . . . . . . . . . . . . . . . . . . . . . 733.6.1 Random Sampling Errors . . . . . . . . . . . . . . . . . . . 733.6.2 Systematic Errors . . . . . . . . . . . . . . . . . . . . . . . . 743.6.3 Administrative Errors . . . . . . . . . . . . . . . . . . . . . 743.6.4 Respondent Error . . . . . . . . . . . . . . . . . . . . . . . . 76
xvi Contents
3.7 Observation Methods. . . . . . . . . . . . . . . . . . . . . . . . . . . . . 783.7.1 Direct Observation . . . . . . . . . . . . . . . . . . . . . . . 783.7.2 Contrived Observation . . . . . . . . . . . . . . . . . . . . . 793.7.3 Content Analysis . . . . . . . . . . . . . . . . . . . . . . . . . 803.7.4 Physical Trace Measures . . . . . . . . . . . . . . . . . . . 803.7.5 Participant Observation . . . . . . . . . . . . . . . . . . . . 803.7.6 Behaviour Recording Devices . . . . . . . . . . . . . . . . 81
3.8 Part III: Causal Research Design . . . . . . . . . . . . . . . . . . . . 823.8.1 Causal Research Design: Experimentation . . . . . . . 823.8.2 Causal Relationships . . . . . . . . . . . . . . . . . . . . . . 823.8.3 Experimental Designs . . . . . . . . . . . . . . . . . . . . . 83
3.9 Issues in Experimentation . . . . . . . . . . . . . . . . . . . . . . . . . 843.9.1 Treatment of Independent Variable . . . . . . . . . . . . 843.9.2 Experimental Groups and Control Groups . . . . . . . 843.9.3 Selection and Measurement
of the Dependent Variable . . . . . . . . . . . . . . . . . . 853.9.4 Control of Extraneous Variables . . . . . . . . . . . . . . 85
3.10 Experimental Validity . . . . . . . . . . . . . . . . . . . . . . . . . . . . 863.10.1 Internal Validity . . . . . . . . . . . . . . . . . . . . . . . . . 863.10.2 External Validity. . . . . . . . . . . . . . . . . . . . . . . . . 89
3.11 Type of Experimental Designs . . . . . . . . . . . . . . . . . . . . . . 913.11.1 Pre-experimental Designs . . . . . . . . . . . . . . . . . . . 913.11.2 True Experimental Designs . . . . . . . . . . . . . . . . . 933.11.3 Quasi-Experimental Designs . . . . . . . . . . . . . . . . . 963.11.4 Statistical Designs . . . . . . . . . . . . . . . . . . . . . . . . 97
3.12 Questions . . . . . . . . . . . . . . . . . . . . . . . . . . . . . . . . . . . . . 101References . . . . . . . . . . . . . . . . . . . . . . . . . . . . . . . . . . . . . . . . . 103
Part III Sources and Methods of Data Collection: Qualitativeand Quantitative Data
4 Scales and Measurement. . . . . . . . . . . . . . . . . . . . . . . . . . . . . . . 1074.1 Identifying and Deciding on the Variables
to be Measured. . . . . . . . . . . . . . . . . . . . . . . . . . . . . . . . . 1074.2 Development of Measurement Scales . . . . . . . . . . . . . . . . . 1104.3 Types of Measurement Scales . . . . . . . . . . . . . . . . . . . . . . 112
4.3.1 Nominal Scale . . . . . . . . . . . . . . . . . . . . . . . . . . 1124.3.2 Ordinal Scale . . . . . . . . . . . . . . . . . . . . . . . . . . . 1134.3.3 Interval Scale . . . . . . . . . . . . . . . . . . . . . . . . . . . 1134.3.4 Ratio Scale. . . . . . . . . . . . . . . . . . . . . . . . . . . . . 114
4.4 Criteria for Good Measurement . . . . . . . . . . . . . . . . . . . . . 1144.4.1 Reliability . . . . . . . . . . . . . . . . . . . . . . . . . . . . . 1144.4.2 Test–Retest Reliability . . . . . . . . . . . . . . . . . . . . . 115
Contents xvii
4.4.3 Equivalent Form Reliability . . . . . . . . . . . . . . . . . 1154.4.4 Internal Consistency . . . . . . . . . . . . . . . . . . . . . . 1154.4.5 Validity . . . . . . . . . . . . . . . . . . . . . . . . . . . . . . . 1164.4.6 Face Validity . . . . . . . . . . . . . . . . . . . . . . . . . . . 1164.4.7 Content Validity . . . . . . . . . . . . . . . . . . . . . . . . . 1164.4.8 Criterion-Related Validity . . . . . . . . . . . . . . . . . . 1174.4.9 Construct Validity . . . . . . . . . . . . . . . . . . . . . . . . 1174.4.10 Sensitivity . . . . . . . . . . . . . . . . . . . . . . . . . . . . . 1184.4.11 Generalizability. . . . . . . . . . . . . . . . . . . . . . . . . . 1184.4.12 Relevance . . . . . . . . . . . . . . . . . . . . . . . . . . . . . 119
4.5 Sources of Measurement Problems . . . . . . . . . . . . . . . . . . . 1194.5.1 Respondent-Associated Errors. . . . . . . . . . . . . . . . 1194.5.2 Non-response Errors . . . . . . . . . . . . . . . . . . . . . . 1194.5.3 Response Bias . . . . . . . . . . . . . . . . . . . . . . . . . . 1204.5.4 Instrument-Associated Errors . . . . . . . . . . . . . . . . 1204.5.5 Situational Errors . . . . . . . . . . . . . . . . . . . . . . . . 1204.5.6 Measurer as Error Source. . . . . . . . . . . . . . . . . . . 121
4.6 Attitude Measurement . . . . . . . . . . . . . . . . . . . . . . . . . . . . 1214.7 Components of Attitude. . . . . . . . . . . . . . . . . . . . . . . . . . . 122
4.7.1 Cognitive Component . . . . . . . . . . . . . . . . . . . . . 1224.7.2 Affective Component. . . . . . . . . . . . . . . . . . . . . . 1224.7.3 Behavioural Component . . . . . . . . . . . . . . . . . . . . 123
4.8 Relationship Between Attitudes and Behaviour. . . . . . . . . . . 1234.9 Changing Attitudes . . . . . . . . . . . . . . . . . . . . . . . . . . . . . . 124
4.9.1 Altering Existing Beliefs About a Product . . . . . . . 1244.9.2 Changing Attitudes by Changing
the Importance of Beliefs . . . . . . . . . . . . . . . . . . . 1254.9.3 Adding New Beliefs . . . . . . . . . . . . . . . . . . . . . . 125
4.10 Association Between Measurement of Beliefsand Situation . . . . . . . . . . . . . . . . . . . . . . . . . . . . . . . . . . 126
4.11 Attitude Scales . . . . . . . . . . . . . . . . . . . . . . . . . . . . . . . . . 1274.12 Definition of Attitude Scale and Scaling . . . . . . . . . . . . . . . 1284.13 Types of Attitude Scales . . . . . . . . . . . . . . . . . . . . . . . . . . 128
4.13.1 Single-Item Scales. . . . . . . . . . . . . . . . . . . . . . . . 1284.13.2 Itemized Category Scales . . . . . . . . . . . . . . . . . . . 1284.13.3 Rank: Order Scales . . . . . . . . . . . . . . . . . . . . . . . 1294.13.4 Q-Sort Scales . . . . . . . . . . . . . . . . . . . . . . . . . . . 1304.13.5 Comparative Scales . . . . . . . . . . . . . . . . . . . . . . . 1304.13.6 Paired Comparison Scales . . . . . . . . . . . . . . . . . . 1314.13.7 Constant Sum Scales . . . . . . . . . . . . . . . . . . . . . . 1324.13.8 Pictorial Scales . . . . . . . . . . . . . . . . . . . . . . . . . . 1324.13.9 Continuous Scales . . . . . . . . . . . . . . . . . . . . . . . . 1334.13.10 Multi-Item Scales . . . . . . . . . . . . . . . . . . . . . . . . 1344.13.11 Semantic Differential Scales . . . . . . . . . . . . . . . . . 135
xviii Contents
4.13.12 Stapel Scales . . . . . . . . . . . . . . . . . . . . . . . . . . . 1364.13.13 Likert Scales . . . . . . . . . . . . . . . . . . . . . . . . . . . 1374.13.14 Thurstone Scales . . . . . . . . . . . . . . . . . . . . . . . . . 1394.13.15 Profile Analysis . . . . . . . . . . . . . . . . . . . . . . . . . 139
4.14 Considerations in Selecting a Scale . . . . . . . . . . . . . . . . . . . 1404.14.1 Balanced Versus Unbalanced Scales . . . . . . . . . . . 1404.14.2 Number of Categories . . . . . . . . . . . . . . . . . . . . . 1414.14.3 Odd or Even Number of Scale Categories . . . . . . . 1414.14.4 Forced Versus Unforced Choice . . . . . . . . . . . . . . 141
References . . . . . . . . . . . . . . . . . . . . . . . . . . . . . . . . . . . . . . . . . 142
5 Questionnaire Design . . . . . . . . . . . . . . . . . . . . . . . . . . . . . . . . . 1435.1 Preliminary Decisions . . . . . . . . . . . . . . . . . . . . . . . . . . . . 143
5.1.1 Required Information. . . . . . . . . . . . . . . . . . . . . . 1445.1.2 Target Respondents . . . . . . . . . . . . . . . . . . . . . . . 1445.1.3 Interviewing Technique . . . . . . . . . . . . . . . . . . . . 144
5.2 Question Content . . . . . . . . . . . . . . . . . . . . . . . . . . . . . . . 1455.2.1 The Utility of Data . . . . . . . . . . . . . . . . . . . . . . . 1455.2.2 Effectiveness in Producing Data . . . . . . . . . . . . . . 1455.2.3 The Participant’s Ability to Answer Accurately . . . 1465.2.4 The Respondent’s Willingness
to Answer Accurately . . . . . . . . . . . . . . . . . . . . . 1475.2.5 Effect of External Events . . . . . . . . . . . . . . . . . . . 147
5.3 Response Format . . . . . . . . . . . . . . . . . . . . . . . . . . . . . . . 1475.3.1 Open-Ended Questions. . . . . . . . . . . . . . . . . . . . . 1485.3.2 Free Response . . . . . . . . . . . . . . . . . . . . . . . . . . 1485.3.3 Probing . . . . . . . . . . . . . . . . . . . . . . . . . . . . . . . 1485.3.4 Projective . . . . . . . . . . . . . . . . . . . . . . . . . . . . . . 1495.3.5 Close-Ended Questions . . . . . . . . . . . . . . . . . . . . 1495.3.6 Binary Questions. . . . . . . . . . . . . . . . . . . . . . . . . 1495.3.7 Ranking Questions . . . . . . . . . . . . . . . . . . . . . . . 1505.3.8 Multiple-Choice Questions . . . . . . . . . . . . . . . . . . 1515.3.9 Checklist Questions . . . . . . . . . . . . . . . . . . . . . . . 151
5.4 Question Wording. . . . . . . . . . . . . . . . . . . . . . . . . . . . . . . 1535.4.1 Shared Vocabulary . . . . . . . . . . . . . . . . . . . . . . . 1545.4.2 Unsupported Assumptions . . . . . . . . . . . . . . . . . . 1545.4.3 Frame of Reference . . . . . . . . . . . . . . . . . . . . . . . 1545.4.4 Biased Wording . . . . . . . . . . . . . . . . . . . . . . . . . 1555.4.5 Adequate Alternatives . . . . . . . . . . . . . . . . . . . . . 1555.4.6 Double-Barrelled Questions . . . . . . . . . . . . . . . . . 1555.4.7 Generalizations and Estimates. . . . . . . . . . . . . . . . 156
5.5 Questionnaire Sequence . . . . . . . . . . . . . . . . . . . . . . . . . . . 1565.5.1 Lead-in Questions . . . . . . . . . . . . . . . . . . . . . . . . 1565.5.2 Qualifying Questions . . . . . . . . . . . . . . . . . . . . . . 157
Contents xix
5.5.3 Warm-Up Questions . . . . . . . . . . . . . . . . . . . . . . 1575.5.4 Specific Questions. . . . . . . . . . . . . . . . . . . . . . . . 1575.5.5 Demographic Questions . . . . . . . . . . . . . . . . . . . . 158
5.6 Questionnaire Pre-testing, Revision and Final Draft . . . . . . . 1585.7 Summary . . . . . . . . . . . . . . . . . . . . . . . . . . . . . . . . . . . . . 158Reference . . . . . . . . . . . . . . . . . . . . . . . . . . . . . . . . . . . . . . . . . . 159
Part IV Multivariate Data Analysis Using IBM SPSS 20.0
6 Data Preparation and Preliminary Analysis. . . . . . . . . . . . . . . . . 1636.1 Validating and Editing. . . . . . . . . . . . . . . . . . . . . . . . . . . . 163
6.1.1 Treatment of Unsatisfactory Responses . . . . . . . . . 1666.2 Coding . . . . . . . . . . . . . . . . . . . . . . . . . . . . . . . . . . . . . . 167
6.2.1 Categorization Rules . . . . . . . . . . . . . . . . . . . . . . 1676.2.2 Code Book . . . . . . . . . . . . . . . . . . . . . . . . . . . . . 1686.2.3 Coding Close-Ended Questions . . . . . . . . . . . . . . . 1686.2.4 Coding Open-Ended Questions . . . . . . . . . . . . . . . 1686.2.5 Coding ‘Do not Knows’. . . . . . . . . . . . . . . . . . . . 171
6.3 Data Entry . . . . . . . . . . . . . . . . . . . . . . . . . . . . . . . . . . . . 1726.4 Data Cleaning . . . . . . . . . . . . . . . . . . . . . . . . . . . . . . . . . 1726.5 Tabulation of Survey Results . . . . . . . . . . . . . . . . . . . . . . . 173
6.5.1 One-Way Frequency Tabulation . . . . . . . . . . . . . . 1736.5.2 Cross Tabulation . . . . . . . . . . . . . . . . . . . . . . . . . 174
6.6 Data Mining. . . . . . . . . . . . . . . . . . . . . . . . . . . . . . . . . . . 1766.6.1 Data Mining in Management Research . . . . . . . . . 1766.6.2 The Data Mining Process . . . . . . . . . . . . . . . . . . . 179
6.7 Summary . . . . . . . . . . . . . . . . . . . . . . . . . . . . . . . . . . . . . 180References . . . . . . . . . . . . . . . . . . . . . . . . . . . . . . . . . . . . . . . . . 181
7 Experimental Analysis of Variance (ANOVA) . . . . . . . . . . . . . . . 1837.1 Launching Fruit Flavoured Soft Drinks at Fresh Cola (A) . . . 183
7.1.1 Experiment-1 . . . . . . . . . . . . . . . . . . . . . . . . . . . 1857.1.2 Experiment-2 (a) . . . . . . . . . . . . . . . . . . . . . . . . . 1867.1.3 Experiment-2 (b). . . . . . . . . . . . . . . . . . . . . . . . . 1867.1.4 Experiment-3 . . . . . . . . . . . . . . . . . . . . . . . . . . . 1867.1.5 Experiment-4 . . . . . . . . . . . . . . . . . . . . . . . . . . . 1877.1.6 Questions for Discussion . . . . . . . . . . . . . . . . . . . 187
7.2 Launching Fruit Flavoured Soft Drinks at Fresh Cola (B) . . . 1887.2.1 Experiment-1 . . . . . . . . . . . . . . . . . . . . . . . . . . . 1887.2.2 Experiment-2 (a) . . . . . . . . . . . . . . . . . . . . . . . . . 1887.2.3 Experiment-2 (b). . . . . . . . . . . . . . . . . . . . . . . . . 1887.2.4 Experiment-3 . . . . . . . . . . . . . . . . . . . . . . . . . . . 1887.2.5 Experiment-4 . . . . . . . . . . . . . . . . . . . . . . . . . . . 1897.2.6 Questions for Discussion . . . . . . . . . . . . . . . . . . . 193
xx Contents
8 Multiple Regression . . . . . . . . . . . . . . . . . . . . . . . . . . . . . . . . . . 1958.1 Introduction . . . . . . . . . . . . . . . . . . . . . . . . . . . . . . . . . . . 1958.2 Important Assumptions of Multiple Regression . . . . . . . . . . 1958.3 Multiple Regression Model with Three
Independent Variables . . . . . . . . . . . . . . . . . . . . . . . . . . . . 1968.4 Multiple Regression Equation. . . . . . . . . . . . . . . . . . . . . . . 1968.5 Regression Analysis Using SPSS . . . . . . . . . . . . . . . . . . . . 1978.6 Output Interpretation for Regression Analysis . . . . . . . . . . . 1988.7 Examination of Major Assumptions of Multiple
Regression Analysis . . . . . . . . . . . . . . . . . . . . . . . . . . . . . 2028.7.1 Examination of Residual . . . . . . . . . . . . . . . . . . . 2028.7.2 Test of Linearity . . . . . . . . . . . . . . . . . . . . . . . . . 2028.7.3 Test of Normality . . . . . . . . . . . . . . . . . . . . . . . . 2028.7.4 Test of Homogeneity of Variance
(Homoscedasticity) . . . . . . . . . . . . . . . . . . . . . . . 2038.7.5 Test of Autocorrelation . . . . . . . . . . . . . . . . . . . . 2038.7.6 Test of Multicollinearity . . . . . . . . . . . . . . . . . . . 2038.7.7 Questions . . . . . . . . . . . . . . . . . . . . . . . . . . . . . . 204
9 Exploratory Factor and Principal Component Analysis . . . . . . . . 2079.1 What is Factor Analysis. . . . . . . . . . . . . . . . . . . . . . . . . . . 2079.2 Factor Analysis Versus Principal Component Analysis . . . . . 2099.3 A Hypothetical Example of Factor Analysis. . . . . . . . . . . . . 2109.4 SPSS Procedures for Performing Factor Analysis on PDI,
Price and Value Consciousness and Sale Proneness Datain Windows . . . . . . . . . . . . . . . . . . . . . . . . . . . . . . . . . . . 211
9.5 KMO and Bartlett’s Test of Sphericity(Under Correlation Matrix) . . . . . . . . . . . . . . . . . . . . . . . . 217
9.6 Principle Component Analysis . . . . . . . . . . . . . . . . . . . . . . 2179.7 Unrotated Factor Solution . . . . . . . . . . . . . . . . . . . . . . . . . 2189.8 Scree Plot . . . . . . . . . . . . . . . . . . . . . . . . . . . . . . . . . . . . 2189.9 Eigen Values and Eigen Values Greater than One . . . . . . . . 2189.10 Rotated Solution . . . . . . . . . . . . . . . . . . . . . . . . . . . . . . . . 2199.11 SPSS Syntax Method . . . . . . . . . . . . . . . . . . . . . . . . . . . . 2209.12 Output 1: IBM SPSS 20.0 Output for Factor Analysis. . . . . . 2209.13 Results and Interpretation . . . . . . . . . . . . . . . . . . . . . . . . . 2219.14 Key Statistics . . . . . . . . . . . . . . . . . . . . . . . . . . . . . . . . . . 2279.15 Review Questions . . . . . . . . . . . . . . . . . . . . . . . . . . . . . . . 227Reference . . . . . . . . . . . . . . . . . . . . . . . . . . . . . . . . . . . . . . . . . . 228
10 Cluster Analysis . . . . . . . . . . . . . . . . . . . . . . . . . . . . . . . . . . . . . 22910.1 Steps for Conducting the Cluster Analysis . . . . . . . . . . . . . . 229
10.1.1 Step 1: Problem Definition. . . . . . . . . . . . . . . . . . 231
Contents xxi
10.1.2 Step 2: Selection of Appropriate Distanceor Similarity Measure . . . . . . . . . . . . . . . . . . . . . 232
10.1.3 Step 3: Selection of Clustering Type . . . . . . . . . . . 23210.2 SPSS Output Interpretation for Hierarchical Clustering . . . . . 234
10.2.1 Step 4: Decide Number of Clusters to be Retainedin the Final Cluster Solution. . . . . . . . . . . . . . . . . 237
10.2.2 Step 5: Calculate Cluster Centroid and GiveMeaning to Cluster Solution . . . . . . . . . . . . . . . . . 238
10.2.3 Step 6: Assess the Cluster Validityand Model Fit . . . . . . . . . . . . . . . . . . . . . . . . . . . 238
10.3 SPSS Procedure for Hierarchical Cluster Analysis . . . . . . . . 24010.4 Questions . . . . . . . . . . . . . . . . . . . . . . . . . . . . . . . . . . . . . 243
11 Binary Logistic Regression . . . . . . . . . . . . . . . . . . . . . . . . . . . . . 24511.1 Chapter Overview . . . . . . . . . . . . . . . . . . . . . . . . . . . . . . . 24511.2 Logistic Regression . . . . . . . . . . . . . . . . . . . . . . . . . . . . . . 24511.3 Logistic Curve Versus Regression Line . . . . . . . . . . . . . . . . 24611.4 Hypothetical Example of Logistic Regression: Defaulter
Prediction . . . . . . . . . . . . . . . . . . . . . . . . . . . . . . . . . . . . 24811.5 Logistic Regression Equation for Defaulter Prediction. . . . . . 24811.6 SPSS Procedures for Performing Factor Analysis
on Defaulter Prediction . . . . . . . . . . . . . . . . . . . . . . . . . . . 24811.7 IBM SPSS 20.0 Syntax for Binary Logistic Regression . . . . . 25211.8 IBM SPSS 20.0 Output for Logistic Regression . . . . . . . . . . 25211.9 Assessing a Model’s Fit and Predictive Ability. . . . . . . . . . . 25511.10 Questions . . . . . . . . . . . . . . . . . . . . . . . . . . . . . . . . . . . . . 257
Part V Data Presentation
12 Business Research Reports . . . . . . . . . . . . . . . . . . . . . . . . . . . . . 26112.1 Types of Research Reports. . . . . . . . . . . . . . . . . . . . . . . . . 261
12.1.1 Short Reports . . . . . . . . . . . . . . . . . . . . . . . . . . . 26112.1.2 Long Reports . . . . . . . . . . . . . . . . . . . . . . . . . . . 262
12.2 Components of Research Reports . . . . . . . . . . . . . . . . . . . . 26312.2.1 Prefatory Information . . . . . . . . . . . . . . . . . . . . . 26312.2.2 Introduction . . . . . . . . . . . . . . . . . . . . . . . . . . . . 26512.2.3 Methodology . . . . . . . . . . . . . . . . . . . . . . . . . . . 26512.2.4 Findings . . . . . . . . . . . . . . . . . . . . . . . . . . . . . . . 26712.2.5 Conclusions and Recommendations . . . . . . . . . . . . 26712.2.6 Appendices. . . . . . . . . . . . . . . . . . . . . . . . . . . . . 26712.2.7 Bibliography. . . . . . . . . . . . . . . . . . . . . . . . . . . . 267
xxii Contents

12.3 Written Presentation . . . . . . . . . . . . . . . . . . . . . . . . . . . . . 26812.3.1 Pre-writing Concerns . . . . . . . . . . . . . . . . . . . . . . 26812.3.2 Writing the Draft . . . . . . . . . . . . . . . . . . . . . . . . 26912.3.3 Presentation of the Research Report . . . . . . . . . . . 270
12.4 Oral Presentations . . . . . . . . . . . . . . . . . . . . . . . . . . . . . . . 27112.4.1 Initial Planning . . . . . . . . . . . . . . . . . . . . . . . . . . 27112.4.2 Preparation . . . . . . . . . . . . . . . . . . . . . . . . . . . . . 27212.4.3 Making the Presentation. . . . . . . . . . . . . . . . . . . . 27212.4.4 Delivery. . . . . . . . . . . . . . . . . . . . . . . . . . . . . . . 273
12.5 Visual Aids . . . . . . . . . . . . . . . . . . . . . . . . . . . . . . . . . . . 27412.5.1 Tables . . . . . . . . . . . . . . . . . . . . . . . . . . . . . . . . 27412.5.2 Charts and Graphs. . . . . . . . . . . . . . . . . . . . . . . . 275
12.6 Summary . . . . . . . . . . . . . . . . . . . . . . . . . . . . . . . . . . . . . 276
Index . . . . . . . . . . . . . . . . . . . . . . . . . . . . . . . . . . . . . . . . . . . . . . . . 279
Contents xxiii

Part IOverview of Business Research
Chapter 1Introduction to Business Research
In the present fast track business environment marked by cut-throat competition,many organizations rely on business research to gain a competitive advantage andgreater market share. A good research study helps organizations to understandprocesses, products, customers, markets and competition, to develop policies,strategies and tactics that are most likely to succeed.
Business research can be defined as a systematic and objective process ofgathering, recording and analysing data that provide information to guide businessdecisions. It is used to understand the market trends, or find the optimal marketingmix, devise effective HR policies, or find the best investment options. This chapterprovides an overview of business research and its role in decision-making. First,we shall discuss the scope of business research. Then, we shall understand the twocategories of business research studies, basic research and applied research. Later,we shall discuss the role of business research in decision-making and evaluate thefactors that influence the need for business research. Finally, we shall examinehow globalization and the Internet are influencing business research.
1.1 Scope of Business Research
Business research is used to solve the various operational and planning problemsthat arise in a business organization. These may include problems related tomarketing, finance, HR and manufacturing. The three major forms of businessresearch are as follows: market research, operations research and motivationalresearch. Market research aims at understanding and examining the marketplace inwhich the company operates. This helps the organization devise effective businesspolicies and marketing strategies. Operations research involves use of mathe-matical, logical and analytical methods to find optimal solutions to businessproblems. Operations research is primarily used for forecasting demand, opti-mizing production and finding the best investment options. Motivational researchinvolves analysing the reasons and motives behind people’s behaviour. Motiva-tional research is used to understand consumer behaviour. It is also used tounderstand employee behaviour.
S. Sreejesh et al., Business Research Methods,DOI: 10.1007/978-3-319-00539-3_1,� Springer International Publishing Switzerland 2014
3
1.2 Basic Research and Applied Research
Business research is conducted either to expand knowledge about a particularaspect or to find a solution to a particular problem. Business research studies canbe classified into two categories—basic research and applied research.
Basic research refers to a focused, systematic study or investigation undertakento discover new knowledge or interpretations and establish facts or principles in aparticular field. In other words, it is a research aimed primarily at gainingknowledge rather than solving a pragmatic problem. The underlying motive is toincrease knowledge about particular phenomena by testing, refining and elabo-rating theory without concern for practical application. Examples of such basicresearch include the following:
1. Understanding the consumer buying process2. Examining the consumer learning process.
Applied research refers to investigation undertaken to discover the applicationsand uses of theories, knowledge and principles in actual work or in solvingproblems. In other words, it is any research that is used to answer a specificquestion, determine why something failed or succeeded, solve a specific, prag-matic problem, or to gain better understanding. Examples include the following:Evaluating the impact of a training programme on employee performance.Examining consumer response to direct marketing programmes Although thepurpose of these two research forms varies, there is not much difference in theresearch methods and tools used for their conduct. Both these research forms usescientific methods in various stages of the research process. The scientific methodrefers to a systematic approach towards observing phenomena, drawing conclu-sions and testing hypotheses. Scientific methods involve systematic analysis andlogical interpretation of empirical evidence to establish facts or to prove a theory.
In basic research, first the hypothesis is tested through experimentation andobservation. Then, logical interpretations and conclusions are made about a par-ticular phenomenon. These conclusions lead to the formation of general laws aboutthat phenomenon. However, applied research involves developing alternatives to aparticular problem and finding the best alternative among them.
1.3 Role of Business Research in Decision-Making
For effective planning and implementation of business decisions, accurate infor-mation about the internal business environment and the external business envi-ronment is of primary importance. The key objective of any business research is toprovide accurate, relevant and timely information to the top management, so thatthey can make effective decisions. The business decision-making process in anorganization goes through these key interrelated stages (see Fig. 1.1). They are:
4 1 Introduction to Business Research
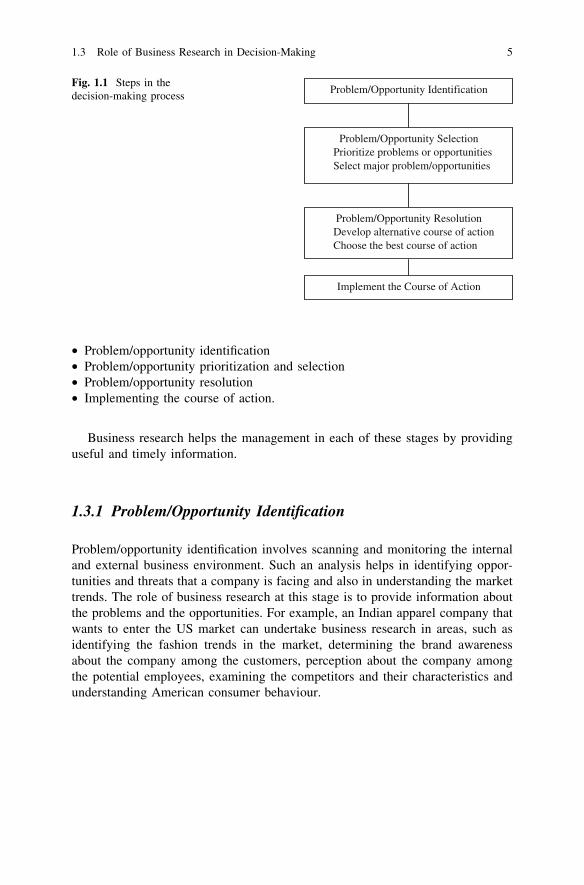
• Problem/opportunity identification• Problem/opportunity prioritization and selection• Problem/opportunity resolution• Implementing the course of action.
Business research helps the management in each of these stages by providinguseful and timely information.
1.3.1 Problem/Opportunity Identification
Problem/opportunity identification involves scanning and monitoring the internaland external business environment. Such an analysis helps in identifying oppor-tunities and threats that a company is facing and also in understanding the markettrends. The role of business research at this stage is to provide information aboutthe problems and the opportunities. For example, an Indian apparel company thatwants to enter the US market can undertake business research in areas, such asidentifying the fashion trends in the market, determining the brand awarenessabout the company among the customers, perception about the company amongthe potential employees, examining the competitors and their characteristics andunderstanding American consumer behaviour.
Problem/Opportunity Identification
Problem/Opportunity SelectionPrioritize problems or opportunitiesSelect major problem/opportunities
Problem/Opportunity ResolutionDevelop alternative course of actionChoose the best course of action
Implement the Course of Action
••
••
Fig. 1.1 Steps in thedecision-making process
1.3 Role of Business Research in Decision-Making 5
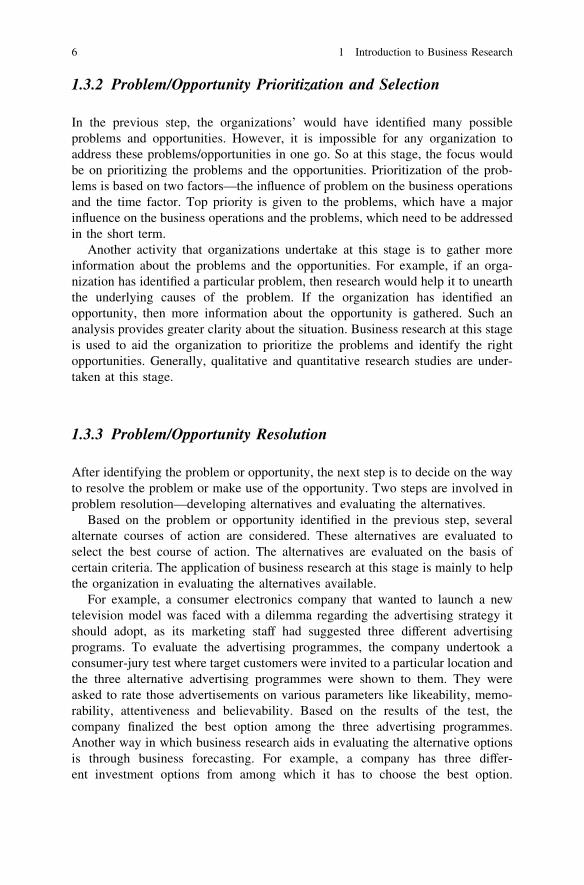
1.3.2 Problem/Opportunity Prioritization and Selection
In the previous step, the organizations’ would have identified many possibleproblems and opportunities. However, it is impossible for any organization toaddress these problems/opportunities in one go. So at this stage, the focus wouldbe on prioritizing the problems and the opportunities. Prioritization of the prob-lems is based on two factors—the influence of problem on the business operationsand the time factor. Top priority is given to the problems, which have a majorinfluence on the business operations and the problems, which need to be addressedin the short term.
Another activity that organizations undertake at this stage is to gather moreinformation about the problems and the opportunities. For example, if an orga-nization has identified a particular problem, then research would help it to unearththe underlying causes of the problem. If the organization has identified anopportunity, then more information about the opportunity is gathered. Such ananalysis provides greater clarity about the situation. Business research at this stageis used to aid the organization to prioritize the problems and identify the rightopportunities. Generally, qualitative and quantitative research studies are under-taken at this stage.
1.3.3 Problem/Opportunity Resolution
After identifying the problem or opportunity, the next step is to decide on the wayto resolve the problem or make use of the opportunity. Two steps are involved inproblem resolution—developing alternatives and evaluating the alternatives.
Based on the problem or opportunity identified in the previous step, severalalternate courses of action are considered. These alternatives are evaluated toselect the best course of action. The alternatives are evaluated on the basis ofcertain criteria. The application of business research at this stage is mainly to helpthe organization in evaluating the alternatives available.
For example, a consumer electronics company that wanted to launch a newtelevision model was faced with a dilemma regarding the advertising strategy itshould adopt, as its marketing staff had suggested three different advertisingprograms. To evaluate the advertising programmes, the company undertook aconsumer-jury test where target customers were invited to a particular location andthe three alternative advertising programmes were shown to them. They wereasked to rate those advertisements on various parameters like likeability, memo-rability, attentiveness and believability. Based on the results of the test, thecompany finalized the best option among the three advertising programmes.Another way in which business research aids in evaluating the alternative optionsis through business forecasting. For example, a company has three differ-ent investment options from among which it has to choose the best option.
6 1 Introduction to Business Research
By forecasting the revenue potential of each investment option, the company canselect the investment option, which has the highest revenue potential.
1.3.4 Implementing the Course of Action
After deciding upon the best course of action, the organization has to effectivelyimplement it. At this stage, business research is mainly used to monitor and controlthe programmes that are being implemented. Evaluative research studies areundertaken at this stage. One type of evaluative research study used is performanceresearch. In this type of research, the performance of a particular activity ismeasured, so that it can be compared with the objectives set for that activity. Forexample, if a company has offered a discount coupon scheme in the market, thecoupon redemption rate at the end of the scheme is measured and compared withthe objectives that were set for this scheme. This helps in evaluating the perfor-mance of the scheme.
Companies also monitor the performance of a particular activity continuouslyso as to identify the opportunities and detect the problems at an early stage. Thishelps a company in altering the plans or developing new programmes. Forexample, certain companies continuously track the sales at retail stores, so thatthey can identify which products are registering higher sales, the buying behaviourof consumers, and consumer preference towards the company’s products.
1.4 Factors Affecting Business Research
Although business research provides many benefits to an organization, it is not apanacea for all the problems that an organization faces. And conducting businessresearch also involves cost, time and effort. Therefore, an organization shoulddecide upon the option of conducting business research after considering variousfactors. These include time constraints, availability of resources, availability ofdata, nature of information that the organization is expecting and the costsinvolved.
1.4.1 Time Constraint
Time constraint is a key factor that influences a company’s decision regardingwhether to conduct a business research study or not. In certain cases, lack of timeprompts a company to take decisions without making any research study. Suddenchanges in competitors’ strategies, regulatory changes, change in the marketenvironment, or changes in the company’s operations, require immediate action.
1.3 Role of Business Research in Decision-Making 7
For example, P and G drastically cut the prices of its detergents in India, in May2004. HLL responded to the price cuts without making any study on the impli-cations of the price cuts on its product sales or image.
1.4.2 Availability of Resources
Another factor that influences the decision to undertake business research or not isthe availability of resources. The availability of resources can be either in terms ofbudgetary allocations or human resources. Lack of financial resources may lead toimproper conduct of a business research study. The results obtained from suchresearch, in turn, will be inaccurate. Lack of financial resources forces a companyto compromise on the way its research project is undertaken, such as taking asmaller sample size where the project demands a larger sample size, using cheapermethods of data collection and even comprising on the data analysis process that iscrucial for any business research study. Therefore, before conducting the businessresearch, the company needs to consider the issue of availability of financialresources.
A company also needs to consider the availability of human resources whiletaking a decision about the business research study. Lack of qualified personnelmay affect the data collection and data analysis processes in a business researchstudy. Lack of qualified personnel may lead to selection of improper sample,improper filling of data and inaccurate analysis of data. Therefore, a companyneeds to look for well-qualified and well-trained personnel before conducting abusiness research study.
1.4.3 Nature of Information Sought
The information or input that a company wants to obtain from the research studyalso influences the decision of whether to conduct the business research study ornot. If the information that a company wants to obtain from the research study canbe obtained from the internal records of the company, or from prior studies con-ducted by the company, then conducting business research is a waste of time andeffort. For example, if a company like Pepsi is launching a new fruit drink in Indiaand wants information about the market potential of the product, it can use itsknowledge and its prior studies regarding the beverages market in India, ratherthan conducting a new market study. In certain cases, the management’s experi-ence and intuition is enough to take a particular decision and there is no need for abusiness research study.
8 1 Introduction to Business Research
1.4.4 Benefits Versus Cost
The benefits of a research are many. However, a research demands significantefforts and that requires allocation of sufficient budget for the same. Therefore,every manager has to make a cost-benefit analysis before taking a decisionregarding the conduct of a business research study. Unless the benefits of theresearch, in the form of the information to be gained that would serve to improvethe quality of the decisions to be made, outweigh the expenditure on the research,the research proposal should not be approved.
1.5 Globalization and Business Research
Globalization of business and the formation of regional trading blocks have had amajor impact on all aspects of business and especially, on business research.Companies are increasingly looking out for international markets due to variouscompelling reasons. As firms overcome the geographic barriers of their operationsto cash in on the opportunities in the global market, the need for timely andrelevant information from a broader and more diverse range of markets isincreasing. An organization or a market research company, conducting interna-tional business research requires a different set of capabilities and approaches ascompared to the ones involved in domestic research. Some of the issues that anorganization needs to consider before venturing into international businessresearch are as follows:
• Global business research efforts need to be more closely associated with marketgrowth opportunities outside the industrialized nations.
• International business researchers need to devise new creative approaches tounderstand the international markets.
• Researchers should make use of technological advances in order to undertakeinternational business activities effectively.
Until now, the focus of international business research has been confined toindustrialized markets including North America, Europe and Japan. However,these markets are saturating while emerging markets like Latin America, India,China and Southeast Asia are showing a high growth potential. Therefore, mul-tinational firms should concentrate on understanding these markets by devotinggreater time and effort in conducting research activities in these markets.
However, conducting research studies successfully in emerging marketsrequires different approaches than the usual approaches. These markets do notpossess well-developed business research infrastructure. Moreover, the literacyrate is low. Therefore, researchers while designing the response formats andresearch instruments for the emerging markets need to keep these aspects in mind.Researchers should also develop innovative tools to understand these markets.
1.4 Factors Affecting Business Research 9
Unlike in western markets where quantitative research techniques are used more,qualitative and observation studies are effective in emerging markets.
Researchers can use innovative tools like videotaping techniques to understandconsumer behaviour in these markets. Researchers can use focus groups tounderstand views, preferences and cultures.
Companies can also use projective and elicitation techniques like collage,picture completion, analogies and metaphors and psycho drawing to gain a deeperunderstanding about these markets.
Use of technology can aid the researchers in effectively implementing theresearch activities. Researchers can make use of technologies like Computer-Assisted Telephone Interviewing (CATI), and Computer-Assisted Personal Inter-viewing (CAPI) and the Internet to make the research process faster, efficient andeffective.
1.6 Business Research and the Internet
Use of the Internet in business research studies is increasing. The declining costsof conducting online research activities coupled with the increasing number ofInternet users have made the Internet a cost-effective alternative to traditionalresearch methods for business research organizations. The following sectionsdiscuss the role of the Internet in primary and secondary research.
1.6.1 Primary Research
Primary data are collected directly from respondents using data collection methodslike survey interviews, questionnaires, measurements, direct observation or tabu-lation. Use of the Internet for primary data collection is still in its infancy.Although there have been satisfying results of its initial implementation and thefuture prospects look good it is still used cautiously. There are various advantagesin conducting online surveys compared with traditional survey methods. Theseinclude the following:
• The responses and feedback can be obtained faster.• Costs for conducting online surveys are less compared with traditional survey
methods.• Questionnaires can be delivered to the respondents faster.• Confidentiality is maintained as only the recipients read the questionnaire.• Respondents can reply to the questionnaire at their convenience.• Apart from online surveys, organizations are also conducting online focus group
studies.
10 1 Introduction to Business Research
• Although there are several advantages in using the Internet, there are certaindrawbacks as well. Online surveys lack face-to-face interaction. Also, lack ofaccessibility of the Internet among the population compared with other media isa major limitation.
1.6.2 Secondary Research
Secondary data are the data that already exist which have been collected by someother person or organization for their use and are generally made available to otherresearchers free or at a concessional rate. Major use of the Internet in businessresearch is in the area of secondary research. The research reports and databasesmaintained by major research companies are also available on the net. This makesit faster, economical and reliable for companies to know about competitor activ-ities. The very essence of the Internet as a major source of secondary informationprobably springs forth from the advantages of its broad scope, covering virtuallyevery topic and the reasonable cost in acquiring them.
1.7 Summary
Business research can be defined as a systematic and objective process of gath-ering, recording and analysing data to guide business decision-making. Businessresearch is mainly used to reduce the uncertainty of decisions. Business researchencompasses various facets of business in an organization including marketing,finance, human resources and manufacturing. Three types of business researchstudies are mainly employed by organizations: market research, operationsresearch and motivational research. Business research studies can be classified intotwo categories—basic research and applied research. Basic research refers to afocused, systematic study or investigation undertaken to discover new knowledgeor interpretations and establish facts or principles in a particular field. Appliedresearch refers to investigation undertaken to discover the applications and uses oftheories, knowledge and principles in actual work or in solving problems. The keyobjective of any business research is to provide accurate, relevant and timelyinformation to the top management, so that they can make effective decisions.
In business, decision-making goes through four key interrelated stages: prob-lem/opportunity identification, problem/opportunity selection, problem/opportu-nity resolution and implementing the course of action.
Business research helps the management in each of these stages by providinguseful and timely information. Organizations should decide upon the option ofconducting business research after considering various factors. These include timeconstraints, availability of resources, availability of data, nature of information thatthe organization expecting and the costs involved.
1.6 Business Research and the Internet 11

Globalization of business and the formation of regional trading blocks have hada major impact on all aspects of business and especially, on business research.Companies are increasingly looking out for international markets. As firmsovercome the geographic barriers of their operations to cash in on the opportunitiesin the global market, the need for timely and relevant information from a broaderand more diverse range of markets is increasing. The role of the Internet inbusiness research studies has also been discussed in the chapter. The decliningcosts of conducting online research activities coupled with the increasing numberof Internet users have made the Internet an attractive option for business researchorganizations.
12 1 Introduction to Business Research
Chapter 2Business Research Process
The business research process involves a series of steps that systematicallyinvestigate a problem or an opportunity facing the organization. The sequence ofsteps involved in the business research process are as follows: problem/opportunityidentification and formulation, planning a research design, selecting a researchmethod, selecting the sampling procedure, data collection, evaluating the data andpreparing the research report for presentation. The above steps provide a broadoutline applicable to any business research project. However, the number andsequence of activities can vary as per the demand of an individual research project.
The process of business research can be primarily divided into three phases—planning, execution and report preparation. The planning phase begins fromproblem/opportunity identification and leads to selection of the sampling proce-dure. Data collection and evaluation can be described as the execution phase of thebusiness research process, while report preparation can be considered as the lastphase. In this chapter, we will discuss each of these phases in detail.
2.1 Steps in the Research Process
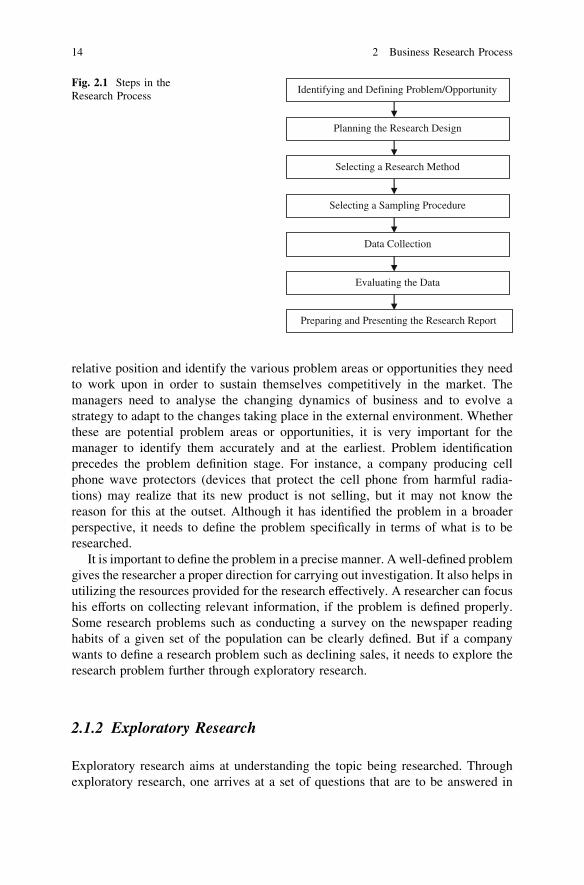
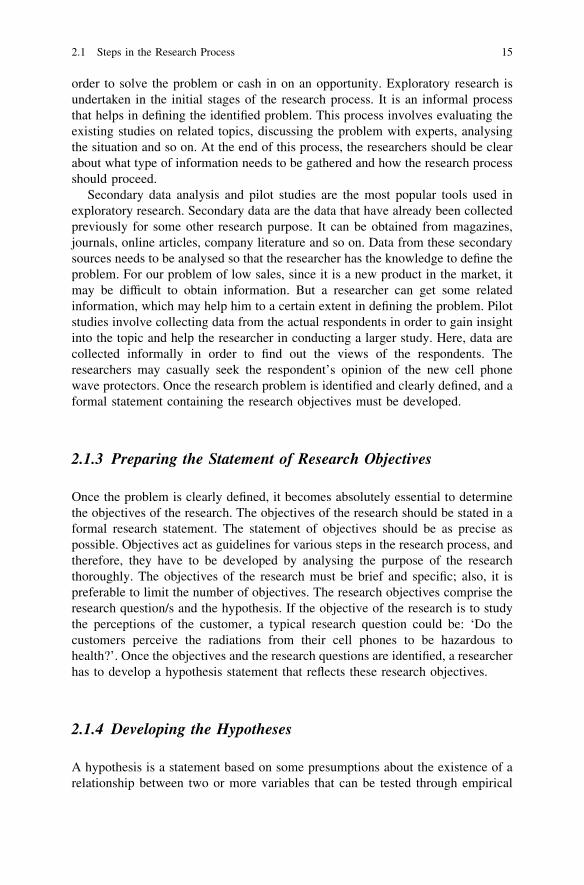
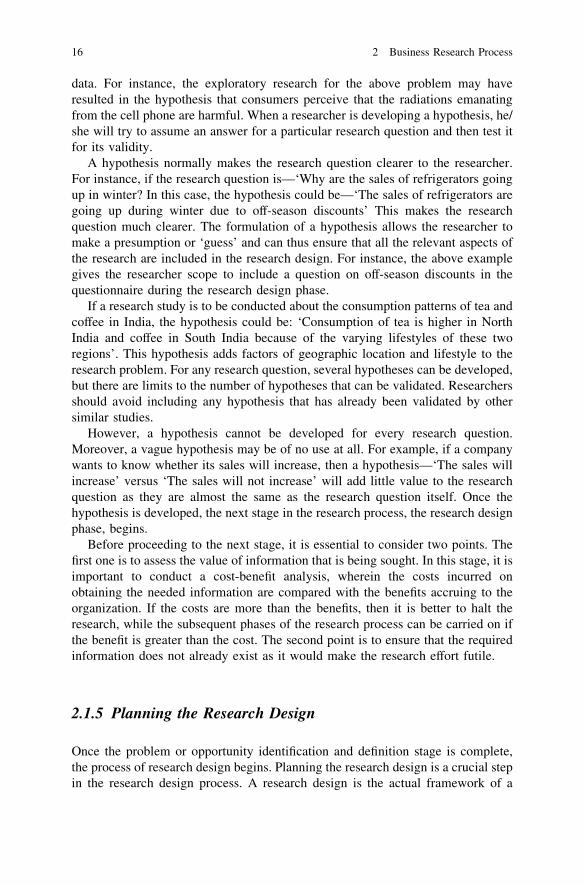
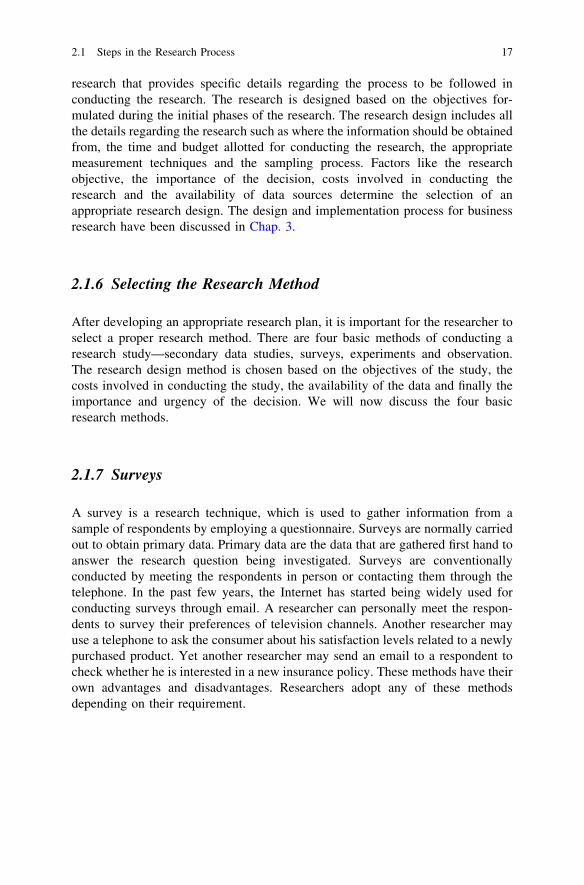
The steps in the research process, namely identification and definition of theproblem or opportunity, planning the research design, selecting a research method,selecting a sampling procedure, data collection, evaluating the data and finallypreparing and presenting the research report have been shown in the Fig. 2.1. Eachof these steps in the research process is discussed below.
2.1.1 Identifying and Defining the Problem/Opportunity
The initial step in the research process is the identification of the problem oropportunity. As businesses today operate in a highly volatile environment gov-erned by various macro environmental factors, they need to constantly assess their
S. Sreejesh et al., Business Research Methods,DOI: 10.1007/978-3-319-00539-3_2,� Springer International Publishing Switzerland 2014
13
relative position and identify the various problem areas or opportunities they needto work upon in order to sustain themselves competitively in the market. Themanagers need to analyse the changing dynamics of business and to evolve astrategy to adapt to the changes taking place in the external environment. Whetherthese are potential problem areas or opportunities, it is very important for themanager to identify them accurately and at the earliest. Problem identificationprecedes the problem definition stage. For instance, a company producing cellphone wave protectors (devices that protect the cell phone from harmful radia-tions) may realize that its new product is not selling, but it may not know thereason for this at the outset. Although it has identified the problem in a broaderperspective, it needs to define the problem specifically in terms of what is to beresearched.
It is important to define the problem in a precise manner. A well-defined problemgives the researcher a proper direction for carrying out investigation. It also helps inutilizing the resources provided for the research effectively. A researcher can focushis efforts on collecting relevant information, if the problem is defined properly.Some research problems such as conducting a survey on the newspaper readinghabits of a given set of the population can be clearly defined. But if a companywants to define a research problem such as declining sales, it needs to explore theresearch problem further through exploratory research.
2.1.2 Exploratory Research
Exploratory research aims at understanding the topic being researched. Throughexploratory research, one arrives at a set of questions that are to be answered in
Identifying and Defining Problem/Opportunity
Planning the Research Design
Selecting a Research Method
Selecting a Sampling Procedure
Data Collection
Evaluating the Data
Preparing and Presenting the Research Report
Fig. 2.1 Steps in theResearch Process
14 2 Business Research Process
order to solve the problem or cash in on an opportunity. Exploratory research isundertaken in the initial stages of the research process. It is an informal processthat helps in defining the identified problem. This process involves evaluating theexisting studies on related topics, discussing the problem with experts, analysingthe situation and so on. At the end of this process, the researchers should be clearabout what type of information needs to be gathered and how the research processshould proceed.
Secondary data analysis and pilot studies are the most popular tools used inexploratory research. Secondary data are the data that have already been collectedpreviously for some other research purpose. It can be obtained from magazines,journals, online articles, company literature and so on. Data from these secondarysources needs to be analysed so that the researcher has the knowledge to define theproblem. For our problem of low sales, since it is a new product in the market, itmay be difficult to obtain information. But a researcher can get some relatedinformation, which may help him to a certain extent in defining the problem. Pilotstudies involve collecting data from the actual respondents in order to gain insightinto the topic and help the researcher in conducting a larger study. Here, data arecollected informally in order to find out the views of the respondents. Theresearchers may casually seek the respondent’s opinion of the new cell phonewave protectors. Once the research problem is identified and clearly defined, and aformal statement containing the research objectives must be developed.
2.1.3 Preparing the Statement of Research Objectives
Once the problem is clearly defined, it becomes absolutely essential to determinethe objectives of the research. The objectives of the research should be stated in aformal research statement. The statement of objectives should be as precise aspossible. Objectives act as guidelines for various steps in the research process, andtherefore, they have to be developed by analysing the purpose of the researchthoroughly. The objectives of the research must be brief and specific; also, it ispreferable to limit the number of objectives. The research objectives comprise theresearch question/s and the hypothesis. If the objective of the research is to studythe perceptions of the customer, a typical research question could be: ‘Do thecustomers perceive the radiations from their cell phones to be hazardous tohealth?’. Once the objectives and the research questions are identified, a researcherhas to develop a hypothesis statement that reflects these research objectives.
2.1.4 Developing the Hypotheses
A hypothesis is a statement based on some presumptions about the existence of arelationship between two or more variables that can be tested through empirical
2.1 Steps in the Research Process 15
data. For instance, the exploratory research for the above problem may haveresulted in the hypothesis that consumers perceive that the radiations emanatingfrom the cell phone are harmful. When a researcher is developing a hypothesis, he/she will try to assume an answer for a particular research question and then test itfor its validity.
A hypothesis normally makes the research question clearer to the researcher.For instance, if the research question is—‘Why are the sales of refrigerators goingup in winter? In this case, the hypothesis could be—‘The sales of refrigerators aregoing up during winter due to off-season discounts’ This makes the researchquestion much clearer. The formulation of a hypothesis allows the researcher tomake a presumption or ‘guess’ and can thus ensure that all the relevant aspects ofthe research are included in the research design. For instance, the above examplegives the researcher scope to include a question on off-season discounts in thequestionnaire during the research design phase.
If a research study is to be conducted about the consumption patterns of tea andcoffee in India, the hypothesis could be: ‘Consumption of tea is higher in NorthIndia and coffee in South India because of the varying lifestyles of these tworegions’. This hypothesis adds factors of geographic location and lifestyle to theresearch problem. For any research question, several hypotheses can be developed,but there are limits to the number of hypotheses that can be validated. Researchersshould avoid including any hypothesis that has already been validated by othersimilar studies.
However, a hypothesis cannot be developed for every research question.Moreover, a vague hypothesis may be of no use at all. For example, if a companywants to know whether its sales will increase, then a hypothesis—‘The sales willincrease’ versus ‘The sales will not increase’ will add little value to the researchquestion as they are almost the same as the research question itself. Once thehypothesis is developed, the next stage in the research process, the research designphase, begins.
Before proceeding to the next stage, it is essential to consider two points. Thefirst one is to assess the value of information that is being sought. In this stage, it isimportant to conduct a cost-benefit analysis, wherein the costs incurred onobtaining the needed information are compared with the benefits accruing to theorganization. If the costs are more than the benefits, then it is better to halt theresearch, while the subsequent phases of the research process can be carried on ifthe benefit is greater than the cost. The second point is to ensure that the requiredinformation does not already exist as it would make the research effort futile.
2.1.5 Planning the Research Design
Once the problem or opportunity identification and definition stage is complete,the process of research design begins. Planning the research design is a crucial stepin the research design process. A research design is the actual framework of a
16 2 Business Research Process
research that provides specific details regarding the process to be followed inconducting the research. The research is designed based on the objectives for-mulated during the initial phases of the research. The research design includes allthe details regarding the research such as where the information should be obtainedfrom, the time and budget allotted for conducting the research, the appropriatemeasurement techniques and the sampling process. Factors like the researchobjective, the importance of the decision, costs involved in conducting theresearch and the availability of data sources determine the selection of anappropriate research design. The design and implementation process for businessresearch have been discussed in Chap. 3.
2.1.6 Selecting the Research Method
After developing an appropriate research plan, it is important for the researcher toselect a proper research method. There are four basic methods of conducting aresearch study—secondary data studies, surveys, experiments and observation.The research design method is chosen based on the objectives of the study, thecosts involved in conducting the study, the availability of the data and finally theimportance and urgency of the decision. We will now discuss the four basicresearch methods.
2.1.7 Surveys
A survey is a research technique, which is used to gather information from asample of respondents by employing a questionnaire. Surveys are normally carriedout to obtain primary data. Primary data are the data that are gathered first hand toanswer the research question being investigated. Surveys are conventionallyconducted by meeting the respondents in person or contacting them through thetelephone. In the past few years, the Internet has started being widely used forconducting surveys through email. A researcher can personally meet the respon-dents to survey their preferences of television channels. Another researcher mayuse a telephone to ask the consumer about his satisfaction levels related to a newlypurchased product. Yet another researcher may send an email to a respondent tocheck whether he is interested in a new insurance policy. These methods have theirown advantages and disadvantages. Researchers adopt any of these methodsdepending on their requirement.
2.1 Steps in the Research Process 17
2.1.8 Experiments
In business research, experiments can be conducted for studying cause-and-effectrelationships. Analysing the changes in one variable, by manipulating anothervariable, helps one identify cause-and-effect relationships through experiments.For instance, analysing the sales targets achieved by individual salespersons bymanipulating their monetary rewards is a typical example of experimentation. Testmarketing conducted by companies to test the viability of their new product in themarket is a form of business experimentation.
2.1.9 Secondary Data Studies
A secondary data study is concerned with the analysis of already existing data thatis related to the research topic in question. In secondary data studies, secondarydata are studied in order to analyse the future sales of a product. For instance, forthe cell phone wave protector research, secondary data regarding the telecom-munications set-up, mobile networking, the waves used for communication inwireless telephony and its effects, may be essential for assessing the future salestrends of the cell phone wave protector. Secondary data studies help in projectingfuture sales trends using some mathematical models.
2.1.10 Observation Techniques
Observation technique is a process where the respondents are merely observedwithout any interruption by the observers. For instance, the shopping patterns ofcustomers in supermarkets assessed by the observers or by counting the number ofvehicles passing through a junction can qualify as observation research. Theadvantage of this method is that the observers do not depend on the respondents fortheir responses as they are only observed and are not asked to participate in theresearch process. Although the observation technique is useful, it cannot be usedfor studying several other factors such as motivations, attitudes and so on.
2.1.11 Analysing Research Designs
Although several research designs are available for a researcher to choose from, itis very difficult to say that a particular research design best suits a particularbusiness research problem. Therefore, researchers should be cautious whileselecting a research design. The best method to select a research design is to work
18 2 Business Research Process
backwards; that is, a research design should be selected based on the end result thatneeds to be obtained. For instance, to study the cell phone usage patterns ofcustomers in public places, an observation technique would be a better methodthan a survey research as it would save on research costs and would not require theresearchers to rely on the responses of the respondents.
Once the researcher selects a research method that is most appropriate for theresearch, he now needs to develop a sampling procedure. Sampling is the mostimportant activity pertaining to the planning phase of the business researchprocess.
2.1.12 Selecting the Sampling Procedure
Sampling is generally a part of the research design but is considered separately inthe research process. Sampling is a process that uses a small number of items or asmall portion of a population to draw conclusions regarding the whole population.Alternately, a sample can be considered as a subset of a larger set called thepopulation. A well-defined sample has the same characteristics as the populationas a whole, and therefore, when a research is conducted on such sample, the resultsobtained will represent the characteristics of the whole population. But if errors aremade in selecting the sample, then the research results will be wrong, since awrongly selected sample does not represent the characteristics of the population asa whole. For instance, to study the petrol and diesel consumption patterns ofpeople, if a sample is selected from a list of vehicle owners, it may not representthe whole population, since there are several others who use petrol or diesel forrunning generators or for purposes other than travelling. It is therefore veryimportant to define the population before selecting the sample; otherwise, theresearch results may not be helpful for the manager in taking effective decisions.For example, a television manufacturing company wanting to assess its futuresales potential may select a sample from a population of households having no TVsets at all. But there may be several TV owners who may want to buy a second TVset or replace the existing one, and if they are not included in the population, thenthe research results may not be accurate.
Another important aspect of sampling is to decide the size of the sample. Howbig should a sample be? The bigger the sample size the greater will be its preci-sion. But for practical reasons, it is not feasible to select large samples. Therefore,a sample that is selected using probability sampling techniques will be sufficientfor getting effective results. A sample can be selected in two ways from a popu-lation—through probability sampling, or through non-probability sampling. Whenthe subsets of a population are chosen in such a way that it ensures a representativecross-section by giving every element in the population a known chance of beingselected, it is called probability sampling. When subsets of a population in whichlittle or no attempt is made to ensure a representative cross-section are chosen, it is
2.1 Steps in the Research Process 19
called non-probability sampling. Sampling has been extensively discussed inChap. 6.
All the steps in the business research process till selecting the sampling pro-cedure constitute the planning phase. The execution phase of the research processbegins with data collection that is the next logical step following the samplingprocedure. Once a researcher decides on a sample, he needs to obtain data fromthis sample. We will discuss this process in the following section.
2.1.13 Data Collection
After preparing a suitable sample, the researcher collects the data from the units inthis sample. As there are several research techniques, there are a number of datacollection methods as well. For instance, in the survey method, the data are col-lected by asking the respondents to fill out a questionnaire administered to them,while in the observation technique, the respondents are just observed without theirdirect participation in the research. Whatever the method used to collect the data, itis very important that the data are collected without any errors. Errors may creep induring the data collection process in several forms. Potential data collection errorsmay arise if the interviewee does not understand the question or if the interviewerrecords the answers inaccurately. The various types of data collection errors arediscussed in Chap. 4.
Data collection is done in two stages—pre-testing and the main study. Pre-testing involves collecting data from a small subsample to test whether the datacollection plan for the main study is appropriate. This helps the researchers tominimize any potential errors that may crop up during the main study. The pre-testresults may also be used to decide on a way of tabulating the collected data. If theresults of a pre-test are not appropriate for decision-making, then the researchermay consider altering the research design.
Once the data are collected to the satisfaction of the researcher, the researchprocess enters the next stage, which is evaluation of the data.
2.1.14 Evaluating the Data
Once the data have been collected, the next important phase in the research processis evaluating the data. The most important aspect of data evaluation is to convertthe data collected into a format which will facilitate the manager in effectivedecision-making. The reason for analysing the data is to obtain research results andto prepare the research report. Several mathematical and statistical models are usedto evaluate the data. Evaluation of data normally starts with editing and coding ofthe data. Editing is undertaken to verify the data and check for any potential errorsor for any inconsistencies and so on. Another task of editing is to remove any
20 2 Business Research Process
errors that may have cropped up during the interview such as recording theanswers under the wrong columns of a questionnaire and so on. Coding is aprocess of assigning different symbols to different sets of responses. The codingprocess is done so that the data can be fed in and interpreted easily using com-puters. These days, technological advances have made it possible for data to becollected and directly fed into computers, removing the possibility of human error.For instance, an interviewer may question respondents through telephone andrecord the answers directly into a computer, where the data are processed almostimmediately, thus eliminating the scope for errors which may arise if conventionalmethods of data collection are used.
2.1.15 Analysis
The interpretation of the data that have been collected by using different analyticaltechniques according to the requirements of the management is called analysis.Several statistical tools are used for data analysis, in order to make the analysissuitable for effective decision-making. The statistical analysis of the data mayrange from simple frequency distribution tables to complex multivariate analysis.
2.1.16 Preparing and Presenting the Research Report
After the evaluation of the data, the last and the major phase that comes intopicture is the preparation of a research report. The research reports can be pre-sented either in oral or in written format. The research report should contain a briefdescription of the objectives of the research, a summary of the research designadopted, a summary of the major findings and conclude with the limitations andrecommendations. The purpose of conducting any research is to obtain informationthat can aid in efficient decision-making. Therefore, it is very important to care-fully analyse the information obtained and present it according to the requirementsof the management of the company. At this stage, the research report should bedeveloped most efficiently and it should portray the research findings mosteffectively. Most often researchers fill the research reports with all the technicaldetails. This should be avoided to the maximum possible extent, as the manage-ment is more interested in the actual research results and they have to be presentedlucidly in a concise format. The amount of information provided in the researchreport should be based on the requirements of the manager. A research report alsoacts as a historical document, in the sense that the manager may refer to thisdocument in the future if a research on the same lines is being conducted sometimein the future.
2.1 Steps in the Research Process 21
2.2 Summary
The business research process can be considered as the framework of the entiretopic of business research. It involves a series of steps starting from the identifi-cation of the problem or opportunity to the stage of preparing the research report.These stages are as follows: identification and definition of the problem oropportunity, planning the research design, selecting a research method, selecting asampling procedure, data collection, evaluating the data and finally preparing andpresenting the research report. Any business research is primarily conducted fortaking effective managerial decisions regarding various problems or opportunitiesidentified by the organization.
Whenever a company identifies a potential problem or opportunity, it recog-nizes the need for conducting a research study. Once the problem is clearlyidentified, the manager can check whether the required information is alreadypresent; if such information is easily accessible, then the manager need not spend alot of resources in obtaining the same information again. After clearly identifyingthe problem, it needs to be defined accordingly, and subsequently, the objectivesof the research are determined. Development of the hypothesis plays a crucial rolein the research process. Once this is done, the research boundaries are definedfollowed by estimating the value of information to be obtained against the costsincurred on conducting the research. At this stage, the most important part of theresearch begins, that is, planning the research design and involves the selection ofthe sample and the measurement technique. After this, the data are collected andevaluated and are later presented in the form of a report to the company’s man-agement for decision-making.
22 2 Business Research Process

Part IIResearch Design
Chapter 3Business Research Design: Exploratory,Descriptive and Causal Designs
Learning Objectives
After reading this chapter, the reader should be able to:
1. Understand the meaning of research design, select and develop appropriateresearch design to solve the concerned management dilemma.
2. Understand the basic difference between the three research designs: explor-atory, descriptive and causal research designs.
3. Identify the mode, techniques and plan for data collection for collecting nec-essary information to solve business research problem.
S. Sreejesh et al., Business Research Methods,DOI: 10.1007/978-3-319-00539-3_3,� Springer International Publishing Switzerland 2014
25

Chapter OverviewThe objective of this chapter is to define and explain research design in detail.
In this chapter, we discussed three major types of research designs, such asexploratory, descriptive and causal research designs. We also explained the modeof data used in each of these designs and the techniques to collect these data,which would ultimately helps the researcher to decide appropriate analysis tech-nique. This chapter concludes with budgeting and scheduling of a businessresearch project and elaborated the guidelines for writing a business researchproposal. This chapter designed in such a way that the reader can appreciate theseconcepts by considering the examples and cartoon illustrations, which would betterelicit and convince the concept understanding.
Say, Mr. Anto why did customer foot print in ourhotel chains reduced so sharply last summer?
How many people in the city realise that wesponsored a littlele ague team last summer?
How are we doing in the “Loyal customer” segment ofthe market?
Does the new advertisement the me really convincepeople that our hotels are much safer today than theywere in two years ago?
What type of research would you conduct fordetermining a coherent marketing strategy for thevarious hotels owned by our group?
(Exploratory): Define and formulate there searchproblem more precisely, recognize alternativecourse of action, way to develop hypotheses andgain deeper insights and establish priorities forfurther research
(Descriptive): Describe the characteristics andbehaviour of some objects, events, individualorgroup, identify the association between variablesand make some specific predictions
(Causal): Identify cause-and effect relationships
26 3 Business Research Design: Exploratory, Descriptive and Causal Designs
3.1 Introduction
Once the researcher has identified and established the broad approach to theresearch problem, the next step is to prepare a framework or blue print of thestudy, which specifies the procedures necessary for achieving the stated objectivesin a robust manner. This framework helps the researcher to lay foundation forconducting business research project. A well-prepared framework will ensure thatthe business research project is conducted in an efficient and effective manner.
Research design can be defined as a framework or blue print for conductingbusiness research project in an efficient manner. It details the procedures neces-sary for collection, measurement and analysis of information which helps theresearcher to structure/or solve business research problems.
Typically, a good and well-planned research design consists of the followingcomponents, or tasks:
1. Selection of appropriate type of design: Exploratory, descriptive and/or causaldesign.
2. Identification of specific information needed based problem in hand and theselected design.
3. Specification of measurement and scaling procedures for measuring theselected information.
4. Mode of collection of information and specification of appropriate form fordata collection.
5. Designing of appropriate sampling process and sample size.6. Specification of appropriate data analysis method.
Some important characteristics of a good research design are flexibility, adapt-ability, efficiency, being economy and so on. A good research design should mini-mize bias and maximize accuracy of the data obtained and should have as few errorsas possible. The most important requirement of good research design is that it shouldprovide adequate information so that the research problem can be analysed on a wideperspective. An ideal design should take into account important factors like:
1. Identifying the exact research problem to be studied2. The objective of the research3. The process of obtaining information and4. The availability of adequate time and financial resources.
Case 1: Johnson & Johnson and Cause-Related Marketing Initiatives
Product failures and litigations is not a new story for Johnson & Johnson. InSeptember 1982, the company faced a tragedy when seven people died fromingesting Tylenol capsules that had been laced with cyanide. Soon after the
3.1 Introduction 27
tragedy, the company stopped the advertising and recalled all Tyenol productsfrom the market. The FDA investigations found that the tampering had beendone at the retail level rather than during manufacturing. In the next 2 weeksafter these deaths, the company’s stocks dropped 18 % and its major compet-itors products Datril and Anacin-3 were in such demand that supplies were backordered. The company was able to restore its losses and confidence among themasses via several marketing strategies. The company ran a one-time adver-tising that explained how to exchange Tylenol capsules for tablets or refundsand worked closely with the press, responding directly to reporter’s questions asa means of keeping the public up to date. The company also placed a pricereduction offer of $2.50 to any Tylenol products in newspapers across thecountry.
In 2002, the company introduced Ortho Evra birth-control patch, consideredto be good hit in the market, because of its benefits to younger women as aconvenient alternative to the pill. Time magazine quoted this as ‘coolestinventions’ of the year. But at the end of 2005, the first lawsuits were filedagainst J&J claiming that the patch cause blood clots that could lead to heartattack or stroke and that the company misled the doctors and regulators foryears by withholding data on those risks. Figure 3.1 shows that there are around40 women died after using this patch. One victim was Ashley Lewis a 17-year-old high school girl who died in 2003, leaving behind a 1-year-old son. Reportsshows that of the 4,000 lawsuits the Ortho Evra patch has spawned, most haveeither been settled under confidential terms with admitting the liability or dis-missed.1 In response to FDA regulations, J&J strengthened the patch in severaltime since 2005. However, without considering these rules and regulations, thepatch remains on the market, and J&J is still defending against patent lawsuitsover the product.
In this context, the company decided to restore its decaling image about itsproduct among public through introducing cause-marketing programmes.Cause-related marking is a strategy in which a ‘for-profit’ organization alignsitself with a worthwhile cause. There are several incentives for a company touse a cause-related marketing strategy. First, a company can improve its publicimage by showing that it is interested in more than just making profits. Second,a company can also increase demand for its goods and gain a competitiveadvantage. For instance, consumers would be more willing to purchase some-thing from a company that they know donates a portion of their proceeds to acharity than from a company that just keeps all the profits for itself.
1 By David Voreacos, Alex Nussbaum and Greg Farrel, Johnson and Johnson reaches a band-aid,Bloomberg Business week.
28 3 Business Research Design: Exploratory, Descriptive and Causal Designs
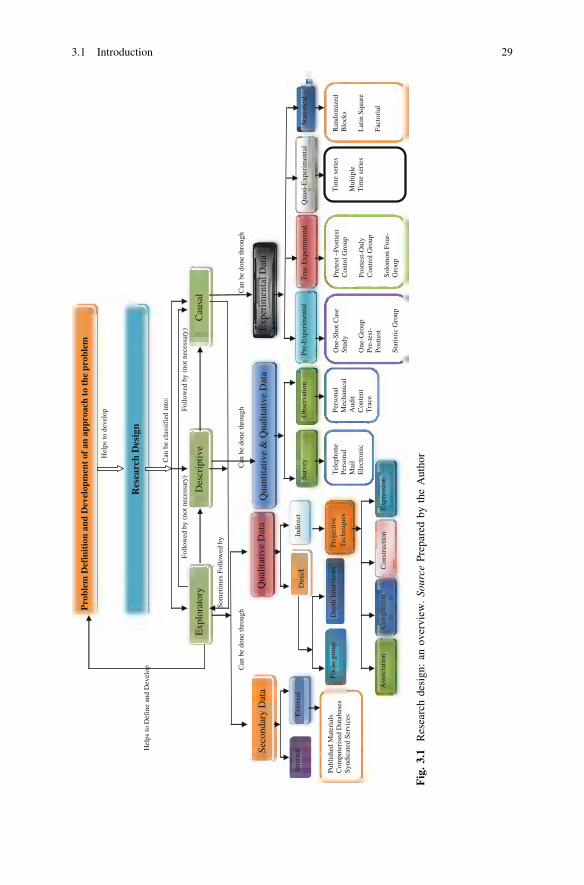
Hel
ps to
dev
elop
Hel
ps to
Def
ine
and
Dev
elop
Can
be
clas
sifi
ed in
to:
Follo
wed
by
(not
nec
essa
ry)
F
ollo
wed
by
(not
nec
essa
ry)
Som
etim
es F
ollo
wed
by
Can
be
done
thro
ugh
Can
be
done
thro
ugh
Can
be
done
thro
ugh
Pro
blem
Def
init
ion
and
Dev
elop
men
t of
an
appr
oach
to
the
prob
lem
Res
earc
h D
esig
n
Cau
sal
Des
crip
tive
Exp
lora
tory
Qua
litat
ive
Dat
aSe
cond
ary
Dat
aQ
uant
itativ
e &
Qua
litat
ive
Dat
aE
xper
imen
tal D
ata
Dir
ect
Indi
rect
Focu
s gr
oup
Dep
th I
nter
view
sPr
ojec
tive
Tec
hniq
ues
Ass
ocia
tion
Com
plet
ion
Con
stru
ctio
nE
xpre
ssio
n
Obs
erva
tion
Surv
ey
Tel
epho
nePe
rson
alM
ail
Ele
ctro
nic
Pers
onal
Mec
hani
cal
Aud
itC
onte
ntT
race
Inte
rnal
E
xter
nal
Publ
ishe
d M
ater
ials
Com
pute
rise
d D
atab
ases
Synd
icat
ed S
ervi
ces
Pre-
Exp
erim
enta
lT
rue
Exp
erim
enta
lQ
uasi
-Exp
erim
enta
lSt
atis
tical
One
-Sho
t Cas
eSt
udy
One
-Gro
upPr
e-te
st-
Post
test
Stat
istic
Gro
up
Pret
est –
Post
test
Con
tol G
roup
Post
test
-Onl
yC
ontr
ol G
roup
Solo
mon
Fou
r-G
roup
Tim
e se
ries
Mul
tiple
Tim
e se
ries
Ran
dom
ized
Blo
cks
Lat
in S
quar
e
Fact
oria
l
Fig
.3.
1R
esea
rch
desi
gn:
anov
ervi
ew.
Sour
ceP
repa
red
byth
eA
utho
r
3.1 Introduction 29
As part of its introduction of cause-marketing activities, the companyconducted an exploratory research in the form of secondary data analysis andfocus groups. The main objective behind this exploratory analysis was toidentify the major factors that determine the social causes that a pharmaceuticalcompany should be concerned about. From the exploratory investigation, thecompany found that the major social causes that the industry concerned aboutare the following: child care, drug abuse, public education, hunger, crime, theenvironment, medical research and poverty.
After the exploratory findings, the company decided to conduct a conclusiveresearch that was in the nature of a descriptive cross-sectional survey. Themajor objective behind this survey was to understand how and why cause-related marketing influences consumers’ perception of company’s brand and toidentify the relative importance of each attribute identified in the exploratoryresearch. The company uses a random sample of 1,000 Indian consumers andconducted a telephonic interview. The findings of the study showed that about50 % of the respondents stated the fact that when price and quality of thepharmaceutical products are equal, they would switch to a brand that supportsgood causes, protect the environment and caring about the public. The surveyalso support the fact that more than half of the people that the company sur-veyed would be able to pay a premium to those brands or products which islinked to a good cause. In short, the overall survey revealed the fact that thegeneral public in India would give more image and greater trust to thosecompanies and products that is linked to a good cause (see Table 3.1: Findingsof the survey, Social Issues Johnson & Johnson should concern about).
After this survey, company has been working hard towards becoming moreenvironmental friendly by: reducing generated hazardous waste, decreasingwater use, and using alternative sources of energy for production. This is asmart move for Johnson & Johnson, because they were one of the first one torecognize the environmentally friendly social movement that has been hap-pening all around the world. Another way that Johnson & Johnson is improvingits image is by partnering with organizations such as UNICEF to providemedical care for women and babies in India and by contributing millions ofdollars each year to humanitarian works all around the world. Even thoughcompanies that implement cause-related marketing strategy exercise their socialresponsibility, some critics see this as ‘cause-exploitation’. This is becausecause-related marketing allows a company to improve its image, increase salesand gain a competitive advantage; some companies may choose to implementthis strategy not to exercising their social responsibility, but just to have itsbenefits.
30 3 Business Research Design: Exploratory, Descriptive and Causal Designs
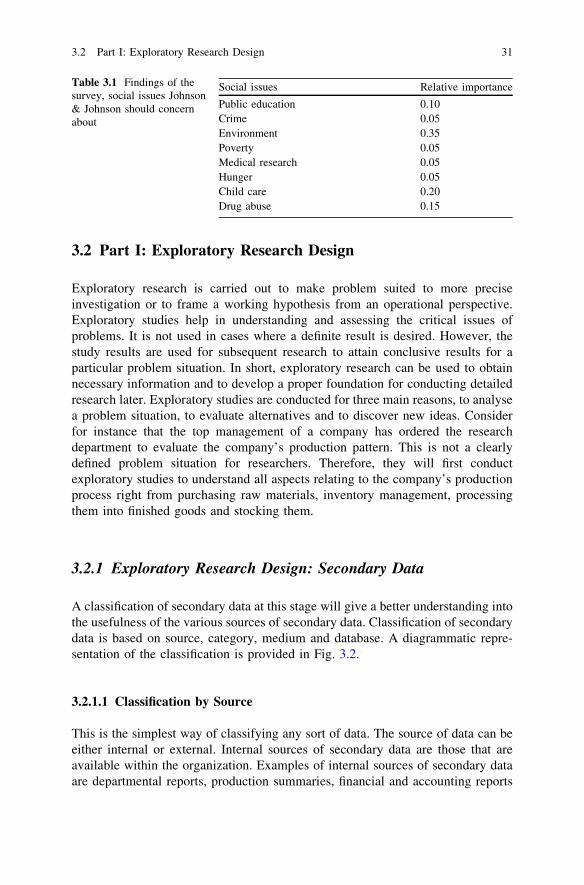
3.2 Part I: Exploratory Research Design
Exploratory research is carried out to make problem suited to more preciseinvestigation or to frame a working hypothesis from an operational perspective.Exploratory studies help in understanding and assessing the critical issues ofproblems. It is not used in cases where a definite result is desired. However, thestudy results are used for subsequent research to attain conclusive results for aparticular problem situation. In short, exploratory research can be used to obtainnecessary information and to develop a proper foundation for conducting detailedresearch later. Exploratory studies are conducted for three main reasons, to analysea problem situation, to evaluate alternatives and to discover new ideas. Considerfor instance that the top management of a company has ordered the researchdepartment to evaluate the company’s production pattern. This is not a clearlydefined problem situation for researchers. Therefore, they will first conductexploratory studies to understand all aspects relating to the company’s productionprocess right from purchasing raw materials, inventory management, processingthem into finished goods and stocking them.
3.2.1 Exploratory Research Design: Secondary Data
A classification of secondary data at this stage will give a better understanding intothe usefulness of the various sources of secondary data. Classification of secondarydata is based on source, category, medium and database. A diagrammatic repre-sentation of the classification is provided in Fig. 3.2.
3.2.1.1 Classification by Source
This is the simplest way of classifying any sort of data. The source of data can beeither internal or external. Internal sources of secondary data are those that areavailable within the organization. Examples of internal sources of secondary dataare departmental reports, production summaries, financial and accounting reports
Table 3.1 Findings of thesurvey, social issues Johnson& Johnson should concernabout
Social issues Relative importance
Public education 0.10Crime 0.05Environment 0.35Poverty 0.05Medical research 0.05Hunger 0.05Child care 0.20Drug abuse 0.15
3.2 Part I: Exploratory Research Design 31
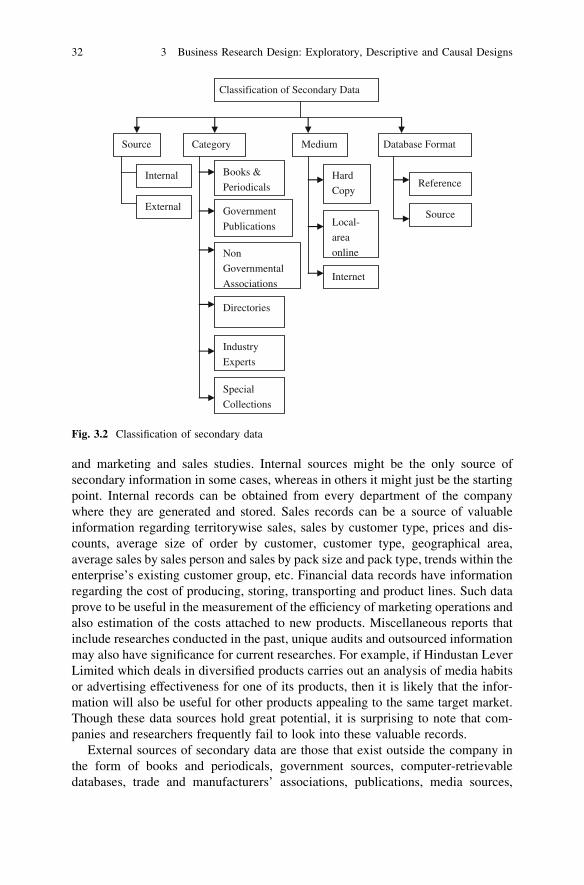
and marketing and sales studies. Internal sources might be the only source ofsecondary information in some cases, whereas in others it might just be the startingpoint. Internal records can be obtained from every department of the companywhere they are generated and stored. Sales records can be a source of valuableinformation regarding territorywise sales, sales by customer type, prices and dis-counts, average size of order by customer, customer type, geographical area,average sales by sales person and sales by pack size and pack type, trends within theenterprise’s existing customer group, etc. Financial data records have informationregarding the cost of producing, storing, transporting and product lines. Such dataprove to be useful in the measurement of the efficiency of marketing operations andalso estimation of the costs attached to new products. Miscellaneous reports thatinclude researches conducted in the past, unique audits and outsourced informationmay also have significance for current researches. For example, if Hindustan LeverLimited which deals in diversified products carries out an analysis of media habitsor advertising effectiveness for one of its products, then it is likely that the infor-mation will also be useful for other products appealing to the same target market.Though these data sources hold great potential, it is surprising to note that com-panies and researchers frequently fail to look into these valuable records.
External sources of secondary data are those that exist outside the company inthe form of books and periodicals, government sources, computer-retrievabledatabases, trade and manufacturers’ associations, publications, media sources,
Classification of Secondary Data
Source Category
Internal
External
Books &
Periodicals
Government
Publications
Non
Governmental
Associations
Directories
Special
Collections
Medium
Hard
Copy
Local-
area
online
Internet
Database Format
Reference
Source
Industry
Experts
Fig. 3.2 Classification of secondary data
32 3 Business Research Design: Exploratory, Descriptive and Causal Designs
commercial sources, syndicated services, directories, external experts and specialcollections. These sources can also provide valuable information pertaining toresearch.
3.2.1.2 Classification by Category
Classifying secondary data by category, we put the sources under books andperiodicals, databases, government documents, publications, associations, externalexperts, directories, media sources, commercial sources and special collections.
Books and periodicalsBooks and periodicals procured from various sources are a typical source for a
desk researcher. A researcher who locates the right book pertaining to his researchgets off to a good start. Journal of Business Research, Journal of AccountingResearch, Journal of Marketing Research, Financial Analysts Journal are some ofthe professional journals that contain much needed and useful information thatserve as rich sources of secondary data.
Business Week, Business World, Economist, Fortune and Harvard BusinessReview are some of the magazines that feature research surveys and cover generalbusiness trends both nationally and internationally. Fortune magazine brings out alist of the top 500 companies in the world in terms of sales volumes, revenuesgenerated, best practices, etc. which are of great help to researchers in garneringvital information.
Most metropolitan areas have periodicals and journals specific to the devel-opments in that particular area. Most business and consumer magazines can alsobe a boon for secondary research as they obtain updated data through their researchdepartments and make them available in the marketplace.
Newspapers can also be a vital source for market research information. Allmajor newspapers have a business section that brings out industry-specific infor-mation and also the general trends in the market. In India, we have newspapers likethe Economic Times, Business Standard, The Financial Times, etc. which provideonly business-related news. Such sources prove to be of great help for researchersin anticipating trends in various businesses.
Government publicationsGovernment agencies and their publications can be a vital source of secondary
information for the market researcher. Taking the case of our own country India,we have a number of government agencies and publications that can be a source ofsecondary data for research.
In India, we have the reports and publications from The Registrar General ofIndia, The Central Statistical Organization (CSO), Planning Commission, RBI,Department of Economic Affairs, Ministry of Food and Agriculture, The IndianLabour Bureau, etc. The Registrar General of India conducts a population censusfor the whole country every 10 years that gives a huge report about the demo-graphic data. Another government agency called The CSO has various publica-tions such as ‘Estimates of National Product, Savings and capital Formation’—
3.2 Part I: Exploratory Research Design 33

which come out annually and compile the estimates of national income for severalyears, and the ‘Statistical Abstract, India’—which is also an annual publicationcontaining economic statistics for various sectors usually for 5 years whichincludes additional statewise statistics for the previous year. It has also a publi-cation called, ‘Annual Survey of Industries’(ASI), which compiles detailed data onthe performance of the industrial sector in terms of the number of companies in anindustry, employees (workers and non-workers), productive capital employed,total production by product types, fixed and variable costs. The data collectedthrough ASI relate to capital, employment and emoluments, consumption of fueland lubricants, raw material and other input/output, value added, labour turnover,absenteeism, labour cost, construction of houses by employers for their employeesand other characteristics of factories/industrial establishments. Another importantpublication of the CSO is the Monthly Statistics of the Production of
Adapted from Beri (1989)The Director General of Commercial Intelligence, brings out monthly statistics of
foreign trade in two parts, that is, export and import. This report also contains vastpast records that help researchers to learn about the changing face of India’s foreigntrade. The National Sample Survey (NSS) is another important source, also worthmentioning in this context, as it publishes data regarding social, economic, demo-graphic, industrial and agricultural statistics on an elaborate and continuing basis.Some other publications that are useful to researchers are given in Exhibit 3.1.
Exhibit 3.1: Useful Governmental Publications
• The Wholesale Price Index numbers by The Office of the Economic Advisor,Ministry of Commerce and Industry which is weekly and covers variousproducts such as food articles, food grains, minerals, fuel, power, textiles,chemicals, etc.
• All-India Consumer Price Index by the Government of India.• Basic Statistics Relating to the Indian Economy by the Planning Commission.• Reserve Bank of India Bulletin, Currency and Finance Report, which are
monthly and annual journals, respectively, by the RBI, covering currency andfinancial aspects in general.
• The Economic Survey, a yearly publication of the Department of EconomicAffairs, Ministry of Finance. This is published on the eve of the presentationof the national budget.
• Agricultural Situation in India by the Department of Economic Affairs,Ministry of Food and Agriculture. This monthly journal compiles reports andassessments of the agricultural situations in the country.
• The Indian Labor Journal a monthly publication of The Indian LabourBureau, which contains detailed statistics on price indices, wages and earn-ings absenteeism, etc.
34 3 Business Research Design: Exploratory, Descriptive and Causal Designs

As in India, we also have a number of useful government publications in othercountries. These publications would be useful for those companies that are plan-ning to venture into the international markets. Taking the case of United States, wehave the Internal Revenue Service (IRS) from the Department of Treasury whichprovides information on the IRS strategic plans for coming years, annual perfor-mance plans and other budgetary information; The Bureau of International LabourAffairs from the U.S. Department of Labour publishes The International PriceProgramme through Import Price Indexes (MPI) and Export Price Indexes (XPI)which contains data on changes in the prices of non-military goods and servicestraded between the United States and the rest of the world. Some of the major statedepartment publications in the Unites States are ‘Battling International Bribery’which is the Department of State’s report on enforcement and monitoring of theOECD Convention and ‘Country Reports’ submitted annually to the Congress bythe Department of State regarding the status of internationally recognized humanrights practices.
Other government agencies in the United States which bring out useful sec-ondary information are The Bureau of Alcohol, Tobacco, Firearms and Explosives,Bureau of Industry and Security from the U.S. Department of Commerce, The U.S.Food and Drug Administration, etc. The U.S. Environmental Protection Agencybrings out the publication ‘Waste management reports—selected publicationsrelated to climate change and municipal waste management’ The EconomicReport of the President is an annual report written by the Chairman of the Councilof Economic Advisors which gives the nation’s economic progress using text andextensive data appendices.
Non-governmental associationsApart from the official publications, there are also loads of non-governmental or
private organizational reports that can be useful to researchers. Various industryand trade associations are worth mentioning in this context. The Indian CottonMills Federation publishes statistics on the cotton textile industry. The BombayMill Owners’ Association similarly publishes in its annual report statistics on theperformance of its member units. Other non-governmental sources of publicationsare the annual statistics by The Market Research and Statistical Bureau of theCoffee Board, Bangalore; ‘India’s Production, Exports and Internal Consumptionof Coir and Coir Goods’ an annual publication by The Coir Board, Cochin; TheRubber Statistics, an annual report by The Rubber Board, Kottayam; the IndianSugar Year Book by the Indian Sugar Mills Association, Delhi and a quarterlypublication entitled ‘Wool and Woolens of India’ by The Indian Woolen MillsFederation. Apart from bringing out the latest statistics and details about theindustry, these industrial and trade reports also provide an insight into the prob-lems of the industry as a whole. The Steel Authority of India Ltd. also brings out,on a quarterly basis, a statistical publication relating to the functioning of the ironand steel industry in India.
Apart from these non-governmental associations, there exist several chambersof commerce. These include the Federation of Indian Chambers of Commerce andIndustry (FICCI), Associated Chambers of Commerce and Industry of India and
3.2 Part I: Exploratory Research Design 35

the Indo-American Chamber of Commerce, which have their own periodic pub-lications highlighting the functioning and latest trends of a specific industry andthe problems it faces.
Similarly, in the United States too, there are several non-governmental asso-ciations that publish industry-related information. ‘The American Statistics Index’published monthly, quarterly and annually by LexisNexis, brings out indexes andabstracts of a wide range of statistical publications produced by the US govern-ment. ‘FedStats’ provides access to the statistics and information produced bymore than 70 US federal agencies. Other non-governmental associations in theUnited States which provide statistical information are ‘The Digital NationalSecurity Archive’ which is a collection of primary documents central to US for-eign and military policy since 1945. More than 35,000 declassified documents—totalling more than 200,000 pages—have been gathered through use of the USFreedom of Information Act (FOIA). LexisNexis Statistical Indexing and abstractsfor over 100,000 U.S. government and non-government statistical publicationswith links to selected full text documents and agency web sites are available on theNet. Selected tables can be imported to spreadsheets, etc.
The governmental and non-governmental associations mentioned here are onlya few of those available and illustrate the point that an ample amount of secondarydata is always available at hand. One should make good use of these sources forvarious research purposes
DirectoriesWhile framing its marketing strategy, a company needs to take serious note of
its potential competitors and customers. As such, the company has to be aware ofthe latest developments and market strategies of the major players in the industry.It is possible for the company to access such information through industry-specificdirectories. These directories give first-hand information about the existing play-ers, their products and strategies. Researchers often make use of directories whenthey are preparing sampling frames. Stock exchange directories can be a handysource for detailed information on the corporate sector. For example, The BombayStock Exchange Directory is unique in providing detailed data on the financialaccounts, key profitability and other important ratios of listed companies. Thepresentation makes it easy for earlier data to be replaced with the latest datawithout much difficulty.
Trade show directories are another useful source of secondary data. They helpin identifying trade shows linked with a specific industry, along with informationon individual companies including addresses, names of executives, product rangeand brand names. This facilitates establishing contact with sponsors and variousexhibitors who participate in these exhibitions. Some Indian directories are ‘121India’ (Portal with news, entertainment, matrimonials and business), ‘The City asit Happens’ (detailed information about major metros, people and their lifestyles,pubs, latest fashion trends, etc.) and ‘Tata Yellow Pages’ (Guide offering classifiedinformation of products, services and organizations in major Indian cities).
Every country has its own Yellow Pages on the Internet. Some major directoriesin other countries include ‘The Thomas Register of American Manufacturers’ (New
36 3 Business Research Design: Exploratory, Descriptive and Causal Designs
York: Thomas Publishing Co.) which has data on more than 150,000 companies,‘Who Owns Whom’ (North American Edition) lists 6,500 parent companies and100,000 domestic and foreign subsidiaries and associated companies.
Industry expertsLooking out for industry experts for specific information is another means of
collecting secondary data. These experts specialize in their own domain and sogetting information from them is often highly useful for research. These expertsgive expression to their expertise knowledge through published articles andthrough consultation services. Hence, the best way to contact them would be bytracing published information articles to their authors or contacting consultanciesoffering specialized services. Examples of such expertise consulting services arePrice Waterhouse Coopers (PWC) that has expert financial consultants; Data-monitor’s Business Information Centre which provides services to the world’slargest companies in the fields of automotive and logistics, consumer markets,energy and utilities, financial services, and healthcare and technology sectors andACNielsen for industrial services.
Special collectionsSpecial collections consist of diverse materials that include reference books;
university publications consisting of master’s theses, doctoral dissertations andresearch papers; company publications such as financial reports, company policystatements, speeches by eminent personalities, sales literature, etc. Miscellaneousdata available from organizations that publish statistical compilations, researchreports and proceedings of meetings also come under special collections. Finally,there are personal, historical and other social science research reports which findan occasional place in business studies.
Classification by MediumSecondary data classified by medium include hard copy and Internet. Hard copy
refers to non-database information. This comprises of all books, magazines,journals and special collections contained in hard-copy libraries. It is very difficultto get detailed indices for all hard copies.
With the advancement in technology in recent times, huge databases andinformation have become available on the Internet and these facilitate the newtrend of data collection over the old tradition of spending long hours in the library.In fact, there is so much data available on the net that researchers at times do notneed to go to other sources. Not only does it facilitate the retrieval of online datapertaining to the research, but also helps in gathering information from respon-dents via e-mail. Browsers such as Microsoft’s Internet Explorer and Netscape’sNavigator make it possible to access sites and user groups of all those connectedthrough the Net.
There are two reasons which keep the researchers glued to the internet—first itmakes it easy for the researcher to gather information regarding the advertising,promotions and communications of various products and services from thewebsites created by companies, and secondly, it acts as an interface between theuser groups interested in a particular subject and the researcher. There are manydatabases available online which contain certain research papers, articles, etc.,
3.2 Part I: Exploratory Research Design 37
and a researcher can find data relevant to his topic in some database or the other.These can be accessed for a fixed amount or on a pay-as-you see basis. Thesedata are updated regularly by those who provide and maintain them. All gov-ernmental and non-governmental associations, companies and publishing com-panies have their specific websites which one can surf through at a minimum costto gather useful data. Such online databases are a resource to be converted touseable data for improved decision-making and analysis. Each of these websiteshas hypertext links to other useful data for similar purposes. Some websites alsooffer membership options. A person wanting to be a member pays a fixed amountof money and is then able to access the information stored in the database.Another form of multimedia database is the vast number of CD-ROM businessdatabases that interrelate audio, video and text and provide search and downloadcapabilities.
Classification by Database ContentClassification of secondary data by database content is useful for a better insight
into the subject matter. A database is a collection of information in a detailed andstandard format. A classification of database by the content of informationincludes online, internet and offline databases. Online databases consist of a centraldatabank accessible by a terminal via a telecommunications network. Internetdatabases are those that can be accessed on the net and can also be downloaded ifrequired. Offline databases are those which make the information available ondiskettes and CD-ROMs. A further classification of these three highlights twocommon aspects. We will now look into each of these types in detail.
Reference databaseA reference database provides a bibliography of documents, abstracts or
locations of original information. Since they provide online indices, citations andabstracts, they are also referred to as bibliographic databases. Wide varieties ofbibliographic databases are available for a variety of business research applica-tions. Abstract Business Information (ABI) contains 150 word abstracts and 1,300-business publications worldwide. Reference databases enable the researcher to usenatural-language key words to search for abstracts and summaries of a wide rangeof articles appearing in various business magazines, government reports, tradejournals and research papers.
Some examples of reference databases are Predicasts Overview of Markets andTechnology (PROMPT), Marketing and Advertising Reference Services (MARS),Aerospace/Defence Markets and Technology (A/DM&T), PTS Newsletter Data-base, F and S Index, etc. These databases contain index, word abstracts and full-text records, including competitor information and emerging technologies fromtrade and business publications worldwide.
Source databasesSource databases usually publish numerical data, full text or a combination of
both. They include full texts of various economic and financial databases. Unlikereference databases, which are limited to providing indices and summaries thesedatabases provide complete text and numerical information. Census-based numericdatabases are often found to be useful for studies dealing with market potential,
38 3 Business Research Design: Exploratory, Descriptive and Causal Designs
segmentation and site location evaluations. Time series data available online arealso useful for tracking and forecasting.
Source databases provide data relating to economy and industries. They can beclassified into full-text information sources, economic and financial statisticaldatabases, online data and descriptive information on firms. Harvard BusinessReviews Online, Hoovers Online, LexisNexis and EBSCO are good examples inthis case. EBSCO facilitates access to various business databases and also specialnewspapers, periodicals, books and company annual reports.
3.2.1.3 Advantages of Secondary Data
Secondary data are used by managers as it is cheaper and takes less time to gather,thus saving them a lot of money and time that they would have otherwise spent ingathering primary data. Apart from these, there are other distinct advantages ofusing secondary data, which are as follows:
Secondary data can help identify, clarify and redefine the research problem: Insituations where the actual problem in a research study cannot be defined or isdefined in an ambiguous way, the use of secondary data can help clear the con-fusion with a clear definition of the problem to be probed into.
Secondary data might also hold a solution to the problem: Research problemsmight not require the gathering of primary data each time. Many a times, ithappens that precise data regarding the current research is already available assecondary data that had been collected for some other research purpose. Hence, itmight not be necessary to conduct a primary data collection exercise at all.
Secondary data may provide alternatives methods that can be used for primaryresearch: Every research situation has a custom-made primary research designedfor it. If such published reports are gathered from secondary sources, then it gives apush to the initial stages of the similar current research at hand by outlining thepossible research alternatives.
Secondary data generate requisite information for better creativity: Secondarydata can provide insights into the means to identify potential customers, industrytrends and proper language usage. This prior knowledge helps in the design andprogress of the current research. This provides a better chance of creativity in theresearch.
Although secondary data have many advantages to its credit, it has its ownshare of pitfalls and disadvantages. A close look at the utility of secondary datareveals the following limitations and disadvantages.
Lack of availability: Even though secondary data might be available for manyresearch studies, it might so happen that there is no secondary data available forspecial cases or that the organization holding such data are not willing to make itaccessible to outsiders. If a company like General Motors would like to conduct aresearch for the market potential of its cars in particular cities in India, then it isvery unlikely that any secondary data would be available in this context.
3.2 Part I: Exploratory Research Design 39
Lack of relevance: Secondary data might be irrelevant because of the changesin competitive situation, changing trends and other variables in the researchenvironment from the time the data were initially collected. Thus, its usage for acurrent research study might be limited. Relevance might be reduced due to dif-ference in units of measurement, use of surrogate data in the secondary sources,difference in definition of classes and time.
Inaccurate data: Secondary data can be subject to doubt because of the errorsthat can occur in any of the steps or due to personal bias. Errors of this sort canmake the secondary data inaccurate and therefore unusable. It is possible that thesecondary source of data might have been custom made to avoid some specificrealities and as such fail to mention the sources of error. Hence, an effort shouldalways be made to trace the secondary data to its original source.
Insufficient data: Secondary might be available but they might not posses all therequired data useful for the current research at hand.
3.2.1.4 Syndicated Data
Syndicated data are data produced by a market research firm, which provides abody of similar data compiled from a large number of sources, organized into acommon format for a fee to its subscribers. This data are neither available nor canbe gathered from any internal source. Such data are not client-specific, but areflexible enough to be custom made to suit particular researches. A brief classifi-cation of syndicated data has the following three inclusions that are also shownbelow in Fig. 3.3. Syndicated data can be collected using the following.
• Surveys• Audits• Panels• Warranty cards.
SurveysCommercial surveys undertaken by research organizations fall under three
categories, that is, periodic surveys, panel surveys and shared surveys.Periodic SurveysThese are surveys that are conducted at regular intervals—weekly, monthly,
quarterly or annually. The sample respondents are different each time the survey isconducted. Though the sample population differs, the topic of the survey remainsthe same allowing the researcher to analyse the changing trends. This type ofsurvey does not facilitate the study of trends at the individual level as therespondents of the survey change over a period of time. These surveys can be usedto study changing trends in the competitive environment or consumer behaviour.Mail, personal interviews and telephonic interviews are some of the methods ofconducting commercial surveys.
40 3 Business Research Design: Exploratory, Descriptive and Causal Designs
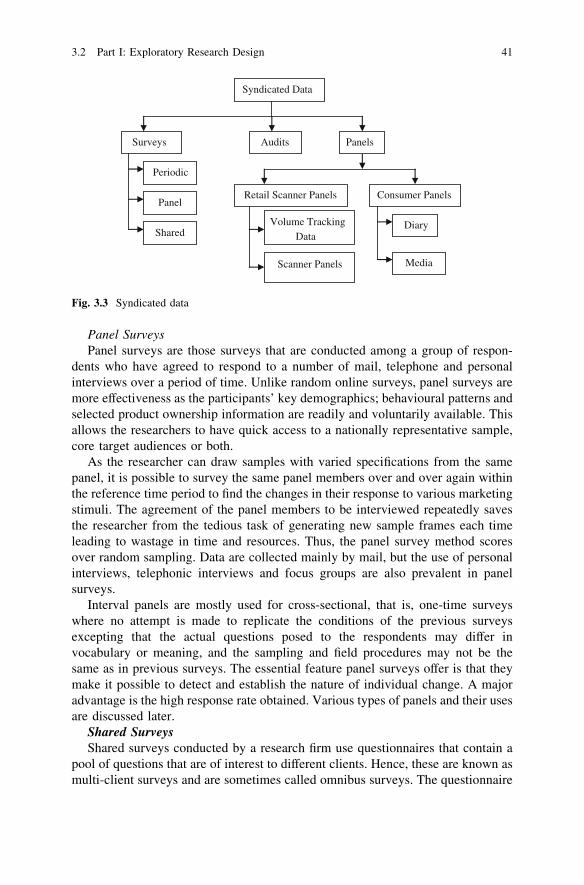
Panel SurveysPanel surveys are those surveys that are conducted among a group of respon-
dents who have agreed to respond to a number of mail, telephone and personalinterviews over a period of time. Unlike random online surveys, panel surveys aremore effectiveness as the participants’ key demographics; behavioural patterns andselected product ownership information are readily and voluntarily available. Thisallows the researchers to have quick access to a nationally representative sample,core target audiences or both.
As the researcher can draw samples with varied specifications from the samepanel, it is possible to survey the same panel members over and over again withinthe reference time period to find the changes in their response to various marketingstimuli. The agreement of the panel members to be interviewed repeatedly savesthe researcher from the tedious task of generating new sample frames each timeleading to wastage in time and resources. Thus, the panel survey method scoresover random sampling. Data are collected mainly by mail, but the use of personalinterviews, telephonic interviews and focus groups are also prevalent in panelsurveys.
Interval panels are mostly used for cross-sectional, that is, one-time surveyswhere no attempt is made to replicate the conditions of the previous surveysexcepting that the actual questions posed to the respondents may differ invocabulary or meaning, and the sampling and field procedures may not be thesame as in previous surveys. The essential feature panel surveys offer is that theymake it possible to detect and establish the nature of individual change. A majoradvantage is the high response rate obtained. Various types of panels and their usesare discussed later.
Shared SurveysShared surveys conducted by a research firm use questionnaires that contain a
pool of questions that are of interest to different clients. Hence, these are known asmulti-client surveys and are sometimes called omnibus surveys. The questionnaire
Syndicated Data
Surveys
Periodic
Panel
Shared
Audits Panels
Retail Scanner Panels
Volume Tracking Data
Scanner Panels
Consumer Panels
Diary
Media
Fig. 3.3 Syndicated data
3.2 Part I: Exploratory Research Design 41
features standard demographic questions along with other questions asked by eachclient. Clients do not have any sort of access to either the data or the questionsasked by other clients. The findings of the survey are tabulated according to theneeds of the client. Such surveys are mostly conducted through mail, telephone orpersonal interviews. Respondents are selected from interval panels or selectedrandomly from a larger population.
Shared surveys offer several advantages. Firstly, since the fixed cost of sampledesign and other variable costs are borne by many clients, the cost per question isusually low. The pricing is based on the number of questions asked by each client.The cost per question decreases as the number of questions increases. Samplingconsisting of interval panel members offers extra benefits as the extensivedemographic data associated with each panel member can be used in the analysisof the responses. Surveys can be generally used for market segmentation (withpsychographic and lifestyle data for establishing consumer profiles), productimage determination, price perception analysis and evaluation of the effectivenessof advertising.
Surveys are advantageous in that they are flexible enough to collect data fromdifferent segments of the society regarding consumers’ motives, attitudes andpreferences. They even help to locate intergroup differences based on demographicvariables and even help to forecast the future. But their utility may be limited dueto respondent bias. There may be a difference between what the respondent saysand what he does, or he might be influenced to give socially desirable responses.
AuditsAn audit involves an in-depth analysis of the existing situation in a firm. In
business, there are many activities that can be subject to an audit. Audits arecarried out by the physical inspection of inventories, sales receipts, shelf facings,prices and other aspects of the marketing mix to determine sales, market share,relative price, distribution and other relevant information. A performance audit isan objective and systematic examination of evidence in order to provide anindependent assessment of the performance of an organization, programme,activity or function, so that information to improve accountability and facilitatedecision-making can be made available to the parties responsible for overseeing orinitiating corrective action. Audits are of different types such as store audits,product audits and retail distribution audits.
Store audits examine the quantity of a product that is being sold at the retaillevel. Nielsen Retail Index provides such audited data. Generally, such auditsprovide data on the total sales of all the packaged goods carried by the differenttypes of retail stores sampled for auditing. The packaged goods considered forstore audit include food, tobacco, pharmaceuticals, beverages, etc. Retailers andwholesalers who participate in the auditing get cash and the much-needed auditingreports as incentive. Store audits allow the marketers to measure the performanceof their brands against the competitors. They can also help marketers to evaluatethe main reasons for the product being off-shelf on the basis of supply/distributionproblems, incorrect master data and store replenishment issues.
42 3 Business Research Design: Exploratory, Descriptive and Causal Designs
Product audits are similar to store audits in the information provided but focuson covering all types of outlets that store a particular product. For example, a storeaudit for Close-up toothpaste can help to estimate the total potential market anddistribution of sales by type of outlet and various regions. The product audit for thesame would include grocery stores, mass merchandisers and retail chain stores.Retail distribution audits are also similar but they differ in their mode of operation.Auditors enter a retail shop unannounced, without permission, record the stockholdings, shelf facings and collect other relevant data for selected product cate-gories. Pantry Audits are special audits used to find out customer preferences bystudying the quantity, price and type of goods being purchased by the consumer.The method studies the buying pattern of the consumers relating to which type ofconsumers purchased what products and could be followed by a questioningsession to find the exact reasons for the purchases done by the consumers. Thelimitation of this method is that it is difficult to specifically identify consumerpreferences through this method if used as a stand-alone method especially incases where promotional schemes are being run.
Auditing data find their uses in:
• Assessing brand shares and competitive activity• Identifying inventory problems• Developing sales potential and forecasts• Determining total market size• Monitoring promotional budgets based on sales volume.
Audit data provide accurate information on the sale of various products atvarious levels. However, they have the disadvantage of limited coverage and timefactors. Unlike scanner data, audit data cannot be associated with consumercharacteristics and advertising expenditures.
PanelsA panel is a group of individuals or organizations that have agreed to provide
information to a researcher over a period of time. This section relates to continuouspanels, which consist of samples who have agreed to participate in a survey andprovide specified information or report specified behaviours on a regular basiswithin a reference time period. Panels are of various types such as:
• Retail Scanner Panels• Consumer Panels.
Retail Scanner PanelsRetail panels consist of sample retail outlets, and retail panel surveys provide
information based on sales data from the checkout scanner tapes of a sample ofsupermarkets and retailers that use electronic scanner systems. Supermarkets andbig retail chains carry products that have barcodes, which make it easier to capture(using scanners), the details of the products sold by the retail stores on a real-timebasis. Scanner data are obtained by passing merchandise over a laser scanner thatoptically reads the Universal Product Code (UPC) from the packages.
3.2 Part I: Exploratory Research Design 43
Another technology related to UPC is the Electronic Point-of-Sale (EPOS)systems. These are used extensively by retailers like K-Mart, Wal-Mart, Toys’-R’Us, Food World, etc. The mode of operation in both is similar. ScanTrack(A. C. Nielsen), InfoScan (IRI) and SRI (INTAGE) are some popular scanningservices available to researchers. These panels have their own samples of retailchain outlets having the requisite technology. These samples consist of super-markets, drugstores, mass merchants and other smaller retail chains.
There are two types of scanner data that are available. They are volume-tracking data and scanner panels. Panel members are selected in a systematic wayso as to ensure that they are representative of the total population. Detailed data arecollected and stored for each of the participating households or individuals.
Volume-Tracking Data: In volume-tracking data, the UPC of all purchasesmade by customers is scanned by electronic scanners. These codes are then linkedto their corresponding prices held in the computer memory after which the salesslip is prepared. The data are then analysed to deliver reports on purchases bybrand, size, flavour and market share as against time, area and store classification,as specified by the client. These panels focus on exclusive markets and geographicregions for specified time periods. Retail scanner panels have been able to putdown deep roots because of their flexibility and efficiency. Retail chains too canmake use of this data to detect price elasticities, placement of products in the storeand effects of in-store advertising and merchandising.
Scanner panels: Scanner panels are a little more advanced than the retailscanner panels and are used by IRI, NPD/Nielsen. In scanner panels, eachhousehold member of the selected sample household is given an identity card thathas a code specific to the individual and which can be read by the electronicscanner. Thereafter, along with the scanning of all the products purchased, thecustomers are required to swipe their ID cards at the checkout counters. In thisway, consumer identity is linked to the purchased products along with the time anddate. Some firms alternatively provide their customers with hand-held scanners.Once back home, the selected consumers are required to scan the codes of theproducts they purchased. But in comparison with the automatic ID scanning, thisrequires more effort on the part of the consumer as, apart from the scanning athome, the store name, prices and other data have to be fed in manually. This is alsoknown to create problems as for example in the case of goods consumed beforereaching home, wrong entries of prices and unscanned data due to time pressures,which can affect the accuracy of the data entered.
Consumer PanelsContinuous consumer panels are those that monitor shifts in individual or
specific household behaviours and attitudes over a period of time. They are helpfulin gathering relevant data pertaining to competitors’ strategies or own marketingstrategy efficiency. They also make use of UPC or consumer diaries. The followingsections will give a better insight into each of these functionalities.
Diary Panels: A diary panel as the name suggests is a panel of households whocontinuously record their purchases of selected products in a diary. Records aregenerally maintained for products frequently purchased like food items, household
44 3 Business Research Design: Exploratory, Descriptive and Causal Designs
goods and personal-care products. Nielsen Household Services, MRCA and IN-TAGE are some of the famous suppliers of diary panel data. The number ofproduct categories on which information is sought might vary from one serviceprovider to another. Each panel of the vast sample of families and non-familyhouseholds are required to report information on purchase of selected items,including the following data:
• Dates of purchase• The number and sizes of the packages• The total amount paid• Payment mode, whether cash, credit or coupons• Whether purchase was influenced by any promotional methods• The store where the purchase was made.
Apart from these information sample respondents are also required to answercertain special questions that are specific for each product category. Recentdevelopments are slowly replacing paper diaries by electronic diaries, where thesample respondents make their purchase entries online or by automatic electronicdevices provided to them. Data provided by diary panels prove to be useful in salesforecasting, market share estimation, assessment of brand loyalty and brandswitching and measuring advertising effectiveness. This method is not yet usedextensively in India.
Media Panels: Media panels are used by researchers who are interested inknowing the media habits of their target customers. Media panels consist ofsampled households whose television viewing behaviour is recorded throughspecial electronic devices. This electronic device is a household meter wired tothe TV and connected to a central computer by a telephone line. Thisarrangement automatically starts recording the specific channels that were beingtuned to when the TV is switched on. But the limitation of this system is that theresearcher cannot find out the number of viewers and their demographiccharacteristics.
To overcome this limitation, Nielsen Media Research came up with the NielsenPeople Meter. These meters can be placed on the TV sets of the sample householdswhich recorded two things, that is, the channel being tuned to and the person(s)watching. The operation is also simple. The meter is linked to a remote control thatrecords the age and gender of each of the family members when they press theidentifying button. The records are automatically fed into the central computer thatalready has the demographics of each of the family members. Thus, data for eachday are stored.
Apart from these electronic meters, TV diaries and booklets are also used tocollect the media habits of the households. This data are used by various serviceproviders like A. C. Nielsen, INTAGE to estimate the number and percentage ofall TV households viewing a specific show. This data are also disaggregated intovarious demographic and socioeconomic characteristics such as household
3.2 Part I: Exploratory Research Design 45
income, size and age of members, education levels and geographic locations as perclient specifications.
This technology has also stepped into tracking home video (cable, VCR, DVDplayers) and Internet indexes. Data gathered from media panels serve to be useful inestablishing advertising rates by TV and radio networks, the selection of appro-priate programming and profiling viewer and listener groups. Diary and mediapanels have distinct advantages over surveys. Respondents participate due to theirown willingness and as such provide more and higher quality data than samplerespondents. Secondly, the use of electronic devices that records at the time ofpurchase and TV switching eliminates human error in both diary (recall error) andmedia panels, respectively. These methods also have disadvantages in the form oflack of representativeness, maturation and response bias, refusal and attrition.
Warranty CardsThese postcard-sized cards are used commonly by dealers in the consumer
durables industry. The dealer sends the card to the consumers who post them back,so that the dealer can gather information about the products from them.
3.2.2 Exploratory Research: Qualitative Data
The exquisiteness of qualitative research lies in its flexibility to adapt to differentsituations. Not only can it help in probing the sub-conscious mind of therespondent, but it also finds extensive use in brainstorming sessions that often pavethe way for embarking upon product development or solving marketing problems.The participation of the customer in the brainstorming sessions can have a deepimpact on the objectivity of the research.
Increase the Value of Subsequent Quantitative ResearchQualitative research can serve as a prelude to quantitative research. A quanti-
tative research generally has a pre-designed set of responses. A respondent has tochoose from the limited answers irrespective of whether or not they represent histrue feelings. Such responses may have little value for the research. A bettermethod would be to make use of qualitative research prior to conducting a moreanalytical quantitative research and try to include the most relevant responses inthe questionnaire.
Obtain Visceral Feedback Instead of Just Number Crunching DataQualitative researches, unlike quantitative ones are not data centric. In addition
to the ability of generating richer data, they also have the advantage of observingthe respondents (in face-to-face interviews), which helps in probing the mind ofthe respondents and interpreting the information given by them.
Group Dynamics Enhance ResultsQualitative researches involve group dynamics where participants can interact
with one another. This interaction has the inherent tendency to draw out responsesthat may not have been obtained in a one-to-one confrontation with theinterviewer.
46 3 Business Research Design: Exploratory, Descriptive and Causal Designs
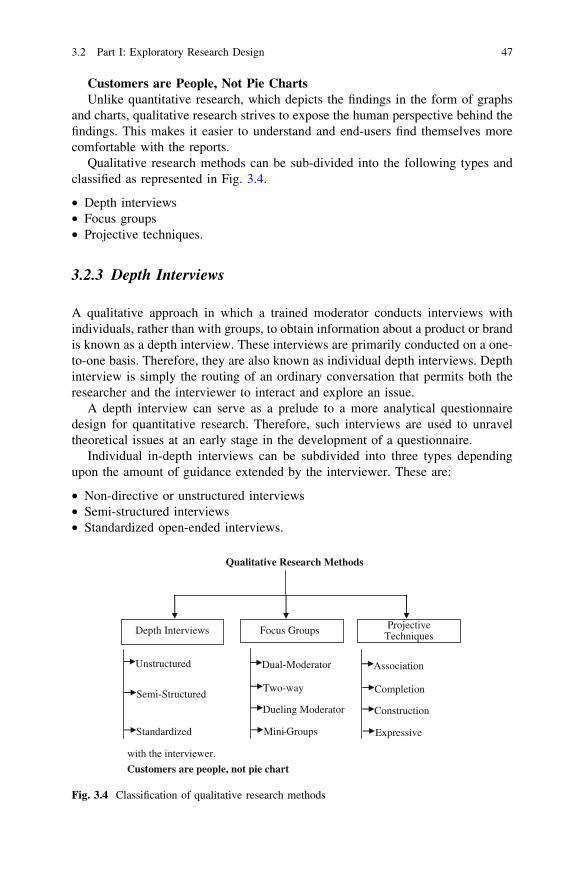
Customers are People, Not Pie ChartsUnlike quantitative research, which depicts the findings in the form of graphs
and charts, qualitative research strives to expose the human perspective behind thefindings. This makes it easier to understand and end-users find themselves morecomfortable with the reports.
Qualitative research methods can be sub-divided into the following types andclassified as represented in Fig. 3.4.
• Depth interviews• Focus groups• Projective techniques.
3.2.3 Depth Interviews
A qualitative approach in which a trained moderator conducts interviews withindividuals, rather than with groups, to obtain information about a product or brandis known as a depth interview. These interviews are primarily conducted on a one-to-one basis. Therefore, they are also known as individual depth interviews. Depthinterview is simply the routing of an ordinary conversation that permits both theresearcher and the interviewer to interact and explore an issue.
A depth interview can serve as a prelude to a more analytical questionnairedesign for quantitative research. Therefore, such interviews are used to unraveltheoretical issues at an early stage in the development of a questionnaire.
Individual in-depth interviews can be subdivided into three types dependingupon the amount of guidance extended by the interviewer. These are:
• Non-directive or unstructured interviews• Semi-structured interviews• Standardized open-ended interviews.
with the interviewer.
Qualitative Research Methods
Customers are people, not pie chart
Depth Interviews Focus Groups Projective Techniques
Unstructured
Semi-Structured
Standardized
Dual-Moderator
Two-way
Dueling Moderator
Mini-Groups
Association
Completion
Construction
Expressive
Fig. 3.4 Classification of qualitative research methods
3.2 Part I: Exploratory Research Design 47
3.2.3.1 Unstructured Interviews
Unstructured interviews take the form of a natural conversation and the inter-viewer brings up various topics that are of interest to him during the course of theconversation. The respondent is given the freedom to decide the direction of theconversation while expressing his opinions or narrating his experiences relating toa topic. This unstructured characteristic of the interview enables the interviewer todevelop a rapport with the interviewee and understand him better. Unstructuredinterviews are also known as non-directive interviews as there are no pre-for-mulated set of questionnaires and no pre-determined paths to route the intervieweeresponses.
The success of a non-directive interview depends upon the interviewer’sexpertise in giving an informal touch to the interaction, his ability to probe intoand elaborate on specific responses and in bringing back the discussion to linewhenever it deviates from the relevant topic. Such interviews normally extendanywhere between an hour and two and can be tape recorded with the priorconsent of the interviewee. Although flexible and responsive to individual andsituational changes, this method is known to generate less systematic data and it isvery difficult and time-consuming to classify and analyse such data.
3.2.3.2 Semi-Structured Interviews
These types of interviews are more structured than the non-directive interviews.While allowing some amount of flexibility to the interview, the interviewer ensuresthat he keeps the interview limited to the topics that are essential to the research.The interviewer at his discretion can make use of appropriate wordings andallocate a specific time for each question. This lends him sufficient flexibility toadapt to different responses. At this stage, probing techniques can be used toencourage the respondents to provide details for relevant responses. This techniqueis primarily used to interact with busy executives, technical experts and thoughtleaders. As the technique calls for interactions with experts, the interviewer mustpossess knowledge of the latest trends in technology, market demand, legislationand competitive activity. This will enable him to apply probing techniques better.Therefore, much depends upon the inherent skills of the interviewer.
Recording the answers may be a problem in case the interviewee dislikes it. Tocounter this, a group of interviewers, probably 3–4 can alternatively ask questionsand note down the answers. Although advantageous in many respects, the techniqueis known to have no provision to permit the interviewer to probe into unanticipatedissues cropping up during the interaction, which were not a part of the basicchecklist. Even the flexibility regarding the choice of words of the interviewer maylend bias, leading to different responses from different individuals.
48 3 Business Research Design: Exploratory, Descriptive and Causal Designs
3.2.3.3 Standardized Open-Ended Interviews
This is different from the two interview methods described above with respect tothe flexibility in the questionnaire. Here, the questionnaire contains a set ofsequential ordered, carefully worded, open-ended questions. This reduces thedifferences in responses from different individuals due to the choice of words onthe part of the interviewer. This technique is appropriate when two or moreinterviewers conduct the interviews. It minimizes the variation in the questionsposed by them to different interviewees. These types of interviews enable theevaluator to collect data systematically, thus facilitating comparison of responsescollected from different respondents. This method, however, limits the use ofsubstitute questioning to probe into individual differences.
3.2.3.4 Techniques for Conducting Depth Interviews
Marketers rely on surveys, and demographic information to help them developmarketing strategies and tactics for their products. These marketers fall back ondepth interviews when they do not have much knowledge about a population anddesire to explore the same. This preliminary information can be gathered throughthree different interview techniques as recommended by Durgee. These are asfollows:
LadderingAn interviewing technique that enables the interviewer to gain an insight into
the subject’s personal reasons for purchasing certain products is known as lad-dering. In this technique, the interviewer starts the interview with questions relatedto product attributes and slowly starts probing into user characteristics as theinterview progresses. In other words, a tactful set of closely related questionsprobe into the product attributes, consequences and personal values behind aconsumer’s preferences for a product/service.
For example, a respondent may be asked to give the distinguishing features forhis preference of supermarket A over supermarket B. The main motive in thistechnique is to trace the tangible aspects of the product/service to the intangibleaspects of the respondent’s mind to gain an insight into decision-making at anindividual level. If the factors are ‘ambience’ and ‘better service’, the respondentis further probed on the specific ambience or service factor, to trace the linking ofthat factor to the sub-conscious mind of the respondent. The traceability of thetangible product attributes to the intangible aspects helps to determine the keyfactors in the sub-conscious mind that affect the buying behaviour of therespondent and to identify the hurdles preventing the greater diffusion of certaingoods and/or services.
This technique, aims at obtaining cognitive maps, or Hierarchical Value Maps(HVMs) and is the most widely used method to uncover consumers’ cognitive
3.2 Part I: Exploratory Research Design 49
structures. The interviewer needs to have expertise in specific probing techniquesto enable him to read the sub-conscious mind of the interviewee and frame thequestions accordingly. The key to conducting successful laddering is practice. Thefollowing steps are necessary for a laddering interview to be successful.
• Choose a brand-loyal respondent who is uniquely capable of articulating the keyaspects of the product he likes most.
• Start out with questions that get the customer talking about the product. Thistends to put the respondents at ease and gets them accustomed to answering yourquestions about the product.
• Questions should always link to the previous response given by the interviewee,to construct a ladder establishing links between the attributes, consequences andvalues.
• The second round of questions begins by probing why certain attributes areimportant. Upon a specific response, the interviewer should keep probing deeperinto that consequence to find the underlying value to identify the real reasonbehind the purchase.
Hidden-Issue QuestioningThis interview technique aims to identify significant personal views that would
otherwise not be revealed by respondents during a direct approach. This techniquetries to probe into the hidden issues and items like daydreams, anxieties, fasci-nations and hopes in peoples’ lives that do not surface in their day-to-day schedule.Turner refers to these fallback thoughts as ‘liminoid’ or, ‘the state of marginalityoccurring when normal structural constraints—limits imposed by work, family,ones own abilities and attributes—are removed’.
The key point here is to unravel the ‘second life’ captured in the liminoidcondition. Respondents tend to take interest in such topics and answer questionsnot only with speed but also in detail. Therefore, questions like ‘what would youdo if you get 10 crores?’ or ‘How do you see yourself as a celebrity?’ are typicalquestions in such techniques. Questions under this method probe into therespondent’s attitude towards work, home, leisure pursuits and the like.
3.2.3.5 Advantages and Disadvantages of Depth Interviews
Advantages
• Depth interviews attribute independent responses directly to the respondents,unlike focus groups where it is difficult to trace responses to a particularrespondent.
• Attitudes and emotions of the test persons can be explored in detail and are closeto reality as there is no social pressure to conform to group responses, as is thecase of focus groups.
50 3 Business Research Design: Exploratory, Descriptive and Causal Designs
• It is possible to determine the motivations and resistance towards certain mar-kets, products and services.
• Mutual interaction between the interviewer and the interviewee helps to gen-erate an informal atmosphere that facilitates the discussion of sensitive questionsor ‘taboo themes’.
Disadvantages
• It is difficult and expensive to find and employ skilled interviewers.• Lack of structure in questionnaires in non-directive and semi-structured inter-
views introduces interviewer bias.• Quality of the results depends on the skills of the interviewer.• The cost and the length of the interviews combined do not permit more number
of interviews to be conducted.
3.2.4 Focus Group Interview
A focus group is defined as group of individuals selected and assembled byresearchers to discuss and comment on, from personal experience, the topic that isthe subject of the research. This type of interviewing is particularly suited forobtaining several perspectives about the same topic. According to the late politicalconsultant Lee Atwater, the conversations in focus groups ‘give you a sense ofwhat makes people tick and a sense of what is going on with people’s minds andlives that you simply cannot get with survey data’. A focus group consists of agroup of anywhere between 6 and 12 members. This size of the group encouragesthe participants to give their views on the specific issue. The very essence of thefocus group as a technique lies in tapping the unexpected findings that result froman interactive session between the members of the group.
These members take part in the discussion for about 2 h, which is the normaltime for a focus group interview. These members are selected from a plannedsample. It should be ensured that the participants have ample knowledge andexperience of the issue/topic to be discussed. Prior to conducting the focus groupdiscussion, the participants are updated, over the phone, regarding the purpose ofthe focus group and the confidentiality of the members and their information. Atthe onset of the discussion, the moderator reiterates the same things in addition tointroducing any co-moderators and explaining how and why these group memberswere invited to participate and stating the purpose of note taking and recording.
It should be ensured that the focus group is homogeneous with the participantshaving common interests, experiences, or demographic characteristics. This would
3.2 Part I: Exploratory Research Design 51
facilitate proper blending among the members resulting in a productive discus-sion.2 However, in doing so, it should be ensured that people who know each otheror are in some sort of command chain are not recruited into the same sessions. Forthis purpose, the researchers segregate the participants into different groups basedon the difference in views (for or against) or some other parameters.
The effectiveness of a focus group depends on the person who moderates thediscussion. A moderator should balance a directive role with that of a moderator,which calls for the moderator to be skilled in establishing and upholding groupdynamics and being able to provoke intense discussion on relevant issues. This isimportant as the quality of data collected is directly proportional to the effec-tiveness with which the moderator monitors the discussion by asking questions andkeeping the discussion targeted on the research objectives. A moderator external tothe research organization but with sufficient expertise can also be invited to presideover and facilitate the discussions. If there are different groups then the moderatoris expected to be flexible enough to customize his style to each of them.
As the group consists of a number of participants, the format of the questioningplays a major role in eliciting responses from the participants that are cumulativeand elaborate than individual responses. The questions should be open-ended,clearly formatted, neutral and sequential. Close-ended questions and leadingquestions (questions that favour a particular response from the participants) shouldbe avoided. Focus group questioning is not a serial interview. It is rather a dis-cussion of a specific topic that follows from the interaction of the group members.Not only does the discussion prove to be useful in comparing the responses of thedifferent members but also helps the researcher to know what the members thinkand why. The responses of the members of the group are also affected by theimmediate physical surroundings. Therefore, the provision of a relaxed, informalatmosphere should be ensured.
As the focus group involves the interaction of different participants, it becomesdifficult to gather the information generated during the course of the discussion.Therefore, some of the techniques that are used to keep a track of the responses ofthe participants in combination with manual note taking are audio/video recordingand multiple methods of recording. Although videotaping is costly, if used, it cancapture the details of the discussion including the facial expressions of theparticipants.
3.2.4.1 Variations in Focus Groups
Focus groups can be of different types depending on the subtle variations incor-porated into the standard procedure. These variations are necessary as membersdiffer widely across various groups and some amount of variation helps in eliciting
2 Due of lack of representativeness it is not possible to compare the results from different groupsin a strict quantitative sense.
52 3 Business Research Design: Exploratory, Descriptive and Causal Designs
a multiplicity of views and emotional processes within a group context. Some ofthe variations in focus groups are discussed below.
Dual-moderator group: These types of focus groups are presided over by twofacilitators or moderators. There is simple division of labour between the twomoderators. One of them takes charge of the smooth flow of the interactive sessionand the other ensures that the topics in the basic checklist are discussed.
Two-way focus group: This type of focus group consists of two groups. One ofthe groups discusses the relevant topics with the other group monitoring theirwords and responses. The second group then analyses the observed interactionsand conclusions.
Duelling-moderator group: This consists of two facilitators who preside overthe group discussions. The unique feature of this group is that the moderators takeopposite stances against one another on the specific topics. In doing so, they ensurethat all the topics in the checklist are covered during the discussion and they get toanalyse both sides of a controversial issue. In taking opposite stances, they pushthe members to come up with more information than they would have otherwisedone.
Mini-groups: These usually consist of three to six respondents with a singlemoderator. They may not assist the collection of as private and highly insightfuldata as in the case of individual depth interviews, but nevertheless, the presence ofless number of members facilitates better and extensive probing into the subjectmatter. Therefore, they prove to be more competent when compared to largergroups, in the case of discussion of narrower issues. The duration of these dis-cussions is usually for an hour.
3.2.4.2 Advantages and Disadvantages of Focus Groups
Advantages
• In-depth synergism: Focus groups can, by putting together a number of people,get information about the subjects that cannot be obtained through individualdepth interviews.
• Snowballing: Participants not only discuss their own opinions but they also havean opportunity to react to the ideas of others. This can uncover issues that wouldnot emerge in a one-to-one interview.
• Hands-on: There is also an opportunity for extensive direct investigation.Products can be tried out, concepts can be reviewed, and reactions observed andprobed.
• Timely: Post-group debriefings with moderators and clients can create sharedinsight and reduce selective hearing or premature conclusions.
• Security: The homogeneity among the members regarding their experiences andfeelings place them at a comfortable position where they willingly communicatetheir ideas. Ideas arise more unexpectedly in a group than in individualinterviews.
3.2 Part I: Exploratory Research Design 53
• Speed: Interviewing a large number of people at the same time makes the datacollection and analysis faster than usual.
• Structure: A focus group interview permits the interviewer to have in-depthdiscussions on varied topics.
Disadvantages
• Misuse: People often tend to consider focus group results a replacement forsurvey data. It needs to be clarified that focus group researches probe the natureof attitudes and motivations, not their frequency in the population.
• Misinterpretation: The spontaneous responses from the members pose a diffi-culty for the researchers to decide which responses can be generalized. This canlead them to use their own conclusions, resulting in bias.
• Poorly managed group dynamics: Conducting focus groups require skill, insightand experience. It is often difficult to find a moderator with the requisite skills.
• Messy: As the members answer in an unstructured manner, it becomes difficultto code, analyse and interpret the responses.
3.2.5 Projective Techniques
Every individual has a sub-conscious mind that holds a lot of attitudes andmotivations that even the individual may not be aware of. Use of direct questionsto unravel these attitudes and motivations are least effective. Therefore,researchers use special techniques to venture into the private worlds of subjects touncover their inner motives. These special techniques are known as projectivetechniques.
The projective technique is an unstructured, indirect form of questioning thatencourages respondents to project their underlying motivations, beliefs, attitudesor feelings regarding the issue of concern. The respondents are exposed to variousscenarios and asked to interpret them. A close observation of the way therespondents describe a situation or a scenario reveals their own motives, attitudes,values and motivation.
Projective techniques find applications in various fields and are not limited tothe exclusive study of consumer motivation. They are not used to measure (whichis more the territory of other techniques such as surveys), but to uncover feelings,beliefs, attitudes and motivation that many consumers find difficult to articulate.The underlying principle of projective techniques is that the unconscious desiresand feelings of the respondents can be inferred by presenting them with anambiguous situation in which the respondent has to use the ego defence mecha-nism of projection.
The following are some of the projective techniques used by researchers to tapthe feelings in the sub-conscious minds of the subjects.
54 3 Business Research Design: Exploratory, Descriptive and Causal Designs
• Association techniques• Completion techniques• Construction techniques• Expressive techniques• Sociometry.
3.2.5.1 Association Techniques
In this technique, subjects are presented with a stimulus and are asked to reveal thefirst word, image, or thought elicited by the stimulus. Word association is the mostpopular type of association technique used, where a respondent is asked to respondto a word spelt out with the first word or thought that comes to their mind. This isknown as free word association where the subject has to share his first word ofthought. Successive word association is a slight variation in which the subjectshares a series of words or thoughts that strike his mind in response to the stimulus.For example, the word ‘ambience’ asked by the interviewer can have variedresponses from individuals like ‘sales men’, ‘building’ and ‘cleanliness’.
The researcher records the responses and the time taken to respond to eachword. This helps in analysing the frequency in which the subject gives a particularword or thought in response to the stimulus. These responses are analysed bycalculating the following:
• The frequency of the words given in response• The time elapsed before the response• The number of non-respondents.
Association tests are especially useful in consumer research used for discov-ering brand image or product attributes. Brand personification is one such area.Association tests can also be extended to measure attitudes about specific brands,their attributes, packaging and even advertisements.
3.2.5.2 Completion Techniques
These are somewhat similar to association techniques in that the subject is requiredto complete an incomplete stimulus. Completion techniques are of two types, thatis, sentence completion and story completion.
In sentence completion, a subject is asked to fill up the blank in a sentence. Thesubject uses his/her intuitive ideas to do the job and in the process leaves clues thatare traceable to his/her underlying attitudes, thought process and feelings. Thistechnique scores over word association in that the subjects can be given moredirective stimulus. These statements are usually in the third person and are some-what ambiguous. Interpretation is usually informal and qualitative, rather thanquantitative. Sentence completion is useful when time is limited, but depth of
3.2 Part I: Exploratory Research Design 55
feeling still has to be tapped.3 A slight modification in this technique is the para-graph completion where the subjects are required to fill in an incomplete paragraph.
Story completion is also similar to the above two variations with the exceptionthat the respondent is required to fill in the conclusion of the story. The storycontains enough clues to direct the responses of the subject but gives no hints atthe ending. The choice of words and the way the respondent concludes the storyhelps the researcher to form an idea about the feelings and personality of therespondent.
3.2.5.3 Construction Techniques
In construction technique, the subject is asked to construct his responses in theform of a story, description, dialogue or a picture. In construction techniques, therespondent is supplied with less initial structure that in turn requires more complexand controlled intellectual activity on his part. Construction techniques are of twotypes, that is, picture response and cartoons.
Picture response techniques originated from the Thematic Apperception Test(TAT) that is based on Henry Murray’s Personality Theory. The participants in thistechnique are given one or more pictures and asked to interpret the backgroundsituation, discussion, or direction of the story from the moment the picture iscaptured. It is for this reason that it is also known as the picture interpretationtechnique. It is used to identify the unspoken thoughts of the characters.
Cartoon techniques also serve a similar purpose. Here, the statements or athought of one of the cartoon characters is given in the box above his head. This issupposed to evoke certain responses in the mind of the other cartoon. This isexactly what the subjects have to identify. This evokes varied responses fromdifferent subjects, which in turn help the researchers to understand their uniquemindset and personalities. Other variations in this technique are the third-persontechniques, fantasy scenarios and personification.
3.2.5.4 Expressive Techniques
This is a technique that involves role-playing, where the respondent is given averbal or visual situation and is asked to play the role of a specific character like asales executive, a manager, or a political leader. The respondent, for example, isasked to assume that he is a political leader who has been invited to an interactivesession with the public on TV. The people tend to pour out their woes and
3 Green.
56 3 Business Research Design: Exploratory, Descriptive and Causal Designs
objections against the government. The manner in which the respondent copeswith the situation, tackles the grievances and makes statements reveals a lot aboutthe personality of the subject.
3.2.5.5 Sociometry
Sociometry is a method that was devised by Jacob L. Moreno for assessing groupstructure. Moreno defined Sociometry as the mathematical study of psychologicalproperties of populations, and the results obtained by the application of quanti-tative methods.
Sociometry is based on the fact that people make choices in interpersonalrelationships. Whenever people are in a group, they chose where to sit or whomthey speak to etc. It studies patterns of affection and loyalty that bind some groupmembers more closely than others and can be applied to situations involving studyof group behaviour in business research.
3.2.5.6 Advantages and Disadvantages of Projective Techniques
Advantages
• As the respondent is aloof of the purpose of the study, he tends to give responsesthat would otherwise have not been possible.
• Respondents do not perceive right or wrong answers to the exercise and areencouraged to respond with a wide range of ideas. This results in an increasedamount of data collection that is rich and accurate.
• Projective techniques help in generating hypotheses regarding why consumersbehave as they do.
• They are useful in ‘breaking the ice’ in focus group discussions.
Disadvantages
• Complexity of the techniques requires trained interviewers and skilled analysts,who are difficult to find, to analyse the responses.
• The employment of highly skilled staff is expensive which makes it difficult toadminister the techniques.
• Getting subjects for role-playing is difficult, as not all subjects may feel com-fortable with the idea.
• The reliability of measures is difficult to establish.
3.2 Part I: Exploratory Research Design 57
3.3 Part II: Descriptive Research Design
3.3.1 Descriptive Research Design: Survey and Observation
The method of collecting information by asking a set of pre-formulated questionsin a predetermined sequence in a structured questionnaire to a sample of indi-viduals drawn so as to be representative of a defined population is known as surveyresearch. A researcher conducting a survey has to deal with sampling, question-naire design, questionnaire administration and data analysis. These questionnairesare administered to an individual or a group of individuals through interviews.These interviews can be either face-to-face, over the phone or through any othercommunication media which has to be decided in advance. Typical surveyobjectives involve describing or learning from an ongoing activity by studying thechanges in behavioural patterns of the subjects of interest to the researcher. Thus,surveys tend to be descriptive in nature, although they are often quantitative innature surveys also entail some qualitative aspects as in research concerningconsumer satisfaction surveys and new product development.
3.3.2 Classifying Survey Research Methods
Having looked at the essential features of surveys in general, we can now classifysurveys into their different types. Surveys can be classified on basis of the methodof communication, the degree of structure and the amount of disguise in a ques-tionnaire and the timeframe for data collection. The next section deals with theclassification in terms of questionnaire structure, disguise and the timeframe,following which the classification based on mode of communication will followunder the section on survey methods. For a detailed classification of surveyresearch methods, refer Fig. 3.5
3.3.3 Questionnaire Design
Questionnaire design is a vital issue in interviewing. A properly designed ques-tionnaire can tap the necessary information from the respondent. Therefore,researchers always design a tactful set of questions to probe and prompt theinterviewee to give useful answers. Questionnaires fall under various categories,such as structured, unstructured, disguised and undisguised. But in this section, wewill limit our discussion to the study of structured and disguised questions.
A structured question is one that has a specified number of responses. Hence,the interviewee has to choose from among the alternatives given. Structuredinterviews are for the most part, orally administered questionnaires. Such
58 3 Business Research Design: Exploratory, Descriptive and Causal Designs
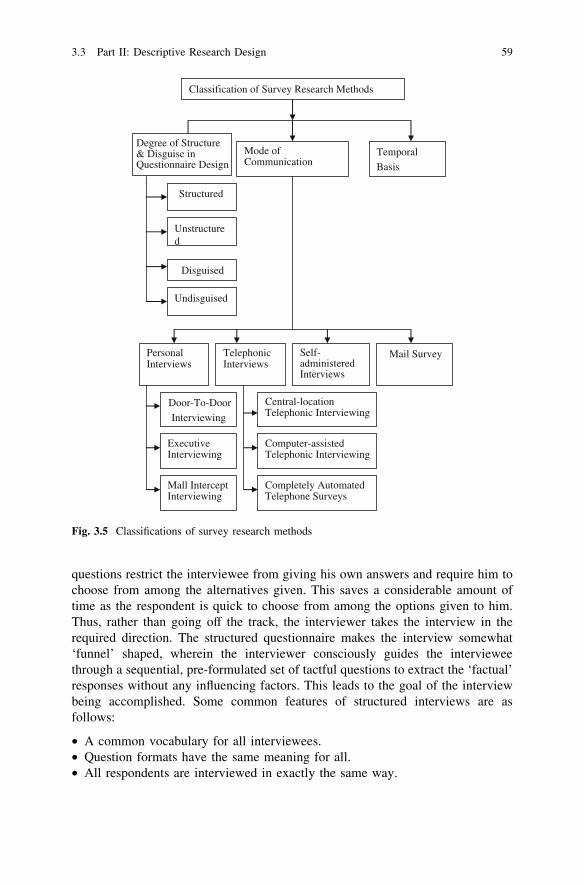
questions restrict the interviewee from giving his own answers and require him tochoose from among the alternatives given. This saves a considerable amount oftime as the respondent is quick to choose from among the options given to him.Thus, rather than going off the track, the interviewer takes the interview in therequired direction. The structured questionnaire makes the interview somewhat‘funnel’ shaped, wherein the interviewer consciously guides the intervieweethrough a sequential, pre-formulated set of tactful questions to extract the ‘factual’responses without any influencing factors. This leads to the goal of the interviewbeing accomplished. Some common features of structured interviews are asfollows:
• A common vocabulary for all interviewees.• Question formats have the same meaning for all.• All respondents are interviewed in exactly the same way.
Classification of Survey Research Methods
Degree of Structure & Disguise in Questionnaire Design
Mode of Communication
Temporal
Basis
Structured
Unstructured
Disguised
Undisguised
Personal Interviews
Telephonic Interviews
Self-administered Interviews
Mail Survey
Door-To-Door
Interviewing
Executive Interviewing
Mall Intercept Interviewing
Central-location Telephonic Interviewing
Computer-assisted Telephonic Interviewing
Completely Automated Telephone Surveys
Fig. 3.5 Classifications of survey research methods
3.3 Part II: Descriptive Research Design 59
• The questions are set in advance with their order and the range of possibleresponses the same for all respondents.
These features enhance the effectiveness of a structured questionnaire in thefollowing ways:
• Structured questions are easy and the interviewee can answer them quickly.• Similar questions and a uniform format make the answers easy to decode and
analyse.• The factual information has a high degree of reliability.• The possibility of any interviewer bias is reduced.
Although structured questionnaires help the researcher in eliciting programmedresponses, they fail to probe into the actual motives of the respondent. Thisdrawback can be overcome by including some unstructured questions in thequestionnaire. Unstructured questionnaires are usually open-ended and try to probeinto the mind of respondent, allowing the interviewee to express his own thoughtsrather than restricting him to the available response options.
Sometimes, it might happen that a questionnaire has a set of personal andsensitive questions to which the respondent might give incorrect answers. Theseare a set of questions to which the interviewee might take offence or questions thatmight threaten his ego or prestige. In such situations, interviewee may knowinglygive the wrong information. To nullify such instances of deliberate falsification,the interviewer frames the questions in a disguised manner. These disguisedquestions framed in a tactful manner help to elicit the right information from therespondent in an indirect manner, thus leading to the accomplishment of theresearch objective.
Depending upon the degree of structure and disguise involved, questionnairescan be further categorized as structured-undisguised, unstructured-undisguised andstructured-disguised.
However, these classifications have a number of limitations. Firstly, thevariance in the degree of structure and disguise in the questions makes them lessstraightforward and liable to misunderstanding by the respondent. Secondly,since the number of responses is limited, interviewees feel forced to choose oneeven if it does not divulge their true feelings. Thirdly, since surveys have a mixof personal and general questions they tend to adopt a hybrid style of ques-tionnaire format including structured, unstructured, disguised and undisguisedquestions. This leaves no alternative other than response bias to creep into theresearch data.
Since some research projects have a limited purpose, the data required can begathered in a single survey. However, there are other research studies that requiremultiple surveys for a consensus on data and conclusions to be reached and henceextend over a longer period of time. Classifying research surveys based on the timeperiod over which they extend, we have cross-sectional and longitudinal studies,which are discussed below.
60 3 Business Research Design: Exploratory, Descriptive and Causal Designs
3.3.4 Cross-Sectional and Longitudinal Studies
Most cross-sectional surveys gather information at a single point in time. Mostsurveys fall into this category. In this type of survey, the total target population isdivided into various segments, and then data are collected from all these segmentsusing a sampling method. Data collected are then analysed to define the rela-tionship between the various variables based on cross tabulation.
For example, a study designed to establish the relationship between ethics ofparents and their views on internet filtering is likely to bring in varied responsesfrom different sections of society who are studied at the same time.
The advantages of cross-sectional surveys lie in the fact that they are morerepresentative of the population. These surveys can be used to study the differ-ences in the consumption levels or trends in income, job changes and buyingbehaviour of individuals hailing from various groups and sub-groups of the pop-ulation. But when it comes to defining the same research objectives over a periodof time, cross-sectional studies cannot be used. Here, longitudinal studies arerequired.
Longitudinal studies are those research studies that use multiple surveys togather data over a period of time. They help in monitoring the behavioural changestaking place in the population that is of interest to the researcher. This type ofsurvey is flexible and can over a period of time, interview different respondentsprovided the new subjects are also from the same group or sub-group originallyinterviewed. Hence, longitudinal surveys are essential not only to learn aboutcurrent social situations, but also to measure their variation over a time period.
A number of different designs are available for the construction of longitudinalsurveys. They are:
• Trend studies• Panel surveys• Cohort panels.
Trend Studies: Longitudinal surveys consisting of a series of cross-sectionalsurveys conducted at two or more points in time, with a new sample on eachoccasion are known as trend studies. But it should be ensured that the new sampleis from the same category or segment of population originally surveyed, as trendstudies focus on the changing patterns of a particular population. Since eachsurvey brings out the existing trend at a particular point of time, data from severalcross-sectional studies of the same population can be integrated and a time trendanalysis can be established into the longitudinal survey. This can be done by usingconsistent questions in each of the cross-sectional studies.
Panel Surveys: A longitudinal survey that involves collecting data from thesame sample of individuals or households across time is called a panel survey. Theselected sample is called a panel. Panel surveys enable the researcher to detect andestablish the nature of changes occurring in the population over a period of time.These changes can be traced to the level of the individual as the surveys are
3.3 Part II: Descriptive Research Design 61
conducted on the same panel over a period of time. A particular sample of in-terviewees might respond or react to an impulse in a certain way, which mightdifferentiate them from others over a period of time. The very basis of longitudinalsurveys lies in detecting these changes. Although they provide highly specificinformation, they have certain drawbacks. They are time-consuming, expensiveand are also known to have high attrition rates as people often drop out of thestudy.
Cohort Panels: A cohort is defined as those people within a geographically orotherwise delineated population who experienced the same significant life eventwithin a given period of time. Cohort panels can be considered as a specific formof panel study that takes the process of generation replacement explicitly intoaccount. Thus, one or more generations are followed over their life course. Thestudy usually probes into the long-term changes and the individual developmentprocesses. If in each particular generation the same sample people are investigated,a cohort study amounts to a series of panel studies whereas, if a new sample ofrespondents is drawn in each generation, in each period of observation, a cohortstudy consists of a series of trend studies.
3.3.5 Survey Methods
Surveys are conducted through interviews and are generally classified based on themethod of communication used in the interview. The following are some of thecommon methods of conducting surveys.
• Personal Interviews• Telephonic Interviews• Self-Administered Interviews• Mail Surveys.
3.3.6 Personal Interviews
Based on the respondents to be interviewed and the means to contact them, thedifferent methods of personal interviews can be classified into the following types:
• Door-to-door Interviewing• Executive Interviewing• Mall Intercept Surveys.
Personal interviews are characterized by the presence of four entities, that is, theresearcher, the interviewer, the interviewee and the interview environment. The firstthree participants have some inherent and acquired characteristics specific to each ofthem. As such, they are able to influence the interviewing process in some way or theother. The choice of the fourth entity, that is, the interview environment is chosen by
62 3 Business Research Design: Exploratory, Descriptive and Causal Designs
the researcher based upon the type of data to be collected. Before we move on to discussthe various personal interviewing methods classified according to the interviewenvironment, it would be prudent to look at the advantages of personal interviews.
3.3.6.1 Advantages of Personal Interviews
Face-to-face personal interviews have a number of inherent advantages over non-personal interviews. These advantages are discussed below.
Feedback Opportunities: The opportunity to clarify the doubts of the inter-viewee is one of the features that put personal interviews ahead of other methodsof gathering data. A respondent hesitant to provide sensitive information can beassured of the confidentiality of the information provided.
Probing: The interviewer, in a personal interview, has the advantage of probingthe respondent for complex answers. A respondent might reveal her likes/dislikesfor a certain soft drink which is of no use to the researcher. But with the inter-viewer present, the actual reason can be traced back to any of the product attri-butes. The interviewer, by asking further questions, can probe respondents to zero-in on the specific product attribute that they like/dislike. This kind of informationis more useful to the researcher.
Length of Interview: As compared to other survey methods, the length ofinterview is appreciably better in personal interviews. This is so because it is easyfor a reluctant respondent to hang up the phone or not respond to a mail rather thanavoid someone in a face-to-face interview. Hence, the chance of the respondentanswering all the questions is greater as compared to other non-personal surveymethods. Some respondents, though reluctant to participate in a non-personalsurvey method, feel comfortable about sharing information with an interviewerpresent right in front. This leads to an increase in the length of the interview and animprovement in the quality of response in the case of personal interviews.
Door-To-Door InterviewingThis traditional survey method, supposedly the best, involves consumers being
interviewed in their homes. There are a number of reasons why this method isconsidered the best. Firstly, door-to-door interview involves a direct, face-to-facecontact with the interviewee. Therefore, it has the inherent advantages of instantfeedback and explanation of complex and difficult tasks. Secondly, special ques-tionnaire techniques requiring visual contact to improve data quality can be used inthis method. Thirdly, where complex product concepts are to be explained to thecustomer, door-to-door interviewing is an obvious choice. Fourthly, it is alsohelpful to the interviewer since as the customer being at home is at ease and islikely to reveal factual information.
Another advantage is that it provides a sample that is more representative of thepopulation as compared to mail questionnaires. Even people who do not have atelephone or whose numbers are not listed in the telephone directory can bereached by door-to-door interviewing. It is the best possible way for in-homeproduct tests, which require either establishing facts about the product or
3.3 Part II: Descriptive Research Design 63
explaining complex product features to the customer. Since it involves direct face-to-face interaction, it reduces the chances of non-response error. However, owingto the large number of drawbacks involved, there has been a slow decline in theusage of door-to-door interviewing. Some of its drawbacks are listed below.
i. The number of potential respondents is low in a population where both adultswork outside the home.
ii. Unsafe areas, distance and lack of accessibility pose a hindrance in reaching thedesired sample.
iii. Dearth of qualified interviewers.iv. Fluctuations in weather conditions, vehicle breakdown or sickness are also
factors that might pose a hindrance to reaching the target samples.v. It might not be possible to interview individuals who reside in high-rise
apartments or are too busy to entertain personal interviews. Hence, theseindividuals have to be excluded from the list.
Although door-to-door interviewing does not enjoy the status it once had, yet itwill remain in use for the variety of reasons for which it is particularly useful.
Executive InterviewingExecutive interviewing is similar to door-to-door interviewing with the only
difference that it is specific to workplace respondents. Executive interviewing isconcerned with finding out information related to some industrial product orservice and hence requires the interviewing of business people who use theseproducts in their offices.
If an ERP solutions provider seeks to identify the latest user preferences, then itshould at first identify and get in touch with the end users of its ERP products.After making a list of suitable names, the interviewer should contact the respon-dents over the phone asking them to spare some time for the interview. Theprocess is expensive but it is worth it. This is because the users more often thannot, make time for the interview, as they too are interested in expressing theiropinions and learning more about the products and services they use at work. Theinterviewer should ensure that he reaches the venue on time. Often, the intervie-wees are busy at work and the interviewer might be required to wait for themeeting; at other times, the appointment might be postponed due to time con-straints. Since executive interviews are similar to door-to-door interviews, theyshare the same advantages and disadvantages as door-to-door interviews.
Mall Intercept SurveysMarketing practitioners and advertising researchers base vital business deci-
sions on available market research information. The concept of mall interviewing(a predominant type of personal interview in the United States today) has becomea popular way to collect survey data. The technique gained popularity in early1960s when big, enclosed shopping centres attracted a large number of peoplefrom various sections of society (something of an ideal sample for researchers).
Mall intercept interviews are often viewed as an inexpensive substitute fordoor-to-door interviews. Shopping mall intercept interviewing involves exactly
64 3 Business Research Design: Exploratory, Descriptive and Causal Designs
what the name implies—stopping or intercepting shoppers in a mall at random,qualifying them if necessary, asking whether they would be willing to participatein a research study and conducting the interview right on the spot or taking them tothe research agency’s interviewing facilities located in the mall. Prior to the mallintercept, surveys were conducted in other places having a high concentration ofpeople, such as supermarkets, discount stores, theatres and railway stations.
Since its inception, mall intercept surveys have come a long way. The presentperiod is witnessing huge developments and advancements in mall intercept surveyswith enterprising researchers opening permanent offices and test centres in malls.Today, some mall research facilities are equipped with complete food preparation/storage facilities for conducting taste tests, focus group facilities, video tapeequipment, etc. Since each mall has its own customer characteristics, the chances ofderiving biased information is more as compared to door-to-door sampling.
Mall intercept interviews are useful when the chances of demographic influ-ences are negligible or the target group is a special population. It comes in handyfor surveys that require coordination and timing such as cooking and tasting foodproducts and for products that need to be demonstrated. Purchase intercept tech-nique is a special case of mall intercept interviewing. This technique involves anin-store observation and in-store interviewing, where consumers are interceptedand interviewed while buying a specific product. The interviewer then probes intothe reasons for selecting the particular product. Mall intercept surveys score overother modes of survey interviews in the following respects: cost of research anddegree of control, time taken for execution and the quality of information col-lected. Mall intercept interviews have the following advantages:
• Depth of response is greater for mall intercept interviews than for any otherface-to-face interview.
• The interviewing environment is controlled by the researcher.• Interviewer can notice and react to the non-verbal indications of the interviewee.• Various types of equipment are available to analyse the responses.• The memories about the shopping experience are fresh, and hence, the situation
is conducive for studying purchase behaviour.
Although the advantages of mall intercept interviews are considerable, yet theiradoption without recognition of their shortcomings is not prudent. Some of thedrawbacks of mall intercept interviews are as follows:
• Getting personal information from respondents is not easy and involves manyproblems.
• Social desirability effect.• Interviewer bias.• Shoppers and respondents who are in a hurry might respond carelessly leading
to wrong information.• Samples drawn may not be representative of the population.• Lower completion rates of questionnaires.• Inapplicability of probability-based sampling techniques.
3.3 Part II: Descriptive Research Design 65
• The respondents might be in a hurry to leave the mall.
Disadvantages of Personal InterviewsAlthough personal interviews have a number of advantages, they are also
known to have some disadvantages such as high cost, lack of anonymity ofrespondent and necessity for callbacks. These points are discussed below.
Cost: As compared to mail, internet and telephonic surveys, personal interviewsare generally expensive. The costs are directly related to the number and thequality of the workforce employed; the reach of respondents; the length andcomplexity of questionnaires and also the extent of non-response due to non-availability and ignorance.
Lack of Anonymity of Respondents: A respondent in a personal interviewmay hesitate to provide the right information as his identity is known to theinterviewer. Questions like smoking habits during driving and extra marital affairsare sure to fetch falsified answers. Thus, the interview suffers from social desir-ability bias. To overcome this issue, interviewers spend a lot of time in framingquestions in the best possible way so as to be able to prompt the true responsesfrom the interviewees even for sensitive issues.
Necessity for Callbacks: We have already discussed that the characteristics ofthose who remain at home like (non-working women and retired people) are dif-ferent from those who go to work. Hence, it becomes necessary to recontact peoplewho were unavailable at the first call. This requires a systematic procedure andoften turns out more costly than interviewing the individual in the first call itself.
3.3.7 Telephonic Interviews
Telephonic interviews, once thought of as ‘quick and dirty’, providing less reliableor valid data, have finally come of age and are currently judged as one of the bestcost-effective alternatives to face-to-face interviews and mail surveys. The shift offocus to telephonic interviews of late has happened for several reasons, prominentamong which are:
• Plunging response rates in face-to-face interviews in certain urban areas.• Lower cost of telephonic interviews as interviewer travel time and mileage are
eliminated.• Introduction of random digit dialling as a remedy to previous problems (cited
below) of telephonic interviews and• Adoption of new technology in telephonic interviewing in the form of computer-
assisted telephone interviewing (CATI) and computer voice activated telephonicinterviewing.
The use of random digit dialling as a sampling procedure eradicated manyproblems associated with telephonic interviews. Instead of sampling from existingtelephone directories, it used sampling via a random number procedure. This
66 3 Business Research Design: Exploratory, Descriptive and Causal Designs
ensured that even those individuals in the sample who had shifted or changed theirtelephone numbers could be included. But the sampling frame for telephonicinterviews is not restricted only to directories. Researchers are also known to makeuse of student registers, hospital and clinic records, census tract information andemployee lists of corporations as sampling frames for telephonic interviews. Beforewe move on to discuss the various developments in telephonic interviewing, wetake a quick glance at the advantages and disadvantages of telephonic interviewing.
3.3.7.1 Advantages
• Speed in data collection.• Potential to produce a high-quality sample through improved techniques.• Increased co-operation and quality of data as individuals reluctant to respond to
face-to-face interviews feel more comfortable with telephonic interviews.• Ability to interview respondents in high-crime areas, which is a limitation for
face-to-face interviews.• Facilitation of collection of socially undesirable responses which is a drawback
in face-to-face interviews.• Making callbacks is easier.
3.3.7.2 Disadvantages
• The absence of face-to-face contacts which results in the inability of the inter-viewer to display products, concepts and advertisements, or to judge therespondent on demographic characteristics.
• Time length of interviews is less and it is easy for a reluctant respondent to hangup the phone rather than avoid someone in a face-to-face interview.
• Interviews on sensitive topics, although they may exceed the expected length oftime give rise to doubts regarding the quality of data.
• Greater tendency among respondents to give shorter answers generating ‘notascertained’ responses as compared to face-to-face interviews.
• Absence of face-to-face contact also results in the respondent continuing tospeak without realizing that the interviewer is still engaged noting the previousresponse.
• Uses of screening devices such as Caller ID and answering machines haveincreased the non-response rates for telephonic interviews, with respondentsmore willing to participate in a legitimate survey rather than entertaining callerswho wish to sell products.
• Samples are usually not representative when the interest group consists of thegeneral population, and directories are used as sampling frames.
3.3 Part II: Descriptive Research Design 67
Adoption of advanced techniques in telephonic interviews has helped inter-viewers to overcome many of the problems associated with this method. Theseadvanced techniques are discussed below.
3.3.7.3 Central Location Telephone Interviews
For central location telephone interviews, the interviewers make calls from acentrally located marketing research facility to reach and interview respondents.Wide-Area Telecommunications Service (WATS) lines are used for making thecalls. These lines facilitate unlimited long distance calls throughout the country orgeographical area at fixed rates. The superiority of CLTI can be attributed to onefactor, that is, control. The whole interviewing process can be monitored bysupervisors using special monitoring equipment. This means that interviewers whodo not conduct the interview properly can either be corrected or removed. Thisalso facilitates editing and checking interviews for quality on the spot. Inter-viewers can be appraised of any deficiencies in their work. Finally, since inter-viewers report in and out of the workplace, it helps to scrutinize and control theirwork hours.
3.3.7.4 Computer-Assisted Telephone Interviewing
The process in which the telephonic interview responses can be directly enteredinto the computer is known as computer-assisted telephone interviewing. Here, thetelephonic interviewer is seated at a computer terminal while interviewing qual-ified respondents. The questions are usually close-ended. The questions along withtheir possible response options appear on the computer screen (one at a time) infront of the interviewer. The interviewer reads out the questions and enters thecorresponding answers of the interviewee into the computer. Once the answer tothe question is entered, the computer automatically skips to the next question.Since the interview consists of close-ended questions with possible options foreach, the questionnaire needs to be highly structured.
The processing of the CATI has become much easier with the use of latesttechnology. This technology includes telephone management systems that takecare of everything, starting from selecting telephone numbers at random to diallingthem. Another call management feature is automatic callback scheduling wherethe computer is programmed to make the necessary recalls as per the desiredtimings. Thus, timings can be set to recall ‘busy numbers’ after 15 min and ‘no-contacts’ after 1 h. The computer can also be programmed to fill a certain quotaand to deliver daily status reports according to the quota. Even though this processcan be done in the traditional way using pencil and paper, there are manyadvantages attached to CATI. A separate step of editing is not required as data canbe edited with their subsequent data entry. Moreover, tabulations, which wouldrequire a week or more to compile in the traditional way, can be done at the click
68 3 Business Research Design: Exploratory, Descriptive and Causal Designs
of a button using CATI. This speed in tabulations also proves to be advantageousin indicating clearly whether certain questions need to be deleted or added to theexisting questionnaire to make it more specific.
3.3.7.5 Completely Automated Telephone Surveys (CATS)
This process that combines computerized telephone dialling and voice-activatedcomputer messages makes use of Interactive Voice Response (IVR) technology torecord the responses of the interviewees. The need for an interviewer is eliminatedsince CATS involves a voice-synthesized module controlled by a microprocessor.The questions are highly structured and close-ended with response options. Thefunctioning of the technique is explained as follows.
The computer uses the recorded voice of a professional interviewer to ask thequestions. Interviewees are required to answer by choosing from the optionsavailable and then pressing a number button on their telephone sets to mark theirchoice of options. The options selected are thus recorded by the computer. Thesystem is so designed that if a respondent does not answer the first couple ofquestions the computer moves on to dial the next respondent. The use of CATS ishandy for short, simple questionnaires. CATS technology is known to producequality data at good speed and is also considered to be much economical comparedwith other telephonic methods. Since the computer handles the entire interview,CATS shares the same advantages as CATI. The flexibility of the system extendsits usability to various research needs such as customer satisfaction surveys,monitoring service quality, in-home product testing and electoral polling.
The Direct Computer Interview is another related method. This is very similarin functioning to the other computer-assisted interviewing methods with the onlydifference being that the interviewee is intercepted in a mall, made to sit in front ofa terminal in the mall and given basic instructions as to the filling of the questions.Here, however, the interviewee enters the answers instead of the interviewer.
3.4 Self-Administered Interviews
An interview where the questionnaire is filled out by the respondent without theintervention of an interviewer is known as a self-administered interview.Respondents of such interviews are not assisted by interviewer or the computer.These self-administered interviews are mostly conducted in shopping malls,supermarkets, hotels, theatres and airlines as these locations provide captiveaudiences. Passengers and regular customers are given brief questionnaires toenquire about their views of the quality of service offered in an airline or hotel.The absence of the interviewer, however, results in a limitation, namely clarifi-cations on responses to open-ended questions cannot be obtained. A customermight just indicate his/her liking as a reason for buying a particular product/brand,
3.3 Part II: Descriptive Research Design 69
which is of no utility from a managerial perspective. The absence of the inter-viewer thus makes it difficult to trace the buying decision of the customer to any ofthe product/brand attributes. Even the quantity of information generated is limited.However, the absence of the interviewer proves to be a boon in disguise as iteliminates the possibility of interviewer bias.
The use of kiosks is another recent improvement in self-administered inter-views. Kiosks are multimedia, touch-screen computers contained in freestandingcabinets. The capacity of these pre-programmed computers to administer complexsurveys is enhanced by their ability to display full-colour scanned images, playstereo sound clips and show videos. These kiosks having been successfully testedat trade shows are now being tried in retail stores due to their numerous appli-cations. Kiosk interviewing is less expensive and is known to derive more honestresults than methods that involve an interviewer.
3.5 Mail Surveys
A survey where questionnaires are sent to qualified respondents by mail or e-mailis known as a mail survey. Two types of mail surveys are used in businessresearch. They are ad hoc mail surveys and mail panels. The only differencebetween the two is that there is no prior contact in the case of ad hoc mail surveys.A questionnaire is just sent to a sample selected from an appropriate source andresponses are awaited. The selected sample is used only for a single project.
The functioning of mail panel surveys is explained below.
• The process starts with obtaining mailing lists from various sources afterensuring that they have the current, complete address of potential participants. Itshould be ensured that the list of participants is closely related to the groupunder study.
• The next step involves contacting the sample participants through mail, post-cards, letters or telephone. The purpose of their participating in the panel surveyis explained to the participants. If the participants contacted agree to take part,they are required to fill in an initial questionnaire pertaining to their backgroundand demographic details, which may be used to determine whether the partic-ipant qualifies for inclusion in the survey.
• On successful selection, the panel participants are sent questionnaires from timeto time.
• Participants are thereafter contacted by various means to remind them to mailback the completed questionnaire.
An essential feature in mail panel surveys is that it is a type of longitudinalstudy where the same respondents are surveyed at different points of time to notespecific changes pertaining to the topic of research. The advantages are similar tothose of self-administered interviews. The method is cost-effective as the need torecruit, train, monitor and pay the interviewers is eliminated. The questionnaire
70 3 Business Research Design: Exploratory, Descriptive and Causal Designs
can be administered from a single location for better control. It is even possible tocontact respondents who are hard to reach. Respondents can spend as much time asthey like answering the questionnaires and can complete them at their conve-nience. Thus, the respondents tend to give more detailed responses. However, theabsence of a qualified interviewer gives rise to the same limitations in mail surveysas for self-administered interviews. Mail surveys are, however, characterized by ahigh rate of non-response. Typical ways to cope with non-response in mail surveysare outlined below.
• Monetary incentives• Stamped, self-addressed return envelope with a persuasive covering letter• Premiums such as pen, pencil and other small gifts• Promise of contributions towards charity• Entry into drawings for prizes• Emotional appeals• Reminder that the respondent participated in previous surveys.
3.5.1 Factors Determining the Choice of Survey Research
The choice of the survey method is influenced by a number of factors. An idealsurvey method should provide the researcher with the required data with thespecified quality at the lowest possible cost. The various factors that come intoplay in the choice of a survey method are outlined below.
3.5.1.1 Sampling Precision
The required level of sampling precision varies from research to research.Therefore, the researcher can select a research survey that suits the accuracy needsof the research. For example, if the researcher requires the results of the samplingsurvey to be very accurate he can select central location telephone interviewing.On the other hand, mail surveys can be used when there is not much emphasis onthe accuracy of the data. A central location telephone interviewing employing arandom digit dialling sampling procedure is more likely to deliver a better samplethan a mail survey. Hence, the trade-off between the costs and accuracy of asampling procedure that a researcher is willing to make plays a major role in theselection of the survey method.
3.5.1.2 Budget
The financial resources available to the researcher to conduct the research have adirect impact on the selection of survey method. A research project supported by
3.5 Mail Surveys 71
huge amounts of funds can include an appropriate survey method irrespective of itscosts. Thus, when a low budget is set apart for the survey, the researcher cannotemploy a costly survey method like door-to-door interviewing. In some cases,even if accuracy of the data is important, the researcher may have to settle for atelephonic interview rather than door-to-door or mail surveys to minimize the costof the research.
3.5.1.3 Quality of Data
The validity and reliability of the data required plays an important role in thechoice of survey methods. Validity refers to the research surveys ability to produceresults that are relevant to the researcher. Reliability refers to the consistency withwhich the results are produced under the same conditions with the same orcomparable populations. Quality of data in a survey is affected by factors likechoice of questionnaire design, sampling methods, scaling techniques and inter-viewer qualification and training. It is also affected by the inherent pros and consof the selected survey method.
For example, an exploratory research study involving an open-ended ques-tionnaire would rather prefer a door-to-door interview over a mall intercept sincepeople on a shopping spree would not be interested in answering open-endedquestions.
3.5.2 Need to Expose the Respondent to Various Stimuli
Surveys that need to expose the respondent to certain marketing stimuli likeproduct concepts, components and demonstrations have no better option other thanto choose a face-to-face survey method. For example, when a cola major wants totest its customers’ response to a new soft drink flavour it is planning to launch, ataste test is necessary and this requires the researcher to select a face-to-facesurvey method. Similarly, researches aimed at product testing, advertisingresearch, shopping behaviour, etc. require direct contact with the customer. Thus,the type of stimulus that is to be provided to the interviewee as part of theinterview decides the type of survey method required to conduct the interview.
3.5.3 Incidence Rate
The percentage of households or persons out of the total population that fit thequalifications of people to be interviewed in a particular study is known as theincidence rate. It might so happen that the incidence rate for a research study is verylow. Hence, the researcher cannot afford to employ expensive methods like door-to-
72 3 Business Research Design: Exploratory, Descriptive and Causal Designs
door interviewing where the cost of searching the respondents would exceed thecosts incurred for actual face-to-face interviewing. Hence, the choice here would bedefinitely a combination of survey methods that could provide desired results at areasonable cost. People might be screened using telephone or mail surveys, andlater, an interviewer can be sent to meet the selected respondent in person.
3.5.4 Accuracy of the Resultant Data
The accuracy of the data collected by the survey methods can also influence thechoice of survey method in a business research. It might be happened that thequestionnaire involves sensitive questions or the involvement of the interviewermight bring in some interviewer bias. Personal interviews may not be the rightchoice in these cases. Mail and self-administered survey methods would be moreappropriate. CATI or CATS might also be a choice option since the interviewerwould not be in direct face-to-face contact with the interviewee.
3.6 Errors in Survey Research
Technological advancements have led to remarkable improvements in surveytechniques and standards. A proper evaluation of the research methodologyemployed coupled with the standard techniques can give precise results. Butsurvey research can still result in errors in findings and their application. Thedifferent types of possible errors in a research study are shown in Fig. 8.2. The twomajor sources of survey error are
• Random sampling error• Systematic error.
3.6.1 Random Sampling Errors
Random sampling error is the error caused by a particular sample not beingrepresentative of the population of interest due to random variation. Sampling asan integral part of any survey process exposes a representative cross-section of thetarget population. Even though a representative sample is taken, there is always aminimal deviation between the true population value and the sample value. This isdue to statistical error as the sample selected is not perfectly representative of thetest population due to chance variation. Therefore, a small random sampling erroris evident. This error cannot be altogether avoided, but it can be brought underacceptable limits by increasing the sample size.
3.5 Mail Surveys 73
3.6.2 Systematic Errors
Errors that occur due to the nature of the research design and the precision ofexecution are known as systematic errors. The use of wrong techniques or wronglycalibrated instruments leads to systematic errors. When the results of a sampleshow consistent deviation, in a direction away from the true value of the popu-lation parameter, it is known as a sample error or bias. There are many sources ofsystematic errors, which can be classified under two broad categories, that is,administrative errors and respondent errors. The following section contains thediscussion of these errors.
3.6.3 Administrative Errors
An error caused by improper administration or execution of the research task isknown as administration error. These are caused due to sample design error or dueto other factors on the personal front such as carelessness, confusion, negligence,omission, etc. The different types of administrative error are given below:
• Sample Selection Error• Sample Frame Error• Population Specification Error• Data Processing Error• Interviewer Error.
3.6.3.1 Sample Selection Error
A systematic error that occurs because of an inaccuracy in either the stage ofsample design or the execution of the sampling procedure resulting in an unrep-resentative sample is known as sample selection error. It can even surface in casesinvolving a proper sample frame with the population correctly defined. Non-adherence to appropriate sampling procedures and use of incomplete or impropersampling procedures are the main reasons for errors in sample selection. Forexample, mall intercept interviewers may choose to interview only those cus-tomers who they think are neatly dressed or only families with children. As aresult, they might not take the opinions of other potential customers or respon-dents. A political leader during a election campaign in a potential area mightwrongly select telephone numbers at random and corresponding names for a door-to-door campaign, rather than ensuring that he pays a visit to all the registeredvoters in that area. In this case, the leader might miss out on several potential andeligible voters.
74 3 Business Research Design: Exploratory, Descriptive and Causal Designs
3.6.3.2 Sample Frame Error
The list of population elements or members from which units to be sampled areselected is known as the sampling frame. A sampling frame error is said to occurwhen this list of members does not correspond exactly with the target population.For example, if the target population is defined as ‘all the supermarkets inHyderabad’ and the sample frame does not list all the supermarkets, then it wouldresult in a frame error.
3.6.3.3 Population Specification Error
An error that results from an incorrect definition of the universe or population fromwhich the sample chosen is known as a population specification error. Forexample, a small electronic car manufacturer trying to estimate the marketpotential for its cars in Hyderabad might select only other small car users forinterviewing. This is a case of population specification error where the actualpopulation should have been all car users in Hyderabad. In this case, the mistake ismade, because of uncertainty as to whether only small car users will switch to thenew electric car segment. It might happen that with the rising price of petrol or dueto personal preferences, other classes of car users might also choose to buy the newelectronic car. If other classes of car users who are very different in terms of theirinterests are excluded then it will result in biased sample results.
3.6.3.4 Data Processing Error
An error that occurs because of incorrect data entry, incorrect computer pro-gramming or any other error during data analysis is called data processing error.Data entry into the computer is usually done manually. Hence, there are chances oferrors creeping in during the transfer of data from the document to the computer.Programming too is done manually. Hence, the accuracy of data processing by acomputer depends on the accuracy of data entry and programming. Data pro-cessing error can be minimized by a meticulous verification of each step in the dataentry and processing stage.
3.6.3.5 Interviewer Error
Interviewer error is an administrative error caused by mistakes committed by theinterviewer while administering the questionnaire or recording the responses. Thisis due to the interaction of the interviewer with the respondent. Different inter-viewers differ in their characteristics and abilities. The respondent might beinfluenced by the interviewer to give untrue or inaccurate data. It might alsohappen that an interviewer is unable to record the answers correctly as his/her
3.6 Errors in Survey Research 75
writing speed is not very good. Selective perceptions of the interviewer might alsoinfluence the way they interpret and record them. It is possible that the interviewermight record the view of a respondent in the way he understands (specific to hisattitudes and perceptions), leading to an error. Tone of voice and verbal cues fromthe interviewer can also influence telephone respondents. These errors are causeddue to improper selection and training of the interviewers. Interviewers should betrained to remain neutral throughout in order to collect answers that are devoid ofany influence by the interviewer. Cases of interviewer cheating have becomeanother major cause of survey errors. This is particularly prevalent in door-to-doorinterviews, where the interviewer in order to save time or avoid asking sensitivequestions, deliberately skips questions or fills in the answers to certain questions,resulting in wrong information. Some might even submit false reports of havingvisited the respondents. This can be checked by forewarning the interviewers that asmall number of respondents will be called upon to confirm the authenticity of theanswers and whether the interviewer visited them.
3.6.4 Respondent Error
Respondent error as the name suggests are those errors that are observed on therespondents’ side. A survey requires the respondents’ cooperation in givinganswers that contain the correct information. In practice, it is very difficult to getthe interviewees to cooperate with the interviewer or reveal their true opinions.Hence, the two common types of respondent errors that arise are non-responseerror and response bias.
3.6.4.1 Non-Response Error
It is very difficult for any survey to achieve a 100 % response rate. The statisticaldifference in results between a survey that includes only those who responded anda perfect survey that would also include those who failed to respond is known asnon-response error. A non-response occurs when a person is not at home both atthe time of preliminary call and the subsequent callback. This problem, rampant inmail and internet surveys, is also confronted in telephonic and door-to-doorinterviews. The number of ‘no contacts’ is on the rise with the increased usage ofcaller ID and answering machines. Refusals in telephonic, mail and face-to-faceinterviews are also prevalent and occur due to personal preference or due to therespondents being too busy with other important engagements. Fear is assumed tobe the main reason behind people refusing to participate in a survey.4 Concealingprivacy and sensitive issues are among other reasons for refusing to participate in a
4 See Ref. Sudman (1980).
76 3 Business Research Design: Exploratory, Descriptive and Causal Designs

survey. One way of measuring response bias is to compare the demographics of thesample with that of the target population. If a certain group of the population isunderrepresented, then additional efforts are put into gather data from the under-represented categories through personal interviewing rather than telephonicinterviewing.
The success of mail surveys is dependent on the extent to which the respondentis involved in the survey. This is referred to as self-selection bias. Thus, a customerwho has had good or bad experience with the service of any particular airlines ismore prone to fill up a self-administered questionnaire on board or at the airportcounter than a person who is indifferent about the airline’s service.
3.6.4.2 Response Bias
A survey error that results from the inclination of people to answer a questionfalsely, either through deliberate misrepresentation or unconscious falsification isknown as response bias. Thus, response bias can occur in two basic forms, that is,deliberate falsification and unconscious misrepresentation.
Deliberate Falsification: It might be difficult to reason out why peopleknowingly misrepresent or give false answers to questions when they are notcertain about facts. But there are many reasons why this happens. People mighttend to give false answers in order to appear intelligent or to conceal informationthey consider personal or embarrassing. Time pressure, social desirability bias,courtesy bias and uninformed response errors are among other reasons why arespondent would knowingly provide wrong information.
For example, a respondent might remember the number of times he visited asupermarket in the last 6 months, but he might not be able to exactly recollectwhich supermarkets he visited and how many times to each of them. Thus, ratherthan to say a clear cut ‘Don’t Remember’, the respondents might provide detailsbanking on their memory. Such responses are also prevalent in employee satis-faction surveys where the employees might conceal their true responses towardsthe efficiency of their unit or the supervisor. They put themselves in a safe situationthinking that revealing the truth might put them in a difficult situation. This type ofrespondent behaviour is the result of their urge to be perceived as person withopinions in close proximity to that of the average person.
Unconscious Misrepresentation: Unconscious misrepresentation is a situationwhere a respondent gives wrong or estimated information due to ignorance andforgetfulness even though he has no intention of doing it. Such situations can arisedue to question format, content, etc. It might happen that respondents misunder-stand a question and give a wrong or biased answer in the process. Prior inex-perience to a subject or activity is also a reason why unconsciousmisrepresentation on the part of the respondent occurs. Some respondents may alsoconsider it to be a prestige issue and try to answer every question thrown at them inthe best possible way rather than admitting that they do not know the answer to aquestion. A response bias may also pop up when a respondent is taken aback by an
3.6 Errors in Survey Research 77
unexpected question by the interviewer. Thus, we see that there might be mis-representation of answers consciously or unconsciously due to a number of factors.These factors are a by-product of different types of biases in the nature of therespondent such as:
Acquiescence Bias. It might arise from the respondent’s inclination to be of thesame/opposite mind as that of the interviewer and tend to say a ‘yes’ or a ‘no’respectively to everything that the interviewer says.
Extremity Bias. These are individuals who either use extremes to answerquestions, or who tend to remain neutral in all answers. But this depends onindividual characteristics and differs from person to person.
Interviewer Bias. This occurs due to the interaction between the interviewer andthe respondent, where the presence of the interviewer influences the respondent togive untrue or modified answers. The physical characteristics of the interviewerlike facial expressions, age, gender, tone, etc. also play a role in inducing inter-viewer bias into the survey.
Social Desirability Bias. Social desirability is the tendency for respondents togive answers that are socially desirable or acceptable, which may not be accurate.A social desirability bias may occur either consciously or unconsciously to gainprestige or build a socially acceptable image. Information about educationalqualification and salary might be overstated to gain prestige. Here, the respondenttries to create a favourable image or ‘save-face’ and prefers to give a sociallydesirable answer rather than the correct information.
3.7 Observation Methods
Unlike the methods discussed earlier, observation methods do not involve anyverbal communication with the respondents. Observation methods involverecording the behavioural patterns of respondents without communicating withthem. Some of the most popular observation methods used by researchers arediscussed below.
3.7.1 Direct Observation
Direct observation is a method where the observer tries to gain an insight into thebehaviour of a shopper in a tactful manner so as not to be noticed. This hasapplicability in studying merchandising effects in a supermarket and compliance totraffic rules by motorists. In tracking the behaviour of a shopper in a supermarket,the observer can either remain in a passive state as a silent observer (structured) ordisguise himself as another shopper and engage in a shopping spree in closeassociation with the subject (unstructured). In both the cases, the observer notesdown certain specific behaviours related to the subject. This makes it possible for
78 3 Business Research Design: Exploratory, Descriptive and Causal Designs
the observer to find the appealing factors in the buying behaviour and serviceproblems faced by the subject. This is a highly subjective task and requires theobserver to record certain noticeable behavioural features useful for the study. Itcan often be a rapid and economical way of obtaining basic socio-economicinformation on households or communities.
Be it structured or unstructured, it is imperative for the observer to ensure thathe is not identified; else it would lead to an alteration in the behaviour of thesubject and introduce subject bias. Various ways that facilitate in direct obser-vation are one-way mirrors and disguised and hidden cameras. However, whileusing one-way mirrors or hidden cameras, it should be ensured that there is noinvasion into the privacy of the subject. Direct observations make it possible toidentify the exact timing and length of continuation of an activity. There isinstantaneous recording of the observations, which eliminates the necessity ofhaving to recall later. This method is, however, prone to observer bias where theobserver may wrongly assign a specific demographic characteristic to the subject.
3.7.2 Contrived Observation
An observation in which the subject under study is unaware of being scrutinizedfor specific behaviour is known as a natural observation. The subjects under studyhave little knowledge that they are being observed for specific behavioural aspectsand demographic characteristics. This method uses more of a disguised observerwho inconspicuously records the specific behaviour he has to scrutinize. Thismethod of natural observation has little relevance for researchers who desire toanalyse special behaviour, which may be rare among individuals operating innatural circumstances.
Here, in the concept of contrived observation, the subjects in this case havesome advanced knowledge of being participants in the observation study.Although the subjects are aware of their involvement in the study, they still haveno idea as to which aspects of theirs are being scrutinized and observed. However,it may be advantageous, the artificial setting and the awareness of the subject thathe is being observed can bring in respondent bias.
A corollary concept to contrived observation is mystery shopping. Here, themain motive of the observer is to analyse the behavioural aspects of participantsprimarily, in the service sectors. The following are some situations, where thisconcept is used.
Pizza Hut claims to deliver orders for home-delivery within 30 min. Thecompany may authorize any person to pose as a customer and place an order toobserve the timeliness in the delivery process. Similar procedures can be applied toanalyse the quality of service offered in hotels and banks.
An observer may desire to analyse the variety of responses that can be availableto a set of questions. For example, an observer pretending to be an airline
3.7 Observation Methods 79
passenger throws unnatural questions at an executive at the enquiry counter tonotice and analyse the set of responses he gets in return.
3.7.3 Content Analysis
Written materials like advertising copies and news articles, and TV and radioprogrammes have many implicit and explicit meanings. Therefore, their contenthas to be thoroughly analysed for any mismatch or misrepresentation in com-munications. This is where the technique of content analysis comes into play.These written materials need to be analysed, based on words used, themes,characters and space, to enable the smooth flow of the intended communicationalaspects. This helps the management to introduce the required changes in thecommunication process, as may be deemed necessary to generate a better responserate.
3.7.4 Physical Trace Measures
Physical trace measures refer to exposure to advertisements, computer cookierecords, records of credit card usage and dirt on the floor to determine store trafficpatterns. In other words, it is the process of looking systematically into theimmediate surroundings for any evidence of human interaction with one another orthe environment. This method usually helps in unravelling the space usage patternsof people. Two types of traces are observed and measured. They are:
• Erosion traces are shown by deterioration or wear and tear that provides a lookat the usage pattern. This refers to the traces of selective wear and tear of certainparts or things in a space that shows evidence of being used.
• Accretion traces are a build-up of a residue or an interaction. Traces of lumps ofdirt in close proximity reveal the piling up of shoes. Similarly, a number ofglasses together reveal their use for drinking purposes.
3.7.5 Participant Observation
A process in which a researcher establishes a many-sided and long-term rela-tionship with individuals and groups in their natural setting, for the purposes ofdeveloping a scientific understanding of those individuals and groups is known asparticipant observation. At the first look, it may seem as a process concerned withlooking, listening, experiencing and recording the same. However, in reality, it ismore demanding and analytically difficult. This method of observation requires theresearcher to be involved in the day-to-day activities of the subjects or the social
80 3 Business Research Design: Exploratory, Descriptive and Causal Designs
settings that are under investigation. This involvement can be categorized intothree types depending upon the degree of involvement of the researcher. These areas follows:
Complete participant: The researcher immerses himself fully in the activitiesof the group or organization under investigation. It supposedly produces accurateinformation, as the intensions of the researcher are not disclosed to the subjects orsocial settings under investigation and is least likely to guide researchers toenforce their own reality on the social world they seek to understand.
Participant as observer: The researcher in this case keeps the group informedabout his intensions, but does not actively involve himself in the social settings.
Complete observer: The researcher is uninvolved and detached, and merely,passively records behaviour from a distance.
The presence of the researcher can cause some initial sparks of discomfort.Language and cultural dissimilarities can pose barriers in this method. Thisrequires the researcher to negotiate access into the social settings after a thoroughstudy of the power relations within the setting, the relations of people to theirphysical environment, as they perceive it, and the social openings and barriers. Thecompatibility of observation and interviewing in this method makes it highlyflexible. Apprehensions about observations pave the road to questions that are laterclarified during interviews to understand the significance of the observations. Theinterview in this case is highly unstructured.
3.7.6 Behaviour Recording Devices
Human observation is prone to deficiencies or errors. To overcome such errors,machine observers in the form of behaviour-recording devices are used. This sortof mechanical observation include
• On-site cameras in stores and at home for eye-tracking analysis while subjectsare shopping or watching advertisements using coulometer to identify what thesubject is looking at and pupil meters to measure how interested the viewer is.
• Electronic checkout scanners that record the UPC on the products as those usedby A.C. Nielsen and INTAGE. These are used to record purchase behaviour ofthe subjects under investigation or in general (refer this chapter on ‘Secondaryand Syndicated Data’).
• Nielsen People Meter for tracking television station watching (refer this chapteron ‘Secondary and Syndicated Data’).
• Voice pitch meters that serve to measure emotional reactions.• Psycho galvanometer that measures galvanic skin response.
It may be easier for these machines to record the behaviour of the subjects, butmeasuring the precise level of arousal and reaction through them is questionable.Therefore, calibration and sensitivity is a limitation with the mechanical devices.
3.7 Observation Methods 81
3.8 Part III: Causal Research Design
3.8.1 Causal Research Design: Experimentation
The basic aim of causal studies is to identify the cause and effect relationshipbetween variables. For instance, studying the effect of price, advertising andmarketing on sales comprise causal studies. It is therefore essential for researchersto have a thorough knowledge of the subject area of research. The basic premise ofthe causal relationship is that when we do a particular thing (cause), it gives rise toanother thing (effect). It is highly impossible to prove a causal relationship sci-entifically. Researchers develop evidence to understand causal relationships. Forinstance, if researchers want to establish a relationship that good nutrition (cause)leads to intelligence (effect) among children, they should then be able to prove thatgood nutrition precedes intelligence.
3.8.2 Causal Relationships
The causal analysis is the process of determining how one variable influences thechange in another variable. As far as business research is concerned, the cause andeffect relationship is less explicit. Three types of possible relationships can arisebetween two variables—symmetrical, reciprocal and asymmetrical.
3.8.2.1 Symmetrical
A symmetrical variable is one in which two variables fluctuate together. However,it is assumed that the changes in either variable are not due to changes in the other.Symmetrical conditions usually occur when the two variables become alternateindicators of another cause or independent variable. For instance, the low atten-dance of youth in martial art clubs and active participation in discotheques andparties is the result of (dependent on) another factor such as lifestyle preferences.
3.8.2.2 Reciprocal
When two variables mutually influence or reinforce each other, we can say thatthere is an existence of a reciprocal relationship. For instance, a reciprocal rela-tionship exists when a person goes through a particular advertisement, which leadshim to buy that brand of product. Later, after usage, it consequently sensitizes theperson to notice and read the successive advertisements of that particular brand orcompany.
82 3 Business Research Design: Exploratory, Descriptive and Causal Designs
3.8.2.3 Asymmetrical
Asymmetrical relationship exists, when changes in one variable (independentvariable) are responsible for changes in another variable (dependent variable).There are four types of asymmetrical relationships,
(1) Stimulus response relationship. It represents an event that results in responsefrom some object. For example, an increase in product price may lead to fewersales.
(2) Property–disposition relationship. A property is the enduring nature of asubject, which does not depend on circumstances for its activation. A dispo-sition is an inclination to respond in a certain way under certain circumstances.For instance, family status, age, gender, religion and so on can be consideredpersonal properties. Attitudes, opinions, values, etc. are part of disposition. Forproperty–disposition, examples include the effect of age on attitude withregard to savings, gender and its impact on attitude towards social issues, etc.
(3) Disposition–behaviour relationship. Consumption patterns, work perfor-mance, interpersonal acts, etc. are part of behaviour responses. Examplesinclude a person’s perception about a brand and its purchase, job satisfactionand productivity, etc.
(4) Property–behaviour relationship. The family life cycle and purchase of goods,social class and family saving patterns, etc. are some examples.
3.8.3 Experimental Designs
An experiment refers to the process of manipulating one or more variables andmeasuring their effect on other variables, while controlling external variables. Thevariable, which is manipulated, is called the independent variable and the variablewhose behaviour is to be measured after experimentation is called the dependentvariable. For instance, if a company wants to test the impact of advertising onproduct sales, researcher conducts the experiment by manipulating the advertisingfrequency to study its impact on product sales in a particular region. Here, thevariable, which is being manipulated, is advertising, and therefore, it is theindependent variable. The impact of change in advertising frequency on productsales is measured and analysed. Thus, a product sale is the dependent variable.
The aim of experimentation is to establish and measure the causal relationshipbetween the variables studied. A well-executed experiment can depict the causalrelationship between variables by controlling extraneous variables.
In this chapter, we will discuss the experimentation process. First, we will studyvarious aspects to be considered by the researcher while conducting an experi-ment. Then, we will look at experimental validity and the threats to it. Later, wewill move to experimental environments and the pros and cons of laboratory and
3.8 Part III: Causal Research Design 83
field experiments. Finally, the chapter ends with a brief note on different types ofexperimental designs that are widely used by researchers.
3.9 Issues in Experimentation
To make an experiment successful, a researcher has to take decisions regardingvarious aspects. There are four key issues a researcher has to consider whileconducting an experiment. They are the following:
• Treatment of independent variable• Experimental groups and control groups• Selection and measurement of the dependent variable• Control of extraneous variables.
Let us now discuss them in detail.
3.9.1 Treatment of Independent Variable
An independent variable is a variable over which the researcher is able to exertsome control for studying its effect upon a dependent variable. Experimentaltreatment refers to the manipulation of the independent variable. For example,consider a company planning to test a change in package design in terms of itsimpact on product sales. To test the relationship between package design and sales,it has decided to expose customers to packs of three different designs, A, B and C.These packs are placed on the shelves of select outlets. The consumer’s response ismeasured. Here, package design is the independent variable, which is manipulated,and there are three treatment levels (A, B and C) of the variable.
3.9.2 Experimental Groups and Control Groups
In a simple experiment, a researcher uses two groups—the experimental group andthe control group. The control group is a group of test units that are not exposed tothe change in the independent variable. The experimental group, on the other hand,is exposed to a change in the independent variable. In the package design examplediscussed above, a group of supermarkets (experimental group) are selected andeach package design is displayed for a month. Another group of supermarkets(control group) continue to carry the regular package design for that particularperiod. Then, the sales of the product are measured in each case, and the differencebetween the measurement (sales) in the experimental group and the control groupis analysed to determine whether the design change has affected sales.
84 3 Business Research Design: Exploratory, Descriptive and Causal Designs
3.9.3 Selection and Measurement of the Dependent Variable
Selection of the dependent variable and its measurement is another importantdecision the researcher has to take. The dependent or response variable is thevariable whose behaviour is to be measured as a result of an experiment.Dependent variable is the variable that may change due to the manipulation ofindependent variable.
By using the same example of package designs, the sales volume of the productis considered as the dependent variable. Selecting a dependent variable may not beeasy in all cases. For example, if a company wants to do research to evaluate theeffectiveness of various advertising programmes, the dependent variables can bebrand-image, brand awareness and product sales. The researcher has to select thedependent variable depending on the purpose for which the experiment is beingconducted. Proper problem definition will help the researcher select the appro-priate dependent variables.
3.9.4 Control of Extraneous Variables
Other extraneous variables, which influence the dependent variable, have to becontrolled to determine the real effect of manipulation in the independent variableon the dependent variable. The presence of these variables in the experiment willput the researcher in dilemma as to whether the change in dependent variable isdue to the change in the independent variable or due to extraneous variables. Thisis why extraneous variables are also called confounding variables. Researchers usevarious methods to control extraneous variables. They are randomization, physicalcontrol, matching, design control and statistical control.
Randomization is the most popular method to control extraneous variables.Randomization refers to the process of assigning test units randomly to experi-mental treatments and assigning experimental treatments randomly to test units.This process helps researchers to spread the effects of extraneous variables equallyover the test units.
Another approach is to physically control the extraneous variables. This isachieved by keeping the level of extraneous variables constant throughout theexperiment.
Another variant of the physical control approach is matching. In this method,the researcher adopts judgmental sampling to assign test units to both the exper-imental group and the control group. This ensures that both the groups (experi-mental and control groups) are matched in terms of characteristics of test units.
Design control is another approach to control extraneous variables. Selectingappropriate experimental designs to conduct the experiment helps researchers tocontrol particular extraneous variables that affect the dependent variable.
Statistical control can also be used to control the effect of extraneous variables.Here, extraneous variables that are affecting the dependent variable are identified
3.9 Issues in Experimentation 85
and measured using appropriate statistical tools like analysis of variance. Then, theeffects of extraneous variables on the dependent variable are adjusted statistically,cancelling out the effects of extraneous variables.
Exhibit 3.2 shows the required characteristics that a good experiment shouldhave.
3.10 Experimental Validity
Validity is the extent to which a research process is accurate and reflects actualmarket conditions (i.e. it is free from systematic error). There are two types ofvalidity that are considered in experimentation—internal validity and externalvalidity. Internal validity measures to what extent the change in a dependentvariable can be explained by the independent variable. External validity measuresto what extent the inferences derived from experiments can be generalized to thereal environment.
Adapted from ASQ Statistics Division Newsletter (2000)
3.10.1 Internal Validity
Internal validity refers to ‘the approximate validity with which we infer that arelationship between two variables is causal or that the absence of a relationshipimplies the absence of cause’.5
Exhibit 3.2: Prerequisites for Conducting ExperimentsThere are certain characteristics that a good experiment should possess.
• The experiment’s objectives need to be well defined. This means that problemdefinition, the independent variable(s) and their treatment levels, dependentvariable, the experimental design and process should be clearly defined.
• The effect of independent variables should not be influenced by extraneousvariables. The experiment needs to be designed in such a way that theinfluence of extraneous variables is minimized.
• The experiment should provide a measure of precision (experimental error),unless it is known from previous experimentation. Replications provide themeasure of precision while randomization assures the validity of the measureof precision.
• The expected precision of the experiment should be sufficient to meet definedobjectives. There generally is a trade-off between the expense of additionalexperimentation and the
5 See Ref. Cook and Campbell (1979).
86 3 Business Research Design: Exploratory, Descriptive and Causal Designs
In other words, internal validity indicates to what extent the change independent variable in an experiment is caused by the manipulation of independentvariable or due to extraneous variables. If extraneous variables have an influenceon the dependent variable, then establishing the causal relationship between thedependent and independent variable becomes difficult. Any findings or conclusionsdrawn from experimentation in the absence of internal validity will be superficialand deceptive. Hence, while developing experimental research designs,researchers should take adequate care to include the influence of extraneousvariables to improve the experiment’s internal validity. Let us now examine sixmajor types of extraneous variables that are sources of threat to internal validity.They are the following:
• History• Maturation• Testing• Instrumentation• Selection bias• Statistical regression• Mortality.
3.10.1.1 History
History here means something different from the general sense. History here refersto a specific event in the external environment that is historic (rare occurrence) innature and occurs at the same time an experiment is being conducted. Such eventsmay impact the dependent variables. Consider a situation where a companyconducts an analysis to market new farm equipment in a south Indian state. If themajor agricultural belt in that state is affected by flash floods, the results of the testwill be influenced by this historic event. Similarly, an experiment aimed atassessing the impact of a new promotional campaign for a car may be influencedby the steep spurt in petrol prices due to a historic event like the Iraq war. Anoccurrence of an event, which is beyond the control of the researchers, will havean impact on the dependent variable (sales in this case).
3.10.1.2 Maturation
The maturation effect refers to the change in the test units, not due to the influenceof independent variable but due to the passage of time. During the course of theexperiment, people may become older, hungrier or tired. For example, if a phar-maceutical company is conducting drug trials on a sample of patients over a longerperiod of time, there may be some difference in the effect of the drug on patientsdue to physiological changes in them. This impacts the experiment’s internalvalidity.
3.10 Experimental Validity 87
3.10.1.3 Testing
Another extraneous variable that affects experimental results is the testing effect.This refers to the subjects becoming alert when they are exposed to experimen-tation. For example, when employees are made to answer a questionnaire that teststheir knowledge and skills before attending a training programme, they are alertedthat they are being studied. This prompts them to pay more attention to the trainingmodules. Thus, they obtain better scores in the test conducted after the trainingprogramme. Thus, there will be change in experimental results between the firsttest and the second test.
3.10.1.4 Instrumentation
A researcher can vary the measuring instrument used for pre-testing and post-testing to minimize the test effect. However, this may lead to the introduction of anew effect called the instrumentation effect. This refers to the effect on experi-mental results due to change in the measurement instrument, measurement valuesor the researcher’s process of recording measurements during the course of theexperiment.
For example, a researcher has to record observations from morning till evening.During the morning hours, the researcher will record observations enthusiasticallyand the measurements will be accurate. In the evening, due to fatigue, he or shemay not show the same interest in recording the observations. Such an instru-mentation effect will impact experimental results.
3.10.1.5 Selection Bias
Selection bias refers to improper assignment of respondents to treatment conditions.Selection bias occurs in two ways. One is the wrong selection of test units inexperimental group. As a result, it does not represent the population from which thetest units are drawn. Another is that test units assigned to experimental groups differfrom test units assigned for the control group. The difference will result in selectionbias. For example, a company may have included more heavy users of the productin the experimental group and moderate and light users in the control group. Theoutcome of the experiment may be favourable to the company as a result.
3.10.1.6 Statistical Regression
Statistical regression refers to the phenomenon where extreme values of thesample tend to converge near the mean value of the sample during the course ofthe experiment. This can be either positive extreme values or negative extreme
88 3 Business Research Design: Exploratory, Descriptive and Causal Designs
values. Consider an experiment aimed at ascertaining consumer perception on thecustomer service levels of a financial institution. In a pre-test measurement, someconsumers may rate the customer service as highly exceptional, and some may rateit as very poor. However, in a post-treatment (a pilot launch of a new customerservice initiative) measurement, these extreme scores tend to get closer to themean of the sample. This is known as the statistical regression effect. This can beattributed to a continuous change in consumer attitudes. Thus, subjects who dis-play extreme attitudes may change their perception during the course of theexperiment. This will affect experimental results as the change in scores is due tostatistical regression and not due to the treatment (a pilot launch of a new customerservice initiative)
3.10.1.7 Mortality
Mortality effect refers to the loss of subjects or test units in experiments, thusaffecting experimental results. Suppose an educational researcher is conductingan experiment on the impact of television viewing on IQ scores on 100 stu-dents. In the course of the experiment, 15 students have dropped out from theexperiment. Such a reduction in subjects or test units may impact experimentalresults.
3.10.2 External Validity
External validity refers to the ‘the approximate validity with which we can inferthat the presumed causal relationship can be generalized to and across alternatemeasures of the cause and effect and across different types of persons, settings andtimes’.6 External validity examines to what extent the experimental findings can begeneralized to the population from which test units are drawn. We can infer fromthe definition that experiments that are conducted in natural settings offer a greaterexternal validity compared with those conducted in controlled environment. So afield experiment provides greater external validity compared with a laboratoryexperiment.
Experiments are conducted either in a laboratory environment or a field envi-ronment. The former means the experiment is conducted under artificial condi-tions. Field environment refers to conducting an experiment in real conditions.Both these environments have their advantages and disadvantages. The researcherhas to analyse which environment will suit his requirements.
6 See Ref. Cook and Campbell (1979).
3.10 Experimental Validity 89
3.10.2.1 Laboratory Environment
Laboratory experiments refer to experiments conducted in controlled conditions.Examples include showing advertisements or products to select consumers incontrolled conditions and blind taste tests.
Conducting experiments in laboratory settings have many advantages over fieldexperiments. The primary advantage is that the conditions can be controlled.Thereby, the effect of extraneous variables on dependent variables can be mini-mized. A controlled environment is also effective in eliminating the history effect.
The isolation achieved in laboratory settings will also help researchers achievesimilar results, if the experiments are repeated number of times with the same testunits in similar conditions. Laboratory experiments, therefore, provide moreinternal validity.
As the test units and resources required for laboratory experiments are less, italso helps researchers conduct the experiment in shorter time and cost effectively.This is why companies conduct laboratory experiments during the initial stages ofproduct development, as costs and risks associated with experiments can beminimized. Apart from cost-effectiveness, laboratory experiments also help acompany to lessen the risk of information about products or ideas being passed onto competitors. The risk is more in field experiments.
However, there are some drawbacks in laboratory experiments. One is thatlaboratory experiments are conducted in artificial conditions, and the results maynot hold up well in actual conditions (in the market). So these experiments provideless external validity.
Also, the results of laboratory experiments are influenced by the testing effect,where the test units are aware that they are being tested, and so may not respondnaturally.
3.10.2.2 Field Environment
Field experiments refer to experiments conducted in natural settings. Theseinclude launching products in select regions, observing consumer behaviourregarding a POP display in supermarkets and analysing customer response to trialoffers. As field experiments are conducted in natural settings, they have a highdegree of external validity. The disadvantages in field experiments are that as theresearcher has no control over external variables, these experiments will have alow degree of internal validity. Field experiments also require greater time andeffort and are expensive.
90 3 Business Research Design: Exploratory, Descriptive and Causal Designs
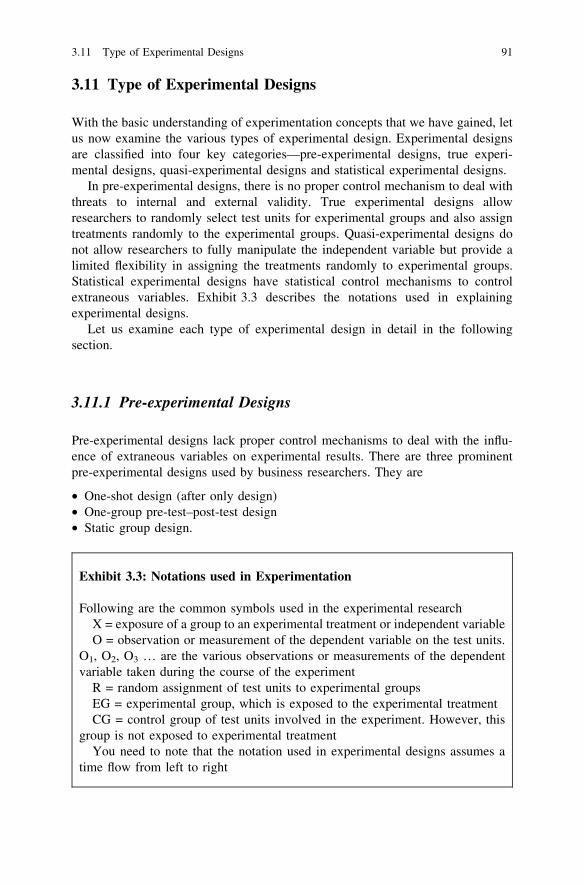
3.11 Type of Experimental Designs
With the basic understanding of experimentation concepts that we have gained, letus now examine the various types of experimental design. Experimental designsare classified into four key categories—pre-experimental designs, true experi-mental designs, quasi-experimental designs and statistical experimental designs.
In pre-experimental designs, there is no proper control mechanism to deal withthreats to internal and external validity. True experimental designs allowresearchers to randomly select test units for experimental groups and also assigntreatments randomly to the experimental groups. Quasi-experimental designs donot allow researchers to fully manipulate the independent variable but provide alimited flexibility in assigning the treatments randomly to experimental groups.Statistical experimental designs have statistical control mechanisms to controlextraneous variables. Exhibit 3.3 describes the notations used in explainingexperimental designs.
Let us examine each type of experimental design in detail in the followingsection.
3.11.1 Pre-experimental Designs
Pre-experimental designs lack proper control mechanisms to deal with the influ-ence of extraneous variables on experimental results. There are three prominentpre-experimental designs used by business researchers. They are
• One-shot design (after only design)• One-group pre-test–post-test design• Static group design.
Exhibit 3.3: Notations used in Experimentation
Following are the common symbols used in the experimental researchX = exposure of a group to an experimental treatment or independent variableO = observation or measurement of the dependent variable on the test units.
O1, O2, O3 … are the various observations or measurements of the dependentvariable taken during the course of the experiment
R = random assignment of test units to experimental groupsEG = experimental group, which is exposed to the experimental treatmentCG = control group of test units involved in the experiment. However, this
group is not exposed to experimental treatmentYou need to note that the notation used in experimental designs assumes a
time flow from left to right
3.11 Type of Experimental Designs 91
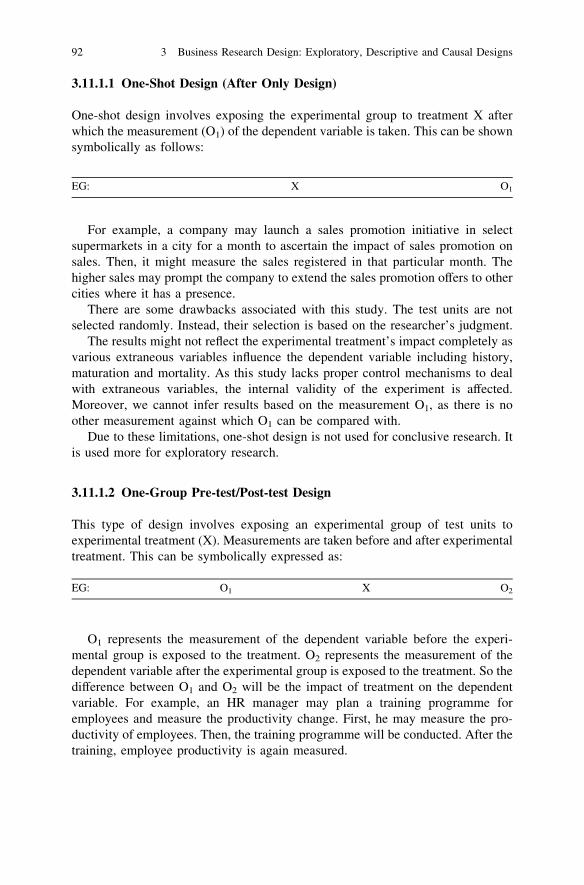
3.11.1.1 One-Shot Design (After Only Design)
One-shot design involves exposing the experimental group to treatment X afterwhich the measurement (O1) of the dependent variable is taken. This can be shownsymbolically as follows:
EG: X O1
For example, a company may launch a sales promotion initiative in selectsupermarkets in a city for a month to ascertain the impact of sales promotion onsales. Then, it might measure the sales registered in that particular month. Thehigher sales may prompt the company to extend the sales promotion offers to othercities where it has a presence.
There are some drawbacks associated with this study. The test units are notselected randomly. Instead, their selection is based on the researcher’s judgment.
The results might not reflect the experimental treatment’s impact completely asvarious extraneous variables influence the dependent variable including history,maturation and mortality. As this study lacks proper control mechanisms to dealwith extraneous variables, the internal validity of the experiment is affected.Moreover, we cannot infer results based on the measurement O1, as there is noother measurement against which O1 can be compared with.
Due to these limitations, one-shot design is not used for conclusive research. Itis used more for exploratory research.
3.11.1.2 One-Group Pre-test/Post-test Design
This type of design involves exposing an experimental group of test units toexperimental treatment (X). Measurements are taken before and after experimentaltreatment. This can be symbolically expressed as:
EG: O1 X O2
O1 represents the measurement of the dependent variable before the experi-mental group is exposed to the treatment. O2 represents the measurement of thedependent variable after the experimental group is exposed to the treatment. So thedifference between O1 and O2 will be the impact of treatment on the dependentvariable. For example, an HR manager may plan a training programme foremployees and measure the productivity change. First, he may measure the pro-ductivity of employees. Then, the training programme will be conducted. After thetraining, employee productivity is again measured.
92 3 Business Research Design: Exploratory, Descriptive and Causal Designs
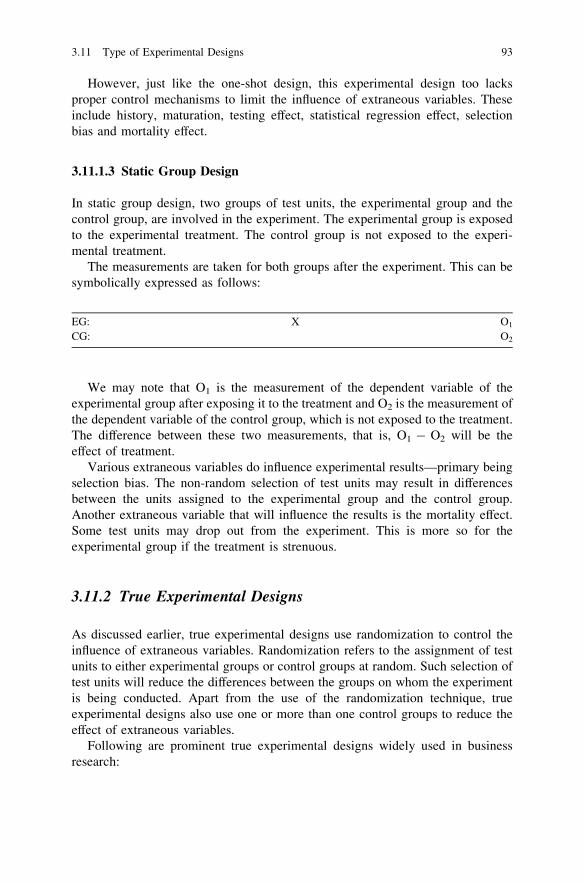
However, just like the one-shot design, this experimental design too lacksproper control mechanisms to limit the influence of extraneous variables. Theseinclude history, maturation, testing effect, statistical regression effect, selectionbias and mortality effect.
3.11.1.3 Static Group Design
In static group design, two groups of test units, the experimental group and thecontrol group, are involved in the experiment. The experimental group is exposedto the experimental treatment. The control group is not exposed to the experi-mental treatment.
The measurements are taken for both groups after the experiment. This can besymbolically expressed as follows:
EG: X O1
CG: O2
We may note that O1 is the measurement of the dependent variable of theexperimental group after exposing it to the treatment and O2 is the measurement ofthe dependent variable of the control group, which is not exposed to the treatment.The difference between these two measurements, that is, O1 - O2 will be theeffect of treatment.
Various extraneous variables do influence experimental results—primary beingselection bias. The non-random selection of test units may result in differencesbetween the units assigned to the experimental group and the control group.Another extraneous variable that will influence the results is the mortality effect.Some test units may drop out from the experiment. This is more so for theexperimental group if the treatment is strenuous.
3.11.2 True Experimental Designs
As discussed earlier, true experimental designs use randomization to control theinfluence of extraneous variables. Randomization refers to the assignment of testunits to either experimental groups or control groups at random. Such selection oftest units will reduce the differences between the groups on whom the experimentis being conducted. Apart from the use of the randomization technique, trueexperimental designs also use one or more than one control groups to reduce theeffect of extraneous variables.
Following are prominent true experimental designs widely used in businessresearch:
3.11 Type of Experimental Designs 93
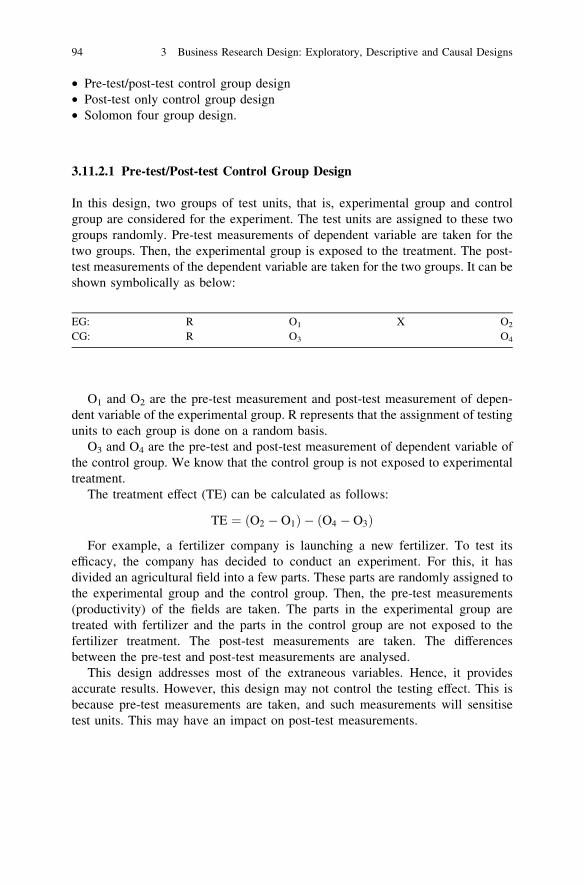
• Pre-test/post-test control group design• Post-test only control group design• Solomon four group design.
3.11.2.1 Pre-test/Post-test Control Group Design
In this design, two groups of test units, that is, experimental group and controlgroup are considered for the experiment. The test units are assigned to these twogroups randomly. Pre-test measurements of dependent variable are taken for thetwo groups. Then, the experimental group is exposed to the treatment. The post-test measurements of the dependent variable are taken for the two groups. It can beshown symbolically as below:
EG: R O1 X O2
CG: R O3 O4
O1 and O2 are the pre-test measurement and post-test measurement of depen-dent variable of the experimental group. R represents that the assignment of testingunits to each group is done on a random basis.
O3 and O4 are the pre-test and post-test measurement of dependent variable ofthe control group. We know that the control group is not exposed to experimentaltreatment.
The treatment effect (TE) can be calculated as follows:
TE ¼ O2 � O1ð Þ � O4 � O3ð Þ
For example, a fertilizer company is launching a new fertilizer. To test itsefficacy, the company has decided to conduct an experiment. For this, it hasdivided an agricultural field into a few parts. These parts are randomly assigned tothe experimental group and the control group. Then, the pre-test measurements(productivity) of the fields are taken. The parts in the experimental group aretreated with fertilizer and the parts in the control group are not exposed to thefertilizer treatment. The post-test measurements are taken. The differencesbetween the pre-test and post-test measurements are analysed.
This design addresses most of the extraneous variables. Hence, it providesaccurate results. However, this design may not control the testing effect. This isbecause pre-test measurements are taken, and such measurements will sensitisetest units. This may have an impact on post-test measurements.
94 3 Business Research Design: Exploratory, Descriptive and Causal Designs
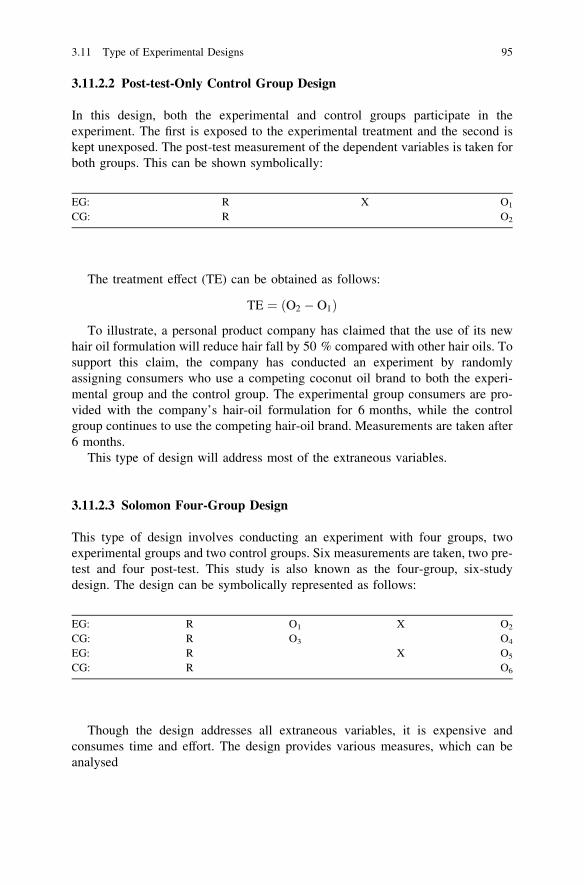
3.11.2.2 Post-test-Only Control Group Design
In this design, both the experimental and control groups participate in theexperiment. The first is exposed to the experimental treatment and the second iskept unexposed. The post-test measurement of the dependent variables is taken forboth groups. This can be shown symbolically:
EG: R X O1
CG: R O2
The treatment effect (TE) can be obtained as follows:
TE ¼ O2 � O1ð Þ
To illustrate, a personal product company has claimed that the use of its newhair oil formulation will reduce hair fall by 50 % compared with other hair oils. Tosupport this claim, the company has conducted an experiment by randomlyassigning consumers who use a competing coconut oil brand to both the experi-mental group and the control group. The experimental group consumers are pro-vided with the company’s hair-oil formulation for 6 months, while the controlgroup continues to use the competing hair-oil brand. Measurements are taken after6 months.
This type of design will address most of the extraneous variables.
3.11.2.3 Solomon Four-Group Design
This type of design involves conducting an experiment with four groups, twoexperimental groups and two control groups. Six measurements are taken, two pre-test and four post-test. This study is also known as the four-group, six-studydesign. The design can be symbolically represented as follows:
EG: R O1 X O2
CG: R O3 O4
EG: R X O5
CG: R O6
Though the design addresses all extraneous variables, it is expensive andconsumes time and effort. The design provides various measures, which can beanalysed
3.11 Type of Experimental Designs 95
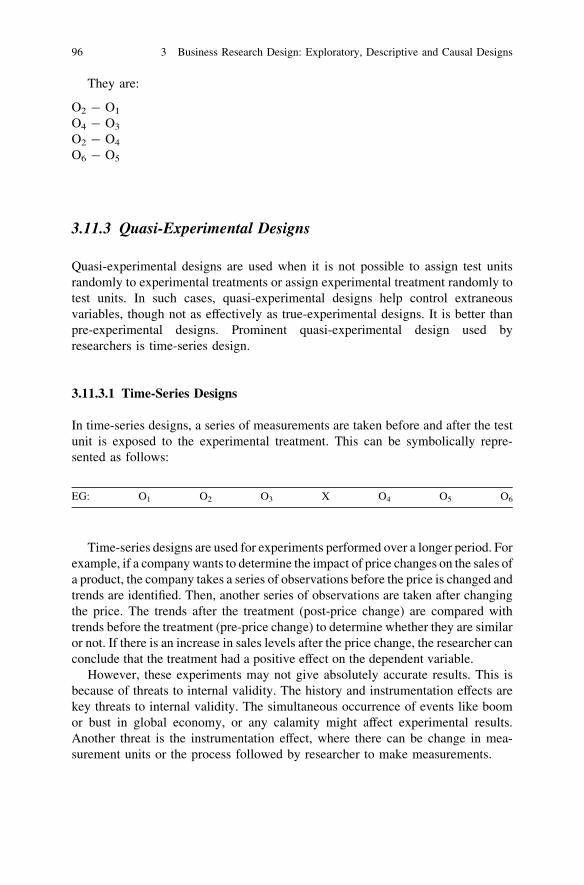
They are:
O2 - O1
O4 - O3
O2 - O4
O6 - O5
3.11.3 Quasi-Experimental Designs
Quasi-experimental designs are used when it is not possible to assign test unitsrandomly to experimental treatments or assign experimental treatment randomly totest units. In such cases, quasi-experimental designs help control extraneousvariables, though not as effectively as true-experimental designs. It is better thanpre-experimental designs. Prominent quasi-experimental design used byresearchers is time-series design.
3.11.3.1 Time-Series Designs
In time-series designs, a series of measurements are taken before and after the testunit is exposed to the experimental treatment. This can be symbolically repre-sented as follows:
EG: O1 O2 O3 X O4 O5 O6
Time-series designs are used for experiments performed over a longer period. Forexample, if a company wants to determine the impact of price changes on the sales ofa product, the company takes a series of observations before the price is changed andtrends are identified. Then, another series of observations are taken after changingthe price. The trends after the treatment (post-price change) are compared withtrends before the treatment (pre-price change) to determine whether they are similaror not. If there is an increase in sales levels after the price change, the researcher canconclude that the treatment had a positive effect on the dependent variable.
However, these experiments may not give absolutely accurate results. This isbecause of threats to internal validity. The history and instrumentation effects arekey threats to internal validity. The simultaneous occurrence of events like boomor bust in global economy, or any calamity might affect experimental results.Another threat is the instrumentation effect, where there can be change in mea-surement units or the process followed by researcher to make measurements.
96 3 Business Research Design: Exploratory, Descriptive and Causal Designs
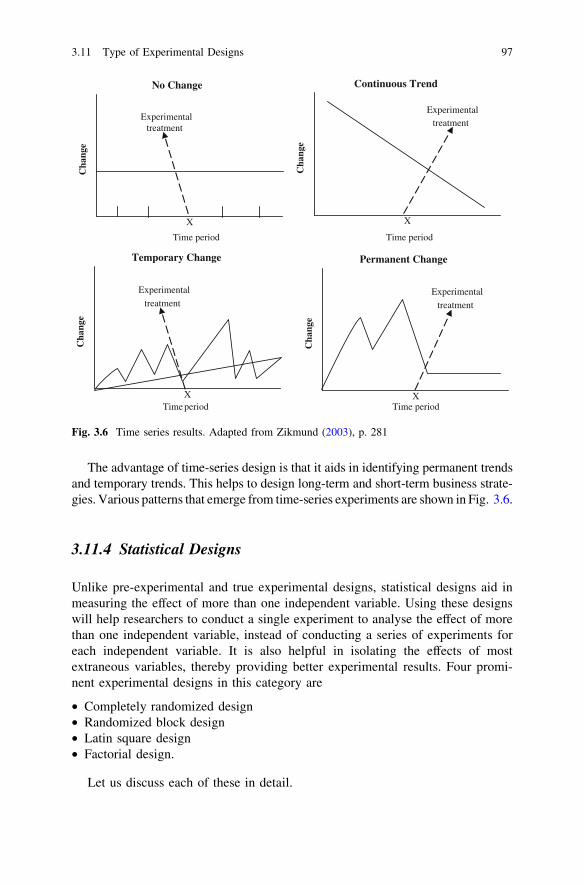
The advantage of time-series design is that it aids in identifying permanent trendsand temporary trends. This helps to design long-term and short-term business strate-gies. Various patterns that emerge from time-series experiments are shown in Fig. 3.6.
3.11.4 Statistical Designs
Unlike pre-experimental and true experimental designs, statistical designs aid inmeasuring the effect of more than one independent variable. Using these designswill help researchers to conduct a single experiment to analyse the effect of morethan one independent variable, instead of conducting a series of experiments foreach independent variable. It is also helpful in isolating the effects of mostextraneous variables, thereby providing better experimental results. Four promi-nent experimental designs in this category are
• Completely randomized design• Randomized block design• Latin square design• Factorial design.
Let us discuss each of these in detail.
Experimental treatment
X
Cha
nge
No Change
Time period
X
Cha
nge
Continuous Trend
Time period
Experimental treatment
Experimental
treatment
X
Cha
nge
Temporary Change
Time periodX
Cha
nge
Permanent Change
Time period
Experimental
treatment
Fig. 3.6 Time series results. Adapted from Zikmund (2003), p. 281
3.11 Type of Experimental Designs 97
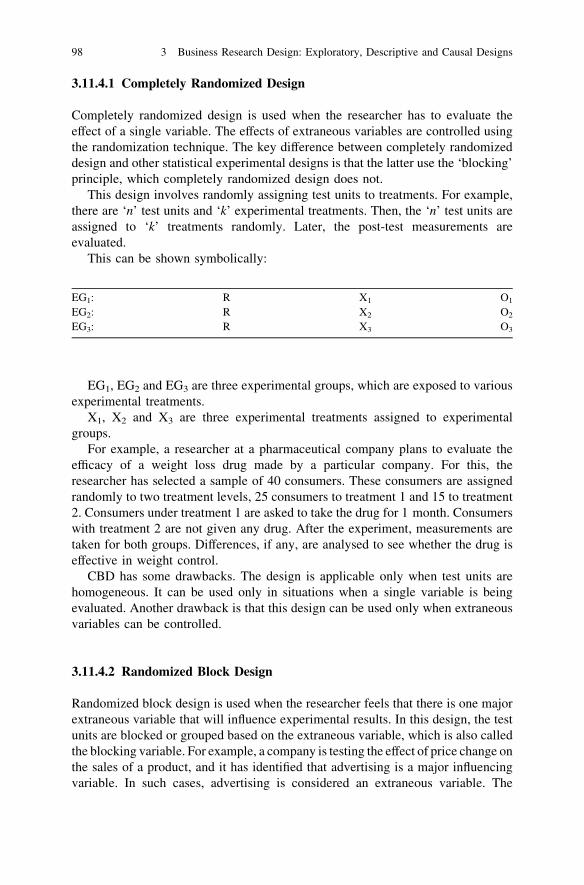
3.11.4.1 Completely Randomized Design
Completely randomized design is used when the researcher has to evaluate theeffect of a single variable. The effects of extraneous variables are controlled usingthe randomization technique. The key difference between completely randomizeddesign and other statistical experimental designs is that the latter use the ‘blocking’principle, which completely randomized design does not.
This design involves randomly assigning test units to treatments. For example,there are ‘n’ test units and ‘k’ experimental treatments. Then, the ‘n’ test units areassigned to ‘k’ treatments randomly. Later, the post-test measurements areevaluated.
This can be shown symbolically:
EG1: R X1 O1
EG2: R X2 O2
EG3: R X3 O3
EG1, EG2 and EG3 are three experimental groups, which are exposed to variousexperimental treatments.
X1, X2 and X3 are three experimental treatments assigned to experimentalgroups.
For example, a researcher at a pharmaceutical company plans to evaluate theefficacy of a weight loss drug made by a particular company. For this, theresearcher has selected a sample of 40 consumers. These consumers are assignedrandomly to two treatment levels, 25 consumers to treatment 1 and 15 to treatment2. Consumers under treatment 1 are asked to take the drug for 1 month. Consumerswith treatment 2 are not given any drug. After the experiment, measurements aretaken for both groups. Differences, if any, are analysed to see whether the drug iseffective in weight control.
CBD has some drawbacks. The design is applicable only when test units arehomogeneous. It can be used only in situations when a single variable is beingevaluated. Another drawback is that this design can be used only when extraneousvariables can be controlled.
3.11.4.2 Randomized Block Design
Randomized block design is used when the researcher feels that there is one majorextraneous variable that will influence experimental results. In this design, the testunits are blocked or grouped based on the extraneous variable, which is also calledthe blocking variable. For example, a company is testing the effect of price change onthe sales of a product, and it has identified that advertising is a major influencingvariable. In such cases, advertising is considered an extraneous variable. The
98 3 Business Research Design: Exploratory, Descriptive and Causal Designs
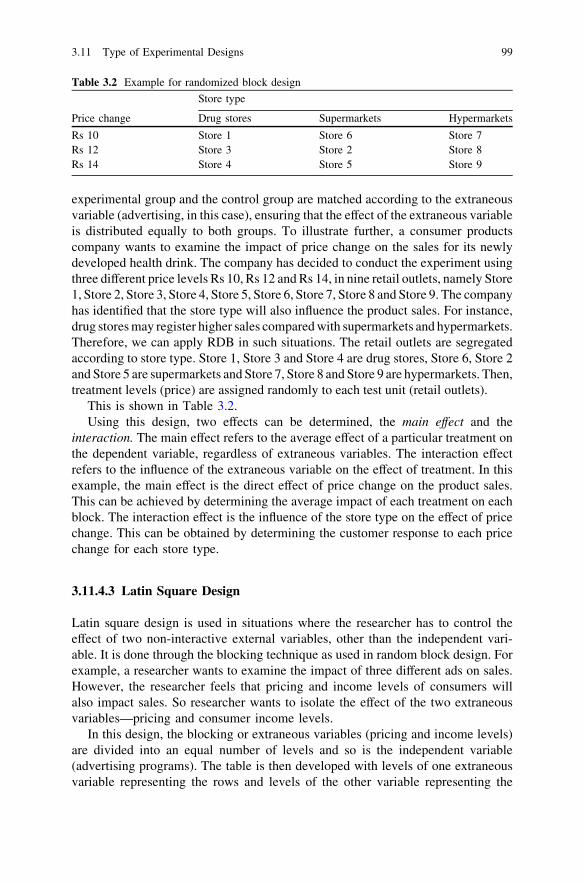
experimental group and the control group are matched according to the extraneousvariable (advertising, in this case), ensuring that the effect of the extraneous variableis distributed equally to both groups. To illustrate further, a consumer productscompany wants to examine the impact of price change on the sales for its newlydeveloped health drink. The company has decided to conduct the experiment usingthree different price levels Rs 10, Rs 12 and Rs 14, in nine retail outlets, namely Store1, Store 2, Store 3, Store 4, Store 5, Store 6, Store 7, Store 8 and Store 9. The companyhas identified that the store type will also influence the product sales. For instance,drug stores may register higher sales compared with supermarkets and hypermarkets.Therefore, we can apply RDB in such situations. The retail outlets are segregatedaccording to store type. Store 1, Store 3 and Store 4 are drug stores, Store 6, Store 2and Store 5 are supermarkets and Store 7, Store 8 and Store 9 are hypermarkets. Then,treatment levels (price) are assigned randomly to each test unit (retail outlets).
This is shown in Table 3.2.Using this design, two effects can be determined, the main effect and the
interaction. The main effect refers to the average effect of a particular treatment onthe dependent variable, regardless of extraneous variables. The interaction effectrefers to the influence of the extraneous variable on the effect of treatment. In thisexample, the main effect is the direct effect of price change on the product sales.This can be achieved by determining the average impact of each treatment on eachblock. The interaction effect is the influence of the store type on the effect of pricechange. This can be obtained by determining the customer response to each pricechange for each store type.
3.11.4.3 Latin Square Design
Latin square design is used in situations where the researcher has to control theeffect of two non-interactive external variables, other than the independent vari-able. It is done through the blocking technique as used in random block design. Forexample, a researcher wants to examine the impact of three different ads on sales.However, the researcher feels that pricing and income levels of consumers willalso impact sales. So researcher wants to isolate the effect of the two extraneousvariables—pricing and consumer income levels.
In this design, the blocking or extraneous variables (pricing and income levels)are divided into an equal number of levels and so is the independent variable(advertising programs). The table is then developed with levels of one extraneousvariable representing the rows and levels of the other variable representing the
Table 3.2 Example for randomized block design
Store type
Price change Drug stores Supermarkets Hypermarkets
Rs 10 Store 1 Store 6 Store 7Rs 12 Store 3 Store 2 Store 8Rs 14 Store 4 Store 5 Store 9
3.11 Type of Experimental Designs 99
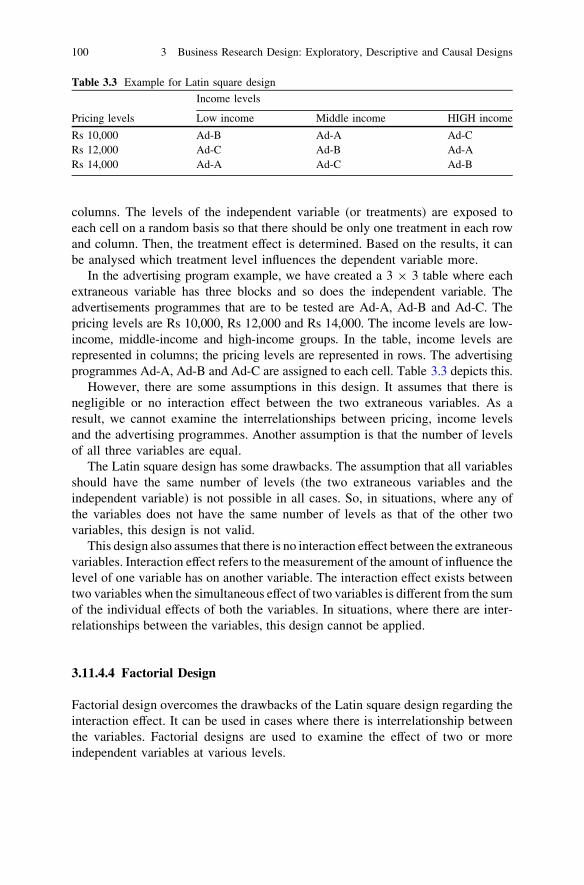
columns. The levels of the independent variable (or treatments) are exposed toeach cell on a random basis so that there should be only one treatment in each rowand column. Then, the treatment effect is determined. Based on the results, it canbe analysed which treatment level influences the dependent variable more.
In the advertising program example, we have created a 3 9 3 table where eachextraneous variable has three blocks and so does the independent variable. Theadvertisements programmes that are to be tested are Ad-A, Ad-B and Ad-C. Thepricing levels are Rs 10,000, Rs 12,000 and Rs 14,000. The income levels are low-income, middle-income and high-income groups. In the table, income levels arerepresented in columns; the pricing levels are represented in rows. The advertisingprogrammes Ad-A, Ad-B and Ad-C are assigned to each cell. Table 3.3 depicts this.
However, there are some assumptions in this design. It assumes that there isnegligible or no interaction effect between the two extraneous variables. As aresult, we cannot examine the interrelationships between pricing, income levelsand the advertising programmes. Another assumption is that the number of levelsof all three variables are equal.
The Latin square design has some drawbacks. The assumption that all variablesshould have the same number of levels (the two extraneous variables and theindependent variable) is not possible in all cases. So, in situations, where any ofthe variables does not have the same number of levels as that of the other twovariables, this design is not valid.
This design also assumes that there is no interaction effect between the extraneousvariables. Interaction effect refers to the measurement of the amount of influence thelevel of one variable has on another variable. The interaction effect exists betweentwo variables when the simultaneous effect of two variables is different from the sumof the individual effects of both the variables. In situations, where there are inter-relationships between the variables, this design cannot be applied.
3.11.4.4 Factorial Design
Factorial design overcomes the drawbacks of the Latin square design regarding theinteraction effect. It can be used in cases where there is interrelationship betweenthe variables. Factorial designs are used to examine the effect of two or moreindependent variables at various levels.
Table 3.3 Example for Latin square design
Income levels
Pricing levels Low income Middle income HIGH income
Rs 10,000 Ad-B Ad-A Ad-CRs 12,000 Ad-C Ad-B Ad-ARs 14,000 Ad-A Ad-C Ad-B
100 3 Business Research Design: Exploratory, Descriptive and Causal Designs
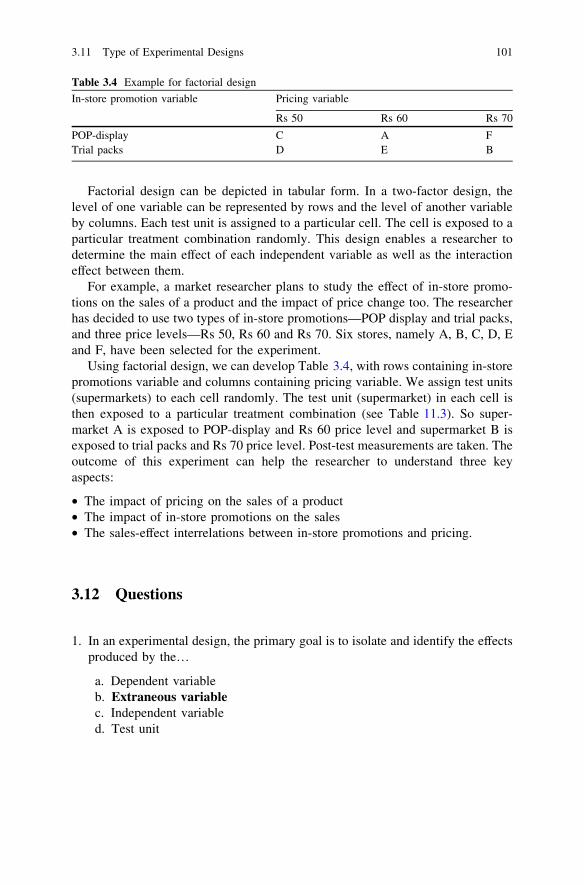
Factorial design can be depicted in tabular form. In a two-factor design, thelevel of one variable can be represented by rows and the level of another variableby columns. Each test unit is assigned to a particular cell. The cell is exposed to aparticular treatment combination randomly. This design enables a researcher todetermine the main effect of each independent variable as well as the interactioneffect between them.
For example, a market researcher plans to study the effect of in-store promo-tions on the sales of a product and the impact of price change too. The researcherhas decided to use two types of in-store promotions—POP display and trial packs,and three price levels—Rs 50, Rs 60 and Rs 70. Six stores, namely A, B, C, D, Eand F, have been selected for the experiment.
Using factorial design, we can develop Table 3.4, with rows containing in-storepromotions variable and columns containing pricing variable. We assign test units(supermarkets) to each cell randomly. The test unit (supermarket) in each cell isthen exposed to a particular treatment combination (see Table 11.3). So super-market A is exposed to POP-display and Rs 60 price level and supermarket B isexposed to trial packs and Rs 70 price level. Post-test measurements are taken. Theoutcome of this experiment can help the researcher to understand three keyaspects:
• The impact of pricing on the sales of a product• The impact of in-store promotions on the sales• The sales-effect interrelations between in-store promotions and pricing.
3.12 Questions
1. In an experimental design, the primary goal is to isolate and identify the effectsproduced by the…
a. Dependent variableb. Extraneous variablec. Independent variabled. Test unit
Table 3.4 Example for factorial design
In-store promotion variable Pricing variable
Rs 50 Rs 60 Rs 70
POP-display C A FTrial packs D E B
3.11 Type of Experimental Designs 101
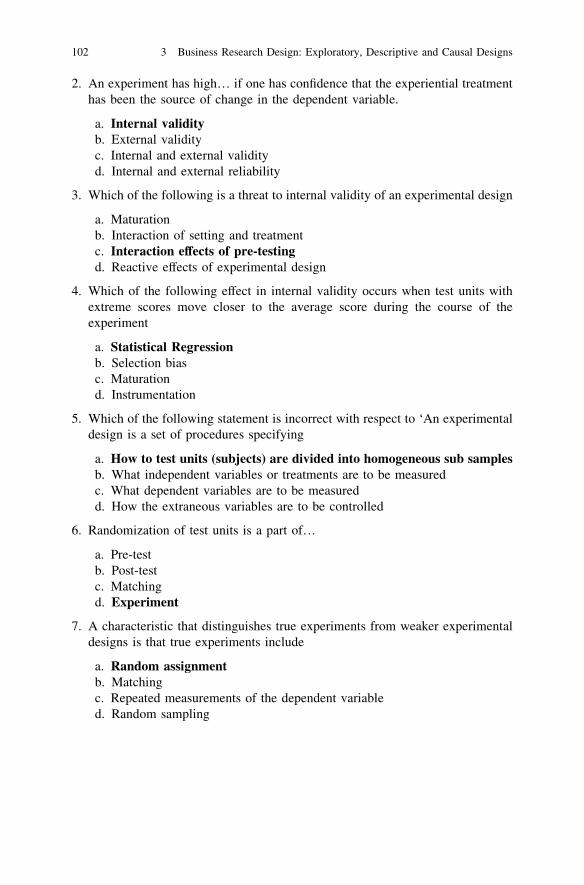
2. An experiment has high… if one has confidence that the experiential treatmenthas been the source of change in the dependent variable.
a. Internal validityb. External validityc. Internal and external validityd. Internal and external reliability
3. Which of the following is a threat to internal validity of an experimental design
a. Maturationb. Interaction of setting and treatmentc. Interaction effects of pre-testingd. Reactive effects of experimental design
4. Which of the following effect in internal validity occurs when test units withextreme scores move closer to the average score during the course of theexperiment
a. Statistical Regressionb. Selection biasc. Maturationd. Instrumentation
5. Which of the following statement is incorrect with respect to ‘An experimentaldesign is a set of procedures specifying
a. How to test units (subjects) are divided into homogeneous sub samplesb. What independent variables or treatments are to be measuredc. What dependent variables are to be measuredd. How the extraneous variables are to be controlled
6. Randomization of test units is a part of…
a. Pre-testb. Post-testc. Matchingd. Experiment
7. A characteristic that distinguishes true experiments from weaker experimentaldesigns is that true experiments include
a. Random assignmentb. Matchingc. Repeated measurements of the dependent variabled. Random sampling
102 3 Business Research Design: Exploratory, Descriptive and Causal Designs

References
ASQ Statistics Division Newsletter (2000), vol 19(issue 2)Beri GC (1989) Marketing research, 1st edn. Tata McGraw-Hill, New DelhiCook T, Campbell D (1979) Quasi experimentation: design and analysis issues for field settings.
Houghton Mifflin Company, BostonSudman S (1980) Improving the quality of shopping centre sampling. J Mark Res 17:423–431Zikmund WG (2003) Business research methods, 7th edn. Thomson South-Western, Singapore,
p 281
References 103

Part IIISources and Methods of Data Collection:
Qualitative and Quantitative Data
Chapter 4Scales and Measurement
Once the research problem has been clearly established, the most important part ofthe research, namely data collection, begins. A proper measurement system has tobe developed before actually venturing into the field to collect data. At this stage, aresearcher has to address some fundamental issues relating to the variables thatneed to be measured, and the different measurement scales that have to be used formeasuring the characteristic that are relevant to the research study.
The process of assigning numbers or labels to different objects under study torepresent them quantitatively or qualitatively is called measurement. Measurementthus can be understood as a means to denote the amount of a particular attributethat a particular object possesses. An important aspect of measurement is that thereare certain rules that will define the process of measurement; for instance, a rulemight be developed which says that number 1 should be assigned to people whoare from South India and number 2 should be assigned to people who are fromNorth India. It is, however, important to note that measurement is done for theattributes of the units under study but not the units themselves. For example,the height, weight, age or other such attributes of a person are measured but not theperson himself.
In this chapter, we discuss some of these issues involved in measurement, suchas determining the variables that have to be measured in a business research pro-cess, the different types of measurement scales available and their uses. The criteriafor good measurement are also covered, and finally, the chapter concludes with adiscussion on the different errors that arise during the process of Measurement.
4.1 Identifying and Deciding on the Variablesto be Measured
The primary step in the measurement process is to identify the area or the conceptthat is of interest for the study. A concept can be understood as a general ideaderived or inferred from specific instances or occurrences. Once a concept has
S. Sreejesh et al., Business Research Methods,DOI: 10.1007/978-3-319-00539-3_4,� Springer International Publishing Switzerland 2014
107
been identified, for example, studying the motivational levels of employees in anorganization, the researcher can focus on developing a construct. A construct is ageneral idea or an abstract inferred or derived from specific instances. Constructscan also be considered as certain types of concepts which exist at different levelsof thought that are developed to simplify complex situations concerning the area ofstudy. They are developed for theoretical usage as well as for explaining theconcepts themselves.
After developing a construct the subsequent process in the research is to definethe concept constitutively and then operationally. A constitutive definition of theconcept will specify the research boundaries and also will define the central themeof the study. The most important use of defining the concept (under study) con-stitutively is to clearly demarcate it from other concepts. The primary purpose ofdefining the concept constitutively is that it will help the researchers in framingand addressing the research question in an appropriate manner. For instance, if wejust say that we want to study the education system in India, this will not help at allin developing a research question, since it has to be clearly defined as to whateducation system needs to be studied—is it primary education or secondary orhigher education, or is it related to an adult education programme and so on. So theconstitutive definition in this example would be, say, ‘Primary education coveringstate government aided schools (classes I to V)’.
Exhibit 4.1: Studying Role Ambiguity
The constitutive definition of role ambiguity can be framed in the followingmanner. Role ambiguity is a direct function of the discrepancy between theinformation available to the person and that which is required for adequateperformance of his role. Subjectively, it is the difference between his actualstate of knowledge and that which provides adequate satisfaction of his personalneeds and values.
On the other hand, the operational definition can be framed as the state ofuncertainty (measured on a five point scale ranging from highly uncertain tohighly certain) an employee feels regarding the duties and responsibilities of hisjob relating to his co-employees and customers.
The measurement scale that has been developed consists of a 45-item scale.Each of these 45 items is analysed on a five-point scale. The five points in thescale represent
1 = highly certain, 2 = certain, 3 = neither certain nor uncertain,4 = uncertain, 5 = highly uncertain.
Some of the items that have been measured are given below:
• What is the amount of work that I am expected to do?• What should I do to improve my chances of getting a promotion?
108 4 Scales and Measurement
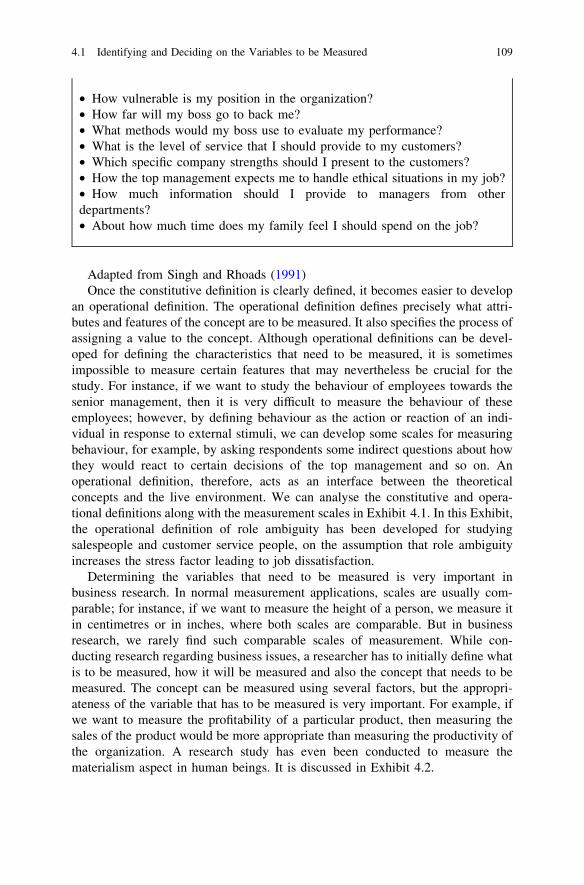
Adapted from Singh and Rhoads (1991)Once the constitutive definition is clearly defined, it becomes easier to develop
an operational definition. The operational definition defines precisely what attri-butes and features of the concept are to be measured. It also specifies the process ofassigning a value to the concept. Although operational definitions can be devel-oped for defining the characteristics that need to be measured, it is sometimesimpossible to measure certain features that may nevertheless be crucial for thestudy. For instance, if we want to study the behaviour of employees towards thesenior management, then it is very difficult to measure the behaviour of theseemployees; however, by defining behaviour as the action or reaction of an indi-vidual in response to external stimuli, we can develop some scales for measuringbehaviour, for example, by asking respondents some indirect questions about howthey would react to certain decisions of the top management and so on. Anoperational definition, therefore, acts as an interface between the theoreticalconcepts and the live environment. We can analyse the constitutive and opera-tional definitions along with the measurement scales in Exhibit 4.1. In this Exhibit,the operational definition of role ambiguity has been developed for studyingsalespeople and customer service people, on the assumption that role ambiguityincreases the stress factor leading to job dissatisfaction.
Determining the variables that need to be measured is very important inbusiness research. In normal measurement applications, scales are usually com-parable; for instance, if we want to measure the height of a person, we measure itin centimetres or in inches, where both scales are comparable. But in businessresearch, we rarely find such comparable scales of measurement. While con-ducting research regarding business issues, a researcher has to initially define whatis to be measured, how it will be measured and also the concept that needs to bemeasured. The concept can be measured using several factors, but the appropri-ateness of the variable that has to be measured is very important. For example, ifwe want to measure the profitability of a particular product, then measuring thesales of the product would be more appropriate than measuring the productivity ofthe organization. A research study has even been conducted to measure thematerialism aspect in human beings. It is discussed in Exhibit 4.2.
• How vulnerable is my position in the organization?• How far will my boss go to back me?• What methods would my boss use to evaluate my performance?• What is the level of service that I should provide to my customers?• Which specific company strengths should I present to the customers?• How the top management expects me to handle ethical situations in my job?• How much information should I provide to managers from otherdepartments?• About how much time does my family feel I should spend on the job?
4.1 Identifying and Deciding on the Variables to be Measured 109
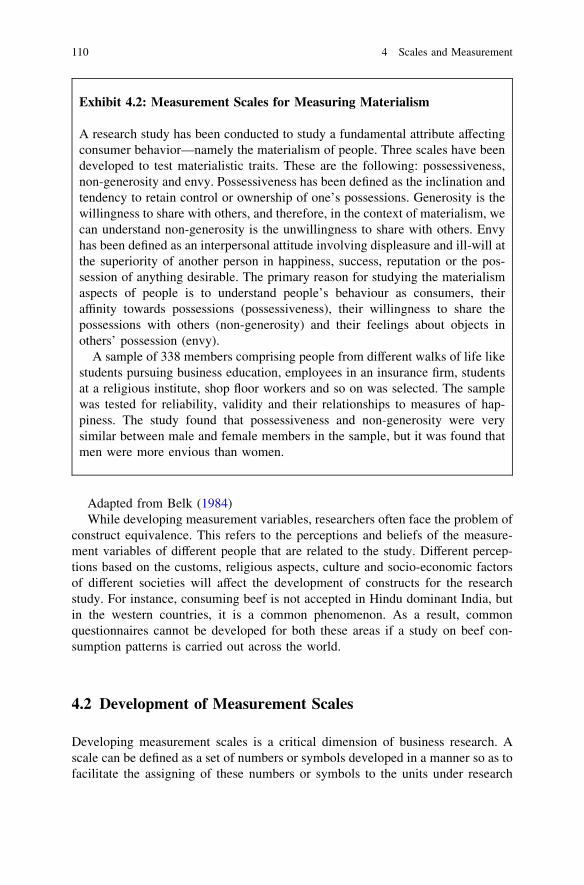
Adapted from Belk (1984)While developing measurement variables, researchers often face the problem of
construct equivalence. This refers to the perceptions and beliefs of the measure-ment variables of different people that are related to the study. Different percep-tions based on the customs, religious aspects, culture and socio-economic factorsof different societies will affect the development of constructs for the researchstudy. For instance, consuming beef is not accepted in Hindu dominant India, butin the western countries, it is a common phenomenon. As a result, commonquestionnaires cannot be developed for both these areas if a study on beef con-sumption patterns is carried out across the world.
4.2 Development of Measurement Scales
Developing measurement scales is a critical dimension of business research. Ascale can be defined as a set of numbers or symbols developed in a manner so as tofacilitate the assigning of these numbers or symbols to the units under research
Exhibit 4.2: Measurement Scales for Measuring Materialism
A research study has been conducted to study a fundamental attribute affectingconsumer behavior—namely the materialism of people. Three scales have beendeveloped to test materialistic traits. These are the following: possessiveness,non-generosity and envy. Possessiveness has been defined as the inclination andtendency to retain control or ownership of one’s possessions. Generosity is thewillingness to share with others, and therefore, in the context of materialism, wecan understand non-generosity is the unwillingness to share with others. Envyhas been defined as an interpersonal attitude involving displeasure and ill-will atthe superiority of another person in happiness, success, reputation or the pos-session of anything desirable. The primary reason for studying the materialismaspects of people is to understand people’s behaviour as consumers, theiraffinity towards possessions (possessiveness), their willingness to share thepossessions with others (non-generosity) and their feelings about objects inothers’ possession (envy).
A sample of 338 members comprising people from different walks of life likestudents pursuing business education, employees in an insurance firm, studentsat a religious institute, shop floor workers and so on was selected. The samplewas tested for reliability, validity and their relationships to measures of hap-piness. The study found that possessiveness and non-generosity were verysimilar between male and female members in the sample, but it was found thatmen were more envious than women.
110 4 Scales and Measurement
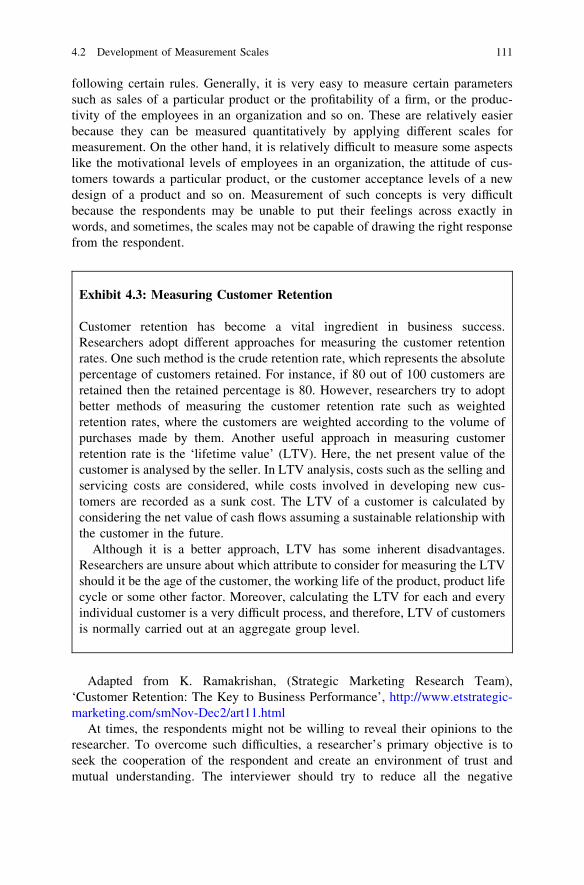
following certain rules. Generally, it is very easy to measure certain parameterssuch as sales of a particular product or the profitability of a firm, or the produc-tivity of the employees in an organization and so on. These are relatively easierbecause they can be measured quantitatively by applying different scales formeasurement. On the other hand, it is relatively difficult to measure some aspectslike the motivational levels of employees in an organization, the attitude of cus-tomers towards a particular product, or the customer acceptance levels of a newdesign of a product and so on. Measurement of such concepts is very difficultbecause the respondents may be unable to put their feelings across exactly inwords, and sometimes, the scales may not be capable of drawing the right responsefrom the respondent.
Adapted from K. Ramakrishan, (Strategic Marketing Research Team),‘Customer Retention: The Key to Business Performance’, http://www.etstrategic-marketing.com/smNov-Dec2/art11.html
At times, the respondents might not be willing to reveal their opinions to theresearcher. To overcome such difficulties, a researcher’s primary objective is toseek the cooperation of the respondent and create an environment of trust andmutual understanding. The interviewer should try to reduce all the negative
Exhibit 4.3: Measuring Customer Retention
Customer retention has become a vital ingredient in business success.Researchers adopt different approaches for measuring the customer retentionrates. One such method is the crude retention rate, which represents the absolutepercentage of customers retained. For instance, if 80 out of 100 customers areretained then the retained percentage is 80. However, researchers try to adoptbetter methods of measuring the customer retention rate such as weightedretention rates, where the customers are weighted according to the volume ofpurchases made by them. Another useful approach in measuring customerretention rate is the ‘lifetime value’ (LTV). Here, the net present value of thecustomer is analysed by the seller. In LTV analysis, costs such as the selling andservicing costs are considered, while costs involved in developing new cus-tomers are recorded as a sunk cost. The LTV of a customer is calculated byconsidering the net value of cash flows assuming a sustainable relationship withthe customer in the future.
Although it is a better approach, LTV has some inherent disadvantages.Researchers are unsure about which attribute to consider for measuring the LTVshould it be the age of the customer, the working life of the product, product lifecycle or some other factor. Moreover, calculating the LTV for each and everyindividual customer is a very difficult process, and therefore, LTV of customersis normally carried out at an aggregate group level.
4.2 Development of Measurement Scales 111
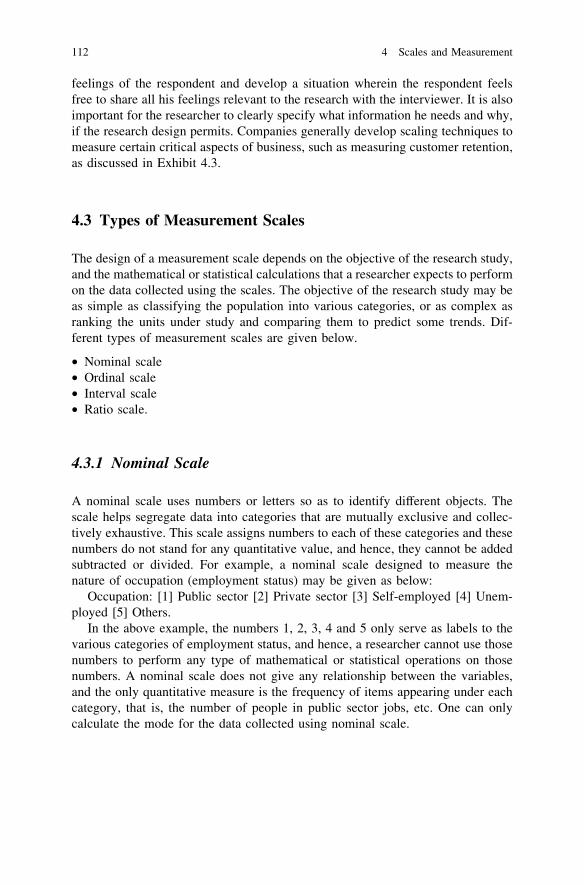
feelings of the respondent and develop a situation wherein the respondent feelsfree to share all his feelings relevant to the research with the interviewer. It is alsoimportant for the researcher to clearly specify what information he needs and why,if the research design permits. Companies generally develop scaling techniques tomeasure certain critical aspects of business, such as measuring customer retention,as discussed in Exhibit 4.3.
4.3 Types of Measurement Scales
The design of a measurement scale depends on the objective of the research study,and the mathematical or statistical calculations that a researcher expects to performon the data collected using the scales. The objective of the research study may beas simple as classifying the population into various categories, or as complex asranking the units under study and comparing them to predict some trends. Dif-ferent types of measurement scales are given below.
• Nominal scale• Ordinal scale• Interval scale• Ratio scale.
4.3.1 Nominal Scale
A nominal scale uses numbers or letters so as to identify different objects. Thescale helps segregate data into categories that are mutually exclusive and collec-tively exhaustive. This scale assigns numbers to each of these categories and thesenumbers do not stand for any quantitative value, and hence, they cannot be addedsubtracted or divided. For example, a nominal scale designed to measure thenature of occupation (employment status) may be given as below:
Occupation: [1] Public sector [2] Private sector [3] Self-employed [4] Unem-ployed [5] Others.
In the above example, the numbers 1, 2, 3, 4 and 5 only serve as labels to thevarious categories of employment status, and hence, a researcher cannot use thosenumbers to perform any type of mathematical or statistical operations on thosenumbers. A nominal scale does not give any relationship between the variables,and the only quantitative measure is the frequency of items appearing under eachcategory, that is, the number of people in public sector jobs, etc. One can onlycalculate the mode for the data collected using nominal scale.
112 4 Scales and Measurement
4.3.2 Ordinal Scale
An ordinal scale is used to arrange objects according to some particular order.Thus, the variables in the ordinal scale can be ranked. For instance, if someonesays that a person came second in the exam, then we can understand that there wasanother person who came first and some others were there who were ranked afterhim. This type of scale that gives ranks is called an ordinal measurement scale.Ordinal variables can only give us the information regarding relative position ofthe participants in the observation, but they do not give any information regardingthe absolute magnitude of the difference between the first and the second position,or second and third position and so on.
For example, an ordinal scale used to measure the preference of customers (inAndhra Pradesh) for various mobile telephone service providers would ask aquestion like please rank the following mobile telephone service providers from 1to 5 with 1 representing the most preferred and 5 the least preferred.
Airtel ____Hutch ____Idea ____BSNL ____Reliance ____A respondent may rank these players depending on his experience/perception of
them. If a respondent ranks Airtel as 1 and Idea as 2, a researcher can know that therespondent prefers Airtel. However, the limitation is that the researcher cannot besure as to how strong the respondents’ liking is for Airtel when compared to Idea.
4.3.3 Interval Scale
Interval scales are similar to ordinal scales to the extent that they also arrangeobjects in a particular order. However, in an interval scale, the intervals between thepoints on the scale are equal. This is the scale where there is equal distance betweenthe two points on the scale. Examples of interval scales are Fahrenheit and Celsiusscales used to measure temperature. In these scale, the difference between theintervals is the same, that is, the difference between 40� and 60� is the same as thedifference between 25� and 45�. But the base point, freezing of water is representedby 32 �F and 0 �C. Thus, there is no natural zero (base) for these scales.
Similarly, we can design an interval scale with points placed at an interval of 1point [10] ——— [9] ——— [8] ——— [7] ——— [6] ——— [5] ——— [4]——— [3] ——— [2] ——— [1] and ask the respondents to place the mobiletelephone service providers on this scale of 10–1. If Idea is assigned 8 and BSNL 4we can say that the value of difference in preference is 4. But we cannot say thatthe liking for Idea is twice that for BSNL because we did not define a point of noliking, that is 0. The only statement we can make about a respondents preference
4.3 Types of Measurement Scales 113
for Idea and BSNL is ‘he likes Idea more than BSNL’ but we cannot give a ratio ofthe likings as there is no base zero.
Interval scales are suitable for the calculation of an arithmetic mean, standarddeviation and correlation coefficient.
4.3.4 Ratio Scale
Ratio scales have a fixed zero point and also have equal intervals. Unlike theordinal scale, the ratio scale allows for the comparison of two variables measuredon the scale. This is possible because the numbers or units on the scale are equal atall levels of the scale. A very good example of ratio scale is distance; for instance,not only can we say that the difference between four miles and six miles is thesame as the difference between six miles and eight miles but we can also say thateight miles is twice as long as four miles. In other words, a ratio scale can bedefined as a scale that measures in terms of equal intervals and an absolute zeropoint of origin exists. This zero is common to a distance scale using yards, meters,etc. Age, height, weight, money scales are other common examples of ratio scales.Since their exist an absolute zero on the ratio scale, the data collected can besubjected to any type of mathematical operation say, addition, subtraction, mul-tiplication and division.
4.4 Criteria for Good Measurement
Researchers normally develop their own scales for measuring variables for differentattributes as it is very difficult to find readily available scales. It is in this process ofdeveloping scales that researchers have to be very careful, since the scales that theydevelop should primarily stand the tests of reliability, validity, sensitivity and so on.In the following sections, we will discuss the criteria for good measurement. Thereare five major criteria for analysing the goodness of a measurement, namely reli-ability, validity, sensitivity, generalizability and relevance.
4.4.1 Reliability
It is considered that if the outcome of a measuring process is reproducible, then themeasuring instrument is reliable. Reliable measuring scales provide stable mea-sures at different times under different conditions. For example, if a coffee vendingmachine gives the same quantity of coffee every time, then it can be concluded thatthe measurement of the coffee vending machine is reliable. Thus, reliability can bedefined as the degree to which the measurements of a particular instrument are free
114 4 Scales and Measurement
from errors and as a result produce consistent results. However, in certain situa-tions, poor data collection methods give rise to low reliability. The quality of thedata collected can become poor if the respondents do not understand the questionsproperly and give irrelevant answers to them. There are three methods that can beused to evaluate the reliability of a measure. They are test–retest reliability,equivalent forms and internal consistency.
4.4.2 Test–Retest Reliability
If the result of a research is the same, even when it is conducted for the second orthird time, it confirms the repeatability aspect. For example, if 40 % of a samplesay that they do not watch movies, and when the research is repeated aftersometime and the result is same (or almost the same) again, then the measurementprocess is said to be reliable. However, there are certain problems regarding thetest–retest method of testing reliability, the first and foremost issue is that it is verydifficult to obtain the cooperation and locate all the respondents for a second roundof research. Apart from this, the responses of these people may have changed onthe second occasion, and sometimes environmental factors may also influence theresponses.
4.4.3 Equivalent Form Reliability
Some of the shortcomings of test–retest reliability can be overcome in this method.In equivalent form reliability, two measurement scales of a similar nature are to bedeveloped. For instance, if the researcher is interested in finding out the percep-tions of consumers on recent technologically advanced products, then he candevelop two questionnaires. Each questionnaire contains different questions tomeasure their perceptions, but both the questionnaires should have an approxi-mately equal number of questions. The two questionnaires can be administeredwith a time gap of about 2 weeks. The reliability in this method is tested bymeasuring the correlation of the scores generated by the two instruments. Themajor problem with equivalent form reliability is that it is almost impossible toframe two totally equivalent questionnaires.
4.4.4 Internal Consistency
Internal consistency of data can be established when the data give the same resultseven after some manipulation. For example, after a research result is obtained for aparticular study, the result can be split into two parts and the result of one part can
4.4 Criteria for Good Measurement 115
be tested against the result of the other; if they are consistent, then the measure issaid to be reliable. The problem with internal consistency is that the reliability ofthis method is completely dependent on the way the data are divided up ormanipulated. Sometimes, it so happens that different splits give different results.To overcome such problems with split halves, many researchers adopt a techniquecalled as Cronbach’s Alpha that needs the scale items to be at equal intervals. Incase of difficulty in obtaining the data at equal intervals of time, then an alternatemethod called KR-20 (Kuder Richardson Formula 20) is used to calculate howconsistent subject responses are among the questions on an instrument. Items onthe instrument must be dichotomously scored (0 for incorrect and 1 for correct).All items are compared with each other, rather than half of the items with the otherhalf of the items. It can be shown mathematically that the Kuder–Richardsonreliability coefficient is actually the mean of all split-half coefficients.
4.4.5 Validity
The ability of a scale or a measuring instrument to measure what it is intended tomeasure can be termed as the validity of the measurement. For instance, studentsmay complain about the validity of an exam, stating that it did not measure theirunderstanding of the topic, but only their memorizing ability. Another examplemay be of a researcher who tries to measure the morale of employees based ontheir absenteeism alone; in this case too, the validity of the research may bequestioned, as absenteeism cannot be purely attributed to low morale, but also toother conditions like prolonged illness, family reasons and so on. Validity can bemeasured through several methods like face validity, content validity, criterion-related validity and construct validity.
4.4.6 Face Validity
Face validity refers to the collective agreement of the experts and researchers onthe validity of the measurement scale. However, this form of validity is consideredthe weakest form of validity. Here, experts determine whether the scale is mea-suring what it is expected to measure or not.
4.4.7 Content Validity
Content validity refers to the adequacy in the selection of relevant variables formeasurement. The scale that is selected should have the required number ofvariables for measurement. For instance, if the state education department wants to
116 4 Scales and Measurement
measure whether all the schools in the city have adequate facilities, and formeasuring this, it develops a scale to measure the attributes like the attractivenessof schools names, the frequency of old students meets, the different varieties ofeatables that are prepared in the school canteen and so on. Here, it is clear thatthese variables considered for measurement do not possess any content validity asthey will not serve the purpose of the research. The scale should instead bedeveloped to measure aspects such as the number of classrooms, the number ofqualified teachers on roll, the capacity of the playground and so on. It is oftendifficult to identify and include all the relevant variables that need to be studied forany research process.
4.4.8 Criterion-Related Validity
The criterion-related validity refers to the degree to which a measurementinstrument can analyse a variable that is said to have a criterion. If a new measureis developed, one has to ensure that it correlates with other measures of the sameconstruct. For instance, length of an object can be measured with the help of tapemeasure, calipers, odometers and also with a ruler and if a new technique ofmeasure is developed then one has to ensure that this new measure correlates withother measures of length. If a researcher wants to establish criterion validity for anew measure for the payment of wages, then he may want to ensure that thismeasure correlates with other traditional measures of wage payment such as totalnumber of days worked.
Criterion validity may be categorized as predictive validity and concurrentvalidity. Predictive validity is the extent to which a future level of a criterionvariable can be predicted by a current measurement on a scale. A scale formeasuring the future occupancy of an apartment complex for example may usethis scale. A builder may give preference to only those repairs that may attract newtenants in the future rather than focusing on all the areas that need repair. Con-current validity is related with the relationship between the predictor variable andthe criterion variable. Both the predictor variable and the criterion variable areevaluated at the same point in time.
4.4.9 Construct Validity
Construct validity refers to the degree to which a measurement instrument rep-resents and logically connects through the underlying theory. Construct validity,although it is not directly addressed by the researcher, is extremely important. Itassesses the underlying aspects relating to behaviour; it measures why a person
4.4 Criteria for Good Measurement 117
behaved in a certain way rather than how he has behaved. For instance, whether aparticular product was purchased by a consumer is not the consideration, but whyhe has/has not purchased the product is taken into account to judge constructvalidity. This helps to remove any extraneous factors that may lead to incorrectresearch conclusions. For example, for a particular product, price may not be thefactor that affects a person deciding whether to buy it. If this product is used in themeasurement of a general relationship of price and quantity demanded, it does nothave construct validity, as it does not connect with the underlying theory.
There are two statistical methods for analysing construct validity—convergentvalidity and discriminant validity. Convergent validity is the extent of correlationamong different measures that are intended to measure the same concept. Dis-criminant validity denotes the lack of or low correlation among the constructs thatare supposed to be different. Consider a multi-item scale that is being developed tomeasure the tendency to stay in low-cost hotels. This tendency has four personalityvariables; high level of self-confidence, low need for status, low need for dis-tinctiveness and high level of adaptability. Additionally, this tendency to stay inlow-cost hotels is not related to brand loyalty or high-level aggressiveness. Thescale can be said to have construct, if it correlates highly with other measures oftendency to stay in low-cost hotels such as reported hotels patronized and socialclass (convergent validity). Has a low correlation with the unrelated constructs ofbrand loyalty and a high level of aggressiveness (discriminant validity).
4.4.10 Sensitivity
Sensitivity refers to an instrument’s ability to accurately measure variability instimuli or responses. Sensitivity is not high in instrument’s involving ‘agree’ or‘disagree’ types of response. When there is a need to be more sensitive to subtlechanges, the instrument is altered appropriately. For example, strongly agree,mildly agree, mildly disagree, strongly disagree, none of the above are categorieswhose inclusion increases the scale’s sensitivity.
4.4.11 Generalizability
Generalizability refers to the amount of flexibility in interpreting the data in dif-ferent research designs. The generalizability of a multiple item scale can beanalysed by its ability to collect data from a wide variety of respondents and with areasonable flexibility to interpret such data.
118 4 Scales and Measurement
4.4.12 Relevance
Relevance, as the name itself suggests, refers to the appropriateness of using aparticular scale for measuring a variable. It can be represented as,
Relevance = reliability 9 validity.If correlation coefficient is used to analyse both reliability and validity, then the
scale can have relevance from 0 to 1, where 0 is the low or no relevance level to 1which is the high relevance level. Here, if either of reliability or validity is low,then the scale will have little relevance.
4.5 Sources of Measurement Problems
When conducting a study, a researcher has to analyse the accuracy of the infor-mation that has been obtained, as several types of research errors can come induring a study. Some of the major research errors are discussed below.
4.5.1 Respondent-Associated Errors
A majority of research studies rely on eliciting information from respondents. Ifthe researchers are able to obtain the cooperation of respondents and elicit truthfulresponses from them, the survey can easily achieve its targets. However, tworespondent-associated errors arise when researchers do not obtain the informationas stated above. These respondent errors are non-response error and response bias.
4.5.2 Non-response Errors
Non-response errors arise when the survey does not include one or more pieces ofinformation from a unit that has to be part of the study. The research results willhave some bias to the extent that those not responding are different from those whorespond. Non-response errors include failure to respond completely or even failureto respond to one or more questions of the surveyor. Unit non-response occurswhen a person or a household that exists in the data set does not respond. Item non-response is one where a person selectively responds to only certain questions of thesurvey and will not respond to one or more questions of the survey. The reasonsfor not responding to some questions may be: lack of knowledge or it may be thatthe respondent does not want to answer. Non-respondent error may become an
4.4 Criteria for Good Measurement 119
important source of bias in the result of the survey if a large number of thepotential respondents do not respond and if the non-respondents are significantlydifferent from the respondents on some of the characteristics that are important forthe study.
4.5.3 Response Bias
If the respondents consciously or unconsciously misrepresent the truth, then itamounts to response bias. Sometimes respondents deliberately mislead researchersby giving false answers so as not to reveal their ignorance or to avoid embar-rassment and so on.
4.5.4 Instrument-Associated Errors
Instrument-associated errors can surface due to poor questionnaire design,improper selection of samples, etc. Even a simple thing like lack of adequate spacein the questionnaire for registering the answers of the respondent can result inerrors of this sort. Another type of instrument errors occurs if the questionnaire iscomplex or ambiguous as this can result in a lot of confusion for the respondent. Ifthe questions in the questionnaire use complicated words and sentences, they willinadvertently lead to errors due to the misinterpretation of such questions by therespondents.
4.5.5 Situational Errors
Plenty of errors arise due to the situational factors. The respondent may not pro-vide proper responses if a third person is present during the interview, or some-times the third person might himself participate in the interview process withoutany invitation leading to inappropriate responses. Other factors such as the loca-tion of the interview also play a crucial part; for instance, if the researcher isconducting intercept interviews in public places, then the respondents may notrespond as properly as they would if they were interviewed in their homes. If theresearcher does not assure the respondent that the data provided will be keptconfidential, the respondent may not part with certain information that may becrucial for the research.
120 4 Scales and Measurement
4.5.6 Measurer as Error Source
The measurer may be a source of error because of some of the common mistakescommitted by interviewers. During the process of the interview, the interviewermight encourage or discourage the respondent while giving responses to certainquestions, through body language and gestures—smiles to encourage certainresponses, frowning to discourage certain responses and so on. After the collectionof the data, the interviewer might reword or rephrase the responses that may leadto errors. Failing to record the full response of the respondent, inappropriatecoding and tabulations and application of irrelevant statistical tools for measure-ment will also lead to errors.
4.6 Attitude Measurement
Attitudes have been understood as learned predispositions that project a positive ornegative behaviour consistently towards various objects of the world. Attitudes aregenerally formed on a permanent basis and they develop as a combination ofseveral interrelated beliefs. People in society have different attitudes towardsdifferent aspects of the world. Attitudes play a major role in a person’s good or badbehaviour, based on the standards set by society. A person may have a negativeattitude towards society and go against its customs and beliefs. On the other hand,a person with a positive attitude will not go against standards set by the society.There will be some people, who take the mid-path, conforming in some things andrebelling in others. Further, attitudes are not just confined to one aspect but apredisposition towards several features, a world-view as such. To give a smallexample, a person may have a positive attitude towards a particular hotel, based onits clean and hygienic environment and the tasty food it serves.
In any company or industry, it is crucial to measure customer attitudes tounderstand their behaviour towards products and services. Although it is difficultto measure attitudes qualitatively, attempts have been made to do this with acertain degree of accuracy. Having an accurate measure of consumer attitudestowards various business situations and marketing mix variables saves companiesfrom committing huge sums to business activities that do not add value to cus-tomers or stakeholders.
In this chapter, we will discuss the components of attitude, the definition ofscaling and different types of single item scales and multi-item scales. The chapterconcludes with a discussion on considerations for selecting an appropriate scale.
4.5 Sources of Measurement Problems 121
4.7 Components of Attitude
Attitude has three components—the cognitive, the affective and the behaviouralcomponents. If a person says that he loves Britannia biscuits because they aretastier and will always eat them, the statement comprises all these three compo-nents of an attitude. Firms usually study components of attitudes in consumers toimprove their marketing communications to attract customers and to develop acompetitive advantage. Let us now elaborate these components.
4.7.1 Cognitive Component
The knowledge and perceptions acquired by a combination of direct experiencewith the attitude object and related information from various sources are based oncognition of an individual. This is termed cognitive component. Such knowledgein a person commonly leads to a belief that a particular type of behaviour leads to aparticular outcome. The cognitive component of attitude consists of beliefs,opinions, knowledge and information held by a person regarding an object or anissue. The knowledge comprises awareness about the existence of the object, beliefabout its different characteristics and features of the product, apart from the rel-ative importance the person gives to each characteristic.
Let us give an illustration. Anand, a businessman, is planning to travel to Delhifrom Hyderabad by air. He remembers the names of several carriers, which he canuse, such as Indian Airlines, Jet Airways, Air Deccan and so on. This is hisknowledge about the existence of an object. This knowledge is not just confined toawareness. Anand will have certain beliefs about each airline based on his personalexperience or through experiences of relatives and friends, knowledge gainedthrough advertisements, books, magazines etc. This constitutes beliefs about dif-ferent features of the object. Anand may also feel that the service in IndianAirlines is superior to Air Deccan. This is called placing relative importance.Anand’s beliefs may not be entirely accurate, but to him, they are facts. Once thesepositive beliefs increase, they give rise to a favourable cognitive componenttowards an object. Marketers use various marketing mix variables to attract thecustomer and overtime try to nurture positive beliefs about their products andservices in the minds of customers.
4.7.2 Affective Component
A person’s emotions or feelings towards an object comprise the affective com-ponent of an attitude. Researchers treat such feelings of individuals as theirfavourable or unfavourable assessment of an object. Such feelings, which are
122 4 Scales and Measurement
called the affective component of attitude, may transform themselves into emo-tionally charged states such as anger, happiness, shame, distress, guilt and so on.These types of experiences will influence one’s perception of an object and thatperson’s later behaviour. For instance, a woman might say that she loves shoppingat Lifestyle and that Shoppers’ Stop does not have as wide a range of apparel asLifestyle does. The woman’s overall emotional feelings form the affective com-ponent. It is important to note that two persons may share a cognitive component,but when it comes to the affective component, one may have a positive affectivecomponent and the other a negative affective component towards the same object.
4.7.3 Behavioural Component
The behavioural component comprises a person’s future actions and intentions. Itis concerned with the likelihood or tendency that an individual will behave in aparticular fashion with regard to an attitude object. Going back to our previousexample, if Anand wants to fly Indian Airlines in the future too or the lady wants tobuy clothes from Lifestyle in her next shopping excursion too, these are thebehavioural components of attitude. These intentions, however, have limitedtimeframes. Sometimes suggestions become a behavioural component. Forinstance, when an individual suggests that a friend travel by Indian Airlines, it is abehavioural component of that individuals’ attitude.
4.8 Relationship Between Attitudes and Behaviour
It is difficult to analyse the relationship between attitudes and behaviour. Ana-lysing the future behaviour of a group of people is relatively easier than analysisfor a single individual. Researchers have discovered that there are certain criticalaspects governing the attitudes and behaviour of consumers. They are:
1. A product or service usage will be maximum if the person develops a positiveattitude towards it. The converse is also true.
2. Attitudes of consumers towards products that they have never tried will beneutral.
3. When attitudes are developed based on actual trial and experience of a product,attitudes predict behaviour effectively. On the other hand, when attitudes arebased on advertising, consistency in attitude and behaviour is considerablyreduced.
4.7 Components of Attitude 123
4.9 Changing Attitudes
Changing customer attitudes, and changing them positively towards a companyand its products, is the most important activity of businesses across the worldtoday. Whenever sales of a product fall or market share declines, it becomesimperative for marketers to identify ways and means to overcome the downturn.Changing attitudes of stakeholders becomes the top priority in company’s devel-opment efforts. Companies can attempt to change the attitudes of customers (animportant stakeholder) towards a product in three ways:
• Altering existing beliefs about a product• Changing attitudes by changing the importance of beliefs• Adding new beliefs.
4.9.1 Altering Existing Beliefs About a Product
A marketer’s fundamental responsibility here is to convert the neutral or negativebelief that a customer holds about the product into a positive belief. For this, themarketer may attempt to change consumer perceptions about the product or ser-vice. Several tactics can be used. For instance, petrol stations have long beenviewed as dusty, poorly lit places where weary petrol pump service personneldressed shabbily serve. This perception or belief has been entirely changed byBPCL, which, by branding petroleum products and developing petrol stations intoshopping malls (like in Western countries) has changed existing beliefs aboutpetrol stations. BPCL’s strategy is discussed in Exhibit 4.4.
However, marketers need to understand that customer beliefs cannot be chan-ged by advertising alone. Any change achieved cannot be sustained if there is notangible quality in the product to support advertising claims. Second, marketerstrying to change consumer beliefs should ensure that the change is incrementalrather than drastic. For example, an aggressive advertising campaign aimed atchanging traditional beliefs of a community may meet with customer resistance.Therefore, the change process should be slow and preferably take the customerthrough all the stages in the learning process.
Exhibit 4.4: Bharat Petroleum’s Efforts to Change Face
Petrol pumps in India have come a long way from being dusty, poorly lit placesmanned by shabbily clothed and indifferent personnel, to the shopping malls ofthe early twenty-first century. Bharat Petroleum Corporation Ltd. (BPCL), aleading player in the Indian petroleum industry, has got wide acclaim for havingbrought about this change in the fuel retailing business.
124 4 Scales and Measurement
4.9.2 Changing Attitudes by Changing the Importanceof Beliefs
Another strategy is to change customer attitudes by changing the importance ofbeliefs that a customer holds about a particular product feature. For example, whenKelloggs entered India, it faced a lot of problems initially to sell its products, as aconsequence of which it tried to change the people’s attitude towards its products.This resulted in significantly improving its sales. Exhibit 4.5 discusses the reposi-tioning strategy of Kelloggs’ for changing customers’ attitude towards the product.
4.9.3 Adding New Beliefs
An altogether different strategy adopted by marketers for changing customer atti-tudes is to develop new beliefs in customers about products. Adding new beliefs isan important job for marketers. Once such new beliefs are clearly communicated toconsumers, there is a likelihood of higher sales since customers who previously didnot bother to buy a product may now choose to buy it. For instance, traditionally,salt has been promoted on the taste attribute. Tata promoted salt with iodine content
With the deregulation of the oil industry in April 2002, Indian players realizedthe need to become more customer focussed. BPCL’s pioneering efforts to createbrand awareness for its products were thus welcomed. BPCL’s first foray intopetrol pump retailing was through Bharat Shell Ltd. (Shell). The store, offeringeatables, soft drinks, stationery, newspapers, magazines, frozen foods, lightbulbs, audio cassettes and CDs, came as a pleasant surprise to Indian consumers.
By July 1999, 35 of BPCL’s retail outlets across the country had ‘Bazaar’stores running successfully. In October 2000, BPCL introduced another revo-lutionary concept by launching a McDonald’s fast food outlet at a petrol pumpnear Mathura (UP) on the Delhi–Agra highway. The 4,000 sq.ft., 180-seatoutlet was set up at a cost of Rs 40 million. McDonald’s paid a fixed rent,besides a percentage of its sales to BPCL for using the facility. The outlet wasexpected to pull in foreign and domestic tourists headed to and from Agra,besides residents of surrounding areas.
In January 2001, BPCL further upgraded the ‘Bazaar’ stores and, a monthlater, launched the ‘In and Out’ stores at around 40 outlets in Bangalore,Mumbai, Delhi, Kolkata and Chennai. To offer enhanced customer service,BPCL tied up with various companies from different industries. These includedfast food, photography, music, financial services, ISPs, e-commerce portals,document centers, ticketing, greeting cards, ATMs and courier services. Allthese efforts have helped BPCL significantly in changing customer beliefs.
4.9 Changing Attitudes 125
as essential for health (Iodine helps the growth, development and functioning of thethyroid gland), thus completely changing common beliefs about salt.
4.10 Association Between Measurement of Beliefsand Situation
It is generally found that there is a lesser relationship between researchers’ mea-surements and the actual prevailing situation. In other words, the match betweenwhat the researcher finds and what actually happens is low owing to a number ofreasons. For projecting a favourable attitude towards a product, a respondent shouldfirst have a felt need for the product. For instance, a respondent should need a car;
Exhibit 4.5: Kellogg’s Repositioning Strategy
Kellogg’s started its India operations in September 1995. Its initial offeringswere cornflakes, wheat flakes and Basmati rice flakes. Later, it introduced thebreakfast cereals Chocos and Frosties. Despite good quality products and sup-port from the parent company’s technical, managerial and financial resources,Kellogg’s products failed in the Indian market. Kellogg realized that it was atough task to get Indian consumers to accept its products. Kellogg bankedheavily on the quality of its crispy flakes. But pouring hot milk on the flakesmade them soggy. As Indians boil their milk before drinking, unlike in the West,the milk was usually warm or lukewarm. Americans often use cold milk forcereals, retaining their crispness. Indians also like to add sugar to their milk.When Kellogg flakes were put in hot milk, they became soggy and did not tastegood. In cold milk, it was not sweet enough for Indian tastes because the sugardid not dissolve easily in cold milk. The rice and wheat versions too did not dowell. In fact, some consumers even referred to the rice flakes as rice corn flakes.
Kellogg’s began working towards better positioning for its products. Thecompany’s research showed that the average Indian consumer did not givemuch importance to the level of iron and vitamin intake and looked at quantity,rather than quality, of food consumed. Kellogg’s worked towards changing thepositioning of Chocos and Frosties—which had not been placed on the healthplatform but had been projected instead as ‘fun-filled’ brands.
In 1995, Kellogg had a 53 % share of the Rs 150 million breakfast cerealmarket, which had been growing at 4-5 % per annum till then. By 2000, themarket size was Rs 600 million, and Kellogg’s share increased to 65 %.Analysts claimed that Kellogg’ entry was responsible for this growth. Thecompany’s improved prospects were clearly attributed to the shift in posi-tioning, increased promotion and an enhanced media budget. The effort todevelop products specifically for the Indian market helped Kellogg makesignificant inroads into the Indian market.
126 4 Scales and Measurement
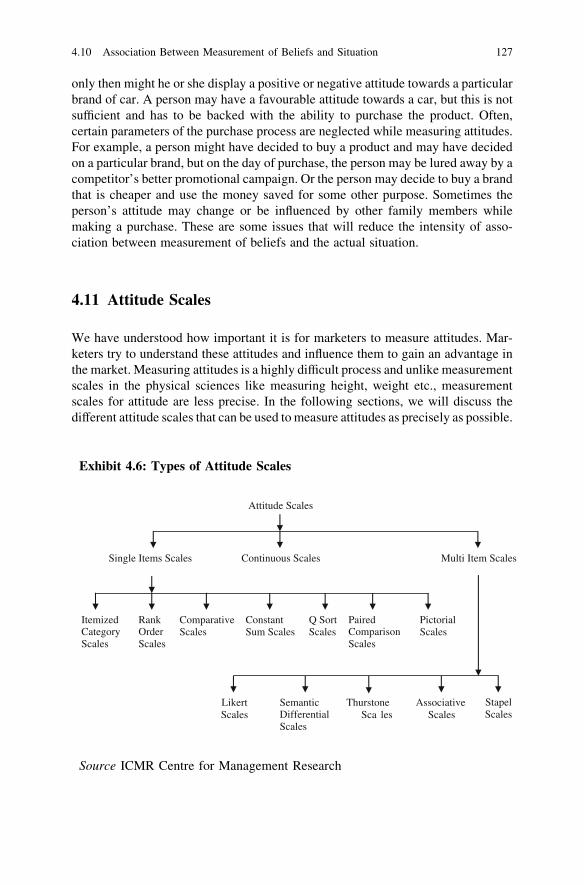
only then might he or she display a positive or negative attitude towards a particularbrand of car. A person may have a favourable attitude towards a car, but this is notsufficient and has to be backed with the ability to purchase the product. Often,certain parameters of the purchase process are neglected while measuring attitudes.For example, a person might have decided to buy a product and may have decidedon a particular brand, but on the day of purchase, the person may be lured away by acompetitor’s better promotional campaign. Or the person may decide to buy a brandthat is cheaper and use the money saved for some other purpose. Sometimes theperson’s attitude may change or be influenced by other family members whilemaking a purchase. These are some issues that will reduce the intensity of asso-ciation between measurement of beliefs and the actual situation.
4.11 Attitude Scales
We have understood how important it is for marketers to measure attitudes. Mar-keters try to understand these attitudes and influence them to gain an advantage inthe market. Measuring attitudes is a highly difficult process and unlike measurementscales in the physical sciences like measuring height, weight etc., measurementscales for attitude are less precise. In the following sections, we will discuss thedifferent attitude scales that can be used to measure attitudes as precisely as possible.
Exhibit 4.6: Types of Attitude Scales
Attitude Scales
Single Items Scales Continuous Scales Multi Item Scales
Itemized Category Scales
Rank OrderScales
ComparativeScales
Constant Sum Scales
Q Sort Scales
Paired Comparison Scales
Pictorial Scales
LikertScales
Semantic Differential Scales
Thurstone Sca les
Associative Scales
StapelScales
Source ICMR Centre for Management Research
4.10 Association Between Measurement of Beliefs and Situation 127
4.12 Definition of Attitude Scale and Scaling
An Attitude Scale is a set of items (questions or statements) that probe a singleaspect of human behaviour, attitudes, or feelings. Scaling is the process of mea-suring quantitative aspects of subjective or abstract concepts. It is a method toassign numbers or symbols to some attributes of an object. Scaling involvesdeveloping a continuum, based on which measured objects are located. Forinstance, if we want to measure the satisfaction levels of customers using aproduct, we might develop a six-point scale where respondents can choose one ifthey are least satisfied, three if they are moderately satisfied and six if they arehighly satisfied. Scales are uni-dimensional or multi-dimensional. The former, asthe name suggests, is used to measure one particular attribute of an object. Forinstance, while using a scale for measuring customer satisfaction levels, althoughseveral items will contribute to the measurement, these will be combined to givethe final rating on customer satisfaction. A multi-dimensional scale is used tomeasure several attributes of an object, for example work environment, interper-sonal relations, and behaviour of top management and compensation procedures.These will all be measured to determine the motivational levels of employees in anorganization.
4.13 Types of Attitude Scales
There are two major types of scales used to measure the attitudes of respondents.They are single item scales and multi-item scales. The different types are shown inExhibit 4.6
4.13.1 Single-Item Scales
Single-item scales are those with only one item to measure. Itemized categoryscales are most commonly used under single-item scales. Besides, itemized cat-egory scales, there are several other scales such as comparative scales, rank orderscales and so on, which are used for attitude measurement. We will discuss each ofthese in the following sections.
4.13.2 Itemized Category Scales
Itemized category scales are those in which respondents have to select an answerfrom a limited number of ordered categories. Respondents are given the scale that
128 4 Scales and Measurement
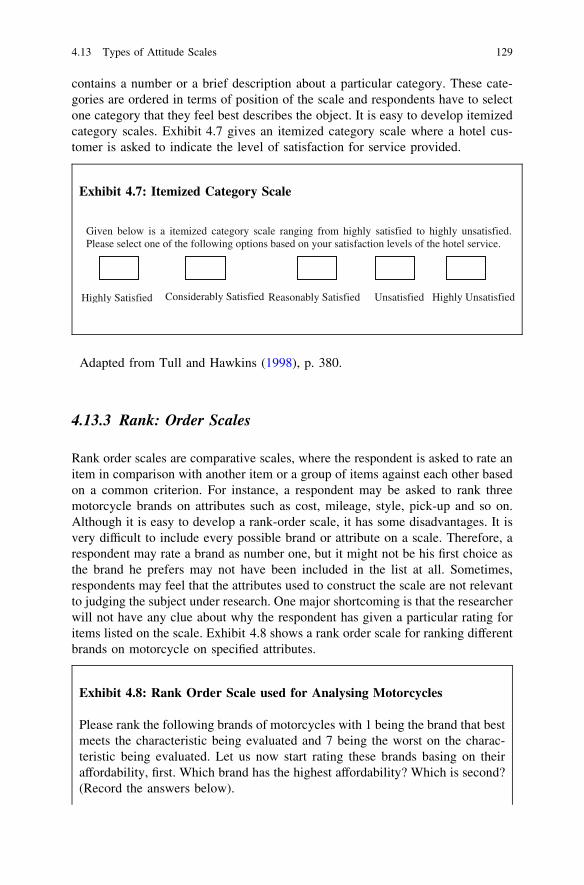
contains a number or a brief description about a particular category. These cate-gories are ordered in terms of position of the scale and respondents have to selectone category that they feel best describes the object. It is easy to develop itemizedcategory scales. Exhibit 4.7 gives an itemized category scale where a hotel cus-tomer is asked to indicate the level of satisfaction for service provided.
Adapted from Tull and Hawkins (1998), p. 380.
4.13.3 Rank: Order Scales
Rank order scales are comparative scales, where the respondent is asked to rate anitem in comparison with another item or a group of items against each other basedon a common criterion. For instance, a respondent may be asked to rank threemotorcycle brands on attributes such as cost, mileage, style, pick-up and so on.Although it is easy to develop a rank-order scale, it has some disadvantages. It isvery difficult to include every possible brand or attribute on a scale. Therefore, arespondent may rate a brand as number one, but it might not be his first choice asthe brand he prefers may not have been included in the list at all. Sometimes,respondents may feel that the attributes used to construct the scale are not relevantto judging the subject under research. One major shortcoming is that the researcherwill not have any clue about why the respondent has given a particular rating foritems listed on the scale. Exhibit 4.8 shows a rank order scale for ranking differentbrands on motorcycle on specified attributes.
Exhibit 4.7: Itemized Category Scale
Highly Satisfied Considerably Satisfied Reasonably Satisfied Unsatisfied Highly Unsatisfied
Given below is a itemized category scale ranging from highly satisfied to highly unsatisfied. Please select one of the following options based on your satisfaction levels of the hotel service.
Exhibit 4.8: Rank Order Scale used for Analysing Motorcycles
Please rank the following brands of motorcycles with 1 being the brand that bestmeets the characteristic being evaluated and 7 being the worst on the charac-teristic being evaluated. Let us now start rating these brands basing on theiraffordability, first. Which brand has the highest affordability? Which is second?(Record the answers below).
4.13 Types of Attitude Scales 129
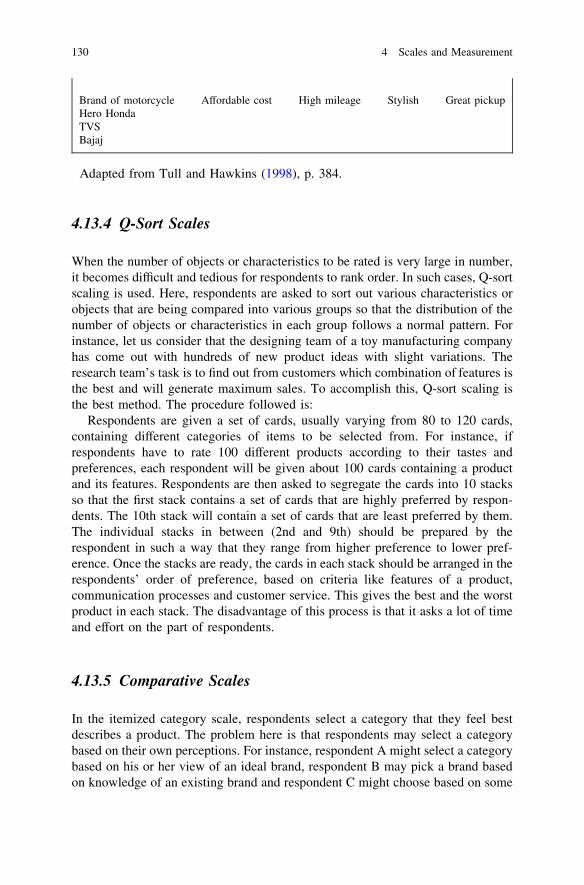
Adapted from Tull and Hawkins (1998), p. 384.
4.13.4 Q-Sort Scales
When the number of objects or characteristics to be rated is very large in number,it becomes difficult and tedious for respondents to rank order. In such cases, Q-sortscaling is used. Here, respondents are asked to sort out various characteristics orobjects that are being compared into various groups so that the distribution of thenumber of objects or characteristics in each group follows a normal pattern. Forinstance, let us consider that the designing team of a toy manufacturing companyhas come out with hundreds of new product ideas with slight variations. Theresearch team’s task is to find out from customers which combination of features isthe best and will generate maximum sales. To accomplish this, Q-sort scaling isthe best method. The procedure followed is:
Respondents are given a set of cards, usually varying from 80 to 120 cards,containing different categories of items to be selected from. For instance, ifrespondents have to rate 100 different products according to their tastes andpreferences, each respondent will be given about 100 cards containing a productand its features. Respondents are then asked to segregate the cards into 10 stacksso that the first stack contains a set of cards that are highly preferred by respon-dents. The 10th stack will contain a set of cards that are least preferred by them.The individual stacks in between (2nd and 9th) should be prepared by therespondent in such a way that they range from higher preference to lower pref-erence. Once the stacks are ready, the cards in each stack should be arranged in therespondents’ order of preference, based on criteria like features of a product,communication processes and customer service. This gives the best and the worstproduct in each stack. The disadvantage of this process is that it asks a lot of timeand effort on the part of respondents.
4.13.5 Comparative Scales
In the itemized category scale, respondents select a category that they feel bestdescribes a product. The problem here is that respondents may select a categorybased on their own perceptions. For instance, respondent A might select a categorybased on his or her view of an ideal brand, respondent B may pick a brand basedon knowledge of an existing brand and respondent C might choose based on some
Brand of motorcycle Affordable cost High mileage Stylish Great pickupHero HondaTVSBajaj
130 4 Scales and Measurement
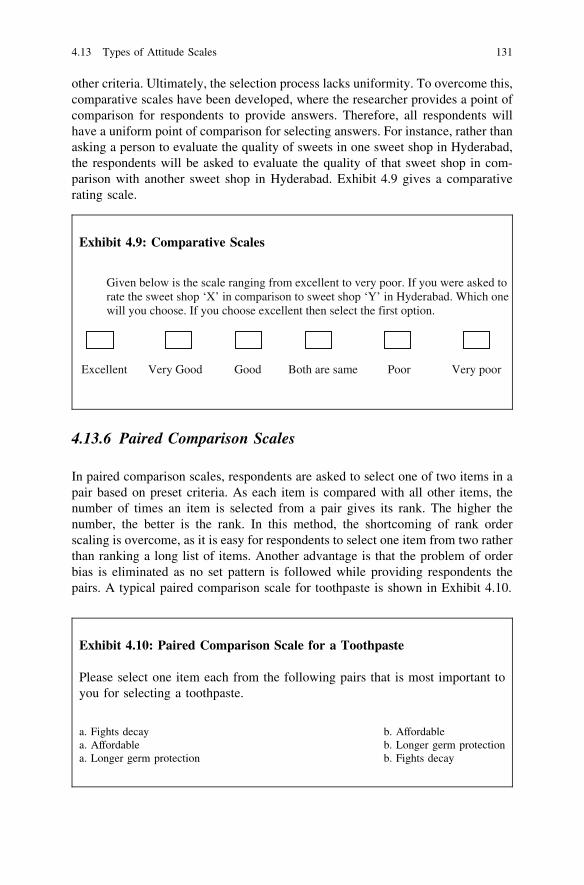
other criteria. Ultimately, the selection process lacks uniformity. To overcome this,comparative scales have been developed, where the researcher provides a point ofcomparison for respondents to provide answers. Therefore, all respondents willhave a uniform point of comparison for selecting answers. For instance, rather thanasking a person to evaluate the quality of sweets in one sweet shop in Hyderabad,the respondents will be asked to evaluate the quality of that sweet shop in com-parison with another sweet shop in Hyderabad. Exhibit 4.9 gives a comparativerating scale.
4.13.6 Paired Comparison Scales
In paired comparison scales, respondents are asked to select one of two items in apair based on preset criteria. As each item is compared with all other items, thenumber of times an item is selected from a pair gives its rank. The higher thenumber, the better is the rank. In this method, the shortcoming of rank orderscaling is overcome, as it is easy for respondents to select one item from two ratherthan ranking a long list of items. Another advantage is that the problem of orderbias is eliminated as no set pattern is followed while providing respondents thepairs. A typical paired comparison scale for toothpaste is shown in Exhibit 4.10.
Exhibit 4.9: Comparative Scales
Excellent Very Good Good Both are same Poor Very poor
Given below is the scale ranging from excellent to very poor. If you were asked to rate the sweet shop ‘X’ in comparison to sweet shop ‘Y’ in Hyderabad. Which one will you choose. If you choose excellent then select the first option.
Exhibit 4.10: Paired Comparison Scale for a Toothpaste
Please select one item each from the following pairs that is most important toyou for selecting a toothpaste.
a. Fights decay b. Affordablea. Affordable b. Longer germ protectiona. Longer germ protection b. Fights decay
4.13 Types of Attitude Scales 131
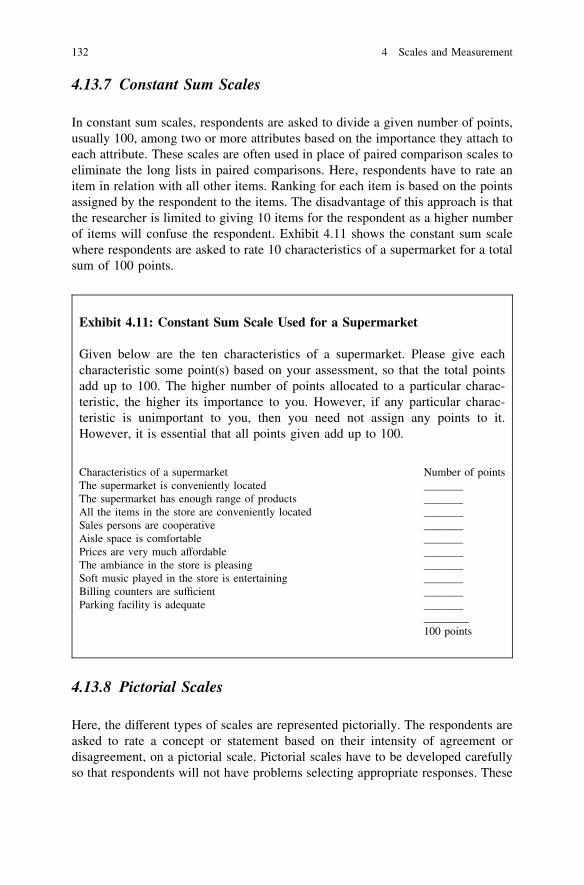
4.13.7 Constant Sum Scales
In constant sum scales, respondents are asked to divide a given number of points,usually 100, among two or more attributes based on the importance they attach toeach attribute. These scales are often used in place of paired comparison scales toeliminate the long lists in paired comparisons. Here, respondents have to rate anitem in relation with all other items. Ranking for each item is based on the pointsassigned by the respondent to the items. The disadvantage of this approach is thatthe researcher is limited to giving 10 items for the respondent as a higher numberof items will confuse the respondent. Exhibit 4.11 shows the constant sum scalewhere respondents are asked to rate 10 characteristics of a supermarket for a totalsum of 100 points.
4.13.8 Pictorial Scales
Here, the different types of scales are represented pictorially. The respondents areasked to rate a concept or statement based on their intensity of agreement ordisagreement, on a pictorial scale. Pictorial scales have to be developed carefullyso that respondents will not have problems selecting appropriate responses. These
Exhibit 4.11: Constant Sum Scale Used for a Supermarket
Given below are the ten characteristics of a supermarket. Please give eachcharacteristic some point(s) based on your assessment, so that the total pointsadd up to 100. The higher number of points allocated to a particular charac-teristic, the higher its importance to you. However, if any particular charac-teristic is unimportant to you, then you need not assign any points to it.However, it is essential that all points given add up to 100.
Characteristics of a supermarket Number of pointsThe supermarket is conveniently located _______The supermarket has enough range of products _______All the items in the store are conveniently located _______Sales persons are cooperative _______Aisle space is comfortable _______Prices are very much affordable _______The ambiance in the store is pleasing _______Soft music played in the store is entertaining _______Billing counters are sufficient _______Parking facility is adequate _______
________100 points
132 4 Scales and Measurement
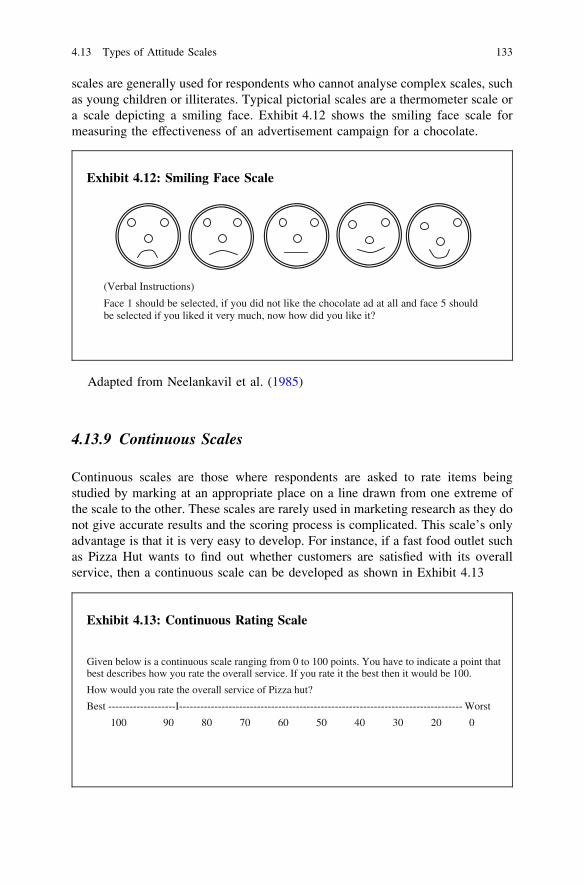
scales are generally used for respondents who cannot analyse complex scales, suchas young children or illiterates. Typical pictorial scales are a thermometer scale ora scale depicting a smiling face. Exhibit 4.12 shows the smiling face scale formeasuring the effectiveness of an advertisement campaign for a chocolate.
Adapted from Neelankavil et al. (1985)
4.13.9 Continuous Scales
Continuous scales are those where respondents are asked to rate items beingstudied by marking at an appropriate place on a line drawn from one extreme ofthe scale to the other. These scales are rarely used in marketing research as they donot give accurate results and the scoring process is complicated. This scale’s onlyadvantage is that it is very easy to develop. For instance, if a fast food outlet suchas Pizza Hut wants to find out whether customers are satisfied with its overallservice, then a continuous scale can be developed as shown in Exhibit 4.13
Exhibit 4.12: Smiling Face Scale
(Verbal Instructions)
Face 1 should be selected, if you did not like the chocolate ad at all and face 5 should be selected if you liked it very much, now how did you like it?
Exhibit 4.13: Continuous Rating Scale
Given below is a continuous scale ranging from 0 to 100 points. You have to indicate a point that best describes how you rate the overall service. If you rate it the best then it would be 100.
How would you rate the overall service of Pizza hut?
Best -------------------I-------------------------------------------------------------------------------- Worst
100 90 80 70 60 50 40 30 20 0
4.13 Types of Attitude Scales 133
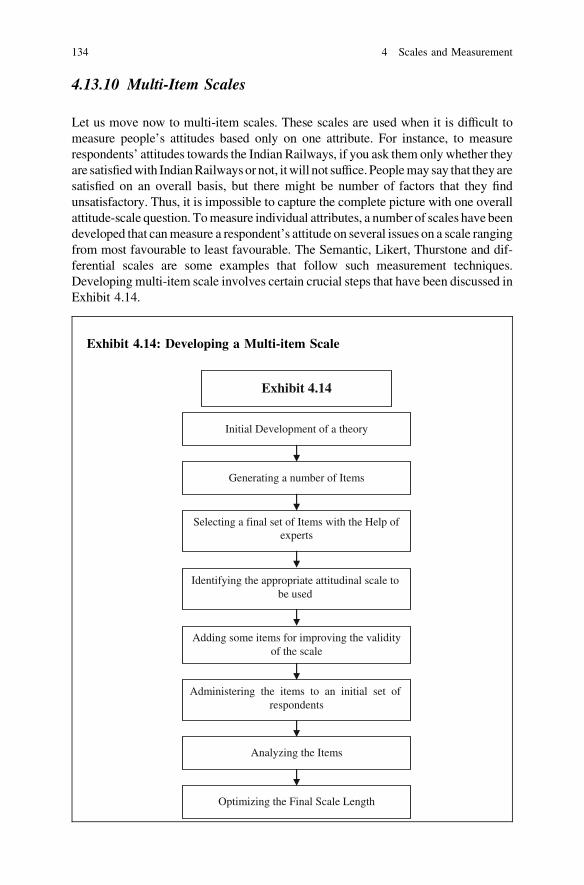
4.13.10 Multi-Item Scales
Let us move now to multi-item scales. These scales are used when it is difficult tomeasure people’s attitudes based only on one attribute. For instance, to measurerespondents’ attitudes towards the Indian Railways, if you ask them only whether theyare satisfied with Indian Railways or not, it will not suffice. People may say that they aresatisfied on an overall basis, but there might be number of factors that they findunsatisfactory. Thus, it is impossible to capture the complete picture with one overallattitude-scale question. To measure individual attributes, a number of scales have beendeveloped that can measure a respondent’s attitude on several issues on a scale rangingfrom most favourable to least favourable. The Semantic, Likert, Thurstone and dif-ferential scales are some examples that follow such measurement techniques.Developing multi-item scale involves certain crucial steps that have been discussed inExhibit 4.14.
Exhibit 4.14: Developing a Multi-item Scale
Initial Development of a theory
Generating a number of Items
Selecting a final set of Items with the Help ofexperts
Adding some items for improving the validityof the scale
Administering the items to an initial set of respondents
Analyzing the Items
Optimizing the Final Scale Length
Identifying the appropriate attitudinal scale to be used
Exhibit 4.14
134 4 Scales and Measurement
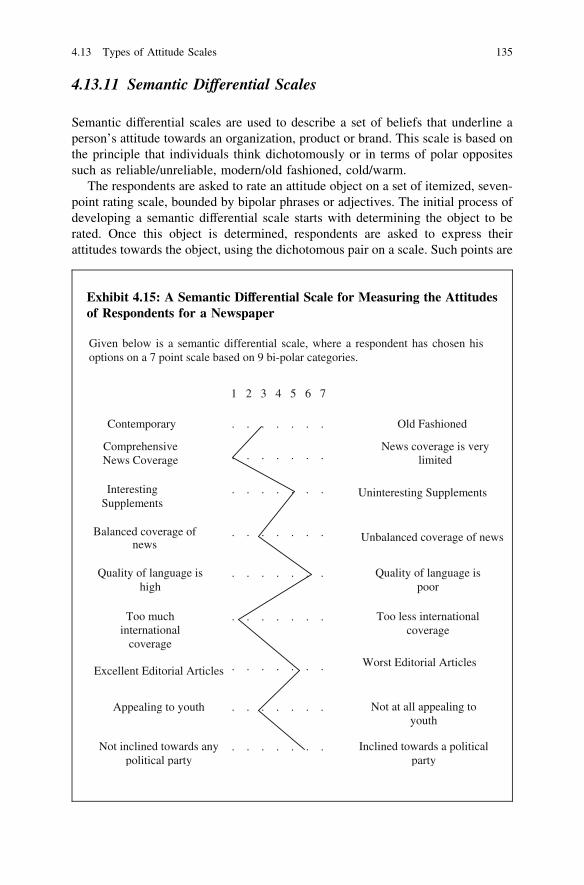
4.13.11 Semantic Differential Scales
Semantic differential scales are used to describe a set of beliefs that underline aperson’s attitude towards an organization, product or brand. This scale is based onthe principle that individuals think dichotomously or in terms of polar oppositessuch as reliable/unreliable, modern/old fashioned, cold/warm.
The respondents are asked to rate an attitude object on a set of itemized, seven-point rating scale, bounded by bipolar phrases or adjectives. The initial process ofdeveloping a semantic differential scale starts with determining the object to berated. Once this object is determined, respondents are asked to express theirattitudes towards the object, using the dichotomous pair on a scale. Such points are
Exhibit 4.15: A Semantic Differential Scale for Measuring the Attitudesof Respondents for a Newspaper
1 2 3 4 5 6 7
Contemporary Old Fashioned
Comprehensive News Coverage
News coverage is very limited
Interesting Supplements
Uninteresting Supplements
Balanced coverage of news
. . . . . . .
. . . . . . .
. . . . . . .
. . . . . . . Unbalanced coverage of news
Quality of language is high
. . . . . . . Quality of language is poor
Too much international
coverage
. . . . . . . Too less international coverage
Excellent Editorial Articles . . . . . . . Worst Editorial Articles
Appealing to youth . . . . . . . Not at all appealing to youth
Not inclined towards any political party
. . . . . . . Inclined towards a political party
Given below is a semantic differential scale, where a respondent has chosen his options on a 7 point scale based on 9 bi-polar categories.
4.13 Types of Attitude Scales 135
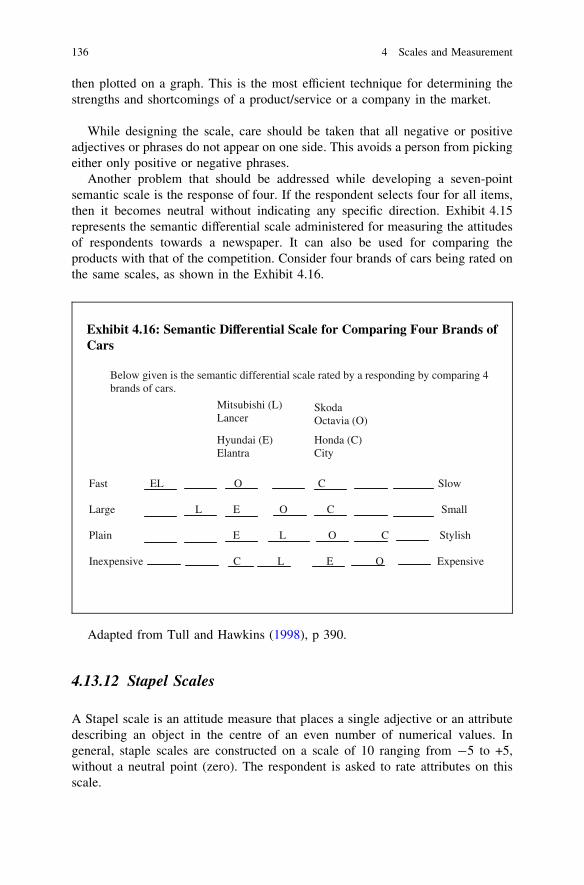
then plotted on a graph. This is the most efficient technique for determining thestrengths and shortcomings of a product/service or a company in the market.
While designing the scale, care should be taken that all negative or positiveadjectives or phrases do not appear on one side. This avoids a person from pickingeither only positive or negative phrases.
Another problem that should be addressed while developing a seven-pointsemantic scale is the response of four. If the respondent selects four for all items,then it becomes neutral without indicating any specific direction. Exhibit 4.15represents the semantic differential scale administered for measuring the attitudesof respondents towards a newspaper. It can also be used for comparing theproducts with that of the competition. Consider four brands of cars being rated onthe same scales, as shown in the Exhibit 4.16.
Adapted from Tull and Hawkins (1998), p 390.
4.13.12 Stapel Scales
A Stapel scale is an attitude measure that places a single adjective or an attributedescribing an object in the centre of an even number of numerical values. Ingeneral, staple scales are constructed on a scale of 10 ranging from -5 to +5,without a neutral point (zero). The respondent is asked to rate attributes on thisscale.
Exhibit 4.16: Semantic Differential Scale for Comparing Four Brands ofCars
Below given is the semantic differential scale rated by a responding by comparing 4 brands of cars.
Mitsubishi (L)Lancer
Hyundai (E) Elantra
Skoda Octavia (O)
Honda (C)City
Fast EL O C Slow
Large L E O C Small
Plain E L O C Stylish
Inexpensive C L E O Expensive
136 4 Scales and Measurement
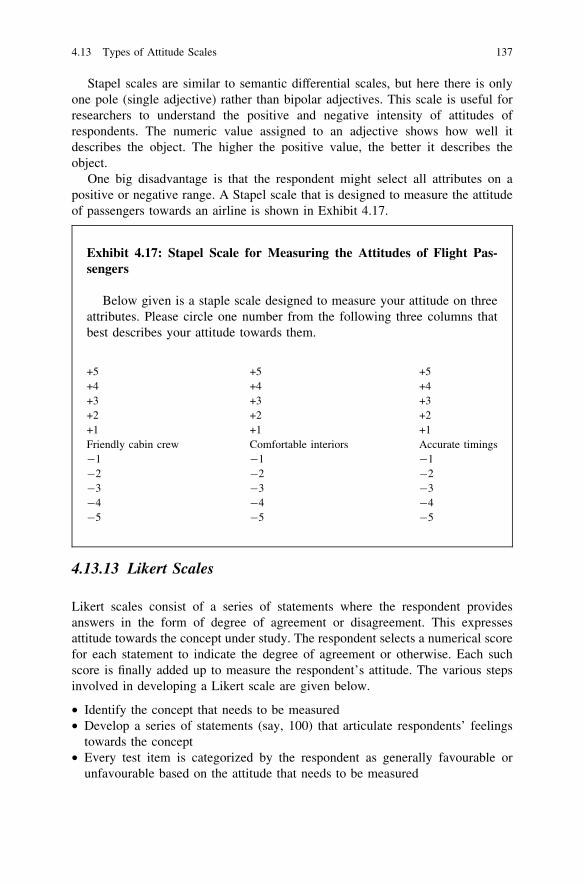
Stapel scales are similar to semantic differential scales, but here there is onlyone pole (single adjective) rather than bipolar adjectives. This scale is useful forresearchers to understand the positive and negative intensity of attitudes ofrespondents. The numeric value assigned to an adjective shows how well itdescribes the object. The higher the positive value, the better it describes theobject.
One big disadvantage is that the respondent might select all attributes on apositive or negative range. A Stapel scale that is designed to measure the attitudeof passengers towards an airline is shown in Exhibit 4.17.
4.13.13 Likert Scales
Likert scales consist of a series of statements where the respondent providesanswers in the form of degree of agreement or disagreement. This expressesattitude towards the concept under study. The respondent selects a numerical scorefor each statement to indicate the degree of agreement or otherwise. Each suchscore is finally added up to measure the respondent’s attitude. The various stepsinvolved in developing a Likert scale are given below.
• Identify the concept that needs to be measured• Develop a series of statements (say, 100) that articulate respondents’ feelings
towards the concept• Every test item is categorized by the respondent as generally favourable or
unfavourable based on the attitude that needs to be measured
Exhibit 4.17: Stapel Scale for Measuring the Attitudes of Flight Pas-sengers
Below given is a staple scale designed to measure your attitude on threeattributes. Please circle one number from the following three columns thatbest describes your attitude towards them.
+5 +5 +5+4 +4 +4+3 +3 +3+2 +2 +2+1 +1 +1Friendly cabin crew Comfortable interiors Accurate timings-1 -1 -1-2 -2 -2-3 -3 -3-4 -4 -4-5 -5 -5
4.13 Types of Attitude Scales 137
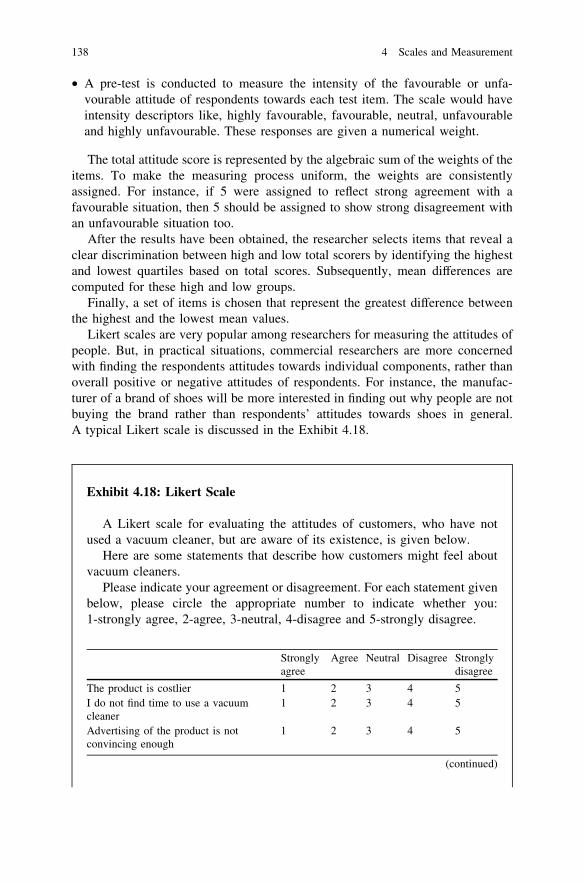
• A pre-test is conducted to measure the intensity of the favourable or unfa-vourable attitude of respondents towards each test item. The scale would haveintensity descriptors like, highly favourable, favourable, neutral, unfavourableand highly unfavourable. These responses are given a numerical weight.
The total attitude score is represented by the algebraic sum of the weights of theitems. To make the measuring process uniform, the weights are consistentlyassigned. For instance, if 5 were assigned to reflect strong agreement with afavourable situation, then 5 should be assigned to show strong disagreement withan unfavourable situation too.
After the results have been obtained, the researcher selects items that reveal aclear discrimination between high and low total scorers by identifying the highestand lowest quartiles based on total scores. Subsequently, mean differences arecomputed for these high and low groups.
Finally, a set of items is chosen that represent the greatest difference betweenthe highest and the lowest mean values.
Likert scales are very popular among researchers for measuring the attitudes ofpeople. But, in practical situations, commercial researchers are more concernedwith finding the respondents attitudes towards individual components, rather thanoverall positive or negative attitudes of respondents. For instance, the manufac-turer of a brand of shoes will be more interested in finding out why people are notbuying the brand rather than respondents’ attitudes towards shoes in general.A typical Likert scale is discussed in the Exhibit 4.18.
Exhibit 4.18: Likert Scale
A Likert scale for evaluating the attitudes of customers, who have notused a vacuum cleaner, but are aware of its existence, is given below.
Here are some statements that describe how customers might feel aboutvacuum cleaners.
Please indicate your agreement or disagreement. For each statement givenbelow, please circle the appropriate number to indicate whether you:1-strongly agree, 2-agree, 3-neutral, 4-disagree and 5-strongly disagree.
Stronglyagree
Agree Neutral Disagree Stronglydisagree
The product is costlier 1 2 3 4 5I do not find time to use a vacuumcleaner
1 2 3 4 5
Advertising of the product is notconvincing enough
1 2 3 4 5
(continued)
138 4 Scales and Measurement
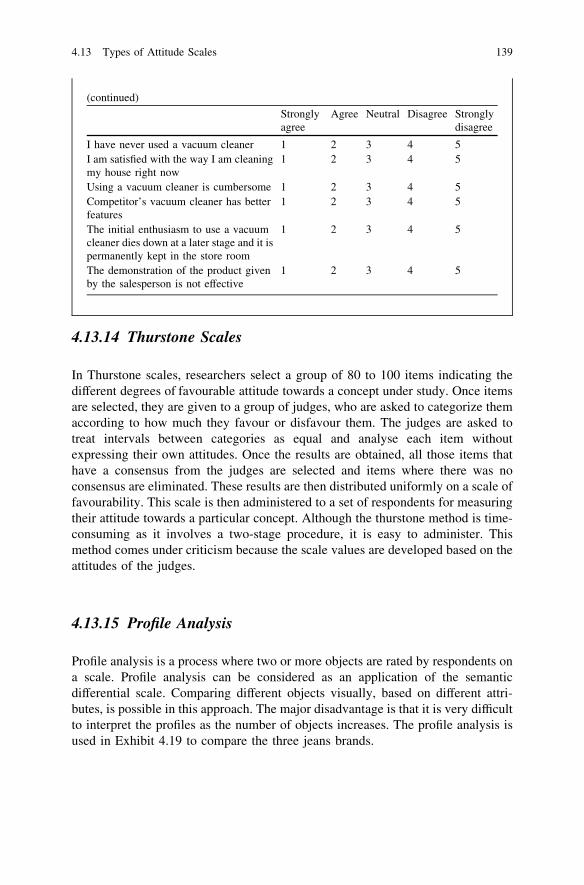
4.13.14 Thurstone Scales
In Thurstone scales, researchers select a group of 80 to 100 items indicating thedifferent degrees of favourable attitude towards a concept under study. Once itemsare selected, they are given to a group of judges, who are asked to categorize themaccording to how much they favour or disfavour them. The judges are asked totreat intervals between categories as equal and analyse each item withoutexpressing their own attitudes. Once the results are obtained, all those items thathave a consensus from the judges are selected and items where there was noconsensus are eliminated. These results are then distributed uniformly on a scale offavourability. This scale is then administered to a set of respondents for measuringtheir attitude towards a particular concept. Although the thurstone method is time-consuming as it involves a two-stage procedure, it is easy to administer. Thismethod comes under criticism because the scale values are developed based on theattitudes of the judges.
4.13.15 Profile Analysis
Profile analysis is a process where two or more objects are rated by respondents ona scale. Profile analysis can be considered as an application of the semanticdifferential scale. Comparing different objects visually, based on different attri-butes, is possible in this approach. The major disadvantage is that it is very difficultto interpret the profiles as the number of objects increases. The profile analysis isused in Exhibit 4.19 to compare the three jeans brands.
(continued)
Stronglyagree
Agree Neutral Disagree Stronglydisagree
I have never used a vacuum cleaner 1 2 3 4 5I am satisfied with the way I am cleaningmy house right now
1 2 3 4 5
Using a vacuum cleaner is cumbersome 1 2 3 4 5Competitor’s vacuum cleaner has betterfeatures
1 2 3 4 5
The initial enthusiasm to use a vacuumcleaner dies down at a later stage and it ispermanently kept in the store room
1 2 3 4 5
The demonstration of the product givenby the salesperson is not effective
1 2 3 4 5
4.13 Types of Attitude Scales 139
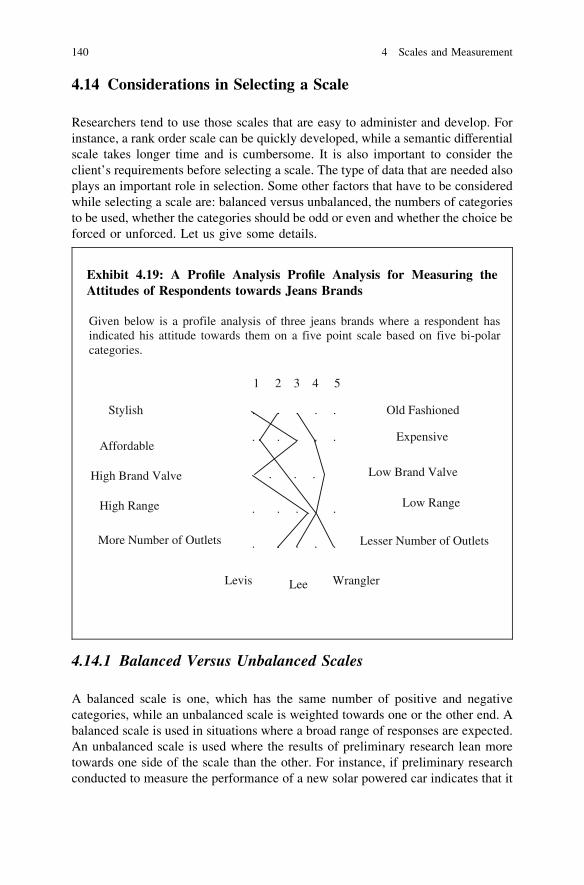
4.14 Considerations in Selecting a Scale
Researchers tend to use those scales that are easy to administer and develop. Forinstance, a rank order scale can be quickly developed, while a semantic differentialscale takes longer time and is cumbersome. It is also important to consider theclient’s requirements before selecting a scale. The type of data that are needed alsoplays an important role in selection. Some other factors that have to be consideredwhile selecting a scale are: balanced versus unbalanced, the numbers of categoriesto be used, whether the categories should be odd or even and whether the choice beforced or unforced. Let us give some details.
4.14.1 Balanced Versus Unbalanced Scales
A balanced scale is one, which has the same number of positive and negativecategories, while an unbalanced scale is weighted towards one or the other end. Abalanced scale is used in situations where a broad range of responses are expected.An unbalanced scale is used where the results of preliminary research lean moretowards one side of the scale than the other. For instance, if preliminary researchconducted to measure the performance of a new solar powered car indicates that it
Exhibit 4.19: A Profile Analysis Profile Analysis for Measuring theAttitudes of Respondents towards Jeans Brands
1 2 3 4 5
Stylish . . . . . Old Fashioned
Affordable. . . . . Expensive
High Brand Valve . . . Low Brand Valve
High Range . . . . . Low Range
More Number of Outlets . . . . . Lesser Number of Outlets
Levis Lee Wrangler
Given below is a profile analysis of three jeans brands where a respondent has indicated his attitude towards them on a five point scale based on five bi-polar categories.
140 4 Scales and Measurement
is generally liked by the people, then a scale with categories such as (1) excellent,(2) very good (3) good, (4) fair and (5) poor is developed.
4.14.2 Number of Categories
The number of categories that have to be included in the scale should be decidedbased on the research concept. If a scale is developed with very few categories(say, 2. good/bad), then it does not reveal the respondents’ true attitudes. At thesame time, if a scale contains 10 or more categories, the respondent might getconfused and will not be able to accurately assign items to the different categories.Therefore, it is always better to develop a scale that contains between five and ninecategories.
4.14.3 Odd or Even Number of Scale Categories
If a scale has an even number of categories, it means that it does not have a neutralpoint. This restricts the respondents and forces them to choose a negative or apositive aspect of a scale. So respondents who are actually neutral cannot expressthis feeling. Adding a neutral point in the scale helps respondents. Some feel thatrespondents can take the easy way out by saying that they are neutral and need notconcentrate on their inner and real feelings. Deciding whether to have an oddnumber or an even number of categories on the scale is dependent on the nature ofresearch to be conducted. For instance, if a company has recently changed thedesign and is attempting to study whether the customers have liked it, it cannotexpect the respondents to be highly emotional towards the package design, andtherefore, it needs to have neutral category (odd number). While if a company onlywants to know how strongly the consumers like or dislike a product, then adding aneutral category will not serve the purpose.
4.14.4 Forced Versus Unforced Choice
If respondents are given adequate choice for selecting a response, it becomes anunforced choice. If they are not given any choice for selecting a response, then itbecomes a forced choice. An unforced decision can be either in the form of‘Neutral’ (which a respondent chooses if he is not inclined towards either object)or ‘Do not know’ (which a respondent can choose if he lacks the knowledge toanswer the question). When these two categories are included in the scale, itbecomes an unforced choice, as the respondents do not have to select a positive ornegative opinion when they do not have any opinion. When a neutral or do not
4.14 Considerations in Selecting a Scale 141

know category is not included in the scale, it obviously becomes a forced choice.Restricting the choice of respondents, although essential in some research studies,should be avoided as a rule.
References
Belk RW (1984) Three scales to measure constructs related to materialism: reliability, validityand relationships to measures of happiness. Adv Consumer Res 11(1):291 (6 pp)
Neelankavil JP, O’Brien JV, Tashjian R (1985) Techniques to obtain market-related informationfrom very young children. J Advert Res
Singh J, Rhoads GK (1991) Boundary role ambiguity in marketing-oriented positions: amultidimensional multifaceted operationalization. J Mark Res 28(3):328 (10 pp)
Tull DS, Hawkins DI (1998) Marketing research—measurement and method, 6th edn. PrenticeHall of India, New Delhi
142 4 Scales and Measurement

Chapter 5Questionnaire Design
A questionnaire is a set of questions to be asked from respondents in an interview,with appropriate instructions indicating which questions are to be asked, and inwhat order. Questionnaires are used in various fields of research like surveyresearch and experimental design. A questionnaire serves four functions—enablesdata collection from respondents, lends a structure to interviews, provides astandard means for writing down answers and help in processing collected data.
A questionnaire will be ineffective if it is not designed in a manner easilyunderstood by both the interviewer and the interviewee. If there is a single, fun-damental principle for developing a sound questionnaire design (Labaw 1980) it isthat the respondent defines what you can do: the types of questions you canreasonably ask; the types of words you can reasonably use; the concepts you canexplore; the methodology you can employ. The design is dependent on theresearcher’s decision to collect qualitative data for better understanding andgeneration of hypotheses on a subject (exploratory research), or quantitative datato test specific hypotheses.
This chapter discusses the various steps in questionnaire design like:
• Preliminary decisions• Question content• Response format• Question wording• Questionnaire sequence• Questionnaire pre-test, revision and final draft
Let us elaborate each of these aspects.
5.1 Preliminary Decisions
A researcher has to take many decisions before framing the actual questionnaire.These decisions relate to the information required, the target respondents and thechoice of interviewing techniques.
S. Sreejesh et al., Business Research Methods,DOI: 10.1007/978-3-319-00539-3_5,� Springer International Publishing Switzerland 2014
143
5.1.1 Required Information
The researcher is expected to know and understand the survey’s objectives beforehe or she can take further steps. In framing a questionnaire, the researcher mustensure that the questions are designed to draw information that will fulfil researchobjectives. Sometimes researchers end up designing questionnaires that study theperipheral issues related to a problem or an opportunity but fail to give insight intothe actual problem. Such questionnaires will act as a drain on a company’sresources and the data so collected may mislead the top management while makingdecisions.
To avoid such situations, a researcher should go through the secondary data andresearch studies that are similar to the current research. This helps in planningcurrent research based on existing research findings related to the topic understudy. The researcher can also conduct informal interviews with the prospectivetarget audience to understand the nature of the problem and the information thatwould help managers in solving a problem.
5.1.2 Target Respondents
Before conducting the actual survey, the researcher must make sure of the targetpopulation for the survey. For example, in case of market research, a researcherhas to decide whether to include both users and non-users of a product or service.This is a crucial step, as the sampling frame would be drawn after the targetrespondents are defined.
Defining the target respondents becomes vital as the task of developing aquestionnaire that will be suitable to all cross-sectional groups of a diversifiedpopulation.
5.1.3 Interviewing Technique
In developing a questionnaire, a lot depends on the choice of interviewing tech-nique. The format and type of questions will be different for personal interviews,focus groups, telephonic interviews and mailed questionnaires. A questionnairedesigned for direct interviewing cannot be used for a survey through mail. Inpersonal interviews, the respondent should be clearly told the details and the formof answers the questions require. It is prudent for questionnaires to be brief and tothe point in telephonic interviews. Mail survey questionnaires should give clearinstructions about the type of details that are desired, as an interviewer does notmediate these interviews.
144 5 Questionnaire Design
5.2 Question Content
A clear definition of the problem and the objectives framed thereafter, play a majorrole in deciding the content of the questions. In other words, the general nature ofthe questions and the information they are supposed to elicit decide the questioncontent. In this process, things become easier because there are some set standardsthat can be followed.
Irrespective of the type of research, a researcher has to find answers to fivemajor questions while deciding the question content. They are
I. What is the utility of the data collected?II. How effective is a question in producing the required data?III. Can the respondent answer the question accurately?IV. Is the respondent willing to answer the question accurately?V. What is the chance of the responses being influenced by external events?
5.2.1 The Utility of Data
A researcher should ensure that each question in the questionnaire contributes tothe survey. For this, every question needs to be screened before it is added to thequestionnaire. This screening test analyses the usefulness of the data that will begathered by that particular question. Questions like, ‘Does it significantly con-tribute towards answering the research question?’ ‘Will its omission affect theanalysis of any other data?’ and ‘Can the same information be gathered throughany other question?’ have to be asked. If the question does not answer any of thesequestions positively, or generates just ‘interesting or good to know information’,then it should be dropped. However, in special cases, it becomes necessary to askunnecessary and disguised questions to avoid any response bias.
5.2.2 Effectiveness in Producing Data
After it is decided to include the question in the questionnaire, it should beassessed whether the question will be able to generate the required information orif it needs to be broken down into two specific questions (double-barrelled ques-tions) to elicit better and accurate answers from respondents. In simple words, thequestion should be effective enough to extract the required information from theinterviewee.
5.2 Question Content 145
5.2.3 The Participant’s Ability to Answer Accurately
It is necessary that respondents understand the question in a way that theresearcher wants. This will eliminate the probability of potentially incorrectresponses. This can be tackled by using simple words to frame the questions. Arespondent’s inability to answer a question may arise from three sources—genuineignorance about the topic, inability to recollect the answer and inability to ver-balize the response.
Ignorance: This refers to respondents being unaware or uninformed about thesubject of the question. This can lead to respondent bias as respondents will rarelyadmit to lack of knowledge on a topic. These respondents will participate at theexpense of accuracy. To cover up their ignorance, they provide some answers or theother, assuming that the interviewer will be impressed with their knowledge level.
Inability to recollect: This happens when respondents forget an answerbecause of recall and memory decay. This happens when questions overtax therespondents recall ability. For example, questions like ‘What was your expenditureon grocery items in the last week?’ requires respondents to bank on their memoryto answer it. It is a fact that many of us cannot exactly keep track of factual detailsrelating to recent activities. But while responding to questions on the same, wetend to give the best answer that we can recollect. Some aspects of forgetfulness ina respondent that are of concern to researchers are:
Omission—when the interviewee is unable to remember if an incident actuallyoccurred. For instance, while answering the above question, the respondent mightnot recollect the purchases made in the last week and hence might fail to give theactual data.
Telescoping—when the interviewee thinks that an event that occurred some-time in past occurred more recently. In other words, the respondent may reportpurchases made a fortnight ago as done in the last week.
Creation—when the interviewee feels that the incident or event did not occur atall. In other words, total forgetfulness.
The above three aspects of forgetting increase with the length of the recallperiod. The telescoping and creation aspects can be minimized by using shortrecall periods. This means that the interviewee should be asked questions, whichneed only recall of incidents and events from the near past. Omission can be dealtwith only by aided or unaided recall measures.
Inability to verbalize: This refers to the respondents’ inability to verbalizefactors influencing their buying motives. It is not quite possible to answer ques-tions like, ‘Why did you buy that car?’, ‘What made you buy that brand of shoes?’This is because many times people buy things for reasons other than what theyadmit to themselves. There might be definite reasons behind the purchase likehabit, vanity, taste, etc. but when asked ‘Why?’ people are generally unable toarticulate reasons, as they are not conscious of what is in their sub-conscious.Researchers can awaken the sub-conscious minds of the respondents througheffective projective techniques.
146 5 Questionnaire Design
5.2.4 The Respondent’s Willingness to Answer Accurately
This refers to the researcher assessing the likelihood of the respondent answering aparticular question accurately. A respondent’s unwillingness to answer a specificquestion can result in item non-response (where the respondent completes the restof the questions other than those he or she is uncomfortable with), refusal tocomplete the rest of the questionnaire or in deliberate falsification. Questions suchas, ‘Were you involved in any extra-marital relationship in the 10 years of yourmarriage?’ ‘Would you resort to stealing things in a supermarket if you knew therewere no hidden cameras?’ are virtually sure to attract stereotyped responses orrefusals from participants.
This refusal can be because of the question being offending, too personal andembarrassing, reflecting on prestige, or when the respondents decide the topic isirrelevant to their interests. Hence, researchers should carefully look into theinclusion of such questions. If the information from such questions is essential, thequestions can be framed subtly so that the respondent’s attention is not attracted.Very often, questions of a personal nature will be answered by respondents in ananonymous survey that is if they do not have to give their real names or identities.
5.2.5 Effect of External Events
Sometimes the respondent’s answer to a particular question is exaggerated orunderstated due to the interference of external events. Example of external eventsis weather or time. For example, a questionnaire designed to find the potentialfootfalls for a big apparel showroom that is to come up in a business districtinvestigated the shopping patterns of women by asking them ‘how many times didyou go shopping in the past 1 week?’ The survey was conducted just after a weekof heavy rain in the particular city. The shopping frequency reported by respon-dents was dismaying as most of them had naturally preferred to stay indoorswithout going shopping in the rains. Though the answers were right for the par-ticular question, it was not truly representative of the shopping frequency of therespondents. Hence, questions should be framed after considering external events.A better way to frame the question would have been to keep it ‘situation free’ andframe it in a general manner to avoid linkage with external events. The question inthe above example could have been, ‘how many times do you shop in a week?’
5.3 Response Format
The response format required by a question depends on the nature of the research.The format usually deals with issues relating to the degree of freedom that should begiven to respondents while answering a question. Two popular response formats are
5.2 Question Content 147
• Open-ended questions• Close-ended questions.
5.3.1 Open-Ended Questions
A type of question that requires participants to respond in his/her own wordswithout being restricted to pre-defined response choices is known as an open-ended question. They are also called infinite response or unsaturated type ques-tions. Open-ended questions are structured in themselves. Although they probe forunstructured responses, there is a definite structure in the arrangement of questionsin the questionnaire. They help establish rapport, gather information and increaseunderstanding. Open-ended questions act as memory prompts, as they at timesrequire the respondent to recollect past experiences. Therefore, the interviewershould refrain from making suggestions. He should rather invite the participant touse his/her own choice of words to answer. The interviewer should get therespondent to talk as much as possible and record answers in the same words usedby the interviewee.
Open-ended questions are useful when the respondent is able to provide anarrative answer, when the researcher is uncertain what answers are needed orwants to conduct exploratory research. Such questions can be sub-divided intothree sub-types—free response, probing and projective.
5.3.2 Free Response
Free-response questions typically fluctuate in the degree of freedom they give tothe interviewee. Look at the following questions.
Q What do you think of the performance of the Indian hockey team in the recentAthens Olympics?
Q How would you evaluate Dhanraj Pillay’s performance in the Athens Olympics?
The second question seeks a more directive response about a particular memberof the Indian hockey team rather than asking about the whole team.
5.3.3 Probing
Probing open-ended questions are those where the actual open-ended questions arereached a little later in the process. Consider the following example.
148 5 Questionnaire Design
Q Which brand of soft drink do you like? Coke or Pepsi?A Pepsi.Q Why do you prefer Pepsi to Coke?A I like the taste.Q What aspect of its taste do you like? (Probe)
This is where the interviewer starts probing to get to the specific productattributes linked to the interviewee’s liking of Pepsi and the role that the sub-conscious mind of the interviewee plays in influencing the buying decisions.
5.3.4 Projective
A vague question or stimulus used by the researcher to project a person’s attitudesfrom the responses is known as a projective open-ended question. Such questionsare primarily used in projective techniques and have been extensively covered inthe chapter ‘Qualitative and Observation Studies’.
For the advantages and disadvantages of open-ended questions, refer Exhibit5.1
5.3.5 Close-Ended Questions
Questions, which restrict the interviewee’s answers to pre-defined responseoptions, are called close-ended questions. Close-ended questions give respondentsa finite set of specified responses to choose from. Such questions are deemedappropriate when the respondent has a specific answer to give (for example,gender), when the researcher has a pre-defined set of answers in mind, whendetailed narrative information is not needed or when there is a finite number ofways to answer a question. These questions are common in survey researches.Four major structures exist for close-ended questions. They are:
• Binary• Ranking questions• Multiple choice• Checklist
5.3.6 Binary Questions
These are also known as dichotomous questions as they permit only two possibleanswers. The respondent has to choose one of the two permissible answers. Binary
5.3 Response Format 149
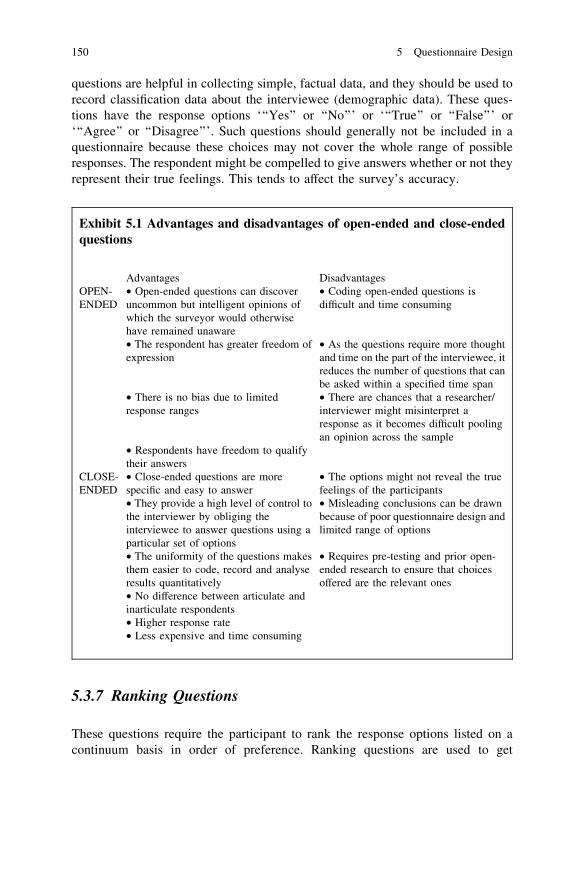
questions are helpful in collecting simple, factual data, and they should be used torecord classification data about the interviewee (demographic data). These ques-tions have the response options ‘‘‘Yes’’ or ‘‘No’’’ or ‘‘‘True’’ or ‘‘False’’’ or‘‘‘Agree’’ or ‘‘Disagree’’’. Such questions should generally not be included in aquestionnaire because these choices may not cover the whole range of possibleresponses. The respondent might be compelled to give answers whether or not theyrepresent their true feelings. This tends to affect the survey’s accuracy.
5.3.7 Ranking Questions
These questions require the participant to rank the response options listed on acontinuum basis in order of preference. Ranking questions are used to get
Exhibit 5.1 Advantages and disadvantages of open-ended and close-endedquestions
Advantages DisadvantagesOPEN-ENDED
• Open-ended questions can discoveruncommon but intelligent opinions ofwhich the surveyor would otherwisehave remained unaware
• Coding open-ended questions isdifficult and time consuming
• The respondent has greater freedom ofexpression
• As the questions require more thoughtand time on the part of the interviewee, itreduces the number of questions that canbe asked within a specified time span
• There is no bias due to limitedresponse ranges
• There are chances that a researcher/interviewer might misinterpret aresponse as it becomes difficult poolingan opinion across the sample
• Respondents have freedom to qualifytheir answers
CLOSE-ENDED
• Close-ended questions are morespecific and easy to answer
• The options might not reveal the truefeelings of the participants
• They provide a high level of control tothe interviewer by obliging theinterviewee to answer questions using aparticular set of options
• Misleading conclusions can be drawnbecause of poor questionnaire design andlimited range of options
• The uniformity of the questions makesthem easier to code, record and analyseresults quantitatively
• Requires pre-testing and prior open-ended research to ensure that choicesoffered are the relevant ones
• No difference between articulate andinarticulate respondents• Higher response rate• Less expensive and time consuming
150 5 Questionnaire Design
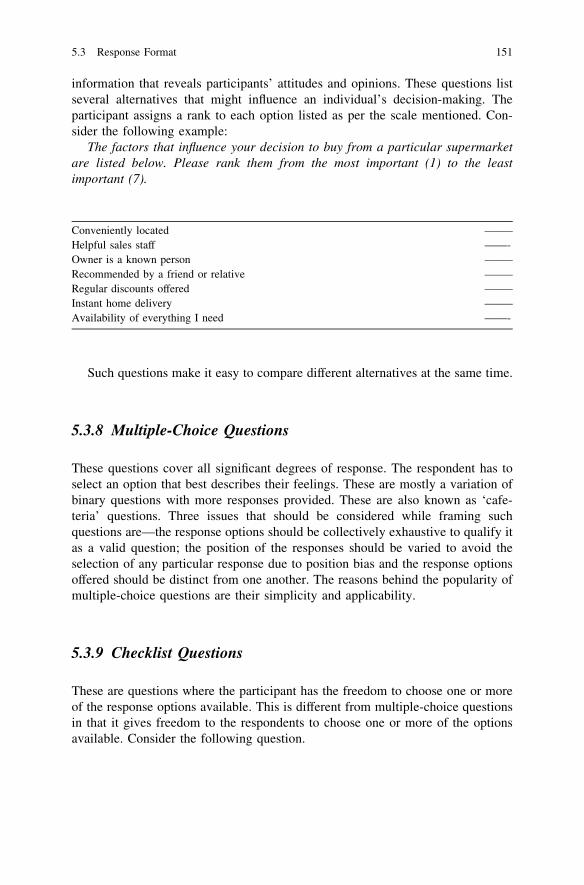
information that reveals participants’ attitudes and opinions. These questions listseveral alternatives that might influence an individual’s decision-making. Theparticipant assigns a rank to each option listed as per the scale mentioned. Con-sider the following example:
The factors that influence your decision to buy from a particular supermarketare listed below. Please rank them from the most important (1) to the leastimportant (7).
Conveniently located ——–Helpful sales staff ——-Owner is a known person ——–Recommended by a friend or relative ——–Regular discounts offered ——–Instant home delivery ——–Availability of everything I need ——-
Such questions make it easy to compare different alternatives at the same time.
5.3.8 Multiple-Choice Questions
These questions cover all significant degrees of response. The respondent has toselect an option that best describes their feelings. These are mostly a variation ofbinary questions with more responses provided. These are also known as ‘cafe-teria’ questions. Three issues that should be considered while framing suchquestions are—the response options should be collectively exhaustive to qualify itas a valid question; the position of the responses should be varied to avoid theselection of any particular response due to position bias and the response optionsoffered should be distinct from one another. The reasons behind the popularity ofmultiple-choice questions are their simplicity and applicability.
5.3.9 Checklist Questions
These are questions where the participant has the freedom to choose one or moreof the response options available. This is different from multiple-choice questionsin that it gives freedom to the respondents to choose one or more of the optionsavailable. Consider the following question.
5.3 Response Format 151
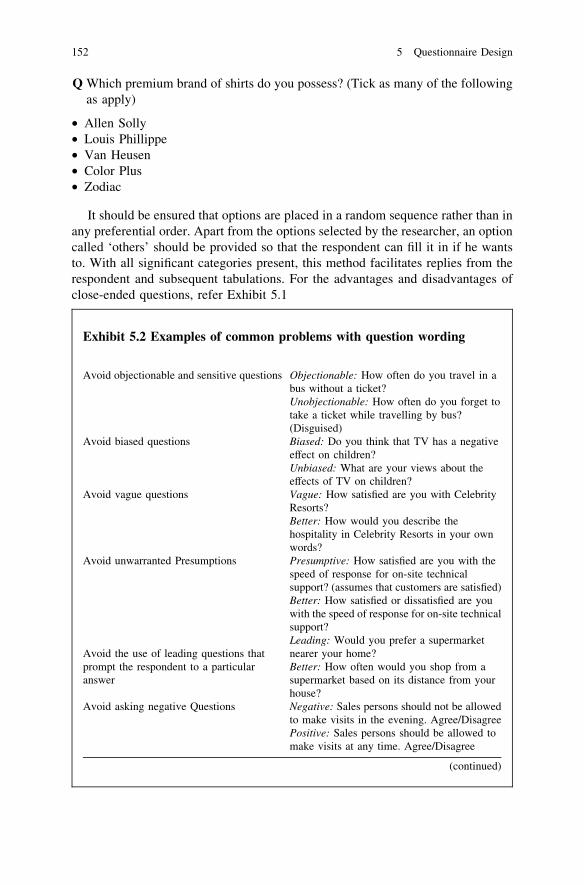
Q Which premium brand of shirts do you possess? (Tick as many of the followingas apply)
• Allen Solly• Louis Phillippe• Van Heusen• Color Plus• Zodiac
It should be ensured that options are placed in a random sequence rather than inany preferential order. Apart from the options selected by the researcher, an optioncalled ‘others’ should be provided so that the respondent can fill it in if he wantsto. With all significant categories present, this method facilitates replies from therespondent and subsequent tabulations. For the advantages and disadvantages ofclose-ended questions, refer Exhibit 5.1
Exhibit 5.2 Examples of common problems with question wording
Avoid objectionable and sensitive questions Objectionable: How often do you travel in abus without a ticket?Unobjectionable: How often do you forget totake a ticket while travelling by bus?(Disguised)
Avoid biased questions Biased: Do you think that TV has a negativeeffect on children?Unbiased: What are your views about theeffects of TV on children?
Avoid vague questions Vague: How satisfied are you with CelebrityResorts?Better: How would you describe thehospitality in Celebrity Resorts in your ownwords?
Avoid unwarranted Presumptions Presumptive: How satisfied are you with thespeed of response for on-site technicalsupport? (assumes that customers are satisfied)Better: How satisfied or dissatisfied are youwith the speed of response for on-site technicalsupport?
Avoid the use of leading questions thatprompt the respondent to a particularanswer
Leading: Would you prefer a supermarketnearer your home?Better: How often would you shop from asupermarket based on its distance from yourhouse?
Avoid asking negative Questions Negative: Sales persons should not be allowedto make visits in the evening. Agree/DisagreePositive: Sales persons should be allowed tomake visits at any time. Agree/Disagree
(continued)
152 5 Questionnaire Design
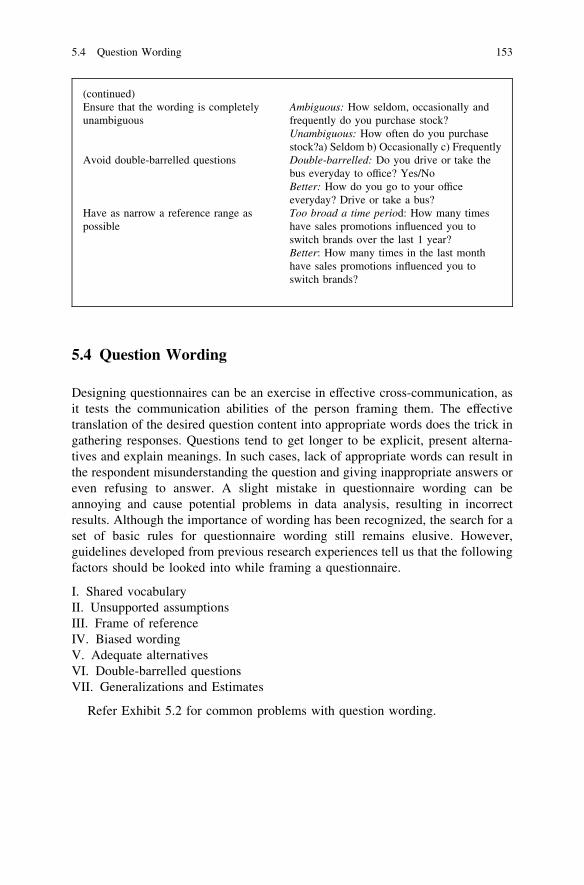
5.4 Question Wording
Designing questionnaires can be an exercise in effective cross-communication, asit tests the communication abilities of the person framing them. The effectivetranslation of the desired question content into appropriate words does the trick ingathering responses. Questions tend to get longer to be explicit, present alterna-tives and explain meanings. In such cases, lack of appropriate words can result inthe respondent misunderstanding the question and giving inappropriate answers oreven refusing to answer. A slight mistake in questionnaire wording can beannoying and cause potential problems in data analysis, resulting in incorrectresults. Although the importance of wording has been recognized, the search for aset of basic rules for questionnaire wording still remains elusive. However,guidelines developed from previous research experiences tell us that the followingfactors should be looked into while framing a questionnaire.
I. Shared vocabularyII. Unsupported assumptionsIII. Frame of referenceIV. Biased wordingV. Adequate alternativesVI. Double-barrelled questionsVII. Generalizations and Estimates
Refer Exhibit 5.2 for common problems with question wording.
(continued)Ensure that the wording is completelyunambiguous
Ambiguous: How seldom, occasionally andfrequently do you purchase stock?Unambiguous: How often do you purchasestock?a) Seldom b) Occasionally c) Frequently
Avoid double-barrelled questions Double-barrelled: Do you drive or take thebus everyday to office? Yes/NoBetter: How do you go to your officeeveryday? Drive or take a bus?
Have as narrow a reference range aspossible
Too broad a time period: How many timeshave sales promotions influenced you toswitch brands over the last 1 year?Better: How many times in the last monthhave sales promotions influenced you toswitch brands?
5.4 Question Wording 153
5.4.1 Shared Vocabulary
An interview of any kind is mostly an exchange of ideas between the interviewerand the interviewee. This exchange takes place mostly through words. This makesit imperative for the interactive language to be kept simple and easily understoodby both parties. A couple of things are worth ensuring in this respect. First, theinvolvement and usage of technical language has to be dealt with carefully. This isnecessary as using highly technical language in the questions may create under-standing problems for both the interviewer and the interviewee. The second issueis the appropriate choice of words. It is not enough to ensure that the words aresimple. It also has to be seen that the words are not ambiguous or vague.
5.4.2 Unsupported Assumptions
Questionnaires should avoid the use of implicit assumptions for better responserates. A questionnaire should not contain questions framed on assumptions that arenot explained in the questions. A question should not leave anything for therespondents and the audience to interpret. The question should be supported withvalid assumptions that would make it clearer to the audience. Unsupported,implied assumptions tend to produce exaggerated estimates from respondents.Consider the following question to a lady. ‘How often does your man accompanyyou to…?’ This will elicit varied responses and may even be misinterpreted. Thequestion assumes that every lady has a spouse or a boyfriend, which is obviouslynot the case. Consider another question. ‘Would you favour a ban on overcrowdingof buses?’ This is sure to provide an inflated estimate of the public’s demand,unless the assumption ‘even if it means an increase in bus fares?’ is added. Whenthe assumption is explicit in the question itself, it tends to produce the rightestimates of the demand for products.
5.4.3 Frame of Reference
A single word can have several connotations under different situations. Wordssuch as ‘often’ and ‘regularly’ can mean different time frames for different indi-viduals. The word ‘capacity’, for example, can mean very different things to anindustrialist and an educator. But the framework of social desirability makes theinterviewer extend a common frame of reference to the participants. The inter-viewer assumes that the interviewee has understood the question in its denotativeterms and qualifies the answer as valid. This is a mistake as the respondent mighthave answered the question using an individual frame of reference rather than fromthe interviewer’s point of view.
154 5 Questionnaire Design
5.4.4 Biased Wording
Questionnaires should avoid the use of biased wording. This tends to influence theresponses of the participants in predetermined ways. Biased and loaded words tendto be emotionally coloured, eliciting automatic feelings of approval or disapproval.They make participants aware of the desired response, thereby taking the focusaway from the actual response.
For example, a question to a factory employee, ‘Would you favour thereplacement of manual labour by machinery?’ is sure to receive a negativeresponse. A way of asking the question to read the sub-conscious mind of theemployee would be, ‘How do you think the introduction of machines would affectlabourers in a factory?’
Similarly, a question in a customer feedback form, ‘How satisfied are you withthe service provided at our restaurant?’ is biased as the question implies that thecustomer is already satisfied and asks them to grade the service.
The question should rather be phrased, ‘How satisfied or dissatisfied are youwith the service provided at our restaurant?’, thereby avoiding bias.
5.4.5 Adequate Alternatives
Questionnaires should give an ample number of alternative answers to eachquestion. This too helps avoiding bias in responses. Alternatives should be explicitrather than implicit. This gives respondents the freedom to choose among alter-natives rather than delve into their own mind to recollect responses. It is a fasterway to gather responses. For example, consider the following question:
How often do you purchase stock?
(a) Seldom(b) Occasionally(c) Frequently
5.4.6 Double-Barrelled Questions
Questionnaires should avoid asking double-barrelled questions like, ‘Do you likefuel-efficient cars with comfortable seats?’ This is actually a combination of twoquestions. It does not distinguish between people who prefer cars due to their fuel-efficiency and people who prefer a car for its comfortable seats or other competingreasons. Such questions can be easily divided into two different questions.Answers to double-barrelled questions will be ambiguous because two or moreideas are included.
5.4 Question Wording 155
5.4.7 Generalizations and Estimates
Questionnaires should be structured to avoid generalizations and estimates. It isseen that when respondents are asked for the frequency of a particular activity overa longer period, they tend to provide generalizations and estimates rather than theactual figures. This trend can be reduced by changing the time reference point to amore specific base. Answers that require calculations by the respondent shouldalso be avoided. Minimal necessary information can be gathered and then thecalculations should be done by the interviewer.
5.5 Questionnaire Sequence
The structure of a questionnaire is an important aspect in questionnaire design. Thequestionnaire structure is framed depending upon whether it is self-administered orthe administration is facilitated by an interviewer. Questionnaire structure pertainsto the proper sequencing for better and effective responses. The sequencing tendsto drive the interview through a ‘funnel-shaped’ process, starting with generalquestions and progressing to more specific ones. The interviewer, before movingto sequential steps, gives a brief introduction about the survey’s basic purposesurvey and client confidentiality. This sequencing is explained through the fol-lowing steps:
• Lead-in questions• Qualifying questions• Warm-up questions• Specifics questions• Demographics questions
5.5.1 Lead-in Questions
This is the introductory phase of the interview and consists of tactfully designedice-breakers. These can prove crucial in gaining the participant’s confidence andcooperation. The questions should be simple, non-threatening and not too personalat this stage. A good way to start the session is by asking a ‘ringer or throw away’question or a dichotomous question with two responses. These questions measurethe respondent’s interest and willingness to respond. The questions can be abouthot topics of the day, where responses are of little importance to the survey. Atypical lead-in question is given below.
Q It is often said that the economic condition in India is a by-product of thepolitical situation. Do you agree with this?
A YES/NO
156 5 Questionnaire Design
5.5.2 Qualifying Questions
These are questions that slowly lead to the survey’s objective. This stage ischaracterized by questions that evaluate the respondent and qualify him/her forfurther questioning. Depending on the responses, the interviewer directs theinterview towards a relevant set of questions. Prior to this, it should be ensured thatthe interviewees are related to the survey in some meaningful terms. A survey forestimating market potential for a new fluoride-based toothpaste brand should askqualifying questions like the following.
Q Which type of toothpaste do you like?A Fluoride Herbal Calcium
Depending upon the interviewee’s response, the interviewer can further givedirections to the next questions.
5.5.3 Warm-Up Questions
This stage plays on the respondent’s mind by making him/her think of certain factsrelated to the survey questions. Questions like, ‘When was the last time you boughttoothpaste?’; ‘Was it fluoride content or herbal?’; ‘Looking back, can you recollecthow many times you might have used fluoride toothpastes over the last 1 year?’tend to make the respondent think and recollect past experiences. A person who isstraightaway asked such questions may not be interested in answering or providingdetails, but after a series of lead-in and qualifying questions, the resistance slowlydecreases and gives way to cooperation.
5.5.4 Specific Questions
This stage consists of questions that are specific to the research objectives. Assuch, they are asked of participants who show a favourable response or are endusers of the product, in this case, fluoride toothpastes. These questions tend toestimate the usage pattern and influential factors in using fluoride content tooth-paste. These specific questions play a major role in data collection and analysis.After ensuring that enough rapport has been established, this section can probe togain insight into sensitive issues.
5.5 Questionnaire Sequence 157
5.5.5 Demographic Questions
These are a necessary part of every survey. Responses to survey questions cannotbe analysed until they are sorted out according to the different characteristicspertaining to the study. This is especially true for surveys that analyse responsesbased on the demographic characteristics of respondents. These usually consist ofa set of questions related to age, sex, location, occupation, etc. These questions arekept to the end to avoid interviewee resistance and to prevent the interviewee’sattention from being diverted.
5.6 Questionnaire Pre-testing, Revision and Final Draft
Pre-testing refers to testing the questionnaire on a small sample of respondentsselected on a convenient basis that is not too divergent from the actual respon-dents. The aim is to identify and eliminate flaws and problems. Pre-testing includestesting all aspects of the questionnaire starting from the question content toquestion sequence. This helps reveal incomprehensible meanings, wrong order ofquestions, leading questions and awkward responses. No matter what the finalmode of administration is, pre-testing should be done by personal interviews. Thiswill facilitate interviewers to observe respondents’ reactions and attitudes, givingthem a first-hand experience of the potential problems and the data that can beexpected from a questionnaire.
The responses gathered from pre-testing are coded to facilitate analysis. Pre-testing enables the researcher to revise the questionnaire by identifying flaws andeliminating any ambiguous questions. It also helps researchers to verify if inter-viewers resort to proper sample selection procedures.
After the revision, the research instrument is ready for its final draft, which is tobe used for the actual survey.
5.7 Summary
A good questionnaire is imperative for good survey results. A questionnaire can bejudged based on its relevance (no collection of unnecessary information) andaccuracy (information should be reliable and valid). This chapter discussed theproper designing of a questionnaire for better results. As no established rules existfor such designing, the steps outlined in this chapter are taken from experiencesaccumulated through various studies. The first step in questionnaire designing isarriving at preliminary decisions regarding the issues of required information, thetarget respondents and the interview techniques to be adopted. This is necessary asthe content, format, wording and sequencing of the questionnaire will depend on
158 5 Questionnaire Design
these basic factors. The next step is to determine the questionnaire content, so thatit deals with identifying the need for data, the question’s ability to yield data, theparticipant’s ability to answer without generalizations and estimates and willing-ness to answer sensitive questions.
Knowing how each question should be phrased requires familiarity with thedifferent types of questions. This leads to the next step of the questionnairedesigning, that is questionnaire response format. This deals with issues of usingopen-ended or close-ended questions. Open-ended questions require the respon-dent to do most of the talking while close-ended questions restrict the respondent’sresponses to the available options. Each has its own advantages and disadvantagesand is suited to different interviewing techniques.
Experiences from previous researches have helped establish general guidelinesregarding questionnaire wording and sequence. It should be ensured that questionsresort to shared vocabulary and adequate alternatives for better understanding andresponse rates. The questions should be free of implicit assumptions, biased andloaded words. It should also be free of questions that are double-barrelled and thatwould provoke the respondent to provide generalizations and estimated answers.Questionnaire sequencing is very important to elicit required information from theparticipant. The opening questions should arouse the respondent’s interest in thesurvey. The specific and general questions should be followed in order. This meansthat the questions are sequenced in the following manner: lead-in, qualifying,warm-up, specific and demographic.
Last, the questionnaire should be pre-tested before administration for detectingflaws and revised with necessary corrections and deletions. This would lead to thefinal draft to be used in the actual survey.
Reference
Labaw, Philip Gendall (1980) A framework for questionnaire design: Labaw Revisited, MarkBull 1998, 9, 29–39
5.7 Summary 159

Part IVMultivariate Data Analysis Using IBM
SPSS 20.0
Chapter 6Data Preparation and PreliminaryAnalysis
After data collection is over and all completed questionnaires are in hand, aresearcher has to analyse the data collected through the research. Data analysisplays an important role in transforming a lot of data into verifiable sets of con-clusions and reports. Proper analysis helps the researcher to gain insights from thedata and to arrive at informed judgments and conclusions. However, if the purposeof research is not defined properly or if research questions are irrelevant, even thebest analytical techniques cannot produce good results. Data analysis may givefaulty results even when research is done properly. This is because of the appli-cation of inappropriate methods to analyse data.
In this chapter, we will start with preliminary data preparation techniques likevalidation, editing and coding, followed by data entry and data cleaning. Thepenultimate section discusses various types of survey tabulations. This is followedby the final section of the chapter, which provides insight into data mining and itsapplications. The various steps in data preparation and preliminary data analysisare shown in Fig. 6.1.
6.1 Validating and Editing
Validation is the preliminary step in data preparation. It refers to the process ofascertaining whether the interviews conducted complied with specified norms. Theessence of this process lies in detecting any fraud or failure by the interviewer tofollow specified instructions (Beegle 1981). In many questionnaires, we find thereis a separate place to record the respondent’s name, address and telephone numberand other demographic details. Though no apparent analysis can be done on suchdata, it is the basis for what is called ‘validation’. Validation helps to confirm if theinterview was really conducted.
Editing is the process of checking for mistakes by the interviewer or respondentin filling the questionnaire. Editing is usually done twice before the data aresubmitted for data entry.
S. Sreejesh et al., Business Research Methods,DOI: 10.1007/978-3-319-00539-3_6,� Springer International Publishing Switzerland 2014
163
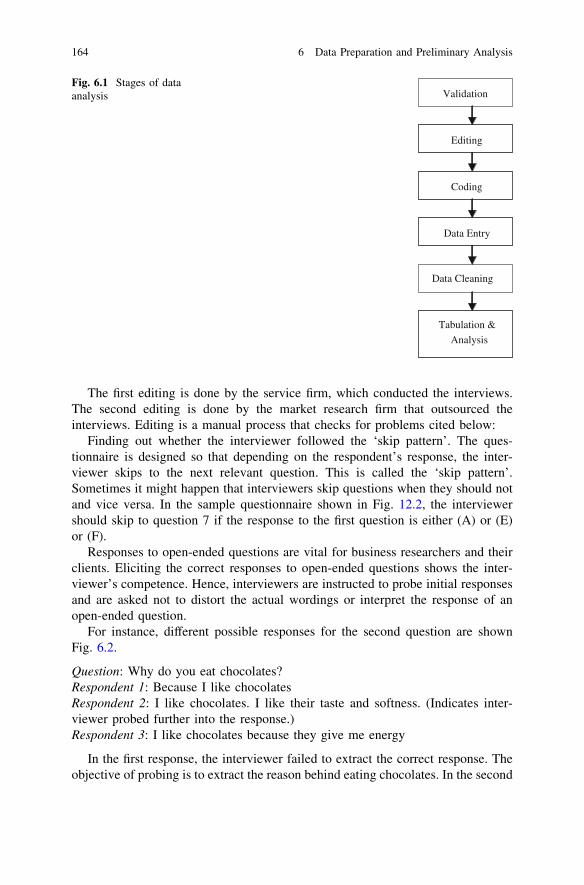
The first editing is done by the service firm, which conducted the interviews.The second editing is done by the market research firm that outsourced theinterviews. Editing is a manual process that checks for problems cited below:
Finding out whether the interviewer followed the ‘skip pattern’. The ques-tionnaire is designed so that depending on the respondent’s response, the inter-viewer skips to the next relevant question. This is called the ‘skip pattern’.Sometimes it might happen that interviewers skip questions when they should notand vice versa. In the sample questionnaire shown in Fig. 12.2, the interviewershould skip to question 7 if the response to the first question is either (A) or (E)or (F).
Responses to open-ended questions are vital for business researchers and theirclients. Eliciting the correct responses to open-ended questions shows the inter-viewer’s competence. Hence, interviewers are instructed to probe initial responsesand are asked not to distort the actual wordings or interpret the response of anopen-ended question.
For instance, different possible responses for the second question are shownFig. 6.2.
Question: Why do you eat chocolates?Respondent 1: Because I like chocolatesRespondent 2: I like chocolates. I like their taste and softness. (Indicates inter-viewer probed further into the response.)Respondent 3: I like chocolates because they give me energy
In the first response, the interviewer failed to extract the correct response. Theobjective of probing is to extract the reason behind eating chocolates. In the second
Validation
Editing
Coding
Data Entry
Data Cleaning
Tabulation &
Analysis
Fig. 6.1 Stages of dataanalysis
164 6 Data Preparation and Preliminary Analysis
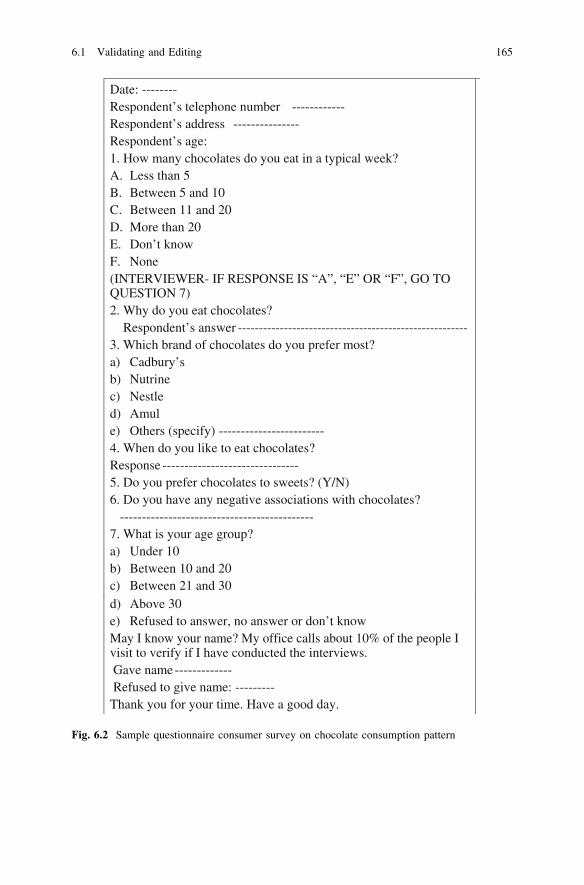
Date: --------Respondent’s telephone number ------------Respondent’s address ---------------Respondent’s age:1. How many chocolates do you eat in a typical week?A. Less than 5B. Between 5 and 10C. Between 11 and 20D. More than 20E. Don’t knowF. None(INTERVIEWER- IF RESPONSE IS “A”, “E” OR “F”, GO TO QUESTION 7)2. Why do you eat chocolates?
Respondent’s answer -------------------------------------------------------3. Which brand of chocolates do you prefer most? a) Cadbury’sb) Nutrinec) Nestled) Amule) Others (specify) ------------------------4. When do you like to eat chocolates?Response -------------------------------5. Do you prefer chocolates to sweets? (Y/N)6. Do you have any negative associations with chocolates?
--------------------------------------------7. What is your age group?a) Under 10b) Between 10 and 20c) Between 21 and 30d) Above 30e) Refused to answer, no answer or don’t knowMay I know your name? My office calls about 10% of the people I visit to verify if I have conducted the interviews.Gave name -------------Refused to give name: ---------
Thank you for your time. Have a good day.
Fig. 6.2 Sample questionnaire consumer survey on chocolate consumption pattern
6.1 Validating and Editing 165
response, the interviewer might have asked further questions like, ‘Do you likeABC brand of chocolates?’ On a positive reply, the interviewer might have probedmore by asking, ‘What do you like about it?’ This is the correct way to elicitresponses for open-ended questions. The interviewer can even go further and probehow a specific product characteristic is attached to the individual’s sub-conscious.
Though editing is time-consuming, it has to be done with care and patiencebecause it is important to data processing.
6.1.1 Treatment of Unsatisfactory Responses
During editing, the researcher may find some illegible, incomplete, inconsistent orambiguous responses. These are called unsatisfactory responses. The responses arecommonly handled by assigning missing values, returning to the field or discardingunsatisfactory respondents.
Assigning missing values—Though revisiting the respondent is logical, it is notalways possible to re-visit the field every time the researcher gets an unsatisfactoryresponse from participants. In this situation, a researcher may resort to assigningmissing values to unsatisfactory responses. This method can be used when thenumber of unsatisfactory responses is proportionately small or variables withunsatisfactory responses are not the key variables.
Returning to the field—Sometimes the interviewer has to re-contact respondentsif the responses provided by them are unsatisfactory. This is feasible especially forindustrial or business surveys, where the sample size is small and respondents areeasily traceable. The responses, however, may be different from those originallygiven.
Discarding unsatisfactory responses—In this approach, unsatisfactory respon-ses from participants are totally discarded. This method is well suited when:
• Proportion of unsatisfactory respondents is very small compared with thesample size
• Respondents with unsatisfactory responses do not differ from other respondentswith respect to important, demographic and user characteristics
• Unsatisfactory responses for each respondent are proportionately more in eachquestionnaire
• Responses on key variables are missing• To reiterate, editing has to be done with patience and care because it is an
important step in the processing of questionnaires.
166 6 Data Preparation and Preliminary Analysis
6.2 Coding
The process of assigning numbers or other symbols to answers in order to groupthe responses into limited categories is known as coding. For example, instead ofusing the word ‘landlord’ or ‘tenant’ in response to a question that asks foridentification of one’s residential status, one can use the codes ‘LLD’ or ‘TNT’.This variable can also be coded as 1 for landlord and 2 for tenant, which is thenknown as numeric coding. This type of categorization and coding sacrifices somedetail but is necessary for efficient data analysis. It helps researchers to packseveral replies into a few categories that contain critical information required foranalysis.
6.2.1 Categorization Rules
A researcher should follow four rules while categorizing replies obtained from aquestionnaire. The categories are—appropriate, exhaustive, mutually exclusiveand derived from one classification principle.
Appropriate. Categorization should help to validate the hypotheses of theresearch study. If a hypothesis aims to establish a relationship between key vari-ables, then appropriate categories should be designed to facilitate comparisonbetween those variables. Categorization provides for better screening of data fortesting and establishing links among key variables. For example, if specific incomeis critical for a testing relationship, then wider income classifications may not yieldthe best results upon analysis.
Exhaustive. When multiple-choice questions are used, an adequate list ofalternatives should be provided to tap the full range of information from respon-dents. The absence of any response from the set of response options given willprove detrimental as that specific response will be underrepresented in the anal-ysis. For example, a questionnaire designed to capture the age group of respon-dents should list all possible alternatives that a respondent may fall into.
Mutually exclusive. Complying with this rule requires that a specific alternativeis placed in one and only one cell of a category set. For example, in a survey, theclassification may be (1) Professional (2) Self-employed (3) Government service(4) Agriculture (5) Unemployed. Some self-employed respondents may considerthemselves as professionals, and these respondents will fit into more than onecategory. A researcher should avoid having categories that are not mutuallyexclusive.
Single Dimension. This means every class in the category set is defined in termsof one concept. If more than one dimension is used, it may not be mutuallyexclusive unless there is a combination of dimensions like (1) Engineering student(2) Managerial student and the like in the response options.
6.2 Coding 167
6.2.2 Code Book
To make data entry less erroneous and more efficient, a rule book called a ‘codebook’ or ‘coding scheme’ is used, which guides research staff. A code book givescoding rules for each variable that appears in a survey. It is also the basic sourcefor locating the positions of variables in the data file during the analysis process.Most code books generally contain the question number, variable number, locationof the variable’s code on the input medium, descriptors for the response optionsand variable name. A code book for the questionnaire in Fig. 6.2 above is shown inFig. 6.3 below.
6.2.3 Coding Close-Ended Questions
It is easy to assign codes for responses that would be generated by close-endedquestions. This is because the number of answers is fixed. Assigning appropriatecodes in the initial stages of research makes it possible to pre-code a questionnaire.This avoids the tiresome, intermediate step of framing the coding sheet prior todata entry. Coding makes it easier for data to be accessed directly from thequestionnaire. The interviewer assigns appropriate numerical responses to eachitem (question) in the questionnaire. This code is later transferred to an inputmedium for analysis.
6.2.4 Coding Open-Ended Questions
Questionnaire data obtained from close-ended questions are relatively easy to codeas there are a definite number of predetermined responses. But a researcher cannotalways use close-ended questions as it is impossible to prepare an exhaustive list ofresponses for a question aimed at probing a person’s perception or attitude to aparticular product or issue. Thus, use of open-ended questions becomes inevitablein business research.
However, coding the data collected from open-ended questions is much moredifficult as the responses are unlimited and varied.
In the questionnaire shown in Fig. 6.2, questions 2, 4 and 6 are open-endedquestions. After preliminary evaluation and coding, response categories for thesecond question are shown in Fig. 6.3. The response categories also include the‘other’ category to satisfy the coding rule of exhaustiveness.
Content analysis for open-ended questions. A qualitative method known ascontent analysis can be used to analyse the text provided in the response categoryof open-ended questions. The purpose is twofold. First, content analysis system-atically and objectively derives categories of responses that represent homogenous
168 6 Data Preparation and Preliminary Analysis
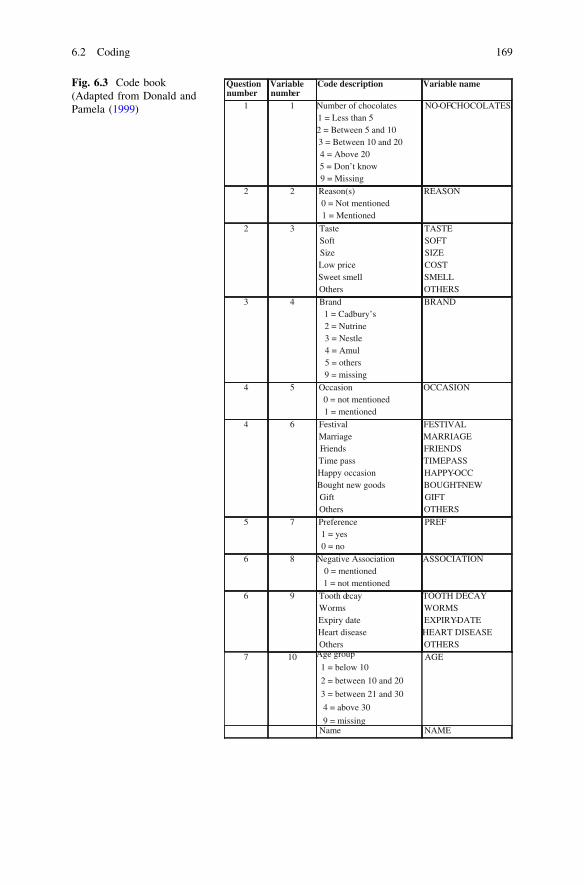
Question number
Variable number
Code description Variable name
1 1 Number of chocolates1 = Less than 52 = Between 5 and 103 = Between 10 and 204 = Above 205 = Don’t know9 = Missing
NO-OF-CHOCOLATES
2 2 Reason(s)0 = Not mentioned1 = Mentioned
REASON
2 3 TasteSoftSizeLow priceSweet smellOthers
TASTESOFTSIZECOSTSMELLOTHERS
3 4 Brand1 = Cadbury’s2 = Nutrine3 = Nestle4 = Amul5 = others9 = missing
BRAND
4 5 Occasion0 = not mentioned1 = mentioned
OCCASION
4 6 FestivalMarriageFriendsTime passHappy occasionBought new goodsGiftOthers
FESTIVALMARRIAGEFRIENDSTIMEPASSHAPPY-OCCBOUGHT-NEWGIFTOTHERS
5 7 Preference1 = yes0 = no
PREF
6 8 Negative Association0 = mentioned1 = not mentioned
ASSOCIATION
6 9 Tooth decayWormsExpiry dateHeart diseaseOthers
TOOTH DECAYWORMSEXPIRY-DATEHEART DISEASEOTHERS
7 10 Age group
1 = below 10
2 = between 10 and 20
3 = between 21 and 30
4 = above 30
9 = missing
AGE
Name NAME
Fig. 6.3 Code book(Adapted from Donald andPamela (1999)
6.2 Coding 169
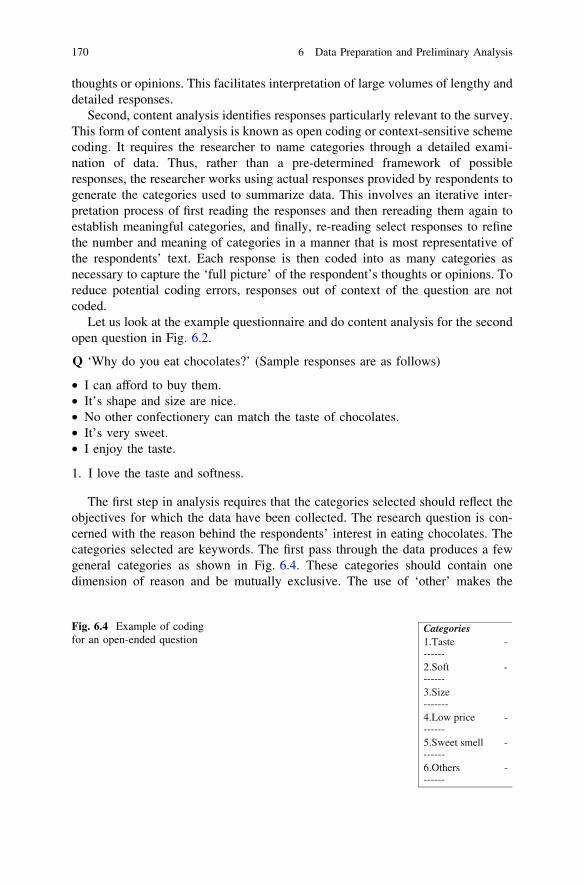
thoughts or opinions. This facilitates interpretation of large volumes of lengthy anddetailed responses.
Second, content analysis identifies responses particularly relevant to the survey.This form of content analysis is known as open coding or context-sensitive schemecoding. It requires the researcher to name categories through a detailed exami-nation of data. Thus, rather than a pre-determined framework of possibleresponses, the researcher works using actual responses provided by respondents togenerate the categories used to summarize data. This involves an iterative inter-pretation process of first reading the responses and then rereading them again toestablish meaningful categories, and finally, re-reading select responses to refinethe number and meaning of categories in a manner that is most representative ofthe respondents’ text. Each response is then coded into as many categories asnecessary to capture the ‘full picture’ of the respondent’s thoughts or opinions. Toreduce potential coding errors, responses out of context of the question are notcoded.
Let us look at the example questionnaire and do content analysis for the secondopen question in Fig. 6.2.
Q ‘Why do you eat chocolates?’ (Sample responses are as follows)
• I can afford to buy them.• It’s shape and size are nice.• No other confectionery can match the taste of chocolates.• It’s very sweet.• I enjoy the taste.
1. I love the taste and softness.
The first step in analysis requires that the categories selected should reflect theobjectives for which the data have been collected. The research question is con-cerned with the reason behind the respondents’ interest in eating chocolates. Thecategories selected are keywords. The first pass through the data produces a fewgeneral categories as shown in Fig. 6.4. These categories should contain onedimension of reason and be mutually exclusive. The use of ‘other’ makes the
Categories1.Taste -------2.Soft -------3.Size -------4.Low price -------5.Sweet smell -------6.Others -------
Fig. 6.4 Example of codingfor an open-ended question
170 6 Data Preparation and Preliminary Analysis
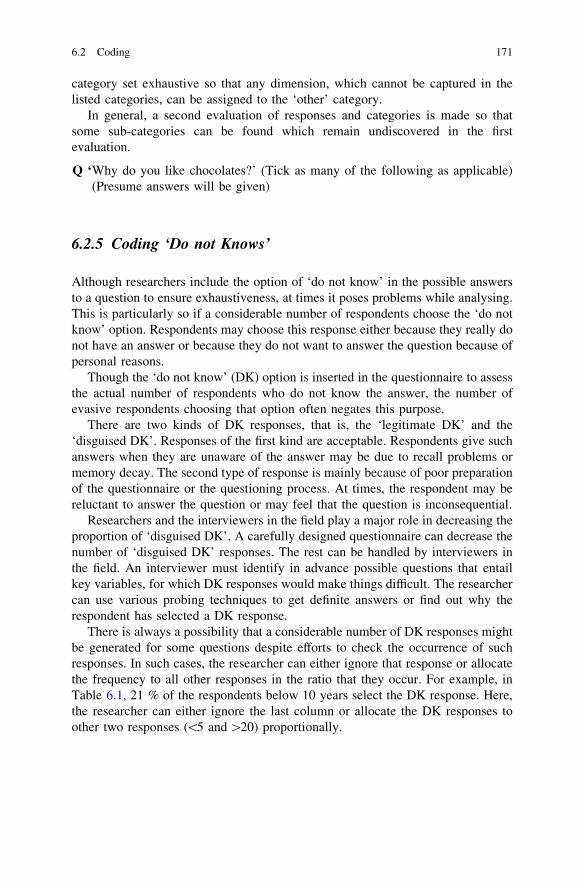
category set exhaustive so that any dimension, which cannot be captured in thelisted categories, can be assigned to the ‘other’ category.
In general, a second evaluation of responses and categories is made so thatsome sub-categories can be found which remain undiscovered in the firstevaluation.
Q ‘Why do you like chocolates?’ (Tick as many of the following as applicable)(Presume answers will be given)
6.2.5 Coding ‘Do not Knows’
Although researchers include the option of ‘do not know’ in the possible answersto a question to ensure exhaustiveness, at times it poses problems while analysing.This is particularly so if a considerable number of respondents choose the ‘do notknow’ option. Respondents may choose this response either because they really donot have an answer or because they do not want to answer the question because ofpersonal reasons.
Though the ‘do not know’ (DK) option is inserted in the questionnaire to assessthe actual number of respondents who do not know the answer, the number ofevasive respondents choosing that option often negates this purpose.
There are two kinds of DK responses, that is, the ‘legitimate DK’ and the‘disguised DK’. Responses of the first kind are acceptable. Respondents give suchanswers when they are unaware of the answer may be due to recall problems ormemory decay. The second type of response is mainly because of poor preparationof the questionnaire or the questioning process. At times, the respondent may bereluctant to answer the question or may feel that the question is inconsequential.
Researchers and the interviewers in the field play a major role in decreasing theproportion of ‘disguised DK’. A carefully designed questionnaire can decrease thenumber of ‘disguised DK’ responses. The rest can be handled by interviewers inthe field. An interviewer must identify in advance possible questions that entailkey variables, for which DK responses would make things difficult. The researchercan use various probing techniques to get definite answers or find out why therespondent has selected a DK response.
There is always a possibility that a considerable number of DK responses mightbe generated for some questions despite efforts to check the occurrence of suchresponses. In such cases, the researcher can either ignore that response or allocatethe frequency to all other responses in the ratio that they occur. For example, inTable 6.1, 21 % of the respondents below 10 years select the DK response. Here,the researcher can either ignore the last column or allocate the DK responses toother two responses (\5 and [20) proportionally.
6.2 Coding 171
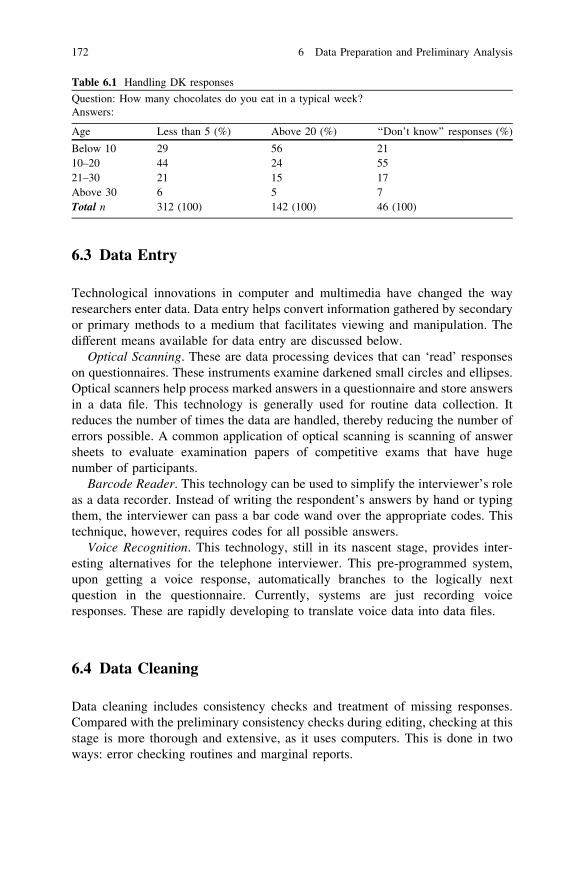
6.3 Data Entry
Technological innovations in computer and multimedia have changed the wayresearchers enter data. Data entry helps convert information gathered by secondaryor primary methods to a medium that facilitates viewing and manipulation. Thedifferent means available for data entry are discussed below.
Optical Scanning. These are data processing devices that can ‘read’ responseson questionnaires. These instruments examine darkened small circles and ellipses.Optical scanners help process marked answers in a questionnaire and store answersin a data file. This technology is generally used for routine data collection. Itreduces the number of times the data are handled, thereby reducing the number oferrors possible. A common application of optical scanning is scanning of answersheets to evaluate examination papers of competitive exams that have hugenumber of participants.
Barcode Reader. This technology can be used to simplify the interviewer’s roleas a data recorder. Instead of writing the respondent’s answers by hand or typingthem, the interviewer can pass a bar code wand over the appropriate codes. Thistechnique, however, requires codes for all possible answers.
Voice Recognition. This technology, still in its nascent stage, provides inter-esting alternatives for the telephone interviewer. This pre-programmed system,upon getting a voice response, automatically branches to the logically nextquestion in the questionnaire. Currently, systems are just recording voiceresponses. These are rapidly developing to translate voice data into data files.
6.4 Data Cleaning
Data cleaning includes consistency checks and treatment of missing responses.Compared with the preliminary consistency checks during editing, checking at thisstage is more thorough and extensive, as it uses computers. This is done in twoways: error checking routines and marginal reports.
Table 6.1 Handling DK responses
Question: How many chocolates do you eat in a typical week?Answers:
Age Less than 5 (%) Above 20 (%) ‘‘Don’t know’’ responses (%)
Below 10 29 56 2110–20 44 24 5521–30 21 15 17Above 30 6 5 7Total n 312 (100) 142 (100) 46 (100)
172 6 Data Preparation and Preliminary Analysis
Error checking routines are computer programs that check for various condi-tions that could lead to potential errors. For example, if a particular field on thedata records should only have a code in the range 1–4, then a logical statement canbe programmed to check for the occurrence of an invalid code in that field.Technological advancements have also made it possible to generate reports, whichspecify the number of times a particular condition was not met and the list of datarecords on which the condition was not met.
Another approach to error checking is the marginal report or one-way fre-quency table. The rows of this report are fields of the data record. The columnsdepict the frequency with which each possible value was encountered in each field.The report assists in determining the use of inappropriate codes and detectingwhether skip patterns were properly followed. If all the numbers are consistent andcomply with the coding, there is no need for further cleaning. However, in caselogic errors are detected, necessary corrections can be made on the computer datafile.
This is the final error check in the process, after which the computer data file isdeemed ‘clean’ and ready for tabulation and statistical analysis.
6.5 Tabulation of Survey Results
Once data are cleansed off all errors and are stored in a database, it should betabulated to facilitate further analysis.
A researcher can tabulate data in two ways—one-way frequency tabulation andcross tabulation.
6.5.1 One-Way Frequency Tabulation
The most commonly used tabulation technique is the one-way frequency table, asshown in Table 6.2. The one-way frequency table shows the number of respon-dents who gave each possible answer to each question. Table 6.2 shows that 225respondents (45 %) like Cadbury’s chocolate, 155 respondents (31 %) preferNestle chocolates and 83 respondents (16.6 %) prefer Amul chocolates. For everyquestion, the responses are tabulated in this manner to get the first summary reportof the survey. The following table shows a computer generated one-way frequencytable for Question 3 in the questionnaire shown in Fig. 6.2, when a survey isadministered for 500 respondents. In addition to frequencies, one-way frequencytables indicate the percentage of those responding to a question that gave eachpossible response.
6.4 Data Cleaning 173
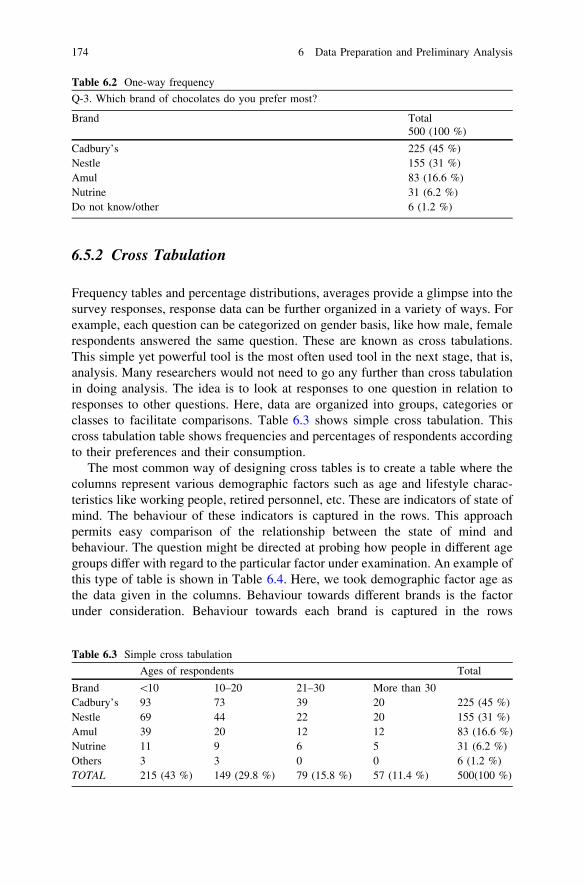
6.5.2 Cross Tabulation
Frequency tables and percentage distributions, averages provide a glimpse into thesurvey responses, response data can be further organized in a variety of ways. Forexample, each question can be categorized on gender basis, like how male, femalerespondents answered the same question. These are known as cross tabulations.This simple yet powerful tool is the most often used tool in the next stage, that is,analysis. Many researchers would not need to go any further than cross tabulationin doing analysis. The idea is to look at responses to one question in relation toresponses to other questions. Here, data are organized into groups, categories orclasses to facilitate comparisons. Table 6.3 shows simple cross tabulation. Thiscross tabulation table shows frequencies and percentages of respondents accordingto their preferences and their consumption.
The most common way of designing cross tables is to create a table where thecolumns represent various demographic factors such as age and lifestyle charac-teristics like working people, retired personnel, etc. These are indicators of state ofmind. The behaviour of these indicators is captured in the rows. This approachpermits easy comparison of the relationship between the state of mind andbehaviour. The question might be directed at probing how people in different agegroups differ with regard to the particular factor under examination. An example ofthis type of table is shown in Table 6.4. Here, we took demographic factor age asthe data given in the columns. Behaviour towards different brands is the factorunder consideration. Behaviour towards each brand is captured in the rows
Table 6.2 One-way frequency
Q-3. Which brand of chocolates do you prefer most?
Brand Total500 (100 %)
Cadbury’s 225 (45 %)Nestle 155 (31 %)Amul 83 (16.6 %)Nutrine 31 (6.2 %)Do not know/other 6 (1.2 %)
Table 6.3 Simple cross tabulation
Ages of respondents Total
Brand \10 10–20 21–30 More than 30Cadbury’s 93 73 39 20 225 (45 %)Nestle 69 44 22 20 155 (31 %)Amul 39 20 12 12 83 (16.6 %)Nutrine 11 9 6 5 31 (6.2 %)Others 3 3 0 0 6 (1.2 %)TOTAL 215 (43 %) 149 (29.8 %) 79 (15.8 %) 57 (11.4 %) 500(100 %)
174 6 Data Preparation and Preliminary Analysis
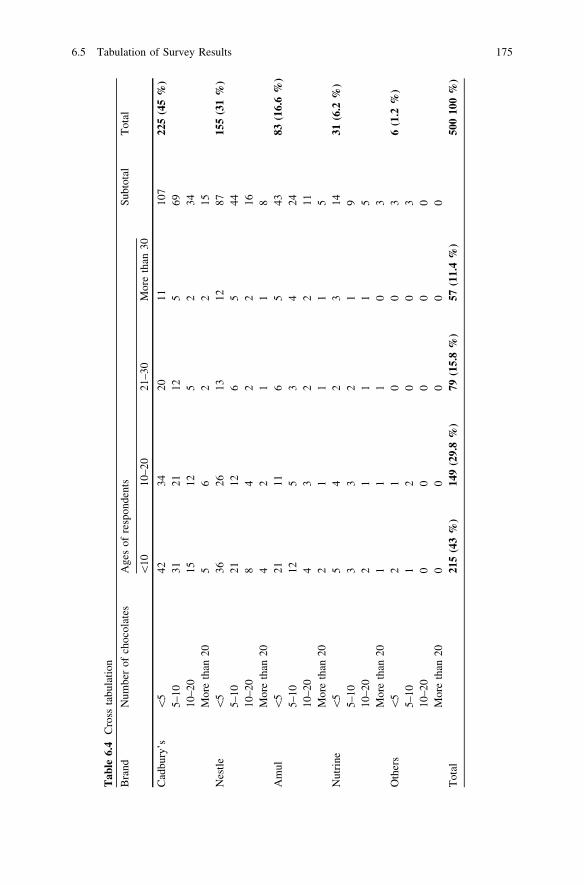
Tab
le6.
4C
ross
tabu
lati
on
Bra
ndN
umbe
rof
choc
olat
esA
ges
ofre
spon
dent
sS
ubto
tal
Tot
al
\10
10–2
021
–30
Mor
eth
an30
Cad
bury
’s\
542
3420
1110
722
5(4
5%
)5–
1031
2112
569
10–2
015
125
234
Mor
eth
an20
56
22
15N
estl
e\
536
2613
1287
155
(31
%)
5–10
2112
65
4410
–20
84
22
16M
ore
than
204
21
18
Am
ul\
521
116
543
83(1
6.6
%)
5–10
125
34
2410
–20
43
22
11M
ore
than
202
11
15
Nut
rine
\5
54
23
1431
(6.2
%)
5–10
33
21
910
–20
21
11
5M
ore
than
201
11
03
Oth
ers
\5
21
00
36
(1.2
%)
5–10
12
00
310
–20
00
00
0M
ore
than
200
00
00
Tot
al21
5(4
3%
)14
9(2
9.8
%)
79(1
5.8
%)
57(1
1.4
%)
500
100
%)
6.5 Tabulation of Survey Results 175
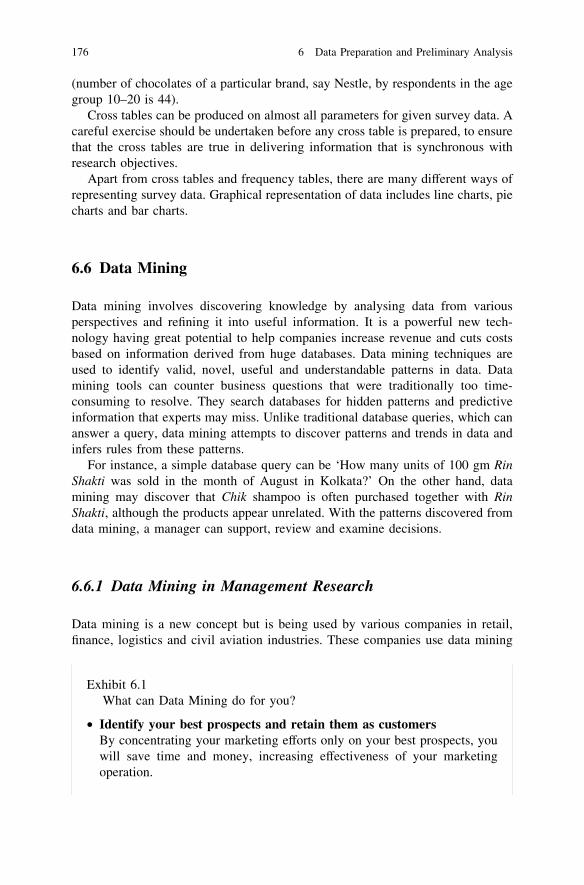
(number of chocolates of a particular brand, say Nestle, by respondents in the agegroup 10–20 is 44).
Cross tables can be produced on almost all parameters for given survey data. Acareful exercise should be undertaken before any cross table is prepared, to ensurethat the cross tables are true in delivering information that is synchronous withresearch objectives.
Apart from cross tables and frequency tables, there are many different ways ofrepresenting survey data. Graphical representation of data includes line charts, piecharts and bar charts.
6.6 Data Mining
Data mining involves discovering knowledge by analysing data from variousperspectives and refining it into useful information. It is a powerful new tech-nology having great potential to help companies increase revenue and cuts costsbased on information derived from huge databases. Data mining techniques areused to identify valid, novel, useful and understandable patterns in data. Datamining tools can counter business questions that were traditionally too time-consuming to resolve. They search databases for hidden patterns and predictiveinformation that experts may miss. Unlike traditional database queries, which cananswer a query, data mining attempts to discover patterns and trends in data andinfers rules from these patterns.
For instance, a simple database query can be ‘How many units of 100 gm RinShakti was sold in the month of August in Kolkata?’ On the other hand, datamining may discover that Chik shampoo is often purchased together with RinShakti, although the products appear unrelated. With the patterns discovered fromdata mining, a manager can support, review and examine decisions.
6.6.1 Data Mining in Management Research
Data mining is a new concept but is being used by various companies in retail,finance, logistics and civil aviation industries. These companies use data mining
Exhibit 6.1What can Data Mining do for you?
• Identify your best prospects and retain them as customersBy concentrating your marketing efforts only on your best prospects, youwill save time and money, increasing effectiveness of your marketingoperation.
176 6 Data Preparation and Preliminary Analysis
techniques to make sense of huge historic data available with them and to improvetheir operations and marketing strategies. Data mining uses various pattern rec-ognition, statistical and mathematical techniques to crunch through huge volumesof data and help analysts identify important facts, relationships, trends, patterns,exceptions and discrepancies that might escape researchers’ attention. To under-stand the various ways in which data mining can be useful, refer Exhibit 6.1.
In businesses, data mining is used to discover patterns and establish relation-ships in the data to help managers formulate better business strategies. Datamining can help reveal sales trends, develop better marketing campaigns andprecisely estimate customer loyalty. For the specific uses of data mining, referExhibit 6.2
Data mining technology can generate new business opportunities by:Automated Prediction of Trends and Behaviour. Data mining helps to find
predictive data from huge databases that can be used for making predictivedecisions. Questions that usually require extensive analysis by managers can nowbe answered from data generated through data mining.
Data mining helps to identify prospects for target marketing. It uses historicdata related to promotional mailing and selects prospects that can be targeted tomaximize returns from a mail. Data mining also helps researchers to forecastfinancial well-being of the company and sounds an alert about forthcomingproblems.
• Predict cross-sell opportunities and make recommendationsWhether you have a traditional or web-based operation, you can help yourcustomers quickly locate products of interest to them—and simultaneouslyincrease the value of each communication with your customers.
• Learn parameters influencing trends in sales and marginsCan this be done with OLAP (on-line analytical processing) tools? WhileOLAP can help prove a hypothesis—this is possible only if you know whatquestions to ask in the first place. Mostly, you have no clue on whatcombination of parameters influences your operation. In these situations,data mining is the only real option.
Segment markets and personalize communicationsThere might be distinct groups of customers, patients or natural phe-
nomena that require different approaches in their handling. If you have abroad customer range, you would need to address teenagers in California andmarried homeowners in Minnesota with different products and messagesoptimize your marketing campaign.1
1 Source http://www.asicb.com/portal/modules.php?name=Content&pa=showpage&pid=26.
6.6 Data Mining 177
Automated Discovery of Hidden Patterns in Data. Huge data stored in companydatabases have enormous information regarding the company’s functioning. It isuseful to the management only if they can find the hidden patterns in the data. Datamining helps establish patterns that are followed by sales data, financial data, etc.Researchers working in financial institutions can use data mining to find out ifthere is any misappropriation of accounts etc.
Exhibit 6.2Uses of data miningData Mining can be used for:Market segmentation—Identify the characteristics of customers of each
product line and product category of a company.Customer defection—dentify customers who are most likely to shift
loyalties to competitors.Fraud detection—Identify fraudulent transactions and those which leave
loopholes for committing fraud.Direct marketing—Identify prospects for mailer promotions.Interactive marketing—Predict the tastes and preferences of visitors to a
web site.Market basket analysis—Determine product categories that are purchased
together. Example tea powder and sugar; bread and jam; soaps, shampoos,hair oils etc.
Trend analysis—To reveal the difference between typical customers thismonth and last month.2
Exhibit 6.3Data mining applicationsBanking: The Bank of America has used data mining to sculpt detailed
demographic views of the banking habits and financial assets of select groupsof customers. Querying their data warehouse averages at 30 s. The systemdraws data from the entire bank and its 30 business units, making it a trulyenterprise-wide database able to serve 1,200 users, making over 2,500complex queries daily.
Finance: Gilman Securities uses data mining to differentiate how thefinancial markets react to the volatility of different business sectors. Exam-ple: finding the relationship(s) between rate of changes between the JapaneseYen and the Government bond market.
Retail: One of the larger retailing operations in America, the Army andAir Force Exchange Service (known to military personnel as ‘the PX’) has
2 Adapted from http://www.eco.utexas.edu/*norman/BUS.FOR/course.mat/Alex/.
178 6 Data Preparation and Preliminary Analysis
Companies can link their computer networks from across branches to workthrough data and establish patterns in product sales and customer profiles. AT andT, A.C. Nielsen and American Express are some well known companies that areimplementing data mining techniques for sales and marketing. These systemsanalyse huge databases and provide insights into customer buying behaviour. Thishelps marketers to frame-winning strategies. For more examples of data miningapplications in different industrial sectors, refer Exhibit 6.3.
6.6.2 The Data Mining Process
Data mining is a 5-step process, which includes sampling, exploring, modifying,modelling and assessing as described below.
Sampling. The first step in data mining is to decide whether one should tune thesystem to work on sample data or analyse the entire data existing in the database.This decision becomes vital when the processing power of systems available withthe organization is less. If the data are very huge and the processing power islimited or speed is more important than complete analysis, it is better to drawsamples than processing the entire data. However, if data are not very large and theprocessing power is high or if it is important to understand patterns for everyrecord in the database, a researcher should not go for sampling.
Exploring. This stage starts with data preparation, which may involve cleaningdata, selecting sub-sets of records and in case of data sets with large numbers ofvariables (‘fields’), performing preliminary feature selection operations to makethe number of variables manageable (depending on the statistical methodsconsidered).
Modifying. This stage pertains to data modification if errors are detected in theexploration stage. This phase is a host to clustering, fractal-based transformation,application of fuzzy logic, data reduction programs like factor analysis,
used automated data mining to predict how much a particular woman willspend annually, given her age, her dependents and her annual wage level, totarget advertising and sales to reach the appropriate customer base.
Insurance: Winterthur Insurance has more than 1 million customers inSpain—given the higher cost of underwriting new customers compared toworking with current ones, reducing churn is an ongoing challenge. Win-terthur must predict which customers may leave and why. After imple-menting data mining applications, Winterthur was able to focus more easilyon reducing customer churn and retaining profitable customers.3
3 Source http://www.morebusiness.com/running_your_business/technology/d935705338.brc.
6.6 Data Mining 179
correspondence analysis and clustering. This stage helps to categorize newlydiscovered key variables separately.
Modelling. Different modelling techniques used in data mining consist of neuralnetworks, decision tree models, sequence-based models, classification and esti-mation models and generic-based models. Any of these can be used in the con-struction of the model once the data are prepared.
Assessing. This final step helps evaluate the performance of the designedmodel. One way to test the model is to run it for known data. For example, if youknow which segment of the given market is risky, you can check to see whetherthe model selected this segment or not.
6.7 Summary
Preparation of data in a presentable form is essential for good analysis. To makethe data collected presentable, a researcher subjects it through various processeslike validation and editing, coding, data entry and data cleaning. Each processscreens the data in its own specific way before forwarding it to the next screeningstage. The very essence of validating lies in detecting fraud or failure by theinterviewer to follow specified instructions. After validation, data moves forwardfor editing. Editing is the process where the editor checks for mistakes on the partof the interviewer or the respondent in filling the questionnaire. It tries to probe ifthe interviewer has failed to record answers to certain questions or if he or she hasfailed to follow the prescribed skip pattern. Any shortcomings are rectified and thedata are updated for the next processing stage, that is coding.
Coding is the process of assigning numbers or other symbols to answers togroup the responses into distinct categories. It assists researchers to bunch severalresponses into a few key categories that contain critical information required foranalysis. For convenience, researchers maintain a codebook that spells outguidelines for coding each of the variables that appear in the questionnaire. Thismakes it easier to code the data collected in a systematic way. After proper coding,this data are fed into a computer where the process of data cleaning takes place.Data cleaning is more thorough and extensive, as it makes use of the computer andis done in two ways, that is, error checking routines and marginal reports. Afterdata cleaning, the data are ready for analysis. Analysis means that the data aretabulated for facilitating further calculations. Tabulation can be done in variousways, prominent among which are one-way frequency tabulation and cross tabu-lation. An emerging concept in data analysis is data mining. This has a great futurefor its multi-faceted applicability. This involves discovering knowledge by ana-lysing data from various perspectives and refining it into useful information. Assuch, it has a wide variety of applications in management research because itpredicts trends and behaviours and discovers hidden patterns in data that can helpcompanies cut costs and improve profitability.
180 6 Data Preparation and Preliminary Analysis

References
Beegle RH (1981) ‘How Does the Field Rate?’ Advertising age. Oct. 20, 1980. Need honesty,better quality from research suppliers, field services’. Marketing News. 18 Sept 1981
Donald RC, Pamela SS (1999) Business research methods sixth edition. Tata McGraw-Hill, NewDelhi, p 458)
References 181
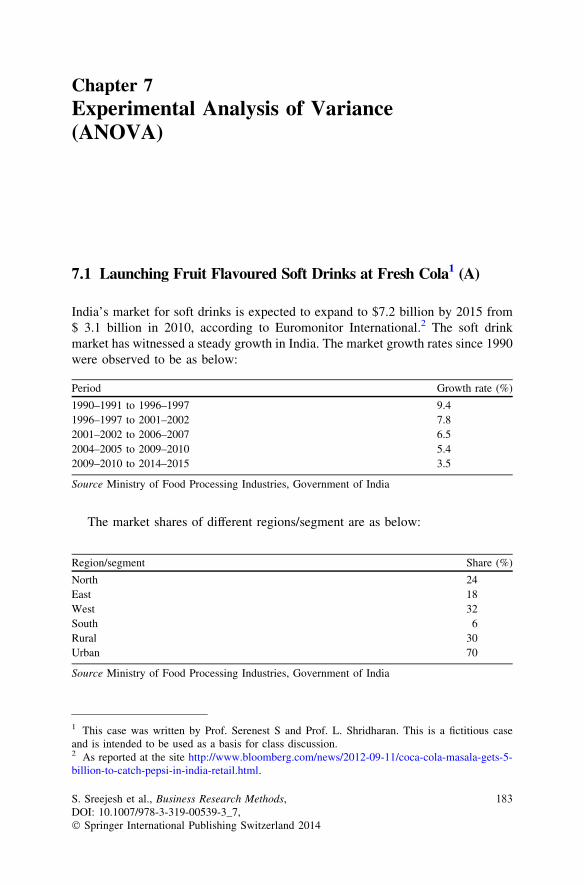
Chapter 7Experimental Analysis of Variance(ANOVA)
7.1 Launching Fruit Flavoured Soft Drinks at Fresh Cola1 (A)
India’s market for soft drinks is expected to expand to $7.2 billion by 2015 from$ 3.1 billion in 2010, according to Euromonitor International.2 The soft drinkmarket has witnessed a steady growth in India. The market growth rates since 1990were observed to be as below:
The market shares of different regions/segment are as below:
Period Growth rate (%)
1990–1991 to 1996–1997 9.41996–1997 to 2001–2002 7.82001–2002 to 2006–2007 6.52004–2005 to 2009–2010 5.42009–2010 to 2014–2015 3.5
Source Ministry of Food Processing Industries, Government of India
Region/segment Share (%)
North 24East 18West 32South 6Rural 30Urban 70
Source Ministry of Food Processing Industries, Government of India
1 This case was written by Prof. Serenest S and Prof. L. Shridharan. This is a fictitious caseand is intended to be used as a basis for class discussion.2 As reported at the site http://www.bloomberg.com/news/2012-09-11/coca-cola-masala-gets-5-billion-to-catch-pepsi-in-india-retail.html.
S. Sreejesh et al., Business Research Methods,DOI: 10.1007/978-3-319-00539-3_7,� Springer International Publishing Switzerland 2014
183
Coke and Pepsi together have a combined market share of around 95 %. Inphysical terms, the demand for aerated soft drinks has grown from 105 millioncases in 1990–1991 to 403 million cases in 2009–2010 and is expected to touch479 million cases in 2014–2015. The annual per capita consumption of soft drinksat around 5–6 l in India is considered far below the global standards. Evenneighbouring countries like Sri Lanka, Pakistan and Thailand averaged at 21, 17and 73 l, respectively.3
The low consumption rate and the large population in India leave room for localplayers as well in the soft drinks market, despite Coke and Pepsi together sharing95 % of the market. Fresh Cola, a regional player from south India, exists in thisspace, headquartered at Kochi. The company has been in existence for over twodecades, with its presence mainly in southern India. As a third-tier non-alcoholiccarbonated Beverage Company, Fresh Cola produces and sells carbonated softdrink and bottled water. Its products come from its five bottling plants, located inthe four southern states in the country.
In the meeting of the Board of Governors of the company held on 15 April2012, Mr. Narayanan Kutty, the Chairman of the company, suggested that with agrowing market in the country for non-alcoholic fruit flavoured drinks, Fresh Colamust consider entering this market segment. He asked Mr. Phillip Varghese,Director (Marketing), to look into the feasibility of introducing these drinks andpresent a report in the next board meeting scheduled to be held in October 2012.The Board also suggested that the company should go for independent and standalone brand names appealing to consumers.
After the meeting, Varghese returned to his chamber and pondered over theboard room discussion. He too felt that Fresh Cola must enter the fruit flavoureddrinks segment. The main concern was to understand consumer preferencestowards different fruit flavoured drinks. However, he realized that considerablegroundwork is needed even to zero down on the idea of launching the fruit drinksand if decided in favour, the question would be ‘which all fruit flavour drinksshould be launched’. Some focused thinking led to the following questions:
a. How to measure consumer preference when the products are not yet in themarket?
b. Can Varghese expect all flavours to be equally popular?c. Can extraneous variables like gender or age have a bearing on consumer
preferences of different brands?d. If so, how to nullify their effects in understanding consumer preferences for
different brands?e. Can the nature of store outlets have a bearing on the likelihood of purchase of
different brands?
3 Source: Ministry of Food Processing Industries, Government of India (http://mofpi.nic.in/ContentPage.aspx?CategoryId=548).
184 7 Experimental Analysis of Variance (ANOVA)
f. Could there be some additional effect due to a combination of some of thesevariables on brand purchase likelihood, besides the effects of the individualvariables?
After considerable introspection and interaction with industry peers, Vargheserealized that he would require the assistance of a professional market research firmto deal with the variety of queries listed above and the likes. Accordingly, afterconsulting his CEO, Mr. John Mathai, he invited Mr. Sreejesh Menon, VicePresident (Research), India International Research Inc. (IIRI), a leading marketresearch firm and posed his concerns to him. Menon discussed the concerns withhis research team and came out with a plan of study, which was approved byVarghese. In the first leg, a series of focus group discussions were proposed toidentify the different flavours consumers like in fruit flavoured soft drinks and thepreferred brand name for each flavour. Subsequent to resolving this issue, a seriesof experimental studies were proposed to address the other issues using a taste testof the proposed drinks. The consumer preference was to be measured throughrespondent’s rating of likelihood of purchase based on tasting the drink on 0–100scale, with 0 representing ‘no possibility of purchase’ and 100 representing ‘cer-tainty of purchase’.
IIRI got on to the job quickly. To identify the preferred flavour alternativesand brand names, IIRI conducted ten focus group interviews, with 8 respondentsin each group. The groups were spread over the age group of 10–50 years, themajor market segments. The analysis of the exploratory investigation showed thefeasibility of introducing three different varieties of fruit flavoured drinks to theirproduct line. These flavours were—apple, strawberry and grapes—with sug-gested brand names as Bravo, Delight and Cool, respectively. With these find-ings available within 10 days of study initiation, they were reported to Varghese.He appreciated the quick work and asked the R and D Department of thecompany to develop the three fruit flavoured soft drinks—Bravo (apple flavour),Delight (strawberry flavour) and Cool (grapes flavour). The R and D teamassured him that they will have the test products ready within one month. Aspromised, the R and D Department delivered the three drinks within a month.This brought IIRI to its second leg of research—the taste tests under differentexperimental conditions.
7.1.1 Experiment-1
To answer the query ‘whether all the flavours would be equally popular’, Menonplanned this experiment. A taste test was conducted with 100 randomly selectedrespondents, with each respondent exposed to only one brand assigned randomlyand data on his/her purchase likelihood of that brand was recorded.
7.1 Launching Fruit Flavoured Soft Drinks at Fresh Cola (A) 185
7.1.2 Experiment-2 (a)
The second experimental study mainly conducted to investigate whether theconsumers’ preferences significantly differ across brands (with three differentflavours), coupled with a goal to analyse whether the response differs betweenmales and females. This is mainly carried out with the gut feeling that therespondents’ preferences for these three brands will be influenced by the gender ofthe respondents. In other words, gender is used as a blocking variable (classifiedinto male and female), each block being a homogeneous group in itself.Respondents from each block are randomly assigned to the treatment groups(Bravo, Delight and Cool). Each respondent first tasted the respective brand andthen rated the likelihood of purchase for that brand.
7.1.3 Experiment-2 (b)
This experimental study focused on whether the consumers’ preferences signifi-cantly differ across brands (with three different flavours), coupled with a goal toanalyse whether the response differs among different age-groups. Once again thiswas done with the gut feeling that respondents’ preferences for these three brandswill be influenced by the age-group of the respondents. In other words, age-groupis used as a blocking variable (classified as school going, college going and adults),each block being a homogeneous group in itself. Respondents from each block arerandomly assigned to the treatment groups (Bravo, Delight and Cool). Eachrespondent first tasted the respective brand and then rated the likelihood of pur-chase for that brand.
7.1.4 Experiment-3
Menon knew from his long experience that each customer mostly buys soft drinksusually from a preferred outlet/store. In this experimental study, in addition tocontrolling age-group of consumers, he wanted to control the type of stores(defined as drug stores, supermarkets and kirana stores) from where these threebrands are likely to be purchased. To implement the design, age of the respondentsand type of stores were blocked into three levels (same as the number of levels forthe treatment variable, i.e. the brand), as shown in Table 7.1. In the Table, rowsrepresent the age-group and columns represent the type of stores, both extraneousvariables each of which are blocked into three levels. Each level of brand (theindependent variable) is then assigned randomly to each cell in the table in such away that each level of the independent variable would appear only once in eachrow and in each column.
186 7 Experimental Analysis of Variance (ANOVA)
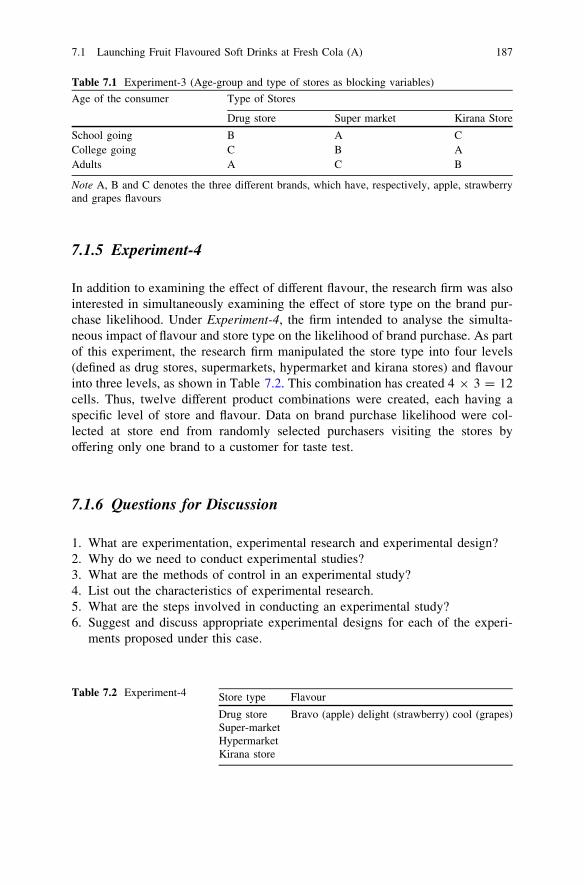
7.1.5 Experiment-4
In addition to examining the effect of different flavour, the research firm was alsointerested in simultaneously examining the effect of store type on the brand pur-chase likelihood. Under Experiment-4, the firm intended to analyse the simulta-neous impact of flavour and store type on the likelihood of brand purchase. As partof this experiment, the research firm manipulated the store type into four levels(defined as drug stores, supermarkets, hypermarket and kirana stores) and flavourinto three levels, as shown in Table 7.2. This combination has created 4 9 3 = 12cells. Thus, twelve different product combinations were created, each having aspecific level of store and flavour. Data on brand purchase likelihood were col-lected at store end from randomly selected purchasers visiting the stores byoffering only one brand to a customer for taste test.
7.1.6 Questions for Discussion
1. What are experimentation, experimental research and experimental design?2. Why do we need to conduct experimental studies?3. What are the methods of control in an experimental study?4. List out the characteristics of experimental research.5. What are the steps involved in conducting an experimental study?6. Suggest and discuss appropriate experimental designs for each of the experi-
ments proposed under this case.
Table 7.1 Experiment-3 (Age-group and type of stores as blocking variables)
Age of the consumer Type of Stores
Drug store Super market Kirana Store
School going B A CCollege going C B AAdults A C B
Note A, B and C denotes the three different brands, which have, respectively, apple, strawberryand grapes flavours
Table 7.2 Experiment-4 Store type Flavour
Drug storeSuper-marketHypermarketKirana store
Bravo (apple) delight (strawberry) cool (grapes)
7.1 Launching Fruit Flavoured Soft Drinks at Fresh Cola (A) 187
7.2 Launching Fruit Flavoured Soft Drinksat Fresh Cola (B)
After deciding on the experimental designs for each experiment, the research teamat IIRI collected data under each of the experiment reported as below:
7.2.1 Experiment-1
The file freshcola1.xls reports data for each individual on purchase likelihood forthe brand he/she was exposed to under the experiment. The data need to beanalysed to answer the above query.
7.2.2 Experiment-2 (a)
The file freshcola2.xls reports data for each individual on purchase likelihood forthe brand he/she was exposed to (reported as 1 for Bravo, 2 for Delight and 3for Cool) under the experiment, along with gender information (reported as 1 formales and 2 for females). The data need to be analysed to answer the above query.
7.2.3 Experiment-2 (b)
The data in the file freshcola2.xls was explained earlier. The file also contains dataon age-group of each respondent (reported as 1 for school children, 2 for collegestudents and 3 for adults). The data need to be analysed to answer the above query.
7.2.4 Experiment-3
The file freshcola3.xls reports data for each individual on purchase likelihood forthe brand he/she was exposed to (reported as 1 for Bravo, 2 for Delight and 3 forCool) under the experiment, along with information on the age-group of eachrespondent (reported as 1 for school children, 2 for college students and 3 foradults) and the store type where interviewed (reported as 1 for drug store, 2 forsupermarket and 3 for kirana store). The data need to be analysed to answer theabove query.
188 7 Experimental Analysis of Variance (ANOVA)
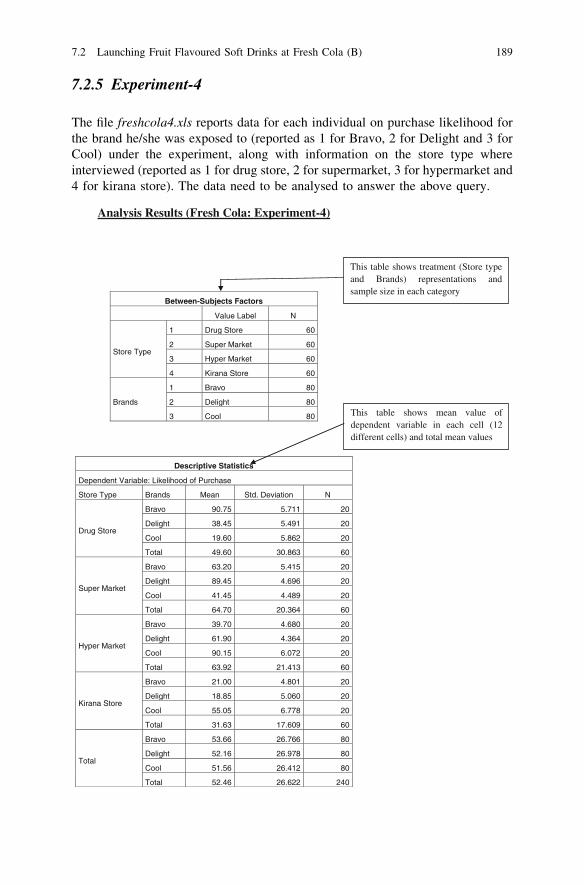
7.2.5 Experiment-4
The file freshcola4.xls reports data for each individual on purchase likelihood forthe brand he/she was exposed to (reported as 1 for Bravo, 2 for Delight and 3 forCool) under the experiment, along with information on the store type whereinterviewed (reported as 1 for drug store, 2 for supermarket, 3 for hypermarket and4 for kirana store). The data need to be analysed to answer the above query.
Analysis Results (Fresh Cola: Experiment-4)
Between-Subjects Factors
Value Label N
Store Type
1 Drug Store 60
2 Super Market 60
3 Hyper Market 60
4 Kirana Store 60
Brands
1 Bravo 80
2 Delight 80
3 Cool 80
Descriptive Statistics
Dependent Variable: Likelihood of Purchase
Store Type Brands Mean Std. Deviation N
Drug Store
Bravo 90.75 5.711 20
Delight 38.45 5.491 20
Cool 19.60 5.862 20
Total 49.60 30.863 60
Super Market
Bravo 63.20 5.415 20
Delight 89.45 4.696 20
Cool 41.45 4.489 20
Total 64.70 20.364 60
Hyper Market
Bravo 39.70 4.680 20
Delight 61.90 4.364 20
Cool 90.15 6.072 20
Total 63.92 21.413 60
Kirana Store
Bravo 21.00 4.801 20
Delight 18.85 5.060 20
Cool 55.05 6.778 20
Total 31.63 17.609 60
Total
Bravo 53.66 26.766 80
Delight 52.16 26.978 80
Cool 51.56 26.412 80
Total 52.46 26.622 240
This table shows treatment (Store type and Brands) representations and sample size in each category
This table shows mean value of dependent variable in each cell (12 different cells) and total mean values
7.2 Launching Fruit Flavoured Soft Drinks at Fresh Cola (B) 189
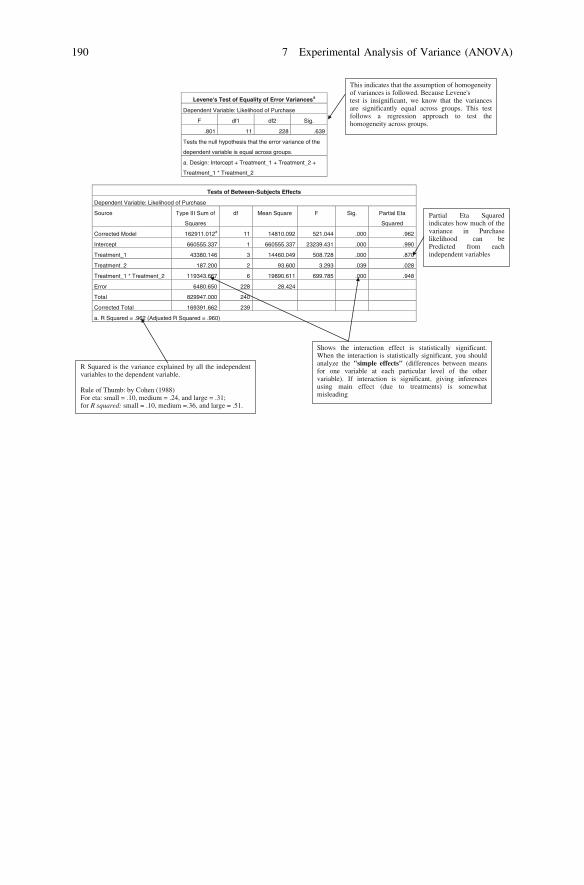
Levene's Test of Equality of Error Variancesa
Dependent Variable: Likelihood of Purchase
F df1 df2 Sig.
.801 11 228 .639
Tests the null hypothesis that the error variance of the
dependent variable is equal across groups.
a. Design: Intercept + Treatment_1 + Treatment_2 +
Treatment_1 * Treatment_2
Tests of Between-Subjects Effects
Dependent Variable: Likelihood of Purchase
Source Type III Sum of
Squares
df Mean Square F Sig. Partial Eta
Squared
Corrected Model 162911.012a 11 14810.092 521.044 .000 .962
Intercept 660555.337 1 660555.337 23239.431 .000 .990
Treatment_1 43380.146 3 14460.049 508.728 .000 .870
Treatment_2 187.200 2 93.600 3.293 .039 .028
Treatment_1 * Treatment_2 119343.667 6 19890.611 699.785 .000 .948
Error 6480.650 228 28.424
Total 829947.000 240
Corrected Total 169391.662 239
a. R Squared = .962 (Adjusted R Squared = .960)
This indicates that the assumption of homogeneityof variances is followed. Because Levene'stest is insignificant, we know that the variances are significantly equal across groups. This test follows a regression approach to test the homogeneity across groups.
Partial Eta Squaredindicates how much of the variance in Purchase likelihood can be Predicted from each independent variables
Shows the interaction effect is statistically significant. When the interaction is statistically significant, you should analyze the "simple effects" (differences between means for one variable at each particular level of the other variable). If interaction is significant, giving inferences using main effect (due to treatments) is somewhat misleading
R Squared is the variance explained by all the independent variables to the dependent variable.
Rule of Thumb: by Cohen (1988)For eta: small = .10, medium = .24, and large = .31;for R squared: small = .10, medium =.36, and large = .51.
190 7 Experimental Analysis of Variance (ANOVA)
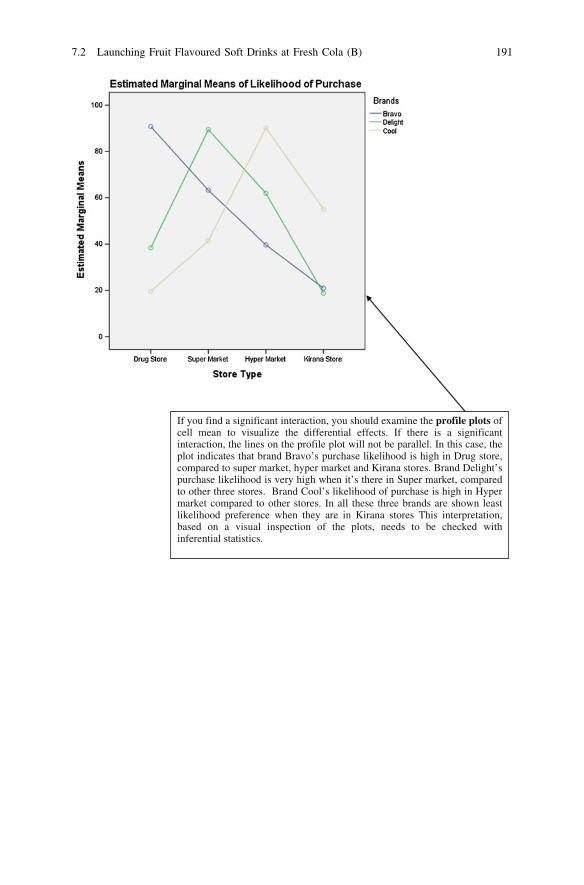
If you find a significant interaction, you should examine the profile plots of cell mean to visualize the differential effects. If there is a significant interaction, the lines on the profile plot will not be parallel. In this case, the plot indicates that brand Bravo’s purchase likelihood is high in Drug store, compared to super market, hyper market and Kirana stores. Brand Delight’s purchase likelihood is very high when it’s there in Super market, compared to other three stores. Brand Cool’s likelihood of purchase is high in Hyper market compared to other stores. In all these three brands are shown least likelihood preference when they are in Kirana stores This interpretation, based on a visual inspection of the plots, needs to be checked with inferential statistics.
7.2 Launching Fruit Flavoured Soft Drinks at Fresh Cola (B) 191
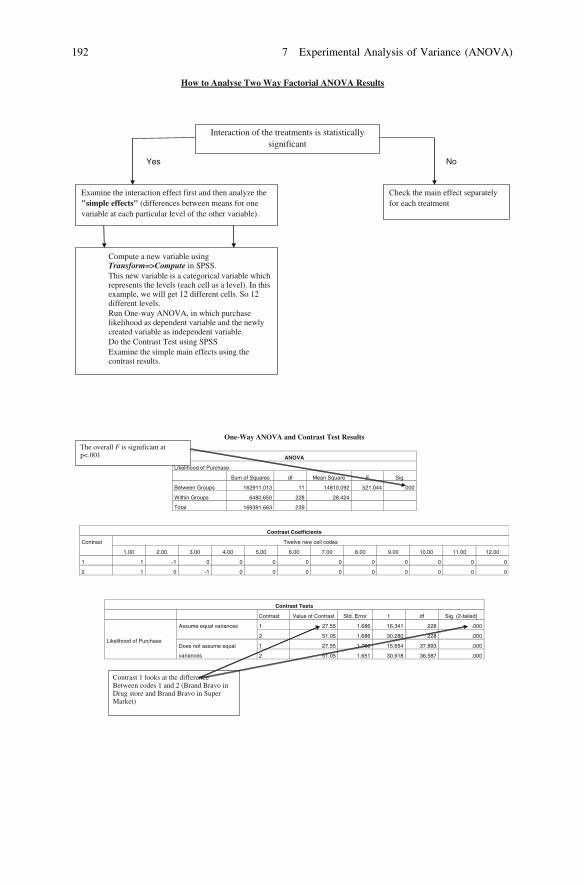
How to Analyse Two Way Factorial ANOVA Results
Interaction of the treatments is statistically significant
Yes No
Check the main effect separately for each treatment
Examine the interaction effect first and then analyze the "simple effects" (differences between means for one variable at each particular level of the other variable).
•
•
•
••
Compute a new variable using Transform=>Compute in SPSS. This new variable is a categorical variable which represents the levels (each cell as a level). In this example, we will get 12 different cells. So 12 different levels. Run One-way ANOVA, in which purchase likelihood as dependent variable and the newly created variable as independent variable. Do the Contrast Test using SPSSExamine the simple main effects using the contrast results.
One-Way ANOVA and Contrast Test Results
Contrast Coefficients
Contrast Twelve new cell codes
1.00 2.00 3.00 4.00 5.00 6.00 7.00 8.00 9.00 10.00 11.00 12.00
1 1 -1 0 0 0 0 0 0 0 0 0 0
2 1 0 -1 0 0 0 0 0 0 0 0 0
Contrast Tests
Contrast Value of Contrast Std. Error t df Sig. (2-tailed)
Likelihood of Purchase
Assume equal variances 1 27.55 1.686 16.341 228 .000
2 51.05 1.686 30.280 228 .000
Does not assume equal
variances
1 27.55 1.760 15.654 37.893 .000
2 51.05 1.651 30.918 36.587 .000
ANOVA
Likelihood of Purchase
Sum of Squares df Mean Square F Sig.
Between Groups 162911.013 11 14810.092 521.044 .000
Within Groups 6480.650 228 28.424
Total 169391.663 239
Contrast 1 looks at the difference Between codes 1 and 2 (Brand Bravo in Drug store and Brand Bravo in Super Market)
The overall F is significant at p<.001
192 7 Experimental Analysis of Variance (ANOVA)

7.2.6 Questions for Discussion
1. Suggest appropriate analysis tool for each of the experiments to draw mean-ingful conclusions on the queries. Recall that Varghese has to report to theChairman, Mr. Kutty on these at the Board meeting scheduled for October2012.
7.2 Launching Fruit Flavoured Soft Drinks at Fresh Cola (B) 193
Chapter 8Multiple Regression
8.1 Introduction
Multiple regression analysis is one of the dependence technique in which theresearcher can analyze the relationship between a single-dependent (criterion)variable and several independent variables. In multiple regression analysis, we useindependent variables whose values are known or fixed (non-stochastic) to predictthe single-dependent variable whose values are random (stochastic). In multipleregression analysis, our dependent and independent variables are metric in nature;however, in some situations, it is possible to use non-metric data as independentvariable (as dummy variable).
Gujarati and Sangeetha (2008) defined regression as:‘It is concerned with the study of the dependence of one variable, the dependent
variable, on one or more other variables, the explanatory variables, with a view toestimating and/or predicting the (population) mean or average value of the formerin terms of the known or fixed (in repeated sampling) value of the later’.
8.2 Important Assumptions of Multiple Regression
1. Linearity—the relationship between the predictors and the outcome variableshould be linear
2. Normality—the errors should be normally distributed—technically normality isnecessary only for the t-tests to be valid, estimation of the coefficients (errorsare identically and independently distributed
3. Homogeneity of variance (homoscedasticity)—the error variance should beconstant
4. Independence (no autocorrelation)—the errors associated with one observationare not correlated with errors of any other observation
5. There is no multicollinearity or perfect correlation between independentvariables.
S. Sreejesh et al., Business Research Methods,DOI: 10.1007/978-3-319-00539-3_8,� Springer International Publishing Switzerland 2014
195
Additionally, there are issues that can arise during the analysis that, whilestrictly speaking, are not assumptions of regression, are none the less, of greatconcern to regression analysis. These are
1. Outliers; it is an observation whose dependent variable value is unusual givenits values on the predictor variable (independent variable).
2. Leverage; an observation with an extreme value on a predictor variable is calleda point with high leverage.
3. Influence; an observation is said to be influential if removing the observationsubstantially changes the estimate of coefficients. Influence can be thought of asthe product of leverage and outliers.
8.3 Multiple Regression Model with Three IndependentVariables
One of the well-known supermarket chains (ABC group) in the country hasadopted an aggressive marketing decision particularly to increase the sales of itsown private brands in the last 19 months. Recently, the company decided toinvestigate its product sales in the last 19 months. In the last 19 months, thecompany has invested lot of money in three strategic areas: Advertisement,marketing (excluding advertisement and distribution) and its distribution network.The company decided to do a multiple regression analysis to predict the impact ofadvertisement, marketing, and distribution expenses on its sales (Table 8.1a).
8.4 Multiple Regression Equation
A multiple regression equation with three independent variables is given below:
Yt ¼ b1 þ b2x2t þ b3x3t þ b4x4t þ u0t ð1Þ
Salest ¼ b1 constantð Þ þ b2 Advertisement Ex:ð Þt þ b3 Marketing Ex:ð Þtþ b4 Distribution Ex:ð Þtþ u0t ð2Þ
Here, Yt is the value of the dependent variable (here it is sales) on time period t,b1 is the intercept or average value of dependent variable when all the independentvariables are absent. b2b3; and b4; are the slope of sales (partial regressioncoefficients) with respect independent variables like advertisement expenses,marketing expenses, and distribution expenses holding other variables constant.For example, the coefficient value b2 implies that one unit change (increase or
196 8 Multiple Regression
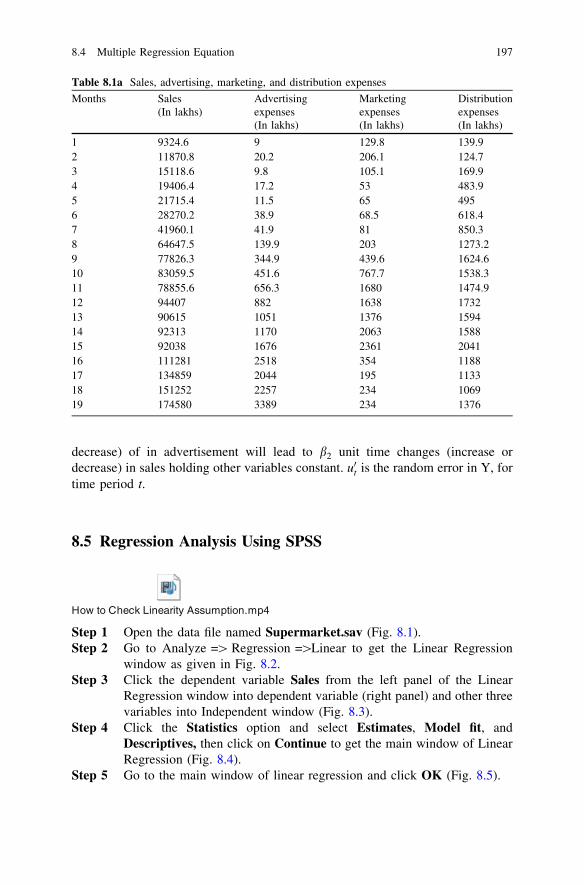
decrease) of in advertisement will lead to b2 unit time changes (increase ordecrease) in sales holding other variables constant. u0t is the random error in Y, fortime period t.
8.5 Regression Analysis Using SPSS
How to Check Linearity Assumption.mp4
Step 1 Open the data file named Supermarket.sav (Fig. 8.1).Step 2 Go to Analyze =[ Regression =[Linear to get the Linear Regression
window as given in Fig. 8.2.Step 3 Click the dependent variable Sales from the left panel of the Linear
Regression window into dependent variable (right panel) and other threevariables into Independent window (Fig. 8.3).
Step 4 Click the Statistics option and select Estimates, Model fit, andDescriptives, then click on Continue to get the main window of LinearRegression (Fig. 8.4).
Step 5 Go to the main window of linear regression and click OK (Fig. 8.5).
Table 8.1a Sales, advertising, marketing, and distribution expenses
Months Sales(In lakhs)
Advertisingexpenses(In lakhs)
Marketingexpenses(In lakhs)
Distributionexpenses(In lakhs)
1 9324.6 9 129.8 139.92 11870.8 20.2 206.1 124.73 15118.6 9.8 105.1 169.94 19406.4 17.2 53 483.95 21715.4 11.5 65 4956 28270.2 38.9 68.5 618.47 41960.1 41.9 81 850.38 64647.5 139.9 203 1273.29 77826.3 344.9 439.6 1624.610 83059.5 451.6 767.7 1538.311 78855.6 656.3 1680 1474.912 94407 882 1638 173213 90615 1051 1376 159414 92313 1170 2063 158815 92038 1676 2361 204116 111281 2518 354 118817 134859 2044 195 113318 151252 2257 234 106919 174580 3389 234 1376
8.4 Multiple Regression Equation 197
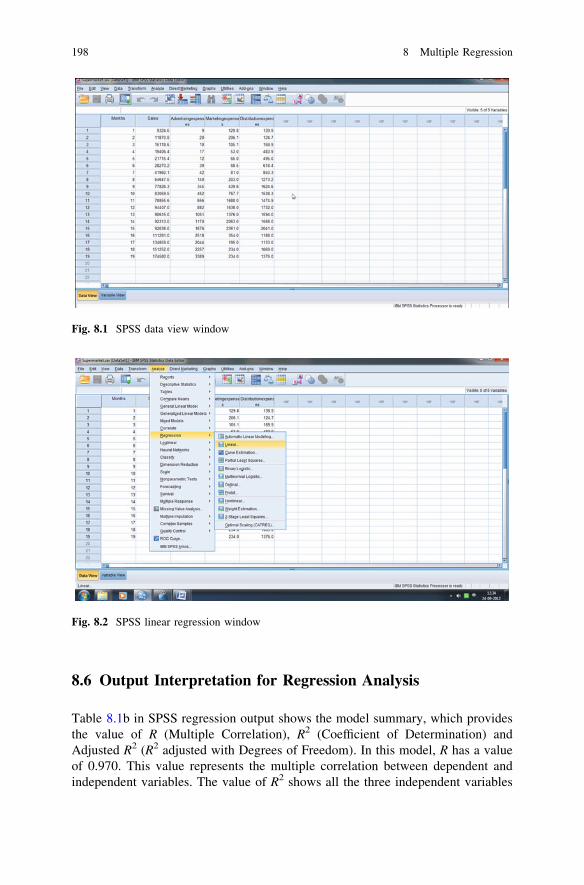
8.6 Output Interpretation for Regression Analysis
Table 8.1b in SPSS regression output shows the model summary, which providesthe value of R (Multiple Correlation), R2 (Coefficient of Determination) andAdjusted R2 (R2 adjusted with Degrees of Freedom). In this model, R has a valueof 0.970. This value represents the multiple correlation between dependent andindependent variables. The value of R2 shows all the three independent variables
Fig. 8.1 SPSS data view window
Fig. 8.2 SPSS linear regression window
198 8 Multiple Regression
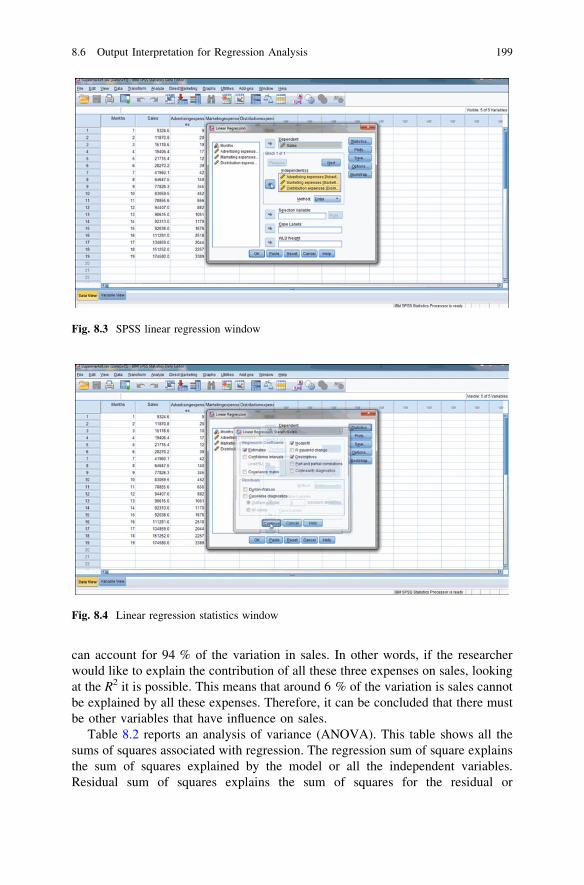
can account for 94 % of the variation in sales. In other words, if the researcherwould like to explain the contribution of all these three expenses on sales, lookingat the R2 it is possible. This means that around 6 % of the variation is sales cannotbe explained by all these expenses. Therefore, it can be concluded that there mustbe other variables that have influence on sales.
Table 8.2 reports an analysis of variance (ANOVA). This table shows all thesums of squares associated with regression. The regression sum of square explainsthe sum of squares explained by the model or all the independent variables.Residual sum of squares explains the sum of squares for the residual or
Fig. 8.3 SPSS linear regression window
Fig. 8.4 Linear regression statistics window
8.6 Output Interpretation for Regression Analysis 199
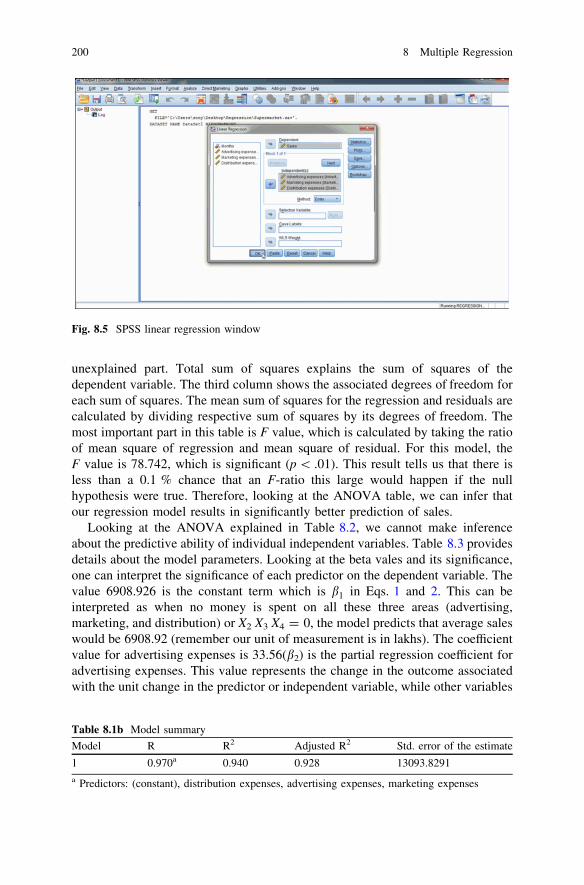
unexplained part. Total sum of squares explains the sum of squares of thedependent variable. The third column shows the associated degrees of freedom foreach sum of squares. The mean sum of squares for the regression and residuals arecalculated by dividing respective sum of squares by its degrees of freedom. Themost important part in this table is F value, which is calculated by taking the ratioof mean square of regression and mean square of residual. For this model, theF value is 78.742, which is significant (p \ .01). This result tells us that there isless than a 0.1 % chance that an F-ratio this large would happen if the nullhypothesis were true. Therefore, looking at the ANOVA table, we can infer thatour regression model results in significantly better prediction of sales.
Looking at the ANOVA explained in Table 8.2, we cannot make inferenceabout the predictive ability of individual independent variables. Table 8.3 providesdetails about the model parameters. Looking at the beta vales and its significance,one can interpret the significance of each predictor on the dependent variable. Thevalue 6908.926 is the constant term which is b1 in Eqs. 1 and 2. This can beinterpreted as when no money is spent on all these three areas (advertising,marketing, and distribution) or X2 X3 X4 = 0, the model predicts that average saleswould be 6908.92 (remember our unit of measurement is in lakhs). The coefficientvalue for advertising expenses is 33.56(b2) is the partial regression coefficient foradvertising expenses. This value represents the change in the outcome associatedwith the unit change in the predictor or independent variable, while other variables
Fig. 8.5 SPSS linear regression window
Table 8.1b Model summary
Model R R2 Adjusted R2 Std. error of the estimate
1 0.970a 0.940 0.928 13093.8291
a Predictors: (constant), distribution expenses, advertising expenses, marketing expenses
200 8 Multiple Regression
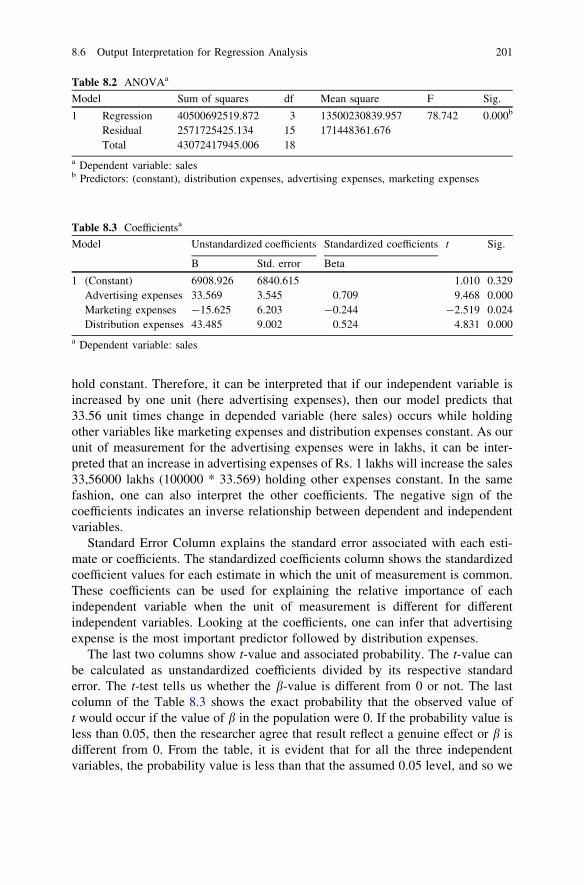
hold constant. Therefore, it can be interpreted that if our independent variable isincreased by one unit (here advertising expenses), then our model predicts that33.56 unit times change in depended variable (here sales) occurs while holdingother variables like marketing expenses and distribution expenses constant. As ourunit of measurement for the advertising expenses were in lakhs, it can be inter-preted that an increase in advertising expenses of Rs. 1 lakhs will increase the sales33,56000 lakhs (100000 * 33.569) holding other expenses constant. In the samefashion, one can also interpret the other coefficients. The negative sign of thecoefficients indicates an inverse relationship between dependent and independentvariables.
Standard Error Column explains the standard error associated with each esti-mate or coefficients. The standardized coefficients column shows the standardizedcoefficient values for each estimate in which the unit of measurement is common.These coefficients can be used for explaining the relative importance of eachindependent variable when the unit of measurement is different for differentindependent variables. Looking at the coefficients, one can infer that advertisingexpense is the most important predictor followed by distribution expenses.
The last two columns show t-value and associated probability. The t-value canbe calculated as unstandardized coefficients divided by its respective standarderror. The t-test tells us whether the b-value is different from 0 or not. The lastcolumn of the Table 8.3 shows the exact probability that the observed value oft would occur if the value of b in the population were 0. If the probability value isless than 0.05, then the researcher agree that result reflect a genuine effect or b isdifferent from 0. From the table, it is evident that for all the three independentvariables, the probability value is less than that the assumed 0.05 level, and so we
Table 8.2 ANOVAa
Model Sum of squares df Mean square F Sig.
1 Regression 40500692519.872 3 13500230839.957 78.742 0.000b
Residual 2571725425.134 15 171448361.676Total 43072417945.006 18
a Dependent variable: salesb Predictors: (constant), distribution expenses, advertising expenses, marketing expenses
Table 8.3 Coefficientsa
Model Unstandardized coefficients Standardized coefficients t Sig.
B Std. error Beta
1 (Constant) 6908.926 6840.615 1.010 0.329Advertising expenses 33.569 3.545 0.709 9.468 0.000Marketing expenses -15.625 6.203 -0.244 -2.519 0.024Distribution expenses 43.485 9.002 0.524 4.831 0.000
a Dependent variable: sales
8.6 Output Interpretation for Regression Analysis 201
can say that in all the three cases, the coefficient values are significantly differentfrom zero or it significantly contributes to the model.
8.7 Examination of Major Assumptions of MultipleRegression Analysis
8.7.1 Examination of Residual
Examining the residual provide useful insights in examining the appropriateness ofthe underlying assumptions and regression model fitted A residual is the differ-ence between the observed value of Yi and the value predicted by the regressionequation Yi.. Residuals are used in the calculation of several statistics associatedwith regression. Without verifying that your data have met the regressionassumptions, the results may be misleading.
8.7.2 Test of Linearity
When we do linear regression, we assume that the relationship between theresponse variable and the predictors is linear. This is the assumption of linearity. Ifthis assumption is violated, the linear regression will try to fit a straight line to datathat does not follow a straight line. Checking the linear assumption in the case ofsimple regression is straightforward, since we only have one predictor. All wehave to do is a scatter plot between the each response variable (independentvariable) and the predictor (dependent variable) to see if nonlinearity is present,such as a curved band or a big wave-shaped curve. The examination of linearitycan be examined through the following video.
How to Check Normality Assumption.mp4
8.7.3 Test of Normality
The assumption of a normally distributed error term can be examined by con-structing a histogram of the residuals. A visual check reveals whether the distri-bution is normal. It is also useful to examine the normal probability of plot ofstandardized residuals compared with expected standardized residuals from thenormal distribution. If the observed residuals are normally distributed, they willfall on the 45-degree line. Additional evidence can be obtained by determining the
202 8 Multiple Regression
percentages of residuals falling within ± 2 SE or ± 2.5 SE. More formal assess-ment can be made by running the tests: Shapiro–Wilk, Kolmogorov–Smirnov,Cramer–von Mises and Anderson–Darling.1
How to Autocorrelation Assumption.mp4
8.7.4 Test of Homogeneity of Variance (Homoscedasticity)
The assumption of constant variance of the error term can be examined by plottingthe residuals against the predicted values of the dependent variable, Yi. If thepattern is not random, the variance of the error term is not constant. See the videoHow to check Normality Assumption.
8.7.5 Test of Autocorrelation
How to Check No Multicollinearity Assumption.mp4
A plot of residuals against time, or the sequence of observations, will throwsome light on the assumption that the error terms are uncorrelated or no auto-correlation. A random pattern should be seen if this assumption is true. A moreformal procedure for examining the correlations between the error terms is theDurbin–Watson test (Applicable only for time series data).
8.7.6 Test of Multicollinearity
The presence of multicollinearity or perfect linear relationship between indepen-dent variables can be identified using different methods. These methods are:
1. VIF (Variance-Inflating factor): As a rule of thumb, If the VIF value exceeds10, which will happen only if correlation between independent variablesexceeds 0.90, that variable is said to be highly collinear (Gujarati andSangeetha 2008).
1 Null hypothesis the observations are normally distributed, alternative hypothesis not normallydistributed.
8.7 Examination of Major Assumptions 203
2. TOL (Tolerance): The closer the TOL to zero, the greater the degree of col-linearity of the variables (Gujarati and Sangeetha 2008).
3. Conditional Index (CI): If CI exceeds 30, there is severe multicollinearity(Gujarati and Sangeetha 2008).
4. Partial Correlations: High partial correlation between independent variablesalso shows the presence of multicollinearity.
How to Check No Multicollinearity Assumption.mp4
8.7.7 Questions
Examine the following fictitious data
Model R R2 Adjusted R square Std. error of the estimate1 0.863 0.849 0.850 13.8767
1. Which of the following statements can we not say?
(a) The standard error is an estimate of the variance of y, for each value of x.(b) In order to obtain a measure of explained variance, you need to square
the correlation coefficient.(c) The correlation between x and y is 86 %.d) The correlation is good here as the data points cluster around the line of fit
quite well. So prediction will be good.(e) The correlation between x and y is 85 %.
2. The slope of the line is called:
(a) Which gives us a measure of how much y changes as x changes.(b) Is the point where the regression line cuts the vertical axis.(c) A correlation coefficient indicates the variability of the points around the
regression line in the scatter diagram.(d) None of the above.(e) The average value of the dependent variable.
3. Using some fictitious data, we wish to predict the musical ability for a personwho scores 8 on a test for mathematical ability. We know the relationship ispositive. We know that the slope is 1.63 and the intercept is 8.41. What is theirpredicted score on musical ability?
204 8 Multiple Regression
(a) 80.32(b) -4.63(c) 21.45(d) 68.91(e) 54.55
4. We have a negative relationship between number of drinks consumed andnumber of marks in a driving test. One individual scores 3 on number of drinksconsumed, another individual scores 5 on number of drinks consumed. Whatwill be their respective scores on the driving test if the intercept is 18 and theslope 3?
(a) It is not possible to predict from negative relationships.(b) Driving test scores (Y-axis) will be 51 and 87 [individual who scored 5 on
drink consumption].(c) Driving test scores (Y-axis) will be 27 [individual who scored 3 on drink
consumption] and 33 [individual who scored 5 on drink consumption].(d) Driving test scores (Y-axis) will be 9 [individual who scored 3 on drink
consumption] and 3 [individual who scored 5 on drink consumption].(e) None of these.
5. You are still interested in whether problem-solving ability can predict theability to cope well in difficult situations; whether motivation can predictcoping and whether these two factors together predict coping even better. Youproduce some more results.
Dependent variable coping skills in difficult situations
Unstandardized coefficients Standardized coefficients t Sig.
B Std. error BetaConstant -0.466 0.241 1.036 0.302Problem 0.200 0.048 0.140 2.082 0.030Motivation 0.950 0.087 0.740 10.97 0.000
Which of the following statements is incorrect?
(a) As motivation increases by one standard deviation, coping skills increases byalmost three quarters of a standard deviation (0.74). Thus, motivation appearsto contribute more to coping skills than problem solving.
(b) As motivation increases by one unit coping skills increases by 0.95.
8.7 Examination of Major Assumptions 205

(c) The t-value for problem solving is 2.082 and the associated probability is0.03. This tells us the likelihood of such a result arising by sampling error,assuming the null hypothesis is true, is 97 in 100.
(d) Problem solving has a regression coefficient of 0.20. Therefore, as problemsolving increases by one unit coping skills increases by 0.20.
(e) None of these.
206 8 Multiple Regression
Chapter 9Exploratory Factor and PrincipalComponent Analysis
Chapter Overview
This chapter provides an introduction to Factor Analysis (FA): A procedure todefine the underlying structure among the variables in the analysis. The chapterprovides general requirements, statistical assumptions and conceptual assumptionsbehind FA. This chapter explains the way to do FA with IBM SPSS 20.0. It showshow to determine the number of factors to retain, interpret the rotated solution,create factor scores and summarize the results. Fictitious data from two studies areanalysed to illustrate these procedures. The present chapter deals only with thecreation of orthogonal (uncorrelated) components.
9.1 What is Factor Analysis
According to Hair et al. (2010),1 ‘factor analysis is an interdependence techniquewhose primary purpose is to define the underlying structure among the variables inthe analysis’. Suppose a marketing researcher wants to identify the underlyingdimensions of retail brand attractiveness. He begins by administering the retailbrand attractiveness scale from the existing literature to a large sample of people(N = 2000) during their visit in a particular retail store. Assume that there are fivedifferent dimensions, which consist of 30 different items. What the researcher willend up with these 30 different observed variables, the mass number as such willsay very little about the underlying dimension of this retail attractiveness. Onaverage, some of the scores will be high, some will be low and some intermediate,but interpretation of these scores will be extremely difficult if not impossible. Thisis where the tool factor analysis (FA) comes in handy and it allows the researcherin ‘data reduction’ and ‘data summarization’ of this large pool of items to a fewrepresentative factors or dimensions, which could be used for further multivariate
1 See Ref. Hair et al. (2010).
S. Sreejesh et al., Business Research Methods,DOI: 10.1007/978-3-319-00539-3_9,� Springer International Publishing Switzerland 2014
207
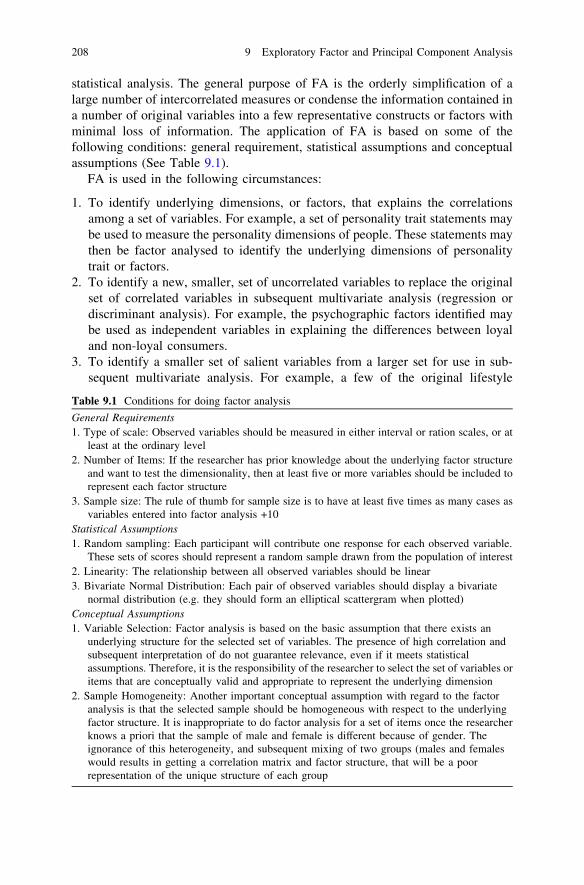
statistical analysis. The general purpose of FA is the orderly simplification of alarge number of intercorrelated measures or condense the information contained ina number of original variables into a few representative constructs or factors withminimal loss of information. The application of FA is based on some of thefollowing conditions: general requirement, statistical assumptions and conceptualassumptions (See Table 9.1).
FA is used in the following circumstances:
1. To identify underlying dimensions, or factors, that explains the correlationsamong a set of variables. For example, a set of personality trait statements maybe used to measure the personality dimensions of people. These statements maythen be factor analysed to identify the underlying dimensions of personalitytrait or factors.
2. To identify a new, smaller, set of uncorrelated variables to replace the originalset of correlated variables in subsequent multivariate analysis (regression ordiscriminant analysis). For example, the psychographic factors identified maybe used as independent variables in explaining the differences between loyaland non-loyal consumers.
3. To identify a smaller set of salient variables from a larger set for use in sub-sequent multivariate analysis. For example, a few of the original lifestyle
Table 9.1 Conditions for doing factor analysis
General Requirements1. Type of scale: Observed variables should be measured in either interval or ration scales, or at
least at the ordinary level2. Number of Items: If the researcher has prior knowledge about the underlying factor structure
and want to test the dimensionality, then at least five or more variables should be included torepresent each factor structure
3. Sample size: The rule of thumb for sample size is to have at least five times as many cases asvariables entered into factor analysis +10
Statistical Assumptions1. Random sampling: Each participant will contribute one response for each observed variable.
These sets of scores should represent a random sample drawn from the population of interest2. Linearity: The relationship between all observed variables should be linear3. Bivariate Normal Distribution: Each pair of observed variables should display a bivariate
normal distribution (e.g. they should form an elliptical scattergram when plotted)Conceptual Assumptions1. Variable Selection: Factor analysis is based on the basic assumption that there exists an
underlying structure for the selected set of variables. The presence of high correlation andsubsequent interpretation of do not guarantee relevance, even if it meets statisticalassumptions. Therefore, it is the responsibility of the researcher to select the set of variables oritems that are conceptually valid and appropriate to represent the underlying dimension
2. Sample Homogeneity: Another important conceptual assumption with regard to the factoranalysis is that the selected sample should be homogeneous with respect to the underlyingfactor structure. It is inappropriate to do factor analysis for a set of items once the researcherknows a priori that the sample of male and female is different because of gender. Theignorance of this heterogeneity, and subsequent mixing of two groups (males and femaleswould results in getting a correlation matrix and factor structure, that will be a poorrepresentation of the unique structure of each group
208 9 Exploratory Factor and Principal Component Analysis
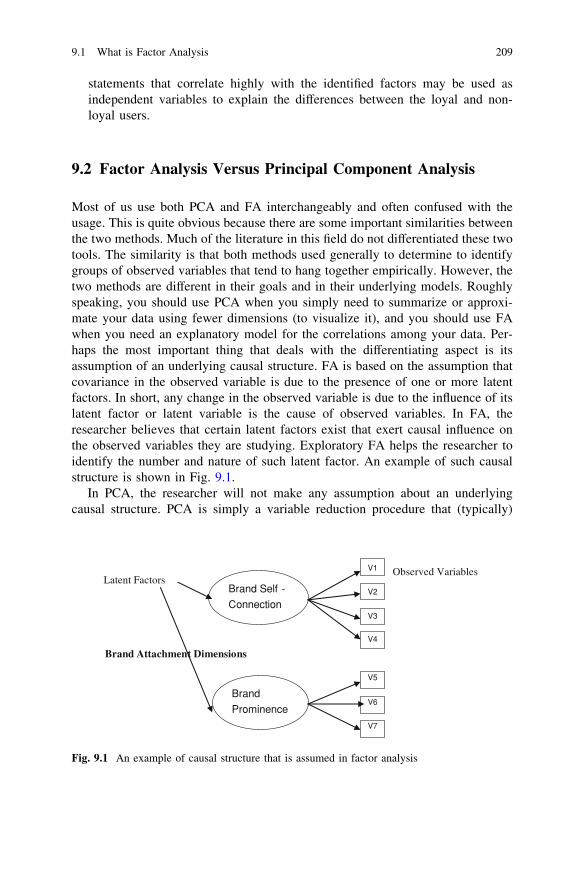
statements that correlate highly with the identified factors may be used asindependent variables to explain the differences between the loyal and non-loyal users.
9.2 Factor Analysis Versus Principal Component Analysis
Most of us use both PCA and FA interchangeably and often confused with theusage. This is quite obvious because there are some important similarities betweenthe two methods. Much of the literature in this field do not differentiated these twotools. The similarity is that both methods used generally to determine to identifygroups of observed variables that tend to hang together empirically. However, thetwo methods are different in their goals and in their underlying models. Roughlyspeaking, you should use PCA when you simply need to summarize or approxi-mate your data using fewer dimensions (to visualize it), and you should use FAwhen you need an explanatory model for the correlations among your data. Per-haps the most important thing that deals with the differentiating aspect is itsassumption of an underlying causal structure. FA is based on the assumption thatcovariance in the observed variable is due to the presence of one or more latentfactors. In short, any change in the observed variable is due to the influence of itslatent factor or latent variable is the cause of observed variables. In FA, theresearcher believes that certain latent factors exist that exert causal influence onthe observed variables they are studying. Exploratory FA helps the researcher toidentify the number and nature of such latent factor. An example of such causalstructure is shown in Fig. 9.1.
In PCA, the researcher will not make any assumption about an underlyingcausal structure. PCA is simply a variable reduction procedure that (typically)
Observed Variables Latent Factors
Brand Attachment Dimensions
Brand Self -
Connection
Brand
Prominence
V1
V2
V3
V4
V5
V6
V7
Fig. 9.1 An example of causal structure that is assumed in factor analysis
9.1 What is Factor Analysis 209
results in a relatively small number of components that account for most of thevariance in a set of observed variables (i.e. groupings of observed variables vs.latent constructs).
http://www.youtube.com/watch?v=znrfcV4ZvlQhttp://www.youtube.com/watch?NR=1&feature=endscreen&v=pmMPXUtk
QCc
9.3 A Hypothetical Example of Factor Analysis
Consider a construction company (ABC Builders) that is planning to build anapartment complex near a university. Suppose the company is interested inidentifying the perception of the university faculties regarding the value con-sciousness,2 price consciousness3 and purchase decision involvement (PDI),4 andsale proneness5 that would help the company to construct and design apartmentsaccording to the target people. The company hired a marketing research firm todetermine how these four major response dimensions the faculties concerned aboutbefore buying an apartment. The research firm identified the scale to measure thesethree constructs using some existing literature in price consciousness (3-item 5-point Likert scale), value consciousness (3-item 5-point Likert scale), saleproneness (2-item 5-point Likert scale) and PDI (4-item measure on 5-pointbipolar phrases). The firm surveyed 98 randomly selected respondents (faculties),using different scales to determine the perception of the faculties with regard to thePDI, price, value consciousness and sale proneness. Table 9.2 shows the selecteditems for measuring the above-mentioned constructs.
Variables were labelled as V1 through V12. The data were analysed using PCAand the varimax rotation procedure. Let us begin with how this can be achieved byperforming FA. Given below are the steps of SPSS operations that are adopted forperforming FA.
2 Value consciousness is defined as a concern for price paid relative to quality received(Lichtenstein et al. 1993).3 Price consciousness is the degree to which the consumer focuses exclusively on paying lowprices (Lichtenstein et al. 1993).4 Purchase decision involvement (PDI) is defined as the extent of interest and concern that aconsumer brings to bear upon a purchase-decision task (Mittal 1989). This scale considerspurchase decision task as its goal object, and is considered mindset-not response behaviour.5 Sale proneness is defined as an increased propensity to respond to a purchase offer because thesale form in which the price is presented positively affects purchase evaluations (Lichtensteinet al. 1990).
210 9 Exploratory Factor and Principal Component Analysis
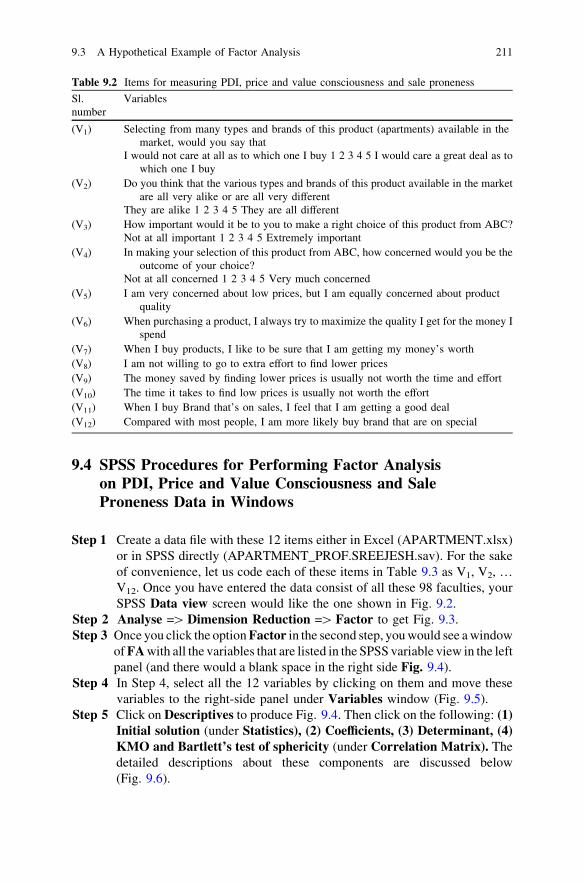
9.4 SPSS Procedures for Performing Factor Analysison PDI, Price and Value Consciousness and SaleProneness Data in Windows
Step 1 Create a data file with these 12 items either in Excel (APARTMENT.xlsx)or in SPSS directly (APARTMENT_PROF.SREEJESH.sav). For the sakeof convenience, let us code each of these items in Table 9.3 as V1, V2, …V12. Once you have entered the data consist of all these 98 faculties, yourSPSS Data view screen would like the one shown in Fig. 9.2.
Step 2 Analyse =[ Dimension Reduction =[ Factor to get Fig. 9.3.Step 3 Once you click the option Factor in the second step, you would see a window
of FA with all the variables that are listed in the SPSS variable view in the leftpanel (and there would a blank space in the right side Fig. 9.4).
Step 4 In Step 4, select all the 12 variables by clicking on them and move thesevariables to the right-side panel under Variables window (Fig. 9.5).
Step 5 Click on Descriptives to produce Fig. 9.4. Then click on the following: (1)Initial solution (under Statistics), (2) Coefficients, (3) Determinant, (4)KMO and Bartlett’s test of sphericity (under Correlation Matrix). Thedetailed descriptions about these components are discussed below(Fig. 9.6).
Table 9.2 Items for measuring PDI, price and value consciousness and sale proneness
Sl.number
Variables
(V1) Selecting from many types and brands of this product (apartments) available in themarket, would you say that
I would not care at all as to which one I buy 1 2 3 4 5 I would care a great deal as towhich one I buy
(V2) Do you think that the various types and brands of this product available in the marketare all very alike or are all very different
They are alike 1 2 3 4 5 They are all different(V3) How important would it be to you to make a right choice of this product from ABC?
Not at all important 1 2 3 4 5 Extremely important(V4) In making your selection of this product from ABC, how concerned would you be the
outcome of your choice?Not at all concerned 1 2 3 4 5 Very much concerned
(V5) I am very concerned about low prices, but I am equally concerned about productquality
(V6) When purchasing a product, I always try to maximize the quality I get for the money Ispend
(V7) When I buy products, I like to be sure that I am getting my money’s worth(V8) I am not willing to go to extra effort to find lower prices(V9) The money saved by finding lower prices is usually not worth the time and effort(V10) The time it takes to find low prices is usually not worth the effort(V11) When I buy Brand that’s on sales, I feel that I am getting a good deal(V12) Compared with most people, I am more likely buy brand that are on special
9.3 A Hypothetical Example of Factor Analysis 211
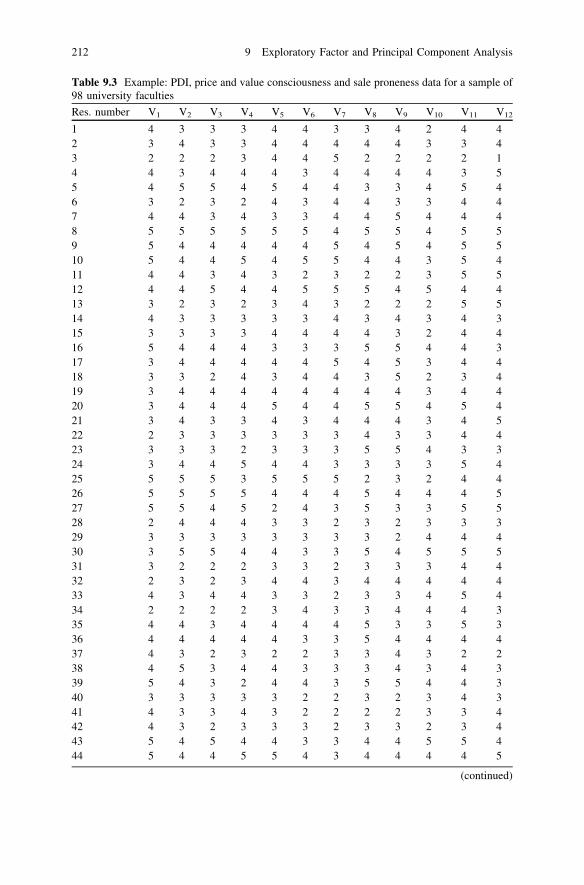
Table 9.3 Example: PDI, price and value consciousness and sale proneness data for a sample of98 university faculties
Res. number V1 V2 V3 V4 V5 V6 V7 V8 V9 V10 V11 V12
1 4 3 3 3 4 4 3 3 4 2 4 42 3 4 3 3 4 4 4 4 4 3 3 43 2 2 2 3 4 4 5 2 2 2 2 14 4 3 4 4 4 3 4 4 4 4 3 55 4 5 5 4 5 4 4 3 3 4 5 46 3 2 3 2 4 3 4 4 3 3 4 47 4 4 3 4 3 3 4 4 5 4 4 48 5 5 5 5 5 5 4 5 5 4 5 59 5 4 4 4 4 4 5 4 5 4 5 510 5 4 4 5 4 5 5 4 4 3 5 411 4 4 3 4 3 2 3 2 2 3 5 512 4 4 5 4 4 5 5 5 4 5 4 413 3 2 3 2 3 4 3 2 2 2 5 514 4 3 3 3 3 3 4 3 4 3 4 315 3 3 3 3 4 4 4 4 3 2 4 416 5 4 4 4 3 3 3 5 5 4 4 317 3 4 4 4 4 4 5 4 5 3 4 418 3 3 2 4 3 4 4 3 5 2 3 419 3 4 4 4 4 4 4 4 4 3 4 420 3 4 4 4 5 4 4 5 5 4 5 421 3 4 3 3 4 3 4 4 4 3 4 522 2 3 3 3 3 3 3 4 3 3 4 423 3 3 3 2 3 3 3 5 5 4 3 324 3 4 4 5 4 4 3 3 3 3 5 425 5 5 5 3 5 5 5 2 3 2 4 426 5 5 5 5 4 4 4 5 4 4 4 527 5 5 4 5 2 4 3 5 3 3 5 528 2 4 4 4 3 3 2 3 2 3 3 329 3 3 3 3 3 3 3 3 2 4 4 430 3 5 5 4 4 3 3 5 4 5 5 531 3 2 2 2 3 3 2 3 3 3 4 432 2 3 2 3 4 4 3 4 4 4 4 433 4 3 4 4 3 3 2 3 3 4 5 434 2 2 2 2 3 4 3 3 4 4 4 335 4 4 3 4 4 4 4 5 3 3 5 336 4 4 4 4 4 3 3 5 4 4 4 437 4 3 2 3 2 2 3 3 4 3 2 238 4 5 3 4 4 3 3 3 4 3 4 339 5 4 3 2 4 4 3 5 5 4 4 340 3 3 3 3 3 2 2 3 2 3 4 341 4 3 3 4 3 2 2 2 2 3 3 442 4 3 2 3 3 3 2 3 3 2 3 443 5 4 5 4 4 3 3 4 4 5 5 444 5 4 4 5 5 4 3 4 4 4 4 5
(continued)
212 9 Exploratory Factor and Principal Component Analysis
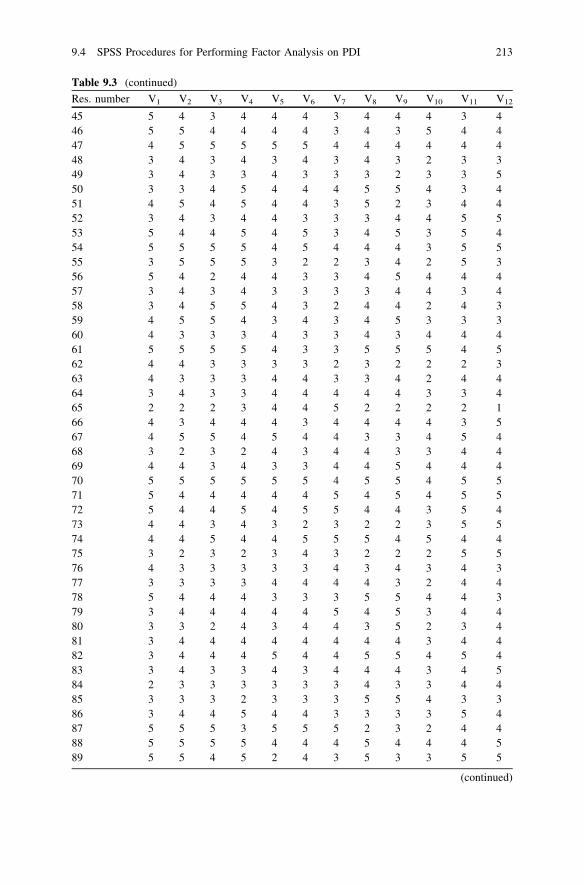
Table 9.3 (continued)
Res. number V1 V2 V3 V4 V5 V6 V7 V8 V9 V10 V11 V12
45 5 4 3 4 4 4 3 4 4 4 3 446 5 5 4 4 4 4 3 4 3 5 4 447 4 5 5 5 5 5 4 4 4 4 4 448 3 4 3 4 3 4 3 4 3 2 3 349 3 4 3 3 4 3 3 3 2 3 3 550 3 3 4 5 4 4 4 5 5 4 3 451 4 5 4 5 4 4 3 5 2 3 4 452 3 4 3 4 4 3 3 3 4 4 5 553 5 4 4 5 4 5 3 4 5 3 5 454 5 5 5 5 4 5 4 4 4 3 5 555 3 5 5 5 3 2 2 3 4 2 5 356 5 4 2 4 4 3 3 4 5 4 4 457 3 4 3 4 3 3 3 3 4 4 3 458 3 4 5 5 4 3 2 4 4 2 4 359 4 5 5 4 3 4 3 4 5 3 3 360 4 3 3 3 4 3 3 4 3 4 4 461 5 5 5 5 4 3 3 5 5 5 4 562 4 4 3 3 3 3 2 3 2 2 2 363 4 3 3 3 4 4 3 3 4 2 4 464 3 4 3 3 4 4 4 4 4 3 3 465 2 2 2 3 4 4 5 2 2 2 2 166 4 3 4 4 4 3 4 4 4 4 3 567 4 5 5 4 5 4 4 3 3 4 5 468 3 2 3 2 4 3 4 4 3 3 4 469 4 4 3 4 3 3 4 4 5 4 4 470 5 5 5 5 5 5 4 5 5 4 5 571 5 4 4 4 4 4 5 4 5 4 5 572 5 4 4 5 4 5 5 4 4 3 5 473 4 4 3 4 3 2 3 2 2 3 5 574 4 4 5 4 4 5 5 5 4 5 4 475 3 2 3 2 3 4 3 2 2 2 5 576 4 3 3 3 3 3 4 3 4 3 4 377 3 3 3 3 4 4 4 4 3 2 4 478 5 4 4 4 3 3 3 5 5 4 4 379 3 4 4 4 4 4 5 4 5 3 4 480 3 3 2 4 3 4 4 3 5 2 3 481 3 4 4 4 4 4 4 4 4 3 4 482 3 4 4 4 5 4 4 5 5 4 5 483 3 4 3 3 4 3 4 4 4 3 4 584 2 3 3 3 3 3 3 4 3 3 4 485 3 3 3 2 3 3 3 5 5 4 3 386 3 4 4 5 4 4 3 3 3 3 5 487 5 5 5 3 5 5 5 2 3 2 4 488 5 5 5 5 4 4 4 5 4 4 4 589 5 5 4 5 2 4 3 5 3 3 5 5
(continued)
9.4 SPSS Procedures for Performing Factor Analysis on PDI 213
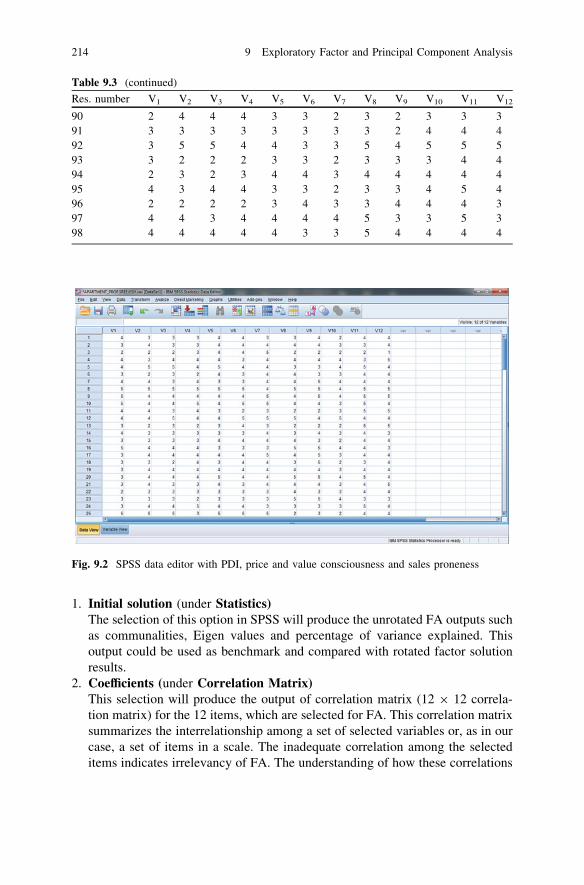
1. Initial solution (under Statistics)The selection of this option in SPSS will produce the unrotated FA outputs suchas communalities, Eigen values and percentage of variance explained. Thisoutput could be used as benchmark and compared with rotated factor solutionresults.
2. Coefficients (under Correlation Matrix)This selection will produce the output of correlation matrix (12 9 12 correla-tion matrix) for the 12 items, which are selected for FA. This correlation matrixsummarizes the interrelationship among a set of selected variables or, as in ourcase, a set of items in a scale. The inadequate correlation among the selecteditems indicates irrelevancy of FA. The understanding of how these correlations
Table 9.3 (continued)
Res. number V1 V2 V3 V4 V5 V6 V7 V8 V9 V10 V11 V12
90 2 4 4 4 3 3 2 3 2 3 3 391 3 3 3 3 3 3 3 3 2 4 4 492 3 5 5 4 4 3 3 5 4 5 5 593 3 2 2 2 3 3 2 3 3 3 4 494 2 3 2 3 4 4 3 4 4 4 4 495 4 3 4 4 3 3 2 3 3 4 5 496 2 2 2 2 3 4 3 3 4 4 4 397 4 4 3 4 4 4 4 5 3 3 5 398 4 4 4 4 4 3 3 5 4 4 4 4
Fig. 9.2 SPSS data editor with PDI, price and value consciousness and sales proneness
214 9 Exploratory Factor and Principal Component Analysis
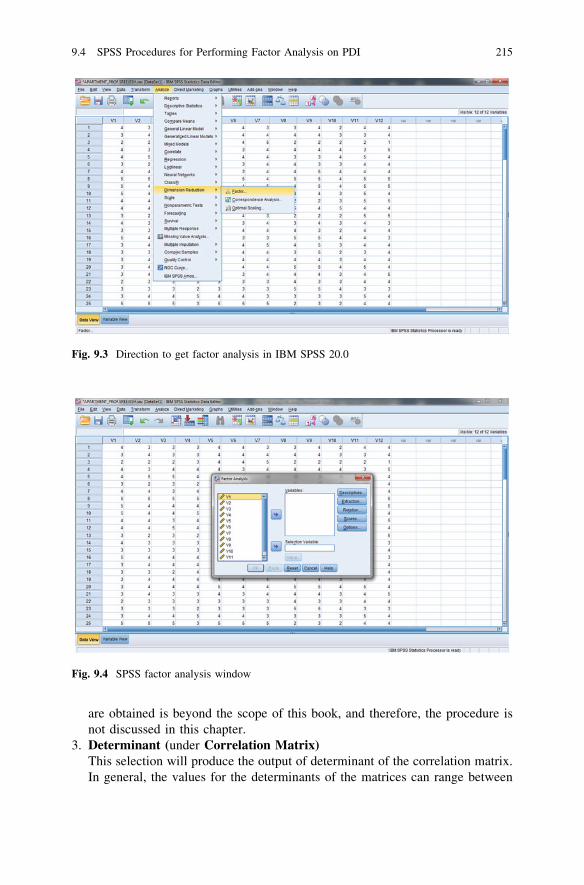
are obtained is beyond the scope of this book, and therefore, the procedure isnot discussed in this chapter.
3. Determinant (under Correlation Matrix)This selection will produce the output of determinant of the correlation matrix.In general, the values for the determinants of the matrices can range between
Fig. 9.3 Direction to get factor analysis in IBM SPSS 20.0
Fig. 9.4 SPSS factor analysis window
9.4 SPSS Procedures for Performing Factor Analysis on PDI 215
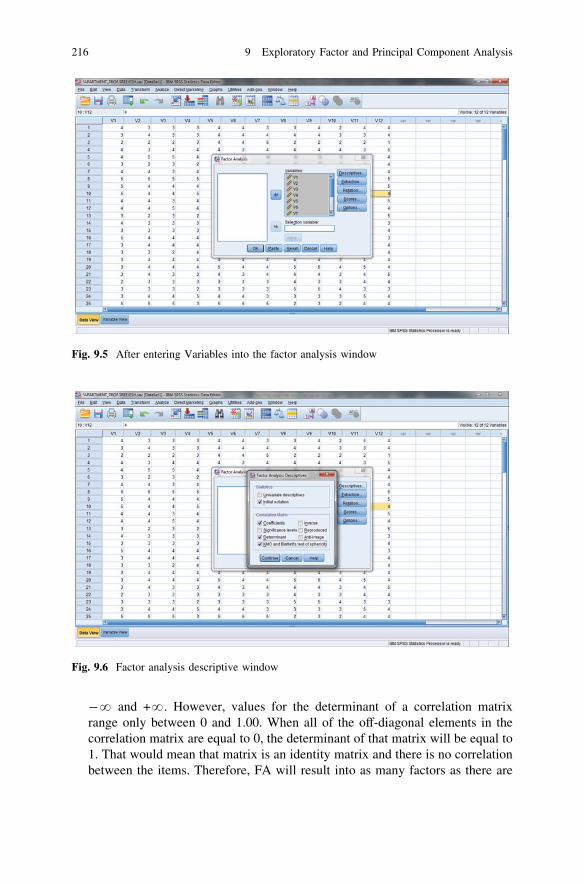
-? and +?. However, values for the determinant of a correlation matrixrange only between 0 and 1.00. When all of the off-diagonal elements in thecorrelation matrix are equal to 0, the determinant of that matrix will be equal to1. That would mean that matrix is an identity matrix and there is no correlationbetween the items. Therefore, FA will result into as many factors as there are
Fig. 9.5 After entering Variables into the factor analysis window
Fig. 9.6 Factor analysis descriptive window
216 9 Exploratory Factor and Principal Component Analysis
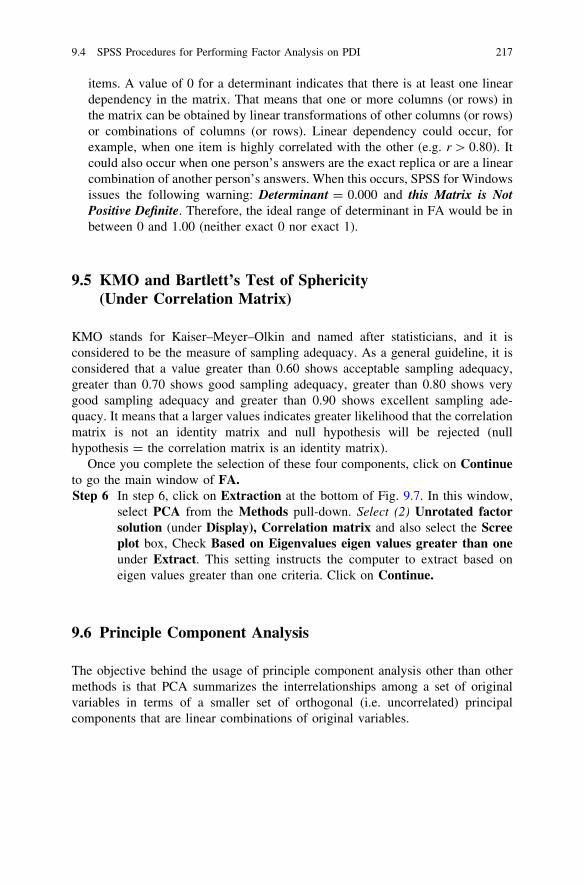
items. A value of 0 for a determinant indicates that there is at least one lineardependency in the matrix. That means that one or more columns (or rows) inthe matrix can be obtained by linear transformations of other columns (or rows)or combinations of columns (or rows). Linear dependency could occur, forexample, when one item is highly correlated with the other (e.g. r [ 0.80). Itcould also occur when one person’s answers are the exact replica or are a linearcombination of another person’s answers. When this occurs, SPSS for Windowsissues the following warning: Determinant = 0.000 and this Matrix is NotPositive Definite. Therefore, the ideal range of determinant in FA would be inbetween 0 and 1.00 (neither exact 0 nor exact 1).
9.5 KMO and Bartlett’s Test of Sphericity(Under Correlation Matrix)
KMO stands for Kaiser–Meyer–Olkin and named after statisticians, and it isconsidered to be the measure of sampling adequacy. As a general guideline, it isconsidered that a value greater than 0.60 shows acceptable sampling adequacy,greater than 0.70 shows good sampling adequacy, greater than 0.80 shows verygood sampling adequacy and greater than 0.90 shows excellent sampling ade-quacy. It means that a larger values indicates greater likelihood that the correlationmatrix is not an identity matrix and null hypothesis will be rejected (nullhypothesis = the correlation matrix is an identity matrix).
Once you complete the selection of these four components, click on Continueto go the main window of FA.Step 6 In step 6, click on Extraction at the bottom of Fig. 9.7. In this window,
select PCA from the Methods pull-down. Select (2) Unrotated factorsolution (under Display), Correlation matrix and also select the Screeplot box, Check Based on Eigenvalues eigen values greater than oneunder Extract. This setting instructs the computer to extract based oneigen values greater than one criteria. Click on Continue.
9.6 Principle Component Analysis
The objective behind the usage of principle component analysis other than othermethods is that PCA summarizes the interrelationships among a set of originalvariables in terms of a smaller set of orthogonal (i.e. uncorrelated) principalcomponents that are linear combinations of original variables.
9.4 SPSS Procedures for Performing Factor Analysis on PDI 217
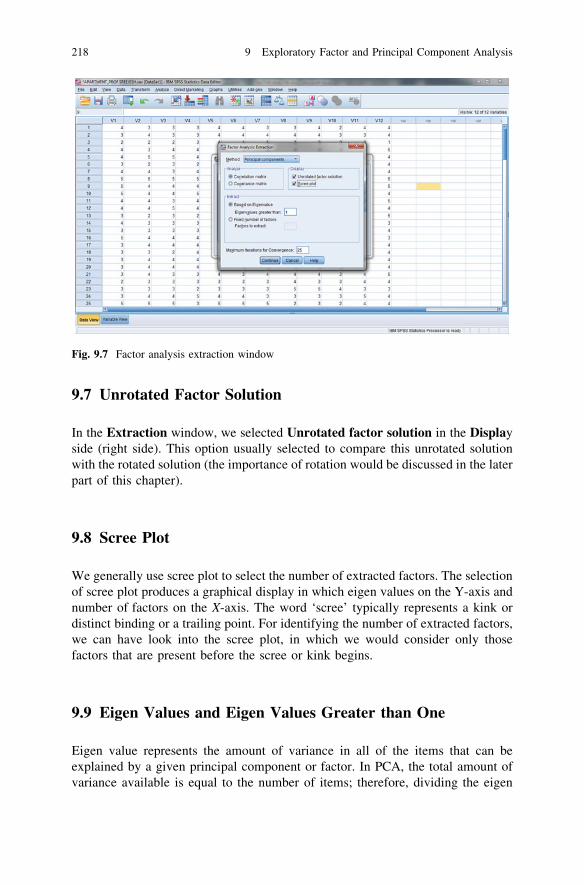
9.7 Unrotated Factor Solution
In the Extraction window, we selected Unrotated factor solution in the Displayside (right side). This option usually selected to compare this unrotated solutionwith the rotated solution (the importance of rotation would be discussed in the laterpart of this chapter).
9.8 Scree Plot
We generally use scree plot to select the number of extracted factors. The selectionof scree plot produces a graphical display in which eigen values on the Y-axis andnumber of factors on the X-axis. The word ‘scree’ typically represents a kink ordistinct binding or a trailing point. For identifying the number of extracted factors,we can have look into the scree plot, in which we would consider only thosefactors that are present before the scree or kink begins.
9.9 Eigen Values and Eigen Values Greater than One
Eigen value represents the amount of variance in all of the items that can beexplained by a given principal component or factor. In PCA, the total amount ofvariance available is equal to the number of items; therefore, dividing the eigen
Fig. 9.7 Factor analysis extraction window
218 9 Exploratory Factor and Principal Component Analysis
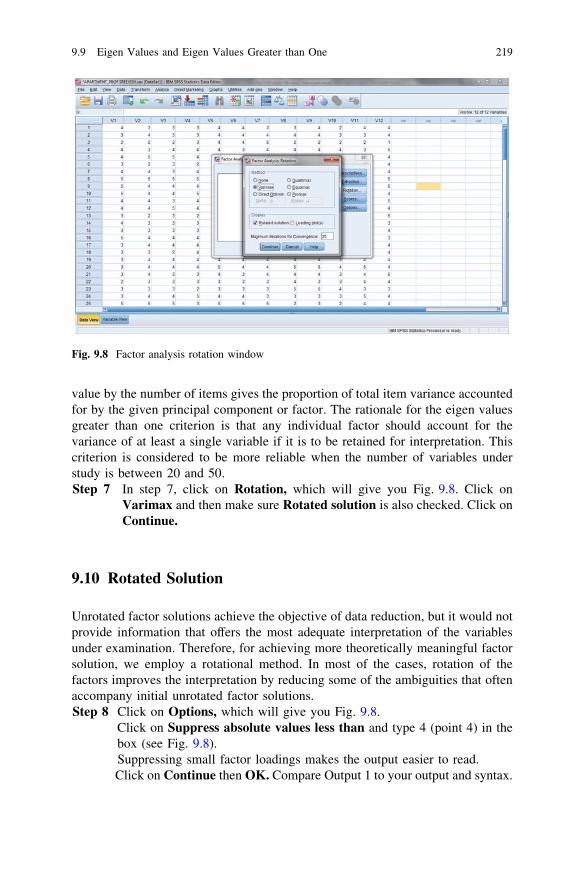
value by the number of items gives the proportion of total item variance accountedfor by the given principal component or factor. The rationale for the eigen valuesgreater than one criterion is that any individual factor should account for thevariance of at least a single variable if it is to be retained for interpretation. Thiscriterion is considered to be more reliable when the number of variables understudy is between 20 and 50.Step 7 In step 7, click on Rotation, which will give you Fig. 9.8. Click on
Varimax and then make sure Rotated solution is also checked. Click onContinue.
9.10 Rotated Solution
Unrotated factor solutions achieve the objective of data reduction, but it would notprovide information that offers the most adequate interpretation of the variablesunder examination. Therefore, for achieving more theoretically meaningful factorsolution, we employ a rotational method. In most of the cases, rotation of thefactors improves the interpretation by reducing some of the ambiguities that oftenaccompany initial unrotated factor solutions.Step 8 Click on Options, which will give you Fig. 9.8.
Click on Suppress absolute values less than and type 4 (point 4) in thebox (see Fig. 9.8).Suppressing small factor loadings makes the output easier to read.Click on Continue then OK. Compare Output 1 to your output and syntax.
Fig. 9.8 Factor analysis rotation window
9.9 Eigen Values and Eigen Values Greater than One 219
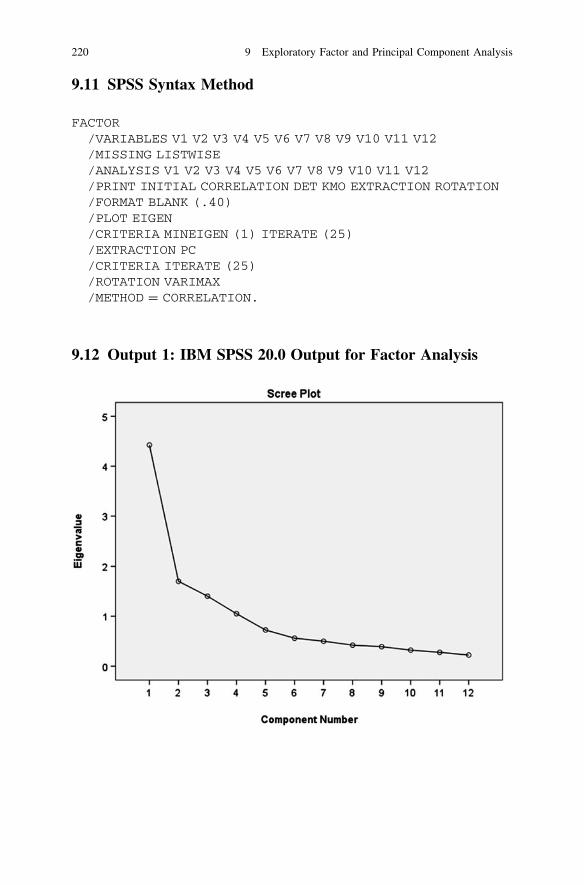
9.11 SPSS Syntax Method
FACTOR/VARIABLES V1 V2 V3 V4 V5 V6 V7 V8 V9 V10 V11 V12/MISSING LISTWISE/ANALYSIS V1 V2 V3 V4 V5 V6 V7 V8 V9 V10 V11 V12/PRINT INITIAL CORRELATION DET KMO EXTRACTION ROTATION/FORMAT BLANK (.40)/PLOT EIGEN/CRITERIA MINEIGEN (1) ITERATE (25)/EXTRACTION PC/CRITERIA ITERATE (25)/ROTATION VARIMAX/METHOD = CORRELATION.
9.12 Output 1: IBM SPSS 20.0 Output for Factor Analysis
220 9 Exploratory Factor and Principal Component Analysis
9.13 Results and Interpretation
The aforementioned steps (Figs. 9.2, 9.3, 9.4, 9.5, 9.6, 9.7, 9.8, 9.9 and 9.10) give anumber of tables depending on the option selected by the researcher for doing FAin IBM SPSS 20.0. The first table in FA output is correlation matrix. Table 9.4:Presents 12 9 12 correlation matrix for the 20 items specified in the study. Thiscorrelation matrix summarizes the interrelationship among set of variables or, as inthis example, a set of items in a scale. The correlation ranges between -1.00 andþ1:00, with higher absolute values indicating a stronger relationship between twovariables. A positive value indicates direct relationship between two items. InTable 9.4, for example, the correlation between V2 (Do you think that the varioustypes and brands of this product available in the market are all very alike or areall very different) and V3 (How important would it be to you to make a right choiceof this product from ABC?) was 0.734. This means that respondents who scoredhigh on V2 also scored high on V3. A negative value indicates an inverse rela-tionship between two items: high scores on one item are associated with low scoreson the second item. Given the magnitude of correlation between variables, it isclear that the hypothesized factor model appears to be appropriate. Looking at thecorrelation table for larger number of variable is a tiresome job, and therefore, wehave some other measures to check the adequacy of correlation or interrelationshipbetween the factored items, and these measures are as follows:
1 The determinant
This is the determinant of the matrix (12 9 12), and the value is located underthe correlation matrix (Table 9.4). In our example, we got a value of 0.007, itsneither exact zero or exact one, which is greater than the cut-off value of 0.00001.Therefore, we can conclude that the correlation matrix is neither an identity matrixnor a singular matrix. This value confirms the assumption that there are sufficientinterrelationships among our study items.
2 Bartlett’s test of Spherecity and the KMO
Table 9.5 gives the results of KMO and Bartlett’s test (Bartlett 1950). Bartlett’stest of Spherecity tests the null hypothesis that the correlation matrix is an identitymatrix (there is no relationship between items) and follows Chi square distribution.Larger the value of Bartlett’s test indicates greater likelihood the correlationmatrix is not an identity matrix and null hypothesis will be rejected. In thisexample, The Bartlett’s test value (452.25) is significant (i.e. a significance valueof less than 0.05); this means that we may reject the null hypothesis that ourcorrelation matrix is an identity matrix and will conclude that the variables arecorrelated highly enough to provide a reasonable basis for FA. The KMO test is ameasure of sampling adequacy. The KMO measure should be greater than 0.70and is inadequate if less than 0.60. All these three measures (determinant,Bartlett’s test and KMO) show the evidence that there are good interrelationships
9.13 Results and Interpretation 221
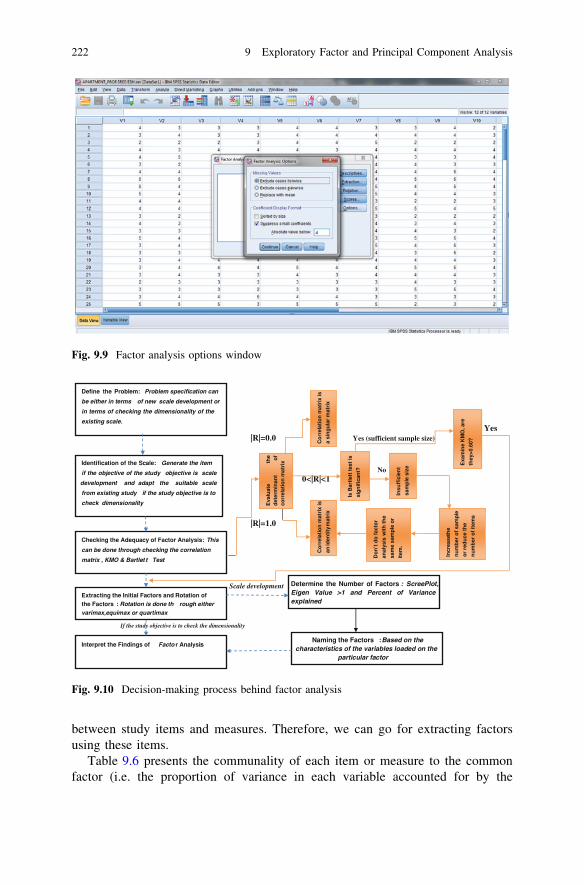
between study items and measures. Therefore, we can go for extracting factorsusing these items.
Table 9.6 presents the communality of each item or measure to the commonfactor (i.e. the proportion of variance in each variable accounted for by the
Fig. 9.9 Factor analysis options window
Yes |R|=0.0 Yes (sufficient sample size)
No0<|R|<1
|R|=1.0
Scale development
If the study objective is to check the dimensionality
Naming the Factors : Based on the characteristics of the variables loaded on the
particular factor
Define the Problem: Problem specification can
be either in terms of new scale development or
in terms of checking the dimensionality of the
existing scale.
Identification of the Scale: Generate the item
if the objective of the study objective is scale
development and adapt the suitable scale
from existing study if the study objective is to
check dimensionality
Checking the Adequacy of Factor Analysis: This
can be done through checking the correlation
matrix , KMO & Bartlet t Test
Extracting the Initial Factors and Rotation of the Factors : Rotation is done th rough either varimax,equimax or quartimax
Determine the Number of Factors : Scree Plot, Eigen Value >1 and Percent of Variance explained
Interpret the Findings of Facto r Analysis:
Do
n’t
do
fac
tor
anal
ysis
wit
h t
he
sam
e sa
mp
le o
r
item
. In
suff
icie
nt
sam
ple
siz
e
Eva
luat
e th
e d
eter
min
ant
of
corr
elat
ion
mat
rix
Co
rrel
atio
n m
atri
x is
a si
ngu
lar
mat
rix
Co
rrel
atio
n m
atri
x is
an id
enti
tym
atri
x
Is B
artl
ett
test
is
sign
ific
ant?
Exa
min
e K
MO
, are
they
>0.6
0?
Incr
ease
the
nu
mb
er o
f sa
mp
le
or
red
uce
th
e
nu
mb
er o
f it
ems
Fig. 9.10 Decision-making process behind factor analysis
222 9 Exploratory Factor and Principal Component Analysis
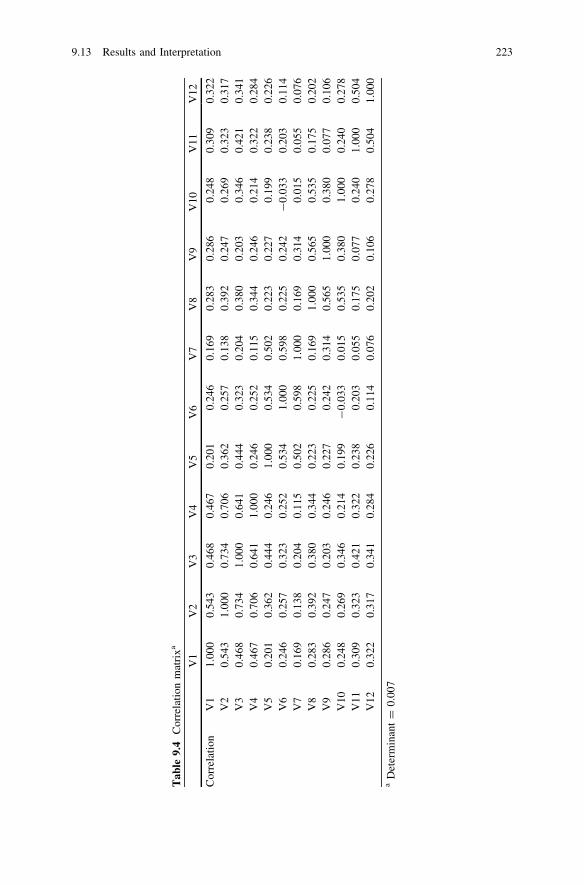
Tab
le9.
4C
orre
lati
onm
atri
xa
V1
V2
V3
V4
V5
V6
V7
V8
V9
V10
V11
V12
Cor
rela
tion
V1
1.00
00.
543
0.46
80.
467
0.20
10.
246
0.16
90.
283
0.28
60.
248
0.30
90.
322
V2
0.54
31.
000
0.73
40.
706
0.36
20.
257
0.13
80.
392
0.24
70.
269
0.32
30.
317
V3
0.46
80.
734
1.00
00.
641
0.44
40.
323
0.20
40.
380
0.20
30.
346
0.42
10.
341
V4
0.46
70.
706
0.64
11.
000
0.24
60.
252
0.11
50.
344
0.24
60.
214
0.32
20.
284
V5
0.20
10.
362
0.44
40.
246
1.00
00.
534
0.50
20.
223
0.22
70.
199
0.23
80.
226
V6
0.24
60.
257
0.32
30.
252
0.53
41.
000
0.59
80.
225
0.24
2-
0.03
30.
203
0.11
4V
70.
169
0.13
80.
204
0.11
50.
502
0.59
81.
000
0.16
90.
314
0.01
50.
055
0.07
6V
80.
283
0.39
20.
380
0.34
40.
223
0.22
50.
169
1.00
00.
565
0.53
50.
175
0.20
2V
90.
286
0.24
70.
203
0.24
60.
227
0.24
20.
314
0.56
51.
000
0.38
00.
077
0.10
6V
100.
248
0.26
90.
346
0.21
40.
199
-0.
033
0.01
50.
535
0.38
01.
000
0.24
00.
278
V11
0.30
90.
323
0.42
10.
322
0.23
80.
203
0.05
50.
175
0.07
70.
240
1.00
00.
504
V12
0.32
20.
317
0.34
10.
284
0.22
60.
114
0.07
60.
202
0.10
60.
278
0.50
41.
000
aD
eter
min
ant
=0.
007
9.13 Results and Interpretation 223
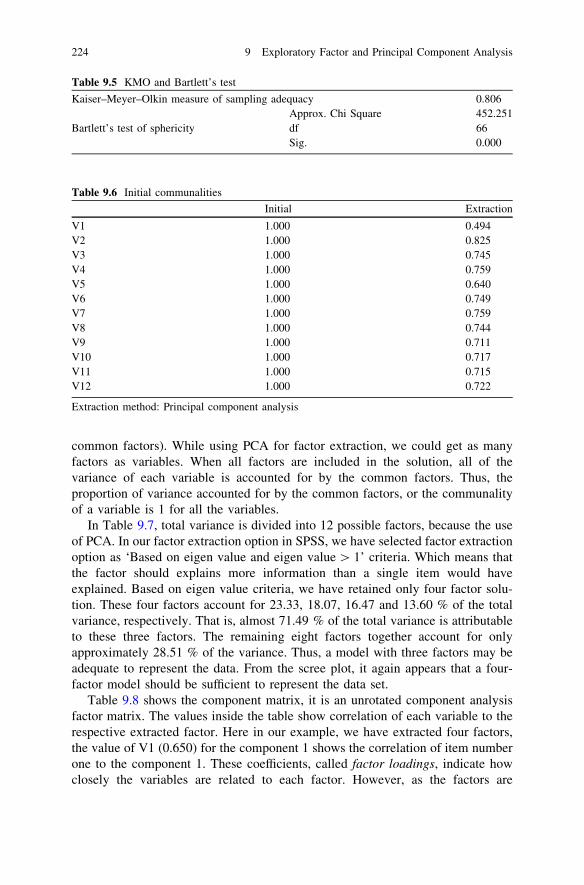
common factors). While using PCA for factor extraction, we could get as manyfactors as variables. When all factors are included in the solution, all of thevariance of each variable is accounted for by the common factors. Thus, theproportion of variance accounted for by the common factors, or the communalityof a variable is 1 for all the variables.
In Table 9.7, total variance is divided into 12 possible factors, because the useof PCA. In our factor extraction option in SPSS, we have selected factor extractionoption as ‘Based on eigen value and eigen value [ 1’ criteria. Which means thatthe factor should explains more information than a single item would haveexplained. Based on eigen value criteria, we have retained only four factor solu-tion. These four factors account for 23.33, 18.07, 16.47 and 13.60 % of the totalvariance, respectively. That is, almost 71.49 % of the total variance is attributableto these three factors. The remaining eight factors together account for onlyapproximately 28.51 % of the variance. Thus, a model with three factors may beadequate to represent the data. From the scree plot, it again appears that a four-factor model should be sufficient to represent the data set.
Table 9.8 shows the component matrix, it is an unrotated component analysisfactor matrix. The values inside the table show correlation of each variable to therespective extracted factor. Here in our example, we have extracted four factors,the value of V1 (0.650) for the component 1 shows the correlation of item numberone to the component 1. These coefficients, called factor loadings, indicate howclosely the variables are related to each factor. However, as the factors are
Table 9.5 KMO and Bartlett’s test
Kaiser–Meyer–Olkin measure of sampling adequacy 0.806Approx. Chi Square 452.251
Bartlett’s test of sphericity df 66Sig. 0.000
Table 9.6 Initial communalities
Initial Extraction
V1 1.000 0.494V2 1.000 0.825V3 1.000 0.745V4 1.000 0.759V5 1.000 0.640V6 1.000 0.749V7 1.000 0.759V8 1.000 0.744V9 1.000 0.711V10 1.000 0.717V11 1.000 0.715V12 1.000 0.722
Extraction method: Principal component analysis
224 9 Exploratory Factor and Principal Component Analysis
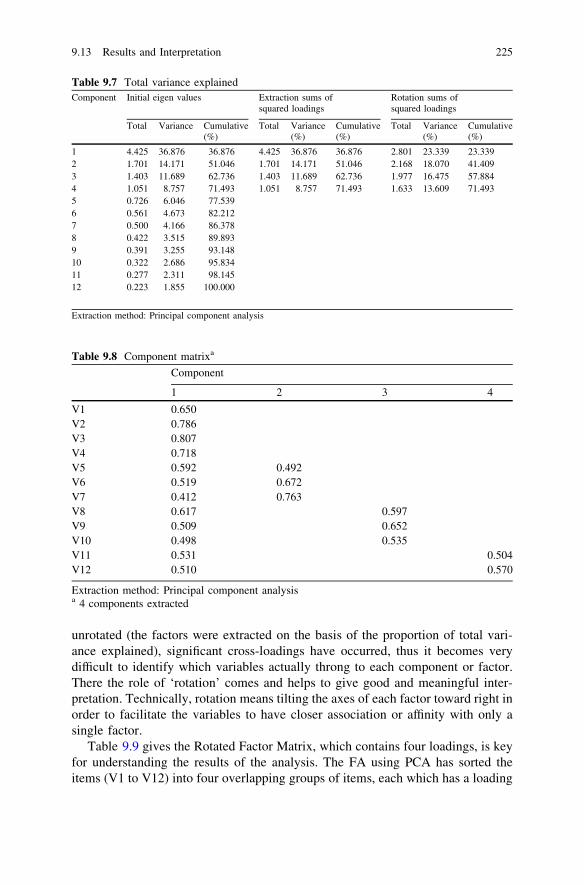
unrotated (the factors were extracted on the basis of the proportion of total vari-ance explained), significant cross-loadings have occurred, thus it becomes verydifficult to identify which variables actually throng to each component or factor.There the role of ‘rotation’ comes and helps to give good and meaningful inter-pretation. Technically, rotation means tilting the axes of each factor toward right inorder to facilitate the variables to have closer association or affinity with only asingle factor.
Table 9.9 gives the Rotated Factor Matrix, which contains four loadings, is keyfor understanding the results of the analysis. The FA using PCA has sorted theitems (V1 to V12) into four overlapping groups of items, each which has a loading
Table 9.7 Total variance explainedComponent Initial eigen values Extraction sums of
squared loadingsRotation sums ofsquared loadings
Total Variance Cumulative(%)
Total Variance(%)
Cumulative(%)
Total Variance(%)
Cumulative(%)
1 4.425 36.876 36.876 4.425 36.876 36.876 2.801 23.339 23.3392 1.701 14.171 51.046 1.701 14.171 51.046 2.168 18.070 41.4093 1.403 11.689 62.736 1.403 11.689 62.736 1.977 16.475 57.8844 1.051 8.757 71.493 1.051 8.757 71.493 1.633 13.609 71.4935 0.726 6.046 77.5396 0.561 4.673 82.2127 0.500 4.166 86.3788 0.422 3.515 89.8939 0.391 3.255 93.14810 0.322 2.686 95.83411 0.277 2.311 98.14512 0.223 1.855 100.000
Extraction method: Principal component analysis
Table 9.8 Component matrixa
Component
1 2 3 4
V1 0.650V2 0.786V3 0.807V4 0.718V5 0.592 0.492V6 0.519 0.672V7 0.412 0.763V8 0.617 0.597V9 0.509 0.652V10 0.498 0.535V11 0.531 0.504V12 0.510 0.570
Extraction method: Principal component analysisa 4 components extracted
9.13 Results and Interpretation 225
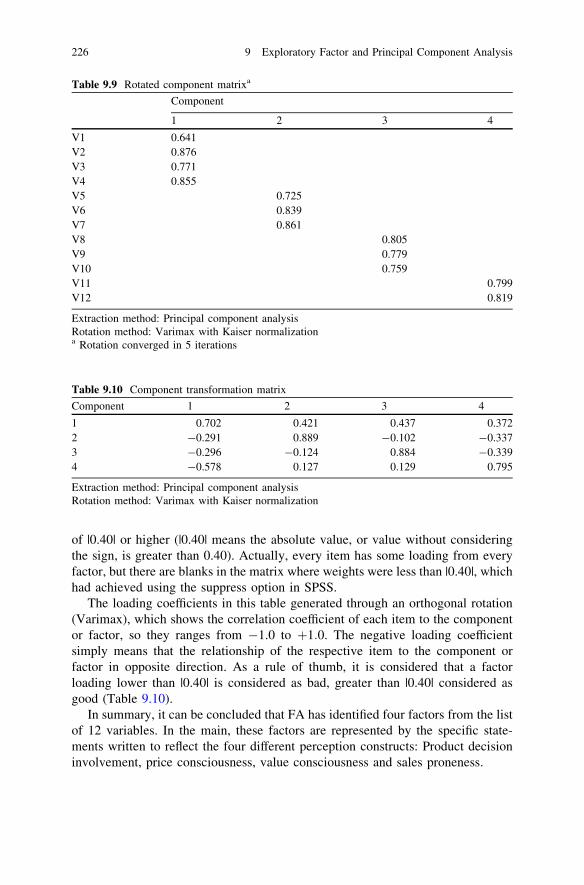
of |0.40| or higher (|0.40| means the absolute value, or value without consideringthe sign, is greater than 0.40). Actually, every item has some loading from everyfactor, but there are blanks in the matrix where weights were less than |0.40|, whichhad achieved using the suppress option in SPSS.
The loading coefficients in this table generated through an orthogonal rotation(Varimax), which shows the correlation coefficient of each item to the componentor factor, so they ranges from -1.0 to þ1:0. The negative loading coefficientsimply means that the relationship of the respective item to the component orfactor in opposite direction. As a rule of thumb, it is considered that a factorloading lower than |0.40| is considered as bad, greater than |0.40| considered asgood (Table 9.10).
In summary, it can be concluded that FA has identified four factors from the listof 12 variables. In the main, these factors are represented by the specific state-ments written to reflect the four different perception constructs: Product decisioninvolvement, price consciousness, value consciousness and sales proneness.
Table 9.9 Rotated component matrixa
Component
1 2 3 4
V1 0.641V2 0.876V3 0.771V4 0.855V5 0.725V6 0.839V7 0.861V8 0.805V9 0.779V10 0.759V11 0.799V12 0.819
Extraction method: Principal component analysisRotation method: Varimax with Kaiser normalizationa Rotation converged in 5 iterations
Table 9.10 Component transformation matrix
Component 1 2 3 4
1 0.702 0.421 0.437 0.3722 -0.291 0.889 -0.102 -0.3373 -0.296 -0.124 0.884 -0.3394 -0.578 0.127 0.129 0.795
Extraction method: Principal component analysisRotation method: Varimax with Kaiser normalization
226 9 Exploratory Factor and Principal Component Analysis
9.14 Key Statistics
Communality. Communality is the amount of variance a variable shares with allthe other variables being considered. This is also the proportion of varianceexplained by the common factors.
Correlation matrix. A correlation matrix is a lower triangular matrix showingthe simple correlations, r, between all possible pairs of variables included in theanalysis. The diagonal elements, which are all one, are usually omitted.
Eigen value. The eigen value represents the total variance explained by eachfactor.
Factor loadings. Factor loadings are simple correlations between the variablesand the factors.
Factor-loading plot. A factor-loading plot is a plot of the original variablesusing the factor loadings as coordinates.
Factor matrix. A factor matrix contains the factor loadings of all the variableson all the factors extracted.
Factor scores. Factor scores are composite scores estimated for each respon-dent on the derived factors.
KMO measure of sampling adequacy. The KMO measure of sampling ade-quacy is an index used to examine the appropriateness of FA. High values(between 0.5 and 1.0) indicate that FA is appropriate. Values below 0.5 imply thatFA may not be appropriate.
Percentage of variance. The percentage of the total variance attributed to eachfactor.
Residuals. Residuals are the differences between the observed correlations, asgiven in the input correlation matrix, and the reproduced correlations, as estimatedfrom the factor matrix.
Scree plot. A scree plot is a plot of the eigen values against the number offactors in order of extraction.
9.15 Review Questions
1. Discuss the possible reasons for the use of FA with the data (FACTOR).2. Produce a correlation matrix for the 12 variables (scale items). Does it appear
that FA would be appropriate for these data?3. Do a principal component analysis (with rotation if necessary for interpretation)
using the data. How many factors should be retained? What is the percentage ofvariance accounted for each factor? Interpret the factors.
9.14 Key Statistics 227

Reference
Hair JF Jr, Black WC, Babin BJ, Anderson RE (2010) Multivariate data analysis: a globalperspective. Pearson, London
228 9 Exploratory Factor and Principal Component Analysis
Chapter 10Cluster Analysis
Cluster analysis is a group of multivariate techniques whose major objective is tocombine observations/object/cases into groups or clusters, such that each group orcluster formed is homogeneous or similar with respect to some certain charac-teristics and these groups should be different from other groups with respect tosame characteristics. In cluster analysis, the researcher can classifies objects, suchas respondents, products or other entities and cases or events, based on a set ofselected variables or characteristics. Cluster analysis works based on certain set ofvariables, called ‘‘Cluster variate’’, which form the basis for comparing the objectsin the cluster analysis. In cluster analysis, the selection of cluster variate is veryimportant, because in cluster analysis the focus is for comparing the objects ineach cluster based on variate, rather than the estimation of the variate itself. Thisdifference makes cluster analysis different from other multivariate techniques.Therefore, the researcher’s definition of the cluster variate plays a crucial role incluster analysis.
10.1 Steps for Conducting the Cluster Analysis
The process of performing cluster analysis involves six integrated processes, asshown in Fig. 10.1.
S. Sreejesh et al., Business Research Methods,DOI: 10.1007/978-3-319-00539-3_10,� Springer International Publishing Switzerland 2014
229
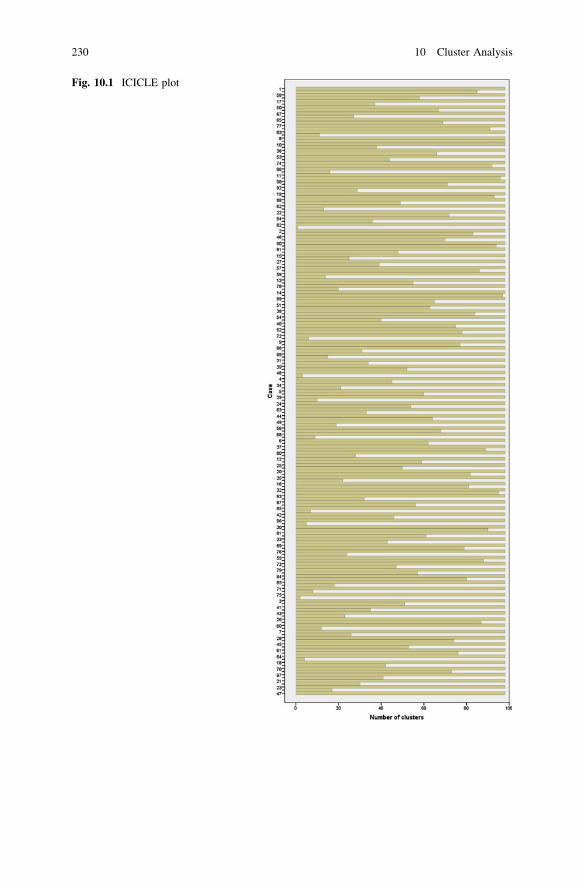
Fig. 10.1 ICICLE plot
230 10 Cluster Analysis
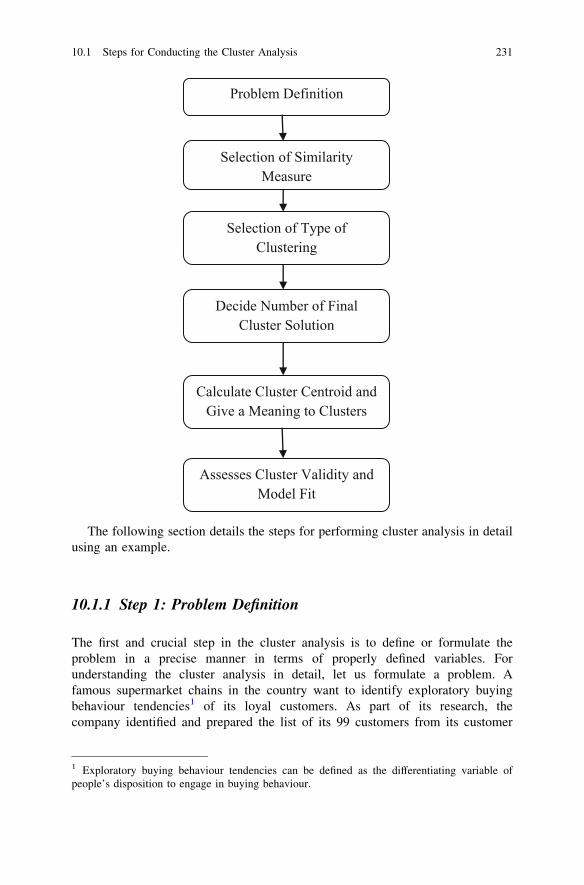
Problem Definition
Selection of Similarity Measure
Selection of Type of Clustering
Decide Number of Final Cluster Solution
Calculate Cluster Centroid and Give a Meaning to Clusters
Assesses Cluster Validity and Model Fit
The following section details the steps for performing cluster analysis in detailusing an example.
10.1.1 Step 1: Problem Definition
The first and crucial step in the cluster analysis is to define or formulate theproblem in a precise manner in terms of properly defined variables. Forunderstanding the cluster analysis in detail, let us formulate a problem. Afamous supermarket chains in the country want to identify exploratory buyingbehaviour tendencies1 of its loyal customers. As part of its research, thecompany identified and prepared the list of its 99 customers from its customer
1 Exploratory buying behaviour tendencies can be defined as the differentiating variable ofpeople’s disposition to engage in buying behaviour.
10.1 Steps for Conducting the Cluster Analysis 231
database. For understanding the exploratory buying behaviour of its customers,the company administered a questionnaire to the 99 loyal customers. Thequestionnaire consists of seven exploratory buying behaviour statements thatwere measured on a 7-point rating scale with 1 strongly disagree and 7 stronglyagree. The detailed description about the statements used in the survey is givenas follows:
V1: Event though certain food products are available in a number of differentflavours, I tend to buy the same flavour which I have been using (Reverse coded).V2: When I see a new brand on the shelf, I am not afraid of giving it a tryV3: I am very cautious in trying new or different products (Reverse coded)V4: I enjoy taking chances in buying unfamiliar brands just to get some variety inmy purchaseV5: I do not like to shop around just out of curiosityV6: I like to shop around and look at displaysV7: I do not like to talk to my friends about my purchases.
The data file attached with this note gives the scores obtained by these 99 loyalcustomers for seven statements to determine the exploratory buying behaviour.
10.1.2 Step 2: Selection of Appropriate Distanceor Similarity Measure
It has already been discussed in the introduction that cluster analysis works basedon distance or similarity. Thus, it is essential to select an appropriate distancemeasure by which the similarity between the cases or subjects can be identified, toclub similar object in a cluster.
There are two main widely accepted and used distance measures for measuringsimilarity between objects, Squared Euclidean Distance and Euclidean Distance.The squared Euclidean distance is the sum of squared differences between thevalues for each variable. Euclidean distance is the square root of the sum ofsquared differences between the values for each variable. There are other differentmethods of distances are available, but it is beyond the scope of this book, andtherefore, in the example aforementioned, we will limit the distance measure toeither Squared Euclidean Distance or Euclidean Distance.
10.1.3 Step 3: Selection of Clustering Type
There are two major types of cluster analysis: (1) Hierarchical Cluster Analysisand (2) Non-Hierarchical Cluster Analysis. Hierarchical cluster analysisinvolves n-1 clustering decisions, in which n equals number of observations. This
232 10 Cluster Analysis
type of cluster analysis combines observations into a hierarchy or tree-likestructure. Hierarchical clustering technique can be again classified into Agglom-erative Clustering and Divisive Clustering. In an agglomerative method ofclustering, a hierarchical process follows and clustering starts with each object orobservation as a single cluster, or with N number of clusters and end up with asingle cluster. For example, if we want to cluster 100 observations using hierar-chical procedure with agglomerative type, clustering initially starts with 100individual clusters, each includes a single observation. At first step, the two mostsimilar objects are being combined, leaving other 99 clusters. At the very nextstep, clustering happens for the other most similar objects, so that there would bearound 98 clusters. This process continues until the last step where the final tworemaining clusters are combined into a single cluster. Divisive clustering is theopposite of agglomerative clustering in which clustering starts with single clusterand end up with N number of clusters or each object is a single-member cluster.There are five major approaches in agglomerative clustering, and these are thefollowing:
1. Single Linkage or Nearest Neighbourhood MethodThis method of agglomerative clustering procedure based on the principle ofshortest distance. In this method, the similarity between clusters as the shortestdistance from any object in one cluster to any object in the other.
2. Complete Linkage or Farthest Neighbourhood MethodThis method of clustering is similar to single linkage algorithm, except thatcluster similarity is based on maximum distance between observations in eachcluster. In this method, all objects in a cluster are linked to each other at somemaximum distance.
3. Average LinkageIn This method of clustering, similarity of any two clusters, is the averagesimilarity of all individuals in one cluster with all individuals in another. Thismethod of clustering is most preferred among linkage methods, because itavoids taking two extreme members while considering the distance between thetwo clusters. The other advantage for this method is that it considers all theobjects of the cluster rather than two extreme members of the clusters.
4. Centroid MethodIn this method of clustering, the similarity between two clusters is the distancebetween the cluster centroids. The term cluster centroid explains the meanvalues of the observations on the variables in the cluster variate. In this tech-nique, every time individuals are grouped, and a new centroid is computed.
5. Ward’s MethodThis kind of clustering follows a variance-based approach. In this method ofclustering, within cluster variance is to be minimised. In Ward’s method, thedistance is the total sum of squared deviation (error sum of squares). In thistechnique, at each stage, two clusters are joined to produce smallest increase inthe overall sum of the squared within the cluster distances.
10.1 Steps for Conducting the Cluster Analysis 233
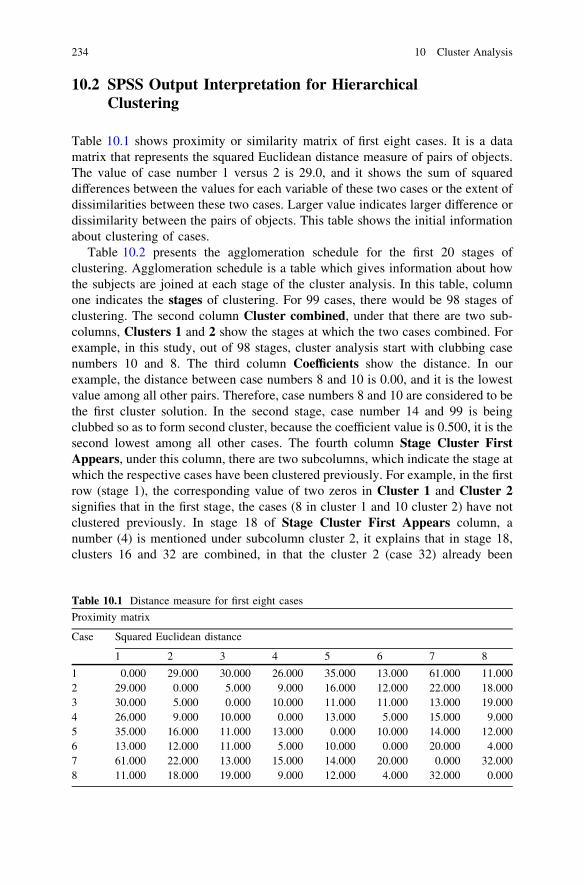
10.2 SPSS Output Interpretation for HierarchicalClustering
Table 10.1 shows proximity or similarity matrix of first eight cases. It is a datamatrix that represents the squared Euclidean distance measure of pairs of objects.The value of case number 1 versus 2 is 29.0, and it shows the sum of squareddifferences between the values for each variable of these two cases or the extent ofdissimilarities between these two cases. Larger value indicates larger difference ordissimilarity between the pairs of objects. This table shows the initial informationabout clustering of cases.
Table 10.2 presents the agglomeration schedule for the first 20 stages ofclustering. Agglomeration schedule is a table which gives information about howthe subjects are joined at each stage of the cluster analysis. In this table, columnone indicates the stages of clustering. For 99 cases, there would be 98 stages ofclustering. The second column Cluster combined, under that there are two sub-columns, Clusters 1 and 2 show the stages at which the two cases combined. Forexample, in this study, out of 98 stages, cluster analysis start with clubbing casenumbers 10 and 8. The third column Coefficients show the distance. In ourexample, the distance between case numbers 8 and 10 is 0.00, and it is the lowestvalue among all other pairs. Therefore, case numbers 8 and 10 are considered to bethe first cluster solution. In the second stage, case number 14 and 99 is beingclubbed so as to form second cluster, because the coefficient value is 0.500, it is thesecond lowest among all other cases. The fourth column Stage Cluster FirstAppears, under this column, there are two subcolumns, which indicate the stage atwhich the respective cases have been clustered previously. For example, in the firstrow (stage 1), the corresponding value of two zeros in Cluster 1 and Cluster 2signifies that in the first stage, the cases (8 in cluster 1 and 10 cluster 2) have notclustered previously. In stage 18 of Stage Cluster First Appears column, anumber (4) is mentioned under subcolumn cluster 2, it explains that in stage 18,clusters 16 and 32 are combined, in that the cluster 2 (case 32) already been
Table 10.1 Distance measure for first eight cases
Proximity matrix
Case Squared Euclidean distance
1 2 3 4 5 6 7 8
1 0.000 29.000 30.000 26.000 35.000 13.000 61.000 11.0002 29.000 0.000 5.000 9.000 16.000 12.000 22.000 18.0003 30.000 5.000 0.000 10.000 11.000 11.000 13.000 19.0004 26.000 9.000 10.000 0.000 13.000 5.000 15.000 9.0005 35.000 16.000 11.000 13.000 0.000 10.000 14.000 12.0006 13.000 12.000 11.000 5.000 10.000 0.000 20.000 4.0007 61.000 22.000 13.000 15.000 14.000 20.000 0.000 32.0008 11.000 18.000 19.000 9.000 12.000 4.000 32.000 0.000
234 10 Cluster Analysis
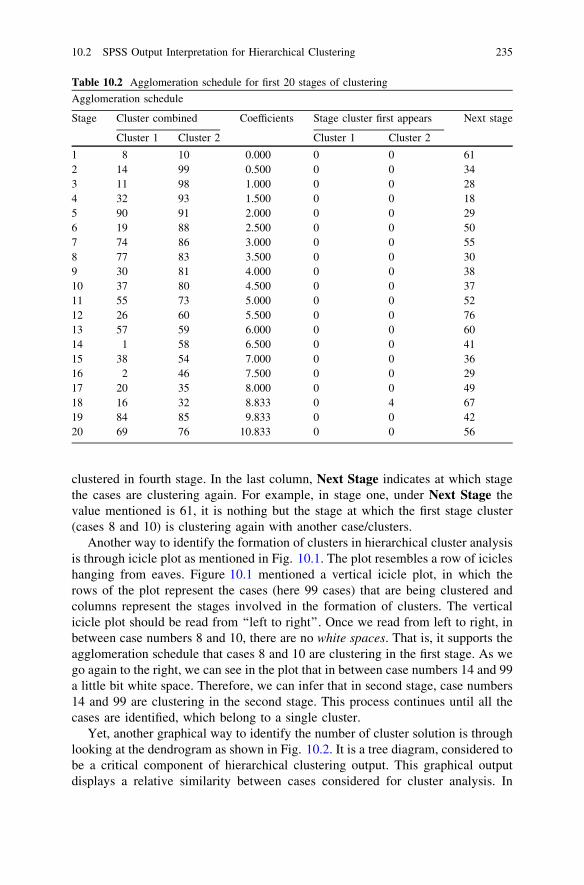
clustered in fourth stage. In the last column, Next Stage indicates at which stagethe cases are clustering again. For example, in stage one, under Next Stage thevalue mentioned is 61, it is nothing but the stage at which the first stage cluster(cases 8 and 10) is clustering again with another case/clusters.
Another way to identify the formation of clusters in hierarchical cluster analysisis through icicle plot as mentioned in Fig. 10.1. The plot resembles a row of icicleshanging from eaves. Figure 10.1 mentioned a vertical icicle plot, in which therows of the plot represent the cases (here 99 cases) that are being clustered andcolumns represent the stages involved in the formation of clusters. The verticalicicle plot should be read from ‘‘left to right’’. Once we read from left to right, inbetween case numbers 8 and 10, there are no white spaces. That is, it supports theagglomeration schedule that cases 8 and 10 are clustering in the first stage. As wego again to the right, we can see in the plot that in between case numbers 14 and 99a little bit white space. Therefore, we can infer that in second stage, case numbers14 and 99 are clustering in the second stage. This process continues until all thecases are identified, which belong to a single cluster.
Yet, another graphical way to identify the number of cluster solution is throughlooking at the dendrogram as shown in Fig. 10.2. It is a tree diagram, considered tobe a critical component of hierarchical clustering output. This graphical outputdisplays a relative similarity between cases considered for cluster analysis. In
Table 10.2 Agglomeration schedule for first 20 stages of clustering
Agglomeration schedule
Stage Cluster combined Coefficients Stage cluster first appears Next stage
Cluster 1 Cluster 2 Cluster 1 Cluster 2
1 8 10 0.000 0 0 612 14 99 0.500 0 0 343 11 98 1.000 0 0 284 32 93 1.500 0 0 185 90 91 2.000 0 0 296 19 88 2.500 0 0 507 74 86 3.000 0 0 558 77 83 3.500 0 0 309 30 81 4.000 0 0 3810 37 80 4.500 0 0 3711 55 73 5.000 0 0 5212 26 60 5.500 0 0 7613 57 59 6.000 0 0 6014 1 58 6.500 0 0 4115 38 54 7.000 0 0 3616 2 46 7.500 0 0 2917 20 35 8.000 0 0 4918 16 32 8.833 0 4 6719 84 85 9.833 0 0 4220 69 76 10.833 0 0 56
10.2 SPSS Output Interpretation for Hierarchical Clustering 235
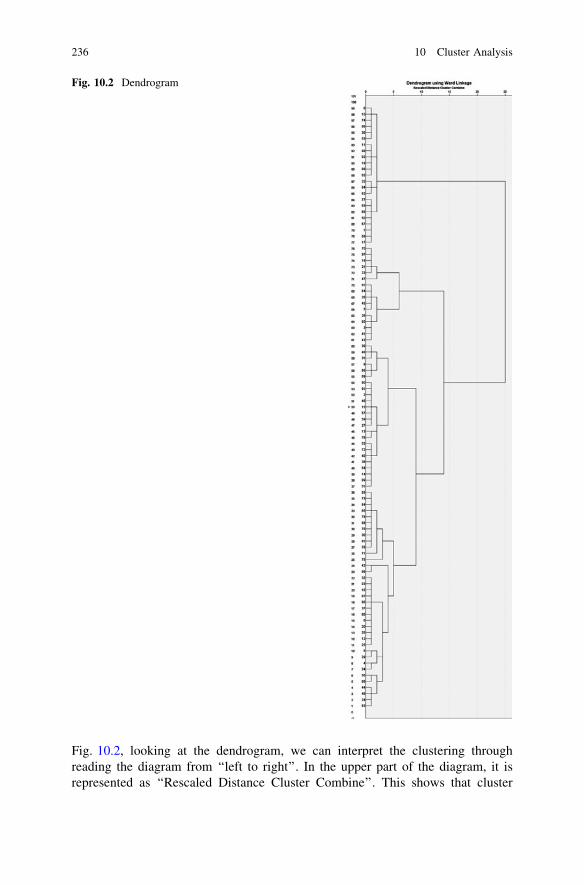
Fig. 10.2, looking at the dendrogram, we can interpret the clustering throughreading the diagram from ‘‘left to right’’. In the upper part of the diagram, it isrepresented as ‘‘Rescaled Distance Cluster Combine’’. This shows that cluster
Fig. 10.2 Dendrogram
236 10 Cluster Analysis
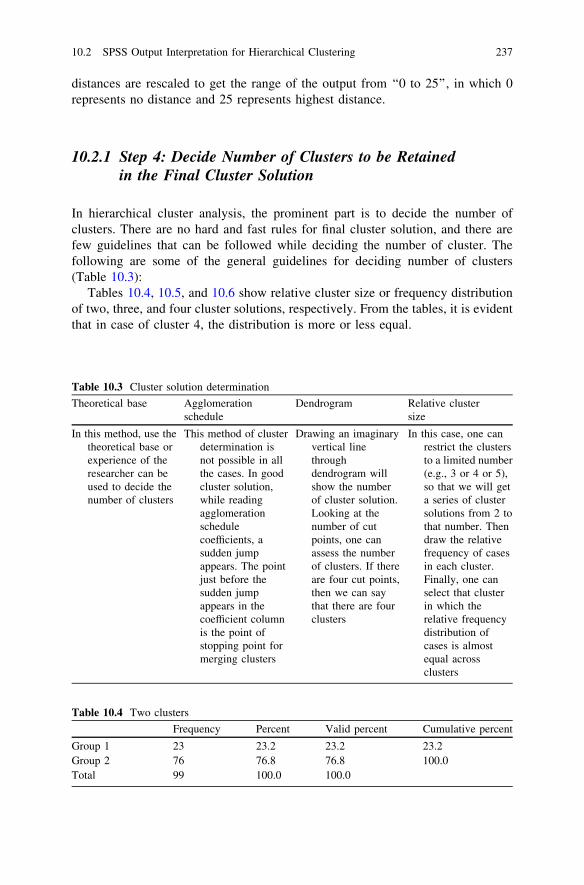
distances are rescaled to get the range of the output from ‘‘0 to 25’’, in which 0represents no distance and 25 represents highest distance.
10.2.1 Step 4: Decide Number of Clusters to be Retainedin the Final Cluster Solution
In hierarchical cluster analysis, the prominent part is to decide the number ofclusters. There are no hard and fast rules for final cluster solution, and there arefew guidelines that can be followed while deciding the number of cluster. Thefollowing are some of the general guidelines for deciding number of clusters(Table 10.3):
Tables 10.4, 10.5, and 10.6 show relative cluster size or frequency distributionof two, three, and four cluster solutions, respectively. From the tables, it is evidentthat in case of cluster 4, the distribution is more or less equal.
Table 10.3 Cluster solution determination
Theoretical base Agglomerationschedule
Dendrogram Relative clustersize
In this method, use thetheoretical base orexperience of theresearcher can beused to decide thenumber of clusters
This method of clusterdetermination isnot possible in allthe cases. In goodcluster solution,while readingagglomerationschedulecoefficients, asudden jumpappears. The pointjust before thesudden jumpappears in thecoefficient columnis the point ofstopping point formerging clusters
Drawing an imaginaryvertical linethroughdendrogram willshow the numberof cluster solution.Looking at thenumber of cutpoints, one canassess the numberof clusters. If thereare four cut points,then we can saythat there are fourclusters
In this case, one canrestrict the clustersto a limited number(e.g., 3 or 4 or 5),so that we will geta series of clustersolutions from 2 tothat number. Thendraw the relativefrequency of casesin each cluster.Finally, one canselect that clusterin which therelative frequencydistribution ofcases is almostequal acrossclusters
Table 10.4 Two clusters
Frequency Percent Valid percent Cumulative percent
Group 1 23 23.2 23.2 23.2Group 2 76 76.8 76.8 100.0Total 99 100.0 100.0
10.2 SPSS Output Interpretation for Hierarchical Clustering 237
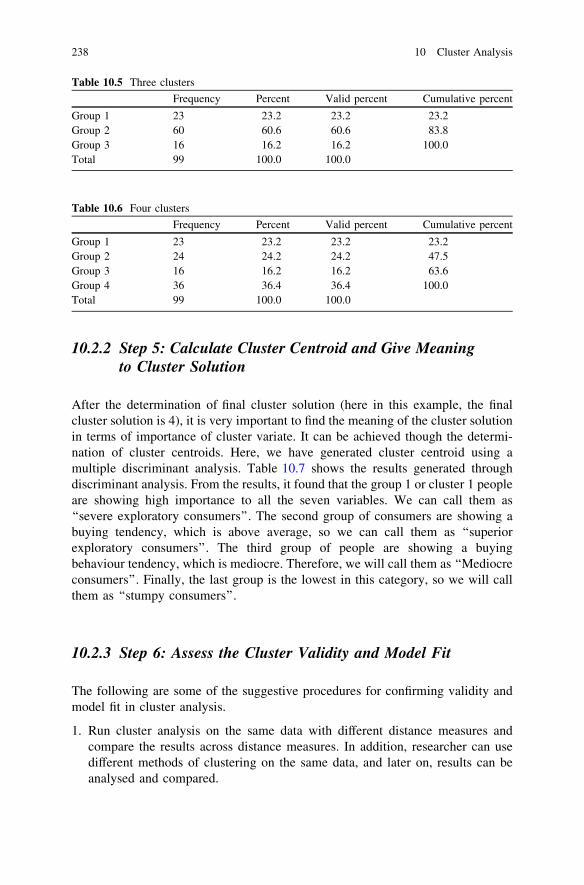
10.2.2 Step 5: Calculate Cluster Centroid and Give Meaningto Cluster Solution
After the determination of final cluster solution (here in this example, the finalcluster solution is 4), it is very important to find the meaning of the cluster solutionin terms of importance of cluster variate. It can be achieved though the determi-nation of cluster centroids. Here, we have generated cluster centroid using amultiple discriminant analysis. Table 10.7 shows the results generated throughdiscriminant analysis. From the results, it found that the group 1 or cluster 1 peopleare showing high importance to all the seven variables. We can call them as‘‘severe exploratory consumers’’. The second group of consumers are showing abuying tendency, which is above average, so we can call them as ‘‘superiorexploratory consumers’’. The third group of people are showing a buyingbehaviour tendency, which is mediocre. Therefore, we will call them as ‘‘Mediocreconsumers’’. Finally, the last group is the lowest in this category, so we will callthem as ‘‘stumpy consumers’’.
10.2.3 Step 6: Assess the Cluster Validity and Model Fit
The following are some of the suggestive procedures for confirming validity andmodel fit in cluster analysis.
1. Run cluster analysis on the same data with different distance measures andcompare the results across distance measures. In addition, researcher can usedifferent methods of clustering on the same data, and later on, results can beanalysed and compared.
Table 10.5 Three clusters
Frequency Percent Valid percent Cumulative percent
Group 1 23 23.2 23.2 23.2Group 2 60 60.6 60.6 83.8Group 3 16 16.2 16.2 100.0Total 99 100.0 100.0
Table 10.6 Four clusters
Frequency Percent Valid percent Cumulative percent
Group 1 23 23.2 23.2 23.2Group 2 24 24.2 24.2 47.5Group 3 16 16.2 16.2 63.6Group 4 36 36.4 36.4 100.0Total 99 100.0 100.0
238 10 Cluster Analysis
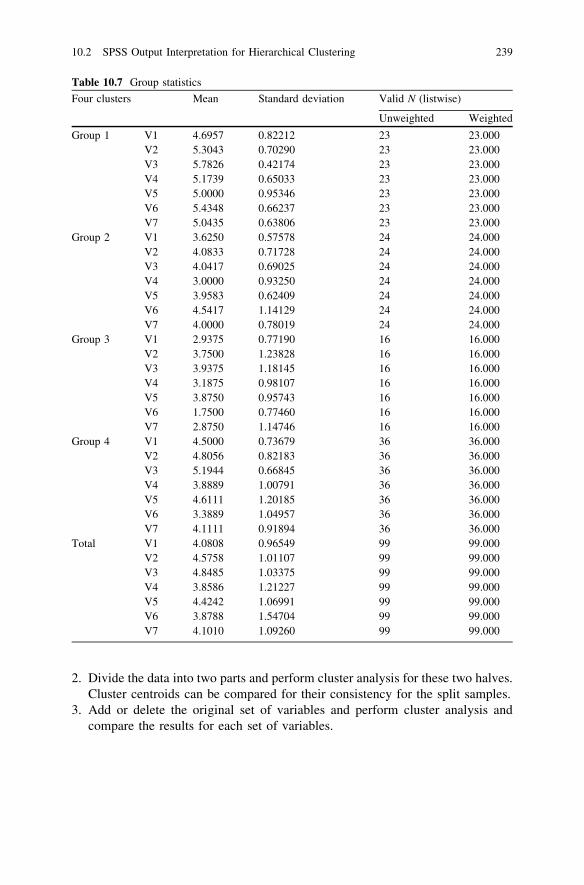
2. Divide the data into two parts and perform cluster analysis for these two halves.Cluster centroids can be compared for their consistency for the split samples.
3. Add or delete the original set of variables and perform cluster analysis andcompare the results for each set of variables.
Table 10.7 Group statistics
Four clusters Mean Standard deviation Valid N (listwise)
Unweighted Weighted
Group 1 V1 4.6957 0.82212 23 23.000V2 5.3043 0.70290 23 23.000V3 5.7826 0.42174 23 23.000V4 5.1739 0.65033 23 23.000V5 5.0000 0.95346 23 23.000V6 5.4348 0.66237 23 23.000V7 5.0435 0.63806 23 23.000
Group 2 V1 3.6250 0.57578 24 24.000V2 4.0833 0.71728 24 24.000V3 4.0417 0.69025 24 24.000V4 3.0000 0.93250 24 24.000V5 3.9583 0.62409 24 24.000V6 4.5417 1.14129 24 24.000V7 4.0000 0.78019 24 24.000
Group 3 V1 2.9375 0.77190 16 16.000V2 3.7500 1.23828 16 16.000V3 3.9375 1.18145 16 16.000V4 3.1875 0.98107 16 16.000V5 3.8750 0.95743 16 16.000V6 1.7500 0.77460 16 16.000V7 2.8750 1.14746 16 16.000
Group 4 V1 4.5000 0.73679 36 36.000V2 4.8056 0.82183 36 36.000V3 5.1944 0.66845 36 36.000V4 3.8889 1.00791 36 36.000V5 4.6111 1.20185 36 36.000V6 3.3889 1.04957 36 36.000V7 4.1111 0.91894 36 36.000
Total V1 4.0808 0.96549 99 99.000V2 4.5758 1.01107 99 99.000V3 4.8485 1.03375 99 99.000V4 3.8586 1.21227 99 99.000V5 4.4242 1.06991 99 99.000V6 3.8788 1.54704 99 99.000V7 4.1010 1.09260 99 99.000
10.2 SPSS Output Interpretation for Hierarchical Clustering 239
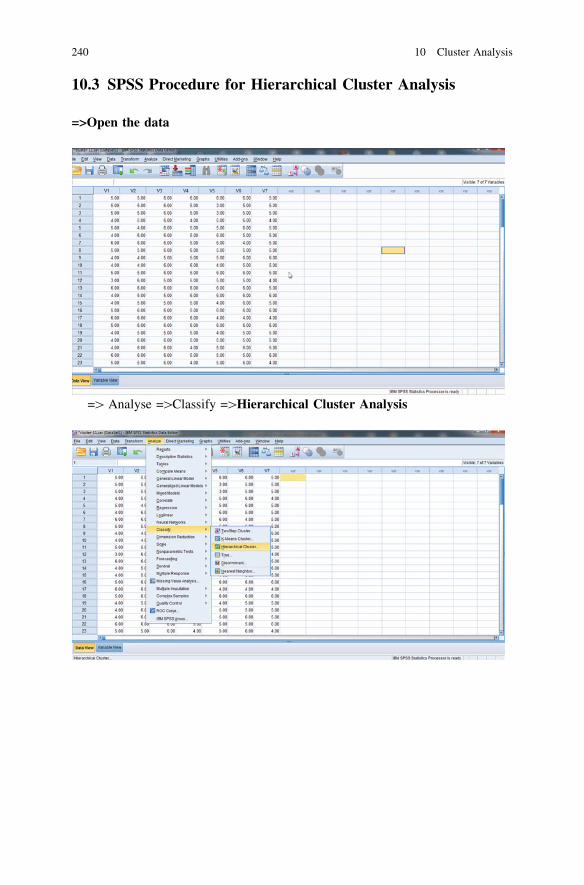
10.3 SPSS Procedure for Hierarchical Cluster Analysis
=>Open the data
=[ Analyse =[Classify =[Hierarchical Cluster Analysis
240 10 Cluster Analysis
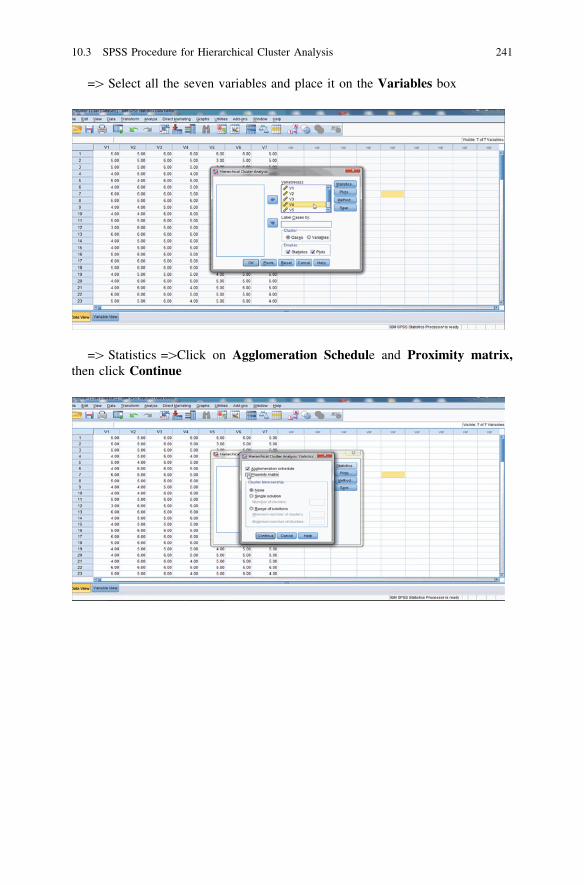
=[ Select all the seven variables and place it on the Variables box
=[ Statistics =[Click on Agglomeration Schedule and Proximity matrix,then click Continue
10.3 SPSS Procedure for Hierarchical Cluster Analysis 241
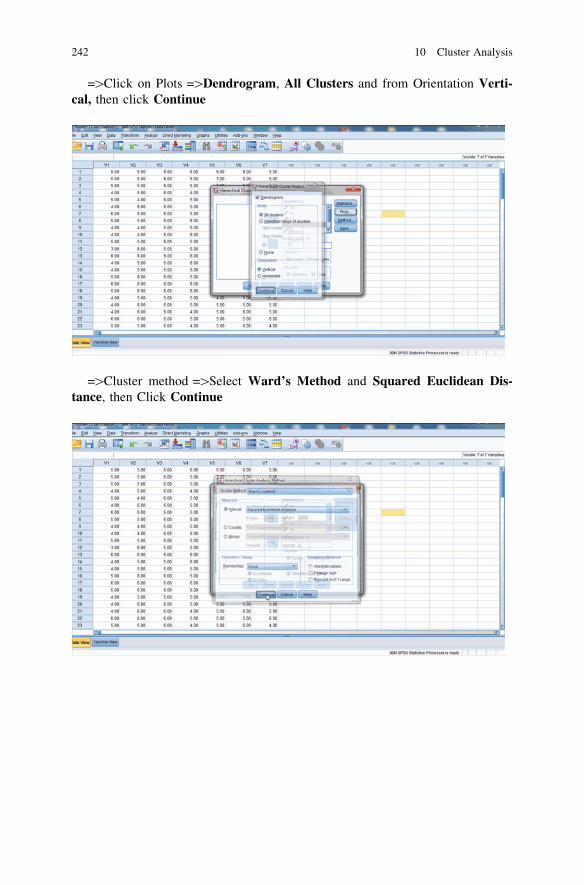
=[Click on Plots =[Dendrogram, All Clusters and from Orientation Verti-cal, then click Continue
=[Cluster method =[Select Ward’s Method and Squared Euclidean Dis-tance, then Click Continue
242 10 Cluster Analysis
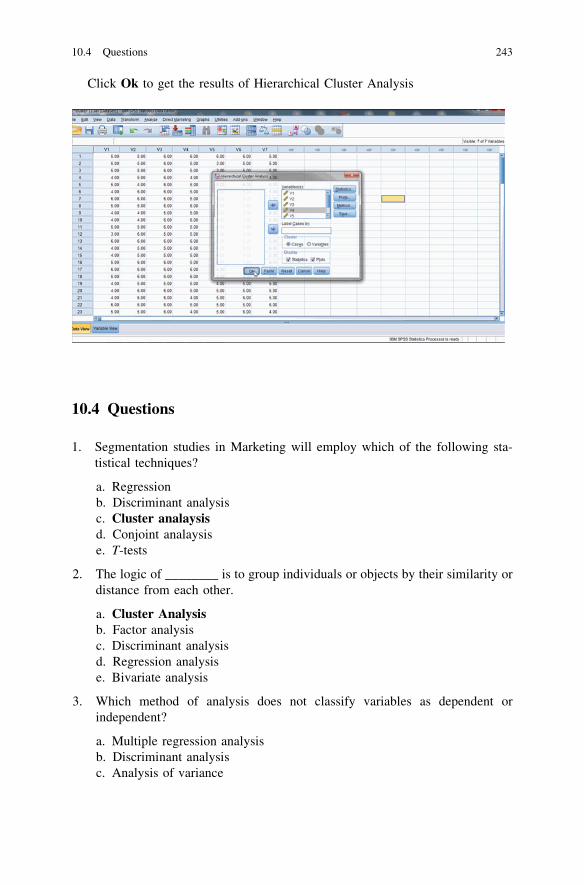
Click Ok to get the results of Hierarchical Cluster Analysis
10.4 Questions
1. Segmentation studies in Marketing will employ which of the following sta-tistical techniques?
a. Regressionb. Discriminant analysisc. Cluster analaysisd. Conjoint analaysise. T-tests
2. The logic of ________ is to group individuals or objects by their similarity ordistance from each other.
a. Cluster Analysisb. Factor analysisc. Discriminant analysisd. Regression analysise. Bivariate analysis
3. Which method of analysis does not classify variables as dependent orindependent?
a. Multiple regression analysisb. Discriminant analysisc. Analysis of variance
10.4 Questions 243

d. Cluster analysise. Simple regression analysis
4. A _________ or tree graph is a graphical device for displaying clusteringresults. Vertical lines represent clusters that are joined together. The positionof the line on the scale indicates the distances at which clusters were joined.
a. Dendrogramb. Scattergramc. Scree plotd. Icicle diagrame. Histogram.
244 10 Cluster Analysis
Chapter 11Binary Logistic Regression
11.1 Chapter Overview
This chapter discusses a methodology that is more or less analogous to linearregression discussed in the previous chapter, Binary Logistic Regression. In abinary logistic regression, a single dependent variable (categorical: two catego-ries) is predicted from one or more independent variables (metric or non-metric).This chapter also explains what the logistic regression model tells us: Interpre-tation of regression coefficients and odds ratios using IBM SPSS 20.0. Theexample detailed in this chapter involves one metric- and four non-metric-inde-pendent variables.
11.2 Logistic Regression
Logistic regression is considered to be a specialized form of regression. Inregression equation, the researcher explains the relationship between one metric-dependent and one or more metric-independent variables. In logistic regression,we can predict a categorical dependent variable (non-metric) in terms of one ormore categorical (non-metric) or non-categorical (metric) independent variables.The coefficients that we derived from both the equations are more or lesssimilar, in a way that it explains the relative impact of each predictor variableon dependent variable. In discriminant analysis, the non-metric dependent var-iable is predicted based on metric-independent variables and categorizing themembers or objects in each group based on discriminant Z scores. It requiresthe calculation of cutting scores and based on that we will assign the obser-vations to each group. The major differences between these three methods areshown Table 11.1.
S. Sreejesh et al., Business Research Methods,DOI: 10.1007/978-3-319-00539-3_11,� Springer International Publishing Switzerland 2014
245
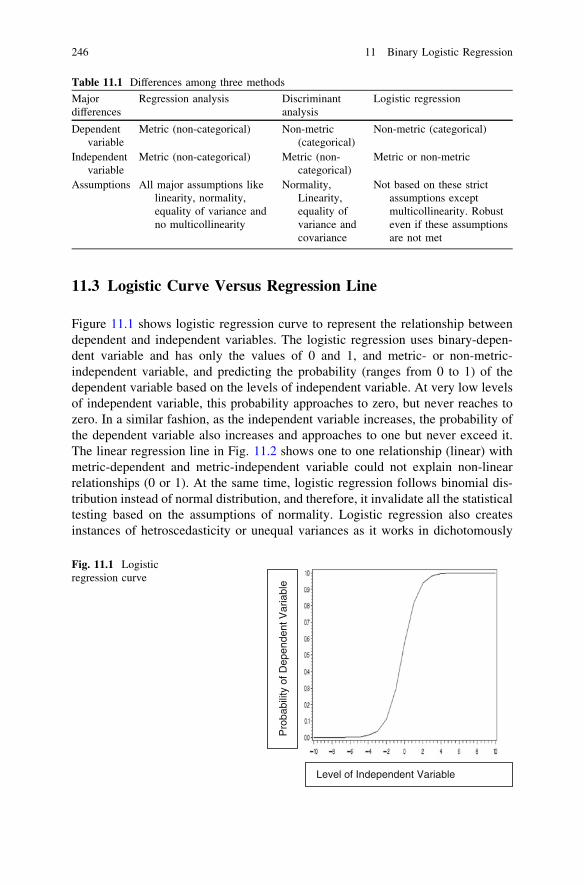
11.3 Logistic Curve Versus Regression Line
Figure 11.1 shows logistic regression curve to represent the relationship betweendependent and independent variables. The logistic regression uses binary-depen-dent variable and has only the values of 0 and 1, and metric- or non-metric-independent variable, and predicting the probability (ranges from 0 to 1) of thedependent variable based on the levels of independent variable. At very low levelsof independent variable, this probability approaches to zero, but never reaches tozero. In a similar fashion, as the independent variable increases, the probability ofthe dependent variable also increases and approaches to one but never exceed it.The linear regression line in Fig. 11.2 shows one to one relationship (linear) withmetric-dependent and metric-independent variable could not explain non-linearrelationships (0 or 1). At the same time, logistic regression follows binomial dis-tribution instead of normal distribution, and therefore, it invalidate all the statisticaltesting based on the assumptions of normality. Logistic regression also createsinstances of hetroscedasticity or unequal variances as it works in dichotomously
Table 11.1 Differences among three methods
Majordifferences
Regression analysis Discriminantanalysis
Logistic regression
Dependentvariable
Metric (non-categorical) Non-metric(categorical)
Non-metric (categorical)
Independentvariable
Metric (non-categorical) Metric (non-categorical)
Metric or non-metric
Assumptions All major assumptions likelinearity, normality,equality of variance andno multicollinearity
Normality,Linearity,equality ofvariance andcovariance
Not based on these strictassumptions exceptmulticollinearity. Robusteven if these assumptionsare not met
Pro
babi
lity
of D
epen
dent
Var
iabl
e
Level of Independent Variable
Fig. 11.1 Logisticregression curve
246 11 Binary Logistic Regression
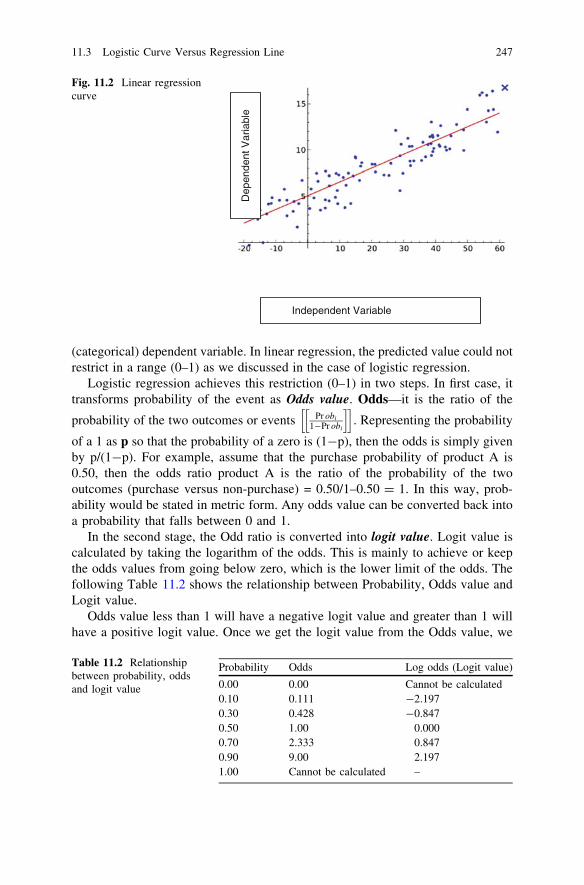
(categorical) dependent variable. In linear regression, the predicted value could notrestrict in a range (0–1) as we discussed in the case of logistic regression.
Logistic regression achieves this restriction (0–1) in two steps. In first case, ittransforms probability of the event as Odds value. Odds—it is the ratio of the
probability of the two outcomes or events Pr obi1�Pr obi
h ih i. Representing the probability
of a 1 as p so that the probability of a zero is (1-p), then the odds is simply givenby p/(1-p). For example, assume that the purchase probability of product A is0.50, then the odds ratio product A is the ratio of the probability of the twooutcomes (purchase versus non-purchase) = 0.50/1–0.50 = 1. In this way, prob-ability would be stated in metric form. Any odds value can be converted back intoa probability that falls between 0 and 1.
In the second stage, the Odd ratio is converted into logit value. Logit value iscalculated by taking the logarithm of the odds. This is mainly to achieve or keepthe odds values from going below zero, which is the lower limit of the odds. Thefollowing Table 11.2 shows the relationship between Probability, Odds value andLogit value.
Odds value less than 1 will have a negative logit value and greater than 1 willhave a positive logit value. Once we get the logit value from the Odds value, we
Dep
ende
nt V
aria
ble
Independent Variable
Fig. 11.2 Linear regressioncurve
Table 11.2 Relationshipbetween probability, oddsand logit value
Probability Odds Log odds (Logit value)
0.00 0.00 Cannot be calculated0.10 0.111 -2.1970.30 0.428 -0.8470.50 1.00 0.0000.70 2.333 0.8470.90 9.00 2.1971.00 Cannot be calculated –
11.3 Logistic Curve Versus Regression Line 247
can always transform this value back into Odds and then into probability, and thiswould restrict the problem of Odds value going below zero.
11.4 Hypothetical Example of Logistic Regression:Defaulter Prediction
The data in Table 17.1 come from a factious study. A total of 609 account holderswere studied to determine and predict how credit defaulting behaviour is depen-dent on the other variables observed.
In the last few quarters, one of the public sector bank in India (let’s call it ABCBank) observed that the default rate in its credit card portfolio has gone up and thisis causing a rise in Non-Performing Assets (NPA) of the bank. In order to reducethe risk, the bank is interested in constructing a model to predict and differentiateits defaulter and non-defaulters. The bank has classified the customers into twocategories, that is, clear category (non-defaulter) and default category. Now thebank is interested in knowing the repayment behaviour of the customers based oninformation collected from their applications for credit cards. The informationcollected was age of the customer, income of the customer, number of dependents,nature of job of the account holder (permanent versus temporary), education of theaccount holder and possession of other loans. The information is collected fromfirst 20 account holders and is shown in Table 11.3.
The researcher used the Logistic regression for the purpose of predicting futuredefaulters versus non-defaulters.
11.5 Logistic Regression Equation for Defaulter Prediction
LOGIT i ¼ lnProbdefaulter
1� Probdefaulter
� �� �
¼ b10 þ b11Ageþ b12Genderþ b13Incomeþ b14Legal Issues
þ b15Number of Dependentsþ b16Jobþ b17Education
þ b18Other Loan ð11:1Þ
11.6 SPSS Procedures for Performing Factor Analysison Defaulter Prediction
Step 1 Analyse =[ Regression =[ Binary Logistic to get to Fig. 11.3
248 11 Binary Logistic Regression
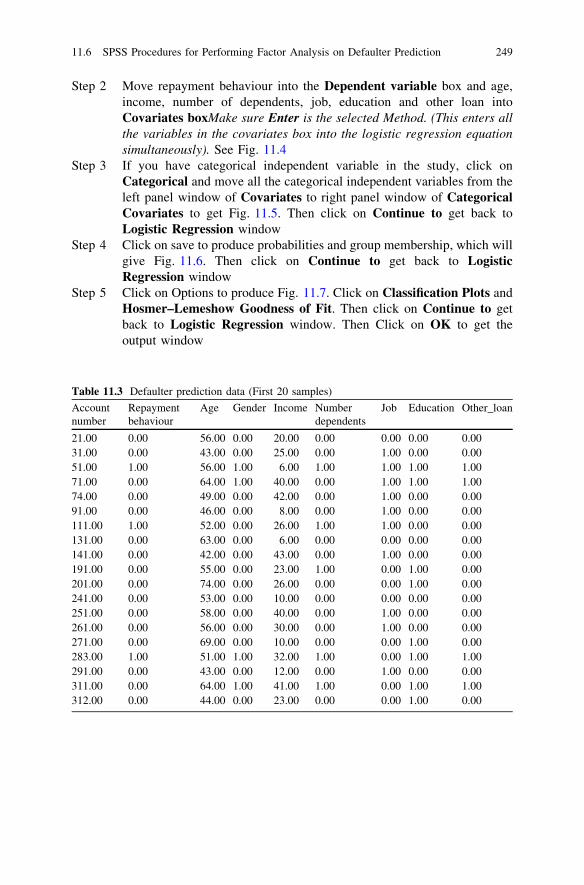
Step 2 Move repayment behaviour into the Dependent variable box and age,income, number of dependents, job, education and other loan intoCovariates boxMake sure Enter is the selected Method. (This enters allthe variables in the covariates box into the logistic regression equationsimultaneously). See Fig. 11.4
Step 3 If you have categorical independent variable in the study, click onCategorical and move all the categorical independent variables from theleft panel window of Covariates to right panel window of CategoricalCovariates to get Fig. 11.5. Then click on Continue to get back toLogistic Regression window
Step 4 Click on save to produce probabilities and group membership, which willgive Fig. 11.6. Then click on Continue to get back to LogisticRegression window
Step 5 Click on Options to produce Fig. 11.7. Click on Classification Plots andHosmer–Lemeshow Goodness of Fit. Then click on Continue to getback to Logistic Regression window. Then Click on OK to get theoutput window
Table 11.3 Defaulter prediction data (First 20 samples)
Accountnumber
Repaymentbehaviour
Age Gender Income Numberdependents
Job Education Other_loan
21.00 0.00 56.00 0.00 20.00 0.00 0.00 0.00 0.0031.00 0.00 43.00 0.00 25.00 0.00 1.00 0.00 0.0051.00 1.00 56.00 1.00 6.00 1.00 1.00 1.00 1.0071.00 0.00 64.00 1.00 40.00 0.00 1.00 1.00 1.0074.00 0.00 49.00 0.00 42.00 0.00 1.00 0.00 0.0091.00 0.00 46.00 0.00 8.00 0.00 1.00 0.00 0.00111.00 1.00 52.00 0.00 26.00 1.00 1.00 0.00 0.00131.00 0.00 63.00 0.00 6.00 0.00 0.00 0.00 0.00141.00 0.00 42.00 0.00 43.00 0.00 1.00 0.00 0.00191.00 0.00 55.00 0.00 23.00 1.00 0.00 1.00 0.00201.00 0.00 74.00 0.00 26.00 0.00 0.00 1.00 0.00241.00 0.00 53.00 0.00 10.00 0.00 0.00 0.00 0.00251.00 0.00 58.00 0.00 40.00 0.00 1.00 0.00 0.00261.00 0.00 56.00 0.00 30.00 0.00 1.00 0.00 0.00271.00 0.00 69.00 0.00 10.00 0.00 0.00 1.00 0.00283.00 1.00 51.00 1.00 32.00 1.00 0.00 1.00 1.00291.00 0.00 43.00 0.00 12.00 0.00 1.00 0.00 0.00311.00 0.00 64.00 1.00 41.00 1.00 0.00 1.00 1.00312.00 0.00 44.00 0.00 23.00 0.00 0.00 1.00 0.00
11.6 SPSS Procedures for Performing Factor Analysis on Defaulter Prediction 249
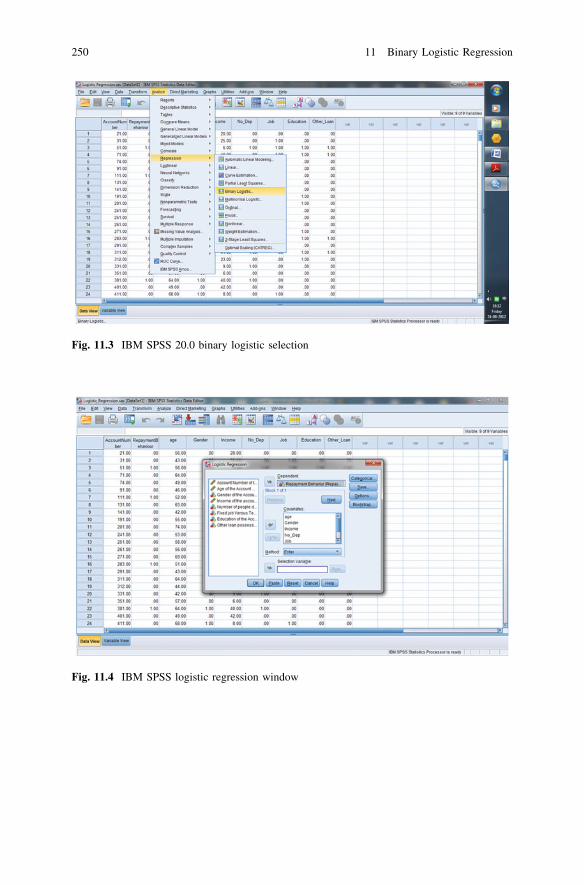
Fig. 11.3 IBM SPSS 20.0 binary logistic selection
Fig. 11.4 IBM SPSS logistic regression window
250 11 Binary Logistic Regression
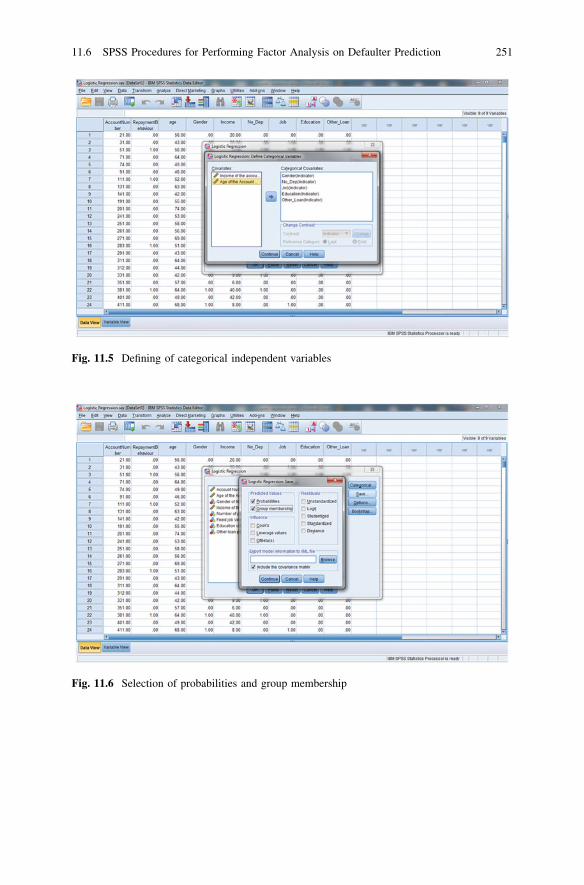
Fig. 11.6 Selection of probabilities and group membership
Fig. 11.5 Defining of categorical independent variables
11.6 SPSS Procedures for Performing Factor Analysis on Defaulter Prediction 251
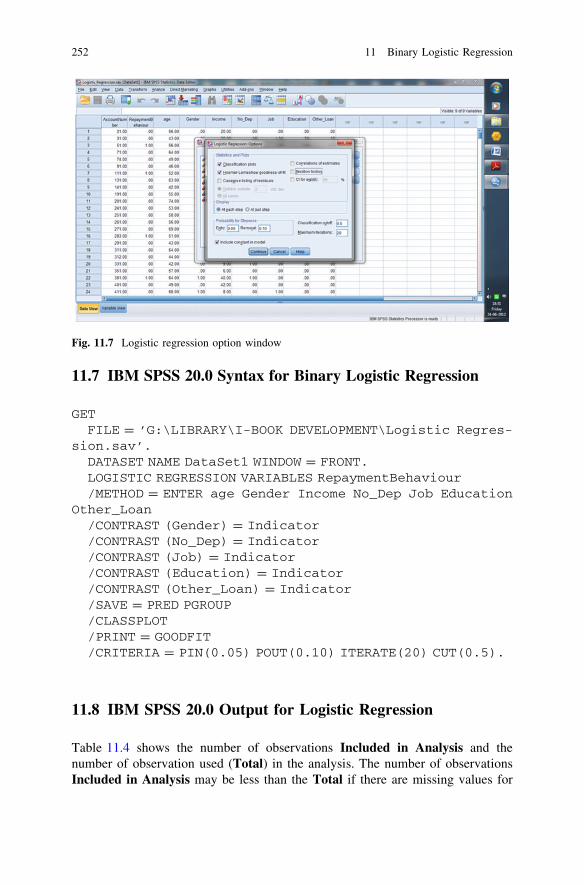
11.7 IBM SPSS 20.0 Syntax for Binary Logistic Regression
GETFILE = ’G:\LIBRARY\I-BOOK DEVELOPMENT\Logistic Regres-
sion.sav’.DATASET NAME DataSet1 WINDOW = FRONT.LOGISTIC REGRESSION VARIABLES RepaymentBehaviour/METHOD = ENTER age Gender Income No_Dep Job Education
Other_Loan/CONTRAST (Gender) = Indicator/CONTRAST (No_Dep) = Indicator/CONTRAST (Job) = Indicator/CONTRAST (Education) = Indicator/CONTRAST (Other_Loan) = Indicator/SAVE = PRED PGROUP/CLASSPLOT/PRINT = GOODFIT/CRITERIA = PIN(0.05) POUT(0.10) ITERATE(20) CUT(0.5).
11.8 IBM SPSS 20.0 Output for Logistic Regression
Table 11.4 shows the number of observations Included in Analysis and thenumber of observation used (Total) in the analysis. The number of observationsIncluded in Analysis may be less than the Total if there are missing values for
Fig. 11.7 Logistic regression option window
252 11 Binary Logistic Regression
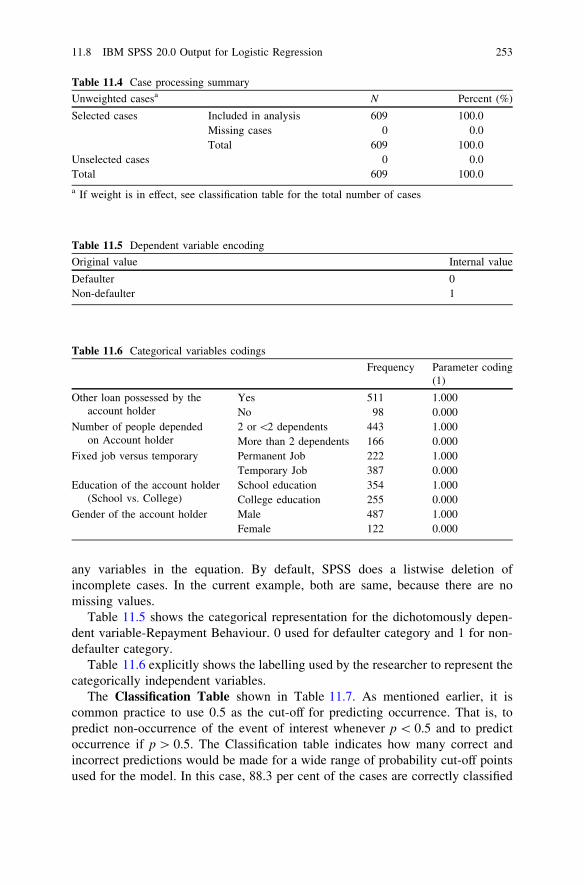
any variables in the equation. By default, SPSS does a listwise deletion ofincomplete cases. In the current example, both are same, because there are nomissing values.
Table 11.5 shows the categorical representation for the dichotomously depen-dent variable-Repayment Behaviour. 0 used for defaulter category and 1 for non-defaulter category.
Table 11.6 explicitly shows the labelling used by the researcher to represent thecategorically independent variables.
The Classification Table shown in Table 11.7. As mentioned earlier, it iscommon practice to use 0.5 as the cut-off for predicting occurrence. That is, topredict non-occurrence of the event of interest whenever p \ 0.5 and to predictoccurrence if p [ 0.5. The Classification table indicates how many correct andincorrect predictions would be made for a wide range of probability cut-off pointsused for the model. In this case, 88.3 per cent of the cases are correctly classified
Table 11.4 Case processing summary
Unweighted casesa N Percent (%)
Selected cases Included in analysis 609 100.0Missing cases 0 0.0Total 609 100.0
Unselected cases 0 0.0Total 609 100.0
a If weight is in effect, see classification table for the total number of cases
Table 11.5 Dependent variable encoding
Original value Internal value
Defaulter 0Non-defaulter 1
Table 11.6 Categorical variables codings
Frequency Parameter coding(1)
Other loan possessed by theaccount holder
Yes 511 1.000No 98 0.000
Number of people dependedon Account holder
2 or \2 dependents 443 1.000More than 2 dependents 166 0.000
Fixed job versus temporary Permanent Job 222 1.000Temporary Job 387 0.000
Education of the account holder(School vs. College)
School education 354 1.000College education 255 0.000
Gender of the account holder Male 487 1.000Female 122 0.000
11.8 IBM SPSS 20.0 Output for Logistic Regression 253
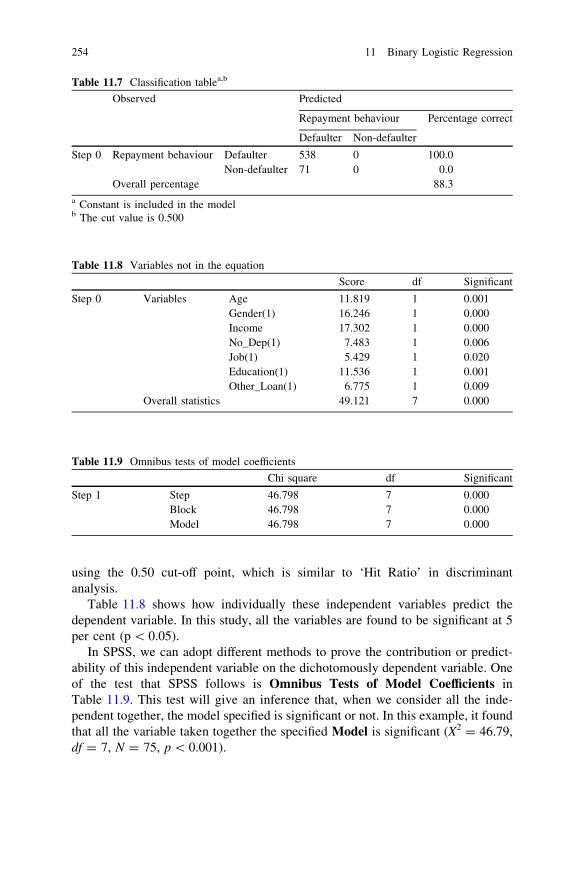
using the 0.50 cut-off point, which is similar to ‘Hit Ratio’ in discriminantanalysis.
Table 11.8 shows how individually these independent variables predict thedependent variable. In this study, all the variables are found to be significant at 5per cent (p \ 0.05).
In SPSS, we can adopt different methods to prove the contribution or predict-ability of this independent variable on the dichotomously dependent variable. Oneof the test that SPSS follows is Omnibus Tests of Model Coefficients inTable 11.9. This test will give an inference that, when we consider all the inde-pendent together, the model specified is significant or not. In this example, it foundthat all the variable taken together the specified Model is significant (X2 = 46.79,df = 7, N = 75, p \ 0.001).
Table 11.8 Variables not in the equation
Score df Significant
Step 0 Variables Age 11.819 1 0.001Gender(1) 16.246 1 0.000Income 17.302 1 0.000No_Dep(1) 7.483 1 0.006Job(1) 5.429 1 0.020Education(1) 11.536 1 0.001Other_Loan(1) 6.775 1 0.009
Overall statistics 49.121 7 0.000
Table 11.7 Classification tablea,b
Observed Predicted
Repayment behaviour Percentage correct
Defaulter Non-defaulter
Step 0 Repayment behaviour Defaulter 538 0 100.0Non-defaulter 71 0 0.0
Overall percentage 88.3a Constant is included in the modelb The cut value is 0.500
Table 11.9 Omnibus tests of model coefficients
Chi square df Significant
Step 1 Step 46.798 7 0.000Block 46.798 7 0.000Model 46.798 7 0.000
254 11 Binary Logistic Regression
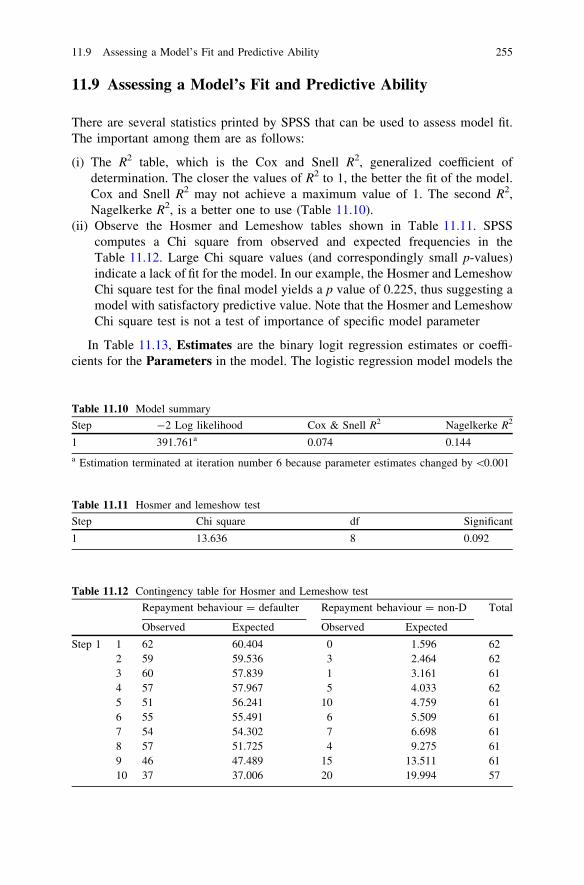
11.9 Assessing a Model’s Fit and Predictive Ability
There are several statistics printed by SPSS that can be used to assess model fit.The important among them are as follows:
(i) The R2 table, which is the Cox and Snell R2, generalized coefficient ofdetermination. The closer the values of R2 to 1, the better the fit of the model.Cox and Snell R2 may not achieve a maximum value of 1. The second R2,Nagelkerke R2, is a better one to use (Table 11.10).
(ii) Observe the Hosmer and Lemeshow tables shown in Table 11.11. SPSScomputes a Chi square from observed and expected frequencies in theTable 11.12. Large Chi square values (and correspondingly small p-values)indicate a lack of fit for the model. In our example, the Hosmer and LemeshowChi square test for the final model yields a p value of 0.225, thus suggesting amodel with satisfactory predictive value. Note that the Hosmer and LemeshowChi square test is not a test of importance of specific model parameter
In Table 11.13, Estimates are the binary logit regression estimates or coeffi-cients for the Parameters in the model. The logistic regression model models the
Table 11.11 Hosmer and lemeshow test
Step Chi square df Significant
1 13.636 8 0.092
Table 11.12 Contingency table for Hosmer and Lemeshow test
Repayment behaviour = defaulter Repayment behaviour = non-D Total
Observed Expected Observed Expected
Step 1 1 62 60.404 0 1.596 622 59 59.536 3 2.464 623 60 57.839 1 3.161 614 57 57.967 5 4.033 625 51 56.241 10 4.759 616 55 55.491 6 5.509 617 54 54.302 7 6.698 618 57 51.725 4 9.275 619 46 47.489 15 13.511 6110 37 37.006 20 19.994 57
Table 11.10 Model summary
Step -2 Log likelihood Cox & Snell R2 Nagelkerke R2
1 391.761a 0.074 0.144a Estimation terminated at iteration number 6 because parameter estimates changed by \0.001
11.9 Assessing a Model’s Fit and Predictive Ability 255
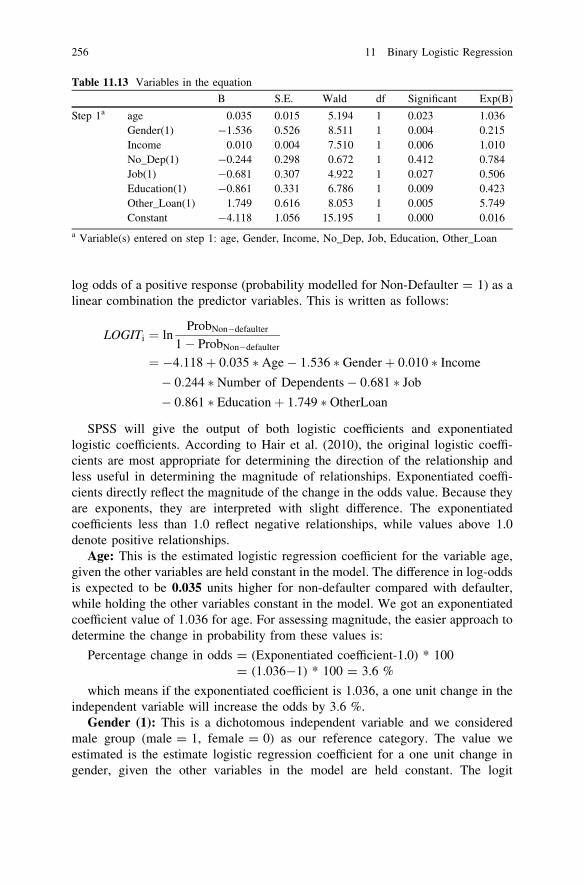
log odds of a positive response (probability modelled for Non-Defaulter = 1) as alinear combination the predictor variables. This is written as follows:
LOGITi ¼ lnProbNon�defaulter
1� ProbNon�defaulter
¼ �4:118þ 0:035 � Age� 1:536 � Genderþ 0:010 � Income
� 0:244 � Number of Dependents� 0:681 � Job
� 0:861 � Educationþ 1:749 � OtherLoan
SPSS will give the output of both logistic coefficients and exponentiatedlogistic coefficients. According to Hair et al. (2010), the original logistic coeffi-cients are most appropriate for determining the direction of the relationship andless useful in determining the magnitude of relationships. Exponentiated coeffi-cients directly reflect the magnitude of the change in the odds value. Because theyare exponents, they are interpreted with slight difference. The exponentiatedcoefficients less than 1.0 reflect negative relationships, while values above 1.0denote positive relationships.
Age: This is the estimated logistic regression coefficient for the variable age,given the other variables are held constant in the model. The difference in log-oddsis expected to be 0.035 units higher for non-defaulter compared with defaulter,while holding the other variables constant in the model. We got an exponentiatedcoefficient value of 1.036 for age. For assessing magnitude, the easier approach todetermine the change in probability from these values is:
Percentage change in odds = (Exponentiated coefficient-1.0) * 100= (1.036-1) * 100 = 3.6 %
which means if the exponentiated coefficient is 1.036, a one unit change in theindependent variable will increase the odds by 3.6 %.
Gender (1): This is a dichotomous independent variable and we consideredmale group (male = 1, female = 0) as our reference category. The value weestimated is the estimate logistic regression coefficient for a one unit change ingender, given the other variables in the model are held constant. The logit
Table 11.13 Variables in the equation
B S.E. Wald df Significant Exp(B)
Step 1a age 0.035 0.015 5.194 1 0.023 1.036Gender(1) -1.536 0.526 8.511 1 0.004 0.215Income 0.010 0.004 7.510 1 0.006 1.010No_Dep(1) -0.244 0.298 0.672 1 0.412 0.784Job(1) -0.681 0.307 4.922 1 0.027 0.506Education(1) -0.861 0.331 6.786 1 0.009 0.423Other_Loan(1) 1.749 0.616 8.053 1 0.005 5.749Constant -4.118 1.056 15.195 1 0.000 0.016
a Variable(s) entered on step 1: age, Gender, Income, No_Dep, Job, Education, Other_Loan
256 11 Binary Logistic Regression
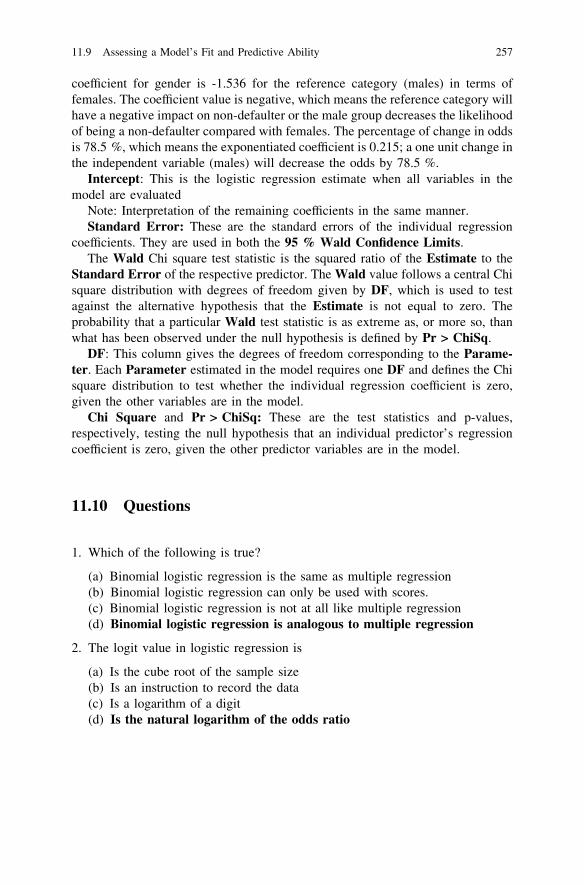
coefficient for gender is -1.536 for the reference category (males) in terms offemales. The coefficient value is negative, which means the reference category willhave a negative impact on non-defaulter or the male group decreases the likelihoodof being a non-defaulter compared with females. The percentage of change in oddsis 78.5 %, which means the exponentiated coefficient is 0.215; a one unit change inthe independent variable (males) will decrease the odds by 78.5 %.
Intercept: This is the logistic regression estimate when all variables in themodel are evaluated
Note: Interpretation of the remaining coefficients in the same manner.Standard Error: These are the standard errors of the individual regression
coefficients. They are used in both the 95 % Wald Confidence Limits.The Wald Chi square test statistic is the squared ratio of the Estimate to the
Standard Error of the respective predictor. The Wald value follows a central Chisquare distribution with degrees of freedom given by DF, which is used to testagainst the alternative hypothesis that the Estimate is not equal to zero. Theprobability that a particular Wald test statistic is as extreme as, or more so, thanwhat has been observed under the null hypothesis is defined by Pr > ChiSq.
DF: This column gives the degrees of freedom corresponding to the Parame-ter. Each Parameter estimated in the model requires one DF and defines the Chisquare distribution to test whether the individual regression coefficient is zero,given the other variables are in the model.
Chi Square and Pr > ChiSq: These are the test statistics and p-values,respectively, testing the null hypothesis that an individual predictor’s regressioncoefficient is zero, given the other predictor variables are in the model.
11.10 Questions
1. Which of the following is true?
(a) Binomial logistic regression is the same as multiple regression(b) Binomial logistic regression can only be used with scores.(c) Binomial logistic regression is not at all like multiple regression(d) Binomial logistic regression is analogous to multiple regression
2. The logit value in logistic regression is
(a) Is the cube root of the sample size(b) Is an instruction to record the data(c) Is a logarithm of a digit(d) Is the natural logarithm of the odds ratio
11.9 Assessing a Model’s Fit and Predictive Ability 257
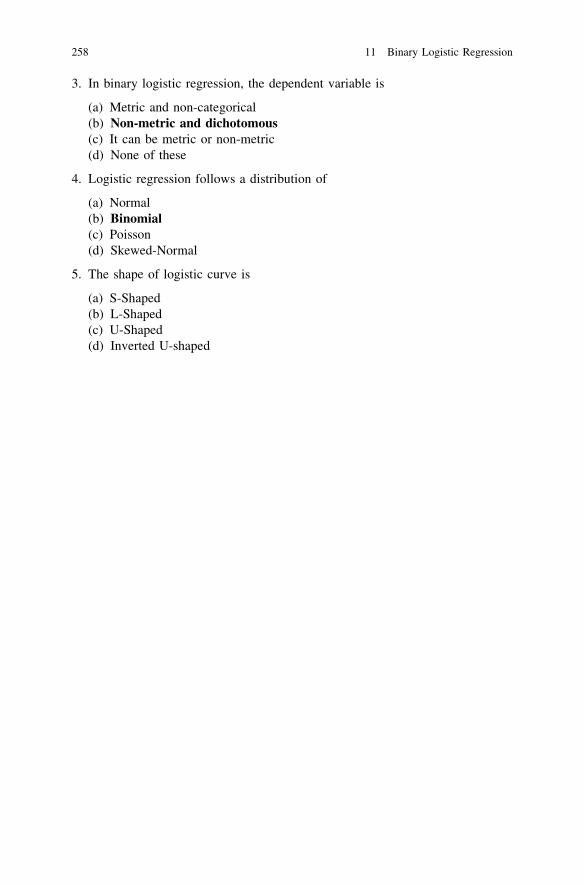
3. In binary logistic regression, the dependent variable is
(a) Metric and non-categorical(b) Non-metric and dichotomous(c) It can be metric or non-metric(d) None of these
4. Logistic regression follows a distribution of
(a) Normal(b) Binomial(c) Poisson(d) Skewed-Normal
5. The shape of logistic curve is
(a) S-Shaped(b) L-Shaped(c) U-Shaped(d) Inverted U-shaped
258 11 Binary Logistic Regression

Part VData Presentation
Chapter 12Business Research Reports
Market researchers and decision makers conduct research on various problems/opportunities and base their future decisions on the findings of the research. Unlessthe research results are properly communicated in the reports, they would be oflittle use to managers. Managers cannot take valid and effective decisions unlessthe entire research findings are presented to them in a systematic manner.A business research report contains many items including findings, analysis,interpretations, conclusions and at times recommendations. These can be presentedto the management either in a written form or communicated orally. For theresearch findings to be useful to the managers, the research report needs to bemeticulously designed, with all the necessary contents properly arranged andpresented.
This chapter deals with the fundamentals of report writing and presentation.The chapter begins with a description of the types of research reports, providesan insight into the various components of the written business research reportand concludes with a description of the features of written and oralpresentation.
12.1 Types of Research Reports
12.1.1 Short Reports
Short research reports usually run into 4–5 pages and are prepared for thoseresearches, which have a well-defined problem, limited scope and employ a clear-cut methodology. These reports usually start with a concise statement regardingthe approval for the study, followed by the objective of the study, that is, theproblem definition and the research overview, which contains concisely, the mainpart of the research, such as the methodology used. This is followed by conclu-sions based on the findings and recommendations, if any. The underlying basis for
S. Sreejesh et al., Business Research Methods,DOI: 10.1007/978-3-319-00539-3_12,� Springer International Publishing Switzerland 2014
261
these types of reports is to make information available, to all those concerned, inan easy-to-use format. Short reports are prepared even for small clients who haveinexpensive projects.
12.1.2 Long Reports
As the name indicates, long reports are more detailed than the short reports. Theycan be further subdivided into technical and management reports based on theobjectives of the researchers’ and the end users’. Technical reports (TRs) areprimarily meant for researchers. Management reports are meant for managers (asend users), to aid their decision-making.
12.1.2.1 The Technical Report
A TR should focus on a specific topic logically pertaining to the research objec-tive. The report should include the following: a descriptive title, author name andinformation, date, list of keywords, informative abstract, body, acknowledgments,list of references and appendices. The introduction of each TR should clearlyidentify its thesis and an organizational plan for the same.
The body should consist of sources of data, research procedures, samplingdesign, and data collection methods, instruments used, and data analysis arrangedinto a standard format under motivation, methods, results and discussion. The TRshould include sufficient procedural information for other users to replicate thestudy. Therefore, it should explain what was done, why it was done, what wasdiscovered and what was significant in the findings. The report should identifyclearly what is original about the work, and how it relates to past knowledge.
There is no minimum or maximum length requirement for a TR. However,usually they are of 10–15 pages. A good quality TR should have the conclusionsand recommendations in line with the findings. While all necessary details shouldbe referred to, it should avoid the inclusion of non-essential information andoversimplification.
12.1.2.2 The Management Report
Managers and decision-makers want information quick and straight to the point.Therefore, they show little interest in knowing the technicalities of the research.They are more interested in the ultimate findings and conclusions, which can act asa base for their decisions. As the management reports are meant for a non-tech-nical audience, there should be very less use of technical jargons and whereverjargons are used, they should be explained using a footnote or in the appendices.The language of a management report should be such that it is easy to understand.Some of the other features of a good management report are as follows:
262 12 Business Research Reports
• Short and direct statements• Underlining relevant parts for better emphasis• Pictures and graphs accompanying tables• Graphics and animations accompanying the presentation of the report
12.2 Components of Research Reports
Be they short or long, formal or informal, routine or special, public or private anddaily/weekly/monthly/annual, research reports have a set of specified components.A typical research report has the followings sections:
• Prefatory information:
– Letter of Transmittal– Title Page– Authorization Statement– Executive Summary– Table of Contents
• Introduction:
– Problem Statement– Research Objectives– Background
• Methodology:
– Sampling Design– Research Design– Data Collection– Data Analysis– Limitations
• Findings• Conclusions and Recommendations• Appendices• Bibliography
12.2.1 Prefatory Information
The prefatory information contains the letter of transmittal, the title page, autho-rization statement, executive summary and table of contents.
Letter of Transmittal. The letter of transmittal is a sort of authorization by theclient organization, citing approval for the project. This becomes necessary when
12.1 Types of Research Reports 263
the relationship between the researcher and the client is formal. A transmittal letterconsists of a salutation of the person who commissioned the report, the objectivityof the letter, a brief synopsis of the report, acknowledgements and follow-up actionexpected of the reader.
Title Page. The title page should include the following:
• The title of the report• The date• Name of the client• Name of the organization and the researchers• The nature of the project in a precise and succinct manner
The title should incorporate the following elements: the variables taken intoaccount in the study, the type of relationship between the variables included in thestudy and the target population for whom the results can be useful. A shortinformative title can be effective.
Authorization Statement. A letter of authorization is a letter from the client to theresearcher approving the project and specifying some of the details. Such lettersusually accompany the research reports to federal and state governments wheredetailed information about authorization factors is required. At times, a reference tothe letter of authorization in the letter of transmittal is deemed enough. The letternot only helps in identifying the sponsor, but also outlines the original request.
Executive Summary. This functions as a miniature report. The key findings arevery concisely presented in the executive summary running into 100–200 words ora maximum of two pages. The major thrust of the executive summary should be onhighlighting the objective, salient features and analysis of the results including therecommendations. Recommendations should be given if the client wants them,else should be avoided. This is because some decision-makers do not want theirthought process to be limited to the recommendations given. As the executivesummary is the gist of the whole report, it is framed only after the report iscompleted. Conclusions should be supported later and graphics should be used ifnecessary.
Table of Contents. The table of contents lists the divisions and sub-divisions ofthe report with appropriate page numbers. Shorter reports can suffice with the mainheadings only. As the table of contents lists the topics covered, it is preferable totake the headings from the headings in the report. A linking row of dots shouldconnect the topics with the page number. The list should be in the same sequenceas it appears in the original report. The list of tables, charts and graphs follows thetable of contents.
264 12 Business Research Reports
12.2.2 Introduction
The introduction gives an overview of the report. It highlights parts of the projectlike problem definition, research objectives, background material and the findings.It lays down the plan for the development of the project.
Problem Statement. This highlights the basic problem for the research willprobe into. It explains the reason why the research is being conducted and isusually followed by a set of objectives.
Research Objectives. Research objectives form the heart of the study. Theyaddress the purpose of the project. Every research follows a set of well-plannedobjectives. Therefore, the general and specific objectives should be stated. Thesecan be adjusted for sequencing without changing their basic nature. The researchobjectives can take the form of questions and statements. The objectives influencethe choice of research methodology and the basic structure used to report thefindings.
Background. Background information may include a review of the previousresearch or descriptions of conditions that caused the project to be authorized. Itmay entail preliminary results from an experience survey or secondary data fromvarious sources. The references from secondary data, definitions and assumptionsare included in this section. Background material depending on whether it containsthe literature reviews or information relating to the occurrence of the problem isplaced either after the research objectives or before the problem definition,respectively.
12.2.3 Methodology
For short reports and management reports, it is not necessary to have a separatesection on the methodology used. This can be included in the introduction sectionand details can be accommodated in the appendix. However, in the case of a TR,methodology needs to be explained as an independent section and include thefollowing.
Sampling Design. The researcher in this section defines the target populationand the sampling methods to use. This section contains other necessary informa-tion such as:
• Type of sampling (probability or non-probability) used• Type of probability sampling (simple random or complex random) or non-
probability sampling (quota sampling or snowball sampling) used• The factors influenced the determination of sample size and selection of the
sampling elements• The levels of confidence and the margin of acceptable error
12.2 Components of Research Reports 265
The sampling methods used should be explained and calculations should beplaced in the appendix rather than in the body of the report.
Research Design. The research design has to be custom-made to the researchpurpose and should contain information on:
• Nature of the research design• Design of questionnaires• Questionnaire development and pre-testing• Data that were gathered• Definition of interview and type of interviewers• Sources (both primary and secondary) from which data were collected• Scales and instruments used• Designs of sampling, coding and method of data input• Strengths and weaknesses
Copies of materials used and the technical details should be placed in theappendix.
Data Collection. The contents of this section depend on the research design. Asthe name implies, data collection pertains to the information about:
• Time of data collection• Field conditions during data collection• The number of field workers and supervisors• The training aspects of supervisors and workers• Handling of irregularities, if any• Subject assignments to various groups• Administration of tests and questionnaires• Manipulation of variables
If any secondary data were used, then the relevance of that data should begiven. Details of field instructions and any other necessary information should begiven in the appendix.
Data Analysis. This section provides information on the different methods usedto analyse the data and the justification for choosing the methods. In other words, itshould justify the choice of the methods based on assumptions. It provides detailson:
• Data handling• Groundwork analysis• Rational statistical tests and analysis
Limitations. Certain researchers tend to avoid this section, but this is not a signof professionalism. There should be a tactful combination of reference andexplanation of the various methodologies and their limitations or implementationproblems. The limitations need not be explained in detail. Details of limitations donot belittle the research. They help the reader in acknowledging its honesty andvalidity.
266 12 Business Research Reports
12.2.4 Findings
Most of the space in the report is devoted to this section. It presents all the relevantdata but makes no attempt to draw any inferences. The section attempts to bringthe fore any pattern in the industry. Charts, graphs and tables are generally used topresent quantitative data. It is better to report one finding per page and support itwith quantitative data.
12.2.5 Conclusions and Recommendations
Conclusions should be directly related to the research objectives or hypotheses.Conclusions are inferences drawn from the findings. The researcher should alwayspresent the conclusions as he has first-hand knowledge of the research study. It iswrong to leave the inference of the conclusions on the reader.
Recommendations on the other hand are a few corrective actions presented bythe researcher. They highlight the actions the report calls for as per the researcher.The recommendations should be in line with the results of the report and should beexplicit. They may even contain plans of how future research for the same canproceed. However, recommendations ought to be given only if the client isinterested. It may happen that the client does not want any recommendations onthe findings. In such a case, the report should not carry any recommendations.
12.2.6 Appendices
Appendices are optional. They should be used to present details that were part ofthe research but were not necessary to the presentation of the findings orconclusions.
Appendices include raw data, calculations, graphs, copies of forms and ques-tionnaires, complex tables, instructions to field workers and other quantitativematerial that would look inappropriate in the main text. The reader can refer tothem if required. However, care should be taken that they do not exist in isolationand reference to each appendix is given in the text.
12.2.7 Bibliography
A list of citations or references to books or periodical articles on a particular topicis known as a bibliography. It contains all the works consulted in the preparation of
12.2 Components of Research Reports 267
the report, not just those referred to in the text. A consistent reference formatshould be used all through the section.
12.3 Written Presentation
12.3.1 Pre-writing Concerns
The effectiveness of a research report depends on how well it is presented. A reporthas many parts and all parts should display interconnectivity. This interconnec-tivity is possible only with a meticulous organization of the different parts of thereport. This organization should be reflected in the initial sections of the report. Agood researcher spends significant amount of time in designing this initial sectionwherein he tries to relate the purpose of the report, the audience it is meant for, thetechnical background and the limitations under which the report is written.
Customizing the report to the tastes of different audience is necessary. The gaparising due to degree of difference between the subject knowledge of the writer andthe reader should be taken into account. The technical knowledge of the end-usersmay not match that of the researcher so the report should be written in a simplemanner with less technical jargons. This would enable the readers to understandthe theme of the project and relate the conclusions to the specific objectivesoutlined in the report. In fact, all parts of the report should coherently pursue theresearch problem. This means that the conclusions and findings when integratedbackwards should show some connection with the research objectives, which wereframed in line with the problem situation. This unified structure assists the readerto understand how the research problem was probed into and how the project wasaccomplished. As the final organized report is written after the research is over, theresearcher can relate the facts and present the findings in a manner that wouldappeal to the reader. Pre-writing concerns, therefore, play an important role indesigning the research report. Pre-writing entails the following sections:
• Outline• Bibliography
Outline. The best way to organize a report is to develop an outline of the mainsections. The outlining stage gives a natural progression to the various stages ofreport writing. The outlining stage concentrates on how it should be presented tomake an impact on the readers. In trying to establish the relation among thevarious parts, the outline should introduce the complete scope of the report. Assaid earlier, the outline should contain the main headings of the various sectionsalong with their sub-headings and sub sub-headings. This task is now made easywith the help of special software that helps in drawing a proper outline for aproject report.
268 12 Business Research Reports
Two styles of outlining can be generally identified, that is, the topic outline andthe sentence outline. The topic outline includes a key word or phrase that remindsthe writer of the nature of the argument represented by the keyword. The sentenceoutline on the other hand gives a description of the ideas associated with thespecific topic. A traditional outline structure for a TR is shown below.
(1) Major Topic Heading
(A) Main Sub-topic Heading
(1) Sub Sub-Topic Heading
(a) Further Details.
A newer form of outlining is the decimal form. Decimal form of outline isshown below.
(1) Major Topic Heading
1.1 Main Sub-topic Heading
1.1.1 Sub Sub-Topic Heading
1.2 Main Sub-topic Heading
1.2.1 Sub Sub-Topic Heading
Bibliography. As defined earlier, bibliography is a list of citations or referencesto books or periodicals on a particular topic. It is necessary to provide the details ofthe secondary sources used to prepare the technical or long report. Special soft-ware can help in searching, sorting, indexing and formatting bibliographies intoany required style. This software helps to cite the references from online sourcesand translate them into database records, which can be used for future referrals.
12.3.2 Writing the Draft
Different authors have different styles of presenting their work. Some prefer towrite the report themselves doing the additions/deletions, while others depend on agood editor to transcribe their reports into the required format. The quality of areport depends upon the following:
• Readability and Comprehensibility• Tone• Final proof
Readability and Comprehensibility. A report has to be properly understood bythe readers to achieve high readership. Therefore, a researcher should take intoaccount the needs of the reader before preparing the report. The basic requirements
12.3 Written Presentation 269
of a report are readability and comprehensibility. The following points should benoted in this context:
• It is necessary to avoid ambiguous statements.• The report should be checked for grammar.• As far as possible, simple words that convey the meaning clearly should be used.• Sentences should be reviewed and edited to ensure a flow from one statement to
another.• Larger units of text should be broken down into smaller ones without altering
the original meaning.• Visual aids should be provided wherever required for better understanding.• Visuals should not be inserted at the end of a section. They should be placed
within the section for better comprehensibility.• Each paragraph should contain only one idea.• Underlining and capitalization should be used to differentiate and emphasize the
important ideas from the secondary and subordinate ideas.• Technical terms and jargons should be avoided wherever possible. Wherever
unavoidable, they should find a reference in the footnotes.• Each reference should include the name of the author, article title, journal title,
volume, page numbers and year. Journal titles and book titles should be initalics. Book references should also include the publisher’s name.
• Symbols, abbreviations, diagrams and statistics should find a reference, ifnecessary.
Tone. Proper use of tone is essential for better reading effects. This highlightsthe attitude of the writer and reflects his understanding of the reader. The reportshould make tactful use of details and generalizations. It should focus on facts andnot the opinions of the writer. The report should make use of passive voice as faras possible and should avoid the use of first person. Recommendations should notundergo any sort of alterations to give them a positive image.
Final proof. Final editing of the draft should be taken up after a gap of at least aday. This helps in identifying mistakes, if any, better and correcting the mistakes.Final editing requires various questions to be answered pertaining to the organi-zation, contextual and layout of the final report. This can be done a couple of timesand looking at the report with a different focus each time. The executive summaryfollows the final stage of editing.
12.3.3 Presentation of the Research Report
A business researcher can present the findings of the research either in an elec-tronic format or as a printout. Irrespective of the medium the researcher chooses topresent his report, he should ensure that the findings are presented in a professional
270 12 Business Research Reports
manner to the end-user. Some of the important aspects that should be consideredfor presenting a report are listed below.
• Reports should be typed or printed using an ink-jet, laser, or colour printer.• The report should have a uniform font.• The findings of the research study should be placed under appropriate headings
and sub-headings.• Leave ample space between the lines and on all sides for better reading.
Overcrowding creates problems and is stressful for the eyes.• Split larger text paragraphs into smaller paragraphs.• Use bullet points to list specific points.• Ensure that appropriate labels are assigned to every table, figure and graph that
appears in the report.
12.4 Oral Presentations
The findings of the research may be presented orally. Such presentations are madeto a small group of people (decision-makers/managers) who are more interested inthe critical findings of the report. Therefore, unlike written reports that are elab-orate, oral presentations are only briefings. Oral presentations are known to con-tinue for 20–30 min, but presentations extending beyond an hour are notuncommon. Such sessions are interactive where the audience clarifies their doubtsat the end of the presentation. Some distinctive features of oral presentation areexplored in the subsequent sections.
12.4.1 Initial Planning
This basically requires the speaker to preplan certain strategies for a better pre-sentation. For this, the speaker gets in touch with the organizers to determine thefollowing:
• The type of speech expected of him/her. Whether the interaction will be aninformal chat or a formal discussion.
• Whether the audience will consist of general or specialist clients and theirnumbers.
• Whether the time allotted will be sufficient for an exploratory presentation orwhether the presentation will have to be a short one consisting of only the majorpoints.
• The expected content of the presentation. This is to have an idea of what theaudience expects of the presentation, so as to get prepared in advance.
• The type of audio-visuals to be used to facilitate the presentation.
12.3 Written Presentation 271
• Whether a memorized speech or an extemporaneous presentation will create abetter impact.
12.4.2 Preparation
Once the content of the presentation is decided, the next step involves planninghow to present it. For the presentation to be well constructed and tidy, it has to beprepared well in advance. The preparation should include framing a time boundoutline and a proper homework of the content in advance. The following pointsneed to be taken into account:
• The content collected should be jotted down in big, bold letters highlighting theproblem, its importance and steps to be taken.
• The outline of the presentation should be such that it keeps the interest of theaudience alive throughout the presentation.
• Sentences should be short and appropriately arranged to follow a logicalsequence.
• Determine the content that has to be supported by visual aids.• The presenter should get a feel of the room and the equipment, if possible 1 day
in advance.• The presenter should do a thorough rehearsal of the presentation. This can be
done in the presence of colleagues to get their feedback and make corrections ifnecessary.
12.4.3 Making the Presentation
This involves the execution of all that is rehearsed. It should start with a warmwelcome or a greeting to the audience. The execution of the presentation wouldconsist of the following:
Opening. The opening should be as brief as possible using not more than 15 % ofthe allotted time. The opening section should provide an overview of the entirepresentation. It should include the reasons for the initiation of the project and itsobjectives. It is necessary to start the presentation with a startling fact, a pertinentquestion, or an interesting statistical figure to grab the attention of the audience.Findings and Conclusions. Findings and conclusions should immediately followand it should be ensured that each conclusion is in line with the research objec-tives. The speaker should spend 60 % of the allotted time in explaining the detailsof this section.Recommendations. The recommendations should appropriately follow the con-clusions thus maintaining the flow of the presentation. After the presentation isover, it can be thrown open to the audience for questions.
272 12 Business Research Reports
The following points need to be taken into account during the presentation:
• Be ready with the opening statement when being introduced by the host.• Use a natural, moderate rate of speech and use automatic gestures.• While using laser pointers, remember not to point them at the audience.• If lights need to be turned off, do it but not completely and for long.• Try to interact with the audience and maintain eye contact.• Try to have an impressive and memorable summary.• While doing all this, keep a strict eye on the time factor. It is good to finish
before time; never overshoot the time limits.
12.4.4 Delivery
An oral presentation is said to be effective when the content of the presentation isaccompanied by the positive approach of the speaker. Therefore, the dress, speedof speech and tone and pitch of voice of the speaker play an important role in thesuccess of a presentation. First time or inexperienced speakers may get nervousand this nervousness comes in the way of an effective presentation. Taking a fewdeep breaths, before starting the presentation helps in overcoming the nervousness.The presenter can arrive early and greet people as they walk in and have a chat.This creates a relaxed atmosphere. The following problems should be taken careof:
• Vocal Problems
– Try to speak loud enough to be heard by the audience.– Avoid speaking too fast and give a pause after every sentence, but not a long
one.– Vary the volume, tone according to the content.– Use appropriate language. For example, get the right level of formality/
informality.– Watch out for too much ‘uh,’ ‘you know’, ‘okay’ and other kinds of nervous
verbal habits.
• Physical Behaviour
– Avoid habitual behaviour (pacing, fumbling change in pocket or twirlinghair).
– Use hands to emphasize points but do not indulge in too much hand waving.– Do not turn your back to the audience and neither keep looking at a single
individual. Try to maintain eye contact with all.– Avoid being a barrier between the audience and the OHP or the display
screen.– Do not fumble with visuals. Arrange them in order, in advance.
12.4 Oral Presentations 273
• Handling QuestionsThis is the most important section of the oral presentation. This session eval-uates the interaction abilities of the speaker. A few points are worth consideringin this regard.
– Postpone questions aimed at resolving specific problems (or arcane knowl-edge). This is particularly important if the answer is expected to distract eitherthe presenter or the audience away from the flow of the presentation.
– The presenter should repeat the question so that the entire audience knowsabout the question and the presenter gets time to understand the question.
– The presenter should not interrupt the questioner in the middle and try toanswer. He should wait for the question to be complete.
– Take a pause before starting to answer.– If the presenter is not able to answer the question, he should say so.– The presenter can offer to research an answer and then get back to the
questioner later or ask for suggestions from the audience.– The presenter should avoid prolonged discussions with one person, extended
answers and especially arguments.
12.5 Visual Aids
12.5.1 Tables
A research report more often than not contains quantitative data to substantiate thevarious findings. These quantitative findings if presented in a narrative form wouldgo unnoticed by the reader. Therefore, a better way of representing them is tomake use of tables to present the statistics. Tables save the writer from beingcaught in details, which can be boring. Data in the form of tables form a vital partof the report and makes the comparisons of quantitative data easier.
There are two types of tables based on their nature: general and summary.General tables are large, complex and exhaustive. As they are very comprehensive,they are usually reserved for the appendix. Summary tables, on the other hand, areconcise and contain data that are closely associated with an explicit finding. Thisform of table can be customized to make it appealing. This can be done byretaining such important details only that will aid the reader in understanding thecontents of the table. Tables should be used when graphs or figures cannot makethe point.
A table should have the following features:
Title and Number. The title should be brief and yet all-inclusive of the informationprovided. It should be comprehensive enough to explain the subject of the table,the data classification and the relationship between the column and row headings.
274 12 Business Research Reports
It may also include a sub-title, if required. The sub-title usually includes themeasurement units used. If different measurement units are used in different partsof the table, it should be appropriately mentioned. All tables in a report should benumbered and a reference for each should be given in the text. The table title andnumber usually appear at the top.Bannerheads and Stubheads. Bannerheads are the identifying criteria for thecontents of the columns. Bannerheads specify the contents of the columns, that is,what data the column holds. Stubheads perform the same function for the contentsof the rows.Footnotes. Any special reference to or explanation that cannot be incorporated inthe table is given in the form of footnotes. Letters and asterisks instead of numbersare used to spot footnotes, as they help to avoid confusion with data values.Footnotes as they appear at the bottom of the page are also used to explainunfamiliar abbreviations to the reader.Source. Tables derived from secondary sources cannot be deemed to be original.Therefore, they should bear a source note that acknowledges the table to theoriginal source. A source can be anything from a published or printed material tocompany websites. The source is generally given at the bottom of the table.
12.5.2 Charts and Graphs
Charts and graphs in a research report tend to translate numerical information intovisual form for better understanding of the subject matter. Like tables, charts andgraphs also have a number and a title, labels for parts of the figure and sources andfootnotes. Graphs and charts which depict a general trend are accompanied by astatement as ‘not to scale’ to avoid any confusions. Charts can be of the followingtypes:
• Line Graphs• Pie Charts• Bar Charts
12.5.2.1 Line Graphs
A type of graph that highlights trends by drawing connecting lines between datapoints is known as a line graph. A line graph is a bar graph with the tops of the barsrepresented by points joined by continuous lines. This presents an eye-catchingway to illustrate trends and changes over long, continuous intervals. A line graphtakes statistical data presented in tables and represents them in rising and fallinglines, steep or gentle curves. Line graphs have an X-axis (horizontal) and a Y-axis(vertical), both labelled. When a time variable is used, the X-axis is numbered forthe time period, which is the independent variable, and the Y-axis is numbered for
12.5 Visual Aids 275
what is being measured, which is the dependent variable. Line graphs representdata that change with time, such as cycles, fluctuations, trends, distributions,increases and decreases in profits, employment, energy levels and temperatures.A line graph shows trends in data clearly, and hence, it is possible to predict thefuture trends for which data have not been collected.
12.5.2.2 Pie Charts
A type of presentation graphic in which percentage values are represented asproportionally sized slices of a pie is known as a pie chart. These charts are used todisplay the sizes of parts of some total quantity at a particular time. They can beused to compare different parts among themselves or with the whole. Therefore,they are represented in percentages. Before drawing a pie chart, it should beensured that the sum of the different parts to be included totals 100. This is becausethe pie chart is a circle. The slices of varying percentages are arrangedproportionately in a descending order, in a clockwise direction, with the largestslice occupying the 12 o’clock position in the circle. Different parts in the pie areshaded with different colours for better identification. Each slice is labelledhorizontally and its appropriate percentage of the whole is also mentioned. As piecharts are round figures, they are usually labelled outside the circle. Pie charts canbe misrepresented if parts of the whole are left out and if the whole is not definedas to what it stands for.
12.5.2.3 Bar Charts
A bar graph demonstrates the magnitude, sizes of several items or emphasizes thedifference at equal intervals of time. Each bar represents a separate quantity, andmultiple bars may be grouped and displayed horizontally or vertically. It shows thechanges in the value of the dependent variable plotted on the Y-axis at discreteintervals of the independent variable plotted on the X-axis. Bar graphs are similarto line graphs with the difference that instead of using points, horizontal or verticalrectangular bars are used. Use of bar graphs makes it easier to point out differencesamong several items in a chart with multiple variables, over a time period. Theytend to emphasize the rise or fall of one variable under the influence of another.Bar charts are of various types like pictogram/histogram grouped bar charts,segmented bars or deviation bar charts.
12.6 Summary
The essence of a business research report is the way it is presented, be it in thewritten format or orally. This makes it imperative for the report to be inclusive ofall the necessary details. These details may vary according to the specific
276 12 Business Research Reports
requirements of the clients. Business reports are of two types, that is, short andlong. Short reports are concise and are made for those researches that have a well-defined problem, limited scope and employ a clear-cut methodology. Long reportsare detailed and usually comprise of technical and management reports. Thevarious components of these reports are as follows: prefatory information, intro-duction, methodology, findings, conclusions and recommendations, appendicesand bibliography. While preparing a written report, the following points should betaken care of:
• Pre-writing concerns which consist of preparing, organizing and formatting theoutline and bibliography.
• Writing the draft that requires adapting the tone of the report to the tastes of theaudience for better readability and comprehensibility.
• Presentation considerations, which include the type of writing to be used, font ofthe words, formatting and preparing the cover of the report.
An oral presentation generally concentrates on the summary of the project withemphasis on the findings, conclusions and recommendations. Therefore, theessential criteria for a successful oral presentation are as follows:
• Initial planning, where the speaker plans certain strategies in advance regardingwhat to include in the report for a better presentation.
• Preparation, where he decides how to assemble the necessary items to maintaina flow in the presentation.
• Making the presentation, where he actually concentrates on presenting theessential findings of the report and the conclusions based on the objectives.
• Delivery, which provides essential tips on points to be taken care of during apresentation.
• Visual aids, which bring out the various ways in which the statistical findingscan be presented for a better impact of the presentation.
12.6 Summary 277
Index
AAdequate alternative, 153, 155, 159Administrative error, 74, 75Affective component, 122, 123Analysis, 4, 5, 8, 16, 21, 42, 54, 168, 179, 180,
185, 196, 197Analyzing research design, 18ANOVA, 199, 200Applied research, 4Associated errors, 119, 120Association technique, 55Assumptions of multiple regression, 195Asymmetrical, 83Attitude measurement, 121, 128Attitudes and behaviour, 44, 123Attitude scale, 127, 128Audits, 32, 42Autocorrelation, 195, 203Availability of resources, 7, 8, 11
BBalanced scale, 140Barcode reader, 172Bartlett test of spherecity, 221Basic research, 4, 17Behavioural component, 122, 123Biased wording, 153, 155Binary questions, 149, 151Budget, 9, 17, 71Business research, 18, 20, 27, 33, 70, 73, 82,
93, 107, 110, 164, 168
CCausal, 21, 82Central location telephonic interview, 68Checklist questions, 151
Classification, 31, 33, 37, 38, 44, 58, 60, 167Close ended questions, 52, 68Cluster analysis, 229, 231, 232, 233, 234, 237,
238, 240Coding, 20, 21, 121, 163, 167, 168, 170, 171,
173, 180Coefficient, 116, 119, 196, 198, 200–205Cognitive component, 122, 123Comparative scales, 128–131Completely automated telephonic interview, 69Completely randomized design, 98Completion technique, 55Computer assisted telephonic interview, 68Constant sum scale, 132Construction technique, 56Construct validity, 116–118Consumer panels, 44Content analysis, 80, 168, 170Content validity, 117Continuous scale, 133Contrived observation, 79Control group, 84, 88, 93, 95Criteria for good measurement, 107, 114Cross sectional and longitudinal, 61Cross tabulation, 173, 174, 180
DData analysis, 15, 58, 153, 163, 167, 180, 262,
266Data cleaning, 8, 10, 13, 20, 54, 57, 58, 115,
163, 172, 180Data collection, 8, 10, 13, 20, 39, 57, 67, 163,
172, 263, 266Data entry, 68, 75, 163, 168, 172Data mining, 163, 176–180Data mining process, 179Data processing error, 75
S. Sreejesh et al., Business Research Methods,DOI: 10.1007/978-3-319-00539-3,� Springer International Publishing Switzerland 2014
279
Decision making process, 4, 5, 222Deliberate falsification, 60, 77Dependent variable, 83, 85, 94, 195, 196Depth interviews, 47, 49, 50, 53Descriptive, 27Determinant, 211, 215, 217, 221Developing hypothesis, 15Direct observation, 10, 78Discarding unsatisfactory response, 166
EEditing, 20, 68, 163, 164, 166, 172, 180Eigenvalues, 217Error source, 121Evaluating data, 13, 14, 20, 21Examination of residual, 202Experimental analysis of variance, 86, 199Experimental design, 83, 85, 91, 96Experimental group, 84, 95, 99Experimental validity, 83Experiments, 18, 84, 86, 90, 97Exploratory factor, 207–226Exploratory research, 14, 16, 31, 46, 72Expressive technique, 56External validity, 86, 89, 91Extraneous variable, 83, 85, 90, 93, 95, 98
FFace validity, 179Factor analysis, 179, 207, 209–211, 220, 248Factorial design, 100, 101Factors affecting business research, 7Field environment, 89, 90Focus group, 10, 41, 51, 185Forced choice, 141, 142Frame of reference, 153, 154
GGeneralizability, 114, 118Globalization, 3, 12
HHidden issue, 50Hierarchical cluster analysis, 232, 235, 237, 240
IIndependent variable, 195, 196, 198, 200Instrument associated errors, 120Instrumentation, 88, 96
Internal consistency, 115Internal validity, 86, 87, 90, 92, 96, 102Interval, 41, 42, 113, 114Interviewer error, 75
KKMO, 211, 217, 221, 224, 227
LLaboratory environment, 89, 90Laddering, 49Latin square design, 99, 100Likert scale, 137, 138Logistic curve, 246Logistic regression, 245, 248, 249, 252
MMail surveys, 70, 71, 73, 77Maturation, 46, 87, 92, 102Measurement of belief and situation, 126, 127Measurement scale, 112, 113Missing value, 166Model fit, 197Mortality, 89, 92, 93Multicollinearity, 203, 204Multi item scales, 121, 127, 134Multiple choice questions, 151, 167Multiple regressions, 195, 197, 202
NNominal, 112Non response error, 64, 76, 119
OObservation techniques, 18One way frequency tabulation, 173Open ended interviews, 47, 49Optical scanning, 172Ordinal, 113, 114
PPanels, 43, 46, 62, 70Panel surveys, 40, 43, 61, 70Physical trace measure, 80Pictorial scale, 132Population specific error, 75Post test, 92, 94, 95, 98Predictive ability, 200
280 Index
Pre test, 94Principal component analysis, 199, 224, 225,
226Prioritization, 5Profile analysis, 139Projective technique, 54, 57
QQuasi experimental design, 41
RRandomized block design, 98Random sampling, 71, 73Ranking questions, 149, 150Ratio, 114, 171, 200Reciprocal, 82Regression analysis, 82, 195, 197Relevance, 40, 79, 114, 119Reliability, 57, 60, 72, 114, 115, 119Research design, 13, 16, 19–22, 27, 74, 82, 87,
113, 118Research method, 10, 13, 17, 19, 22, 47, 58Research objectives, 15, 52, 61, 176Research report, 11, 20, 21, 37Respondent error, 74, 76, 119Response bias, 46, 60, 77, 119, 120Role of business research, 3
SSample frame error, 75Sample selection error, 74Sampling precision, 71Sampling procedure, 13, 19, 22, 66, 71, 74Scale categories, 141Scales, 107, 109, 111Scree plot, 217, 218, 224Secondary data, 11, 15, 18, 33, 38, 39Selection bias, 88, 93Self administered interviews, 69Semantic differential scale, 135–137, 139, 140Semi-structured interviews, 48, 51Sensitivity, 81, 114, 118Shared surveys, 41
Shared vocabulary, 153, 154, 159Simple cross tabulation, 174Situational errors, 120Social desirable bias, 78Sociometry, 57Staple scale, 136Static group design, 93Statistical design, 97Statistical regression, 88, 89, 93, 102Steps in research process, 13Surveys, 10, 17, 33, 40, 46, 49, 58, 61, 64, 66,
77, 82Symmetrical, 82Systematic error, 74, 86
TTabulation, 68, 121, 173, 174, 180Target respondents, 143, 144, 158Telephonic interviews, 40, 41, 66Testing, 4, 69, 72, 88, 94, 98, 115, 167Test of attitude scale, 137Test of homogeneity, 203Test of linearity, 202Test retest reliability, 115Thurstone scale, 139Time constraint, 64Time series design, 96True experimental design, 91, 93, 96, 97Types of attitude scale, 127, 128Types of scales, 128, 132
UUnbalanced scale, 140Unconscious misrepresentation, 77Unforced choice, 141Unrotated factor solution, 217–219Unsatisfactory response, 166Unstructured interviews, 48
VValidating, 163, 180Validity, 16, 72, 86, 87, 89, 90, 114, 117, 119Voice recognition, 172
Index 281
Recommended


