
INTRODUCTION
In this report a data set regarding usage of different types of equipments from each of the six
main areas (Gampaha, Divulapitiya, Jaela, Kelaniya, Negombo, Veyangoda) of C.E.B. in
Western Province North is analyzed. It is mainly focused on highly technological and expensive
items. Non-scientific equipments such as posts are removed from consideration therefore.
In this project the usage of equipments under each area from year 2011 to 2015 will be mainly
analyzed. Various types of statistical techniques and mainly the statistical package SPSS will be
used for this purpose. Analysis will be done based on year, store, equipment category,
equipment, etc. Then finally demand for each type of equipment will be predicted using
statistical techniques for coming years
Objectives of this study can be list down as follows;
To find usage of equipments based on year.
To identify patterns of usage.
To analyze usage of equipments based on both year and area simultaneously.
To find variations in unit prices of equipments based on year.
Predict the demand for equipments (demand prediction) for the future.

METHODOLOGY
The following statistical techniques, graphs, charts have been used to analyze and interpret the
given data set.
Charts
Charts illustrate the important facts more clearly than tables.
Bar charts
The bar charts make comparisons based on parallel bars whose lengths are proportional to the
values represented.
Simple bar chart
A simple bar chart is a chart consisting of one or more bars, in which the height of each bar
indicates the magnitude (frequency) of the corresponding data item. Further, simple bar
chart consists of a grid and some vertical or horizontal columns (bars) where
each column represents quantitative data of a given scenario.

Multiple bar charts
A multiple bar chart is a bar chart where two or more separate bars are used to present divisions
of data. A clustered bar chart consists of a grid and some vertical or horizontal columns (bars)
that are arranged in groups, or clusters. Each bar represents quantitative data. The bars of each
data series are always in the same position in each cluster throughout the chart.
Mean
The mean is the average of the numbers. It is easy to calculate: add up all the numbers, then
divide by how many numbers there are. In other words it is the sum divided by the count.
Median
To find the Median, place the numbers given in value order and find the middle number.
Example: find the Median of {12, 13, 11, 16, 15, 19, and 26}. The middle number is 15, so
the median is 15. (If there are two middle numbers, average them.)
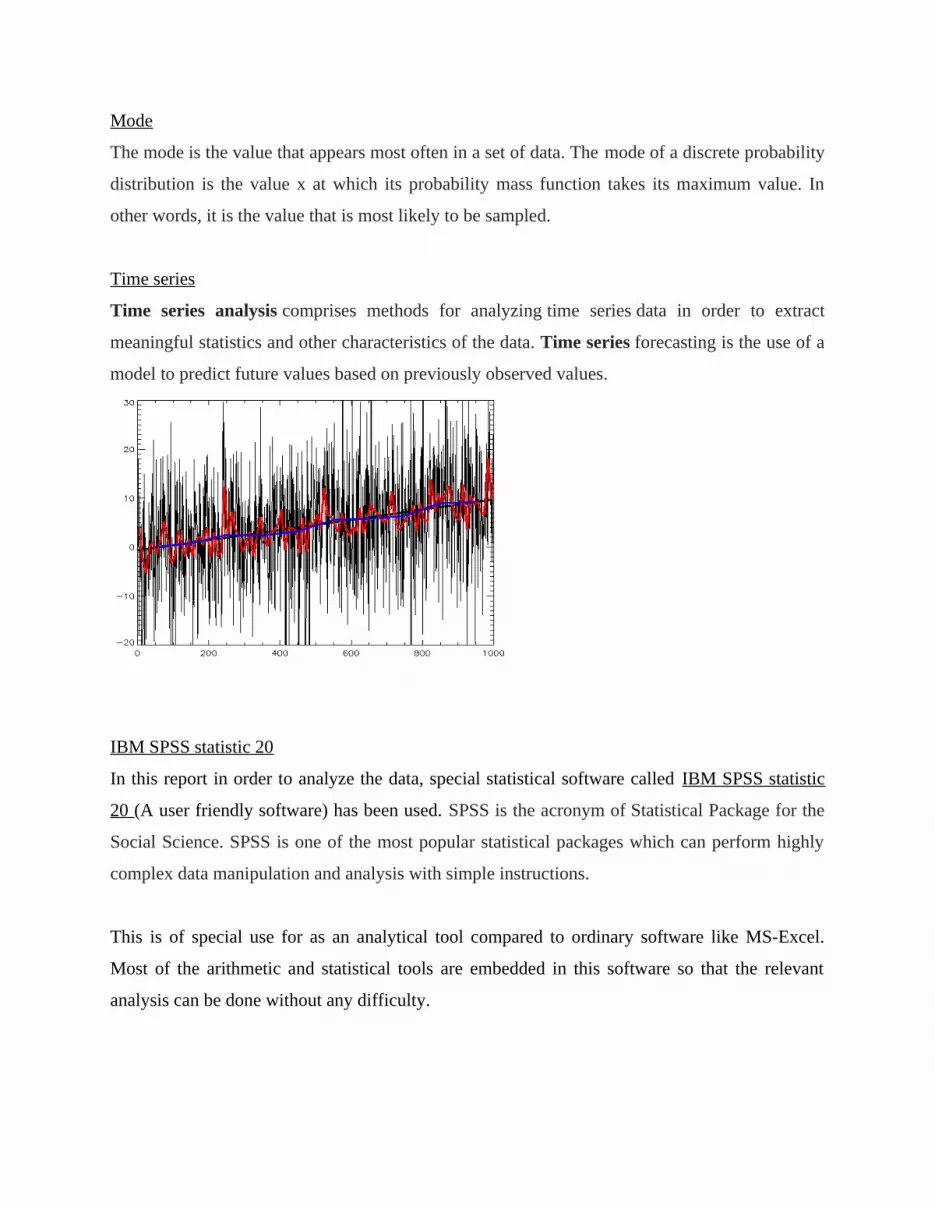
Mode
The mode is the value that appears most often in a set of data. The mode of a discrete probability
distribution is the value x at which its probability mass function takes its maximum value. In
other words, it is the value that is most likely to be sampled.
Time series
Time series analysis comprises methods for analyzing time series data in order to extract
meaningful statistics and other characteristics of the data. Time series forecasting is the use of a
model to predict future values based on previously observed values.
IBM SPSS statistic 20
In this report in order to analyze the data, special statistical software called IBM SPSS statistic
20 (A user friendly software) has been used. SPSS is the acronym of Statistical Package for the
Social Science. SPSS is one of the most popular statistical packages which can perform highly
complex data manipulation and analysis with simple instructions.
This is of special use for as an analytical tool compared to ordinary software like MS-Excel.
Most of the arithmetic and statistical tools are embedded in this software so that the relevant
analysis can be done without any difficulty.

ANALYSIS AND INTERPRETATIONAnalysis of usage of equipments
Mostly used material is B0210.
According to the figure 1, it can be
observed that highest usage in each area
has occurred in 2012. Each area shows a
decreasing trend of using this material.
Another heavily used material is
C0110and this also shows a decreasing
trend in usage after year 2012 but during
2015 usage has again increased violating
the trend.
Figure 1
Figure 2

By observing this Figure 3, it can be
seen that there is a sudden increase
showed in 2015. This is heavily
evident in Divulapitiya area, while
the Kelaniya area has not used that
material at all in 2015.
Figure 4 shows that usage of this
material H0708 shows the highest
usage in year 2014 in all areas except
for Negombo, where the usage is
zero.
Figure 3
Figure 4

According to this figure 5, it can be
observed that material B0810 shows
the highest usage in year 2015 in all
the areas.
K0110 is another material which is heavily used by C.E.B. There isn’t any trend in usage of this material.
Figure 6
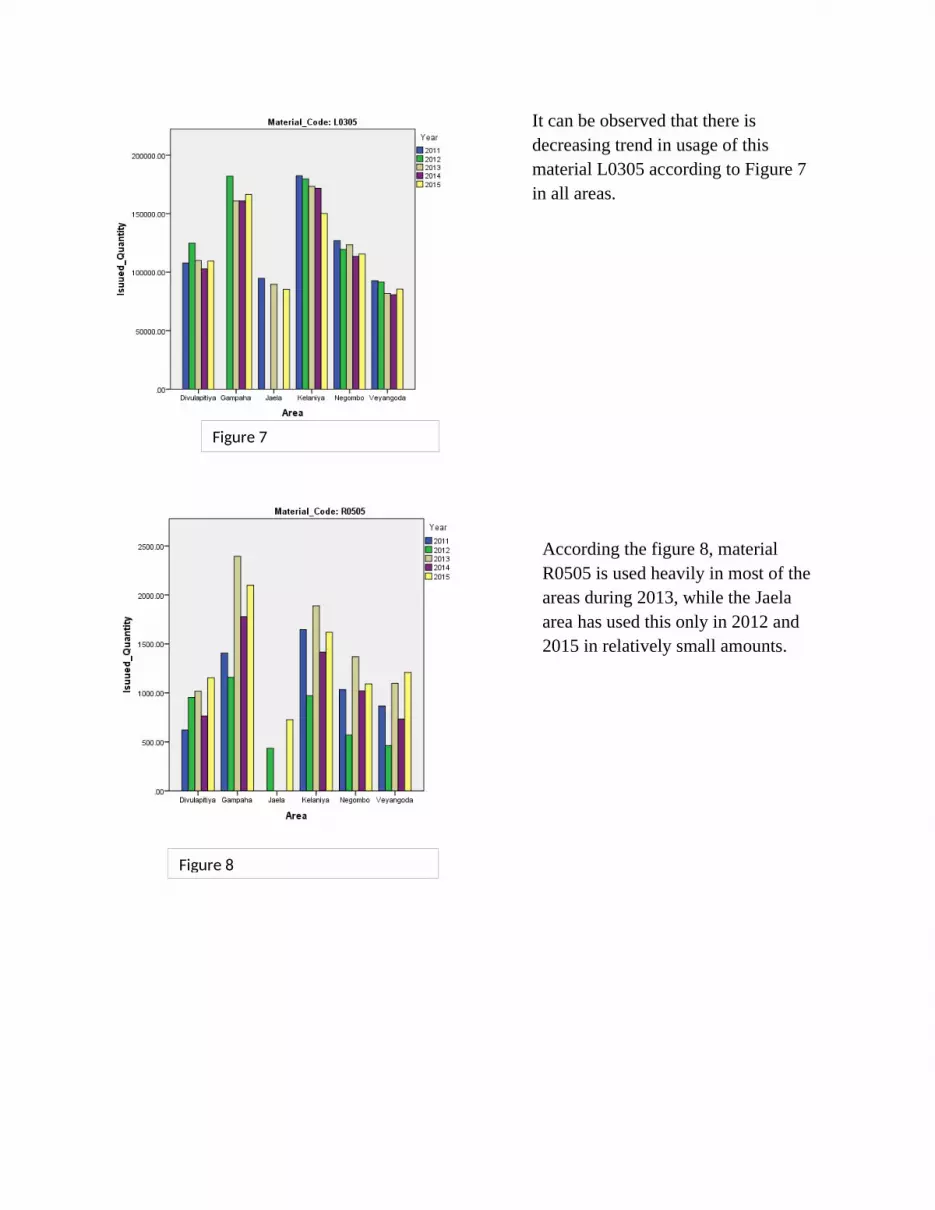
It can be observed that there is decreasing trend in usage of this material L0305 according to Figure 7 in all areas.
According the figure 8, material R0505 is used heavily in most of the areas during 2013, while the Jaela area has used this only in 2012 and 2015 in relatively small amounts.
Figure 7
Figure 8

Figure 9 gives a clear picture of the usage of material R0610. Even though this material is heavily used in 2011-2012, then usage has steeply dropped.
Figure 9A gives a clear picture of the
material H0705. It can be observed that
this material was heavily used in 2011
and then it was not used. Divulapitiya
area has used it for 2 more years and
currently it is not used in any area.
Figure 9
Figure 9A

This figure shows that K0115 is currently only used in divulapitiya area and other
areas have not used it after 2012.
K0205 is a relatively expensive material, which is currently only used in Kelaniya area in very less quantity. This was heavily used in 2011 in Gampaha.
Figure 9B
Figure 9C

This similar decreasing trend is shown by K0207 and L0310 as usages of those materials has
decreased throughout the years in all areas. This can be observed by analyzing Figure 9D and
Figure 9E.
Figure 9D
Figure 9E

Transformer is highly expensive and sophisticated equipment. F0245, F0250, F0270, F0280,
F0285, F0530, F0535, F0540, F0555, F0565 are used as material codes of transformers. By
analyzing figures generated through SPSS, it can be observed that different types are used in
different areas. In JaEla F0245, F0555 and F0250 are only used. In Negombo F0270, F0280,
F0285, F0530, F0565 are used. For areas Gampaha and Kelaniya F0535, F0540, F0555 are used
in common. F0555 is used in many areas such as Gampaha, JaEla, Kelaniya, Veyangoda. F9908
and F99082 are Transformer oil and it is only issued from Gampaha stores. This is clearly shown
in Table A and it can be clearly observed that Divulapitiya stores is not issuing transformers, this
area might be getting transformers from a different stores when they need one. Figure 10 show
the details about the transformer F0555.
Trans#
Area
F
02
45
F
02
50
F
02
70
F
02
80
F
02
85
F
05
30
F
05
35
F
05
40
F
05
55
F
05
65
F
99
08
(oil)
F
99
082
(oil)
Divulaptiya
Gampaha 1 1 1 1 1
JaEla 1 1 1
Kelaniya 1 1 1
Negombo 1 1 1 1 1
Veyangoda 1
Figure 10
Table A

Analysis on unit price over years
By observing the graphs generated through SPSS, it can be said that the unit price of each
material have not changed throughout the last 5 years. Figure 11 here shows it clearly and in a
similar way other materials also can be shown.
Consumer analysis based on area
Area
Year
Kelaniya Negombo Gampaha Veyangoda JaEla Divulapitiy
a
Total
2011 108561 88748 101247 83624 83514 59304 524998
2012 112444 91818 104629 86628 85546 61430 542495
2013 115577 94309 107167 88709 87254 62832 555848
2014 119257 97205 109561 90995 89718 64491 571227
2015 121919 99753 112951 93361 91933 66426 586343
Figure 11

Table 1 shows the details about number of consumers in each area of Western Province North. It
can be observed that there is a approximate increase of 1500 each year in the total value, which
is influenced by consumer increases in different areas. It can be also observed that Kelaniya is
the area with the highest number of consumers and Divulapitiya is the smallest. Gampaha is the
second largest and Negombo, Veyangoda, JaEla are closely related in size.
Material usage predictions for the future
Using the SPSS software, a time series model is fit for each of the heavily used materials and
forecasted the material usage for the future.
Figure 12 shows the observed values of B0210 in Divulapitiya area and using a time series
model it is forecasted for the future. This is shown in Figure 13. Here the predicted value is
7544.83 (nearly 7545) for future years. Confidence interval is widening year by year, which says
that the predicted value might be changed within that region and that region is getting broader.
So this prediction will only be valid when the confidence interval is smaller and closer to the
Table 1
Figure 12

predicted value, simply only for the near future. Table 2 shows the values of the prediction and
their confidence intervals.
Same thing is shown for Gampaha area in Figure 14 and Table 3. Predicted value for demand of B0210 in Gampaha area will be 11675.69 (approximately 11676) for next few years.
Figure 13
Table 2

Forecast
Model 2016 2017 2018
Isuued_Quantity-Model_1
Forecast 11675.69 11675.69 11675.69
UCL 12958.76 13265.26 13521.55
LCL 10392.63 10086.13 9829.84
.
In the same manner future usage of B0210 is predicted for each area, which is shown in table 4.
Area Predicted demand for future years (per year)Divulapitiya 7545Gampaha 11676Kelaniya 12323JaEla 8743Negombo 10152Veyangoda 6026
Figure 14
Table 3
Table 4

Then few other heavily used materials and some expensive materials are also analyzed using time series in order to predict the future usages. Table 5, Table 7, Table 9, Table 11 shows those predictions.
Material code Area Predicted demand for future (per year)B0810 Divulapitiya 2517
Gampaha 4126JaEla 1223Kelaniya 1555Negombo 2295Veyangoda 1272
Below mentioned Table 6 and Figure 15 further describes the prediction for the demand of B0810 in JaEla area.
Forecast
Model 2016 2017 2018
Isuued_Quantity-Model_1
Forecast 1222.99 1222.99 1222.99
UCL 1579.71 1727.46 1840.83
LCL 866.27 718.52 605.15
Table 5
Table 6
Figure 15

Material code Area Predicted demand for future (per year)C0110 Divulapitiya 7337
Gampaha 11509JaEla 8663Kelaniya 12227Negombo 10164Veyangoda 5649
Material C0110’s future demand in the Negombo area is further described from the Table 8 and Figure 16, where it shows the plots of observed values, forecasted values and relevant confidence intervals.
Forecast
Model 2016 2017 2018
Isuued_Quantity-Model_1
Forecast 10164.11 10164.11 10164.11
UCL 12370.96 12400.20 12429.06
LCL 7957.25 7928.01 7899.15
D0110 is a relatively expensive and a heavily used material. Future predictions based on each area for this equipment is shown in table 9.
Table 7
Table 8
Figure 16

Material code Area Predicted demand for future (per year)D0110 Divulapitiya 5504
Gampaha 9219 (For 2016)JaEla 1578Kelaniya 2689Negombo 4218Veyangoda 3999 (For 2016)
In 2015 usage of D0110 in Gampaha area is zero. Forecasts show that usage will be 9219 in 2016, zero in 2017 and 9219 in 2018. This fact is further explained by figure 17 and table 10.
Forecast
Model 2016 2017 2018
Isuued_Quantity-Model_1
Forecast 9219.81 .02 9219.79
UCL 16494.77 10288.35 21820.36
LCL 1944.86 -10288.31 -3380.77
Usage in Veyangoda area for D0110 shows an uneven flow in forecasts, which can be observed through Figure 18.
Table 9
Table 10
Figure 17

Figure 18

E0112 is a material, which is expensive even though it is used in fewer quantities. Table 11 provides the details about future predictions of this material.
Material code Area Predicted demand for future (per year)E0112 Divulapitiya 31
Gampaha 22JaEla 48Kelaniya 11Negombo 41Veyangoda 9
By using Figure 19, predictions of Negombo area can be further explained. It can be observed that number of E0112 used in this region vary from year to year and does not show any trend.
Transformer is the most expensive equipment used by C.E.B. and forecasting the usage of it will be very useful for budgeting and other planning procedures. As mentioned above in Table A, different types of transformers are used in different areas. Forecasting is done considering the transformer type and without considering the area as the usage quantity is very small. Table 12 shows the forecasts for each type of transformer for the next 5 years.
Table 11
Figure 19

Year
Trans#
2016 2017 2018 2019 2020
F0245 0 0 0 0 0
F0250 0 0 0 0 0
F0270 0 0 0 0 0
F0280 0 0 0 0 0
F0285 0 0 0 0 0
F0530 0 0 0 0 0
F0535 0 0 0 0 0
F0540 0 0 0 0 0
F0555 1 1 1 0 0
F0565 1 1 1 0 0
When the table 13 and Figure 20 are analyzed, it can be observed that the predicted value is 0.59, which is closer to 1. So it can be said that one F0555 transformer might be needed in coming years. Similar things can be said with regard to F0565 and it can be observed through Figure 21.
Forecast
Model 2016 2017 2018 2019 2020
Isuued_Quantity-Model_1
Forecast .59 .59 .59 .59 .59
UCL 4.53 4.57 4.61 4.65 4.70
LCL -3.35 -3.39 -3.43 -3.48 -3.52
Table 13
Table 12
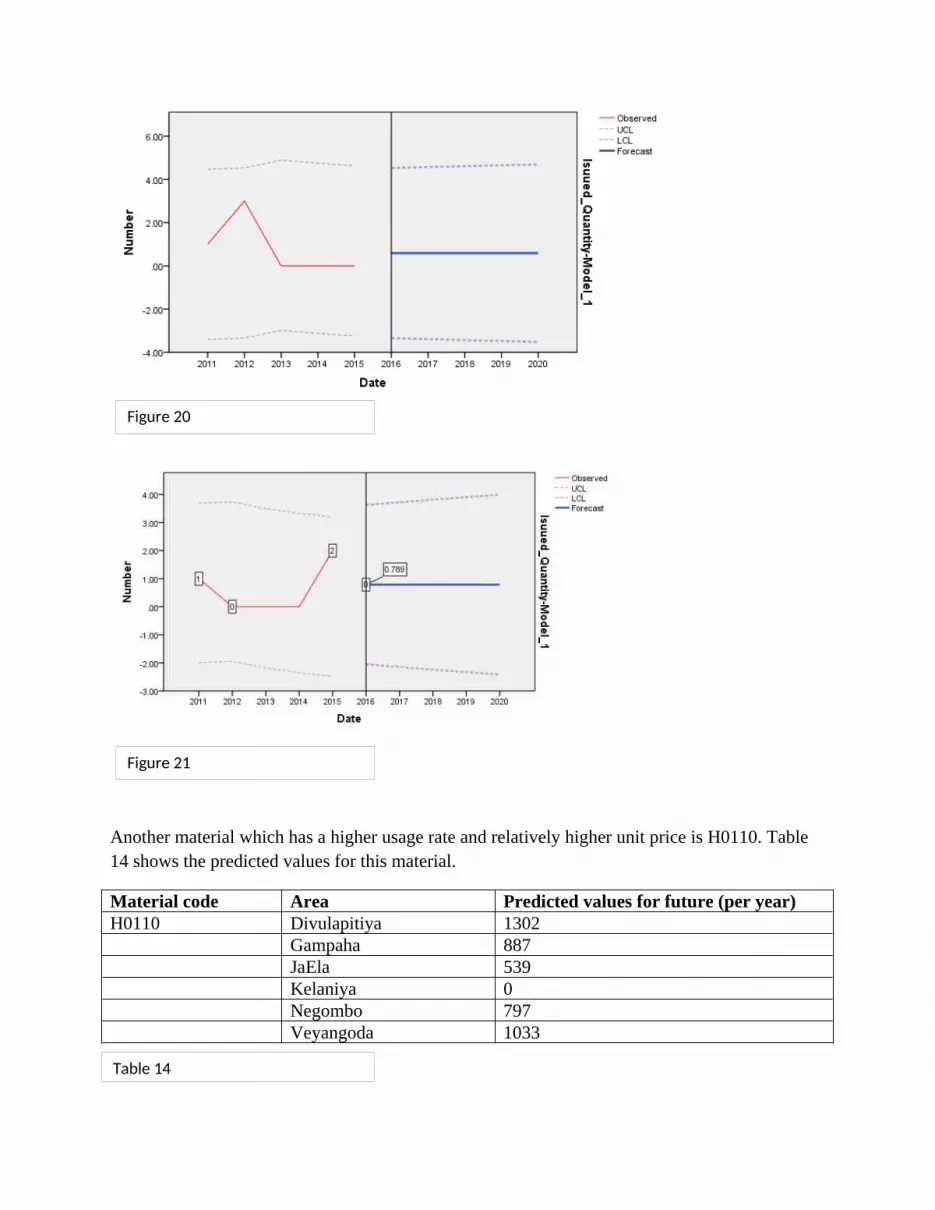
Another material which has a higher usage rate and relatively higher unit price is H0110. Table 14 shows the predicted values for this material.
Material code Area Predicted values for future (per year)H0110 Divulapitiya 1302
Gampaha 887JaEla 539Kelaniya 0Negombo 797Veyangoda 1033
Figure 20
Figure 21
Table 14

When analyzing H0110 usage in Kelaniya area, the forecasted value is zero. The observed values show a decreasing trend as well. These facts can be observed through Figure 22.
Forecasted values based on area for few more heavily used or relatively expensive materials are briefed in the Table 15.
Material code Area Predicted value for future (per year)H0421 Divulapitiya 51(expensive) Gampaha 37
JaEla 58Kelaniya 124Negombo 46 (for 2017) (Refer figure 23)Veyangoda 19
H0708 Divulapitiya 3059(Higher usage) Gampaha 5867
JaEla 4587Kelaniya 4295Negombo 3189Veyangoda 2396
K0110 Divulapitiya 4077(Expensive and Gampaha 5224Higher usage) JaEla 5017
Kelaniya 6651Negombo 4346Veyangoda 2538
Figure 22
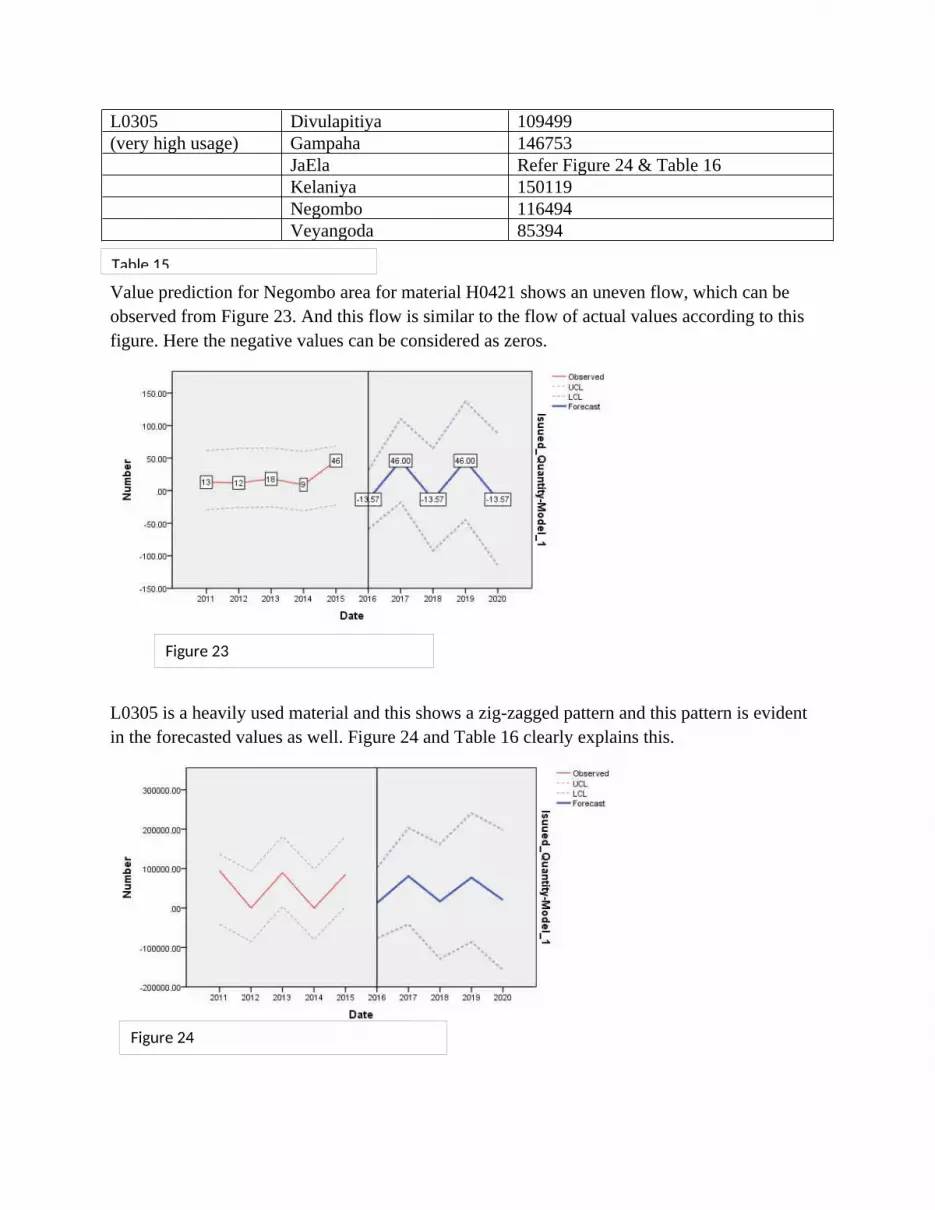
L0305 Divulapitiya 109499(very high usage) Gampaha 146753
JaEla Refer Figure 24 & Table 16Kelaniya 150119Negombo 116494Veyangoda 85394
Value prediction for Negombo area for material H0421 shows an uneven flow, which can be observed from Figure 23. And this flow is similar to the flow of actual values according to this figure. Here the negative values can be considered as zeros.
L0305 is a heavily used material and this shows a zig-zagged pattern and this pattern is evident in the forecasted values as well. Figure 24 and Table 16 clearly explains this.
Figure 23
Figure 24
Table 15

Forecast
Model 2016 2017 2018 2019 2020
Isuued_Quantity-Model_1
Forecast 12914.26 80970.89 16872.44 77242.92 20383.59
UCL 101906.40 203219.75 162394.11 240658.13 198170.50
LCL -76077.89 -41277.96 -128649.23 -86172.28 -157403.32
Finally future predictions are generated for some materials without considering the area as the usage levels are low and the unit prices are high using time series model in SPSS and briefed in Table 17. These predictions are based on total usage for all the areas.
Material code Total predicted usage for all areas for the future (per year)K0207 12K1233 1011L0825 14710T0196 6 (for 2017) Refer Figure 25Z0302_RX 12
Figure 25 shows the fluctuations of usage levels of the material T0196. Forecasts also shows a zig-zagged pattern and negative values should be considered as zeroes.
Table 16
Table 17
Figure 25

GENERAL DISCUSSION (POINTS)Table 1 gives the details about number of consumers. Use it when describing the initial bar charts (usage of equipments)
Unit prices are not changing. CEB might have an agreement with some company to maintain a fixed price.
Divulapitiya small stores .less capacity. Cant store transformers.
Predictions:
Used time series models
Not enough data to arrive at a proper value (only mention if it is ok/ ask from someone)
Values are reliable to some extent.
Environmental factors, natural factors are not considered. But these equipments’ life-span is heavily dependent upon those factors.
Justify the transformer table values (0.59 and 0.79 is closer to one)
Mention about the confidence intervals.
Figure22- this material might have removed from Kelaniya
Recommended


