
Chronic and intensive bottom trawling impairsdeep-sea biodiversity and ecosystem functioningAntonio Pusceddua,1, Silvia Bianchellia, Jacobo Martínb,c, Pere Puigb, Albert Palanquesb, Pere Masquéd,and Roberto Danovaroa,e
aDepartment of Life and Environmental Sciences, Polytechnic University of Marche, 60131 Ancona, Italy; bDepartment of Marine Geosciences, Institut deCiències del Mar, Consejo Superior de Investigaciones Científicas, 08003 Barcelona, Spain; cCentro Austral de Investigaciones Científicas, 9410 Ushuaia,Argentina; dDepartament de Física and Institut de Ciència i Tecnologia Ambientals, Universitat Autònoma de Barcelona, 08193 Bellaterra, Spain; andeStazione Zoologica Anton Dohrn, Villa Comunale, 80121 Naples, Italy
Edited by David M. Karl, University of Hawaii, Honolulu, HI, and approved April 17, 2014 (received for review March 26, 2014)
Bottom trawling has many impacts on marine ecosystems, including
seafood stock impoverishment, benthos mortality, and sediment
resuspension. Historical records of this fishing practice date back
to the mid-1300s. Trawling became a widespread practice in the
late 19th century, and it is now progressively expanding to greater
depths, with the concerns about its sustainability that emerged
during the first half of the 20th century now increasing. We show
here that compared with untrawled areas, chronically trawled
sediments along the continental slope of the north-western Med-
iterranean Sea are characterized by significant decreases in organic
matter content (up to 52%), slower organic carbon turnover (ca.
37%), and reduced meiofauna abundance (80%), biodiversity
(50%), and nematode species richness (25%). We estimate that
the organic carbon removed daily by trawling in the region under
scrutiny represents as much as 60–100% of the input flux. We
anticipate that such an impact is causing the degradation of deep-
sea sedimentary habitats and an infaunal depauperation. With
deep-sea trawling currently conducted along most continental mar-
gins, we conclude that trawling represents a major threat to the
deep seafloor ecosystem at the global scale.
Trawling represents one of the most common fishing practicesalong the coastal oceans of the world. However, it can have
a plethora of impacts on the sea bottom, including stock impov-erishment, alterations to the sea-bottom morphology, sedimentresuspension, and increased bottom-water turbidity, epibenthosmortality, altered nutrient cycles, and alteration of the benthicbiodiversity (1).Historical records of this fishing practice date back to the mid-
1300s, and it became widely practiced with the industrializationof fisheries in the late 19th century (2–4). Because shallow coastalwater resources have steeply declined in the last 50 y (5, 6), fish-eries are expanding offshore and trawling is being carried out atprogressively increasing depths (7, 8).In contrast to what was believed up to a few decades ago,
deep-sea habitats (>200 m in depth) are rich in biodiversity, andthey host many endemic and commercially important species (9,10). Compared with shallow-water areas, the impact of trawlingon deep-sea benthic ecosystems is deemed more severe and long-lasting, because of their lower resilience and higher vulnerability(10). However, our knowledge of the impact of trawling on deep-sea ecosystems has remained limited and has mainly focused onhard-bottom systems, such as seamounts and cold-water coralreefs (11, 12).Sedimentary environments (i.e., the soft sea bottom) represent
the greatest area of the deep-sea floor and host a vast faunabiodiversity (10). In these environments, the metazoan fauna(i.e., multicellular organisms) include almost all of the 35 mod-ern animal Phyla. The smaller components of this fauna, themeiofauna, are characterized by relatively short life cycles, highturnover rates, and a lack of larval dispersion. For all oceanicseafloors, nematodes account for >90% of meiofauna abun-dance in the deep sea (13) and are characterized by very highspecies richness and recognizable feeding types and life strate-gies (14, 15). In this sense, nematodes have been recently used
as a model to demonstrate that any loss in deep-sea fauna bio-diversity is associated with an exponential decrease in ecosystemfunctioning (16).Recent investigations carried out in the north-western Mediter-
ranean Sea have revealed that the continuous stirring, mixing, andresuspension of surface sediments by intensive and chronic trawlingactivities has caused changes to the present-day sediment dynamicsand has permanently smoothed the seafloor morphology of thecontinental slope over large spatial scales (17–19). In this region,deep-sea trawled grounds are subjected to levels of sediment dis-turbance whose effects are larger than the changes in sedimentproperties associated with seasonal variability (20). Smoothedtrawling grounds are also exposed to a reduced habitat heteroge-neity. Because high habitat heterogeneity is crucial to preserve highbiodiversity levels (21, 22), trawling activities might represent amajor threat to the integrity of deep-sea ecosystems (12, 18).
Results
To determine the chronic impact of trawling on deep-sea sedi-mentary environments, we investigated several properties of thebenthic ecosystems within La Fonera submarine canyon (north-western Mediterranean Sea; Fig. 1). In this region, trawling ac-tivities are conducted in the waters from 200 to 800 m in depth,although they are more intensive between 400 and 750 m (18, 19,23) (Methods). Trawling activities in this region take place alongthe entire northern flank of the canyon, whereas the southernflank is trawled only partially, because of the rougher terrainconditions in the easternmost part (20) (Fig. 1). This allowed us to
Significance
Deep-sea ecosystem processes play a key role in global func-
tioning of the planet. These functions are largely dependent
upon deep-sea biodiversity. Industrial fisheries, after the de-
pletion of fish stocks and destruction of the marine habitats on
continental shelves, are now rapidly moving deeper into the
ocean interior. We show here that bottom trawling along
continental slopes has a major impact on deep-sea sedimentary
ecosystems, causing their degradation and infaunal depaup-
eration. Deep-sea fisheries, indeed, cause the collapse of benthic
biodiversity and ecosystem functions, with potential consequences
on the biogeochemical cycles. These findings support the claim of
immediate actions for a sustainable management of fisheries in
deep-sea environments.
Author contributions: A. Pusceddu, S.B., J.M., P.P., A. Palanques, and R.D. designed re-
search; A. Pusceddu, S.B., J.M., P.P., A. Palanques, P.M., and R.D. performed research;
A. Pusceddu, S.B., J.M., P.P., A. Palanques, P.M., and R.D. analyzed data; and A. Pusceddu,
S.B., J.M., P.P., A. Palanques, P.M., and R.D. wrote the paper.
The authors declare no conflict of interest.
This article is a PNAS Direct Submission.
Freely available online through the PNAS open access option.
1To whom correspondence should be addressed. E-mail: [email protected].
This article contains supporting information online at www.pnas.org/lookup/suppl/doi:10.
1073/pnas.1405454111/-/DCSupplemental.
www.pnas.org/cgi/doi/10.1073/pnas.1405454111 PNAS Early Edition | 1 of 6
ENVIRONMENTAL
SCIENCES

use the sediments from the untrawled southern canyon flank asa reference (compared with similar trawled depths), as well asfrom other untrawled canyon regions, to determine the impact ofchronic trawling on the quantity, biochemical composition, andrate of decomposition of sedimentary organic matter; on themeiofauna abundance, biomass, and richness of taxa; and on thebiodiversity of the nematodes (Table S1).
Alteration of the Deep-Sea Sediment Column. We analyzed severalphysical/chemical properties of the sediment column at ∼500-mwater depth, at both the trawled and untrawled sites (Fig. S1). Atthe untrawled sites, the sediment column has a topmost unit ofunconsolidated material with dry bulk densities as low as 0.6g·cm−3 (Fig. S1A). There is progressive compaction with depth,with dry bulk density reaching values of 0.7–1.0 g·cm−3 towardthe bottom of these sediment cores. Such vertical pattern in drybulk density along the sediment column from the untrawledground indicates that these sediments continuously receive andaccumulate soft material from the water column. In contrast, thesurface sediments from the trawled sites are much denser andreach consistently higher values near the surface: this indicatesthe absence of recently deposited unconsolidated sediment at-tributable to repeated trawling-induced resuspension. This largedifference in the compaction of sediments between the two grounds,which reflects differences in the sedimentation patterns, is alsoconsistent with the higher surface 210Pb concentrations and deeperexcess 210Pb horizons in the reference (untrawled) sites than in thetrawled sites (Fig. S1B). Moreover, the total organic carbon con-tent in the trawled sediments (0.34–0.89% dry weight) were lower(by 28–36%) than in the untrawled sediments (0.68–1.02%),consistently along the upper 10 cm of the sediment column(Fig. S1C).
Quantity and Composition of Sedimentary Organic Matter. Com-pared with untrawled areas at the same depth and in deeperareas (800 m), the trawled sediments at 500 m in depth along theflanks of La Fonera Canyon are characterized by a significant5–52% decrease in labile organic matter content (mean decreasein biopolymeric C content: 30% vs. 500 m, 22% vs. 800 m; Fig.2A). Major alterations to the biochemical composition of thetrawled sediments at 500 m in depth are also observed (Table S2and Fig. 2B). The same applies to the primary organic matter
deposited on the surface of the sea floor (i.e., the input of sen-escent and dead algae from the photic zone, measured here asthe phytopigment concentrations in the sediments), which is, onaverage, lower by 74% vs. untrawled sediments at 500 m, 61% vs.800 m, and 38% vs. 2,000 m (Table S2 and Fig. 2C). The con-centrations of phytopigment in the trawled sediments at 500 m indepth in La Fonera Canyon are also lower than those from manyother continental margins investigated over large spatial andtemporal scales (Table S3).
Impacts on Ecosystem Functions and Biodiversity. The trawling-induced continuous stirring of the upper part of deep-sea sedi-ments in the fishing grounds leads to a decrease in the organic Cturnover rates. The organic C turnover in the trawled sedimentsat 500 m in depth (mean, 0.078 d−1) is 37% slower, on average,than in the untrawled sediments at the same depth (mean, 0.124d−1; P < 0.05), and even slower than in the untrawled sedimentsat ca. 2,000 m (by 59%; mean, 0.191 d−1; P < 0.001) (Table S2and Fig. S2). Trawling of the deep-sea soft bottom also affectsthe meiofauna abundance, biomass, and biodiversity in the sur-face sediments. Here, compared with the untrawled areas, themeiofauna abundance in trawled areas was significantly reduced
Sant Sebastiàfishing ground
Rostollfishing ground
Llevantfishing ground
100
500
1000
1500
2000
Study area
3º 10' '03º3'02º3 3º 40'
42º 00'
41º 50'
41º 40'
0 5 10
km
Ca-500
Ca-800
Ca-2000
CNF-500
CSF-500
NF-500
NF-800
SF-800
SF-500
Fig. 1. Bathymetric map of La Fonera Canyon. The sampling stations in the
trawled and untrawled areas are shown as red and blue dots, respectively.
The vessel monitoring system positions of large (>400 horsepower) trawlers
for the years 2007 to 2010 are shown by the small gray dots. (Inset) Location
of the study area in the north-western Mediterranean Sea.
0.0
0.5
1.0
1.5
2.0
2.5
500 m 500 m 800 m 2000 m
Trawled Untrawled
Se
dim
en
tary
org
an
ic m
ae
r co
nte
nt
(mg
bio
po
lym
eri
c C
g-1
)
*ns
ns
A
Trawled 500 m
Untrawled 500 m
Untrawled 800 m
Untrawled 2000 m
0.0
0.2
0.0
CA
P2
CAP1
-0.2
-0.2-0.4 0.40.2
B
0.0
5.0
10.0
15.0
20.0
25.0
500 m 500 m 2000 m
Trawled
800 m
Untrawled
Ph
yto
pig
me
nt
con
ten
t
(µg
g-1
)
***
***
**
C
Fig. 2. Sedimentary organic matter in trawled and untrawled sediments at
different depths of La Fonera Canyon. (A) Sediment content of biopolymeric C.
(B) Variations in the biochemical composition of the sedimentary organic
matter (biplot after canonical analysis of the principal coordinates). (C) Total
phytopigment concentrations in the top 1 cm of sediment. Error bars in-
dicate SEs among stations at similar depth and level of impact or SDs among
replicates for the data at 2,000 m in depth. *P < 0.05; **P < 0.01; ***P <
0.001; NS, not significant vs. untrawled samples from 500, 800, and 2,000 m.
2 of 6 | www.pnas.org/cgi/doi/10.1073/pnas.1405454111 Pusceddu et al.

by up to >80% [mean decrease: 85% vs. 500 m (P < 0.001); 80%vs. 800 m (P < 0.001); 55% vs. 2,000 m (P < 0.05)], the meio-fauna biomass by >70% [mean decrease: 76% vs. 500 m (P <
0.001); 66% vs. 800 m (P < 0.001); 51% vs. 2,000 m (P < 0.05)],and the meiofaunal taxa richness by >50% [mean decrease: 55%vs. 500 m (P < 0.002); 37% vs. 800 m (P < 0.01); 35% vs. 2,000 m(P < 0.05)] (Table S4 and Fig. 3 A–C). Values of meiofaunalabundance in the trawled grounds of La Fonera Canyon areamong the lowest observed so far along the continental slopeof the Mediterranean Sea (Fig. S3 A and B), and, althoughbeing obtained in the mesotrophic north-western MediterraneanSea, they are similar only to those encountered in the ultra-oligotrophic eastern Mediterranean Sea (Fig. S3C). Moreover,the structures of the meiofauna assemblages in trawled sedi-ments at 500 m in depth do not differ significantly from those inbathyal sediments along the canyon axis at 2,000 m in depth(Table S5 and Fig. 3D).The enhanced trawling-induced sediment erosion is also as-
sociated with reductions in the fauna biodiversity and alterationsto the biological traits of the benthic assemblages (e.g., thenematode life strategies). Compared with the untrawled areas,it is apparent that these trawling activities have significantly re-duced the nematode biodiversity in the trawled sediments by ca.25% [statistic F (Pseudo-F) =12.72; P < 0.01], in terms of theES51 (mean decrease: 25% vs. 500 m; 28% vs. 800 m; 28% vs.2,000 m; Fig. 4A). There are also significant differences in thespecies compositions of the nematode assemblages between thetrawled and untrawled sediments at 500 m in depth and betweentrawled sediments at 500 and 2,000 m in depth (Table S5 andFig. 4B). In addition, the nematode assemblages in the trawledsediments contain a significantly larger proportion of opportu-nistic species (Pseudo-F = 5.099; P < 0.01) than in the untrawledsediments, as indicated by the lower values of nematode maturityindex shown in Fig. 4C (mean decrease: 11% vs. 500 m; 10% vs.800 m; 13% vs. 2,000 m). Trawled sediments appear to be col-onized by meiofauna of higher sizes (individual biomass ca. 60%higher, on average) than those in the untrawled sediments at thesame depth and beyond but of similar size of those encounteredin the bathyal adjacent plain at 2,000 m in depth (Fig. S4).
Discussion
Our study reveals that compared with untrawled areas, trawledsediments in the deep-sea regions are characterized by a lowerorganic C turnover and are significantly depleted in organic
matter content, meiofauna abundance and biodiversity, andnematode species richness and individual biomass. The conti-nental slope of the region under investigation is subjected totrawling activities all over the year, on weekdays at workinghours (18). Signals of a persistent trawling-induced sedimentdisturbance are indeed clearly visualized in the vertical structureof the sediment column over the fishing grounds (Fig. S1). Thus,although we limited our analysis to only one time over the year,we can reliably consider the differences observed betweentrawled and untrawled sites as being representative of the con-solidated impact of chronic and intensive trawling more than ofseasonal variability of ecosystem properties across the in-vestigated region. In this regard, a recent study also providedevidence that changes in the quantity and composition of sedi-mentary organic matter caused by bottom trawling in the regionare larger than those associated with the natural seasonality ofthe investigated variables (20). We also pinpoint that the sea-sonal and interannual changes in the phytopigment contents andmeiofaunal abundance and community composition along thecontinental margins of the north-western Mediterranean Sea closeto the study area are very weak (Table S6).We show that these trawled sediments are generally charac-
terized by a decrease in the fraction of organic matter of algalorigin (i.e., total phytopigments), which is the fraction of sedi-mentary organic matter that is most digestible to heterotrophicconsumption, and, as such, represents the most important foodsource for deep-sea benthic fauna (24–26).The effects of deep-sea trawling extend not only to food
availability for the benthos but also to the key ecosystem functionof C cycling. We thus report here that the potential organic Cturnover in trawled sediments is significantly lower than thatestimated for untrawled sediments. This is consistent with whathas been observed in coastal habitats, where natural (e.g., chronicbioturbation and episodic storms) and anthropogenic factors (e.g.,trawling and dredging) that mechanically disturb the sediment canresult in severe changes in the rates of organic matter degradation(27–29). Therefore, in this deep-sea ecosystem, the persistenttrawling-induced resuspension of large amounts of high-qualitynutritional resources, coupled with a slowdown of the organic Ccycling, indicates that bottom trawling can exacerbate the naturalfood limitation of the deep-sea sediments.Previous studies showed that the sediments that are resus-
pended by trawling along the northern canyon flank tend to flowdown-slope incorporated in bottom-arrested gravity currents
Me
iofa
un
a a
bu
nd
an
ce
(n i
nd
ivid
ua
ls 1
0 c
m-2
)M
eio
fau
na
bio
ma
ss
(µg
C 1
0 c
m-2
)
Ric
hn
ess
of
me
iofa
un
a t
axa
(n t
axa
10
cm
-2)
0
200
400
600
800
1000
1200
1400
1600
500 m 2000 m500 m
Trawled
800 m
Untrawled
***
***
*
A
0
10
20
30
40
50
60
500 m 2000 m500 m
Trawled
800 m
Untrawled
***
***
*
B
0
1
2
3
4
5
6
7
8
9
500 m 2000 m500 m
Trawled
800 m
Untrawled
** *
C
Trawled 500 m
Untrawled 500 m
Untrawled 800 m
Untrawled 2000 m
0.0
0.4
0.0
CA
P2
CAP1
-0.2
-0.2-0.4 0.40.2
D
0.2Fig. 3. Meiofauna in trawled and untrawled sediments
at different depths of La Fonera Canyon. Abundance
(A), biomass (B), and biodiversity (as richness of taxa) (C)
and variations in the composition of the meiofauna
communities (biplot after canonical analysis of the
principal coordinates) (D). Error bars indicate SEs among
stations at similar depth and level of impact or SDs
among replicates for the data at 2,000 m in depth. *P <
0.05; **P < 0.01; ***P < 0.001 vs. untrawled samples
from 500, 800, and 2,000 m.
Pusceddu et al. PNAS Early Edition | 3 of 6
ENVIRONMENTAL
SCIENCES

caused by the excess of density provided by the suspended sedimentload, being channelized through the canyon’s tributary valleys.When these flows reach the main canyon axis, they are redirectedseaward and further down-canyon, without affecting the southerncanyons’ flank, and accumulate the sediment load in the lowercanyon reaches at depths of ≥1,800 m (17–19, 30). Combined withthe concurrent impoverishment of the benthic trophic resources inthe upper slope sediments, this mechanism contributes to explainwhy also the composition of the meiofaunal assemblages in trawledsediments at 500 m in depth tends to resemble those recorded atmuch deeper depths along the canyon axis (i.e., at 2,000 m) (TableS5 and Fig. 3D).The effects of intensive and chronic trawling-induced distur-
bance of sediments along the continental slope studied hereresemble the severe impairment of meiofaunal and nematodeabundance and diversity caused by chronic and intensive (highlyfrequent) bottom trawling in coastal habitats (31, 32) and appearto be as severe as the effects of trawling on hard-bottom sub-strata (12, 33). Moreover, our data pinpoint signs of severe im-pacts due to deep-sea trawling that can be also appreciated interms of the life traits and body size of the nematode assem-blages. Indeed, we report that the nematode assemblages intrawled sediments are characterized by life strategies that are
more opportunistic than those observed in untrawled grounds, aspreviously reported also from shallow-water studies (34). Theappearance and dominance of organisms with opportunistic lifestrategies (i.e., early colonizers) is a typical bioecological re-sponse that is reported for communities that are exposed tofrequent disturbance events (35, 36). This observation, coupledwith the significantly higher mean individual biomass of nemat-odes in trawled grounds (Fig. S4), suggests that the disturbanceexerted by bottom trawling removed preferentially small indi-viduals, more susceptible to be resuspended, while leaving on sitelarger and heavier organisms.Cumulatively, the impacts of trawling on the sediment struc-
ture, the benthic biodiversity, and the most basic of all of thenutritional resources in these deep-sea sedimentary ecosystemsresemble the catastrophic effects caused by man-accelerated soilerosion on land (37, 38) and the general environmental de-terioration of abandoned agriculture fields exposed to high levelsof human impact (39). Thus, ultimately, intensive and chronicbottom trawling is deemed to transform large portions of thedeep continental slope into faunal deserts and highly degradedseascapes.Deep-sea trawling is currently carried out along large sectors
of the oceans, and it appears to have severe consequences ondeep-sea sediment dynamics at a global scale. Using the sameapproach adopted for estimating the volume of sediment dis-placed by trawling in La Fonera Canyon (18), we have estimatedthat the continuous sediment resuspension induced by deep-seatrawling can daily subtract from 60% to 100% of the organic Cflux from the trawled area (Methods). Despite the fact that thesediment composition and texture of surface sediments and themagnitude of the C flux can change considerably among conti-nental margins, our results suggest that this fishing practice mayhave devastating consequences on the biodiversity and ecosystemfunctioning of the deep-sea sedimentary environments across theworld oceans.
MethodsStudy Area. La Fonera (Palamós) submarine canyon is located in the Catalan
margin (north-western Mediterranean), and it is about 40 km long with
a maximum depth of ca. 2,200 m (30). The head of the canyon is forked and
N-to-S oriented, with a deeply incised V shape and a major axis oriented
WNW-to-ESE (Fig. 1). The steep canyon walls are indented by numerous
gullies. The most important river on the coast is the Ter River, which is lo-
cated about 15 km northwest of the canyon head, with an average annual
flow of 10.3 m3·s−1. The hydrography of the area is characterized by a ver-
tical density front (salinity-driven) (30) that is permanently positioned at the
convergence between the shelf and the continental slope and separates the
(superficial) waters of continental origin from the denser open-sea waters.
The general circulation is governed by a baroclinic current along the conti-
nental slope toward the southwest, in geostrophic balance with the density
front (40). The direction of the prevailing currents in the area means that
a substantial part of the along-margin sediment transport bypasses the
canyon head and enters the canyon directly from the northern canyon flank
(41). Data from near-bottom current meter deployments within La Fonera
Canyon showed a closed circulation inside the canyon confinement with low
velocities (<20 cm/s) oriented along the local bathymetry and showing fre-
quent current reversals at inertial frequencies (40, 42). However, those mea-
surements and further monitoring studies revealed that the near-bottom
water turbidity and the sediment dynamics in this submarine canyon is heavily
dominated, both in its magnitude and temporal patterns, by trawling-induced
sediment resuspension at the fishing ground (17–19, 40–42).
The local trawling fleet in this submarine canyon targets the deep-sea
shrimp Aristeus antennatus (Risso, 1816) and operates on a daily basis (with
interruption only during the weekend) and year round, down to ca. 800 m
in depth (18). Otter trawl gears are used, comprising a towed net with
sweeplines (bridles), iron otterboards, and warps. The mouth of the net is
kept open by means of floats and weights and is spread horizontally by
forces exerted on the otterboards, which are oriented obliquely to the
trawl’s forward motion. The two otterboards are heavy (from hundreds of
kilograms to tons) and can imprint furrows in the sediment with the resulting
sediment resuspension. The sweeplines and the footrope also cause sediment
resuspension (41). In La Fonera submarine canyon, there are two main
areas that are routinely visited: the Sant Sebastià fishing ground along the
0
5
10
15
20
25
30
35
500 m 500 m 500 m 500 m 500 m 500 m 500 m 500 m 800 m 800 m 800 m 2000 m
Trawled Untrawled
Ne
ma
tod
e b
iod
ive
rsit
y (
ES
51
)A
0
1
2
3
4
500 m 500 m 500 m 500 m 500 m 500 m 500 m 500 m 800 m 800 m 800 m 2000 m
Trawled Untrawled
Ne
ma
tod
e m
atu
rity
in
de
x)
C
Trawled 500 m
Untrawled 500 m
Untrawled 800 m
Untrawled 2000 m
0.0
0.4
0.0
CA
P2
CAP1
-0.2
-0.4
-0.2-0.4 0.40.2
B
0.2
Fig. 4. Nematode biodiversity in trawled and untrawled sediments at dif-
ferent depths of La Fonera Canyon. The expected number of nematode
species for a theoretical sample of 51 nematode specimens (ES51) (A), var-
iations in the composition of the nematode assemblages (canonical analysis
of the principal coordinates) (B), and maturity index (C). Error bars indicate
SEs among stations at similar depth and level of impact or SDs among rep-
licates for the data at 2,000 m in depth. *P < 0.05; **P < 0.01; ***P < 0.001;
NS, not significant vs. untrawled samples from 500, 800, and 2,000 m.
4 of 6 | www.pnas.org/cgi/doi/10.1073/pnas.1405454111 Pusceddu et al.
northern flank of the canyon and the Rostoll fishing ground along the
southern flank of the canyon (Fig. 1). Studies conducted over the last
decade have shown that the continuous passage of the trawling equip-
ment along the steep canyon flanks has triggered frequent sediment
gravity flow (17). This has transported resuspended sediments downslope
toward the main canyon axis (41, 42), which has affected the sediment
accumulation rates in the lower canyon, at a depth of >1,200 m (30). The
fishing grounds currently visited by trawlers had the same roughness as
the one of the eastern southern flank of the canyon and have been
smoothed over time and after decades of intensive bottom trawling (18).
Sampling Strategy.Our analysis is primarily based on the refutation of the null
hypothesis by which the content, composition, and degradation rates of
organic matter, abundance, biomass, and structure of the meiofauna com-
munity, species richness, and life traits of nematode assemblages do not vary
between trawled and untrawled sediments at 500 m and at greater depths in
La Fonera submarine canyon. After identifying areas subjected to intensive
trawling activities and reference areas (i.e., untrawled areas), sediment
samples were retrieved from a total of 13 stations spread across La Fonera
submarine canyon at depths ranging from 500 to 2,000 m (Table S1). The
criteria we have followed to identify trawled and untrawled sites are based
on the distribution of vessel monitoring system positions of large (>400
horsepower) trawlers operating in the study area over the course of four
years (2007 to 2010) (Fig. 1) (18). Surface sediment samples were collected
using a KC Denmark A/S interface multicorer during an oceanographic
cruise from May 10–14, 2011, on board the R/V García del Cid. At each station,
three Plexiglas cores were retrieved from three independent casts of the
multicorer (total of nine corers per station) and immediately stored at −20 °C
for subsequent analyses of organic matter and meiofauna in the laboratory
(within 1 mo). An additional core was used for analysis of extracellular enzy-
matic activities in the topmost 2 cm of the sediment column at four stations, of
which one was in the trawled area and one at each of the representative
untrawled sampling depths along the major canyon axis (500, 800, 2,000 m)
(Table S1). Separate casts of the multicorer were carried out to retrieve sedi-
ment cores at stations located at 500m in both trawled and untrawled grounds
along the canyon flanks and used for the analysis of 210Pb concentrations,
sediment dry bulk density, and total organic C through the entire cores.
Organic Matter Composition and Turnover. The trophic effects caused by
bottom trawling were assessed through the analysis of the labile (phyto-
pigment) and semilabile (biopolymeric C) fractions of sedimentary organic
matter (43). Chlorophyll-a and phaeopigment were extracted (12 h at 4 °C, in
the dark) from triplicate superficial (0–1 cm) sediment samples (about 1 g),
using 3 mL to 5 mL 90% (vol/vol) acetone as the extractant. These extracts
were analyzed fluorometrically, to estimate chlorophyll-a, and after acidi-
fication with 200 μL of 0.1 N HCl, to estimate the phaeopigments (44). Dif-
ferent methods for assessing chlorophyll-a concentrations in marine
sediments can provide different underestimates and overestimates (45). For
this reason, we summed the chlorophyll-a and phaeopigment concen-
trations (i.e., total phytopigments) (43). Protein, carbohydrate, and lipid
analyses were carried out on the top 1 cm of three independent sediment
cores using photometric protocols (44). Protein, carbohydrate, and lipid
contents were converted to C equivalents using the conversion factors 0.49,
0.40, and 0.75 mg of C per milligram, respectively, and their sum is referred
to as the biopolymeric C (44). The sedimentary contents of the phytopig-
ments and biopolymeric C pools reflect the overall trophic conditions of the
deep-sea sediments (43). For determination of the extracellular enzymatic
activities, 2.5 mL of sediment subsamples was incubated at the in situ tem-
perature (ca. 14 °C) in the dark for 2 h with 2.5 mL of filtered, sterile sea-
water containing 200 μM L-leucine-4-methylcumarinyl-7-amide and 75
μM 4-methylumbelliferyl β-D-glucopyranoside separately for aminopeptidase
and β-glucosidase activities, respectively. After these incubations, the samples
were centrifuged, and the supernatants were analyzed fluorometrically (44).
The protease and glucosidase activities (micromoles of substrate per gram
per hour) were converted into C degradation rates (micrograms of C per
gram per hour), using 72 μg of C per mole of substrate as the conversion
factor (46). The turnovers (per day) of the whole protein and carbohydrate
pools (here referred as biopolymeric C) were calculated as the ratios of the
hourly C degradation rates (once multiplied by 24) and the whole protein and
carbohydrate C contents in the sediment.
Fauna Biodiversity. The sediment samples were sieved through 1,000-μm and
then 20-μm meshes, to retain the smallest organisms. The fraction that
remained on the 20-μm sieve was resuspended and centrifuged three times
with Ludox HS 40 (density, 1.18 g·cm−3) (15). All metazoans were counted
and classified per taxon after staining with Rose Bengal (0.5 g·L−1), under
a stereomicroscope using Delfuss cuvettes. For determination of the meio-
fauna biomass, the individual biomasses of all of the animals belonging to
the different taxa were calculated. The nematode biomass was calculated
from the biovolume (n = 100 per replicate) using Andrassy’s formula [V = L ×
W2× 0.063 × 10−5; body length (L) in microns, width (W) in microns]. For all
of the other taxa, the biovolume was measured for all of the specimens
encountered. The body volumes were derived from measurements of body
length (L) (in millimeters) and width (W) (in millimeters) using the formula
V = L × W2× C; where C is the approximate conversion factor for each
meiofauna taxon (47). To obtain the biomass (micrograms dry weight), the
body volumes were multiplied by an average density (1.13 g·cm−3), which
assumes that the dry weight:wet weight ratio is 20–25%, and the C content
was considered as 40% of the dry weight. For the analysis of nematode
species diversity, 100 specimens (or all of the retrieved nematodes, if the
number of extracted individuals was <100) were randomly picked from
three independent replicates at each sampling station. The nematodes were
mounted on slides (following the formalin–ethanol–glycerol technique, to
prevent dehydration) (48) and identified to the species level. For unknown
species, these were indicated as sp1, sp2, and sp3. Nematode species richness
was estimated as the total number of species identified at each habitat.
Because the species richness is strongly influenced by the number of indi-
viduals identified, to standardize the values of nematode diversity, the
species abundance data were converted into rarefaction diversity indices (49,
50). Because the species richness is also strongly affected by the sample size,
the expected number of species for a theoretical sample of 51 nematode
specimens, the ES51, was calculated (51). Previous studies have shown that
this approach enables the provision of robust data on deep-sea species
richness, and the expected species number is the most commonly used
density-independent index for the comparison of areas with nonstandardized
sample sizes (52). The maturity index was calculated according to the weighted
mean of the individual genus scores: MI = Σνifi, where νi is the c–p (colonizers–
persisters) value of species i (53–55), and fi is the frequency of that species.
Modifications of the Sediment Column. Sediment samples from both the
fishing grounds and the control sites at∼500-mwater depth were subsampled
(every centimeter down to 10 cm in depth) and freeze-dried, to obtain the
vertical profiles of the dry bulk density (ratio of dry weight to volume of the
wet sediment slice), as a proxy for sediment compaction. To estimate net
accumulation of recently deposited sediments, the activities of the radionu-
clide 210Pb (half-life, 22.3 y) were determined by counting the α-emission of
its radioactive product 210Po (56). To obtain the total organic C sedimentary
contents (as percentages of total dry weight), aliquots of dried sediment
from the top 10 cm of selected sediment were first decalcified by fuming with
concentrated HCl for 48 h at 40 °C. Then the remaining C in the sample was
determined with a LECO CN-2000 autoanalyzer. Blanks and standards (ana-
lytical grade EDTA; Sigma) were intercalated between replicate samples for
calibration. Although the acidification of sediments with HCl could have
eliminated the more volatile components of organic carbon (OC), we used OC
profiles as geochemical tracers for illustrating the effects of intensive bottom
trawling on the vertical distribution of OC deep in the sediment.
Statistical Analyses. Differences among the trawled and untrawled sediments
were assessed using univariate and multivariate distance-based permuta-
tional nonparametric analyses of variance (PERMANOVA) (57). The design
included four fixed levels: trawled sediments at 500 m in depth (n = 2–5
stations) and untrawled sediments at 500, 800, and 2,000 m in depth (n = 2–4,
n = 3, and n = 1 stations, respectively), with n = 3 as the combination of
factors (i.e., true replicates coming from independent deployments of the
corer at each station). The analyses were carried out on Euclidean distances
(organic matter) or Bray–Curtis similarity matrices (fauna data) of previously
normalized data (organic matter) or on fourth-root transformed data, using
unrestricted permutations of the raw data (univariate tests) or 999 permu-
tations under a reduce model (multivariate test). When significant differ-
ences were observed, pair-wise comparison tests were also carried out. The
multivariate differences in the compositions of the sedimentary organ-
ic matter, meiofauna communities, and nematode assemblages between
trawled and untrawled areas are illustrated using the biplots produced after
canonical analysis of the principal coordinates (CAP) using the same distance/
similarity matrices used for PERMANOVA. Turnover diversity (β diversity) of
nematodes between pairs of contrasted stations (e.g., trawled vs. untrawled
sediments) have been calculated as Bray–Curtis dissimilarity percentage using the
SIMPER (similarity percentages) tool. The PERMANOVA tests, CAP analyses, and
SIMPER tests were carried out using the homonymous routines included in the
software PRIMER 6+.
Pusceddu et al. PNAS Early Edition | 5 of 6
ENVIRONMENTAL
SCIENCES

Estimation of Trawling-Induced Organic C Removal from the Seabed. To esti-
mate the amount of organic C removed daily by the trawling activities from
a single square meter in the study area, we first calculated the mean dif-
ference in the sedimentary organic C quantity (as estimated from biopolymeric
C contents) (43) between the trawled and untrawled sediments at 500 m in
depth. This amount was extrapolated to the total amount of organic C re-
moved annually by trawling from the entire area, using the volume estimate
of 2.40 × 10⁻⁴ km3 of sediment per year, normalized per square meter (using
4.2 km2 as an estimate of the surface of the trawled area) (18) and per single
day (dividing by 365). This amount of C removed by the trawling was com-
pared with estimates of particle flux in the north-western Mediterranean
Sea during a two-decade time-series study at the Dynamique des Flux
Atmosphériques en Méditerranée (DYFAMED) site (58).
ACKNOWLEDGMENTS. Assistance at sea by the crews of research vessel Gar-cía del Cid is acknowledged. The Vessel Monitoring System data were pro-vided by the Spanish General Secretariat of Maritime Fishing. This study wasconducted within the framework of the Hotspot Ecosystem Research andMan’s Impact On European Seas European Union Collaborative Project (ECContract 226354). The oceanographic cruise was funded by the Spanish Re-search Plan (Project CTM2010-11084-E). This study was supported by theProject Ricerca Italiana per il Mare. J.M. received funding from a Junta parala Ampliación de Estudios contract granted by Consejo Superior de Investi-gaciones Científicas and cofinanced by the European Social Fund. P.M.acknowledges funding from the Government of Catalonia through the Insti-tució Catalana de Recerca i Estudis Avançats Academia prize. We are grate-ful to two anonymous reviewers for their constructive criticism on an earlyversion of the manuscript.
1. Thrush SF, Dayton PK (2002) Disturbance to marine benthic habitats by trawling and
dredging: Implications for marine biodiversity. Annu Rev Ecol Syst 33:449–473.
2. Roberts C (2007) The Unnatural History of the Sea (Island Press, Chicago, IL).
3. Graham M (1938) The trawl fisheries: A scientific and national problem. Nature
142(3609):1143–1146.
4. Myers RA, Worm B (2003) Rapid worldwide depletion of predatory fish communities.
Nature 423(6937):280–283.
5. Thurstan RH, Brockington S, Roberts CM (2010) The effects of 118 years of industrial
fishing on UK bottom trawl fisheries. Nat Commun 1:15.
6. Worm B, Tittensor DP (2011) Range contraction in large pelagic predators. Proc Natl
Acad Sci USA 108(29):11942–11947.
7. Roberts CM (2002) Deep impact: The rising toll of fishing in the deep sea. Trends Ecol
Evol 17(5):242–245.
8. Morato T, Watson R, Pitcher TJ, Pauly D (2006) Fishing down the deep. Fish Fish 7(1):
24–34.
9. Costello MJ, et al. (2010) A census of marine biodiversity knowledge, resources, and
future challenges. PLoS ONE 5(8):e12110.
10. Rex MA, Etter RJ (2010) Deep-Sea Biodiversity: Pattern and Scale (Harvard Univ Press,
Cambridge, MA).
11. Norse EA, et al. (2012) Sustainability of deep-sea fisheries. Mar Policy 36(2):307–320.
12. Althaus F, et al. (2009) Impacts of bottom trawling on deep-coral ecosystems of
seamounts are long-lasting. Mar Ecol Prog Ser 397:279–294.
13. Giere O (2009) Meiobenthology. The Microscopic Motile Fauna of Aquatic Sediments
(Springer, Berlin).
14. Lambshead PJD (2004) Marine nematode biodiversity. Nematology: Advances and
Perspectives: Nematode Morphology, Physiology and Ecology, Tsinghua University
Press (TUP) Book Series, eds Chen ZX, Chen SY, Dickson DW (CABI Publishing, Wall-
ingford, UK), Vol 1, pp. 436–467.
15. Heip C, Vincx M, Vranken G (1985) The ecology of marine nematodes. Oceanogr Mar
Biol 23:399–489.
16. Danovaro R, et al. (2008) Exponential decline of deep-sea ecosystem functioning
linked to benthic biodiversity loss. Curr Biol 18(1):1–8.
17. Palanques A, et al. (2006) Evidence of sediment gravity flows induced by trawling in
the Palamós (Fonera) submarine canyon (northwestern Mediterranean). Deep-Sea
Res 53(2):201–214.
18. Puig P, et al. (2012) Ploughing the deep sea floor. Nature 489(7415):286–289.
19. Martín J, Puig P, Palanques A, Ribó M (2014) Trawling-induced daily sediment re-
suspension in the flank of a Mediterranean submarine canyon. Deep Sea Res Part 2
Top Stud Oceanogr, 10.1016/j.dsr2.2013.05.036.
20. Sañé E, Martín J, Puig P, Palanques A (2013) Organic biomarkers in deep-sea regions
affected by bottom trawling: Pigments, fatty acids, amino acids and carbohydrates in
surface sediments from the La Fonera (Palamós) Canyon, NW Mediterranean Sea.
Biogeosciences 10:8093–8108.
21. Levin LA, Dayton PK (2009) Ecological theory and continental margins: Where shallow
meets deep. Trends Ecol Evol 24(11):606–617.
22. McClain CR, Barry JP (2010) Habitat heterogeneity, disturbance, and productivity
work in concert to regulate biodiversity in deep submarine canyons. Ecology 91(4):
964–976.
23. Company JB, et al. (2008) Climate influence on deep sea populations. PLoS ONE 3(1):
e1431.
24. Witte U, et al. (2003) In situ experimental evidence of the fate of a phytodetritus
pulse at the abyssal sea floor. Nature 424(6950):763–766.
25. Mayor DJ, et al. (2012) Resource quality affects carbon cycling in deep-sea sediments.
ISME J 6(9):1740–1748.
26. van Oevelen D, et al. (2011) Canyon conditions impact carbon flows in food webs of
three sections of the Nazaré canyon. Deep Sea Res Part 2 Top Stud Oceanogr
58(23-24):2461–2476.
27. Aller R (1994) Bioturbation and remineralization of sedimentary organic matter: Ef-
fects of redox oscillation. Chem Geol 114(3-4):331–345.
28. Meysman FJR, Middelburg JJ, Heip CHR (2006) Bioturbation: A fresh look at Darwin’s
last idea. Trends Ecol Evol 21(12):688–695.
29. Pusceddu A, Fiordelmondo C, Danovaro R (2005) Sediment resuspension effects on
the benthic microbial loop in experimental microcosms. Microb Ecol 50(4):602–613.
30. Martín J, et al. (2008) Effect of commercial trawling on the deep sedimentation in
a Mediterranean submarine canyon. Mar Geol 252(3-4):150–155.
31. Schratzberger M, Jennings S (2002) Impacts of chronic trawling disturbance on
meiofaunal communities. Mar Biol 141(5):991–1000.
32. Jennings S, et al. (2001) Trawling disturbance can modify benthic production pro-
cesses. J Anim Ecol 70(3):459–475.
33. Bongiorni L, et al. (2010) Deep-water scleractinian corals promote higher biodiversity
in deep-sea meiofaunal assemblages along continental margins. Biol Conserv 143(7):
1687–1700.
34. Liu X-S, Cheung SG, Shin PKS (2009) Meiofauna with special reference to nematodes
in trawling ground of subtropical Hong Kong. Mar Pollut Bull 58(4):607–615.
35. Gray JS (1989) Effects of environmental stress on species rich assemblages. Biol J Linn
Soc Lond 37(1-2):19–32.
36. Warwick RM (1986) A new method for detecting pollution effects on marine mac-
robenthic communities. Mar Biol 92(4):557–562.
37. Pimentel D, et al. (1995) Environmental and economic costs of soil erosion and con-
servation benefits. Science 267(5201):1117–1123.
38. Lal R (2003) Soil erosion and the global carbon budget. Environ Int 29(4):437–450.
39. Cramer VA, Hobbs RJ, Standish RJ (2008) What’s new about old fields? Land aban-
donment and ecosystem assembly. Trends Ecol Evol 23(2):104–112.
40. Palanques A, et al. (2005) General patterns of circulation, sediment fluxes and ecology
of the Palamós (La Fonera) submarine canyon, north western Mediterranean. Prog
Oceanogr 66(2-4):89–119.
41. Martín J, Palanques A, Puig P (2006) Composition and variability of downward par-
ticulate matter fluxes in the Palamós submarine canyon (NW Mediterranean). J Mar
Syst 60(1-2):75–97.
42. Martín J, Palanques A, Puig P (2007) Near-bottom horizontal transfer of particulate
matter in the Palamós Submarine Canyon (NW Mediterranean). J Mar Res 65(2):
193–218.
43. Pusceddu A, Dell’Anno A, Fabiano M, Danovaro R (2009) Quantity and bioavailability
of sediment organic matter as signatures of benthic trophic status. Mar Ecol Prog Ser
375:41–52.
44. Danovaro R (2010) Methods for the Study of Deep-Sea Sediments, Their Functioning
and Biodiversity (CRC, Boca Raton, FL).
45. Pinckney J, Papa R, Zingmark R (1994) Comparison of high-performance liquid chro-
matographic, spectrophotometric, and fluorometric methods for determining chlo-
rophyll a concentrations in estuarine sediments. J Microb Met 19(1):59–66.
46. Fabiano M, Danovaro R (1998) Enzymatic activity, bacterial distribution, and organic
matter composition in sediments of the ross sea (Antarctica). Appl Environ Microbiol
64(10):3838–3845.
47. Feller RJ, Warwick RM (1988) Energetics. Introduction to the Study of Meiofauna, eds
Higgins RP, Thiel H (Smithsonian Institution Press, Washington, DC).
48. Seinhorst JW (1959) A rapid method for the transfer of nematodes from fixative to
anhydrous glycerine. Nematologica 4(1):67–69.
49. Sanders HL (1968) Marine benthic diversity: A comparative study. Am Nat 102(925):
243–282.
50. Hurlbert SH (1971) The nonconcept of species diversity: A critique and alternative
parameters. Ecology 52(4):577–586.
51. Soetaert K, Heip C (1990) Sample-size dependence of diversity indices and the de-
termination of sufficient sample size in a high-diversity deep-sea environment. Mar
Ecol Prog Ser 59:305–307.
52. Danovaro R, Bianchelli S, Gambi C, Mea M, Zeppilli D (2009) α-, β-, γ-, δ-, and e-diversity
of deep-sea nematodes in canyons and open slopes of Northeast Atlantic and Med-
iterranean margins. Mar Ecol Progr Ser 396:197–209.
53. Bongers T, Alkemade R, Yeates GW (1991) Interpretation of disturbance-induced
maturity decrease in marine nematode assemblages by means of the Maturity Index.
Mar Ecol Prog Ser 76:135–142.
54. Bongers T, Bongers M (1998) Functional diversity of nematodes. Appl Soil Ecol 10(3):
239–251.
55. Gambi C, Vanreusel A, Danovaro R (2003) Biodiversity of nematode assemblages from
deep-sea sediments of the Atacama Slope and Trench (South Pacific Ocean). Deep Sea
Res Part I Oceanogr Res Pap 50(1):103–117.
56. Sanchez-Cabeza JA, Masqué P, Ani-Ragolta I (1998) 210Pb and 210Po analysis in sedi-
ments and soils by microwave acid digestion. J Radioanal Nucl Chem 227(1-2):19–22.
57. Anderson MJ (2001) Permutation tests for univariate or multivariate analysis of var-
iance and regression. Can J Fish Aquat Sci 58(3):626–639.
58. Miquel JC, et al. (2011) Dynamics of particle flux and carbon export in the north-
western Mediterranean Sea: A two-decade time-series study at the DYFAMED site.
Prog Oceanogr 91(4):461–481.
6 of 6 | www.pnas.org/cgi/doi/10.1073/pnas.1405454111 Pusceddu et al.

Supporting Information
Pusceddu et al. 10.1073/pnas.1405454111
Fig. S1. Depth profiles of dry bulk density (A), total 210Pb concentrations (B), and organic C content [percentage of sediment dry weight (DW)] (C) in the
surface sediments (0–10 cm) at the trawled and untrawled coring sites along the flanks of La Fonera Canyon. The gray area in B represents the estimated
supported 210Pb concentration (in equilibrium with 226Ra). Concentrations of 210Pb above that threshold are “in excess,” indicating net accumulation of re-
cently deposited sediments (within the order of a century). Absence of excess 210Pb indicates that sediments are older than 100–150 y. See Fig. 1 for sampling
locations and Table S1 for sampling codes.
0.0
0.1
0.1
0.2
0.2
0.3
500 m 500 m 800 m 2000 m
Trawled Untrawled
Org
an
ic m
a�
er
turn
ov
er
(d-1
)
***
**
Fig. S2. Turnover of organic C (±SE) in the trawled and untrawled sediments. The turnover (d−1) of the biopolymeric C pools were calculated as the ratios of
the biopolymeric C daily degradation rates (estimated from extracellular enzymatic activities; Methods) and the biopolymeric C contents in the sediment.
Pusceddu et al. www.pnas.org/cgi/content/short/1405454111 1 of 7

0
100
200
300
400
500
600
700
Western Med Central Med Eastern Med LFC trawled
Me
iofa
un
a a
bu
nd
an
ce (
ind
. 1
0cm
-2)
Depth (m)
A
0
100
200
300
400
500
600
700
Western Med Central Med Eastern Med LFC trawled
Me
iofa
un
a a
bu
nd
an
ce (
ind
. 1
0cm
-2)
Depth (m)
B
0
200
400
600
800
1000
1200
1400
400 500 600 700 800 900 1000 1100
mc0
1.
dni(
ecn
ad
nu
ba
an
uaf
oie
M-2
)
Depth (m)
LFC Untrawled W Med Central Med Eastern Med LFC TrawledC
Fig. S3. Meiofaunal abundance in the Western, Central, and Eastern sectors of the Mediterranean Sea and in the trawled sediments of La Fonera Canyon
(LFC). Illustrated are mean values (±SE) of meiofaunal abundance from the 500- to 800-m-depth (A) and 500- to 600-m-depth (B) ranges and the comparison of
data from the 500- to 1,000-m-depth range in the whole Mediterranean Sea (C). Data are derived from refs. 1 and 2.
1. Bianchelli S, Gambi C, Zeppilli D, Danovaro R (2010) Metazoan meiofauna in deep-sea canyons and adjacent open slopes: A large-scale comparison with focus on the rare taxa. Deep Sea
Res Part 1 Oceanogr Res Pap 57(3):420–433.
2. Gambi C, Lampadariou N, Danovaro R (2010) Latitudinal, longitudinal and bathymetric patterns of abundance, biomass of metazoan meiofauna: Importance of the rare taxa and
anomalies in the deep Mediterranean Sea. Adv Oceanogr Limnol 1(1):167–197.
Pusceddu et al. www.pnas.org/cgi/content/short/1405454111 2 of 7
0
10
20
30
40
50
60
70
500 m 500 m 800 m 2000 m
Trawled Untrawled
Ind
ivid
ua
l b
iom
ass
(n
gC
in
d-1
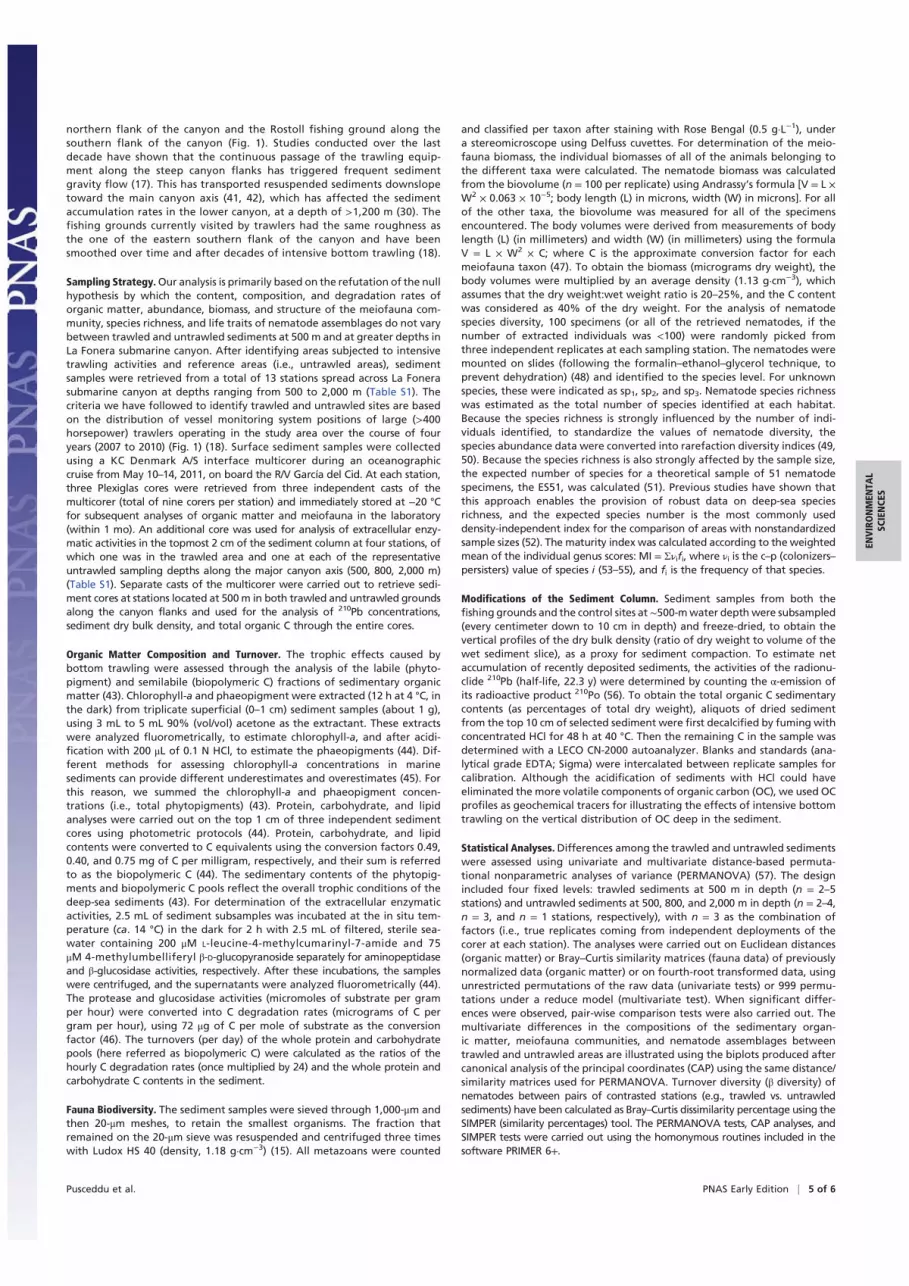
)
***
ns
Fig. S4. Meiofaunal individual biomass in trawled (red) and untrawled (blue) sediments.
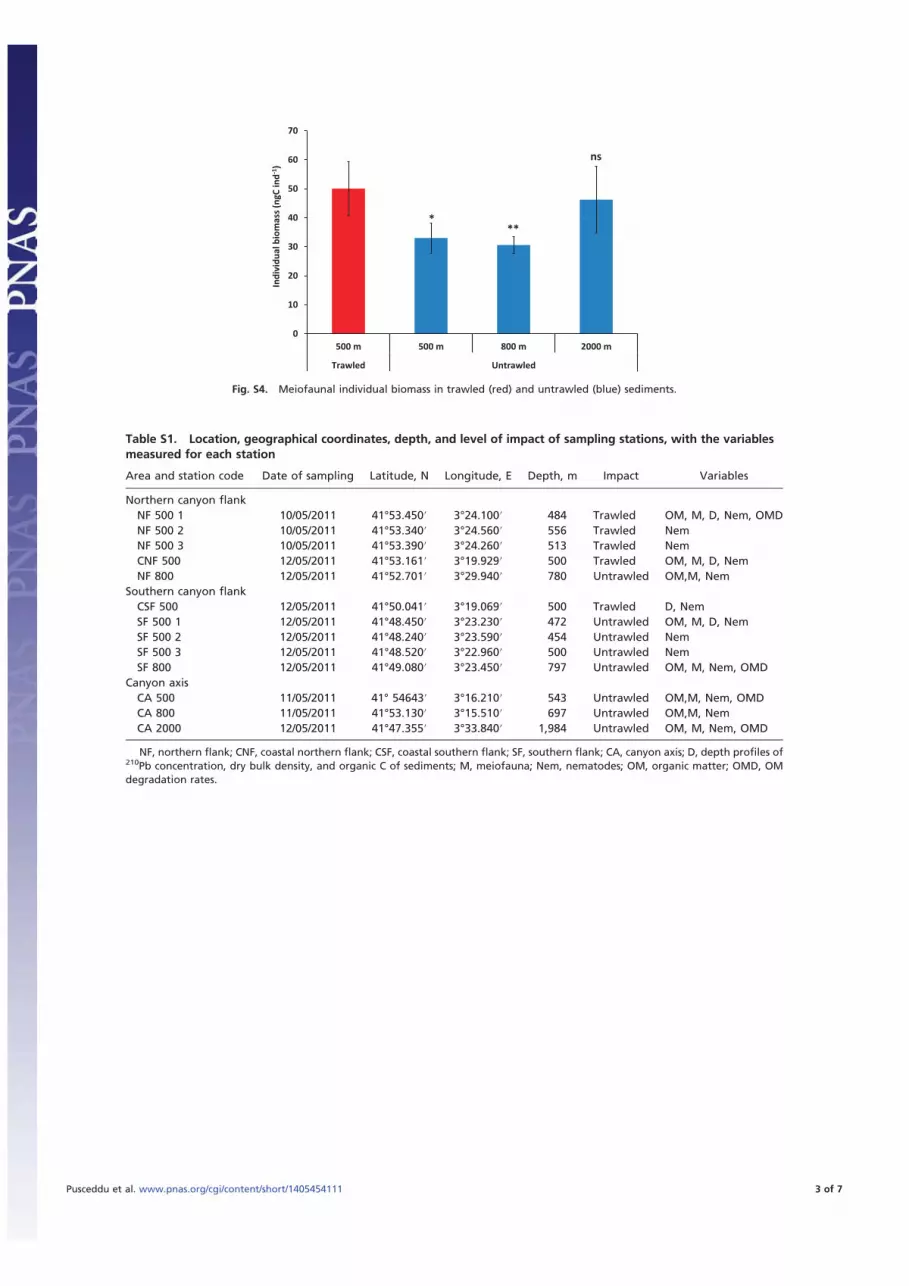
Table S1. Location, geographical coordinates, depth, and level of impact of sampling stations, with the variables
measured for each station
Area and station code Date of sampling Latitude, N Longitude, E Depth, m Impact Variables
Northern canyon flank
NF 500 1 10/05/2011 41°53.450′ 3°24.100′ 484 Trawled OM, M, D, Nem, OMD
NF 500 2 10/05/2011 41°53.340′ 3°24.560′ 556 Trawled Nem
NF 500 3 10/05/2011 41°53.390′ 3°24.260′ 513 Trawled Nem
CNF 500 12/05/2011 41°53.161′ 3°19.929′ 500 Trawled OM, M, D, Nem
NF 800 12/05/2011 41°52.701′ 3°29.940′ 780 Untrawled OM,M, Nem
Southern canyon flank
CSF 500 12/05/2011 41°50.041′ 3°19.069′ 500 Trawled D, Nem
SF 500 1 12/05/2011 41°48.450′ 3°23.230′ 472 Untrawled OM, M, D, Nem
SF 500 2 12/05/2011 41°48.240′ 3°23.590′ 454 Untrawled Nem
SF 500 3 12/05/2011 41°48.520′ 3°22.960′ 500 Untrawled Nem
SF 800 12/05/2011 41°49.080′ 3°23.450′ 797 Untrawled OM, M, Nem, OMD
Canyon axis
CA 500 11/05/2011 41° 54643′ 3°16.210′ 543 Untrawled OM,M, Nem, OMD
CA 800 11/05/2011 41°53.130′ 3°15.510′ 697 Untrawled OM,M, Nem
CA 2000 12/05/2011 41°47.355′ 3°33.840′ 1,984 Untrawled OM, M, Nem, OMD
NF, northern flank; CNF, coastal northern flank; CSF, coastal southern flank; SF, southern flank; CA, canyon axis; D, depth profiles of210Pb concentration, dry bulk density, and organic C of sediments; M, meiofauna; Nem, nematodes; OM, organic matter; OMD, OM
degradation rates.
Pusceddu et al. www.pnas.org/cgi/content/short/1405454111 3 of 7

Table S2. Permutational analyses of variance and the a posteriori pairwise tests for the quantity, composition, and
turnover of the organic matter in the trawled and untrawled sediments at the different depths in La Fonera Canyon
Variable
and source df MS Pseudo-F P(MC)
Pairwise
comparisons t P(MC)
Biopolymeric C
Impact 3 2.775 3.781 P < 0.01 Trawled 500; untrawled 500 2.959 P < 0.05
Residual 20 0.734 Trawled 500; untrawled 800 1.845 NS
Total 23 Trawled 500; untrawled 2,000 0.050 NS
Phytopigment
Impact 3 6.550 39.123 P < 0.001 Trawled 500; untrawled 500 8.917 P < 0.001
Residual 20 0.167 Trawled 500; untrawled 800 7.540 P < 0.001
Total 23 Trawled 500; untrawled 2,000 3.129 P < 0.01
OM composition
Impact 3 22.124 9.099 P < 0.001 Trawled 500; untrawled 500 4.618 P < 0.001
Residual 20 2.432 Trawled 500; untrawled 800 2.878 P < 0.01
Total 23 Trawled 500; untrawled 2,000 1.362 NS
OM turnover
Impact 3 9.839 3.280 P < 0.001 Trawled 500; untrawled 500 7.990 P < 0.01
Residual 11 1.161 0.145 Trawled 500; untrawled 800 2.659 P < 0.05
Total 12 Trawled 500; untrawled 2,000 7.109 P < 0.01
Fixed levels of contrast include trawled sediments at 500 m in depth (n = 2 replicate stations, 1 for organic matter turnover),
untrawled sediments at 500 m in depth (n = 2, 1 for organic matter turnover), untrawled sediments at 800 m in depth (n = 3, 1 for
organic matter turnover), and untrawled sediments at 2,000 m in depth (n = 1). The multivariate test [permutational analyses of
variance (PERMANOVA)] on the organic matter composition included the protein, carbohydrate, lipid, chlorophyll-a, and phytopig-
ment concentrations. All analyses were carried out on normalized data, using unrestricted permutations of the raw data and 999
permutations. df, degrees of freedom; MS, mean square; NS, not significant; P(MC), probability level after Monte Carlo tests; pseudo-F,
statistic F; t, statistic t for pairwise comparisons.
Pusceddu et al. www.pnas.org/cgi/content/short/1405454111 4 of 7

Table S3. Total phytopigment contents along European continental margins
Area Date Latitude, °N Longitude, °E/°W Depth, m CPE, μg·g−1±SE
La Fonera Canyon May 2011 See Table S1 See Table S1 500 5.2 0.7
Catalan margin May 2006 35.147 23.714 2,420 45.4 35.8
Catalan margin April 2005 42.248 4.344 2,147 28.3 19.9
Catalan margin May 2006 35.052 23.492 3,600 24.2 5.1
Catalan margin May 2006 35.085 23.554 3,553 23.5 4.6
Catalan margin May 2006 34.883 24.548 2,669 20.5 7.7
Catalan margin May 2006 34.849 24.809 2,180 15.1 3.8
Catalan margin May 2006 34.603 24.143 3,617 12.1 3.7
Catalan margin October 2005 42.080 4.682 2,342 9.5 2.1
Malta Escarpment August 2005 36.818 15.362 2,325 16.8 2.6
Malta Escarpment August 2005 36.849 15.341 2,062 9.0 5.6
Nordic margin August 2005 78.780 5.333 2,468 44.2 24.5
Nordic margin August 2005 79.134 2.842 5,571 22.3 7.3
Nordic margin August 2005 79.067 4.170 2,545 16.0 2.5
Nordic margin August 2005 79.108 4.600 1,914 13.8 2.0
Nordic margin August 2005 78.610 5.070 2,339 11.9 3.4
Nordic margin August 2005 79.065 4.180 3,997 10.1 5.6
Nordic margin August 2005 79.283 4.328 2,397 8.0 2.1
Nordic margin August 2005 79.065 4.180 2,462 7.9 2.6
Nordic margin August 2005 79.065 4.180 2,462 7.9 2.6
Nordic margin August 2005 78.918 5.002 2,634 6.4 1.8
Portuguese margin July 2005 39.500 9.940 3,530 48.0 1.6
Portuguese margin September 2006 38.363 9.510 2,100 31.8 3.6
Portuguese margin July 2005 39.594 10.321 4,340 23.7 2.7
Portuguese margin September 2006 39.504 9.843 3,231 21.7 2.3
Portuguese margin September 2006 39.593 10.333 4,363 20.0 7.4
Portuguese margin July 2005 38.356 9.979 4,513 16.2 3.5
Portuguese margin September 2006 37.833 9.515 1,002 15.5 3.2
Portuguese margin September 2006 38.312 9.703 2,975 13.4 3.1
Portuguese margin September 2006 40.166 10.167 3,981 9.5 1.1
Portuguese margin September 2006 37.833 10.083 2,908 9.0 0.9
Portuguese margin September 2006 38.333 9.858 3,914 8.7 0.8
Portuguese margin September 2006 39.177 10.666 2,084 7.8 3.5
Portuguese margin July 2005 40.078 10.376 4,277 7.5 0.5
Portuguese margin September 2006 37.833 9.750 2,130 7.1 1.8
Portuguese margin September 2006 37.833 11.000 4,987 6.9 2.2
Portuguese margin September 2006 40.167 10.000 3,475 6.5 2.6
Data from La Fonera Canyon are derived frommean (±SE) concentrations in trawled stations at 500 m in depth in La Fonera Canyon.
Data from the Catalan, Nordic, and Portuguese margin are from ref. 1. The data from the Malta Escarpment are deposited in http://doi.
pangaea.de/10.1594/PANGAEA.681264. Bolded values indicate western longitude. CPE, total phytopigment concentration.
1. Pusceddu A, et al. (2010) Organic matter in sediments of canyons and open slopes of the Portuguese, Catalan, southern Adriatic and Cretan Sea margins. Deep Sea Res Part 1 Oceanogr
Res Pap 57(3):441–457.
Pusceddu et al. www.pnas.org/cgi/content/short/1405454111 5 of 7

Table S4. PERMANOVA and pairwise tests for the total meiofauna abundance, biomass, and richness of the higher
taxa in trawled and untrawled sediments at different depths in La Fonera Canyon
Variable and
source df MS Pseudo-F P(MC) Pairwise comparisons t P(MC)
Abundance
Impact 3 2,456.3 31.298 P < 0.001 Trawled 500; untrawled 500 7.591 P < 0.001
Residual 20 78.5 Trawled 500; untrawled 800 6.995 P < 0.001
Total 23 Trawled 500; untrawled 2,000 3.017 P < 0.05
Biomass
Impact 3 1,331.6 24.866 P < 0.001 Trawled 500; untrawled 500 7.080 P < 0.001
Residual 20 53.6 Trawled 500; untrawled 800 7.856 P < 0.001
Total 23 Trawled 500; untrawled 2,000 2.991 P < 0.05
Taxa richness
Impact 3 109.9 15.534 P < 0.001 Trawled 500; untrawled 500 5.862 P < 0.001
Residual 20 7.1 Trawled 500; untrawled 800 3.369 P < 0.01
Total 23 Trawled 500; untrawled 2,000 2.434 P < 0.05
Fixed levels of contrast include trawled sediments at 500 m in depth (n = 2 replicate stations), untrawled sediments at 500 m in depth
(n = 2), untrawled sediments at 800 m in depth (n = 3), and untrawled sediments at 2,000 m in depth (n = 1). Analyses were carried out on
the fourth-root transformed data, using unrestricted permutations of the raw data and 999 permutations. df, degrees of freedom; MS,
mean square; P(MC), probability level after Monte Carlo tests; Pseudo-F, statistic F; t, statistic t for pairwise comparisons.
Table S5. Multivariate PERMANOVA and pairwise tests on the composition of the meiofauna communities and
nematode assemblages in trawled and untrawled sediments at different depths in La Fonera Canyon
Variable and
source df MS Pseudo-F P(MC) Contrast t P(MC) β
Meiofauna
Impact 3 1670 5.178 P < 0.001 Trawled 500; untrawled 500 3.097 P < 0.01 nc
Residual 23 323 Trawled 500; untrawled 800 2.069 P < 0.05 nc
Total 26 Trawled 500; untrawled 2,000 1.610 NS nc
Untrawled 500; untrawled 800 2.266 P < 0.05 nc
Untrawled 500; untrawled 2,000 3.276 P < 0.01 nc
Untrawled 800; untrawled 2,000 1.302 NS nc
Nematode
Impact 3 4774 2.109 P < 0.001 Trawled 500; untrawled 500 1.761 P < 0.01 37
Residual 22 2264 Trawled 500; untrawled 800 1.190 NS 31
Total 25 Trawled 500; untrawled 2,000 1.483 P < 0.05 27
Untrawled 500; untrawled 800 1.310 NS 27
Untrawled 500; untrawled 2,000 1.730 P < 0.05 31
Untrawled 800; untrawled 2,000 1.129 NS 22
Fixed levels of contrast include trawled sediments at 500 m in depth (n = 2; 5 replicate stations for meiofauna and nematodes,
respectively), untrawled sediments at 500 m in depth (n = 2–4), untrawled sediments at 800 m in depth (n = 3), and untrawled
sediments at 2,000 m in depth (n = 1). Nematode data are presence-/absence- transformed. Analyses were carried out using un-
restricted permutations of the raw data and 999 permutations. β, turnover diversity of nematodes as Bray–Curtis dissimilarity per-
centage; df, degrees of freedom; MS, mean square; NS, not significant; P(MC), probability level after Monte Carlo tests; Pseudo-F,
statistic F; t, statistic t for pairwise comparisons; nc, not calculated.
Pusceddu et al. www.pnas.org/cgi/content/short/1405454111 6 of 7

Table S6. Analysis of seasonal and interannual variability in Cap de Creus Canyon
Contrast, variable, and source df MS Pseudo-F P(MC)
Interannual (2005, 2008, 2009)
Phytopigment content
Year 2 2.82 3.5357 NS
Residual 18 0.80
Meiofauna abundance
Year 2 174.88 2.766 NS
Residual 18 63.23
Meiofauna community structure
Year 2 1,010.70 2.2805 NS
Residual 18 443.20
Seasonal (April vs. October 2008 and 2009)
Phytopigment content
Month 1 3.20 3.7047 NS
Residual 16 0.86
Meiofauna abundance
Month 1 192.72 2.4693 NS
Residual 16 78.05
Meiofauna community structure
Month 1 957.04 3.1359 NS
Residual 16 305.19
Reported are the results of PERMANOVA carried out to test the hypothesis of no significant interannual
(2005, 2008, 2009) and seasonal (April 2008, October 2008, April 2009, October 2009) changes in the phytopig-
ment contents, meiofaunal abundance, and meiofaunal community composition at 1,000 m in depth. Raw data
are derived from ref. 1. PERMANOVAs on phytopigment contents and meiofaunal abundance have been carried
out, after normalization and fourth-root transformation of the raw data, respectively, on resemblance matrixes
based on Euclidean distances with unrestricted permutation of the data. Tests on meiofaunal composition have
been carried out on fourth-root transformed data, using resemblance matrixes based on Bray–Curtis similarity
values, with permutations of the residuals under a reduced model. df, degrees of freedom; MS, mean square;
P(MC), probability level after Monte Carlo tests; Pseudo-F, statistic F.
1. Pusceddu, et al. (2013) Major consequences of an intense dense shelf water cascading event on deep-sea benthic trophic conditions and meiofaunal biodiversity. Biogeosciences 10:
2659–2670.
Pusceddu et al. www.pnas.org/cgi/content/short/1405454111 7 of 7
Recommended


