CITY OF GERALDTON-GREENOUGH
Coastal Processes Study - Greys Beach to Sunset Beach
A Project of the Coastal Vulnerability and Risk Assessment Program
301012-01151
16-Sep-10
Power, Infrastructure & Environment Level 7, QV1 Building 250 St. Georges Terrace Perth WA 6000 AustraliaTel: +61 8 9278 8111 Fax: +61 8 9278 8110 www.worleyparsons.com WorleyParsons Services Pty Ltd ABN 61 001 279 812
© Copyright 2010 WorleyParsons Services Pty Ltd
CITY OF GERALDTON-GREENOUGH
COASTAL PROCESSES STUDY - GREYS BEACH TO SUNSET BEACH
A PROJECT OF THE COASTAL VULNERABILITY AND RISK ASSESSMENT PROGRAM
\\perworfil1\infstruclib\projects\i01151 geraldton-greenough coastal process study\2.0 reports\i01151-00-cs-rep-001_rev1.doc
Page iii 301012-01151 : Rev 1 : 16-Sep-10
CONTENTS
EXECUTIVE SUMMARY ...................................................................................................................1
Coastal Sediment Transport Assessment.....................................................................................1
Coastal Management Methods .....................................................................................................1
Coastal Protection Options ...........................................................................................................2
Recommendations for Coastal Management Planning ................................................................3
1. INTRODUCTION & BACKGROUND..................................................................................4
1.1 Key Partners .......................................................................................................................4
1.2 Study Area ..........................................................................................................................4
1.3 Beaches within the Study Area...........................................................................................5
1.4 Background.........................................................................................................................5
1.5 Data Available and the Northern Beaches Stabilisation Programme................................6
1.6 Objectives of the Report .....................................................................................................7
2. COASTAL SEDIMENT TRANSPORT ASSESSMENT ......................................................9
2.1 Contribution from Other Studies .........................................................................................9
2.2 Desktop Study...................................................................................................................11
2.2.1 Sand Bypassing Programme ...............................................................................11
2.2.2 Beach Profile Monitoring......................................................................................12
2.2.3 Shoreline Long Term Evolution............................................................................15
2.3 Wave Climate Assessment...............................................................................................17
2.3.1 MIKE21SW Modelling ..........................................................................................17
2.3.2 Wave Hindcast Results........................................................................................19
2.4 Longshore Sediment Transport Assessment ...................................................................20
2.4.1 LITPACK Model Description ................................................................................20
2.4.2 Model Setup.........................................................................................................21
2.4.3 Input Data.............................................................................................................21
2.4.4 Results .................................................................................................................23
2.5 Assessment of Sediment Budget along the Geraldton Coastline.....................................24
3. COASTAL MANAGEMENT METHODS ...........................................................................27
CITY OF GERALDTON-GREENOUGH
COASTAL PROCESSES STUDY - GREYS BEACH TO SUNSET BEACH
A PROJECT OF THE COASTAL VULNERABILITY AND RISK ASSESSMENT PROGRAM
\\perworfil1\infstruclib\projects\i01151 geraldton-greenough coastal process study\2.0 reports\i01151-00-cs-rep-001_rev1.doc
Page iv 301012-01151 : Rev 1 : 16-Sep-10
3.1 Impact of Recent Foreshore Development and Management Policy ...............................27
3.1.1 Geraldton Port Harbour and the Recent PEP......................................................27
3.1.2 Detached Breakwater ..........................................................................................27
3.1.3 Northern Beaches Stabilisation Programme........................................................28
3.2 Assessment of Coastal Setback Distances ......................................................................28
3.2.1 State Coastal Planning Policy and Sea Level Rise .............................................28
3.2.2 Coastal Setback for a 20 Year Timeframe...........................................................30
3.2.3 Coastal Setback for a 100 Year Timeframe.........................................................34
3.3 A Review of Available Coastal Protection Options ...........................................................38
3.3.1 Do Nothing ...........................................................................................................38
3.3.2 Managed Recession ............................................................................................38
3.3.3 Dune Management ..............................................................................................39
3.3.4 Beach Nourishment .............................................................................................39
3.3.5 Seawall and Buried Seawall ................................................................................41
3.3.6 Groynes................................................................................................................41
3.3.7 Detached Breakwaters.........................................................................................42
3.3.8 Artificial Reefs ......................................................................................................42
3.3.9 Beach Drainage ...................................................................................................43
3.3.10 Material for Coastal Structure Construction.........................................................44
3.4 Social Impacts of Selected Options ..................................................................................44
3.5 Environmental Impact of Selected Options ......................................................................45
4. DISCUSSION OF COASTAL PROTECTION OPTIONS..................................................46
4.1 Coastal Processes............................................................................................................46
4.2 General Considerations ....................................................................................................47
4.3 Coastal Protection Options: Area Specific Options ..........................................................50
4.3.1 Northern Beaches ................................................................................................50
4.3.2 Sunset Beach.......................................................................................................50
4.3.3 South of Chapman River......................................................................................50
4.3.4 Grey’s Beach........................................................................................................51
4.3.5 Net Present Value................................................................................................51
CITY OF GERALDTON-GREENOUGH
COASTAL PROCESSES STUDY - GREYS BEACH TO SUNSET BEACH
A PROJECT OF THE COASTAL VULNERABILITY AND RISK ASSESSMENT PROGRAM
\\perworfil1\infstruclib\projects\i01151 geraldton-greenough coastal process study\2.0 reports\i01151-00-cs-rep-001_rev1.doc
Page v 301012-01151 : Rev 1 : 16-Sep-10
4.4 Partners and Local Community Feedback .......................................................................54
4.4.1 Northern beaches ................................................................................................54
4.4.2 Sunset Beach.......................................................................................................54
4.4.3 South of Chapman River......................................................................................54
4.4.4 Grey’s Beach........................................................................................................54
4.4.5 Other Comments on Coastal Protection ..............................................................55
5. COASTAL MANAGEMENT PLANNING...........................................................................56
5.1 General Recommendations for Coastal Management Planning ......................................56
5.1.1 South of Chapman River......................................................................................56
5.1.2 Sunset Beach.......................................................................................................56
5.1.3 Grey’s Beach........................................................................................................57
5.1.4 North of the Detached Breakwater ......................................................................57
5.2 Short Term Management Planning: Annual Coastal Management Programme ..............57
5.2.1 Active Beach Monitoring ......................................................................................58
5.2.2 Beach Nourishment .............................................................................................58
5.2.3 Annual Management............................................................................................59
5.3 Medium Term Management Planning: Implementation of Coastal Structures.................59
5.3.1 Coastal Protection Structures ..............................................................................59
5.3.2 Construction Material ...........................................................................................60
6. SUMMARY........................................................................................................................61
6.1 Coastal Sediment Transport Assessment ........................................................................61
6.2 Coastal Management Methods.........................................................................................61
6.3 Coastal Protection Options ...............................................................................................63
6.4 Recommendations for Coastal Management Planning ....................................................65
7. REFERENCES .................................................................................................................66
8. OTHER REFERENCES....................................................................................................68
9. FIGURES..........................................................................................................................71
TABLES AND FIGURES
Table 1.1 Beach Sections and Beach Transects Denominations...........................................................7
CITY OF GERALDTON-GREENOUGH
COASTAL PROCESSES STUDY - GREYS BEACH TO SUNSET BEACH
A PROJECT OF THE COASTAL VULNERABILITY AND RISK ASSESSMENT PROGRAM
\\perworfil1\infstruclib\projects\i01151 geraldton-greenough coastal process study\2.0 reports\i01151-00-cs-rep-001_rev1.doc
Page vi 301012-01151 : Rev 1 : 16-Sep-10
Table 2.1 Stream Discharge Volume for the Chapman River (Utakarra station, source Department of
Water)....................................................................................................................................................10
Table 2.2 Sand Extraction along Pages Beach (volumes in m3) ..........................................................11
Table 2.3 Sand Distributed along Town Beach (volumes in m3)...........................................................11
Table 2.4 Sand Distributed along Northern Beaches (volumes in m3) .................................................12
Table 2.5 Volumetric accretion / erosion rates......................................................................................16
Table 2.6 Key model parameters for the refined scale wave model.....................................................18
Table 2.7 Wave Model output point coordinates for the sediment transport model .............................20
Table 2.8 Statistical analysis of hindcast wave at profile 1: ..................................................................20
Table 2.9 Key LITPACK Model Parameters .........................................................................................21
Table 2.10 Example of potential nett and gross transport across each profile: year 2007...................23
Table 3.1 Sea Level Rise Values (difference from 2010 level) according to the High End scenario ...30
Table 3.2 Recommended setback distances for each section of the shoreline for a 20 year timeframe
...............................................................................................................................................................33
Table 3.3 Comparison of recommended and actual setback distances for the 20 year timeframe......34
Table 3.4 Recommended setback distances for each section of the shoreline for a 100 year
timeframe ..............................................................................................................................................36
Table 3.5 Comparison of recommended and actual setback distances for the 100 year timeframe....37
Table 4.1 Comparison of coastal protections........................................................................................49
Table 4.2 High level costing ..................................................................................................................52
Table 4.3 High Level Estimate of Net Present Value of Cost over a 20 year period ............................53
Table 5.1 Yearly average variations along the section north of the Batavia Coast Marina since
September 2004....................................................................................................................................58
Figure 1-1 General view of the Coastline of Geraldton-Greenough .....................................................71
Figure 1-2 General view of the study area showing the different sections ...........................................72
CITY OF GERALDTON-GREENOUGH
COASTAL PROCESSES STUDY - GREYS BEACH TO SUNSET BEACH
A PROJECT OF THE COASTAL VULNERABILITY AND RISK ASSESSMENT PROGRAM
\\perworfil1\infstruclib\projects\i01151 geraldton-greenough coastal process study\2.0 reports\i01151-00-cs-rep-001_rev1.doc
Page vii 301012-01151 : Rev 1 : 16-Sep-10
Figure 1-3 Requirements for Future Coastal Management ..................................................................73
Figure 2-1 Sediment volume variations along Pages Beach since March 2004 ..................................74
Figure 2-2 Sediment volume variations along Town Beach since March 2004....................................74
Figure 2-3 Sediment volume variation along the Northern Beaches since March 2004.......................75
Figure 2-4 Crosshore positions of the Mean Sea Level lines along the Northern Beaches since March
2004 ......................................................................................................................................................75
Figure 2-5 Sediment transport across the sections of the Northern Beaches (positive values are for
northward longshore transport) .............................................................................................................76
Figure 2-6 Shoreline evolution compared to the shoreline position from 2000 for the northern part of
Champion Bay.......................................................................................................................................76
Figure 2-7 Shoreline evolution compared to the shoreline position from 1942 in Point Moore and
Explosive Beach....................................................................................................................................77
Figure 2-8 Shoreline evolution compared to the shoreline position from 1992 in Grey’s Beach..........77
Figure 2-9 Wave Model domain and bathymetry ..................................................................................78
Figure 2-10 Wave Model domain and bathymetry: Geraldton area......................................................78
Figure 2-11 Time series of significant wave height (A) and wave period (B) in Jurien Bay; comparison
of wave measurement (black lines) and model results (red lines)........................................................79
Figure 2-12 Model domain showing the wave modelling output points (red crosses), the four
crosshore profiles (red lines) and the LITPACK reference line (black lines) ........................................80
Figure 2-13 Longshore sediment transport direction depending on incident wave direction................81
Figure 2-14 Sediment transport dynamics along the study area ..........................................................82
Figure 2-15 Estimated sediment budgets along the study area ...........................................................83
Figure 3-1 Projected Sea Level Rise for 2100 (Source ACE CRC 2008).............................................84
Figure 3-2 Coastal setback analysis: Northern Beaches......................................................................85
Figure 3-3 Coastal setback analysis: Northern beaches ......................................................................86
Figure 3-4 Coastal setback analysis: South of Chapman River ...........................................................87
CITY OF GERALDTON-GREENOUGH
COASTAL PROCESSES STUDY - GREYS BEACH TO SUNSET BEACH
A PROJECT OF THE COASTAL VULNERABILITY AND RISK ASSESSMENT PROGRAM
\\perworfil1\infstruclib\projects\i01151 geraldton-greenough coastal process study\2.0 reports\i01151-00-cs-rep-001_rev1.doc
Page viii 301012-01151 : Rev 1 : 16-Sep-10
Figure 3-5 Coastal setback analysis: Sunset Beach.............................................................................88
Figure 3-6 Coastal setback analysis: Grey’s Beach .............................................................................89
Figure 3-7 Coastal Protection Options..................................................................................................90
Figure 3-7a Schematic view of the effects of seawall on shoreline evolution.......................................91
Figure 3-7b Buried Seawall Concept ....................................................................................................91
Figure 3-8a Schematic view of the effects of groynes on shoreline evolution......................................92
Figure 3-8b Example of the use of groyne to create a buffer against storm erosion............................92
Figure 3-9 Schematic view of the effects of breakwater on shoreline evolution...................................93
Figure 4-1 Medium term shoreline evolution for the case “Do Nothing” or “Managed Recession” along
the Northern Beaches ...........................................................................................................................94
Figure 4-2 Medium term shoreline evolution for the case “Do Nothing” or “Managed Recession” along
Sunset Beach ........................................................................................................................................95
Figure 4-3 Medium term shoreline evolution for the present situation of the NSBP.............................96
Figure 4-4 Medium term shoreline evolution for the present situation of the NSBP and an additional
nourishment north of the detached breakwater ....................................................................................97
Figure 4-5 Possible coastal protection north of the breakwater (300m buried seawall) .......................98
Figure 4-6 Possible coastal protection north of the breakwater (40m groyne) .....................................99
Figure 4-7 Possible coastal protection north of the breakwater (40m groyne and 150m buried seawall)
.............................................................................................................................................................100
Figure 4-8 Possible coastal protection option at Sunset Beach .........................................................101
Figure 4-9 Possible coastal protection south of the Chapman river ...................................................102
Figure 4-10 Possible protection at Grey’s beach ................................................................................103
Figure 5-1 Annual Coastal Management Programme ........................................................................104
Figure 5-2 Process to Implement Medium Term Coastal Management Programme .........................105
Figure A-1 Areas erosion (red) and accretion (green) ........................................................................107
CITY OF GERALDTON-GREENOUGH
COASTAL PROCESSES STUDY - GREYS BEACH TO SUNSET BEACH
A PROJECT OF THE COASTAL VULNERABILITY AND RISK ASSESSMENT PROGRAM
\\perworfil1\infstruclib\projects\i01151 geraldton-greenough coastal process study\2.0 reports\i01151-00-cs-rep-001_rev1.doc
Page ix 301012-01151 : Rev 1 : 16-Sep-10
Figure B-1 Profile transect location along the study area for regular survey (Source: Quantum, 2009)
.............................................................................................................................................................109
Figure B-2 Evolution of beach profile P5 (Source: Quantum, 2009)...................................................110
Figure B-3 Evolution of beach profile T6 (Source: Quantum, 2009)...................................................110
Figure B-4 Evolution of beach profile N3 (Source: Quantum, 2009) ..................................................110
Table C.1 Record of sand volumes for sand bypassing (Source GPA, 2010)....................................112
Table D.1 Joint Frequency Table showing Hs against Tp for the location 266675E, 6816674S (profile
1) for the period 1998-2007................................................................................................................114
Table D.2 Statistical analysis of the significant wave height for each year of simulation (1998-2007)
for the location 266675E, 6816674S (profile 1) ..................................................................................114
Figure D-1 Year Wave Roses for the location 266675E, 6816674S (profile 1) for the period 1998 –
2007 ....................................................................................................................................................115
Table D.3 Joint Frequency Table showing Hs against Tp for the location 266750E, 6817970S (profile
2) for the period 1998-2007.................................................................................................................116
Table D.4 Statistical analysis of the significant wave height for each year of simulation (1998-2007)
for the location 266750E, 6817970S (profile 2) ..................................................................................116
Figure D-2 Year Wave Roses for the location 266750E, 6817970S (profile 2) for the period 1998 –
2007 ....................................................................................................................................................117
Table D.5 Joint Frequency Table showing Hs against Tp for the location 266803E, 6821370S (profile
3) for the period 1998-2007.................................................................................................................118
Table D.6 Statistical analysis of the significant wave height for each year of simulation (1998-2007)
for the location 266803E, 6821370S (profile 3) ..................................................................................118
Figure D-3 Year Wave Roses for the location 266803E, 6821370S (profile 35) for the period 1998 –
2007 ....................................................................................................................................................119
Table D.7 Joint Frequency Table showing Hs against Tp for the location 266461E, 6822816S (profile
4) for the period 1998-2007.................................................................................................................120
Table D.8 Statistical analysis of the significant wave height for each year of simulation (1998-2007)
for the location 266461E, 6822816S (profile 4) ..................................................................................120
CITY OF GERALDTON-GREENOUGH
COASTAL PROCESSES STUDY - GREYS BEACH TO SUNSET BEACH
A PROJECT OF THE COASTAL VULNERABILITY AND RISK ASSESSMENT PROGRAM
\\perworfil1\infstruclib\projects\i01151 geraldton-greenough coastal process study\2.0 reports\i01151-00-cs-rep-001_rev1.doc
Page x 301012-01151 : Rev 1 : 16-Sep-10
Figure D-4 Year Wave Roses for the location 266461E, 6822816S (profile 4) for the period 1998 –
2007 ....................................................................................................................................................121
Table G.1 Sustainability Assessment of coastal Management Options .............................................136
APPENDICES
APPENDIX A: EROSION AND ACCRETION AREAS ALONG THE GERALDTON SHORELINE
(CITY OF GERALDTON GREENOUGH)
APPENDIX B: QUANTUM SURVEYS (2004-2009)
APPENDIX C: SAND BYPASSING (GERALDTON PORT AUTHORITY, PRE 2003 – 2010)
APPENDIX D: HINDCAST WAVE DATA
APPENDIX E: DOT COMPARISON OF MEASURED WAVE DATA AND HINDCAST WAVE DATA
APPENDIX F: INDICATIVE COST ESTIMATE FOR COASTAL PROTECTION OPTIONS
APPENDIX G: OUTCOMES OF THE SUSTAINABILITY ASSESSMENT OF COASTAL
MANAGEMENT OPTIONS WORKSHOP (CITY OF GERALDTON GREENOUGH)
APPENDIX H: PRESENTATION SLIDES OF THE SUSTAINABILITY ASSESSMENT OF COASTAL
MANAGEMENT OPTIONS WORKSHOP
CITY OF GERALDTON-GREENOUGH
COASTAL PROCESSES STUDY - GREYS BEACH TO SUNSET BEACH
A PROJECT OF THE COASTAL VULNERABILITY AND RISK ASSESSMENT PROGRAM
\\perworfil1\infstruclib\projects\i01151 geraldton-greenough coastal process study\2.0 reports\i01151-00-cs-rep-001_rev1.doc
Page 1 301012-01151 : Rev 1 : 16-Sep-10
EXECUTIVE SUMMARY
The City of Geraldton-Greenough commissioned WorleyParsons to undertake a coastal processes
study, which can be used to support decision making on the most appropriate techniques to manage
the coastal zone between Grey’s Beach in the south to Sunset Beach in the north. The aim of the
future coastal zone management is to maintain beach stability by implementing a preferred option for
coastal protection. The preferred management option needs to address the observed erosion whilst
maintaining amenities of the area and minimising the economic cost to the community.
The study approach is to:
Assess coastal sediment transport in the region
Discuss suitable coastal management methods
Propose coastal protection options
Propose recommendations for coastal management planning
Coastal Sediment Transport Assessment
The coastal dynamics of the region has been assessed following a review of historical studies in the
area and an analysis of the sediment budget. This has resulted in a number of key observations,
primarily as follows:
The section form Point Moore to Glenfield Beach is dynamic with significant seasonal and
annual variations
Town beach is relatively stable but is exposed to crosshore transport during storm events;
The section between the Batavia Coast Marina and the offshore breakwater has remained
stable with replenishment. North of the breakwater, erosion is observed. A long stretch of
shoreline (Mabel St to Chapman River) is relatively stable, slightly in accretion;
In the absence of stabilisation work, Grey’s Beach and Sunset Beach have been eroding.
Coastal Management Methods
In order to identify the developed areas likely to be at threat in the next 20 years, owing to the current
shoreline evolution and predicted climate changes, a methodology based on the State Coastal
Planning Policy (SCPP) has been applied to the study coastal zone. From the coastal vulnerability
assessment for the period considered (up to 2030), the areas identified where erosion is likely to
threaten existing assets include:
The section North of the detached breakwater
CITY OF GERALDTON-GREENOUGH
COASTAL PROCESSES STUDY - GREYS BEACH TO SUNSET BEACH
A PROJECT OF THE COASTAL VULNERABILITY AND RISK ASSESSMENT PROGRAM
\\perworfil1\infstruclib\projects\i01151 geraldton-greenough coastal process study\2.0 reports\i01151-00-cs-rep-001_rev1.doc
Page 2 301012-01151 : Rev 1 : 16-Sep-10
Sunset Beach
South of Chapman River (Frederick Street)
Grey’s Beach
The areas requiring Active Beach Monitoring to detect future threat to the existing development are:
The section between Elphick Avenue and Champion Bay Rise
The section in the area of Morris Street and Cecily Street.
Point Moore (along the Car Park)
Pages Beach
Town Beach
Over a longer timescale, from the coastal vulnerability assessment to 2110, the whole coastline is
predicted to be at threat in the next 100 years. Climate change and sea level rise have the very real
potential to have a significant impact on the Geraldton coast, affecting natural and cultural values,
infrastructure and built assets on private and public land. The response to climate change and sea
level rise needs to be both pro-active and reactive which involves actually responding to changes as
they occur.
In order to select the most appropriate coastal protection solution(s) for the area requiring beach
erosion management, a review of existing options has been proposed ranging from “Do Nothing” or
“Managed Recession” options to Beach Nourishment, Buried Seawall, Groynes, Detached
Breakwater Artificial Reefs or Beach Drainage System.
Coastal Protection Options
At Geraldton, beach renourishment in combination with supplementary coastal structures such as
groyne or buried seawalls to reduce the impacts of erosion processes and to provide a last line of
defence are all plausible solutions.
Coastal protection solutions have a significant impact on the social amenity of the beaches. As such,
the selection of an appropriate solution must include contribution from the local community. It is also
important that this process includes accurate technical and descriptive presentation of the behaviour
of the coastline in response to various solutions. As part of this study, the potential range of coastal
protection scenarios has been the subject of public presentation and consultation process. Main
outcomes from this workshop relate that the local community have preferences as follows:
To adopt a Managed Recession approach or Beach Nourishment options;
CITY OF GERALDTON-GREENOUGH
COASTAL PROCESSES STUDY - GREYS BEACH TO SUNSET BEACH
A PROJECT OF THE COASTAL VULNERABILITY AND RISK ASSESSMENT PROGRAM
\\perworfil1\infstruclib\projects\i01151 geraldton-greenough coastal process study\2.0 reports\i01151-00-cs-rep-001_rev1.doc
Page 3 301012-01151 : Rev 1 : 16-Sep-10
To avoid and/or minimise the construction of hard structures other than for the section north
of the detached breakwater.
A high level cost estimate and an estimate of Net Present Values (NPV) for different coastal
protection options revealed that along:
The Northern Beaches a coastal management strategy has to be maintained. The values of
coastal assets to be protected justify the implementation of a coastal structure based on a
buried seawall combined with a groyne and sand nourishment.
Sunset Beach, the “Managed Recession” option appears as expensive as a coastal
protection structure based on buried seawall combined with beach nourishment.
South of Chapman River, a buried seawall would be more economical than a “Do Nothing”
option while along the Grey’s Beach, a “Do Nothing” option would be the most economical.
After evaluation of coastal protection options, the use of a buried seawall with ongoing nourishment
and dune management offers a balanced solution with a high level of aesthetic outcome and
protection of coastal infrastructure; it would appear to meet most of the objectives of the working
group.
Recommendations for Coastal Management Planning
To maintain the targeted profile, an Annual Management Programme is suggested, involving Beach
Monitoring and an Active Beach Nourishment Programme through improvement of the current Sand
Bypassing Programme.
The implementation of coastal structures along specific areas can be made step by step. Feedback
from the Beach Monitoring Programme would allow assessment of the coastal protection influence
and adjustment of the Annual Management Programme accordingly. This will allow the City of
Geraldton-Greenough to maintain the targeted programme, and implement structures in the medium
term in line with these refined observations.
This approach also recognises the importance that once coastal structures are selected they do
become difficult to vary and therefore refinement of the preferred type, extent and shape should be
based on longer term monitoring and measurement. In fact, the refinement of the replenishment
programme may reduce dramatically the degree of the structures required, making the deferment of
the implementation of the structure of greater value whilst replenishment is optimised in line with the
short term programme.
CITY OF GERALDTON-GREENOUGH
COASTAL PROCESSES STUDY - GREYS BEACH TO SUNSET BEACH
A PROJECT OF THE COASTAL VULNERABILITY AND RISK ASSESSMENT PROGRAM
\\perworfil1\infstruclib\projects\i01151 geraldton-greenough coastal process study\2.0 reports\i01151-00-cs-rep-001_rev1.doc
Page 4 301012-01151 : Rev 1 : 16-Sep-10
1. INTRODUCTION & BACKGROUND
The City of Geraldton-Greenough commissioned WorleyParsons to undertake a coastal processes
study, which can be used to support decision making on the most appropriate techniques to manage
the coastal zone between Grey’s Beach in the south to Sunset Beach in the north.
This area of coastline is a dynamic area where coastal processes are a result of various physical
phenomena with waves being an important key driver. Longshore currents are generated by the
incident breaking waves and are responsible for the present and ongoing shoreline evolution. The
implementation of coastal protection solutions requires a sound understanding of the regional and
local coastal processes and this study works to:
Quantify the coastal processes;
Identify and assess protection options.
1.1 Key Partners
The key partners are the contributing organisations overseeing implementation of Coastal
Management Planning for the study area:
City of Geraldton-Greenough (CGG)
Geraldton Port Authority (GPA)
Department of Transport (DoT)
Northern Agricultural Catchments Council (NACC)
1.2 Study Area
The area along the Geraldton-Greenough shoreline is sheltered by a series of offshore reefs as
shown in Figure 1-1. The presence of these reefs implies the occurrence of complex wave
transformation processes nearshore such as wave breaking, diffraction and refraction and creation of
nearshore currents driving the sediment transport processes. At a large temporal and spatial scale,
these reefs are responsible for the creation of the Geraldton tombolo (Point Moore).
About 9 kilometres south of Geraldton and just north of the Greenough River mouth, a series of
inshore reefs works to reduce the magnitude of the longshore sediment transport. North of Champion
Bay (about 10 kilometres north of Geraldton), the tombolo shaped shoreline of Drummond is also
sheltered by inshore reefs. This section of shoreline from the Greenough River mouth to Drummond
(as shown in Figure 1-1) is therefore likely to belong to a large-scale sediment cell. Within this cell,
two secondary cells can be defined. The southern cell extends from the Greenough River mouth to
Point Moore. The northern cell extends from Point Moore to Drummond. The Greenough River and
the Chapman River act as sources of sediment in each cell. These two cells exchange sediment
through the boundary located at Point Moore, between Grey’s Beach and Pages Beach.
CITY OF GERALDTON-GREENOUGH
COASTAL PROCESSES STUDY - GREYS BEACH TO SUNSET BEACH
A PROJECT OF THE COASTAL VULNERABILITY AND RISK ASSESSMENT PROGRAM
\\perworfil1\infstruclib\projects\i01151 geraldton-greenough coastal process study\2.0 reports\i01151-00-cs-rep-001_rev1.doc
Page 5 301012-01151 : Rev 1 : 16-Sep-10
The study area extends from Grey’s Beach to Sunset Beach and includes Town Beach and the
Northern Beaches. Figure 1-2 presents this area.
1.3 Beaches within the Study Area
Grey’s beach is located along the John Willcock Link, on the Southern part of the Geraldton tombolo.
It consists of a sandy beach backed by a small dune. The sea floor is mainly sandy with some
patches of seagrass.
Point Moore and Explosive Beach form the western part of the Geraldton tombolo. The area is
bounded inland by John Willcock Link and includes coastal reserves. The nearshore area is a
complex system of exposed reefs and deeper channels under 0 to 10 metres of water. The beaches
are large sandy beaches.
Pages Beach extends from Point Moore to the southern breakwater of the Geraldton Port and
consists of a relatively flat sandy beach. The sea floor is mainly sandy with some patches of
seagrass.
The Town Beach section consists of an artificial sandy beach with a gentle slope towards the
waterline and a sandy seafloor. This section has recently been redeveloped to offer a recreational
area along the foreshore.
North of the Batavia Coast Marina, the Northern beaches are short sandy beaches with a sea floor
mainly composed of reefs with patches of sand or seagrass. The beaches are backed by low dunes
of around 1 to 4 metres height and/or are bordered by a thin vegetation line in front of man-made
areas including paths, shelters and grassed areas.
North of the Chapman River, Sunset Beach is characterized by a 10 to 15 metre wide sandy beach
which is backed by dunes of around 6 to 8 metres height. The seafloor is characterized by reefs
covered by scattered seagrass and patches of sand.
1.4 Background
The Point Moore reef system has caused the formation of the Geraldton Tombolo. The reefs, together
with the expansion of the Geraldton Port over the last 60 years and the development of the Batavia
Coast Marina, are responsible for driving significant movement of sand along the coast of Champion
Bay. During recent years, acute erosion in certain areas (as shown in Figure A) has become more
pronounced and frequent. These areas can become quickly degraded especially during episodic
winter storms.
Historic movement of the coastline since 1942 was assessed using shoreline positions obtained from
aerial photos. As the waterline is dependent on the oceanographic conditions (wave height and wave
setup, tide level, etc) it is recommended to use the vegetation line as a reference for the shoreline
position (State Coastal Planning Policy 2.6). This method, using controlled photogrammetry, is limited
CITY OF GERALDTON-GREENOUGH
COASTAL PROCESSES STUDY - GREYS BEACH TO SUNSET BEACH
A PROJECT OF THE COASTAL VULNERABILITY AND RISK ASSESSMENT PROGRAM
\\perworfil1\infstruclib\projects\i01151 geraldton-greenough coastal process study\2.0 reports\i01151-00-cs-rep-001_rev1.doc
Page 6 301012-01151 : Rev 1 : 16-Sep-10
in accuracy (+/- 5 meters). However, the general trend of the shoreline evolution can be obtained from
analysis of the data over suitably long time periods. It is feasible to estimate the rate of evolution,
especially along the eroding sections of coast. The variations of sediment volume of the beaches can
also be evaluated in order to assess the sediment transport along the coast.
Numerical modelling studies were undertaken by CES (2001a) to evaluate the impact of the Port
Enhancement Project (PEP). The wave propagation within Champion Bay was simulated for various
cases and the sediment transport estimated using the wave characteristics along the coast. The aim
was to determine the effects of deepening and widening the shipping channel and extending the
northern breakwater on the current sediment dynamics of the bay. The study concluded that the PEP
would result in more wave energy striking the coast from the west at some 100 to 200 metres north of
the Batavia Coast Marina and at the beach south of Chapman River. The presence of the port
structure would contribute to a deficit of sand on the northern beaches. The ongoing erosion of these
beaches has warranted the need for some intervention and the creation of the proposed framework
for coastal protection.
1.5 Data Available and the Northern Beaches Stabilisation Programme
The Northern Beaches Stabilisation Programme (NBSP) was developed in 2004 through agreement
from a joint agency working group with representation from the City of Geraldton, Geraldton Port
Authority, Department for Planning and Infrastructure and the Department of Environment with
technical support from MP Rogers and Associates and URS Australia. It aims to provide a long term
stable foreshore through replacing the natural littoral drift of sand blocked by the Port and the Batavia
Coast Marina structures via sand bypassing processes and stabilisation works. Requirements from
the NBSP include, in particular, beach monitoring, referred as Quantum Surveys hereinafter.
This study aims to incorporate the latest data (to April 2010) made available by the Northern Beaches
Stabilisation Programme. This includes historical shoreline position from aerial photos and survey
data. Shoreline movements from recent years provide information on sediment transport for Grey’s
Beach, Point Moore, Explosive Beach and north of the Chapman River while the survey data provides
information on sediment transport and volume evolution for Pages Beach, Town Beach and Northern
Beaches. The period covered by this survey is from 2004 to 2009.
The study shoreline has been divided into sections for the purposes of this study. These sections
refer to the characteristics of the shoreline evolution and/or the locations of the sand
removal/nourishment. Table 1.1 presents the link between the sections and the transects. Transect
names refer to the Quantum Survey denomination. Figure 1-2 presents the beach section areas and
Figure B-1 the related transects.
For Pages Beach, transects P5 and P6 or section SP2 correspond to the area from which the sand is
generally removed for sand bypassing purposes.
CITY OF GERALDTON-GREENOUGH
COASTAL PROCESSES STUDY - GREYS BEACH TO SUNSET BEACH
A PROJECT OF THE COASTAL VULNERABILITY AND RISK ASSESSMENT PROGRAM
\\perworfil1\infstruclib\projects\i01151 geraldton-greenough coastal process study\2.0 reports\i01151-00-cs-rep-001_rev1.doc
Page 7 301012-01151 : Rev 1 : 16-Sep-10
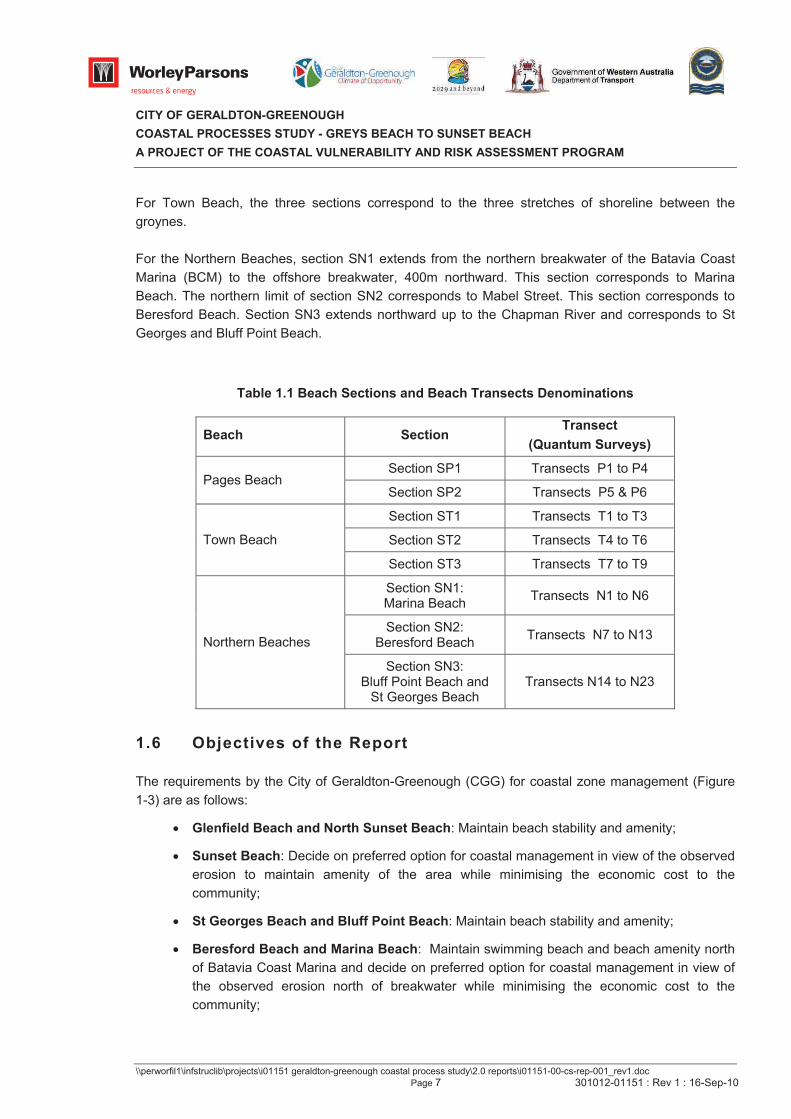
For Town Beach, the three sections correspond to the three stretches of shoreline between the
groynes.
For the Northern Beaches, section SN1 extends from the northern breakwater of the Batavia Coast
Marina (BCM) to the offshore breakwater, 400m northward. This section corresponds to Marina
Beach. The northern limit of section SN2 corresponds to Mabel Street. This section corresponds to
Beresford Beach. Section SN3 extends northward up to the Chapman River and corresponds to St
Georges and Bluff Point Beach.
Table 1.1 Beach Sections and Beach Transects Denominations
Beach Section Transect
(Quantum Surveys)
Section SP1 Transects P1 to P4Pages Beach
Section SP2 Transects P5 & P6
Section ST1 Transects T1 to T3
Section ST2 Transects T4 to T6 Town Beach
Section ST3 Transects T7 to T9
Section SN1: Marina Beach
Transects N1 to N6
Section SN2:Beresford Beach
Transects N7 to N13 Northern Beaches
Section SN3: Bluff Point Beach and
St Georges Beach Transects N14 to N23
1.6 Objectives of the Report
The requirements by the City of Geraldton-Greenough (CGG) for coastal zone management (Figure
1-3) are as follows:
Glenfield Beach and North Sunset Beach: Maintain beach stability and amenity;
Sunset Beach: Decide on preferred option for coastal management in view of the observed
erosion to maintain amenity of the area while minimising the economic cost to the
community;
St Georges Beach and Bluff Point Beach: Maintain beach stability and amenity;
Beresford Beach and Marina Beach: Maintain swimming beach and beach amenity north
of Batavia Coast Marina and decide on preferred option for coastal management in view of
the observed erosion north of breakwater while minimising the economic cost to the
community;
CITY OF GERALDTON-GREENOUGH
COASTAL PROCESSES STUDY - GREYS BEACH TO SUNSET BEACH
A PROJECT OF THE COASTAL VULNERABILITY AND RISK ASSESSMENT PROGRAM
\\perworfil1\infstruclib\projects\i01151 geraldton-greenough coastal process study\2.0 reports\i01151-00-cs-rep-001_rev1.doc
Page 8 301012-01151 : Rev 1 : 16-Sep-10
Town Beach: Maintain swimming beach and beach amenity and decide on preferred option
for coastal management in view of the observed erosion while minimising the economic cost
to the community;
Pages Beach: Maintain beach stability and beach amenity and sediment bypassing source;
Explosive Beach and Point Moore: Maintain beach stability and beach amenity;
Grey’s Beach: Decide on preferred option for coastal management in view of the observed
erosion to maintain amenity of the area while minimising the economic cost to the
community.
This study aims to contribute to a better understanding of the coastal processes in order to propose
adequate coastal management solutions according to the CGG objectives.
The performance and effectiveness of various coastal management solutions have been discussed to
best support decision making on the most appropriate techniques to manage the coastal zone
between Grey’s Beach to Sunset Beach. This report addresses the areas as identified below to
support the decision making processes:
Coastal Sediment Transport Assessment: using information from a review of the previous
studies, a desktop study has been undertaken based on available data and implementing a
numerical study to assess the longshore sediment transport, the sediment budget along the
Geraldton Coastline has been estimated;
Coastal Management Methods: after considering the impact of recent foreshore development
and current coastal managing policy in Geraldton, and assessing the coastal setback
distances for a 20 year timeframe and a 100 year timeframe, a review of available coastal
protection options has been carried out;
Discussion on Coastal Protection Options: Results of the Coastal Sediment Transport
Assessment and outcomes from the Coastal Management Methods have been discussed to
propose adequate coastal protection options. A workshop was held on 24 March 2010 in
Geraldton to present these options to seek public comments and feedback on preferred
solutions. The outcomes from these presentations were the basis of the assessment of the
social acceptance of the various options;
Recommendations for Coastal Management Planning: recommendations have been
presented on both short term and medium term consideration in order to implement the
current coastal management planning of the Geraldton shoreline.
CITY OF GERALDTON-GREENOUGH
COASTAL PROCESSES STUDY - GREYS BEACH TO SUNSET BEACH
A PROJECT OF THE COASTAL VULNERABILITY AND RISK ASSESSMENT PROGRAM
\\perworfil1\infstruclib\projects\i01151 geraldton-greenough coastal process study\2.0 reports\i01151-00-cs-rep-001_rev1.doc
Page 9 301012-01151 : Rev 1 : 16-Sep-10
2. COASTAL SEDIMENT TRANSPORT ASSESSMENT
2.1 Contribution from Other Studies
PAGES BEACH
Existing studies indicate that Pages Beach has been significantly in accretion since 1942. The coastal
vegetation line has moved seaward by more than 100 metres over the past 50 years, depositing a
large amount of sediment south of the Harbour.
There have been investigations into the sediment dynamics of the coast from the Port to Separation
Point; MRA (1994 and 1996) indicate that in the period between 1942 and 1992 there has been about
20,000 to 30,000 m3/year (cubic metres per year) of sand trapped in the area from the Port to
Separation Point. This sand appears to have been transported from the beaches and reefs to the
south, as well as some derived from the seagrass meadows and on the reefs in the area. MRA (2001)
has estimated that the annual average rate of accumulation varies from about 18,000 m3/year to
28,000 m3/year.
In recent times, the Geraldton Port Authority has extracted some of the accumulated sand at Pages
Beach for use as reclamation and nourishment of the Northern Beaches.
NORTHERN BEACHES
Studies relating to the Northern Beaches indicate that this stretch of shoreline from the Batavia Coast
Marina to the Chapman River has been relatively stable or slightly in erosion since 1942. However, it
has been demonstrated that implementation of coastal development has influenced the sediment
transport along Champion Bay. These structures are likely to have limited the natural rate of sand
feeding the Northern Beaches to about 10,000 m3/year to 15,000 m
3/year (CES 2001) and are
believed to be responsible of the increase of erosion observed recently at certain locations (as shown
in Figure A)
Over recent years, a large amount of sand was placed along the northern beaches. For the period
1991 to 2001, 30,000 m3 to 50,000 m
3 of sand (MRA, 2001) were used for renourishment. This
contributed to maintain the shoreline at a relatively stable position.
As part of the Geraldton Northern Foreshore Stabilisation and Enhancement Strategy, a nourishment
of 89,000 m3 of sand was undertaken in 2004. This sand was sourced from the Southern Transport
Corridor project (STC sand). A survey of the nourished beach was carried out during the following
four months and an average northward sediment transport of 50,000 m3/year has been estimated
(Bailey, 2005)
In late 2005, a detached breakwater located about 400m north of BCM was constructed in order to
reduce the sediment transport, protect the foreshore from storm events and stabilise the shoreline.
CITY OF GERALDTON-GREENOUGH
COASTAL PROCESSES STUDY - GREYS BEACH TO SUNSET BEACH
A PROJECT OF THE COASTAL VULNERABILITY AND RISK ASSESSMENT PROGRAM
\\perworfil1\infstruclib\projects\i01151 geraldton-greenough coastal process study\2.0 reports\i01151-00-cs-rep-001_rev1.doc
Page 10 301012-01151 : Rev 1 : 16-Sep-10
NORTH OF THE CHAPMAN R IVER
The studies of the aerial photos have shown that Sunset Beach, located north of the Chapman River,
has experienced significant erosion since 1942. MRA (2003) estimated the rate of shoreline recession
along Sunset Beach to be 0.5 m/year to 0.69 m/year on average. However, most of the erosion
activity occurred between 1942 and 1980.
North of Sunset Beach the shoreline has been relatively stable or in accretion. From 1988 to 2000,
the rate of accretion has been estimated to be 0.5 m/year.
DYNAMICS OF THE CHAPMAN R IVER MOUTH
The Chapman River mouth generally has a sand spit blocking the river from the ocean. The river flow
discharge varies annually. The mouth is likely to open every year between May and August (MRA,
2003). At the time of opening, it has been estimated that between 3,000 m3/year and 16,000 m
3/year
of sand can be lost. This loss of sand from the Chapman River mouth is likely to impact on the
adjacent shoreline. The sand transported offshore is deposited and forms a sand bar and a quantity
of sand is likely to be redistributed along the shoreline by the longshore transport. Both phenomena
contribute to the Chapman river mouth closure. The amount of sediment likely to be lost during a
flooding event has been estimated to be 13,000 m3/year on average. However, the quantity of sand
redistributed along the coast remains unknown.
Table 2.1 presents the records of the annual total stream discharge volume of the Chapman River for
several years. In 2006 and 2007 the discharge was almost nil. For the other years, this discharge is
relatively constant with an average of about 4,000 Megalitres per year.
Table 2.1 Stream Discharge Volume for the Chapman River (Utakarra station, source
Department of Water)
Year Annual total (MegaLitres per year)
2004 3,125
2005 4,201
2006 125
2007 30
2008 5,013
CITY OF GERALDTON-GREENOUGH
COASTAL PROCESSES STUDY - GREYS BEACH TO SUNSET BEACH
A PROJECT OF THE COASTAL VULNERABILITY AND RISK ASSESSMENT PROGRAM
\\perworfil1\infstruclib\projects\i01151 geraldton-greenough coastal process study\2.0 reports\i01151-00-cs-rep-001_rev1.doc
Page 11 301012-01151 : Rev 1 : 16-Sep-10
2.2 Desktop Study
2.2.1 Sand Bypassing Programme
As part of the Northern Beaches Stabilisation Programme (NBSP), the Geraldton Port Authority
(GPA) has to provide a certain amount of beach sand for nourishment purposes in order to maintain
long-term shoreline stability. This sand is primarily sourced at the extreme eastern end of Pages
Beach. The GPA has to contribute an annual quantity of 12,500 banked m3/year of sand.
Table C.1 presents the origin, destination and volume of sand, which has been used for sand
nourishment since 2003 (source: Geraldton Port Authority – June 2010). Table 2.2, Table 2.3 and
Table 2.4 show the volumes of sand respectively removed along Pages Beach and distributed along
Town Beach and the Northern Beaches. Periods have been defined to correspond with the date the
beach surveys were carried out.
Since July 2003, the GPA has contributed to the sand bypassing program by extracting around
16,000 m3/year on average from Pages Beach (10,500 m
3 since March 2004) and depositing around
and 750 m3/year on average along Town Beach (800 m
3 since March 2004) and around 15,000
m3/year on average along the Northern Beaches (11,500 m
3 since March 2004). The remaining
quantities of extracted sand were used for new reclaim access tracks and the additional quantities of
deposited sand were STC sand.
Table 2.2 Sand Extraction along Pages Beach (volumes in m3)
Period
\
Position
07/2003 03/2004
03/2004 09/2004
09/2004 03/2005
03/2005 09/2005
09/2005 03/2006
03/2006 09/2006
09/2006 09/2007
09/2007 11/2009
11/2009 05/2010
07/2003 05/2010
Section
SP225,836 848 4,356 - - 14,328 8,658 25,944 13,207 93,177
Table 2.3 Sand Distributed along Town Beach (volumes in m3)
Period
\
Position
07/2003 03/2004
03/2004 09/2004
09/2004 03/2005
03/2005 09/2005
09/2005 03/2006
03/2006 09/2006
09/2006 09/2007
09/2007 11/2009
11/2009 05/2010
07/2003 05/2010
Section
ST2- - - - - - - 4290 - 4290
CITY OF GERALDTON-GREENOUGH
COASTAL PROCESSES STUDY - GREYS BEACH TO SUNSET BEACH
A PROJECT OF THE COASTAL VULNERABILITY AND RISK ASSESSMENT PROGRAM
\\perworfil1\infstruclib\projects\i01151 geraldton-greenough coastal process study\2.0 reports\i01151-00-cs-rep-001_rev1.doc
Page 12 301012-01151 : Rev 1 : 16-Sep-10
Table 2.4 Sand Distributed along Northern Beaches (volumes in m3)
Period
\
Position
07/2003 03/2004
03/2004 09/2004
09/2004 03/2005
03/2005 09/2005
09/2005 03/2006
03/2006 09/2006
09/2006 09/2007
09/2007 11/2009
11/2009 05/2010
07/2003 05/2010
Section SN1 10,784 2,790 4,356 - - 14,328 8,658 24,733 6,381 72,030
Section SN2 5,608 2,790 - - - - - - 6,826 15,224
Section SN3 244 283 - - - - - 2,110 - 2,637
Total 16,636 5,863 4,356 - - 14,328 8,658 26,843 13,207 89,891
2.2.2 Beach Profile Monitoring
Since March 2004 Quantum Surveys Pty Ltd has been undertaking cross section surveys of the
shoreline from Pages Beach north to the Chapman River mouth, including Town Beach. This involves
a series of surveyed lines starting from above the beach and extending into the water to a level of
approximately –1 m CD (Geraldton Port Datum). The surveys have been conducted on a bi annual
basis for the period March 2004 to September 2006. Two additional surveys were carried out in
September 2007 and November 2009. The surveys have been undertaken generally one to two
weeks after beach nourishment. Selected survey results are presented in Appendix B. Figure B-1
shows the location of the profiles at which the surveys have been performed.
Data processing of these surveys has been undertaken in order to evaluate the evolution of the
shoreline of the study area. The variations in volume (compared to the volume reference of March
2004) have been calculated for each surveyed profile. Results of this analysis are presented for
Pages Beach, Town Beach and the Northern Beaches.
PAGES BEACH
Surveys have been undertaken along six profiles, referred as P1 to P6 in Figure B-1. The beach has
been significantly in accretion over the last five years (2004 to 2009). The rate of accretion is
relatively consistent along the beach; the surveys showing a similar behaviour of the beach for each
profile. As an example, Figure B-2 presents a plot of the data along profile P5.
Analysis of the volume evolution, compared to the volume in March 2004, is presented in Figure 2-1.
Section SP1 (blue line) has been in constant accretion since 2004. Although the sand used for the
sand bypassing has been removed from Section SP2, the volume of this section of Pages Beach (red
line) has been increasing for the past 5 years, except for the period March to September 2005.
Overall, the total volume of Pages Beach has increased by about 33,000 m3.
CITY OF GERALDTON-GREENOUGH
COASTAL PROCESSES STUDY - GREYS BEACH TO SUNSET BEACH
A PROJECT OF THE COASTAL VULNERABILITY AND RISK ASSESSMENT PROGRAM
\\perworfil1\infstruclib\projects\i01151 geraldton-greenough coastal process study\2.0 reports\i01151-00-cs-rep-001_rev1.doc
Page 13 301012-01151 : Rev 1 : 16-Sep-10
The total volume of sand extracted from section SP2 since March 2004 is about 65,000 m3 or, on
average, 10,500 m3/year. The results of this survey data analysis indicate that the volume of sand
extracted each year from Pages Beach could be increased up to 17,000 m3/year and has still no
effect in the stability of Pages beach.
TOWN BEACH
Surveys have been undertaken along nine profiles, referred to as T1 to T9 in Figure B-1. Three
sections were defined.
After a period of volume reduction the beach has been relatively stable over the last 3 years (2006 to
2009). The surveys show a similar behaviour of the beach for each profile. As an example, Figure B-
3 presents a plot of the data along profile T6.
Analysis of the volume evolution, compared to the volume in March 2004, is presented in Figure 2-2.
The three sections ST1, ST2 and ST3, represented by the blue, red and grey line respectively, have
been stable since September 2005 after adjustment of the beach profiles. No significant change in
volume can be noticed since then. This reveals the absence of longshore sediment transport and
exchange between the three sections in stability.
The total reduction of sand over 5 years is about 14,800 m3. However since September 2005, the
reduction of sand is about 2,400 m3. On average, the net rate of erosion is about 1,500 m
3/year.
In 2009, sand nourishment of 4,290 m3 was provided to regenerate a buffer area against storm
erosion. Information from the CGG indicates that beach nourishment has been undertaken in the
recent years. In 2009, an additional volume of about 5,000 m3
of sand was used for nourishment.
While the three groynes were designed to stabilize the artificial beach of Town Beach, unanticipated
rip cells transporting sediment offshore could be at the origin of this lose of sand. The Quantum
surveys do not reveal the presence of offshore bars but these surveys only extend to a maximum
depth of 1 metre.
NORTHERN BEACHES
Surveys have been undertaken since 2004 along 23 profiles by Quantum Surveys, referred to as N1
to N23 in Figure B-1. The shoreline has been divided into three sections (Figure 1-2). It is reminded
that section SN1 corresponds to Marina Beach, section SN2 corresponds to Beresford Beach and
section SN3 corresponds to St Georges and Bluff Point Beach.
Figure 2-3 presents the evolution of the beach volume for each of the three sections compared to the
beach volume in March 2004.
The shoreline evolution for Section SN1 is represented by the blue line in Figure 2-3. This section
(from BCM to the offshore breakwater) in 2004 held a reference volume of 89,000 m3 and since then
the beach has been regularly eroding until the construction of the offshore breakwater in October
CITY OF GERALDTON-GREENOUGH
COASTAL PROCESSES STUDY - GREYS BEACH TO SUNSET BEACH
A PROJECT OF THE COASTAL VULNERABILITY AND RISK ASSESSMENT PROGRAM
\\perworfil1\infstruclib\projects\i01151 geraldton-greenough coastal process study\2.0 reports\i01151-00-cs-rep-001_rev1.doc
Page 14 301012-01151 : Rev 1 : 16-Sep-10
2005. In addition to this coastal structure, sand nourishments have been undertaken in order to retain
the beach width; the total amount of sediment deposited until November 2009 is about 47,000 m3.
Such efforts have enabled maintaining the profiles to the current position and the beach has remained
relatively stable since (small variation of 2000 m3/year).
The volume variations of the second section SN2 (from the breakwater to Mabel Street) is presented
in Figure 2-3 (red line). The shoreline had been in accretion for the period March 2004 to September
2006. This is explained by a northward longshore transport of sediment from the section SN1. It was
estimated that more than 38,000 m3 of sand was shifted north per year (Figure 2-5). This value
corresponds to the 50,000 m3/year estimated from another survey (Bailey, 2005). After the
construction of the offshore breakwater, the amount of sand transported along the coast was reduced
and the volume of the beach has been continuously decreasing. Despite nourishment (about 9,000
m3 of sand over five years), the beach is now at the same position as in 2004; for this section the
beach profiles in November 2009 match the beach profile in March 2004. However, the volume
variations since September 2007 have been relatively small (decrease of 2,400 m3/year).
Section SN3 extends northward up to the Chapman River. The green line in Figure 2-3 represents its
volume variations. This section had been accreting irregularly since September 2004 to reach a
volume increase of 54,000 m3 in September 2007. This volume increase is likely to be due to a
northward littoral drift. The volume has been slightly decreasing (1,000 m3/year) despite a sand
nourishment along the profiles 13 and 14. Moreover, the data shows seasonal variations for the
period 2004 to 2006: the volume increases in winter and decreases in summer (Figure 2-5).
The variations of the total volume of sand along the three sections of the Northern Beaches are
shown in Figure 2-3 (black line). The quantity of sand lost along the Northern Beaches was estimated
to be about 20,000 m3 since September 2004 despite 60,000 m
3 of sand deposed for nourishment
during the same period (pink line in Figure 2-3).
The Mean Sea Level lines (MSL, 0.847m AHD) were extracted from the profile survey data and are
presented in Figure 2-4. The blue line and the red line represent the MSL for March 2004 and
November 2009 respectively. The graph illustrates the impact of the offshore breakwater on the
beach stabilisation by sheltering the beach and reducing the longshore sediment transport in section
SN1. However, a strong sediment transport has affected the beach in Section SN2. One can observe
a northward displacement of the volume of sand just north of the breakwater.
The sand discharged from the Chapman River during a flooding event in winter is likely to be at the
origin of the accretion observed along the northern part of the section SN3. Due to a lack of
information relative to the sediment transport processes during a flooding event, this assumption can
not be confirmed at this stage.
Figure 2-5 presents an estimate of the sediment transport across the sections. Positive values are for
northward transport. The blue line and the red line represent the sediment transport across sections
SN1 and SN2 and across section SN2 and SN3 respectively. Just after the nourishment of 89,000 m3
in 2004, an important quantity of sand had been transported northward. It was calculated that an
average of 30,000 m3/year to 40,000 m
3/year has drifted from section SN1 to SN2 and has probably

CITY OF GERALDTON-GREENOUGH
COASTAL PROCESSES STUDY - GREYS BEACH TO SUNSET BEACH
A PROJECT OF THE COASTAL VULNERABILITY AND RISK ASSESSMENT PROGRAM
\\perworfil1\infstruclib\projects\i01151 geraldton-greenough coastal process study\2.0 reports\i01151-00-cs-rep-001_rev1.doc
Page 15 301012-01151 : Rev 1 : 16-Sep-10
deposited along SN2. Since the construction of the offshore breakwater, the volume transported has
been reduced to 5,000 m3/year to 19,000 m
3/year. This range of values is consistent with the
predicted volume of 10,000 m3/year for which the breakwater was designed (MRA, 2002 and WP,
2004). However, because of the breakwater’s presence, the volume of sediment transported between
the sections SN2 and SN3 increased between September 2005 and September 2006 from 13,000
m3/year to 36,000 m
3/year. This rate rapidly decreased down to 16,000 m
3/year as the quantity of
sediment available along the beach rapidly decreased.
The volume of sediment crossing the boundaries of the section SN3 is indicated in Figure 2-5 (grey
dashed line). There is an important seasonal variation of the sediment transport along this profile. On
an annual average, the sediment transport is northward. Since the construction of the breakwater, this
volume variation has been reduced from 50,000 m3/year to 19,000 m
3/year.
2.2.3 Shoreline Long Term Evolution
Due to a lack of information from the previous studies concerning the northern part of the shoreline of
Champion Bay and Grey’s Beach, an analysis of the vegetation line evolution has been undertaken. It
should be noted that a general trend of the shoreline evolution can be assessed through this method
but its accuracy is limited.
NORTHERN PART OF CHAMPION BAY
The shoreline positions from 1942 to 2007 were analysed. Figure 2-6 shows the relative crosshore
position of vegetation lines compared to the shoreline position in 2000 for different years. It shows
that the shoreline sections on both sides of the Chapman River have been subject to significant
evolution since 1942; from 40m seaward to 21m landward. This indicates the naturally occurring
longshore sediment gradients together with coastal development and the influences of the Chapman
River are having a significant impact on the shoreline evolution over the whole of Champion Bay.
Importantly this demonstrates the need to look at the whole Bay as one unit.
Sunset Beach, just north of the river mouth is affected by the Chapman River flooding events. This
beach has been largely eroded since 1942, especially the southern part. While the beach seems to
have recovered from 1980 to 2000, in only four years the beach had been eroded again from 8 to 20
metres.
North Sunset Beach has also been eroding since 1942 but at a slower rate. Several dune blowouts
can be found along this beach. The most important is located between the longshore positions 5500m
and 6000m. These geological formations contribute to the beach erosion phenomena.
Along the northern part of Champion Bay, Glenfield Beach, located between North Sunset Beach and
Drummond Point, has accreted since 1942 and seems to be relatively stable since 2000, although
slight erosion has taken place in recent years.
Table 2.5 presents the volumetric erosion or accretion rates for the three beaches.
CITY OF GERALDTON-GREENOUGH
COASTAL PROCESSES STUDY - GREYS BEACH TO SUNSET BEACH
A PROJECT OF THE COASTAL VULNERABILITY AND RISK ASSESSMENT PROGRAM
\\perworfil1\infstruclib\projects\i01151 geraldton-greenough coastal process study\2.0 reports\i01151-00-cs-rep-001_rev1.doc
Page 16 301012-01151 : Rev 1 : 16-Sep-10
Table 2.5 Volumetric accretion / erosion rates
Beach section Rate (m3/year)
Glenfield Beach -6,000 to 5,000
North Sunset Beach -6,000 to 1,000
Sunset Beach -6,000 to 2,000
Total -10,000 to 0
EXPLOSIVE BEACH
The shoreline positions from 1942 to 2007 were analysed. Figure 2-7 shows the relative crosshore
position of vegetation lines compared to the shoreline position in 1942 for different years. The
longshore distance is measured from the groyne located along the western edge of Pages Beach up
to the eastern limit of Grey’s Beach.
The analysis shows that the shoreline was in accretion between 1942 and 1988. The shoreline has
been relatively stable along the beach since 1988.
POINT MOORE
The shoreline positions from 1942 to 2007 were analysed. Figure 2-7 shows the relative crosshore
position of vegetation lines compared to the shoreline position in 1942 for different years. The
longshore distance is measured from the groyne located along the western edge of Pages Beach the
up to the eastern limit of Grey’s Beach.
The analysis shows that the shoreline was in accretion between 1942 and 1992. Since 1992, the
shoreline has been variable with a net recession between 1992 and 1997, accretion between 1997
and 2007, and with a position in 2007 similar to 1992.
GREY ’S BEACH
The shoreline positions from 1942 to 2007 were analysed. Figure 2-7 shows the relative crosshore
position of vegetation lines compared to the shoreline position in 1992 for different years. The
longshore distance is measured from the western limit of Grey’s Beach (the 0 m location
corresponding to Point Moore). It shows that the shoreline has been receding between the longshore
positions 0 metre to 800 metres. From the longshore position 800 metre to Separation Point, the
shoreline has been accreting.
John Willcock Link is located along the eroding section of Grey’s Beach shoreline. The minimum
distance between the road and the vegetation line is 18 metres. Moreover, there is no longer a
buffering area between the beach and the car park. At the car park location, it was estimated that the
CITY OF GERALDTON-GREENOUGH
COASTAL PROCESSES STUDY - GREYS BEACH TO SUNSET BEACH
A PROJECT OF THE COASTAL VULNERABILITY AND RISK ASSESSMENT PROGRAM
\\perworfil1\infstruclib\projects\i01151 geraldton-greenough coastal process study\2.0 reports\i01151-00-cs-rep-001_rev1.doc
Page 17 301012-01151 : Rev 1 : 16-Sep-10
long term rate (since 1942) of erosion is about 0.4 m/year, and the rate of erosion for the period 1992
to 2007 is about 1.5 m/year. Along the eroding section of Grey’s Beach, the long term rate of erosion
is on average about 0.2 m/year. The erosion over the recent years (1992-2007) ranges between 0.3
m/year and 1.1 m/year and is on average about 0.6 m/year. Considering an active beach height of 4
metres, an estimate of the annual volume eroded is 800 m3/year on a long term trend and 2,000
m3/year during the recent years. Over the last two years (2008 and 2009), the need for nourishment
of about 6,000 m3 to 7,000 m
3 confirms this recent erosion trend.
2.3 Wave Climate Assessment
Waves are an important driver of coastal processes and sediment transport. Sediment can be stirred
up by the breaking waves, making it available for movements. Longshore currents are also generated
by the breaking waves. Longshore sediment transport is strongly dependent on wave period, wave
height and the angle at which the wave breaks relative to the seabed contours (Figure 2-13).
2.3.1 MIKE21SW Modelling
MODEL DESCRIPTION
To adequately predict longshore sediment movement, the wave climate has been numerically
modelled on a regional scale (Indian Ocean Model) and a refined scale. The MIKE21 Spectral Wave
(SW) module, developed by the Danish Hydraulic Institute (DHI), has been used for the wave
modelling. The wave transformation has been calculated using the MIKE21 SW model, which
represents the state of the art in wave spectrum transformation modelling. MIKE21 SW includes a
spectral wind-wave model and simulates the growth, decay and transformation of wind-generated
waves and swell in offshore and coastal areas. This model takes into account effects of refraction,
diffraction and wave breaking.
REFINED SCALE MODEL DOMAIN AND BATHYMETRY
The refined scale model has been set up covering the area between Jurien Bay and Kalbarri and
extending approximately 100km offshore. The refined model domain and bathymetry are shown in
Figure 2-9 and Figure 2-10.
MODEL SETUP
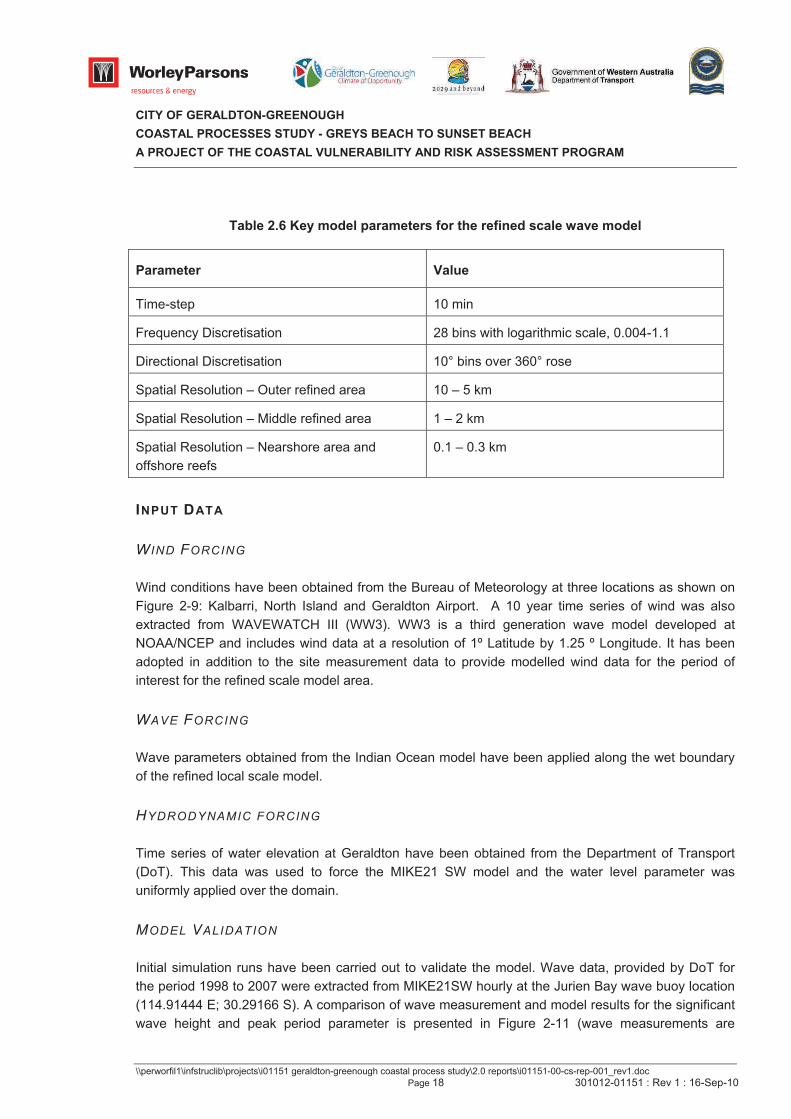
Key model parameters are presented in Table 2.6.
CITY OF GERALDTON-GREENOUGH
COASTAL PROCESSES STUDY - GREYS BEACH TO SUNSET BEACH
A PROJECT OF THE COASTAL VULNERABILITY AND RISK ASSESSMENT PROGRAM
\\perworfil1\infstruclib\projects\i01151 geraldton-greenough coastal process study\2.0 reports\i01151-00-cs-rep-001_rev1.doc
Page 18 301012-01151 : Rev 1 : 16-Sep-10
Table 2.6 Key model parameters for the refined scale wave model
Parameter Value
Time-step 10 min
Frequency Discretisation 28 bins with logarithmic scale, 0.004-1.1
Directional Discretisation 10° bins over 360° rose
Spatial Resolution – Outer refined area 10 – 5 km
Spatial Resolution – Middle refined area 1 – 2 km
Spatial Resolution – Nearshore area and
offshore reefs
0.1 – 0.3 km
INPUT DATA
W IND FORCING
Wind conditions have been obtained from the Bureau of Meteorology at three locations as shown on
Figure 2-9: Kalbarri, North Island and Geraldton Airport. A 10 year time series of wind was also
extracted from WAVEWATCH III (WW3). WW3 is a third generation wave model developed at
NOAA/NCEP and includes wind data at a resolution of 1º Latitude by 1.25 º Longitude. It has been
adopted in addition to the site measurement data to provide modelled wind data for the period of
interest for the refined scale model area.
WAVE FORCING
Wave parameters obtained from the Indian Ocean model have been applied along the wet boundary
of the refined local scale model.
HYDRODYNAMIC FORCING
Time series of water elevation at Geraldton have been obtained from the Department of Transport
(DoT). This data was used to force the MIKE21 SW model and the water level parameter was
uniformly applied over the domain.
MODEL VALIDATION
Initial simulation runs have been carried out to validate the model. Wave data, provided by DoT for
the period 1998 to 2007 were extracted from MIKE21SW hourly at the Jurien Bay wave buoy location
(114.91444 E; 30.29166 S). A comparison of wave measurement and model results for the significant
wave height and peak period parameter is presented in Figure 2-11 (wave measurements are
CITY OF GERALDTON-GREENOUGH
COASTAL PROCESSES STUDY - GREYS BEACH TO SUNSET BEACH
A PROJECT OF THE COASTAL VULNERABILITY AND RISK ASSESSMENT PROGRAM
\\perworfil1\infstruclib\projects\i01151 geraldton-greenough coastal process study\2.0 reports\i01151-00-cs-rep-001_rev1.doc
Page 19 301012-01151 : Rev 1 : 16-Sep-10
represented by the black lines and the model results are represented by the red lines).This shows
good agreement between the modelled data and the measured data.
As requested by DoT, wave data have also been extracted at four points in the area along the
Geraldton Port entrance channel (Figure 2-10). This data was provided to DoT to enable comparison
with measured data (see Appendix E).
It should be noted that the wave modelling has been undertaken to obtain the hindcast wave data for
shoreline movement modelling purposes only and the presented results shall not be used as basis for
any other engineering work.
S IMULATION SCENARIO
The MIKE21 SW model was run to simulate wave conditions at the site for the 10 year period: 1998 to
2007.
2.3.2 Wave Hindcast Results
The nearshore wave data was extracted at four locations along the study shoreline. The extracted
points are shown in Figure 2-12. The coordinates of these points are presented in Table 2.7.
Wave roses for the four points are presented in Appendix D, Figure D-1 to Figure D-4. Joint
Frequency Tables are also presented in Table D.1, Table D.3, Table D.5 and Table D.7. The
simulation indicates similar wave height conditions at each of the sites. Due to the water depth
limitation, significant wave heights were limited to 3.3m and the average significant wave height is
about 1.2m. However wave periods are relatively long, with an average Tp of 12s.
As expected, the wave direction varies depending on the location along Champion Bay which drives
the sediment transport. While the waves offshore of the reefs near Point Moore are characterised by
a southwest direction, the refraction and diffraction effects within the Bay affect the wave directions.
The predominant wave direction ranges from westerly at profile 1, westerly and south-westerly at
profile 2 and south-westerly at profiles 3 and 4. Compared to the beach shoreline orientation, an
average northward sediment transport direction is therefore expected. However, during storm events
in winter, the wave direction can be in the range West to North West. The sediment transport during
storm events is therefore expected to be southward.
The results of the modelling show the distribution of the wave energy along the study area. The
central section (profile 2 and 3) is more exposed to the wave action than the southern part of the
Northern Beaches.
Table D.2, Table D.4, Table D.6 and Table D.8 present the wave height statistics for each of the
output points and for each year. Table 2.8 present a statistical analysis of the hindcast wave data for
the years 1998 to 2007 at profile 1. Over the period 1998 to 2007, the wave climate inside Champion
Bay seems relatively constant. The years 1999, 2003 and 2007 appear to be the more severe.
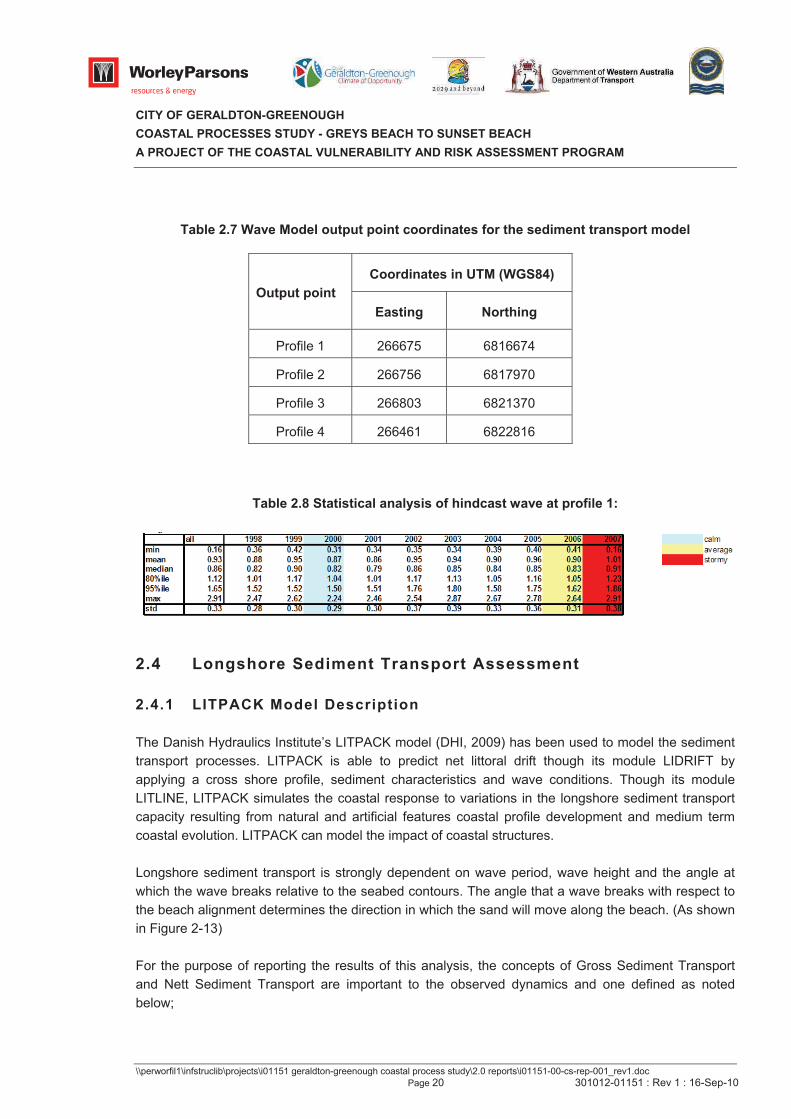
CITY OF GERALDTON-GREENOUGH
COASTAL PROCESSES STUDY - GREYS BEACH TO SUNSET BEACH
A PROJECT OF THE COASTAL VULNERABILITY AND RISK ASSESSMENT PROGRAM
\\perworfil1\infstruclib\projects\i01151 geraldton-greenough coastal process study\2.0 reports\i01151-00-cs-rep-001_rev1.doc
Page 20 301012-01151 : Rev 1 : 16-Sep-10
Table 2.7 Wave Model output point coordinates for the sediment transport model
Coordinates in UTM (WGS84)
Output point
Easting Northing
Profile 1 266675 6816674
Profile 2 266756 6817970
Profile 3 266803 6821370
Profile 4 266461 6822816
Table 2.8 Statistical analysis of hindcast wave at profile 1:
2.4 Longshore Sediment Transport Assessment
2.4.1 LITPACK Model Description
The Danish Hydraulics Institute’s LITPACK model (DHI, 2009) has been used to model the sediment
transport processes. LITPACK is able to predict net littoral drift though its module LIDRIFT by
applying a cross shore profile, sediment characteristics and wave conditions. Though its module
LITLINE, LITPACK simulates the coastal response to variations in the longshore sediment transport
capacity resulting from natural and artificial features coastal profile development and medium term
coastal evolution. LITPACK can model the impact of coastal structures.
Longshore sediment transport is strongly dependent on wave period, wave height and the angle at
which the wave breaks relative to the seabed contours. The angle that a wave breaks with respect to
the beach alignment determines the direction in which the sand will move along the beach. (As shown
in Figure 2-13)
For the purpose of reporting the results of this analysis, the concepts of Gross Sediment Transport
and Nett Sediment Transport are important to the observed dynamics and one defined as noted
below;
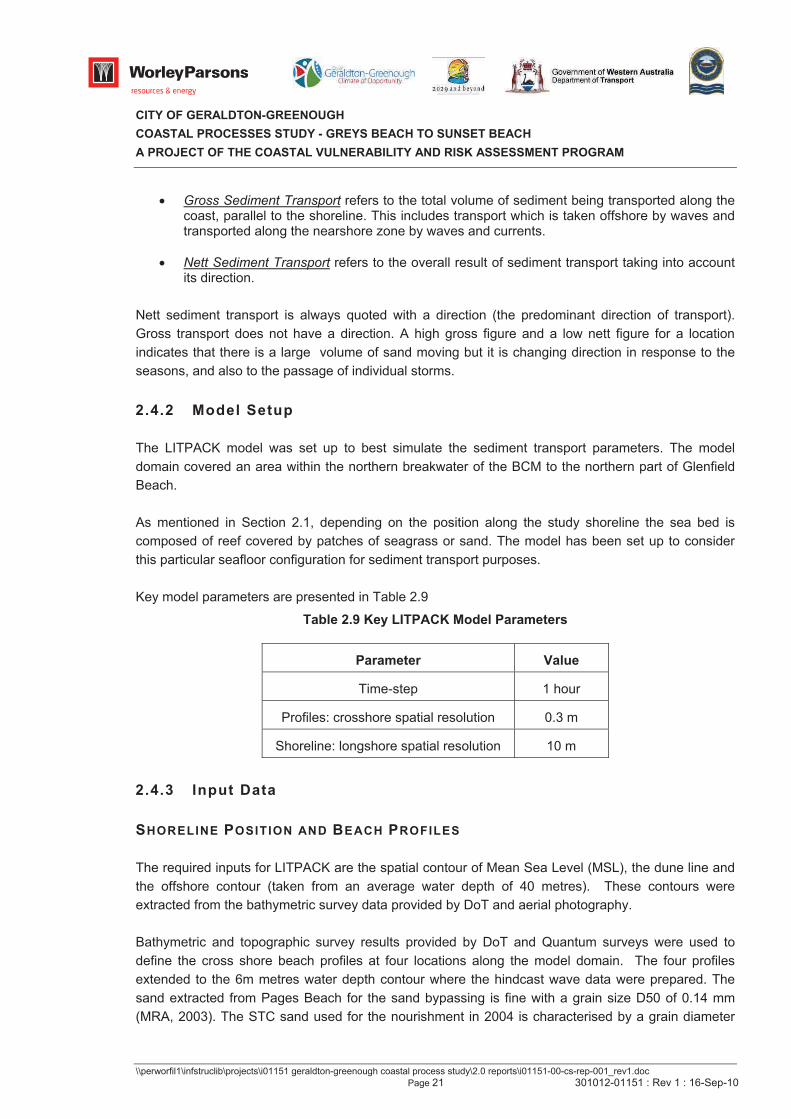
CITY OF GERALDTON-GREENOUGH
COASTAL PROCESSES STUDY - GREYS BEACH TO SUNSET BEACH
A PROJECT OF THE COASTAL VULNERABILITY AND RISK ASSESSMENT PROGRAM
\\perworfil1\infstruclib\projects\i01151 geraldton-greenough coastal process study\2.0 reports\i01151-00-cs-rep-001_rev1.doc
Page 21 301012-01151 : Rev 1 : 16-Sep-10
Gross Sediment Transport refers to the total volume of sediment being transported along the coast, parallel to the shoreline. This includes transport which is taken offshore by waves and transported along the nearshore zone by waves and currents.
Nett Sediment Transport refers to the overall result of sediment transport taking into account its direction.
Nett sediment transport is always quoted with a direction (the predominant direction of transport).
Gross transport does not have a direction. A high gross figure and a low nett figure for a location
indicates that there is a large volume of sand moving but it is changing direction in response to the
seasons, and also to the passage of individual storms.
2.4.2 Model Setup
The LITPACK model was set up to best simulate the sediment transport parameters. The model
domain covered an area within the northern breakwater of the BCM to the northern part of Glenfield
Beach.
As mentioned in Section 2.1, depending on the position along the study shoreline the sea bed is
composed of reef covered by patches of seagrass or sand. The model has been set up to consider
this particular seafloor configuration for sediment transport purposes.
Key model parameters are presented in Table 2.9
Table 2.9 Key LITPACK Model Parameters
Parameter Value
Time-step 1 hour
Profiles: crosshore spatial resolution 0.3 m
Shoreline: longshore spatial resolution 10 m
2.4.3 Input Data
SHORELINE POSITION AND BEACH PROFILES
The required inputs for LITPACK are the spatial contour of Mean Sea Level (MSL), the dune line and
the offshore contour (taken from an average water depth of 40 metres). These contours were
extracted from the bathymetric survey data provided by DoT and aerial photography.
Bathymetric and topographic survey results provided by DoT and Quantum surveys were used to
define the cross shore beach profiles at four locations along the model domain. The four profiles
extended to the 6m metres water depth contour where the hindcast wave data were prepared. The
sand extracted from Pages Beach for the sand bypassing is fine with a grain size D50 of 0.14 mm
(MRA, 2003). The STC sand used for the nourishment in 2004 is characterised by a grain diameter
CITY OF GERALDTON-GREENOUGH
COASTAL PROCESSES STUDY - GREYS BEACH TO SUNSET BEACH
A PROJECT OF THE COASTAL VULNERABILITY AND RISK ASSESSMENT PROGRAM
\\perworfil1\infstruclib\projects\i01151 geraldton-greenough coastal process study\2.0 reports\i01151-00-cs-rep-001_rev1.doc
Page 22 301012-01151 : Rev 1 : 16-Sep-10
D50 of 0.25 mm (MRA, 2003). Along the northern beaches (especially the southern part) the sand is
fine with a D50 of 0.22 mm (CES 2001). Further north (Chapman River) the sand is coarser,
nominally D50=0.3 mm (CES 2001). The sand along Sunset Beach is coarse sand with a grain size
D50 of 0.35 mm (MRA, 2003).
WAVE DATA AND HYDRODYNAMIC FORCING
Time series of water elevation at Geraldton has been used to force the LITPACK model with the
water level parameters uniformly applied over the domain.
Hindcast wave data obtained from the MIKE21 SW model along the Geraldton shoreline is assumed
to be representative of the medium term wave climate and have been applied in the LITPACK
simulations. Root mean square wave height, zero up crossing wave period and peak spectrum wave
direction are the main parameters used to force the LITPACK model.
S IMULATION SCENARIO
To simulate medium term (i.e. 20 years) trends in shoreline evolution in the study area a 20 year
simulation was run using the LITPACK model. The 2007 shoreline position was used as the initial
shoreline position and the model was forced using the hindcast wave data set. The resulting shoreline
development represents the predictal cumulative effects of littoral drift and diffusive processes.
MODEL VALIDATION AND LIMITATION
The LITPACK model simulates both sediment transport and shoreline evolution.
The longshore sediment transport module (LITDRIFT) was set up to consider the particular
configuration of the sea bed. This was done by adjusting the roughness parameter and validated by
comparing the calculation results with survey data (Section 2.2.2).
Regarding the shoreline evolution modelling with the LITLINE model, it is likely that nearshore reefs
extend to land and are overlaw by sand on the dry beach area. This type of beach is generally
referred as hard bottom beach and the quantity of sediment available is limited. Along the northern
beaches these nearshore reefs can be seen at several locations (Hosken St, Dean St, north of Mark
St). While the Quantum Survey data informs on the temporal volume variations of sediment along the
northern beaches, no information is available regarding the quantity of sediment available. For
medium term modelling of the shoreline evolution a sandy beach has been assumed and, as a
consequence, the shoreline evolution development presented herein should be considered as
conservative estimate of the medium term shoreline evolution trend.
Moreover, it should be noted that whilst the LITPACK numerical model considers longshore sediment
transport, it does not include crosshore sediment transport which may be induced during storm
events. However, the crosshore transport is generally nil over one year and an annual average
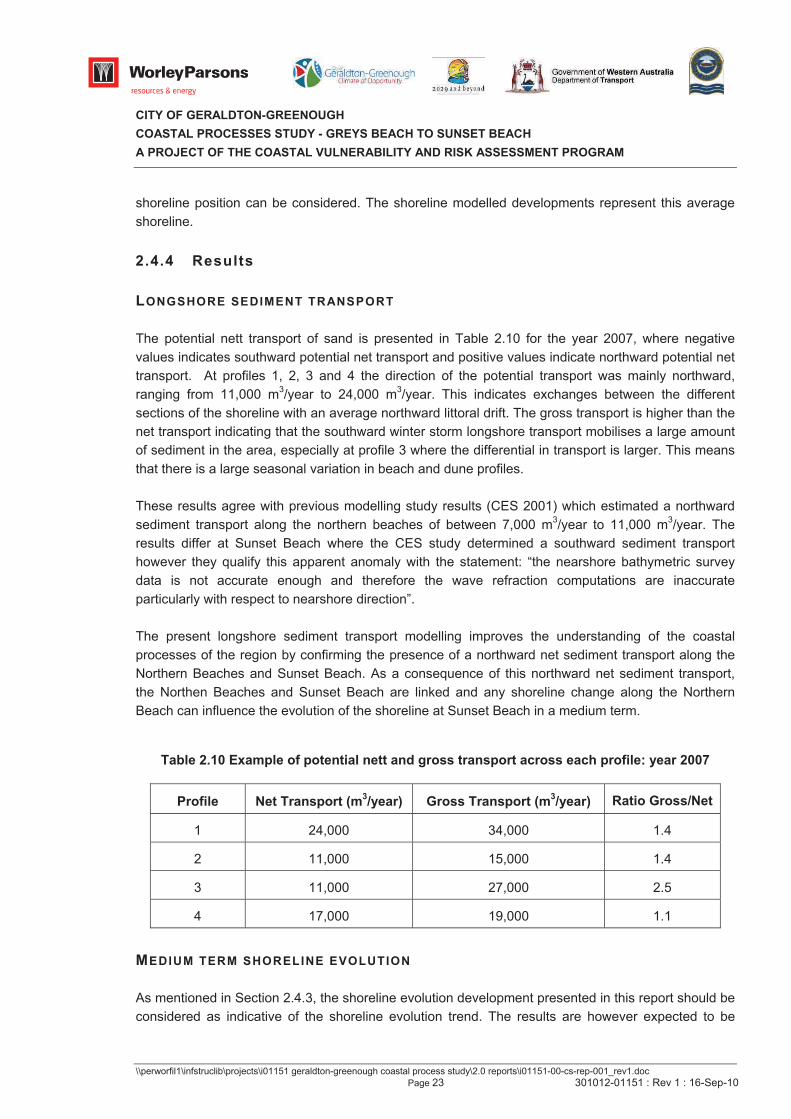
CITY OF GERALDTON-GREENOUGH
COASTAL PROCESSES STUDY - GREYS BEACH TO SUNSET BEACH
A PROJECT OF THE COASTAL VULNERABILITY AND RISK ASSESSMENT PROGRAM
\\perworfil1\infstruclib\projects\i01151 geraldton-greenough coastal process study\2.0 reports\i01151-00-cs-rep-001_rev1.doc
Page 23 301012-01151 : Rev 1 : 16-Sep-10
shoreline position can be considered. The shoreline modelled developments represent this average
shoreline.
2.4.4 Results
LONGSHORE SEDIMENT TRANSPORT
The potential nett transport of sand is presented in Table 2.10 for the year 2007, where negative
values indicates southward potential net transport and positive values indicate northward potential net
transport. At profiles 1, 2, 3 and 4 the direction of the potential transport was mainly northward,
ranging from 11,000 m3/year to 24,000 m
3/year. This indicates exchanges between the different
sections of the shoreline with an average northward littoral drift. The gross transport is higher than the
net transport indicating that the southward winter storm longshore transport mobilises a large amount
of sediment in the area, especially at profile 3 where the differential in transport is larger. This means
that there is a large seasonal variation in beach and dune profiles.
These results agree with previous modelling study results (CES 2001) which estimated a northward
sediment transport along the northern beaches of between 7,000 m3/year to 11,000 m
3/year. The
results differ at Sunset Beach where the CES study determined a southward sediment transport
however they qualify this apparent anomaly with the statement: “the nearshore bathymetric survey
data is not accurate enough and therefore the wave refraction computations are inaccurate
particularly with respect to nearshore direction”.
The present longshore sediment transport modelling improves the understanding of the coastal
processes of the region by confirming the presence of a northward net sediment transport along the
Northern Beaches and Sunset Beach. As a consequence of this northward net sediment transport,
the Northen Beaches and Sunset Beach are linked and any shoreline change along the Northern
Beach can influence the evolution of the shoreline at Sunset Beach in a medium term.
Table 2.10 Example of potential nett and gross transport across each profile: year 2007
Profile Net Transport (m3/year) Gross Transport (m
3/year) Ratio Gross/Net
1 24,000 34,000 1.4
2 11,000 15,000 1.4
3 11,000 27,000 2.5
4 17,000 19,000 1.1
MEDIUM TERM SHORELINE EVOLUTION
As mentioned in Section 2.4.3, the shoreline evolution development presented in this report should be
considered as indicative of the shoreline evolution trend. The results are however expected to be
CITY OF GERALDTON-GREENOUGH
COASTAL PROCESSES STUDY - GREYS BEACH TO SUNSET BEACH
A PROJECT OF THE COASTAL VULNERABILITY AND RISK ASSESSMENT PROGRAM
\\perworfil1\infstruclib\projects\i01151 geraldton-greenough coastal process study\2.0 reports\i01151-00-cs-rep-001_rev1.doc
Page 24 301012-01151 : Rev 1 : 16-Sep-10
conservative. Analysis of the outcome is important as it demonstrates the need for an adequate
coastal protection management plan.
Figure 4-1 and Figure 4-2 present the medium term shoreline evolution over a 20 year period along
the Northern Beaches and Sunset Beach in the case of no human intervention. This demonstrates
that these beaches would show gradual recession and an increased area of beach and development
placed under threat of erosion.
As shown on Figure 4-3, continuation of the present Northern Beaches Stabilisation Programme will
not prevent shoreline erosion north of the detached breakwater. This shows that an adjustment of the
programme is required. It is however possible to prevent the erosion in this area by increasing the
sand bypassing volumes as presented in Figure 4-4.
2.5 Assessment of Sediment Budget along the Geraldton Coastline
The coastal transport processes in Champion Bay have been assessed based on the review of the
historical studies combined with processing and analysis of data regarding the vegetation line
positions and the 5 year profile survey data. Figure 2-14 and Figure 2-15 present a summary of the
results, which are described below.
The study shoreline can be split into one main cell and five sub cells. The main sediment cell
corresponds to Champion Bay. Despite a certain amount of sand entering through the southern
boundary, the sediment budget of this cell is in deficit. The total volume of sand is estimated to be
-21,500 m3/year on average, including 13,000 m
3/year of discharge from the Chapman River. A
certain quantity is drifted towards Drummond cove through the Drummond Point northern boundary
while the remaining quantity is likely to be deposited offshore.
Within the Champion Bay main cell, Sub Cells 1, 2, 3, 4 and 5 correspond to Pages Beach, Town
Beach, the Northern Beaches (cells 3 and 4) and Sunset / Glenfield beaches respectively. Sub Cell 5
and 6, corresponding to Point Moore and Grey’s Beach, which is outside the main cell of Champion
Bay. Cells 3, 4 and 5 comprise the main part of the study shoreline.
SUB CELL 1: PAGES BEACH
The sand, entering Champion Bay by littoral drift along the beach of Point Moore and through the
inshore reefs, is mainly deposited along Pages Beach. Even with sand removal for bypassing
purposes of about 5,000 m3/year to 13,000 m
3/year and 10,500 m
3/year on average, Cell 1 has been
accreting over recent years at a rate of 10,000 m3/year to 21,000 m
3/year and 17,000 m
3/year on
average. The Geraldton harbour and channel infrastructure act as a barrier stopping the longshore
drift processes so no sand is naturally transported from this area to the other sub cells.
CITY OF GERALDTON-GREENOUGH
COASTAL PROCESSES STUDY - GREYS BEACH TO SUNSET BEACH
A PROJECT OF THE COASTAL VULNERABILITY AND RISK ASSESSMENT PROGRAM
\\perworfil1\infstruclib\projects\i01151 geraldton-greenough coastal process study\2.0 reports\i01151-00-cs-rep-001_rev1.doc
Page 25 301012-01151 : Rev 1 : 16-Sep-10
SUB CELL 2: TOWN BEACH
The survey data analysis revealed that Cell 2 has not been subject to significant strong erosion over
the past 5 years and therefore can be considered as independent from the three other sub cells
constituting Champion Bay. However, this beach is subject to natural erosion (1,500 m3/year on
average) during strong storm events and a certain quantity of sand is likely to be transported offshore
towards the port entrance channel.
SUB CELL 3 AND 4: NORTHERN BEACHES
In Cell 3, the Batavia Coast Marina has stopped the natural northward littoral drift preventing the sand
to enter the northern boundary of the cell. This lack of sediment is likely to be the origin of the
observed erosion. In spite of sand nourishment events (5,000 m3/year to 13,000 m
3/year and 12,500
m3/year on average in the period 2004 to 2009), it was determined that about 22,800 m
3/year of sand
was lost from Cell 3 over the years of this analysis. A certain amount of these sediments is deposited
along Cell 4. It was determined that about 4,200 m3/year of sand were accumulating along Cell 4 over
the years of this analysis.
SUB CELL 5: SUNSET BEACH AND GLENFIELD BEACH
Over the past 60 years, the southern part of Cell 5 has been in erosion while the northern part, in the
direction of Drummond Point, has been accreting. Sunset Beach, at the southern boundary, is
influenced by the Chapman River during flooding events which lead to a significant quantity of
sediment in the beach system transported offshore. Moreover, the bar breach occurs generally during
a storm event, which increases the potential for strong erosion. The presence of inshore reefs off the
Chapman River and Sunset Beach is likely to contribute to the bar reforming during the other periods
of the year (especially the dry season) by reducing the littoral drift and causing sand deposit.
The average impacts of these processes manifest themselves in reduced value of sediments in the
system and erosion along the stretch of shoreline north of these reefs. This erosion is accelerated by
the significant dune blowout along North Sunset Beach. It was estimated that about 0 m3/year to
10,000 m3/year of sand has been lost in Cell 5 over the past 60yrs and about 6,000 m
3/year on
average over the recent years.
SUB CELL 6: POINT MOORE AND EXPLOSIVE BEACH
Sub Cell 6 is located between the Champion Bay Cell and another cell extending down to the
Greenough River. It is expected that this Sub Cell is the interface between the two main cells. This
cell is however relatively stable. It has been in relative equilibrium since 1992. The volume variations
along Explosive Beach and Point Moore are less than 2,500 m3/year.
CITY OF GERALDTON-GREENOUGH
COASTAL PROCESSES STUDY - GREYS BEACH TO SUNSET BEACH
A PROJECT OF THE COASTAL VULNERABILITY AND RISK ASSESSMENT PROGRAM
\\perworfil1\infstruclib\projects\i01151 geraldton-greenough coastal process study\2.0 reports\i01151-00-cs-rep-001_rev1.doc
Page 26 301012-01151 : Rev 1 : 16-Sep-10
SUB CELL 7: GREY ’S BEACH
Sub Cell 7 is located outside the Champion Bay Cell and belongs to another cell extending down to
the Greenough River. The cell (Grey’s Beach) is located between Separation Point and Point Moore.
It is not expected to have any significant quantity of sediment entering from the Separation Point
boundary owing to the inshore reef blocking the sand transport. This cell has been losing about 800
m3/year over the past 60 years and about 2,000 m
3/year on average in over the last years.
THE CHAPMAN R IVER
Between Sub Cells 4 and 5, the Chapman River is estimated to discharge about 3,000 m3/year to
16,000 m3/year and 13,000 m
3/year on average during the wet season. During events when the bar is
breached sediment is transported offshore and then redistributed along the shoreline.
However, the understanding of the Chapman River’s role in the sediment transport processes is
limited at this stage and without substantial analysis, the historical survey data is important to provide
an appreciation of the beach dynamics.
GERALDTON HARBOUR CHANNEL
A significant quantity of sediment has been depositing in the Geraldton Harbour Channel. This
required dredging of 40,000 m3 of sediment in 2002/2003. This siltation is driven by the saturation of
Pages Beach and the area seaward adjacent to the port breakwaters providing a mechanism for
sediment to be transported to the channel.
CITY OF GERALDTON-GREENOUGH
COASTAL PROCESSES STUDY - GREYS BEACH TO SUNSET BEACH
A PROJECT OF THE COASTAL VULNERABILITY AND RISK ASSESSMENT PROGRAM
\\perworfil1\infstruclib\projects\i01151 geraldton-greenough coastal process study\2.0 reports\i01151-00-cs-rep-001_rev1.doc
Page 27 301012-01151 : Rev 1 : 16-Sep-10
3. COASTAL MANAGEMENT METHODS
Successful long-term coastal management solutions have to directly address and work with the
natural physical processes responsible for the erosion problems. Therefore, an understanding of the
function and effectiveness of various coastal structures is required, along with the social acceptance
of the various options.
3.1 Impact of Recent Foreshore Development and Management Policy
The following discussion includes observations, which can be drawn, from recent developments and
management methods being adopted on the Geraldton coastal zone.
3.1.1 Geraldton Port Harbour and the Recent PEP
The Geraldton Port Harbour has a long history of development. The construction of the Port facilities
began in 1857 with the first town jetty. In 1893, a new 290 metre jetty was completed northwards from
Durlacher Street. A 670 metre breakwater was completed in 1926 and the Fishing Boat Harbour was
added in 1963. The Construction of Berth 4 commenced in May 1964 and in 1975 a 213 metre berth,
designed to accommodate vessels of up to 27,000 tonnes displacement was added. Recently,
in 2003, the Port Enhancement Project (PEP) was undertaken to deepen the harbour basin and
channel, as well as to upgrade three of the six berths.
Significant work has been completed in the Geraldton area concerning the Port development impact
on the shoreline evolution, especially along the Northern Beaches. Based on historical vegetation and
waterline movement, MRA (2001) suggested that the development of the Harbour has affected
longshore sediment transport by reducing the natural littoral drift. Based on wave and sediment
transport modelling, CES (2001) advised that the effect of the PEP would be to intensify the sediment
transport processes by about 20%. Owing to more wave energy striking the coast from the west at
some 100 to 200 metres north of the Batavia Coast Marina and south of Chapman River, the rate of
sediment transport, following the PEP, was expected to be about 10,000 m3/year to 15,000 m
3/year.
For recent years, the rate of sediment transport north of the detached breakwater has been evaluated
at about 16,000 m3/year (Section 2.2.2), confirming the CES results.
It has to be noted that the sediment budget analysis showed that a higher volume of sediment can be
transported north of the Batavia Coast Marina. This was up to 40,000 m3 after the beach nourishment
of 89,000 m3 with STC sand in 2004. This demonstrates that the potential littoral drift can be
significantly higher as soon as the quantity of sand available along the beaches increases.
3.1.2 Detached Breakwater
A detached breakwater was constructed in 2005, designed to stabilise the shoreline just north of the
Batavia Coast (section SN1). After its construction the eroded volume of sand was reduced to
CITY OF GERALDTON-GREENOUGH
COASTAL PROCESSES STUDY - GREYS BEACH TO SUNSET BEACH
A PROJECT OF THE COASTAL VULNERABILITY AND RISK ASSESSMENT PROGRAM
\\perworfil1\infstruclib\projects\i01151 geraldton-greenough coastal process study\2.0 reports\i01151-00-cs-rep-001_rev1.doc
Page 28 301012-01151 : Rev 1 : 16-Sep-10
between 5,000 m3/year and 19,000 m
3/year (see Section 2.2.2), permitting the beach in SN1 to be
stabilised via ongoing nourishment.
However, north of the detached breakwater, a gradient in transport has been created equal to the
reduction in transport created by the detached breakwater. This is causing exacerbated shoreline
recession and recent erosion problems in this beach section, despite ongoing nourishment.
3.1.3 Northern Beaches Stabil isation Programme
As detailed in section 2, five years of Northern Beaches Stabilisation Programme has resulted in the
following:
Town beach is relatively stable but is exposed to crosshore transport during storm events
A large quantity of sediment remains available along Pages Beach which has been
accreting over the last five years
The section between the Batavia Coast Marina and the offshore breakwater has been
stabilised. However north of the breakwater, erosion is observed despite nourishment,
indicating a deficit in the amount of nourishment being applied. A long stretch of Shoreline
(Mabel St to Chapman River) is relatively stable, slightly in accretion.
In the absence of stabilisation work, Grey’s Beach and Sunset Beach have been eroding.
3.2 Assessment of Coastal Setback Distances
3.2.1 State Coastal Planning Policy and Sea Level Rise
STATE COASTAL PLANNING POLICY
In order to propose adapted coastal protection strategies for the study over the next 20 years, an
assessment of the appropriate setback distance has been undertaken in line with the Western
Australian Planning Commission’s “Statement of Planning Policy No 2.6 – State Coastal Planning
Policy” (SCPP). The calculation of setback in line with this policy allows the areas of high risk of
impact from erosion to be highlighted. This analysis will confirm the observations made in the field.
The policy provides setback guidelines to protect developments from erosion processes.
The setback calculation provides for the coastal processes that may occur within the planning lifetime
and includes setback distances for:
An extreme storm sequence – based on modelling of extreme ocean conditions: S1
Chronic erosion or accretion – based on historic surveys of shoreline change: S2
Future sea level change: S3
This method is based on a planning horizon of 100 years for new developments and its aim is to
avoid the need for active management of the coastal processes.
CITY OF GERALDTON-GREENOUGH
COASTAL PROCESSES STUDY - GREYS BEACH TO SUNSET BEACH
A PROJECT OF THE COASTAL VULNERABILITY AND RISK ASSESSMENT PROGRAM
\\perworfil1\infstruclib\projects\i01151 geraldton-greenough coastal process study\2.0 reports\i01151-00-cs-rep-001_rev1.doc
Page 29 301012-01151 : Rev 1 : 16-Sep-10
For the assessment of setback distances for this study, a planning horizon of 20 years has been
adapted. It was however identified during the discussion with the Partners that a review of the 100
year horizon is relevant to provide appreciation of the larger term horizon.
In additional to the three setback distances, a factor of safety of 10m (S4) has been allowed to
account for likely accuracy of the data and possible error in the models (MRA, 2001).
The determination of the S1 distances requires the modelling of the impact of a sequence of storms
on the shore at the study sites. Such modelling result values have been sourced from previous
studies (MRA, 2001). As recommended by the SCPP, in the absence of modelling, such as when
data is unavailable, the default value of 40 metres has been used (based on modelling of a typical
exposed sandy shore).
Where a coastal protection structure is present, the SCPP recommendations for an Infill classified
area have been applied. Therefore, a minimum setback of S1 has been applied. An exception is for
the seawall case where only the safety distance (S4) has been applied because these structures are
normally designed to prevent inland intrusions of the sea. For the detached breakwater case
(between section SN1 and SN2), while it diminishes the wave action, the structure dimensions are
reduced and therefore a conservative approach has been adopted.
The determination of the distance S3, related to the future seal level change, is discussed in the
following section.
The use of the criterion described above results in a setback distance that will provide a reasonably
low risk of coastal erosion threatening the lease area in the coming 20 year case and 100 year case.
If the setback distance of the existing development were less than the recommended setback, then it
would highlight the need to manage the risk by either application of coastal structures or further active
management of the coastal processes.
SEA LEVEL R ISE DUE TO CLIMATE CHANGE
The influence of potential sea level rise is significant and the accuracy of estimates is also still under
development.
The Intergovernmental Panel on Climate Change (IPCC) was established in 1988 by the United
Nations Environment Programme and the World Meteorological Organisation. It is responsible for
providing the international community with authoritative advice on scientific, technical and economic
issues relating to climate change. The IPCC's Third Assessment Report concluded in 2001 that global
warming had accelerated in recent decades. The recently released Fourth Assessment Report (2007)
increases the level of scientific certainty upon which climate change projections are made and
provides stronger evidence that the majority of global surface warming is attributable to increases in
greenhouse gas emissions associated with human activities.
Increasing global temperature has a direct impact on sea level in a number of ways including:
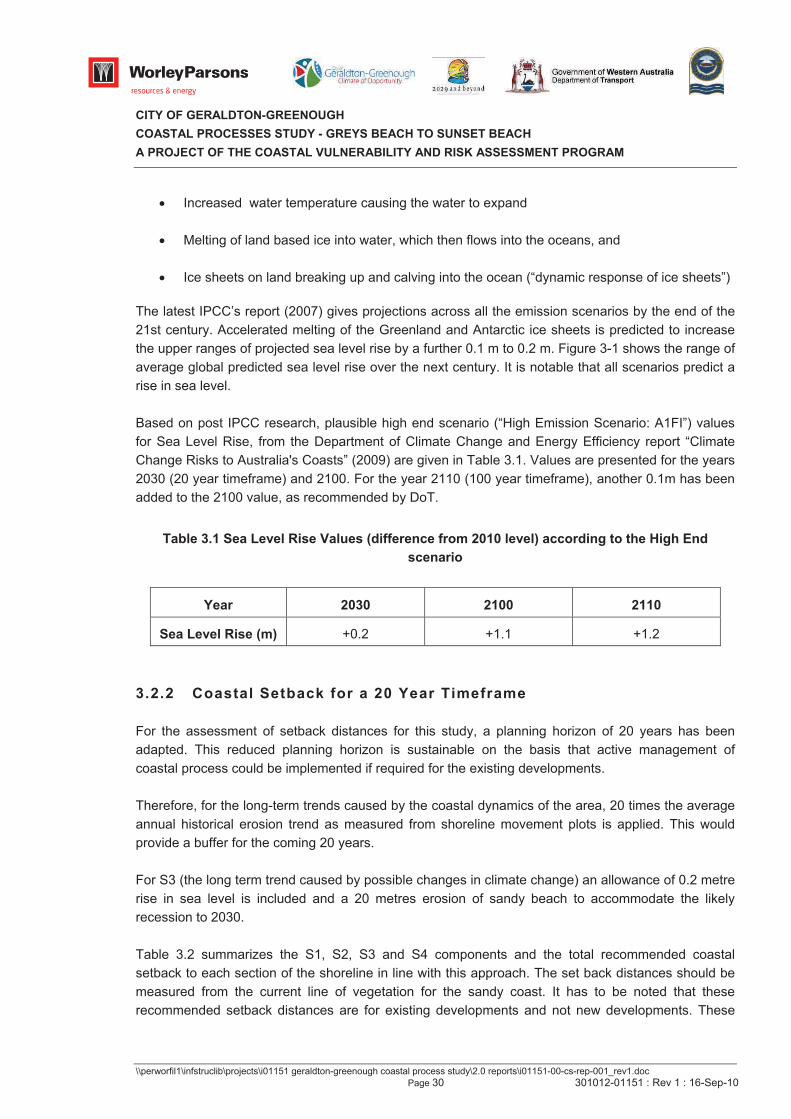
CITY OF GERALDTON-GREENOUGH
COASTAL PROCESSES STUDY - GREYS BEACH TO SUNSET BEACH
A PROJECT OF THE COASTAL VULNERABILITY AND RISK ASSESSMENT PROGRAM
\\perworfil1\infstruclib\projects\i01151 geraldton-greenough coastal process study\2.0 reports\i01151-00-cs-rep-001_rev1.doc
Page 30 301012-01151 : Rev 1 : 16-Sep-10
Increased water temperature causing the water to expand
Melting of land based ice into water, which then flows into the oceans, and
Ice sheets on land breaking up and calving into the ocean (“dynamic response of ice sheets”)
The latest IPCC’s report (2007) gives projections across all the emission scenarios by the end of the
21st century. Accelerated melting of the Greenland and Antarctic ice sheets is predicted to increase
the upper ranges of projected sea level rise by a further 0.1 m to 0.2 m. Figure 3-1 shows the range of
average global predicted sea level rise over the next century. It is notable that all scenarios predict a
rise in sea level.
Based on post IPCC research, plausible high end scenario (“High Emission Scenario: A1FI”) values
for Sea Level Rise, from the Department of Climate Change and Energy Efficiency report “Climate
Change Risks to Australia's Coasts” (2009) are given in Table 3.1. Values are presented for the years
2030 (20 year timeframe) and 2100. For the year 2110 (100 year timeframe), another 0.1m has been
added to the 2100 value, as recommended by DoT.
Table 3.1 Sea Level Rise Values (difference from 2010 level) according to the High End
scenario
Year 2030 2100 2110
Sea Level Rise (m) +0.2 +1.1 +1.2
3.2.2 Coastal Setback for a 20 Year Timeframe
For the assessment of setback distances for this study, a planning horizon of 20 years has been
adapted. This reduced planning horizon is sustainable on the basis that active management of
coastal process could be implemented if required for the existing developments.
Therefore, for the long-term trends caused by the coastal dynamics of the area, 20 times the average
annual historical erosion trend as measured from shoreline movement plots is applied. This would
provide a buffer for the coming 20 years.
For S3 (the long term trend caused by possible changes in climate change) an allowance of 0.2 metre
rise in sea level is included and a 20 metres erosion of sandy beach to accommodate the likely
recession to 2030.
Table 3.2 summarizes the S1, S2, S3 and S4 components and the total recommended coastal
setback to each section of the shoreline in line with this approach. The set back distances should be
measured from the current line of vegetation for the sandy coast. It has to be noted that these
recommended setback distances are for existing developments and not new developments. These
CITY OF GERALDTON-GREENOUGH
COASTAL PROCESSES STUDY - GREYS BEACH TO SUNSET BEACH
A PROJECT OF THE COASTAL VULNERABILITY AND RISK ASSESSMENT PROGRAM
\\perworfil1\infstruclib\projects\i01151 geraldton-greenough coastal process study\2.0 reports\i01151-00-cs-rep-001_rev1.doc
Page 31 301012-01151 : Rev 1 : 16-Sep-10
recommended distances are the minimum from a coastal engineering point of view and they are
made on the basis that the foreshore is properly managed.
Table 3.3 presents a comparison of the recommended coastal setback distances and the actual
coastal setback distances. The recommended setback distances are presented on Figure 3-2, Figure
3-3, Figure 3-4, Figure 3-5 and Figure 3-6 for the Northern Beaches, for south of Chapman River,
Sunset Beach and Grey’s Beach respectively.
For some sections, it appears that the recommended coastal setbacks are not met. For the sections
where the shoreline has a history of erosion or the beach width does not present a sufficient buffer for
storm erosion, a beach protection management action is required to prevent threat to the existing
development. These sections are indicated with a red colour shading in Table 3.3.
For the sections where the shoreline is, however, stable or in accretion and the beach width presents
a sufficient buffer for storm erosion and/or an existing structure protects them from extreme storm
erosion, no immediate action is required but active monitoring is recommended. These sections are
indicated with an orange colour shading in Table 3.3. The active beach monitoring is defined in
Section 5.3.1.
On the basis of a 20 year horizon, the following conclusions can be drawn from this coastal setback
assessment:
The recreational facilities in the foreshore reserve can be located within this setback
distance but will have a higher risk of being threatened by coastal erosion in the coming 20
years.
For the section SN1, the setback is not sufficient to meet the minimum setback requests.
North of the Batavia Coast, the actual setback distance is only 30m. However, this section
has been maintained as described in Section 2.5 (sheltered by a seawall and breakwater
and maintained with ongoing nourishment).
Along sector SN2, the actual setback distance compared to the minimum required setback
is not sufficient for the majority of the developed area. An active coastal protection program
needs to be developed for this area.
For the sector SN3, except for the northern part (north of Fuller Street), the recommended
setback distance is matched for the majority of the shoreline or a sufficient buffer against
storm erosion is present. Active monitoring is recommended.
The section near Fuller Street is already protected by a seawall against beach erosion
during storm events. Other than during maintenance work, no particular management
should be required for this section.
South of Chapman River (Frederick Street), the setback distance is not sufficient for four
houses and the beach would not be wide enough in the event of extreme storm erosion.
CITY OF GERALDTON-GREENOUGH
COASTAL PROCESSES STUDY - GREYS BEACH TO SUNSET BEACH
A PROJECT OF THE COASTAL VULNERABILITY AND RISK ASSESSMENT PROGRAM
\\perworfil1\infstruclib\projects\i01151 geraldton-greenough coastal process study\2.0 reports\i01151-00-cs-rep-001_rev1.doc
Page 32 301012-01151 : Rev 1 : 16-Sep-10
North of the Chapman River, the section corresponding to Sunset Beach is threatened by
erosion. In particular, several houses located in the Caravan Park are far closer to the
vegetation line than it is recommended.
For the sections North Sunset Beach and Glenfield, the setback distances are sufficient.
At Pages, currently in accretion, a groyne protects the car park and recreation area. Along
the eastern side of the beach, some infrastructure from the port might be at risk in the event
of an extreme storm if a sufficient sand buffer is not maintained in their vicinity.
At Point Moore and along Explosive Beach the setback distances are sufficient other than
for the Car Park but the beach is currently stable and a sufficient buffer against storm
erosion is present.
Along the eastern part of Grey’s Beach, the setback distances are sufficient.
Along the western part of Grey’s Beach, the setback distance is not sufficient. The road, the
car park and the pathway would be at threat according to the recommended setback
distances (85 metres). Private infrastructure is however located at a minimum distance of
100 metres.
Along Town Beach, the majority of the foreshore is already protected by a seawall against
beach erosion during storm events. Other than during maintenance work, no particular
management should be required for this section.
On the basis of this analysis, it can be concluded that the areas requiring beach protection
management to avoid threat to the existing development are:
The section north of the detached breakwater
Sunset Beach (mainly along the Caravan Park)
South of Chapman River (Frederick Street)
Grey’s Beach (mainly along the Car Park)
The areas requiring Active Beach Monitoring to detect future threat to the existing development are:
The section between Elphick Avenue and Champion Bay Rise
The section in the area of Morris Street and Cecily Street.
Point Moore (along the Car Park)
Pages Beach
Town Beach
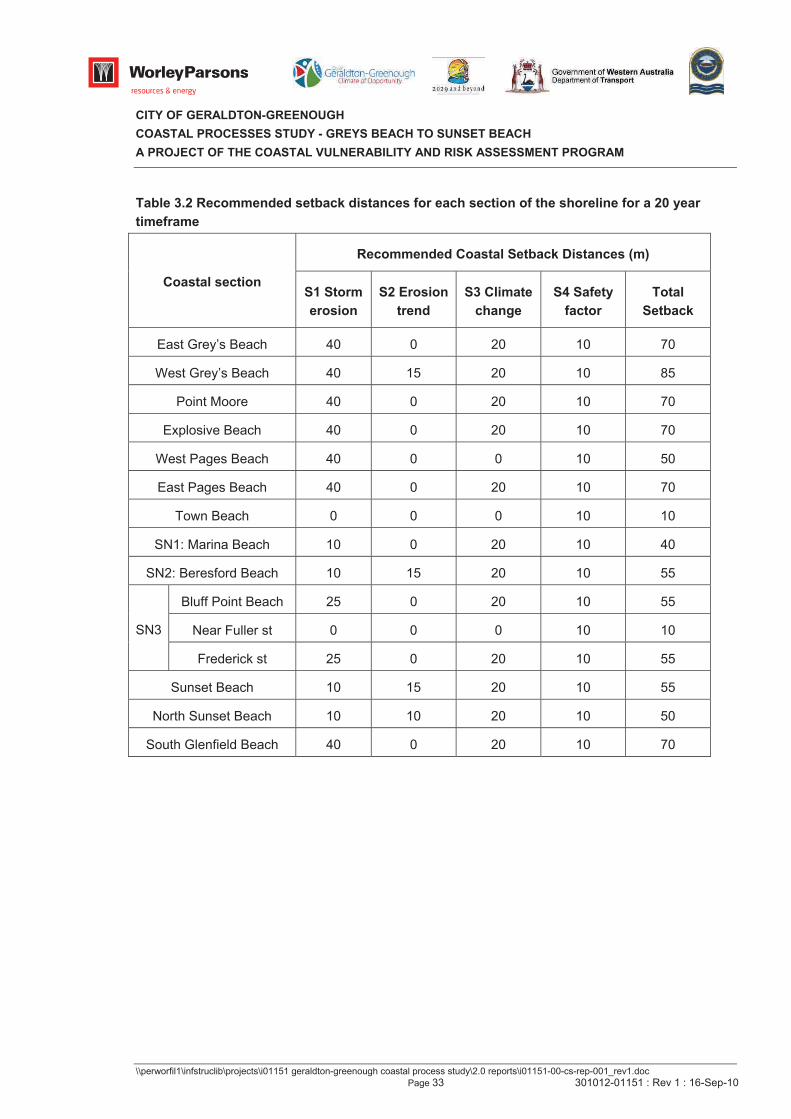
CITY OF GERALDTON-GREENOUGH
COASTAL PROCESSES STUDY - GREYS BEACH TO SUNSET BEACH
A PROJECT OF THE COASTAL VULNERABILITY AND RISK ASSESSMENT PROGRAM
\\perworfil1\infstruclib\projects\i01151 geraldton-greenough coastal process study\2.0 reports\i01151-00-cs-rep-001_rev1.doc
Page 33 301012-01151 : Rev 1 : 16-Sep-10
Table 3.2 Recommended setback distances for each section of the shoreline for a 20 year
timeframe
Recommended Coastal Setback Distances (m)
Coastal section S1 Storm
erosion
S2 Erosion
trend
S3 Climate
change
S4 Safety
factor
Total
Setback
East Grey’s Beach 40 0 20 10 70
West Grey’s Beach 40 15 20 10 85
Point Moore 40 0 20 10 70
Explosive Beach 40 0 20 10 70
West Pages Beach 40 0 0 10 50
East Pages Beach 40 0 20 10 70
Town Beach 0 0 0 10 10
SN1: Marina Beach 10 0 20 10 40
SN2: Beresford Beach 10 15 20 10 55
Bluff Point Beach 25 0 20 10 55
Near Fuller st 0 0 0 10 10 SN3
Frederick st 25 0 20 10 55
Sunset Beach 10 15 20 10 55
North Sunset Beach 10 10 20 10 50
South Glenfield Beach 40 0 20 10 70
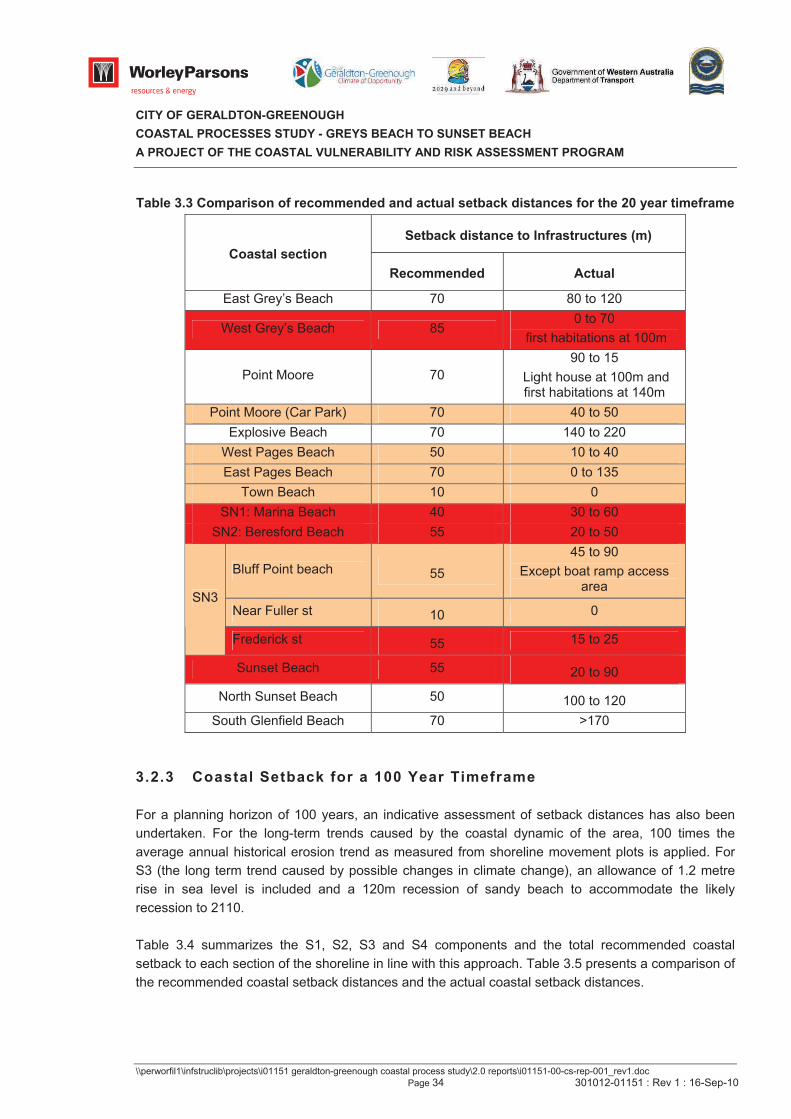
CITY OF GERALDTON-GREENOUGH
COASTAL PROCESSES STUDY - GREYS BEACH TO SUNSET BEACH
A PROJECT OF THE COASTAL VULNERABILITY AND RISK ASSESSMENT PROGRAM
\\perworfil1\infstruclib\projects\i01151 geraldton-greenough coastal process study\2.0 reports\i01151-00-cs-rep-001_rev1.doc
Page 34 301012-01151 : Rev 1 : 16-Sep-10
Table 3.3 Comparison of recommended and actual setback distances for the 20 year timeframe
Setback distance to Infrastructures (m)
Coastal section
Recommended Actual
East Grey’s Beach 70 80 to 120
West Grey’s Beach 850 to 70
first habitations at 100m
Point Moore 70
90 to 15
Light house at 100m and first habitations at 140m
Point Moore (Car Park) 70 40 to 50
Explosive Beach 70 140 to 220
West Pages Beach 50 10 to 40
East Pages Beach 70 0 to 135
Town Beach 10 0
SN1: Marina Beach 40 30 to 60
SN2: Beresford Beach 55 20 to 50
Bluff Point beach 55
45 to 90
Except boat ramp access area
Near Fuller st 10 0SN3
Frederick st 55 15 to 25
Sunset Beach 55 20 to 90
North Sunset Beach 50 100 to 120
South Glenfield Beach 70 >170
3.2.3 Coastal Setback for a 100 Year Timeframe
For a planning horizon of 100 years, an indicative assessment of setback distances has also been
undertaken. For the long-term trends caused by the coastal dynamic of the area, 100 times the
average annual historical erosion trend as measured from shoreline movement plots is applied. For
S3 (the long term trend caused by possible changes in climate change), an allowance of 1.2 metre
rise in sea level is included and a 120m recession of sandy beach to accommodate the likely
recession to 2110.
Table 3.4 summarizes the S1, S2, S3 and S4 components and the total recommended coastal
setback to each section of the shoreline in line with this approach. Table 3.5 presents a comparison of
the recommended coastal setback distances and the actual coastal setback distances.
CITY OF GERALDTON-GREENOUGH
COASTAL PROCESSES STUDY - GREYS BEACH TO SUNSET BEACH
A PROJECT OF THE COASTAL VULNERABILITY AND RISK ASSESSMENT PROGRAM
\\perworfil1\infstruclib\projects\i01151 geraldton-greenough coastal process study\2.0 reports\i01151-00-cs-rep-001_rev1.doc
Page 35 301012-01151 : Rev 1 : 16-Sep-10
The recommended setback distances are presented on Figure 3-2, Figure 3-3, Figure 3-4 and Figure
3-5 for the Northern Beaches, south of Chapman River and Sunset Beach respectively.
Based on this approach (High End Scenario), the whole coastline is predicted to be at threat in the
next 100 years. Climate change and sea level rise have the very real potential to have a significant
impact on the Geraldton coast, affecting natural and cultural values, infrastructure and built assets on
private and public land. The response to climate change and sea level rise needs to be both pro-
active and reactive which involves actually responding to changes as they occur.
It is noted that these estimates are based on the projection of current estimates over a very long
timeframe and in particular estimates of sea level change which have very large estimate averages
over this timeframe. However, it is an important observation that with those estimate accuracy ranges,
much of the coastline would be under threat and coastal protection options must be effective over this
timeline.
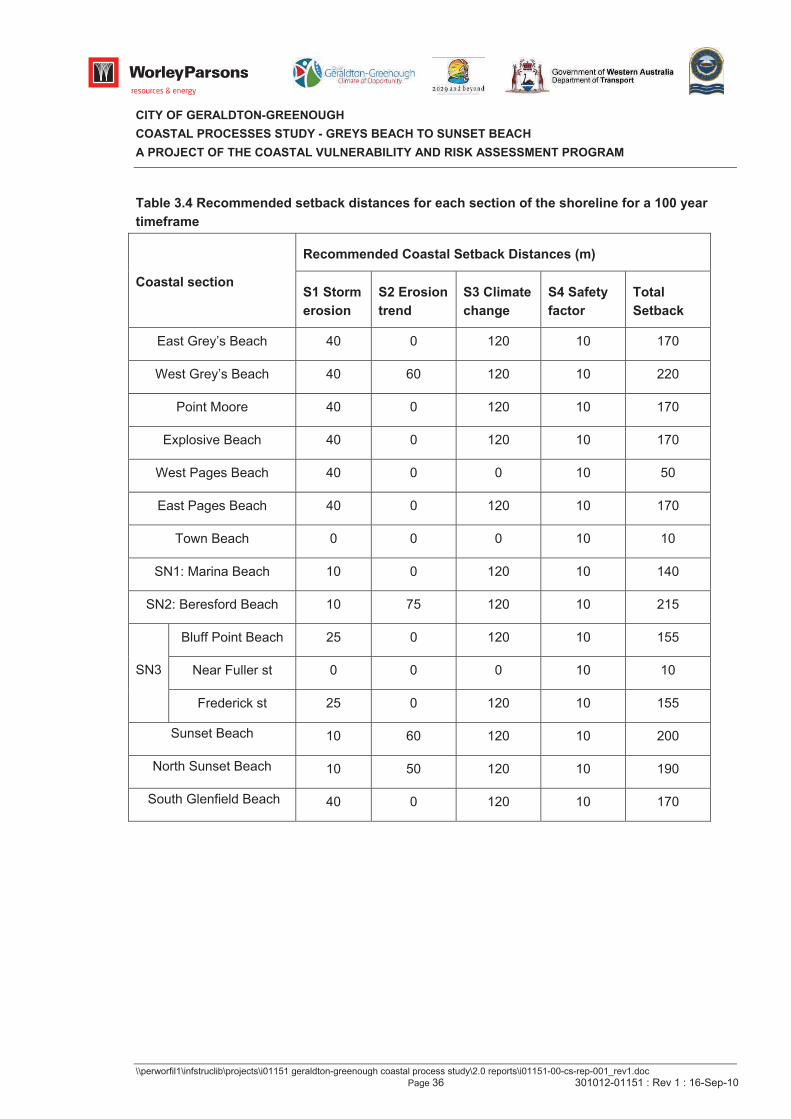
CITY OF GERALDTON-GREENOUGH
COASTAL PROCESSES STUDY - GREYS BEACH TO SUNSET BEACH
A PROJECT OF THE COASTAL VULNERABILITY AND RISK ASSESSMENT PROGRAM
\\perworfil1\infstruclib\projects\i01151 geraldton-greenough coastal process study\2.0 reports\i01151-00-cs-rep-001_rev1.doc
Page 36 301012-01151 : Rev 1 : 16-Sep-10
Table 3.4 Recommended setback distances for each section of the shoreline for a 100 year
timeframe
Recommended Coastal Setback Distances (m)
Coastal section S1 Storm
erosion
S2 Erosion
trend
S3 Climate
change
S4 Safety
factor
Total
Setback
East Grey’s Beach 40 0 120 10 170
West Grey’s Beach 40 60 120 10 220
Point Moore 40 0 120 10 170
Explosive Beach 40 0 120 10 170
West Pages Beach 40 0 0 10 50
East Pages Beach 40 0 120 10 170
Town Beach 0 0 0 10 10
SN1: Marina Beach 10 0 120 10 140
SN2: Beresford Beach 10 75 120 10 215
Bluff Point Beach 25 0 120 10 155
Near Fuller st 0 0 0 10 10 SN3
Frederick st 25 0 120 10 155
Sunset Beach 10 60 120 10 200
North Sunset Beach 10 50 120 10 190
South Glenfield Beach 40 0 120 10 170
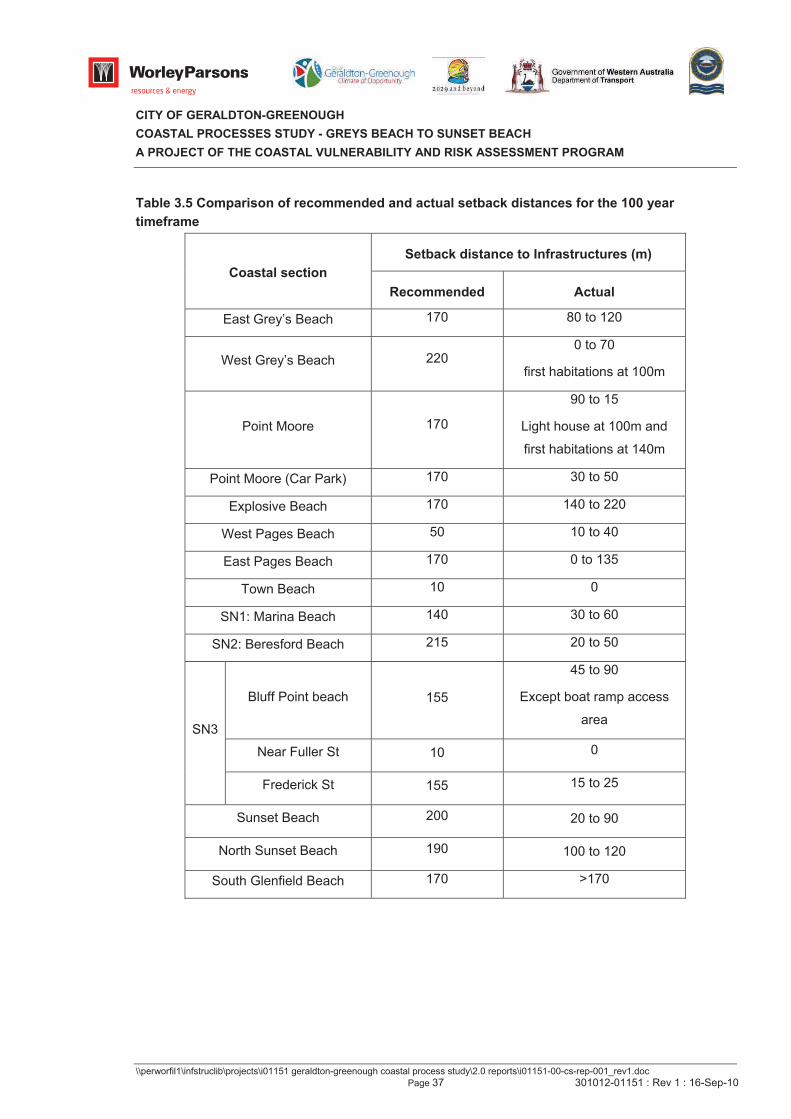
CITY OF GERALDTON-GREENOUGH
COASTAL PROCESSES STUDY - GREYS BEACH TO SUNSET BEACH
A PROJECT OF THE COASTAL VULNERABILITY AND RISK ASSESSMENT PROGRAM
\\perworfil1\infstruclib\projects\i01151 geraldton-greenough coastal process study\2.0 reports\i01151-00-cs-rep-001_rev1.doc
Page 37 301012-01151 : Rev 1 : 16-Sep-10
Table 3.5 Comparison of recommended and actual setback distances for the 100 year
timeframe
Setback distance to Infrastructures (m)
Coastal section
Recommended Actual
East Grey’s Beach 170 80 to 120
West Grey’s Beach 2200 to 70
first habitations at 100m
Point Moore 170
90 to 15
Light house at 100m and
first habitations at 140m
Point Moore (Car Park) 170 30 to 50
Explosive Beach 170 140 to 220
West Pages Beach 50 10 to 40
East Pages Beach 170 0 to 135
Town Beach 10 0
SN1: Marina Beach 140 30 to 60
SN2: Beresford Beach 215 20 to 50
Bluff Point beach 155
45 to 90
Except boat ramp access
area
Near Fuller St 10 0
SN3
Frederick St 155 15 to 25
Sunset Beach 200 20 to 90
North Sunset Beach 190 100 to 120
South Glenfield Beach 170 >170
CITY OF GERALDTON-GREENOUGH
COASTAL PROCESSES STUDY - GREYS BEACH TO SUNSET BEACH
A PROJECT OF THE COASTAL VULNERABILITY AND RISK ASSESSMENT PROGRAM
\\perworfil1\infstruclib\projects\i01151 geraldton-greenough coastal process study\2.0 reports\i01151-00-cs-rep-001_rev1.doc
Page 38 301012-01151 : Rev 1 : 16-Sep-10
3.3 A Review of Available Coastal Protection Options
In order to select the most appropriate coastal protection solution(s) for the area requiring beach
erosion management (highlighted in the previous section), a review of existing options is proposed
hereinafter, as summarised in Figure 3-7:
Do Nothing / Managed Recession
Dune Management
Beach Nourishment
Seawall and Buried Seawall
Groynes
Detached Breakwaters
Artificial Reefs
Beach Drainage
Material for Coastal Structure Construction
3.3.1 Do Nothing
With this option, no interference with the natural coastal processes will occur. On one hand, the
associated fiscal cost could appear less than that associated with implementing coastal management
options.
However, the popular beach amenity would suffer from episodic erosion. It will result in a lack of
adequate beach width and access to the beach. The amenity of the beach would be reduced and the
foreshore infrastructure would remain at risk of erosion and eventually being damaged or lost from
erosion processes. Moreover the cost for lose of land or infrastructure might be higher than the cost
of another coastal management option.
3.3.2 Managed Recession
This option consists of sacrificing a part of the foreshore and relocating infrastructure to an adequate
development setback to allow the beach to respond naturally to the coastal processes and develop a
more suitable alignment. Existing infrastructure would be relocated in an orderly fashion, rather than a
response to storm damage. In the meantime, the eroded material entering the system during
foreshore recession would often reduce or prevent erosion further along the coast.
CITY OF GERALDTON-GREENOUGH
COASTAL PROCESSES STUDY - GREYS BEACH TO SUNSET BEACH
A PROJECT OF THE COASTAL VULNERABILITY AND RISK ASSESSMENT PROGRAM
\\perworfil1\infstruclib\projects\i01151 geraldton-greenough coastal process study\2.0 reports\i01151-00-cs-rep-001_rev1.doc
Page 39 301012-01151 : Rev 1 : 16-Sep-10
However, a section of the foreshore would be sacrificed. The beach would be relatively narrow while
the foreshore recedes. The beach would also require maintenance works to provide adequate beach
access, remove undermined vegetation and batter the eroded scarps to ensure public safety.
Specific studies and actions will be required to guide Managed Recession appropriately.
3.3.3 Dune Management
The dunes present on the foreshore play an important role in providing a buffer to erosion. It should
be considered good practice to implement a dune management plan despite any coastal protection
options selected.
During intense storms, sand is removed from the beach to form an offshore bar, which includes
erosion of the sand buffer reserves held in the dunes. The maintenance of sufficient sand storage
relies on effective dune management, which is based on maintenance of a satisfactory vegetative
cover. This requires the introduction of appropriate plant species and defined access/walkways over
the dunes to maintain their health. Beach vegetation stabilises the sand that returns during calm
weather. Plants have an important function of stabilising seaward of the permanent dune crest and
act to modify the local onshore wind field to enhance sand deposition onto the dune field. These
areas provide a ‘buffer zone’ that stores the sand so that during storm events it is available to
naturally protect the coast.
Dune management is very successful where a wide dune area is or was previously present and there
is an abundant source of sediment. Where only a small width of beach is present, dune management
can be applied in conjunction with other coastal protection measures that result in the widening of the
beach. However, existing coastal processes need to be considered before dune management is
applied.
3.3.4 Beach Nourishment
GENERAL CONSIDERATIONS
Where there is insufficient sediment on a beach to meet storm erosion or long-term sediment loss,
additional sediment can be placed by mechanical means, as is presently done along the northern
beaches. Beach nourishment involves the artificial placement of sand onto a beach to replace sand
that has been lost through erosion. The nourishment forms a ‘buffer’ against storm erosion and
erosion processes from longshore sediment gradients. It is recommended where nourishment is
undertaken, that it occurs over the whole beach profile including the part of the beach below the water
out to depths where storm waves are breaking.
Beach nourishment promotes amenity and natural character in the form of a wide sandy beach and
generally, it does not have adverse effects on adjacent areas. Beach nourishment can provide total
protection if sufficient sand is used.
CITY OF GERALDTON-GREENOUGH
COASTAL PROCESSES STUDY - GREYS BEACH TO SUNSET BEACH
A PROJECT OF THE COASTAL VULNERABILITY AND RISK ASSESSMENT PROGRAM
\\perworfil1\infstruclib\projects\i01151 geraldton-greenough coastal process study\2.0 reports\i01151-00-cs-rep-001_rev1.doc
Page 40 301012-01151 : Rev 1 : 16-Sep-10
Beach nourishment is in many cases undertaken in conjunction with some form of sand retention
device such as groynes (Cottesloe, WA), submerged reefs (Narrowneck, Queensland), or detached
breakwaters, as is the case of the beach north of the Batavia Coast Marina. This combination of
coastal protection methodologies is undertaken to slow or reduce the amount of nourishment and if
necessary address the restraints where insufficient source materials are available or the source is
unsustainable.
Beach nourishment works within the influence of naturally occurring coastal processes and provides a
buffer zone in the form of beach sand. It has a positive impact on the beach amenity and aesthetics in
the form of a wide sandy beach. Sand retention devices can be implemented to increase the
residence time of the nourishment material, or provide a last line of defence if the risk of storm
erosion to developments is high.
Beach nourishment projects have the potential to cause substantial effects on the biota residing in the
nearshore area. These effects can be quantified only though the results of monitoring programs.
Short term impacts include direct burial of the animals that reside in the area and lethal or damaging
doses of turbidity. Long term impacts include a long term source of turbidity which affects light
penetration and altered sediment compositions which can affect the type of animal that will inhabit the
area.
SAND GRAIN S IZ ING
The equilibrium beach profile is predicted by the “Bruun profile”. This physical low establishes a
relationship between the grain size and the beach slope after reworking by the wave action. The
larger the sediment grain size the steeper the slope. Therefore, if the sediment used for beach
nourishment purpose is smaller than the original sand in terms of grain size, an increased quantity of
sediment is required to match the expected beach profile.
North of the Batavia Coast Marina and at Sunset Beach the sand particle diameter (D50) is
approximately 0.35 mm. The sand at Pages Beach and from the STC Project are about 0.2 mm and
0.25 mm respectively. MRA (2003) predicted that a significant portion of the sand nourishment would
be lost from the beach under the action of the waves; more than half of the sand would be lost though
beach profile rework. Processing of the transect survey data undertaken in section 2.2 confirmed this
prediction. In one year, about 50% of the 89,000 m3 of sand used for the original STC sand
nourishment north of the BCM has been lost through wave action. From the Shore Protection Manual
(1984), the overfill factor associated with the STC sand for a beach nourishment along Champion Bay
is 1.9 so a predicted loss of 48%.
Quantities of beach nourishment need to consider the influence of this parameter. In fact, the
deficiency observed in quantities of nourishment on the northern beaches can be partly explained by
this difference.
CITY OF GERALDTON-GREENOUGH
COASTAL PROCESSES STUDY - GREYS BEACH TO SUNSET BEACH
A PROJECT OF THE COASTAL VULNERABILITY AND RISK ASSESSMENT PROGRAM
\\perworfil1\infstruclib\projects\i01151 geraldton-greenough coastal process study\2.0 reports\i01151-00-cs-rep-001_rev1.doc
Page 41 301012-01151 : Rev 1 : 16-Sep-10
3.3.5 Seawall and Buried Seawall
Seawalls or revetments are shore parallel structures that are put in place to impose a landward limit
to coastal erosion and to provide protection to the area behind it. Seawalls are designed to protect the
land and associated land-based amenities behind them and can be described as “a last line of
defence” to coastal erosion.
Seawalls are commonly built of many materials including rock, concrete, steel, timber, geotextiles,
tyre mattresses, or specially designed armour units. Isolated sections of seawall may exacerbate
erosion on unprotected sections of a beach. Continual maintenance of the structures will be required
along with nourishment of the beach in front to make this solution effective.
Seawalls are designed to protect the land and address the effects of erosion rather than the cause.
They have a negative impact on the beach amenity, access and aesthetics if a proper beach
nourishment program is not associated with this option. The beach is generally narrowest along the
seawall due to negative impact.
However, by combining seawall, beach nourishment and dune management, a buried seawall allows
the maintenance of the beach amenity and aesthetics, and provides a last line defence again storm
erosion.
Figure 3-7a and Figure 3-7b illustrates the schematic impact of a seawall on the shoreline evolution.
Without beach replenishment, beach erosion is generally observed downdrift of the structure. If
correct beach replenishment is applied, the seawall does not influence the sediment transport and no
negative impact on the shoreline adjacent to the structure is expected. Moreover, there is no negative
impact on the beach along the buried seawall as it is designed to support a dune system.
The buried seawall along Town Beach, in combination with beach nourishment, contributes to the
protection of the foreshore amenity. It provides protection against wave action during storm events
where the buffering volume of sand has been transported offshore. However, as experienced during
recent storms, the seawall could be extended along the full extent of the beach to fully protect the
foreshore development.
3.3.6 Groynes
Groynes are coastal structures built of similar materials as seawalls, but oriented approximately
shore-normal. They function best on beaches with a predominant longshore transport direction as
they form a cross-shore barrier, which traps sand that moves along the shore with the littoral drift.
As described on Figure 3-8a and Figure 3-8b, the width of the beach tends to increase on the
upstream side. This reduces sand supply down-drift of the groyne and erosion can result. Groynes
may have an impact on swimming safety, aesthetic impacts and may reduce the alongshore beach
access. It may be necessary to use groynes throughout the entire littoral cell in order to balance the
longshore sediment transport.
CITY OF GERALDTON-GREENOUGH
COASTAL PROCESSES STUDY - GREYS BEACH TO SUNSET BEACH
A PROJECT OF THE COASTAL VULNERABILITY AND RISK ASSESSMENT PROGRAM
\\perworfil1\infstruclib\projects\i01151 geraldton-greenough coastal process study\2.0 reports\i01151-00-cs-rep-001_rev1.doc
Page 42 301012-01151 : Rev 1 : 16-Sep-10
Downstream erosion can be avoided by filling the groyne embankment under a beach nourishment
programme, and dune management measures can be used both up-drift and down-drift to
accommodate changes in the beach and dune systems. Moreover, it is good practise to saturate the
updrift area with sand.
Groynes do not reduce the cross-shore movement of sand during storms. Their effect is to build up a
sand buffer. It is therefore possible to design a groyne with adequate dimensions in order to obtain a
buffer zone wide enough to absorb erosion during storm events (Figure 3-8a). Along the downdrift
section, a seawall can be constructed to protect the inland development against storm erosion.
3.3.7 Detached Breakwaters
Detached breakwaters are oriented approximately parallel to the beach and at some distance
offshore. They have been used typically along coastlines with small tidal fluctuations to reduce wave
energy and thus control the longshore sand transport processes.
Detached breakwaters provide protection by reducing the energy in their lee and thereby, reducing
gradients in sediment transport potential that cause coastal erosion. Material is deposited in the zone
of reduced wave energy forming a salient or tombolo.
In general, detached breakwaters are suited to coastlines that require higher levels of protection at
sensitive points. They should be used in situations where there is no alongshore net sediment
transport. After construction, a large quantity of sand and regular renourishment has to be provided in
order for the beach to reach an equilibrium profile as shown in Figure 3-9 .
In case of sensitive downdrift beaches, the breakwaters can cause downdrift erosion, and due to the
high annual variability in longshore transport, their effectiveness can be limited.
Along the Northern Beaches, the longshore sediment transport is significant. The existing breakwater
north of the Batavia Coast Marina was designed to create a stable pocket beach. Because of the
formation of tombolo, the sand bypassing has been significantly reduced. The quantity of sand
bypassing is less than the potential sediment transport, resulting in erosion downdrift of this
breakwater.
3.3.8 Artif icial Reefs
These structures are another form of detached breakwater. Wave energy is dissipated on the reef
resulting in less energy at the beach in the lee of the reef and the deposition of sediment by balancing
wave energy transmission over the crest and around the structure.
A good example of a multi-purpose reef is the Narrowneck reef on the Gold Coast in Queensland,
Australia. The Narrowneck case also has an on-going beach nourishment scheme in place for the
Gold Coast.
CITY OF GERALDTON-GREENOUGH
COASTAL PROCESSES STUDY - GREYS BEACH TO SUNSET BEACH
A PROJECT OF THE COASTAL VULNERABILITY AND RISK ASSESSMENT PROGRAM
\\perworfil1\infstruclib\projects\i01151 geraldton-greenough coastal process study\2.0 reports\i01151-00-cs-rep-001_rev1.doc
Page 43 301012-01151 : Rev 1 : 16-Sep-10
They can provide shoreline protection with low environmental impact. Because the structure is
underwater, visual aesthetics are not impaired. Artificial reefs can improve marine ecology and
improve fish stocks. There is no, or low, negative aesthetic, access or safety impacts, and amenity
value can be enhanced
One disadvantage of a reef that it forms a hazard to navigation and has to be placed far from the
shipping channel.
Artificial reefs could be an attractive solution to apply at Geraldton. However, this type of device is
relatively new and the number of structures existing around the world is still limited. It should also be
noted that they can have similar characteristics as groynes and breakwaters. The design of these
structures is complex and their perceived performance is significantly affected where high seasonal
and annual variability in transport processes is observed. Moreover there would be a significantly
higher investigation cost and would require a specific and expensive strategy of monitoring /
implementation over several years.
As documented by Ranasinghe (2006), contrary to expectations, the majority of submerged structures
constructed to date have resulted in shoreline erosion in their lee: “Before engineering design
guidelines can be developed for submerged coastal protection structures, a fundamental research
challenge is to establish the mechanisms that cause erosion or accretion in their lee”.
However, there is growing interest in the concept that the submerged structure can be optimised to
enhance local surfing conditions. Surfing is a stimulus for industry, job creation and tourism.
Improving local recreational facilities increases a regions ability to attract regional and national surfing
contests, particularly weekend events in autumn and winter, which provide massive boosts for the
local tourism industry and help stimulate job creation.
There is therefore a need for a specific socio economic impact study for the submerged coastal
structure option, as was made for the Mohamet’s artificial Surfing Reef study (Rafanelli, 2004).
3.3.9 Beach Drainage
Beach drains comprise perforated land drain pipes buried below the upper beach surface, and
connected to a pump and discharge. The concept is based on the principle that sand will tend to
accrete if the beach surface is permeable due to an artificially lowered water table. The system is
largely buried and therefore has no visual impact.
The system actively lowers the water table in the swash zone encouraging sand deposition. The
deposited sand forms an upper beach berm that protects the dune face during storm events that
might otherwise cause erosion.
Benefits are greatest on micro-tidal and high value amenity beaches where landscape issues
preclude the use of other management approaches. Important backshore assets should not rely on
drainage systems for erosion protection during storms, even as a temporary measure.
CITY OF GERALDTON-GREENOUGH
COASTAL PROCESSES STUDY - GREYS BEACH TO SUNSET BEACH
A PROJECT OF THE COASTAL VULNERABILITY AND RISK ASSESSMENT PROGRAM
\\perworfil1\infstruclib\projects\i01151 geraldton-greenough coastal process study\2.0 reports\i01151-00-cs-rep-001_rev1.doc
Page 44 301012-01151 : Rev 1 : 16-Sep-10
Installation costs can be relatively low, but maintenance and management commitments are high.
Although the drains should increase upper beach volume during low to moderate wave conditions
they will not be significantly effective during storms, with the result that beach draw down may lead to
exposure of the pipework and system failure.
This option is not recommended as suitable for the Geraldton shoreline owing to its inefficiency during
moderate wave conditions and storms.
3.3.10 Material for Coastal Structure Construction
Several alternatives exist to the use of rock in the construction of coastal structures. Another
alternative is the use of geotube or geotextiles. They are large tubes fabricated from high strength
woven geotextile, which can be use in place of rock armoured seawall, groynes or breakwaters.
Geotextiles are permeable fabrics which are able to hold back materials while allowing water to flow
through. Typically, these tubes are strategically positioned in the desired location and filled with a
sand slurry mixture to form a permanent structure. These tubes are generally about 1 to 2m in
diameter though they can be sized for any application. The tubes can be used singularly or stacked to
add height and can be constructed to any length depending on the required use.
Experience has shown that geotubes are vulnerable to damage by vandals, which can lead to
reduced effectiveness of the structure through loss of fill material. Geotubes have also been known to
sag with time, resulting in reduction in the design height and thus the effectiveness of the structure.
Moreover, positioned on rocky seabed as it is the case in Geraldton, the geosynthetic material can be
damaged.
Owing to the relative availability of rock in the region and the problems and unknown associated with
the effectiveness and longevity of geotubes, the use of rock materials is recommended at Geraldton
where the coastal structures are adopted as part of a coastal management solution.
3.4 Social Impacts of Selected Options
The coastline from Grey’s Beach to Sunset beach is intensively used for a range of activities. The
diversity of the coastal setting and nearshore and inshore reefs are part of this valuable community
asset. The entire coastline is well utilised for recreation including swimming (where possible), walking,
jogging, riding (on the dual path or on the sandy beaches), snorkelling on the inshore reefs,
windsurfing (especially along the Northern part of the Northern Beaches), rock lobster fishing on and
around the reefs, sailing (using of the boat ramp at St George’s Beach for launching), picnicking and
barbecues.
It is therefore a necessity to maintain the beach amenities and aesthetics in order to maintain the
attractiveness of the area. Experience has shown that the use of coastal structures is typically less
desirable from a social perspective in these circumstances and it should be limited to a few critical
locations because of their visually intrusive nature and potential interference to beach users and
coastal residents.
CITY OF GERALDTON-GREENOUGH
COASTAL PROCESSES STUDY - GREYS BEACH TO SUNSET BEACH
A PROJECT OF THE COASTAL VULNERABILITY AND RISK ASSESSMENT PROGRAM
\\perworfil1\infstruclib\projects\i01151 geraldton-greenough coastal process study\2.0 reports\i01151-00-cs-rep-001_rev1.doc
Page 45 301012-01151 : Rev 1 : 16-Sep-10
Sand nourishment requires the presence of trucks and earthmoving equipment on the beach.
Earthmoving equipment is loud to beach users and residents. This work requires beach access to be
limited during the works, disturbs beachside residents and prevents visitors from using the beaches.
Transport of material has a minor impact on the road user for the duration of the works
The use of pipeline systems can minimise the need for earthmoving machinery and trucks on
beaches and suburban roads. Nevertheless, some negative impacts on the community will be
associated with the strategy. For example, a significant but short-term consequence will be the effect
on beach amenities and public safety during construction of pipelines and booster stations. It is likely
that some beach areas will need to be fenced. A piping system would cause some inconvenience due
to noise levels and reduced amenities but the sand is transferred at a much higher rate than the
method of trucking.
In the case of the Geraldton-Greenough shoreline, the quantities of renourishment are small and
typically do not warrant present bypassing systems.
3.5 Environmental Impact of Selected Options
Possible environmental impacts from the dredging and replenishment programme and the
construction of seawalls or breakwaters in critical locations include construction on seagrass
meadows, turbidity during construction causing light attenuation and/or sedimentation, impacts on
benthic fauna, creation of conditions suitable for pest species, and environmental effects on sand
source areas. The use of trucks for sand bypassing (or land imported sand) will result in greenhouse
gas emissions.
The potential impacts shall be monitored and minimised as much as possible to reduce the risks to
the coastal ecosystem. Detailed assessments of this risk would be required as part of the design and
environmental assessment process. However, benthic fauna are generally capable of quick recovery
if disturbed. Dune rehabilitation works shall be undertaken in affected areas where dune flora and
fauna are disrupted.
CITY OF GERALDTON-GREENOUGH
COASTAL PROCESSES STUDY - GREYS BEACH TO SUNSET BEACH
A PROJECT OF THE COASTAL VULNERABILITY AND RISK ASSESSMENT PROGRAM
\\perworfil1\infstruclib\projects\i01151 geraldton-greenough coastal process study\2.0 reports\i01151-00-cs-rep-001_rev1.doc
Page 46 301012-01151 : Rev 1 : 16-Sep-10
4. DISCUSSION OF COASTAL PROTECTION OPTIONS
4.1 Coastal Processes
Based on the literature review of historical work and sediment budget analysis carried out by
WorleyParsons, the sediment transport of the region has significant spatial and temporal variations
that are driven by the bathymetry and wave climate. WorleyParsons has also carried out numerical
modelling of wave and sediment transport to assess the shoreline evolution along the Geraldton-
Greenough coastline.
The results of this study have shown a number of key observations, which define the background of
the coastal dynamics for this area as follows:
The coastal cell between Point Moore and Glenfield beach is a well defined cell where a
significant amount of survey and historical data sets exist which allow sediment budgets to
be assessed;
The sediment transport potential within this cell is dynamic and can have significant annual
variation;
The sediment budget of this cell is in deficit, on an annual average, with sediment being lost
through the northern boundary and offshore.
Conditions at specific beaches, after five years of the Northern Beaches Stabilisation Programme, are
summarised in Figure 2-15, from which the following observations can be drawn:
Town beach is relatively stable but is exposed to crosshore transport during storm events;
A large quantity of sediment remains available along Pages Beach which has been
accreting over the last five years ;
The section between the Batavia Coast Marina and the offshore breakwater has remained
stable with replenishment. North of the breakwater, erosion is observed. A long stretch of
Shoreline (Mabel St to Chapman River) is relatively stable, slightly in accretion;
In the absence of stabilisation work, Grey’s Beach and Sunset Beach have been eroding.
The WorleyParsons approach and scope of work focused on the general understanding of the coastal
processes, as this is essential for design of successful coastal protection solutions. As demonstrated
by the observations in the historical work as well as the modelling which has been undertaken for this
study, the management strategies need to deal with:
the high potential for longshore sediment transport between the Northern Beaches, Sunset
Beach and Glenfield Beach;
the influence of seasonal variations on the longshore transport, especially at Sunset Beach;
CITY OF GERALDTON-GREENOUGH
COASTAL PROCESSES STUDY - GREYS BEACH TO SUNSET BEACH
A PROJECT OF THE COASTAL VULNERABILITY AND RISK ASSESSMENT PROGRAM
\\perworfil1\infstruclib\projects\i01151 geraldton-greenough coastal process study\2.0 reports\i01151-00-cs-rep-001_rev1.doc
Page 47 301012-01151 : Rev 1 : 16-Sep-10
The high potential impact of the Chapman River’s role as primary sediment source/sink of
the Champion Bay cell.
4.2 General Considerations
Successful long-term coastal protection solutions seek to directly address and work with the natural
physical processes responsible for the erosion problems. At Geraldton, beach renourishment in
combination with supplementary coastal structures to reduce sediment loss by alongshore and
crosshore sediment transport or to provide a last line of defence are all plausible solutions. Due to the
complexity of the coastal processes, involving changes at different spatial and temporal scales, a
unique and universal solution does not exist to mitigate the coastal erosion problems. In many cases,
the final solution is driven by aesthetics and social values.
From the coastal vulnerability assessment corresponding to a 20 year period, the areas requiring
beach protection management are:
The section North of the detached breakwater
Sunset Beach
South of Chapman River (Frederick Street)
Grey’s Beach
The areas requiring Active Beach Monitoring to detect future threat to the existing development are:
The section between Elphick Avenue and Champion Bay Rise
The section in the area of Morris Street and Cecily Street.
Point Moore (along the Car Park)
Pages Beach
Town Beach
The “Do Nothing” or “Managed Recession” solution for the Northern Beaches and Sunset Beach
(Figure 4-1 and Figure 4-2) will show gradual recession and an increased area of beach and
development placed under threat of erosion. Analysis of the outcome is important as it demonstrates
the need for an adequate coastal management plan.
As shown on Figure 4-3, continuation of the present Northern Beaches Stabilisation Programme will
not prevent shoreline erosion north of the detached breakwater. Therefore, an adjustment of the
programme is required.
CITY OF GERALDTON-GREENOUGH
COASTAL PROCESSES STUDY - GREYS BEACH TO SUNSET BEACH
A PROJECT OF THE COASTAL VULNERABILITY AND RISK ASSESSMENT PROGRAM
\\perworfil1\infstruclib\projects\i01151 geraldton-greenough coastal process study\2.0 reports\i01151-00-cs-rep-001_rev1.doc
Page 48 301012-01151 : Rev 1 : 16-Sep-10
Regarding the relative quantities of sand involved in the sediment transport processes in Geraldton (a
few thousands of cubic metres compared to hundreds of thousands in the Gold Coast, for example),
sand nourishment and dune management is a sound base case from which comparisons can be
made. This sand nourishment option combines effectiveness, aesthetics and public safety aspects.
Sand for beach renourishment can be sourced from:
Pages Beach (sand bypassing): present extraction is 10,500 m3/year, which may be
increased up to 17,000 m3/year. As the sand from Pages Beach is finer than the sand along
the other beaches, sand nourishment from this source requires larger quantities of sand.
However, the present profile has to be maintained to ensure sufficient buffer against storm
erosion.
External sources of sand: sand with coarser grain size is recommended if external sand is
used for beach renourishment.
In addition to the sand replenishment program, coastal structures can be used where required for
local protection
Beach nourishment needs to be undertaken in conjunction with another form of sand retention device
in order to reduce sediment loss by longshore and crosshore sediment transport.
Appropriate coastal structures for the study area can be:
Groynes and sand replenishment: used for beach stabilisation. The groynes have to be
designed so that a balance is achieved between having a buffer for storm erosion and not
trapping an excessive volume of sand. This is to minimise the amount of sediment
required to fully saturate the area and the longshore sediment transport can continue.
Buried Seawalls: used as last line of defence against storms but would need to be
combined with regular sand nourishment
Artificial reefs or detached breakwater, whilst adaptable for this area, would require significantly
higher investigation cost and a specific and expensive strategy of monitoring and implementation over
several years. The design and performance of these structures is complex and warrant this level of
investigation.
To assist in the selection of a suitable combination of costal protection components, Table 4.1
compares the listed options in term of effectiveness, aesthetic and public safety. The green colour
shading indicates that the option is highly recommended and fully meets the requirement
(effectiveness, aesthetic or public safety. The yellow colour shading indicates that the option is
recommended and meets the majority the requirement of the column providing certain conditions.
Orange colour shading indicates potential negative impact on the considered requirement.
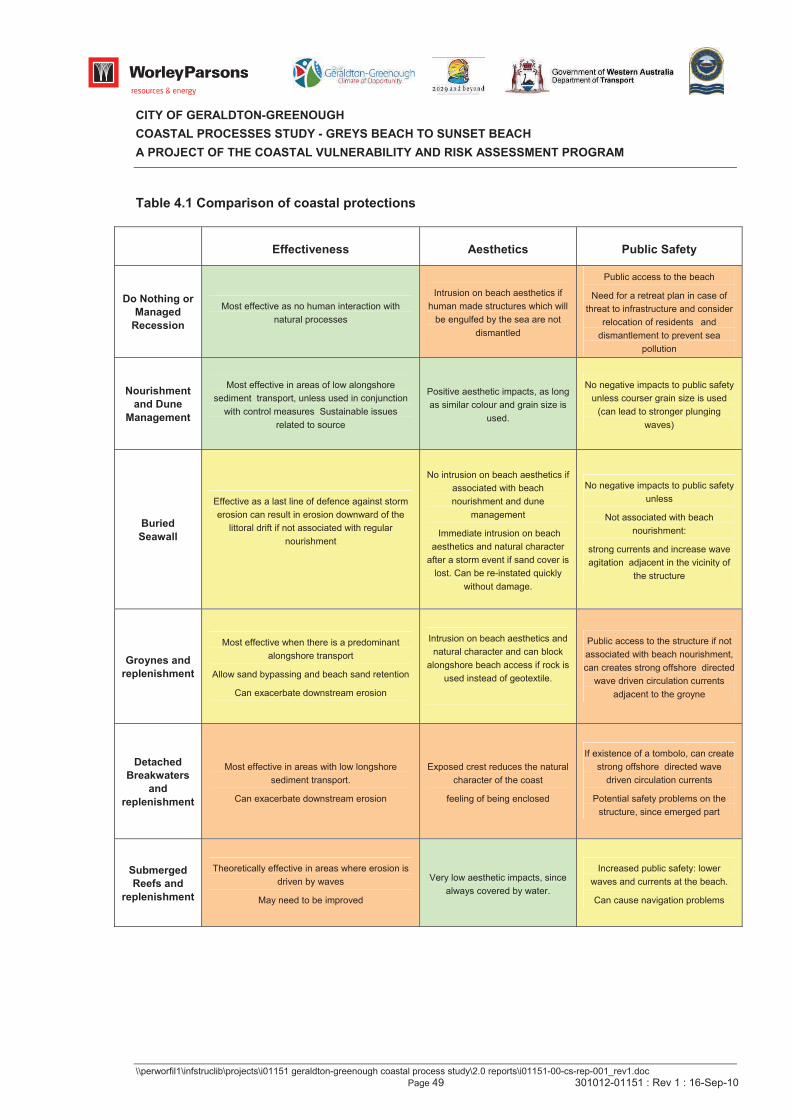
CITY OF GERALDTON-GREENOUGH
COASTAL PROCESSES STUDY - GREYS BEACH TO SUNSET BEACH
A PROJECT OF THE COASTAL VULNERABILITY AND RISK ASSESSMENT PROGRAM
\\perworfil1\infstruclib\projects\i01151 geraldton-greenough coastal process study\2.0 reports\i01151-00-cs-rep-001_rev1.doc
Page 49 301012-01151 : Rev 1 : 16-Sep-10
Table 4.1 Comparison of coastal protections
Effectiveness Aesthetics Public Safety
Do Nothing or
Managed
Recession
Most effective as no human interaction with
natural processes
Intrusion on beach aesthetics if
human made structures which will
be engulfed by the sea are not
dismantled
Public access to the beach
Need for a retreat plan in case of
threat to infrastructure and consider
relocation of residents and
dismantlement to prevent sea
pollution
Nourishment
and Dune
Management
Most effective in areas of low alongshore
sediment transport, unless used in conjunction
with control measures Sustainable issues
related to source
Positive aesthetic impacts, as long
as similar colour and grain size is
used.
No negative impacts to public safety
unless courser grain size is used
(can lead to stronger plunging
waves)
Buried
Seawall
Effective as a last line of defence against storm
erosion can result in erosion downward of the
littoral drift if not associated with regular
nourishment
No intrusion on beach aesthetics if
associated with beach
nourishment and dune
management
Immediate intrusion on beach
aesthetics and natural character
after a storm event if sand cover is
lost. Can be re-instated quickly
without damage.
No negative impacts to public safety
unless
Not associated with beach
nourishment:
strong currents and increase wave
agitation adjacent in the vicinity of
the structure
Groynes and
replenishment
Most effective when there is a predominant
alongshore transport
Allow sand bypassing and beach sand retention
Can exacerbate downstream erosion
Intrusion on beach aesthetics and
natural character and can block
alongshore beach access if rock is
used instead of geotextile.
Public access to the structure if not
associated with beach nourishment,
can creates strong offshore directed
wave driven circulation currents
adjacent to the groyne
Detached
Breakwaters
and
replenishment
Most effective in areas with low longshore
sediment transport.
Can exacerbate downstream erosion
Exposed crest reduces the natural
character of the coast
feeling of being enclosed
If existence of a tombolo, can create
strong offshore directed wave
driven circulation currents
Potential safety problems on the
structure, since emerged part
Submerged
Reefs and
replenishment
Theoretically effective in areas where erosion is
driven by waves
May need to be improved
Very low aesthetic impacts, since
always covered by water.
Increased public safety: lower
waves and currents at the beach.
Can cause navigation problems
CITY OF GERALDTON-GREENOUGH
COASTAL PROCESSES STUDY - GREYS BEACH TO SUNSET BEACH
A PROJECT OF THE COASTAL VULNERABILITY AND RISK ASSESSMENT PROGRAM
\\perworfil1\infstruclib\projects\i01151 geraldton-greenough coastal process study\2.0 reports\i01151-00-cs-rep-001_rev1.doc
Page 50 301012-01151 : Rev 1 : 16-Sep-10
4.3 Coastal Protection Options: Area Specific Options
4.3.1 Northern Beaches
Along the Northern Beaches, the following options could mitigate coastal erosion issues:
Increasing the sand renourishment volumes and deposition by 10,000 m3/year north of the
detached breakwater (Figure 4-4): an adjustment of the NSBP would allow maintaining the
present shoreline position providing 22,500 m3/year of sand renourishment. However, if the
beach was maintained at its present position, there would not be sufficient buffer to protect
infrastructures such as the pathway, barbecue, picnic areas, etc;
buried seawall of 300m combined with regular renourishment of 22,500 m3/year (Figure 4-5)
groyne, located 400m north of the breakwater, with an initial sand replenishment of about
100,000 m3and ongoing renourishment of 22,500 m
3/year would allow a buffer to be
established against storm erosion (Figure 4-6);
Similar option than the above item but with an additional 150m seawall north of the groyne
to prevent threat from any unexpected downdrift erosion or rip current cell (Figure 4-7).
4.3.2 Sunset Beach
Implantation of structures such as a groyne, detached breakwater or artificial reef is not
recommended near the Chapman River due to the high seasonal and annual variability of the
longshore transport direction in this area and the complexity of sediment dynamics at the Chapman
River Mouth. The river can indeed discharge a large quantity of sediment, which may bury or expose
the structure, potentially causing unpredictable behaviour at river mouth and upstream. Moreover,
such structures are also likely to interact negatively with the river discharge (for example by blocking
the discharge flow). Therefore, a structure having no impact on the sediment transport such as the
implementation of buried seawall is preferred in this application.
At Sunset Beach, in the absence of an erosion control solution (Figure 4-2), the Caravan Park and
adjacent public car parks may be threatened. The following options could mitigate coastal erosion
issue and provide sufficient buffer against storm erosion to protect the Caravan Park and other
developments:
initial beach nourishment of 100,000 m3 combined with regular renourishment of 10,000
m3/year;
Buried seawall of 300m combined with regular renourishment of 10,000 m3/year (Figure 4-
8).
4.3.3 South of Chapman River
South of Chapman River, the shoreline is relatively stable but the setback distance is not sufficient
according to the 20 year coastal vulnerability assessment.
CITY OF GERALDTON-GREENOUGH
COASTAL PROCESSES STUDY - GREYS BEACH TO SUNSET BEACH
A PROJECT OF THE COASTAL VULNERABILITY AND RISK ASSESSMENT PROGRAM
\\perworfil1\infstruclib\projects\i01151 geraldton-greenough coastal process study\2.0 reports\i01151-00-cs-rep-001_rev1.doc
Page 51 301012-01151 : Rev 1 : 16-Sep-10
As described above, the implantation of structures such as a groyne, detached breakwater or artificial
reef is not recommended near the Chapman Rive. A buried seawall of 150m should provide the
required protection for the developments in this area (Figure 4-9)
4.3.4 Grey’s Beach
At Grey’s Beach, following the same basis of avoiding impact on sediment transport, similar options
could mitigate coastal erosion issues and provide sufficient buffer against storm erosion to protect the
car park:
Initial beach nourishment of 10,000 m3 combined with regular renourishment of 2,000
m3/year
Buried seawall of 150m combined with regular renourishment of 2,000 m3/year (Figure 4-
10).
4.3.5 Net Present Value
Table 4.2 presents a high level cost estimate of different options ranging from beach renourishment to
groyne and seawall. The costs have been estimated for the different individual options presented
above and correspond to the costs for the different annual volume of sand bypassing, initial
nourishment and the different costal structures (“40m groyne and 150m seawall” or “300m seawall“
for the Northern Beaches, “300m seawall” for Sunset Beach, “150m seawall” south of Chapman
River, “50m seawall” for Grey’s Beach). Details of these estimates are presented in Appendix F.
For a high level estimate of the financial outcomes of the various options including up-front costs and
ongoing maintenance, a Net Present Value assessment is necessary. For this purpose, the Net
Present Value of cost over a 20 year period is presented in Table 4.3 for different options based on
indicative costs.
In finance, the Net Present Value (NPV) of a time series of cash flows is defined as the sum of the
present value of the individual cash flows. NPV is a standard method for using the time value of
money to appraise long-term projects. The discount rate is an interest rate a central bank charges
depository institutions that borrow reserves from it. Therefore, for a study case, three different
discount rates were used in order to provide an indicative range of NPVs.
Indicative values of NPVs for the “Do Nothing” or “Managed Recession” solution are also presented to
allow comparison. For the “Do Nothing” options, NPVs have been calculated considering the present
value of the assets (roads, houses, various infrastructures etc) on threat according to the 20 year
coastal vulnerability assessment. The “Managed Recession“ option is specific of sunset Beach. For
this option, the cost to move the facilities back has been considered.
In the evaluation of options for Geraldton, the use of buried seawall with ongoing nourishment and
dune management offers a balanced solution with comparative NPV meeting the high level of
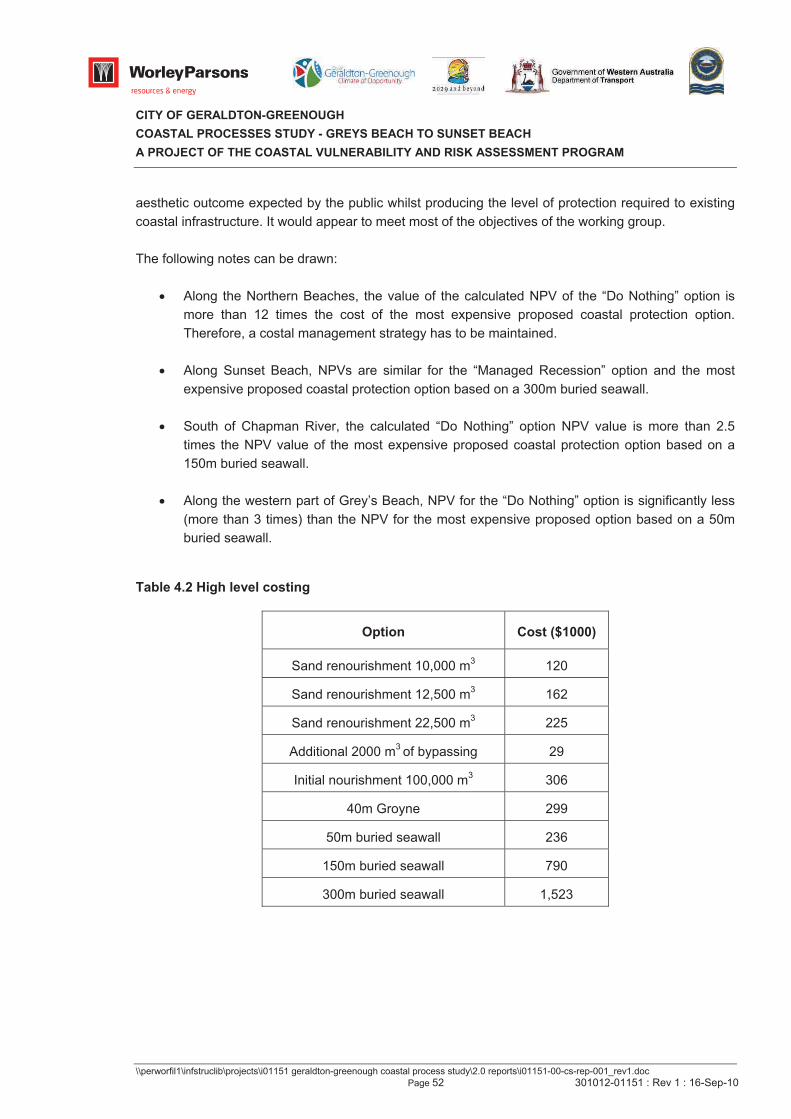
CITY OF GERALDTON-GREENOUGH
COASTAL PROCESSES STUDY - GREYS BEACH TO SUNSET BEACH
A PROJECT OF THE COASTAL VULNERABILITY AND RISK ASSESSMENT PROGRAM
\\perworfil1\infstruclib\projects\i01151 geraldton-greenough coastal process study\2.0 reports\i01151-00-cs-rep-001_rev1.doc
Page 52 301012-01151 : Rev 1 : 16-Sep-10
aesthetic outcome expected by the public whilst producing the level of protection required to existing
coastal infrastructure. It would appear to meet most of the objectives of the working group.
The following notes can be drawn:
Along the Northern Beaches, the value of the calculated NPV of the “Do Nothing” option is
more than 12 times the cost of the most expensive proposed coastal protection option.
Therefore, a costal management strategy has to be maintained.
Along Sunset Beach, NPVs are similar for the “Managed Recession” option and the most
expensive proposed coastal protection option based on a 300m buried seawall.
South of Chapman River, the calculated “Do Nothing” option NPV value is more than 2.5
times the NPV value of the most expensive proposed coastal protection option based on a
150m buried seawall.
Along the western part of Grey’s Beach, NPV for the “Do Nothing” option is significantly less
(more than 3 times) than the NPV for the most expensive proposed option based on a 50m
buried seawall.
Table 4.2 High level costing
Option Cost ($1000)
Sand renourishment 10,000 m3 120
Sand renourishment 12,500 m3 162
Sand renourishment 22,500 m3 225
Additional 2000 m3of bypassing 29
Initial nourishment 100,000 m3 306
40m Groyne 299
50m buried seawall 236
150m buried seawall 790
300m buried seawall 1,523
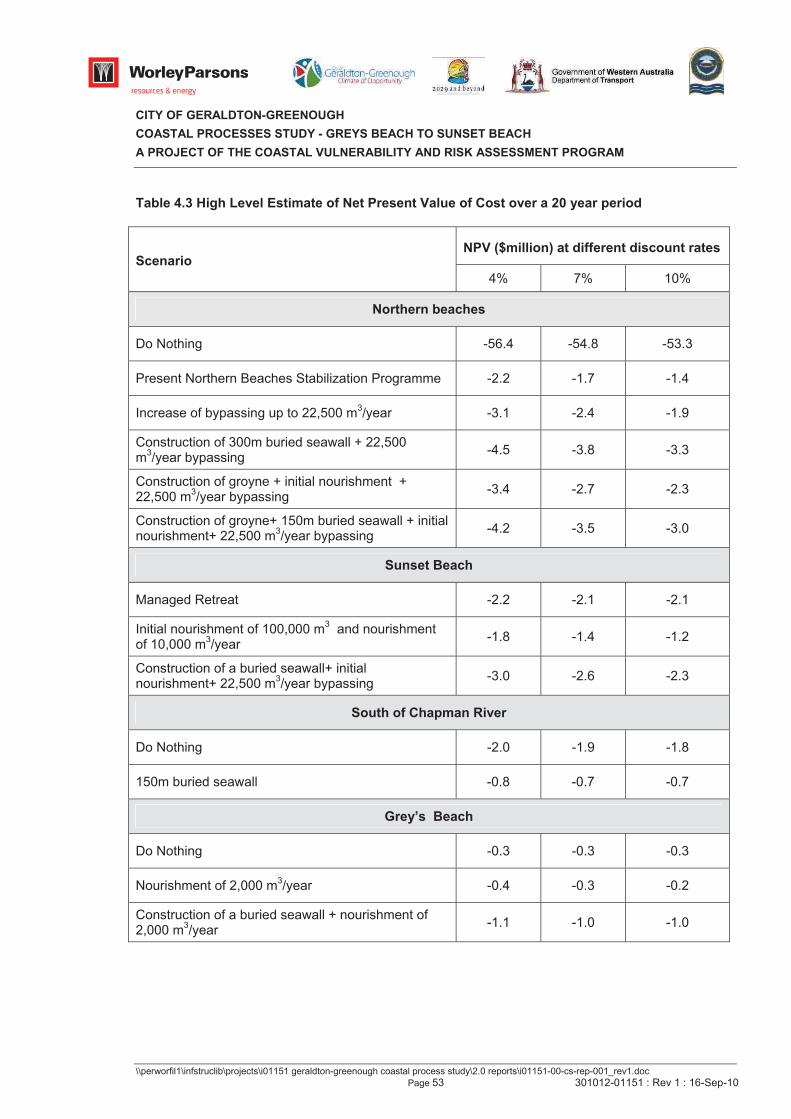
CITY OF GERALDTON-GREENOUGH
COASTAL PROCESSES STUDY - GREYS BEACH TO SUNSET BEACH
A PROJECT OF THE COASTAL VULNERABILITY AND RISK ASSESSMENT PROGRAM
\\perworfil1\infstruclib\projects\i01151 geraldton-greenough coastal process study\2.0 reports\i01151-00-cs-rep-001_rev1.doc
Page 53 301012-01151 : Rev 1 : 16-Sep-10
Table 4.3 High Level Estimate of Net Present Value of Cost over a 20 year period
NPV ($million) at different discount rates Scenario
4% 7% 10%
Northern beaches
Do Nothing -56.4 -54.8 -53.3
Present Northern Beaches Stabilization Programme -2.2 -1.7 -1.4
Increase of bypassing up to 22,500 m3/year -3.1 -2.4 -1.9
Construction of 300m buried seawall + 22,500 m
3/year bypassing
-4.5 -3.8 -3.3
Construction of groyne + initial nourishment + 22,500 m
3/year bypassing
-3.4 -2.7 -2.3
Construction of groyne+ 150m buried seawall + initial nourishment+ 22,500 m
3/year bypassing
-4.2 -3.5 -3.0
Sunset Beach
Managed Retreat -2.2 -2.1 -2.1
Initial nourishment of 100,000 m3 and nourishment
of 10,000 m3/year
-1.8 -1.4 -1.2
Construction of a buried seawall+ initial nourishment+ 22,500 m
3/year bypassing
-3.0 -2.6 -2.3
South of Chapman River
Do Nothing -2.0 -1.9 -1.8
150m buried seawall -0.8 -0.7 -0.7
Grey’s Beach
Do Nothing -0.3 -0.3 -0.3
Nourishment of 2,000 m3/year -0.4 -0.3 -0.2
Construction of a buried seawall + nourishment of 2,000 m
3/year
-1.1 -1.0 -1.0
CITY OF GERALDTON-GREENOUGH
COASTAL PROCESSES STUDY - GREYS BEACH TO SUNSET BEACH
A PROJECT OF THE COASTAL VULNERABILITY AND RISK ASSESSMENT PROGRAM
\\perworfil1\infstruclib\projects\i01151 geraldton-greenough coastal process study\2.0 reports\i01151-00-cs-rep-001_rev1.doc
Page 54 301012-01151 : Rev 1 : 16-Sep-10
4.4 Partners and Local Community Feedback
This section relates the main outcomes from the workshop consultation process held on the 24th
March 2010. Workshop Slides are presented in Appendix H.
Information collected during the workshop regarding the attendees’ preferred coastal protection option
taking into account social, ecological, economic and cultural, have been summarised and are
presented in Table G.1. Each option listed in section 4.2 has been evaluated for each factor with (1)
considered as the lowest rating and (5) considered as the highest rating. The maximum number of
votes for any factor is 90. The results of collating the information show the following facts:
4.4.1 Northern beaches
The majority of participants have favoured the option “Construction of Groyne + 150m buried seawall
+ initial nourishment+ 22,500 m3/year renourishment” as a preferred solution.
The comments indicate concern that the present replenishment program does not fully address the
erosion problems in this area. Members of the community seem to feel that beach nourishment is
inefficient and therefore they would prefer structural options.
The group of respondents did understand that the implantation could be staged until the groynes
being the final stage of the developments.
4.4.2 Sunset Beach
The majority of participants have favoured the “Do Nothing/ Managed Recession” option as a
preferred solution.
While the beach nourishment and replenishment options are considered as a suitable option in term
of social and environmental factors, this is does not meet economic requirements. The buried seawall
is not considered as a suitable option for Sunset Beach.
4.4.3 South of Chapman River
The participants expressed their needs for more information about the necessity of protecting the
developments with a buried seawall for the section South of Chapman River.
4.4.4 Grey’s Beach
At Grey’s Beach, the majority of participants have favored the option of “Managed retreat” as a
preferred solution. Further nourishment, associated or not with buried seawall, is not considered as an
economical option.
CITY OF GERALDTON-GREENOUGH
COASTAL PROCESSES STUDY - GREYS BEACH TO SUNSET BEACH
A PROJECT OF THE COASTAL VULNERABILITY AND RISK ASSESSMENT PROGRAM
\\perworfil1\infstruclib\projects\i01151 geraldton-greenough coastal process study\2.0 reports\i01151-00-cs-rep-001_rev1.doc
Page 55 301012-01151 : Rev 1 : 16-Sep-10
4.4.5 Other Comments on Coastal Protection
The questions raised during the presentation highlighted the demands for coastal structures made
from alternative material such as geotextiles.
Some participants also showed interest in a submerged structure such as an artificial reef for a
coastal protection solution.
Some participants expressed the need for more community participation though education
/awareness of ecological processes and how they impact on people, local government, building
bylaws and agency and policy restraints.
CITY OF GERALDTON-GREENOUGH
COASTAL PROCESSES STUDY - GREYS BEACH TO SUNSET BEACH
A PROJECT OF THE COASTAL VULNERABILITY AND RISK ASSESSMENT PROGRAM
\\perworfil1\infstruclib\projects\i01151 geraldton-greenough coastal process study\2.0 reports\i01151-00-cs-rep-001_rev1.doc
Page 56 301012-01151 : Rev 1 : 16-Sep-10
5. COASTAL MANAGEMENT PLANNING
The following recommendations have been drawn from the technical investigation as well as findings
from the public consultation.
5.1 General Recommendations for Coastal Management Planning
From the coastal vulnerability assessment for a 20 year timeframe, four of the areas require beach
protection management (South of Chapman River, Sunset Beach, Grey’s Beach and the section north
of the detached breakwater).
Along Sunset Beach and Grey’s Beach, currently in erosion, there is a possibility for a Managed
Recession option or beach nourishment option. For these sections and the section South of Chapman
River, the local community does not support the construction of hard structures.
Along the section north of the detached breakwater, the current erosion processes and the proximity
of developed areas justify the need for active coastal management planning. The construction of hard
structures could be required.
5.1.1 South of Chapman River
This section of shoreline is not subject to strong erosion. There is therefore no direct sign that this
area is at risk. However, the assessment of the required coastal setback (Section 3.2) demonstrated
that this area could be at risk and would require a coastal management plan for the next 20 years.
This area will be positively impacted if additional nourishment is implemented to the south, as it is
downdrift from the areas subject to renourishment. This being the case, it is preferred to monitor and
assess this location if the renourishment programme is implemented to the south.
5.1.2 Sunset Beach
Sunset Beach has a history of erosion over the past 60 years. With an average rate of erosion of
about 0.7 m/year, the seaward 30 to 40 metres of the Caravan Park is at risk of erosion. There are
currently two leases for the Caravan Park (one for the half seaward field and one for the half landward
field). At the expiration of the leases, the City of Geraldton-Greenough can change the seaward
boundary if required to allow enough buffer for managed beach recession, and renourishment to the
south can positively influence this area.
The decision to allow managed recessions based on the land available for the Caravan Park has to
be compared with the cost of protected options. If the Managed Retreat option is selected, a coastal
management plan could be required for the houses north of the Caravan Park.
CITY OF GERALDTON-GREENOUGH
COASTAL PROCESSES STUDY - GREYS BEACH TO SUNSET BEACH
A PROJECT OF THE COASTAL VULNERABILITY AND RISK ASSESSMENT PROGRAM
\\perworfil1\infstruclib\projects\i01151 geraldton-greenough coastal process study\2.0 reports\i01151-00-cs-rep-001_rev1.doc
Page 57 301012-01151 : Rev 1 : 16-Sep-10
5.1.3 Grey’s Beach
Grey’s Beach has a history of erosion over the past 60 years. The rate of erosion has increased over
recent years and the Car Park and adjacent road are currently threatened.
However, there is a minimum setback distance of about 90 metres regarding the developed area. If
the Managed Retreat option is selected, the City of Geraldton-Greenough could change the seaward
boundary of the plot to allow enough buffer for managed beach recession, by modifying the road and
car park layout.
5.1.4 North of the Detached Breakwater
This area is currently subject to erosion. This study demonstrated the need for coastal protection
structures to protect this area.
A proposed solution combines a buried seawall and groyne, which would allow creation of a sandy
beach acting as a buffer against storm erosion. These items could be staged with buried seawall and
beach nourishment followed by implementation of the groyne,
Another solution would consist of the construction of a submerged structure to reduce the sediment
transport. The effect would be to reduce the wave energy but it would not totally protect the shoreline.
5.2 Short Term Management Planning: Annual Coastal Management Programme
Regarding the relatively small quantities of sand involved in the sediment transport processes in
Geraldton (in the order of 10,000 m3
compared to 100,000 m3
on the Gold coast for example), sand
nourishment and dune management is highly recommended to maintain the beach profiles, taking
into account effectiveness, aesthetics and public safety aspects.
The Northern Beaches Stabilisation Programme (NSBP) was developed in 2004 to provide a stable
foreshore through sand bypassing processes and stabilisation works. The current requirements from
the NBSP include, in particular, beach monitoring. Results of the desktop study as part of the works
presented herein demonstrates the importance of having this accurate and detailed beach monitoring
database including beach profiles, shoreline positions and sediment transport data.
Processing of the data demonstrated the high annual variability of the volumes of the beaches as
shown in particular at Pages Beach and the Northern Beaches (section 2.2.2). The sand nourishment
volumes proposed for sand bypassing in section 4.2 correspond to the averaged trend of volume
variation based on sediment transport modelling; this provided an average estimate of how the
current sand bypassing volumes should be adjusted to maintain the existing shoreline position and
the associated estimated cost.
CITY OF GERALDTON-GREENOUGH
COASTAL PROCESSES STUDY - GREYS BEACH TO SUNSET BEACH
A PROJECT OF THE COASTAL VULNERABILITY AND RISK ASSESSMENT PROGRAM
\\perworfil1\infstruclib\projects\i01151 geraldton-greenough coastal process study\2.0 reports\i01151-00-cs-rep-001_rev1.doc
Page 58 301012-01151 : Rev 1 : 16-Sep-10
The volume of sand required to maintain the beach stability varies from year to year, mainly
depending on the wave climate and the severity of winter storms. For example, the additional volume
of sand required to maintain the beach profile north of the Batavia Coast Marina has varied from
15,000 m3/year to 5,000 m
3/year since September 2006 as presented in Table 5.1.
The Beach Management Programme aims to maintain a proposed profile over the long term by
combining Beach Monitoring and Beach Nourishment on a yearly basis.
Table 5.1 Yearly average variations along the section north of the Batavia Coast Marina since
September 2004
Period09/2004
09/2005
09/2005
09/2006
09/2006
09/2007
09/2007
11/2009
Volume variation
(m3/year)
-14,700 -12,500 -7,900 -4,600
5.2.1 Active Beach Monitoring
It is highly recommended to maintain and implement the existing monitoring programme. This
programme ranges from shoreline surveys, aerial surveys, photographic records and volumes of sand
used for the nourishments. Volumes of sand applied in the nourishment process can be recorded,
including volume by source location, dates of placement, placement location, prevailing weather
conditions, and before and after photographic records at the placement site.
The Active Beach Monitoring Programme measures deviations from the proposed profile. The survey
should be undertaken as a minimum on an annual basis at the end of summer and prior to the onset
of winter storms.
For an indication of the cost, the present Beach Monitoring Programme cost is about $8,500 per
survey (indicated by GPA, June 2010).
Analysis of the collected data will allow refinement of the estimates of averages and level of variability
in nourishment volumes.
5.2.2 Beach Nourishment
The sand characteristics used for the nourishment should be as close as possible to the
characteristics of the sand at the study site (section 3.3.4). It is anticipated that beach nourishment
will be undertaken in late summer (to avoid windy months as much as possible) and early winter each
year, prior to the onset of winter storms in order to provide an erosion buffer for the winter
CITY OF GERALDTON-GREENOUGH
COASTAL PROCESSES STUDY - GREYS BEACH TO SUNSET BEACH
A PROJECT OF THE COASTAL VULNERABILITY AND RISK ASSESSMENT PROGRAM
\\perworfil1\infstruclib\projects\i01151 geraldton-greenough coastal process study\2.0 reports\i01151-00-cs-rep-001_rev1.doc
Page 59 301012-01151 : Rev 1 : 16-Sep-10
In the event of a major storm, which causes greater erosion than annual episodic storm events,
specific actions must be carried out to resolve any resulting beach damage.
5.2.3 Annual Management
The objective is to maintain a targeted profile by using a yearly management programme involving the
following steps (summarized on Figure 5-1):
Monitoring
Assessment of the amount of sand accreted or eroded each year
Active beach nourishment
The beach nourishment can be undertaken through sand bypassing using sand sourced from Pages
Beach or imported sand from external sources.
5.3 Medium Term Management Planning: Implementation of Coastal Structures
Options have been proposed to manage coastal vulnerability for the next 20 years (Section 4). The
use of coastal structures is not supported by the local community at this time for most of the sections
studied except for the section north of the detached breakwater.
From a general point of view, the implementation of coastal structures along specific areas can be
made step by step. As the littoral drift is northward along Champion Bay, it is likely that it influences
the sediment transport and the shoreline movement northward of it. Feedback from a Beach
Monitoring Programme would allow assessment of the coastal protection influence and adjustment of
the Beach Nourishment Programme accordingly to maintain a targeted programme, as summarized in
Figure 5-2.
5.3.1 Coastal Protection Structures
In the evaluation of options for Geraldton, the use of a buried seawall with ongoing nourishment and
dune management offers a balanced solution with comparative Net Present Value and ensures a high
level of aesthetic outcome and protection of coastal infrastructure; it would appear to meet most of the
objectives of the working group.
Partners and members of the local community expressed interest in the use of a submerged structure
such as artificial reef for a coastal protection solution. For this type of coastal protection structure,
there is a need for a specific socio economic study in conjunction with a specific and detailed design
study.
CITY OF GERALDTON-GREENOUGH
COASTAL PROCESSES STUDY - GREYS BEACH TO SUNSET BEACH
A PROJECT OF THE COASTAL VULNERABILITY AND RISK ASSESSMENT PROGRAM
\\perworfil1\infstruclib\projects\i01151 geraldton-greenough coastal process study\2.0 reports\i01151-00-cs-rep-001_rev1.doc
Page 60 301012-01151 : Rev 1 : 16-Sep-10
5.3.2 Construction Material
The use of rock materials is recommended at Geraldton were coastal structures to be adopted
(section 3.3.10).
Partners and members of the local community expressed their interest in the use of alternative
material such as geotextiles. If the construction of a coastal structure is the chosen solution to protect
the coast against erosion, such material can be considered for the design. However, while there is an
increase demand for using these materials from local communities, the partners should be aware of
the associated drawbacks as discussed in section 3.3.10. Structures made of geotextiles do have the
advantage that they can be easily removed, have visually low impact and have good public
acceptance as they can be easily traversed with relative safety.
Geotextiles have been recently applied at a number of locations around the world. For example, a
recent project (late 2008) in Busselton, Western Australia managed by the Shire of Busselton and
DoT, involved three groynes made of geotextile bags. Monitoring of these structures over the next 10
years would provide better understanding regarding the longevity of this type of material.
CITY OF GERALDTON-GREENOUGH
COASTAL PROCESSES STUDY - GREYS BEACH TO SUNSET BEACH
A PROJECT OF THE COASTAL VULNERABILITY AND RISK ASSESSMENT PROGRAM
\\perworfil1\infstruclib\projects\i01151 geraldton-greenough coastal process study\2.0 reports\i01151-00-cs-rep-001_rev1.doc
Page 61 301012-01151 : Rev 1 : 16-Sep-10
6. SUMMARY
The City of Geraldton-Greenough commissioned WorleyParsons to undertake a coastal processes
study, which can be used to support decision making on the most appropriate techniques to manage
the coastal zone between Grey’s Beach in the south to Sunset Beach in the north. The aim of future
coastal zone management is to maintain beach stability by implementing a preferred option for
coastal protection. The preferred management option needs to address the observed erosion whilst
maintaining amenity of the area and minimising the economic cost to the community.
6.1 Coastal Sediment Transport Assessment
Based on the literature review of historical work and sediment budget analysis carried out by
WorleyParsons, it has been determined that the sediment transport of the region has significant
spatial and temporal variations. Those variations have both natural and anthropogenic causes. For
instance, the Port of Geraldton and the Batavia Coast Marina have created artificial obstacles to the
natural littoral drift and the rate of sediment transport on the Northern Beaches has increased due to
the Port Enhancement Project (PEP) works.
The results of this study have shown a number of key observations, which define the background of
the coastal dynamics of the coastal cell between Point Moore and Glenfield beach. The sediment
transport potential within this cell is dynamic and can have significant annual variation.
Conditions at specific beaches, after five years of the Northern Beaches Stabilisation Programme
result in the following observations being made:
Town Beach is relatively stable but is exposed to crosshore transport during storm events;
A large quantity of sediment remains available along Pages Beach which has been
accreting over the last five years;
The section between the Batavia Coast Marina and the offshore breakwater has remained
stable with replenishment, thanks to the NSBP. Moreover, during the recent years, this
section has been subject to increased wave energy since the PEP works.
North of the breakwater, erosion is observed. A long stretch of Shoreline (Mabel St to
Chapman River) is relatively stable, slightly in accretion;
In the absence of stabilisation work, Grey’s Beach and Sunset Beach have been eroding.
6.2 Coastal Management Methods
In order to identify the developed areas likely to be at threat in the next 20 years, owing to the current
shoreline evolution and predicted climate changes, a methodology based on the State Coastal
Planning Policy (SCPP) has been applied to the study coastal zone. From the coastal vulnerability
assessment for the period considered (up to 2030), the areas identified where erosion is likely to
threaten existing assets include:
CITY OF GERALDTON-GREENOUGH
COASTAL PROCESSES STUDY - GREYS BEACH TO SUNSET BEACH
A PROJECT OF THE COASTAL VULNERABILITY AND RISK ASSESSMENT PROGRAM
\\perworfil1\infstruclib\projects\i01151 geraldton-greenough coastal process study\2.0 reports\i01151-00-cs-rep-001_rev1.doc
Page 62 301012-01151 : Rev 1 : 16-Sep-10
The section North of the detached breakwater
Sunset Beach
South of Chapman River (Frederick Street)
Grey’s Beach
The areas requiring Active Beach Monitoring to detect future threat to the existing development are:
The section between Elphick Avenue and Champion Bay Rise
The section in the area of Morris Street and Cecily Street.
Point Moore (along the Car Park)
Pages Beach
Town Beach
From the coastal vulnerability assessment for 2110, the whole coastline is predicted to be at threat in
the next 100 years. Climate change and sea level rise have the very real potential to have a
significant impact on the Geraldton coast, affecting natural and cultural values, infrastructure and built
assets on private and public land. The response to climate change and sea level rise needs to be
both pro-active and reactive which involves actually responding to changes as they occur.
In order to select the most appropriate coastal protection solution(s) for the area requiring beach
erosion management, a review of existing options has been proposed:
Do Nothing or Managed Recession does not interfere with the natural coastal processes. The
associated fiscal cost could be less than that associated with implementing coastal
management options.
Beach nourishment promotes amenity and natural character in the form of a wide sandy
beach and generally, it does not have adverse effects on adjacent areas. The influence of the
sand grain sizing parameter has to be considered to determine the quantities of sand for
beach nourishment.
Buried seawall: by combining seawall, beach nourishment and dune management, a buried
seawall allows the maintenance of the beach amenity and aesthetics, and provides a last line
defence again storm erosion. If correct beach replenishment is applied, the seawall does not
influence the sediment transport and no negative impact on the shoreline along and adjacent
to the structure is expected.
Groynes build up a sand buffer wide enough to absorb erosion during storm events.
CITY OF GERALDTON-GREENOUGH
COASTAL PROCESSES STUDY - GREYS BEACH TO SUNSET BEACH
A PROJECT OF THE COASTAL VULNERABILITY AND RISK ASSESSMENT PROGRAM
\\perworfil1\infstruclib\projects\i01151 geraldton-greenough coastal process study\2.0 reports\i01151-00-cs-rep-001_rev1.doc
Page 63 301012-01151 : Rev 1 : 16-Sep-10
Detached breakwaters provide protection by reducing the energy in their lee. In case of
sensitive downdrift beaches like in Geraldton, the breakwaters can cause downdrift erosion,
and due to the high annual variability in longshore transport, their effectiveness can be
limited.
Artificial reefs are a specific form of detached breakwater. The design of these structures is
complex and their perceived performance is significantly affected where high seasonal and
annual variability in transport processes is observed. Moreover there would be a significantly
higher investigation cost and would require a specific and expensive strategy of monitoring /
implementation over several years.
A beach drainage system is based on the principle that sand will tend to accrete if the beach
surface is permeable due to an artificially lowered water table. This option is not
recommended as suitable for the Geraldton shoreline owing to its inefficiency during
moderate wave conditions and storms.
6.3 Coastal Protection Options
At Geraldton, beach renourishment in combination with supplementary coastal structures to reduce
the impacts of erosion processes and to provide a last line of defence are all plausible solutions.
Sand for beach renourishment can be sourced from:
Pages Beach (sand bypassing)
External sources of sand
Some options for coastal structures include:
Groynes and sand replenishment may be used for beach stabilisation and designed to
achieve a balance between having a buffer for storm erosion and not trapping an excessive
volume of sand.
Buried Seawalls may be used as last line of defence against storms but would need to be
combined with regular sand nourishment
A range of different coastal protection scenarios have been presented for the four areas identified as
likely to be at threat over a 20 year timeframe:
Section North of the detached breakwater: the “Do Nothing” option, the possibility to
increase the sand volume used for the current sand bypassing programme and the
construction of a buried seawall combined, or not, with a groyne and associated beach
nourishment;
Sunset Beach: the “Managed retreat” option, an initial nourishment followed by annual
nourishment and the construction of a buried seawall associated with annual nourishment;
CITY OF GERALDTON-GREENOUGH
COASTAL PROCESSES STUDY - GREYS BEACH TO SUNSET BEACH
A PROJECT OF THE COASTAL VULNERABILITY AND RISK ASSESSMENT PROGRAM
\\perworfil1\infstruclib\projects\i01151 geraldton-greenough coastal process study\2.0 reports\i01151-00-cs-rep-001_rev1.doc
Page 64 301012-01151 : Rev 1 : 16-Sep-10
South of Chapman River (Frederick Street): the “Do Nothing” option and the construction of
a buried seawall
Grey’s Beach: the “Do Nothing” option, an annual nourishment and the construction of a
buried seawall associated with annual nourishment.
The selected solution for coastal protection will have a significant impact on the social amenity of the
beaches. As such, the selection of an appropriate solution must include contribution from the local
community. It is also important that this process includes accurate technical and descriptive
presentation of the behaviour of the coastline in response to various solutions. This range of different
coastal protection scenarios has been the subject of public presentation and consultation process.
Main outcomes from this workshop consultation process, held on the 24th March 2010, relate that the
local community have preferences as follows:
To adopt a Managed Recession approach or Beach Nourishment options;
To avoid and/or minimise the construction of hard structures other than for the section north
of the detached breakwater.
Members of the Partners and of the local community expressed their interests regarding the use of a
submerged structure such as an artificial reef. The design of these structures is complex and their
perceived performance is significantly affected where high seasonal and annual variability in transport
processes is observed. Such a structure can however provide massive boosts for the local tourism
industry and help stimulate job creation. This option should be the subject of a specific socio-
economic impact study.
A high level cost estimate and an estimate of Net Present Values (NPV) for different coastal
protection options revealed that:
Along the Northern Beaches a costal management strategy has to be maintained.
Along Sunset Beach, NPVs are similar for the “Managed Recession” option and the most
expensive proposed coastal protection option, which is a 300m buried seawall.
South of Chapman River, the calculated “Do Nothing” option NPV value is more than 2.5
times the NPV value of the most expensive proposed coastal protection option based on a
150m buried seawall.
Along the Grey’s Beach, NPV for the “Do Nothing” option is significantly less (more than 3
times) than the NPV for the most expensive proposed option based on a 50m buried seawall.
After evaluation of coastal protection options, the use of a buried seawall with ongoing nourishment
and dune management offers a balanced solution with a high level of aesthetic outcome and
protection of coastal infrastructure; it would appear to meet most of the objectives of the working
group. These options have been assessed in this study and details of their anticipated performance
CITY OF GERALDTON-GREENOUGH
COASTAL PROCESSES STUDY - GREYS BEACH TO SUNSET BEACH
A PROJECT OF THE COASTAL VULNERABILITY AND RISK ASSESSMENT PROGRAM
\\perworfil1\infstruclib\projects\i01151 geraldton-greenough coastal process study\2.0 reports\i01151-00-cs-rep-001_rev1.doc
Page 65 301012-01151 : Rev 1 : 16-Sep-10
are provided. Detailed design of such structures would require additional assessment where
implemented.
6.4 Recommendations for Coastal Management Planning
To maintain the targeted profile, an Annual Management Programme is suggested, involving Beach
Monitoring and an Active Beach Nourishment Programme through improvement of the current Sand
Bypassing Programme.
The implementation of coastal structures along specific areas can be made step by step. Feedback
from the Beach Monitoring Programme would allow assessment of the coastal protection influence
and adjustment of the Annual Management Programme accordingly. This will allow the City of
Geraldton Greenough to maintain the targeted programme, and implement structures in the medium
term in line with these refined observations. This recognises the importance that once coastal
structures are selected they do become difficult to vary and therefore refinement of the preferred type,
extent and shape should be based on longer term monitoring and measurement. In fact, the
refinement of the replenishment programme may reduce dramatically the degree of the structure
required, making the deferment of the implementation of the structure of greater value whilst
replenishment is optimised in line with the short term programme.
CITY OF GERALDTON-GREENOUGH
COASTAL PROCESSES STUDY - GREYS BEACH TO SUNSET BEACH
A PROJECT OF THE COASTAL VULNERABILITY AND RISK ASSESSMENT PROGRAM
\\perworfil1\infstruclib\projects\i01151 geraldton-greenough coastal process study\2.0 reports\i01151-00-cs-rep-001_rev1.doc
Page 66 301012-01151 : Rev 1 : 16-Sep-10
7. REFERENCES
Bailey, J. 2005, Geraldton Northern Beaches Stabilisation Program - Report on coastal sand
migration Oct 2004 - Jan 2005 associated with Southern Transport Corridor sand placement in
September 2004, Prepared for City of Geraldton, Perth, Western Australia.
CES 2001a, Geraldton port enhancement wave and sediment studies - final report: volume 4: impacts
on northern beaches, Prepared for Geraldton Port Authority by Coastal Engineering Solutions, Perth,
Western Australia, July 2001.
CES 2001b, Geraldton Port Enhancement – Wave and Sediment Studies Volumes 1, 2 and 3,
Prepared for Geraldton Port Authority by Coastal Engineering Solutions, Perth, Western Australia,
February 2001.
Climate Change Risks to Australia's Coasts, 2009, Australian Government, Department of Climate
change and Energy Efficiency.
Danish Hydraulics Institute (DHI). 2008. Mike21 Wave Model – User Guide.
Danish Hydraulics Institute (DHI). 2008. LITPACK model – User Guide.
GEMS 2001, Geraldton Port Enhancement and Town Beach Redevelopment: Hydrodynamic
Modelling Study, Prepared for URS Australia by Global Environmental Modelling Systems, Report no.
18/01, October 2001.
Intergovernmental Panel on Climate Change, 2007 Climate Change 2007, the Fourth Assessment Report (AR4
MRA 1994, Proposed port expansion - coastal engineering study, Prepared for Geraldton Port Authority by M.P. Rogers & Associates, Perth, Western Australia.
MRA 1996b, Geraldton Region Coastal Engineering Study, Prepared for Geraldton Port Authority by M.P. Rogers & Associates, Perth, Western Australia.
MRA 2001, Geraldton Northern Foreshore Stage 1, Prepared for City of Geraldton, Geraldton Port
Authority & Department for Planning and Infrastructure by M.P. Rogers & Associates, Perth, Western
Australia, November 2001.
MRA 2002, Geraldton Northern Foreshore Stage 2, Prepared for City of Geraldton, Geraldton Port
Authority & Department for Planning and Infrastructure by M.P. Rogers & Associates, Perth, Western
Australia, June 2002.
MRA 2003, Geraldton Northern Foreshore - Sunset Beach Stage 2, Prepared for City of Geraldton,
Geraldton Port Authority & Department for Planning and Infrastructure by M.P. Rogers & Associates,
Perth, Western Australia, May 2003.
CITY OF GERALDTON-GREENOUGH
COASTAL PROCESSES STUDY - GREYS BEACH TO SUNSET BEACH
A PROJECT OF THE COASTAL VULNERABILITY AND RISK ASSESSMENT PROGRAM
\\perworfil1\infstruclib\projects\i01151 geraldton-greenough coastal process study\2.0 reports\i01151-00-cs-rep-001_rev1.doc
Page 67 301012-01151 : Rev 1 : 16-Sep-10
Ranasinghe, R. and Turner, I. 2006, Shoreline response to submerged structures: a review, Coastal
Engineering, Vol 53, pp 65-79.
Rafanelli, C., 2004, Socio Economic Impact Study – Artificial surfing Reef. Prepared for the Back
Beach improvement group.
Pranzini, E. & Bowman, D. 2003, Reversed responses within a segmented detached breakwater, the
Tuscany coast Italy – a case study. Coastal engineering. Vol 49 pp 263-274
WorleyParsons 2004, Stage 1: Geraldton Coastal Protection Structure, Prepared for Department for
Planning and Infrastructure
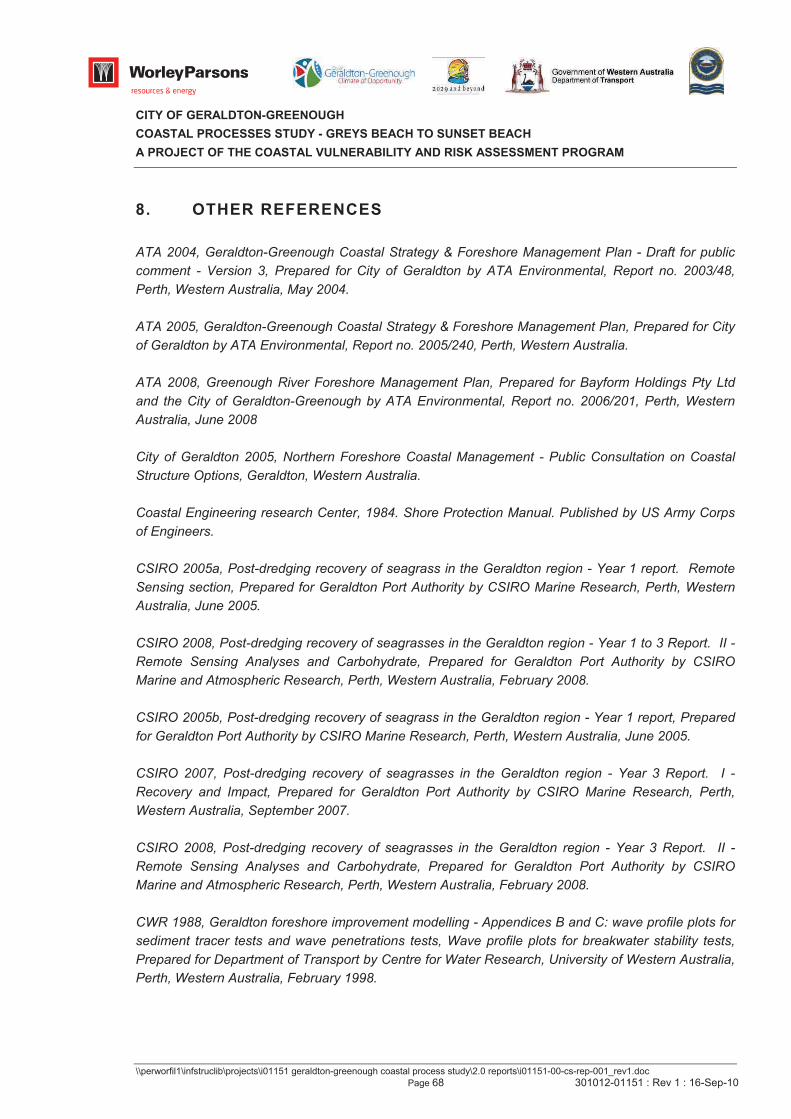
CITY OF GERALDTON-GREENOUGH
COASTAL PROCESSES STUDY - GREYS BEACH TO SUNSET BEACH
A PROJECT OF THE COASTAL VULNERABILITY AND RISK ASSESSMENT PROGRAM
\\perworfil1\infstruclib\projects\i01151 geraldton-greenough coastal process study\2.0 reports\i01151-00-cs-rep-001_rev1.doc
Page 68 301012-01151 : Rev 1 : 16-Sep-10
8. OTHER REFERENCES
ATA 2004, Geraldton-Greenough Coastal Strategy & Foreshore Management Plan - Draft for public
comment - Version 3, Prepared for City of Geraldton by ATA Environmental, Report no. 2003/48,
Perth, Western Australia, May 2004.
ATA 2005, Geraldton-Greenough Coastal Strategy & Foreshore Management Plan, Prepared for City
of Geraldton by ATA Environmental, Report no. 2005/240, Perth, Western Australia.
ATA 2008, Greenough River Foreshore Management Plan, Prepared for Bayform Holdings Pty Ltd
and the City of Geraldton-Greenough by ATA Environmental, Report no. 2006/201, Perth, Western
Australia, June 2008
City of Geraldton 2005, Northern Foreshore Coastal Management - Public Consultation on Coastal
Structure Options, Geraldton, Western Australia.
Coastal Engineering research Center, 1984. Shore Protection Manual. Published by US Army Corps
of Engineers.
CSIRO 2005a, Post-dredging recovery of seagrass in the Geraldton region - Year 1 report. Remote
Sensing section, Prepared for Geraldton Port Authority by CSIRO Marine Research, Perth, Western
Australia, June 2005.
CSIRO 2008, Post-dredging recovery of seagrasses in the Geraldton region - Year 1 to 3 Report. II -
Remote Sensing Analyses and Carbohydrate, Prepared for Geraldton Port Authority by CSIRO
Marine and Atmospheric Research, Perth, Western Australia, February 2008.
CSIRO 2005b, Post-dredging recovery of seagrass in the Geraldton region - Year 1 report, Prepared
for Geraldton Port Authority by CSIRO Marine Research, Perth, Western Australia, June 2005.
CSIRO 2007, Post-dredging recovery of seagrasses in the Geraldton region - Year 3 Report. I -
Recovery and Impact, Prepared for Geraldton Port Authority by CSIRO Marine Research, Perth,
Western Australia, September 2007.
CSIRO 2008, Post-dredging recovery of seagrasses in the Geraldton region - Year 3 Report. II -
Remote Sensing Analyses and Carbohydrate, Prepared for Geraldton Port Authority by CSIRO
Marine and Atmospheric Research, Perth, Western Australia, February 2008.
CWR 1988, Geraldton foreshore improvement modelling - Appendices B and C: wave profile plots for
sediment tracer tests and wave penetrations tests, Wave profile plots for breakwater stability tests,
Prepared for Department of Transport by Centre for Water Research, University of Western Australia,
Perth, Western Australia, February 1998.
CITY OF GERALDTON-GREENOUGH
COASTAL PROCESSES STUDY - GREYS BEACH TO SUNSET BEACH
A PROJECT OF THE COASTAL VULNERABILITY AND RISK ASSESSMENT PROGRAM
\\perworfil1\infstruclib\projects\i01151 geraldton-greenough coastal process study\2.0 reports\i01151-00-cs-rep-001_rev1.doc
Page 69 301012-01151 : Rev 1 : 16-Sep-10
DPI 2002, Preliminary assessment of the cost of pumping sand to the beach north of the Batavia
Coast marina. Prepared for the Geraldton Port Authority, Perth, Western Australia, June 2002.
DPI 2002, DRAFT Geraldton Foreshore Stabilisation and Enhancement Strategy Sand Nourishment
Works - Evaluation of Potential Environmental Impacts, Prepared for City of Geraldton by Department
for Planning and Infrastructure, Perth, Western Australia, May 2002.
Ecoscape 2005, Lancelin foreshore land-use and management plan, Prepared for Shire of Gingin by
Ecoscape (Australia) Pty Ltd and SJB Town Planning and Urban Design,, Perth, Western Australia,
June 2005.
EPA 1988, Geraldton foreshore redevelopment : Department of Marine and Harbours, Western
Australia - Bulletin 339, Prepared by Environmental Protection Authority, Perth, Western Australia.
EPA 2002, Geraldton Port Enhancement Project and Preparatory Works for the Town Beach
Foreshore Redevelopment - Bulletin 1050, Prepared by Environmental Protection Authority, Report
no. 1050, Perth, Western Australia, June 2002.
MRA 2006, Cape Burney Estate Coastal Setback Study, Prepared for ATA Environmental by M.P.
Rogers & Associates, Report no. R175 Rev 0, Perth, Western Australia, January 2006.
MRA 2007, Glenfield Marina - initial coastal engineering assessment, Prepared by M.P. Rogers &
Associates, Perth, Western Australia, March 2007.
Oceanica 2008a, Port of Geraldton Annual Sediment Monitoring 2008, Prepared for Geraldton Port
Authority by Oceanica Consulting Pty Ltd, Report no. 699_001/1, Perth, Western Australia, December
2008.
Oceanica 2008c, Port of Geraldton - Sediment Quality Report: 2008 Survey, Prepared for Geraldton
Port Authority by Oceanica Consulting Pty Ltd, Report no. 622/2, Perth, Western Australia, July 2008.
PHC 2000a, Port of Geraldton harbour surging investigations - Phase 1: wave climate study,
Prepared for Department of Transport by Port & Harbour Consultants, Perth, Western Australia.
PHC 2000b, Batavia coast marina entrance modifications: northern beach erosion assessment,
Prepared for Department of Transport by Port & Harbour Consultants, Perth, Western Australia.
SoG 2006, North Sunset Foreshore Management Plan, Prepared by Shire of Geraldton and
Department for Planning and Infrastructure, Perth, Western Australia, June 2006.
URS 2001, Port Enhancement Project and preparatory works for Town Beach Foreshore
Redevelopment, Prepared for Geraldton Port Authority by URS Australia Pt Ltd, Report no. R842,
Perth, Western Australia, November 2001.
CITY OF GERALDTON-GREENOUGH
COASTAL PROCESSES STUDY - GREYS BEACH TO SUNSET BEACH
A PROJECT OF THE COASTAL VULNERABILITY AND RISK ASSESSMENT PROGRAM
\\perworfil1\infstruclib\projects\i01151 geraldton-greenough coastal process study\2.0 reports\i01151-00-cs-rep-001_rev1.doc
Page 70 301012-01151 : Rev 1 : 16-Sep-10
UWA 1976, Erosion at Sunset Beach Estate, Geraldton, WA, Prepared by University of Western
Australia, Perth, Western Australia, November 1976.
Whelans 2007, North Sunset Foreshore Management Plan - Addenum Report, Prepared for Silver
Glow Assett Pty Ltd by Whelans and CoastWise and Quality Environmental, Perth, Western Australia,
October 2007
CITY OF GERALDTON-GREENOUGH
COASTAL PROCESSES STUDY - GREYS BEACH TO SUNSET BEACH
A PROJECT OF THE COASTAL VULNERABILITY AND RISK ASSESSMENT PROGRAM
\\perworfil1\infstruclib\projects\i01151 geraldton-greenough coastal process study\2.0 reports\i01151-00-cs-rep-001_rev1.doc
Page 71 301012-01151 : Rev 1 : 16-Sep-10
9. FIGURES
Figure 1-1 General view of the Coastline of Geraldton-Greenough
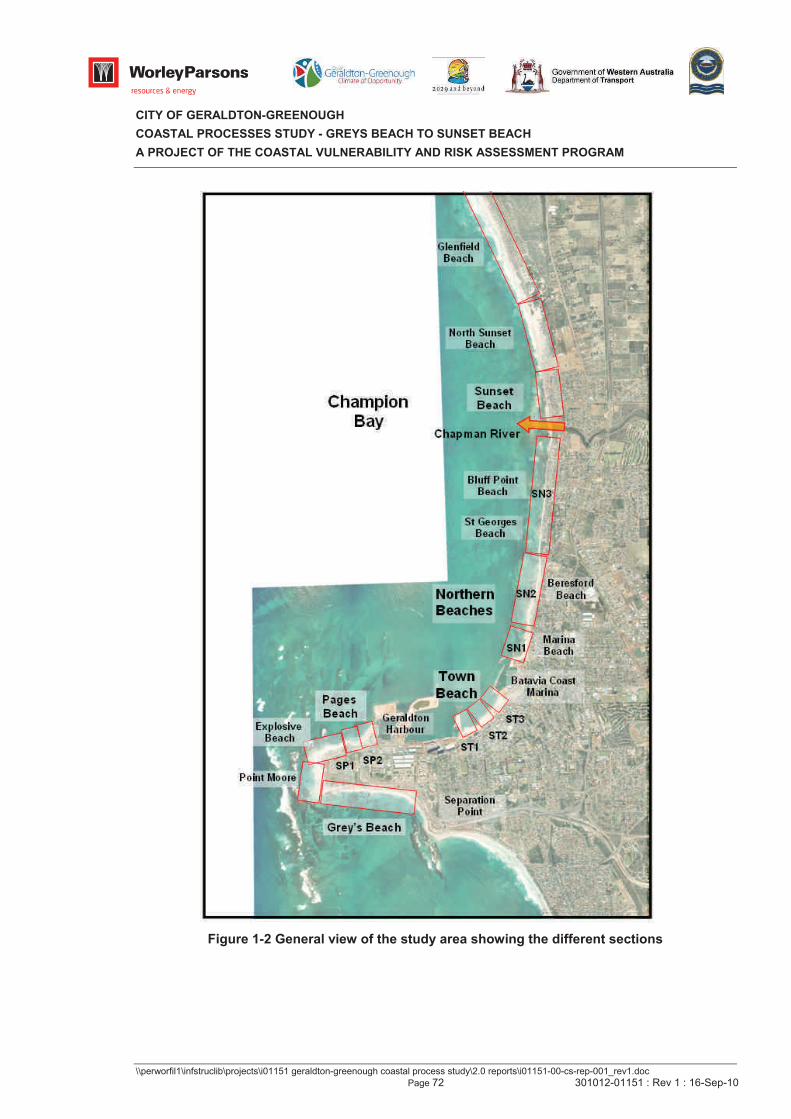
CITY OF GERALDTON-GREENOUGH
COASTAL PROCESSES STUDY - GREYS BEACH TO SUNSET BEACH
A PROJECT OF THE COASTAL VULNERABILITY AND RISK ASSESSMENT PROGRAM
\\perworfil1\infstruclib\projects\i01151 geraldton-greenough coastal process study\2.0 reports\i01151-00-cs-rep-001_rev1.doc
Page 72 301012-01151 : Rev 1 : 16-Sep-10
Figure 1-2 General view of the study area showing the different sections
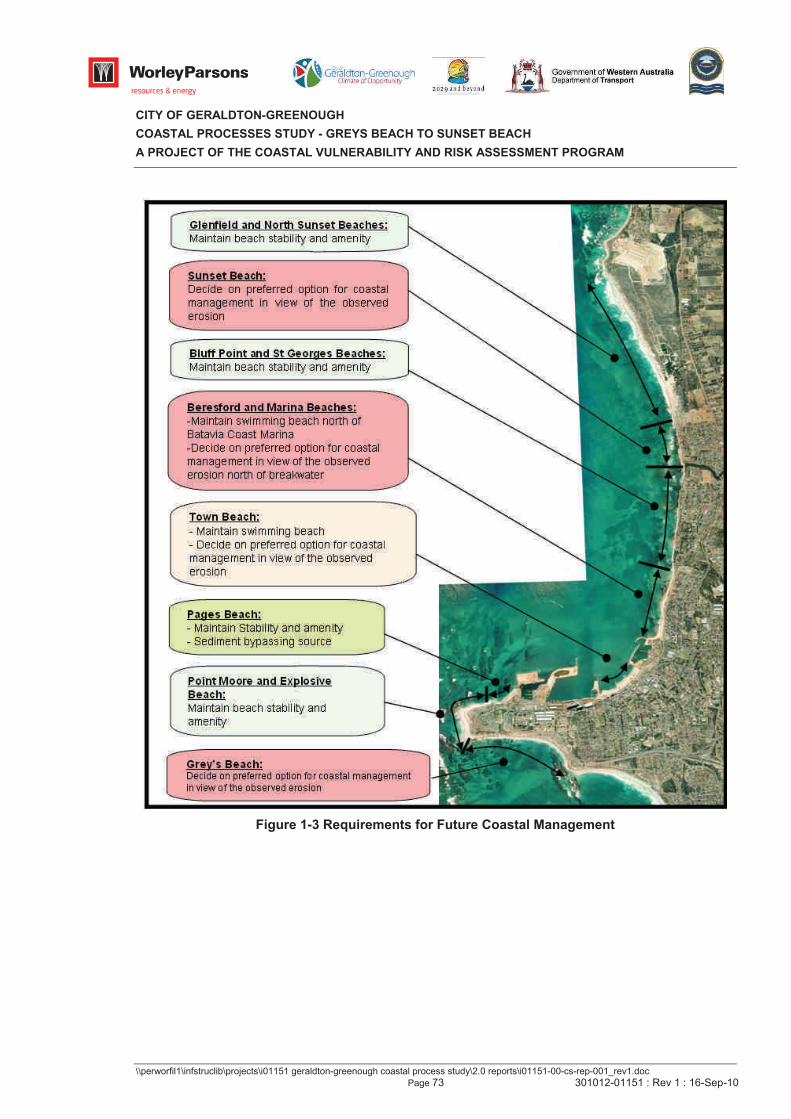
CITY OF GERALDTON-GREENOUGH
COASTAL PROCESSES STUDY - GREYS BEACH TO SUNSET BEACH
A PROJECT OF THE COASTAL VULNERABILITY AND RISK ASSESSMENT PROGRAM
\\perworfil1\infstruclib\projects\i01151 geraldton-greenough coastal process study\2.0 reports\i01151-00-cs-rep-001_rev1.doc
Page 73 301012-01151 : Rev 1 : 16-Sep-10
Figure 1-3 Requirements for Future Coastal Management
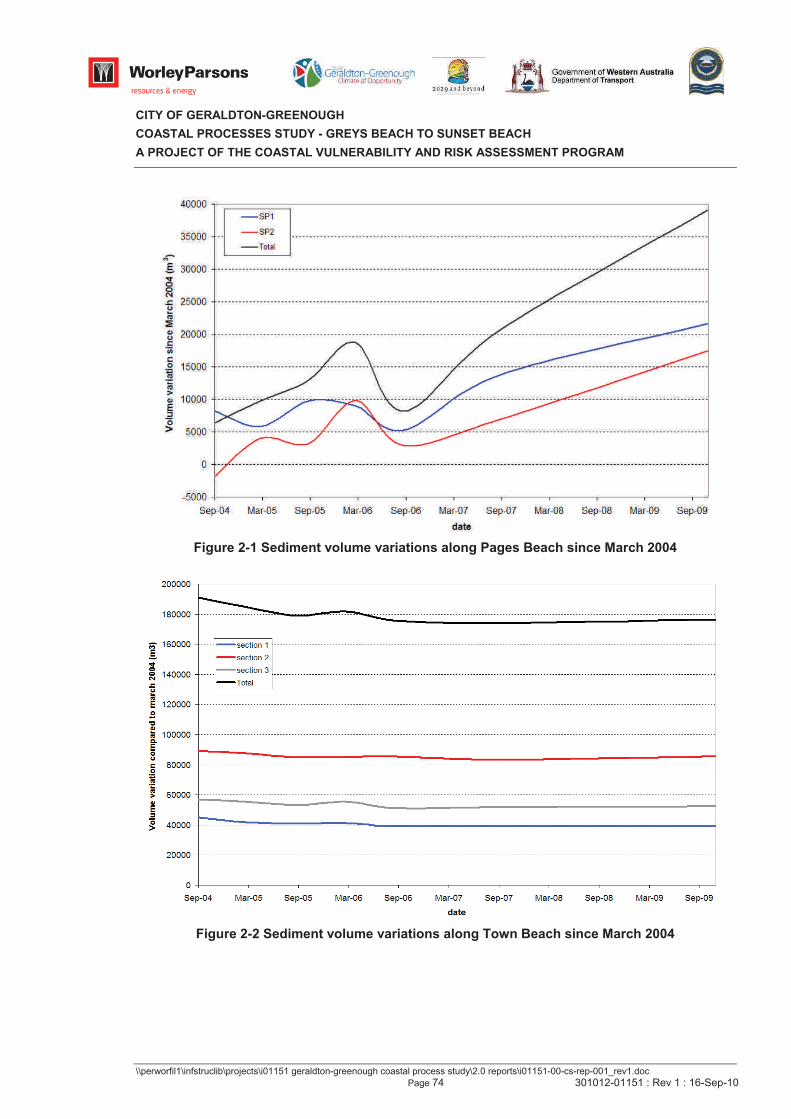
CITY OF GERALDTON-GREENOUGH
COASTAL PROCESSES STUDY - GREYS BEACH TO SUNSET BEACH
A PROJECT OF THE COASTAL VULNERABILITY AND RISK ASSESSMENT PROGRAM
\\perworfil1\infstruclib\projects\i01151 geraldton-greenough coastal process study\2.0 reports\i01151-00-cs-rep-001_rev1.doc
Page 74 301012-01151 : Rev 1 : 16-Sep-10
Figure 2-1 Sediment volume variations along Pages Beach since March 2004
Figure 2-2 Sediment volume variations along Town Beach since March 2004
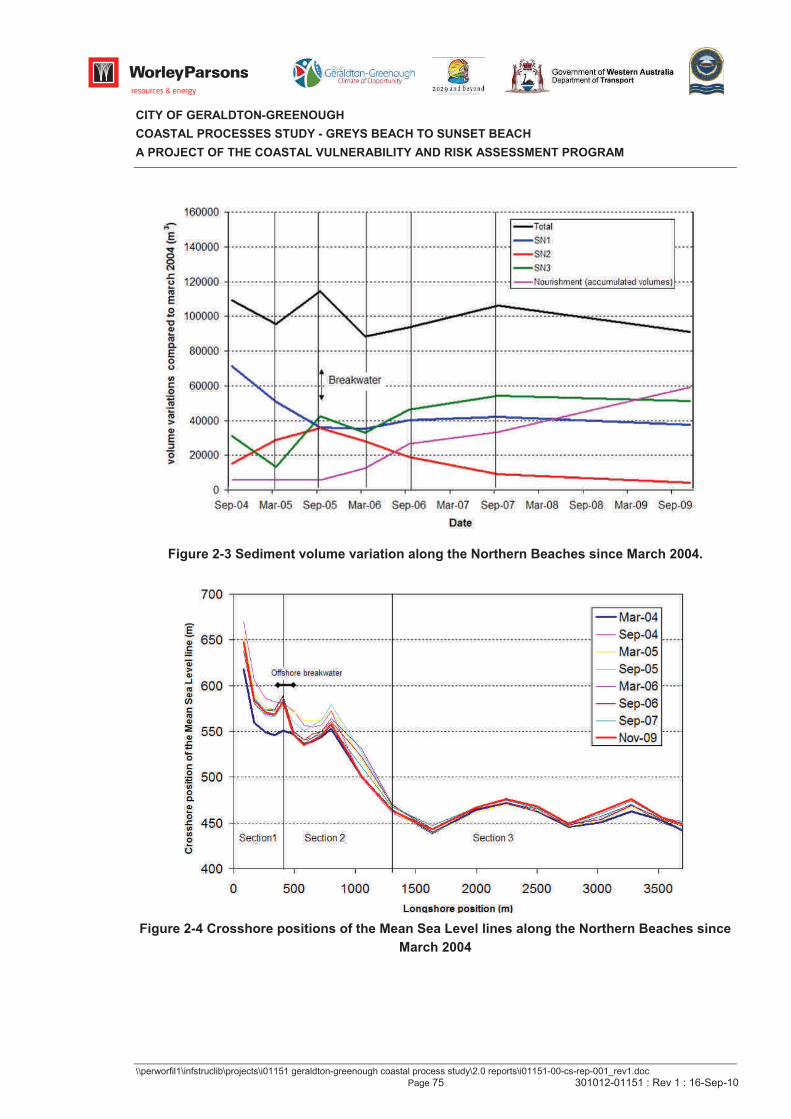
CITY OF GERALDTON-GREENOUGH
COASTAL PROCESSES STUDY - GREYS BEACH TO SUNSET BEACH
A PROJECT OF THE COASTAL VULNERABILITY AND RISK ASSESSMENT PROGRAM
\\perworfil1\infstruclib\projects\i01151 geraldton-greenough coastal process study\2.0 reports\i01151-00-cs-rep-001_rev1.doc
Page 75 301012-01151 : Rev 1 : 16-Sep-10
Figure 2-3 Sediment volume variation along the Northern Beaches since March 2004.
Figure 2-4 Crosshore positions of the Mean Sea Level lines along the Northern Beaches since
March 2004
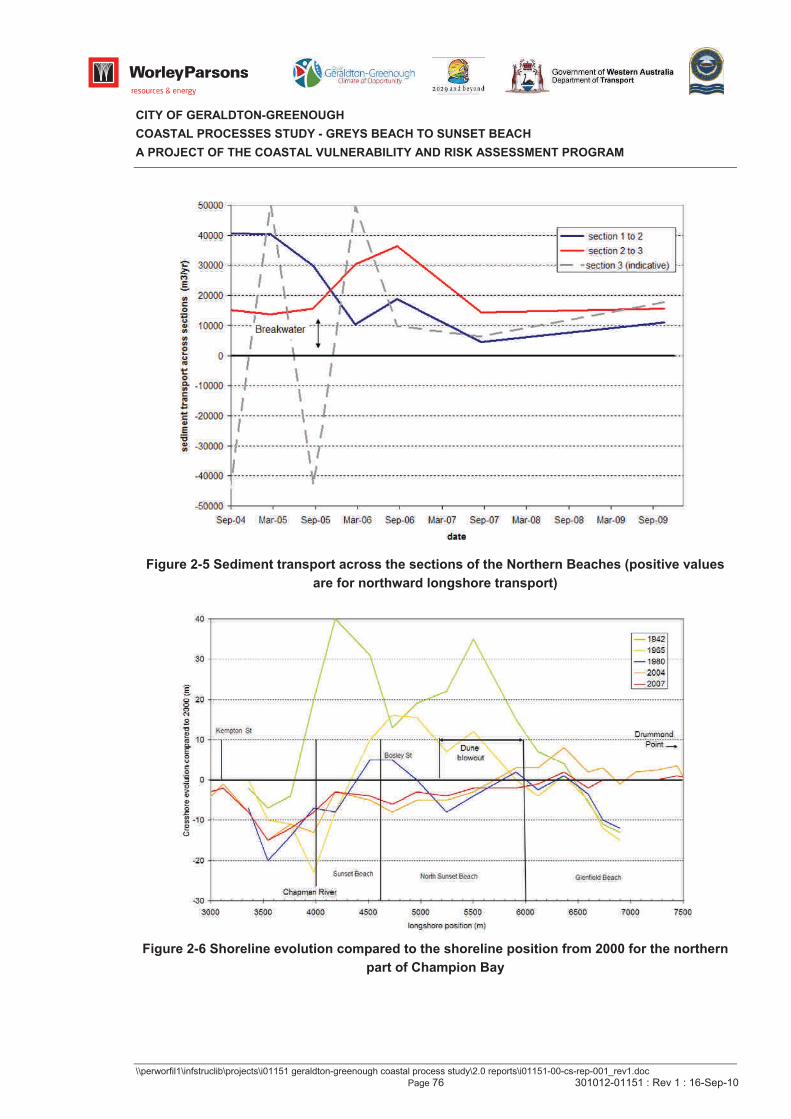
CITY OF GERALDTON-GREENOUGH
COASTAL PROCESSES STUDY - GREYS BEACH TO SUNSET BEACH
A PROJECT OF THE COASTAL VULNERABILITY AND RISK ASSESSMENT PROGRAM
\\perworfil1\infstruclib\projects\i01151 geraldton-greenough coastal process study\2.0 reports\i01151-00-cs-rep-001_rev1.doc
Page 76 301012-01151 : Rev 1 : 16-Sep-10
Figure 2-5 Sediment transport across the sections of the Northern Beaches (positive values
are for northward longshore transport)
Figure 2-6 Shoreline evolution compared to the shoreline position from 2000 for the northern
part of Champion Bay
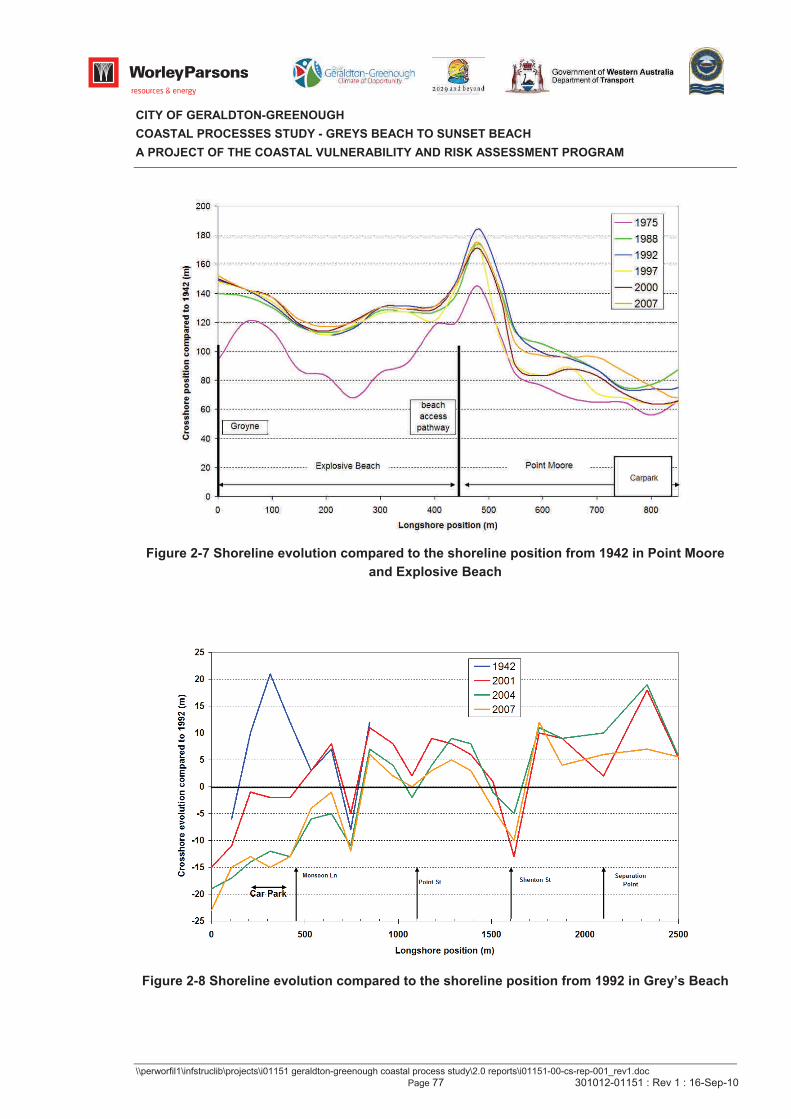
CITY OF GERALDTON-GREENOUGH
COASTAL PROCESSES STUDY - GREYS BEACH TO SUNSET BEACH
A PROJECT OF THE COASTAL VULNERABILITY AND RISK ASSESSMENT PROGRAM
\\perworfil1\infstruclib\projects\i01151 geraldton-greenough coastal process study\2.0 reports\i01151-00-cs-rep-001_rev1.doc
Page 77 301012-01151 : Rev 1 : 16-Sep-10
Figure 2-7 Shoreline evolution compared to the shoreline position from 1942 in Point Moore
and Explosive Beach
Figure 2-8 Shoreline evolution compared to the shoreline position from 1992 in Grey’s Beach
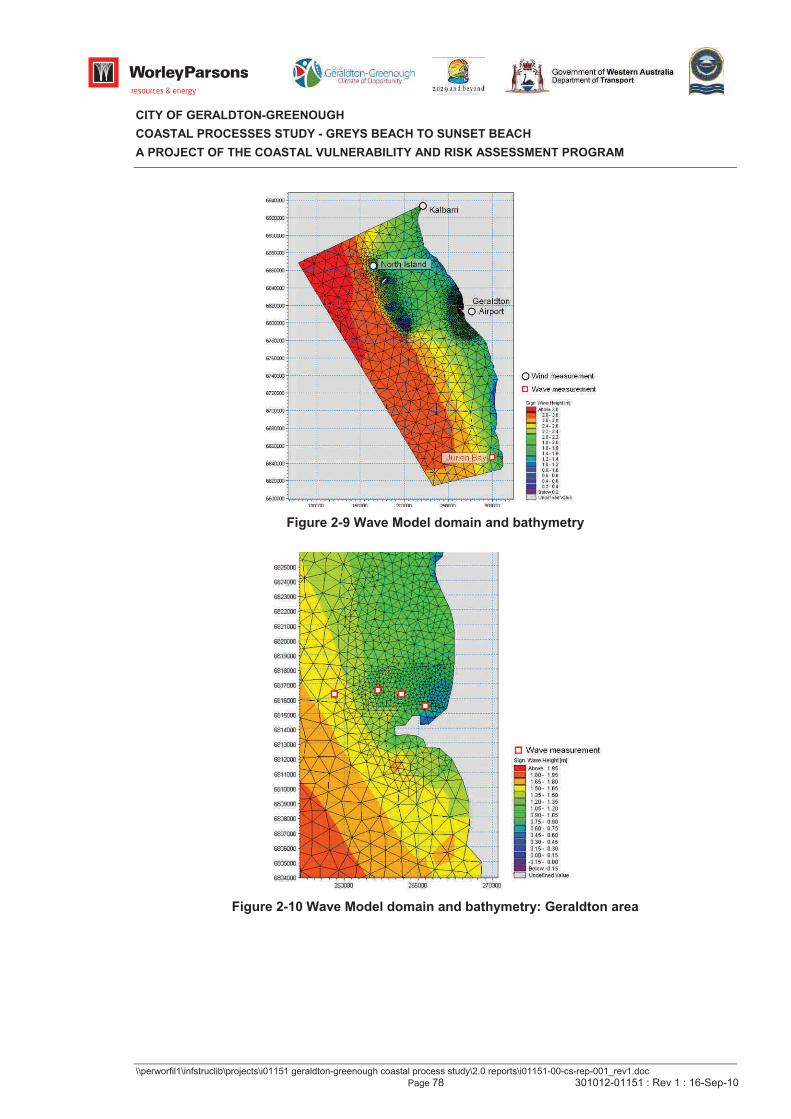
CITY OF GERALDTON-GREENOUGH
COASTAL PROCESSES STUDY - GREYS BEACH TO SUNSET BEACH
A PROJECT OF THE COASTAL VULNERABILITY AND RISK ASSESSMENT PROGRAM
\\perworfil1\infstruclib\projects\i01151 geraldton-greenough coastal process study\2.0 reports\i01151-00-cs-rep-001_rev1.doc
Page 78 301012-01151 : Rev 1 : 16-Sep-10
Figure 2-9 Wave Model domain and bathymetry
Figure 2-10 Wave Model domain and bathymetry: Geraldton area
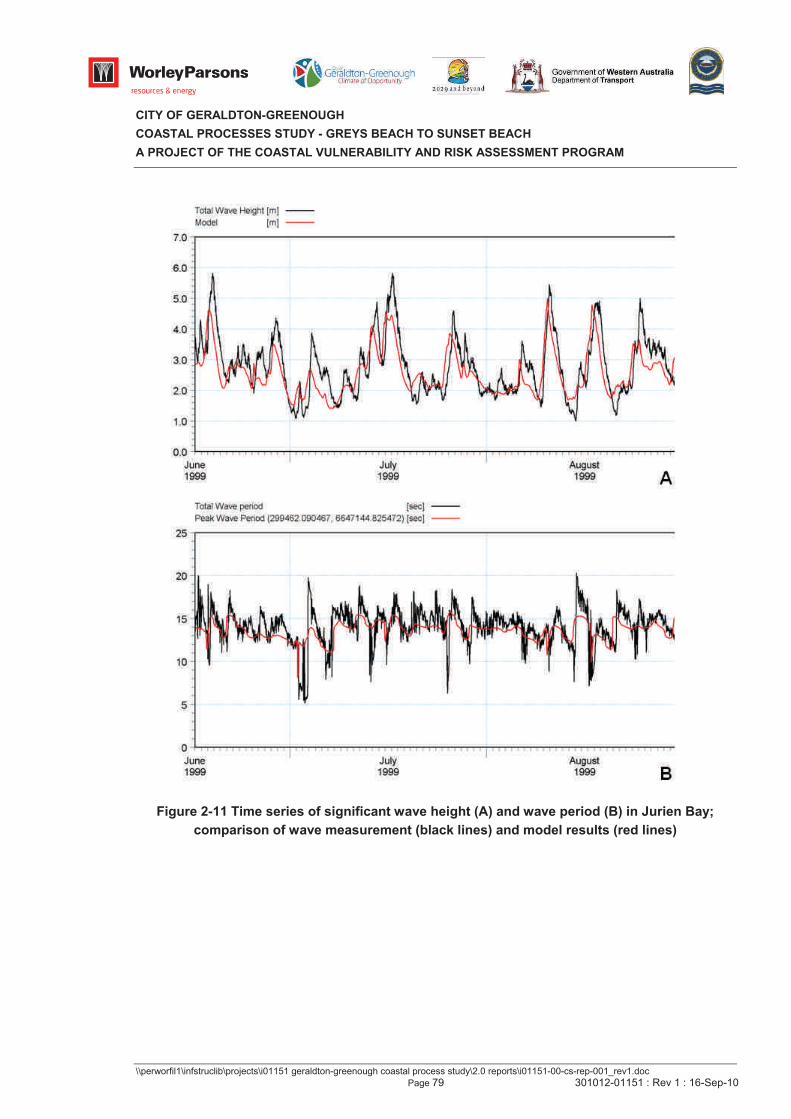
CITY OF GERALDTON-GREENOUGH
COASTAL PROCESSES STUDY - GREYS BEACH TO SUNSET BEACH
A PROJECT OF THE COASTAL VULNERABILITY AND RISK ASSESSMENT PROGRAM
\\perworfil1\infstruclib\projects\i01151 geraldton-greenough coastal process study\2.0 reports\i01151-00-cs-rep-001_rev1.doc
Page 79 301012-01151 : Rev 1 : 16-Sep-10
Figure 2-11 Time series of significant wave height (A) and wave period (B) in Jurien Bay;
comparison of wave measurement (black lines) and model results (red lines)
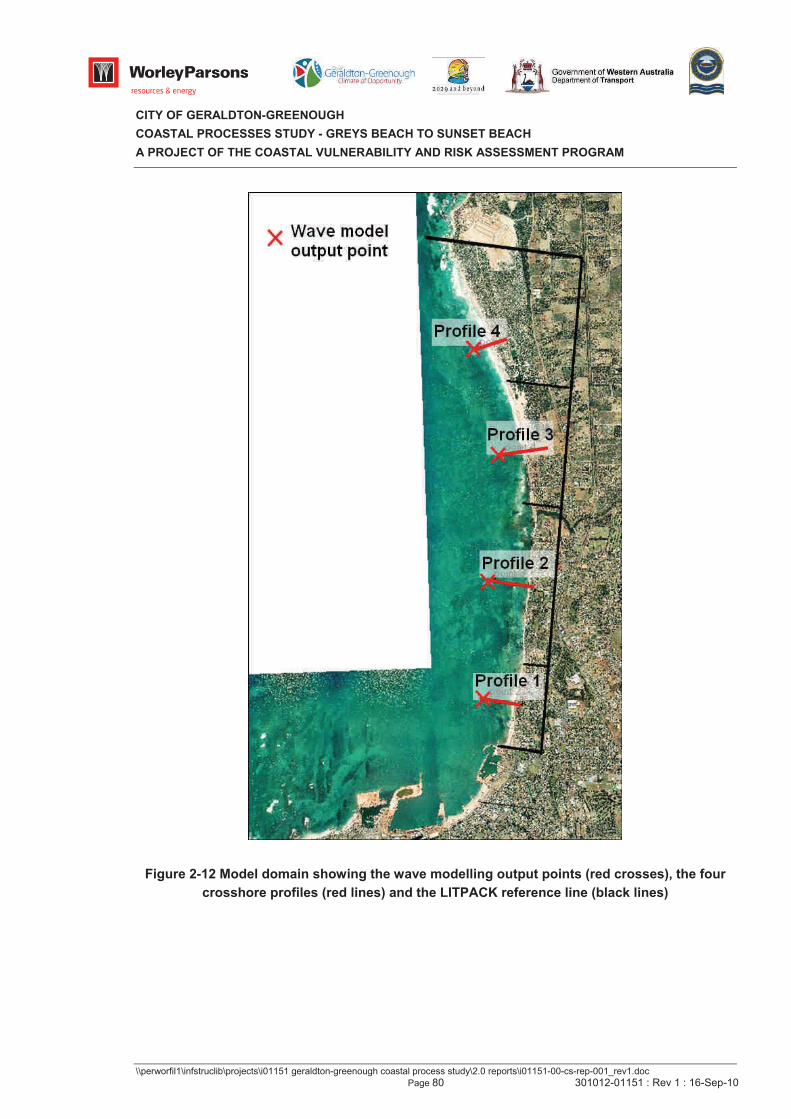
CITY OF GERALDTON-GREENOUGH
COASTAL PROCESSES STUDY - GREYS BEACH TO SUNSET BEACH
A PROJECT OF THE COASTAL VULNERABILITY AND RISK ASSESSMENT PROGRAM
\\perworfil1\infstruclib\projects\i01151 geraldton-greenough coastal process study\2.0 reports\i01151-00-cs-rep-001_rev1.doc
Page 80 301012-01151 : Rev 1 : 16-Sep-10
Figure 2-12 Model domain showing the wave modelling output points (red crosses), the four
crosshore profiles (red lines) and the LITPACK reference line (black lines)
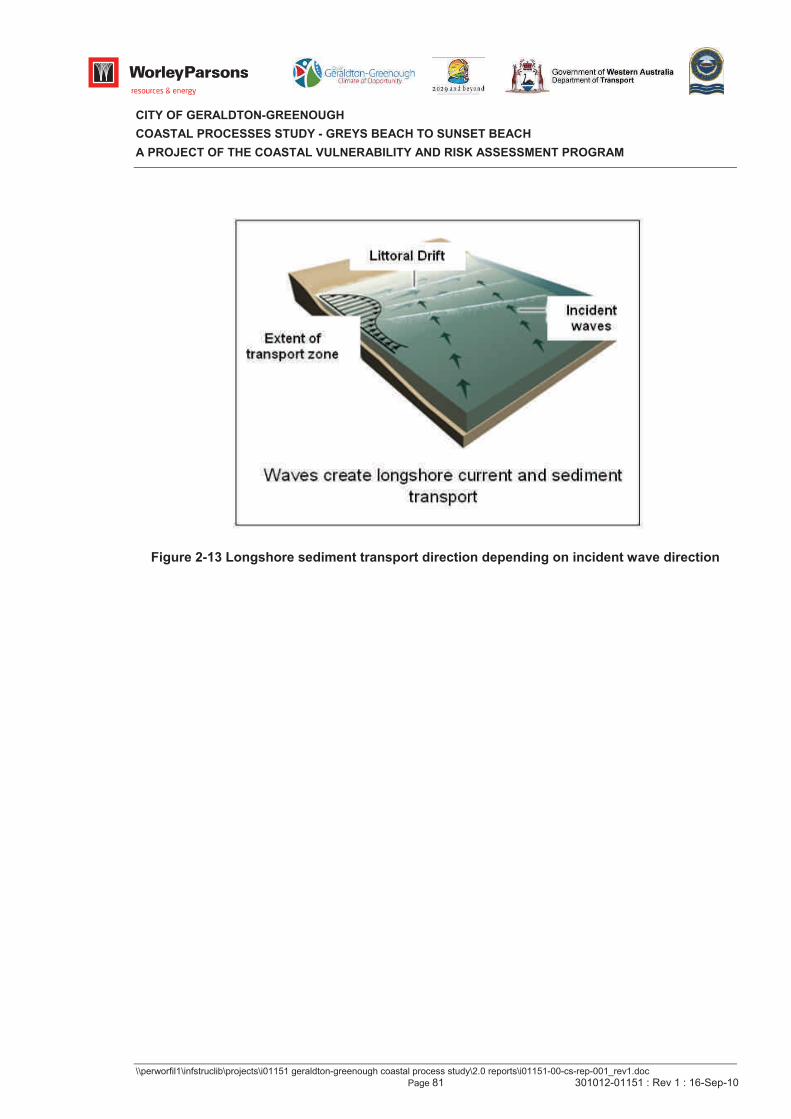
CITY OF GERALDTON-GREENOUGH
COASTAL PROCESSES STUDY - GREYS BEACH TO SUNSET BEACH
A PROJECT OF THE COASTAL VULNERABILITY AND RISK ASSESSMENT PROGRAM
\\perworfil1\infstruclib\projects\i01151 geraldton-greenough coastal process study\2.0 reports\i01151-00-cs-rep-001_rev1.doc
Page 81 301012-01151 : Rev 1 : 16-Sep-10
Figure 2-13 Longshore sediment transport direction depending on incident wave direction
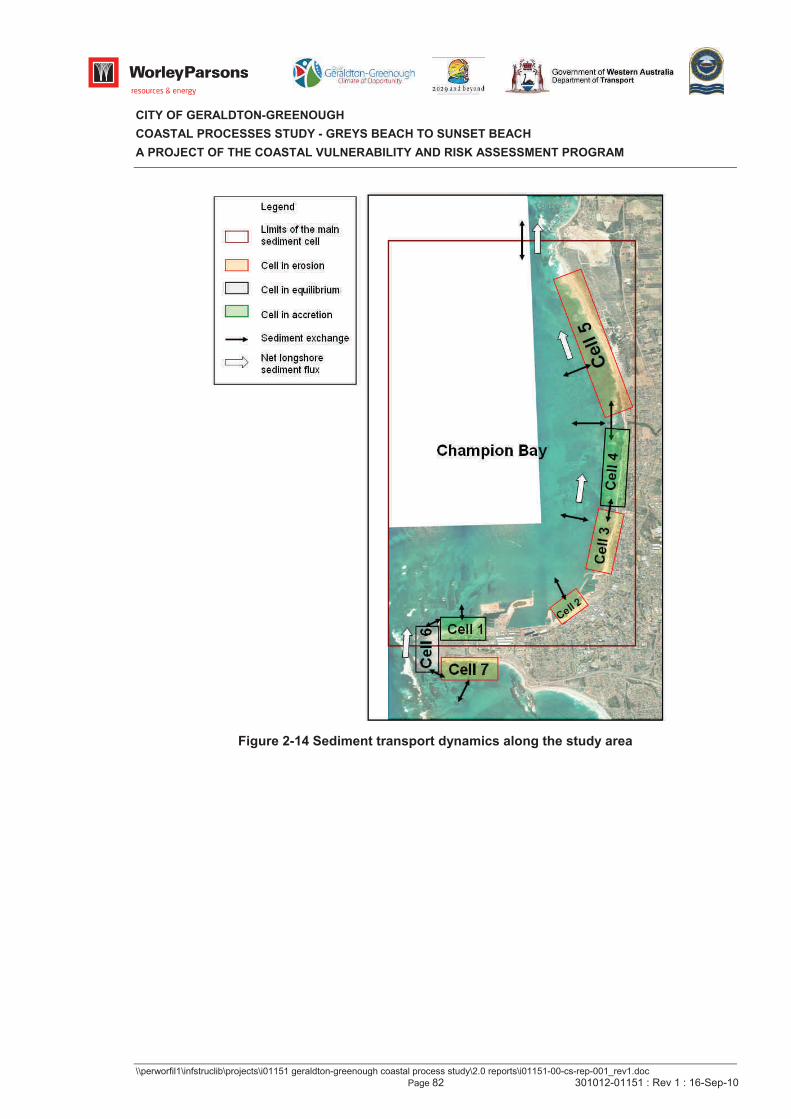
CITY OF GERALDTON-GREENOUGH
COASTAL PROCESSES STUDY - GREYS BEACH TO SUNSET BEACH
A PROJECT OF THE COASTAL VULNERABILITY AND RISK ASSESSMENT PROGRAM
\\perworfil1\infstruclib\projects\i01151 geraldton-greenough coastal process study\2.0 reports\i01151-00-cs-rep-001_rev1.doc
Page 82 301012-01151 : Rev 1 : 16-Sep-10
Figure 2-14 Sediment transport dynamics along the study area
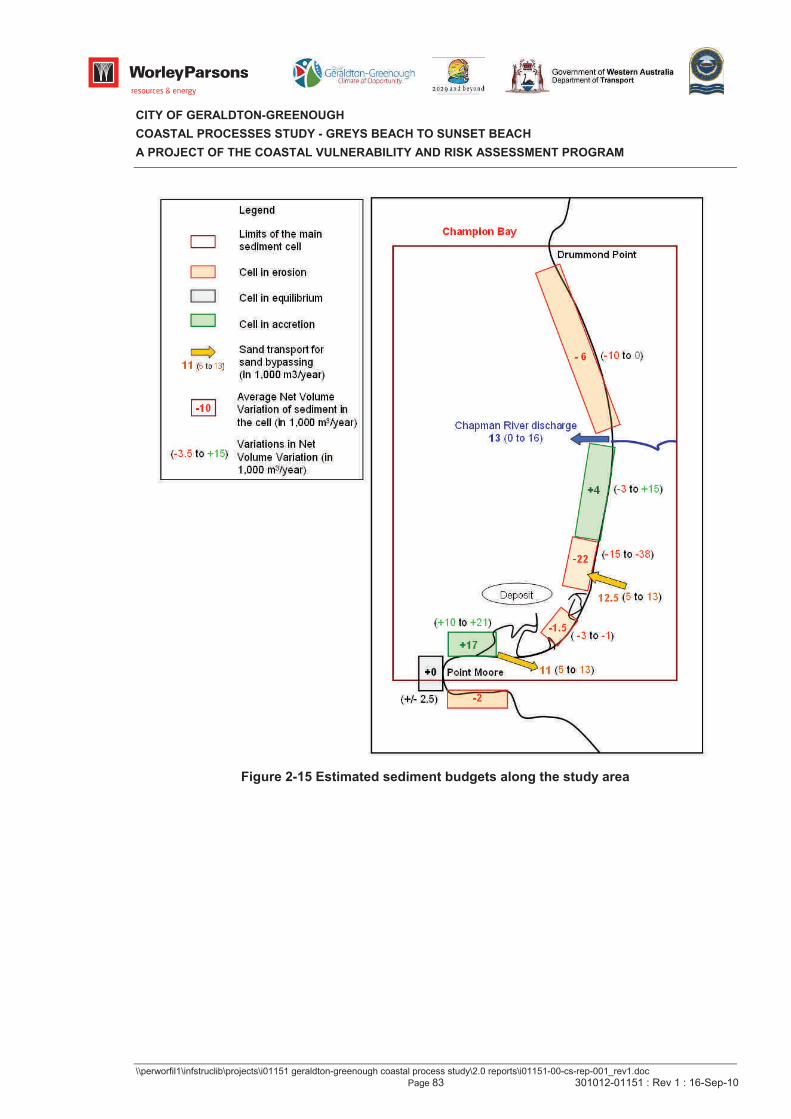
CITY OF GERALDTON-GREENOUGH
COASTAL PROCESSES STUDY - GREYS BEACH TO SUNSET BEACH
A PROJECT OF THE COASTAL VULNERABILITY AND RISK ASSESSMENT PROGRAM
\\perworfil1\infstruclib\projects\i01151 geraldton-greenough coastal process study\2.0 reports\i01151-00-cs-rep-001_rev1.doc
Page 83 301012-01151 : Rev 1 : 16-Sep-10
Figure 2-15 Estimated sediment budgets along the study area
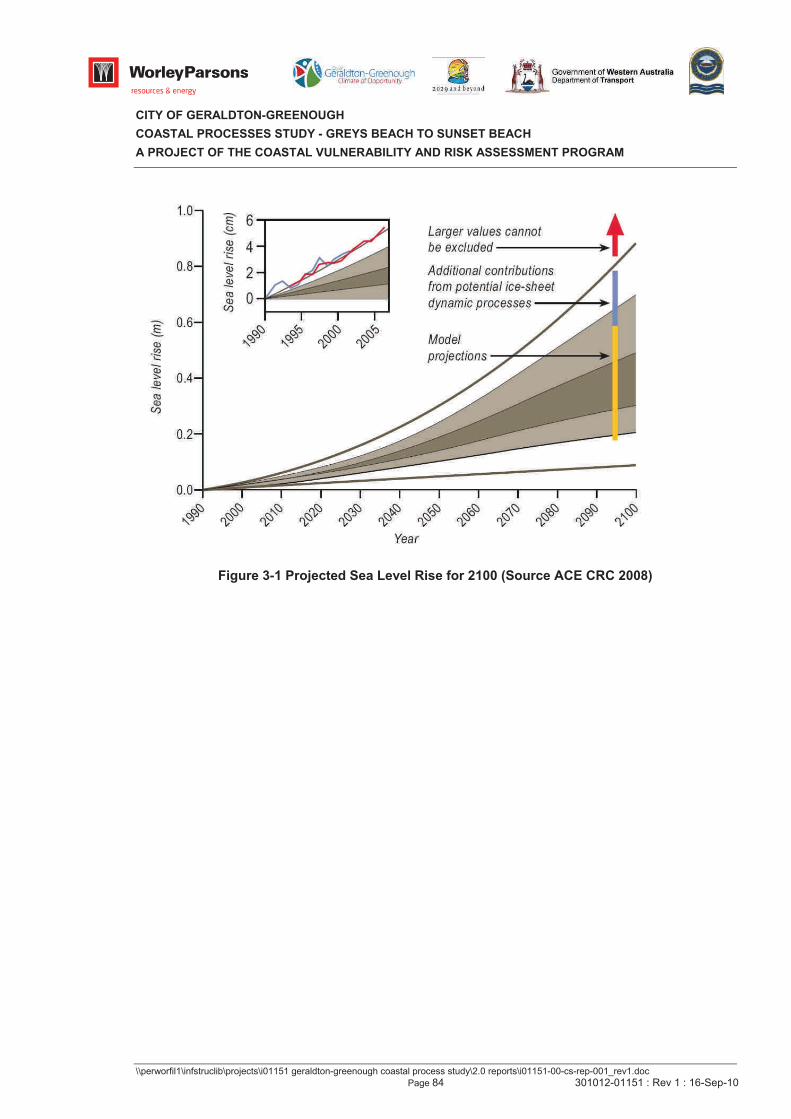
CITY OF GERALDTON-GREENOUGH
COASTAL PROCESSES STUDY - GREYS BEACH TO SUNSET BEACH
A PROJECT OF THE COASTAL VULNERABILITY AND RISK ASSESSMENT PROGRAM
\\perworfil1\infstruclib\projects\i01151 geraldton-greenough coastal process study\2.0 reports\i01151-00-cs-rep-001_rev1.doc
Page 84 301012-01151 : Rev 1 : 16-Sep-10
Figure 3-1 Projected Sea Level Rise for 2100 (Source ACE CRC 2008)
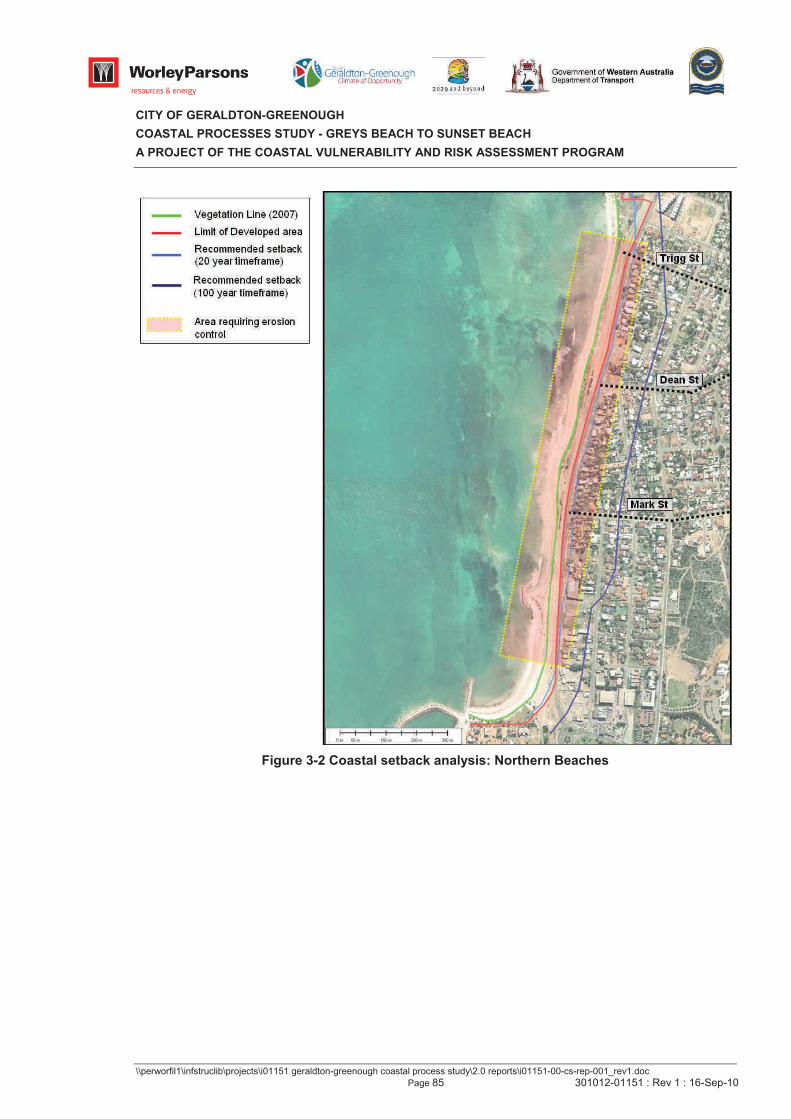
CITY OF GERALDTON-GREENOUGH
COASTAL PROCESSES STUDY - GREYS BEACH TO SUNSET BEACH
A PROJECT OF THE COASTAL VULNERABILITY AND RISK ASSESSMENT PROGRAM
\\perworfil1\infstruclib\projects\i01151 geraldton-greenough coastal process study\2.0 reports\i01151-00-cs-rep-001_rev1.doc
Page 85 301012-01151 : Rev 1 : 16-Sep-10
Figure 3-2 Coastal setback analysis: Northern Beaches
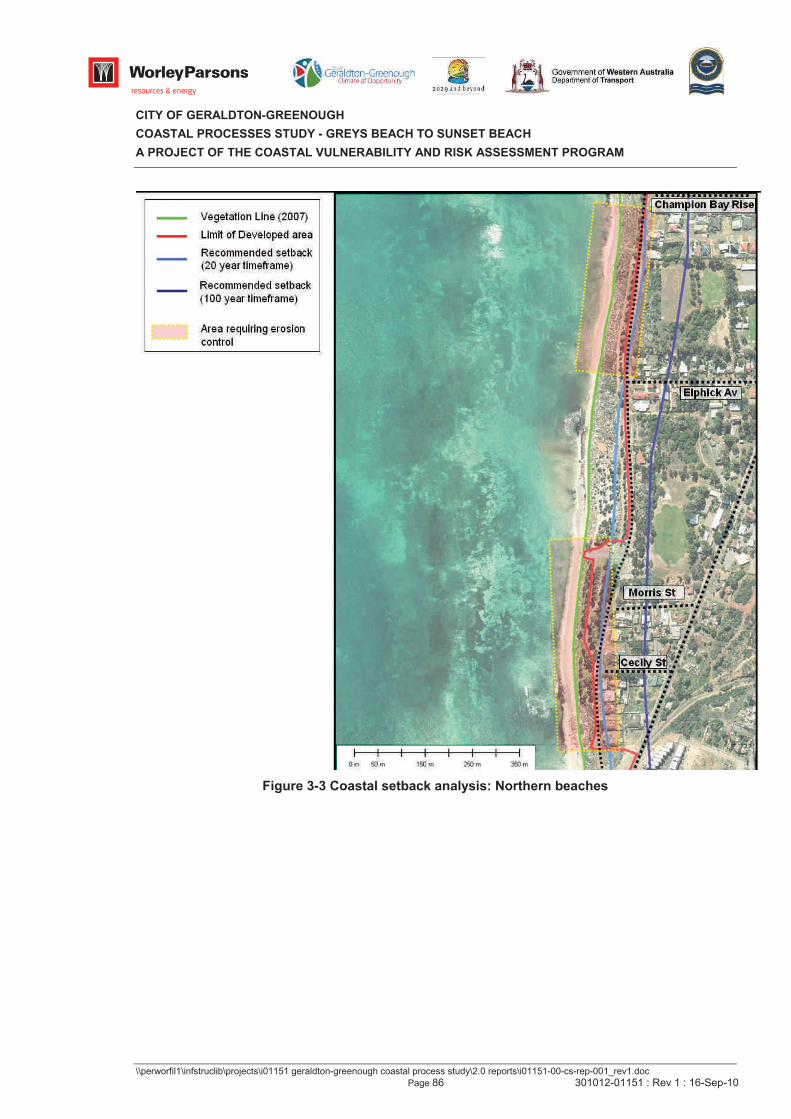
CITY OF GERALDTON-GREENOUGH
COASTAL PROCESSES STUDY - GREYS BEACH TO SUNSET BEACH
A PROJECT OF THE COASTAL VULNERABILITY AND RISK ASSESSMENT PROGRAM
\\perworfil1\infstruclib\projects\i01151 geraldton-greenough coastal process study\2.0 reports\i01151-00-cs-rep-001_rev1.doc
Page 86 301012-01151 : Rev 1 : 16-Sep-10
Figure 3-3 Coastal setback analysis: Northern beaches
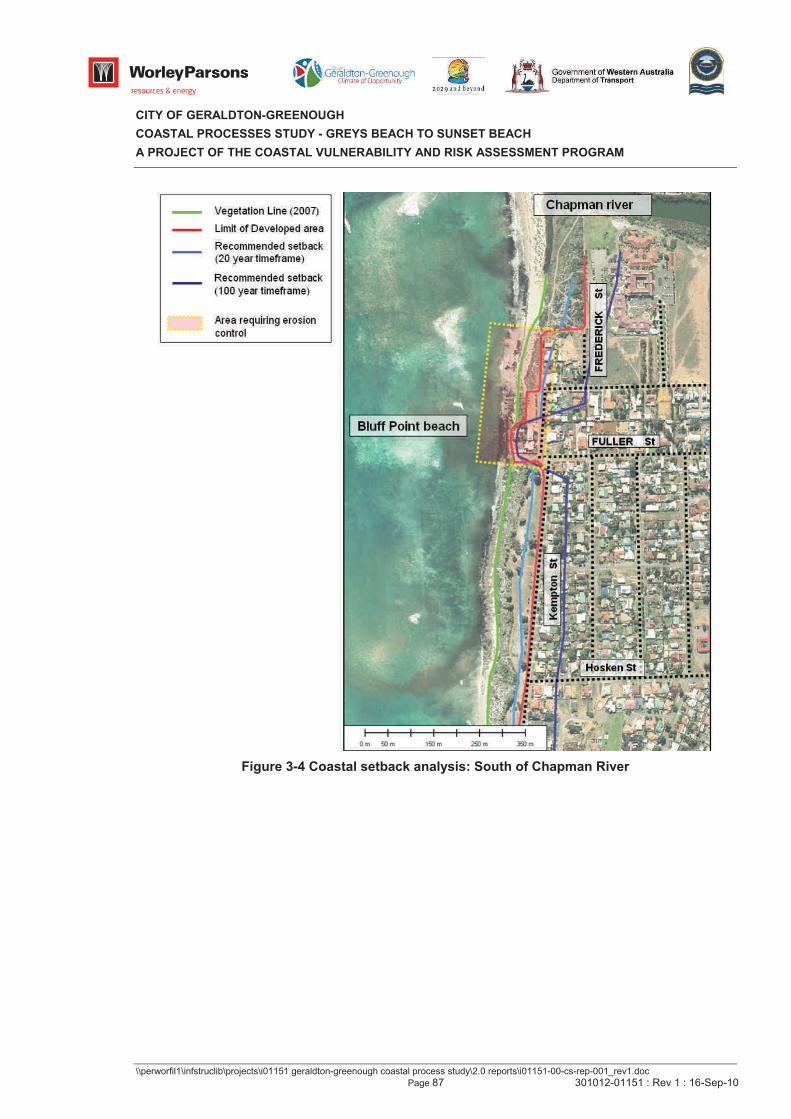
CITY OF GERALDTON-GREENOUGH
COASTAL PROCESSES STUDY - GREYS BEACH TO SUNSET BEACH
A PROJECT OF THE COASTAL VULNERABILITY AND RISK ASSESSMENT PROGRAM
\\perworfil1\infstruclib\projects\i01151 geraldton-greenough coastal process study\2.0 reports\i01151-00-cs-rep-001_rev1.doc
Page 87 301012-01151 : Rev 1 : 16-Sep-10
Figure 3-4 Coastal setback analysis: South of Chapman River
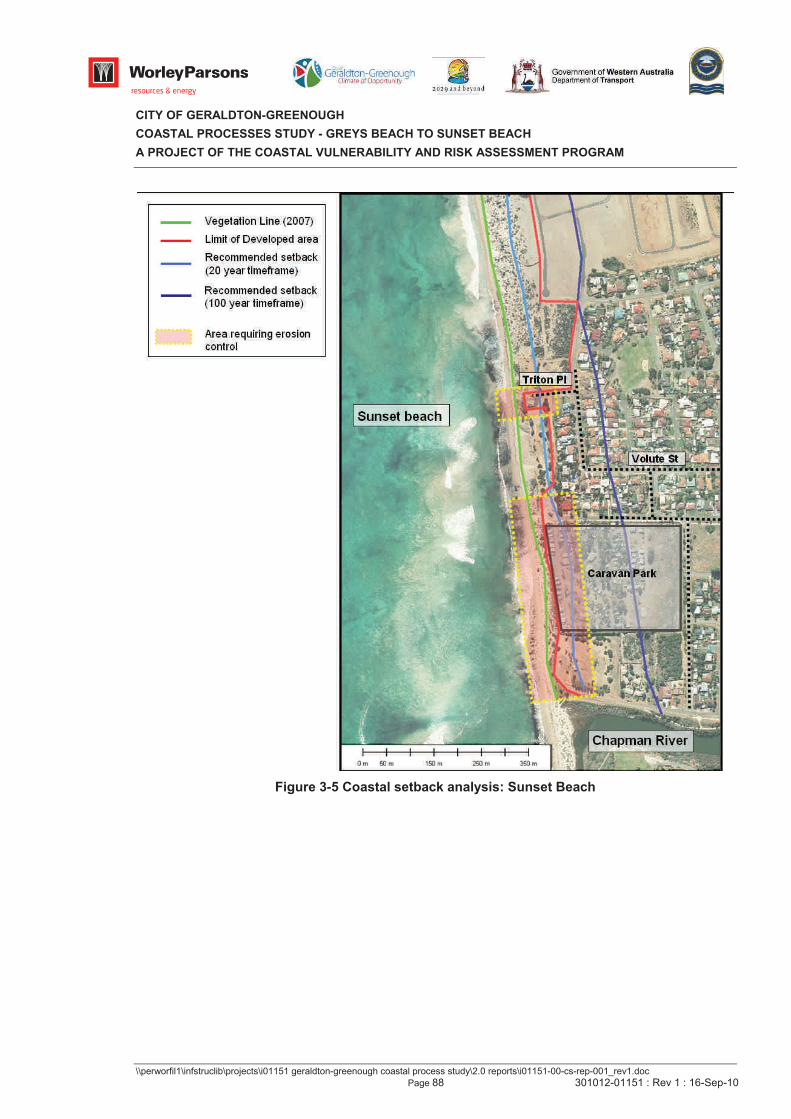
CITY OF GERALDTON-GREENOUGH
COASTAL PROCESSES STUDY - GREYS BEACH TO SUNSET BEACH
A PROJECT OF THE COASTAL VULNERABILITY AND RISK ASSESSMENT PROGRAM
\\perworfil1\infstruclib\projects\i01151 geraldton-greenough coastal process study\2.0 reports\i01151-00-cs-rep-001_rev1.doc
Page 88 301012-01151 : Rev 1 : 16-Sep-10
Figure 3-5 Coastal setback analysis: Sunset Beach
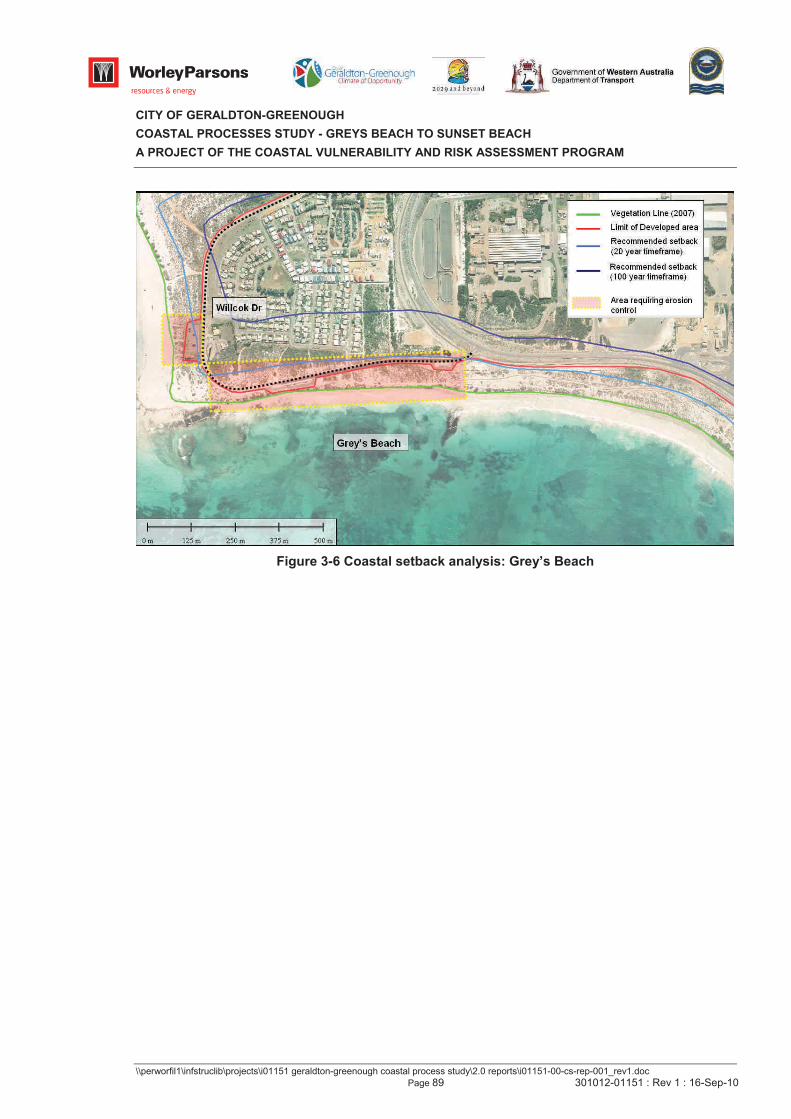
CITY OF GERALDTON-GREENOUGH
COASTAL PROCESSES STUDY - GREYS BEACH TO SUNSET BEACH
A PROJECT OF THE COASTAL VULNERABILITY AND RISK ASSESSMENT PROGRAM
\\perworfil1\infstruclib\projects\i01151 geraldton-greenough coastal process study\2.0 reports\i01151-00-cs-rep-001_rev1.doc
Page 89 301012-01151 : Rev 1 : 16-Sep-10
Figure 3-6 Coastal setback analysis: Grey’s Beach
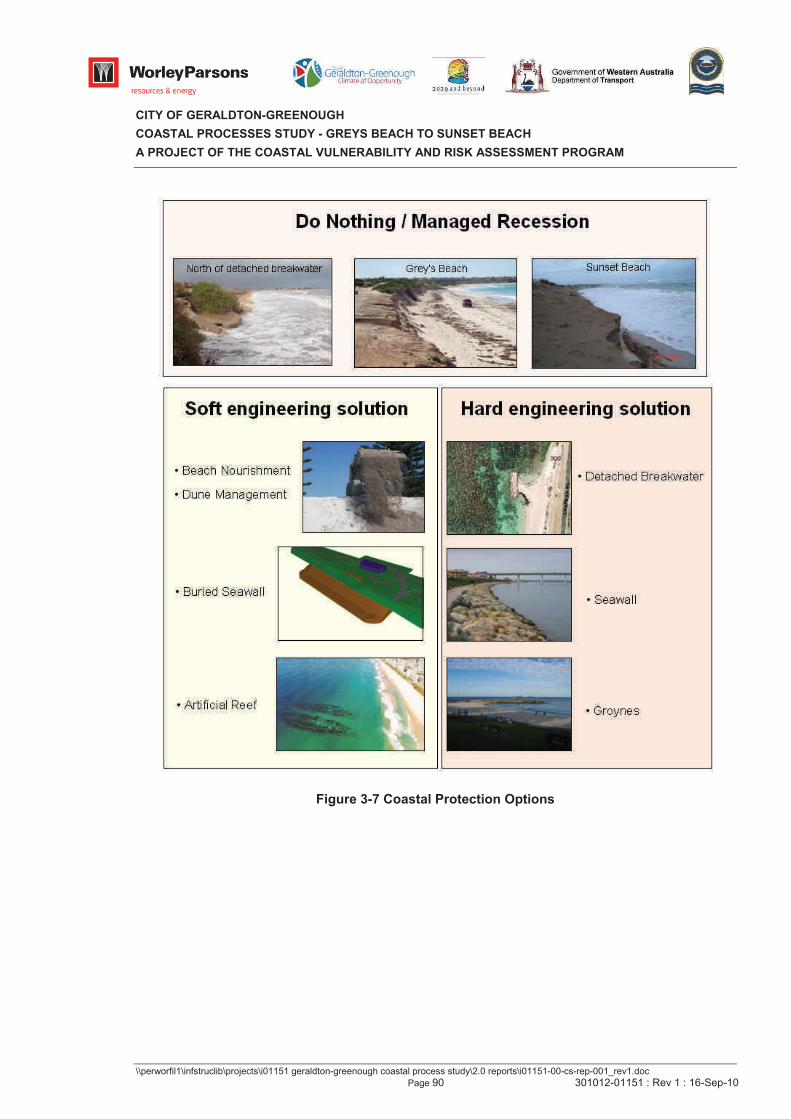
CITY OF GERALDTON-GREENOUGH
COASTAL PROCESSES STUDY - GREYS BEACH TO SUNSET BEACH
A PROJECT OF THE COASTAL VULNERABILITY AND RISK ASSESSMENT PROGRAM
\\perworfil1\infstruclib\projects\i01151 geraldton-greenough coastal process study\2.0 reports\i01151-00-cs-rep-001_rev1.doc
Page 90 301012-01151 : Rev 1 : 16-Sep-10
Figure 3-7 Coastal Protection Options
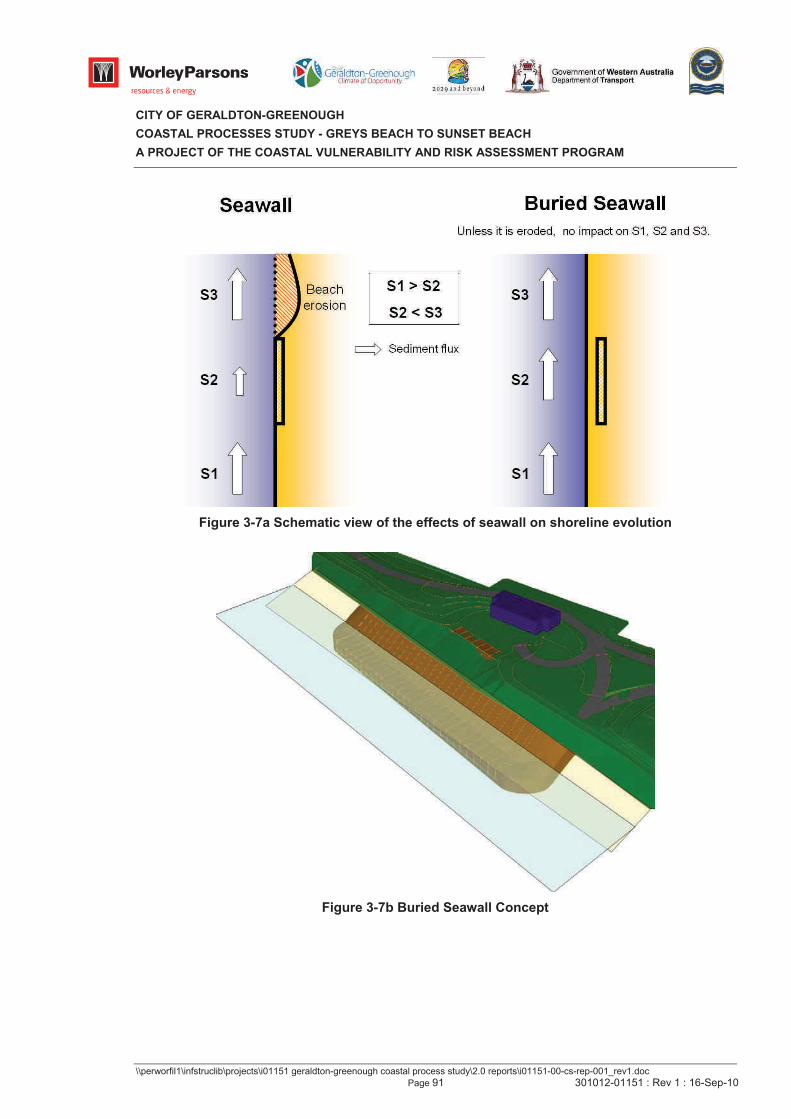
CITY OF GERALDTON-GREENOUGH
COASTAL PROCESSES STUDY - GREYS BEACH TO SUNSET BEACH
A PROJECT OF THE COASTAL VULNERABILITY AND RISK ASSESSMENT PROGRAM
\\perworfil1\infstruclib\projects\i01151 geraldton-greenough coastal process study\2.0 reports\i01151-00-cs-rep-001_rev1.doc
Page 91 301012-01151 : Rev 1 : 16-Sep-10
Figure 3-7a Schematic view of the effects of seawall on shoreline evolution
Figure 3-7b Buried Seawall Concept
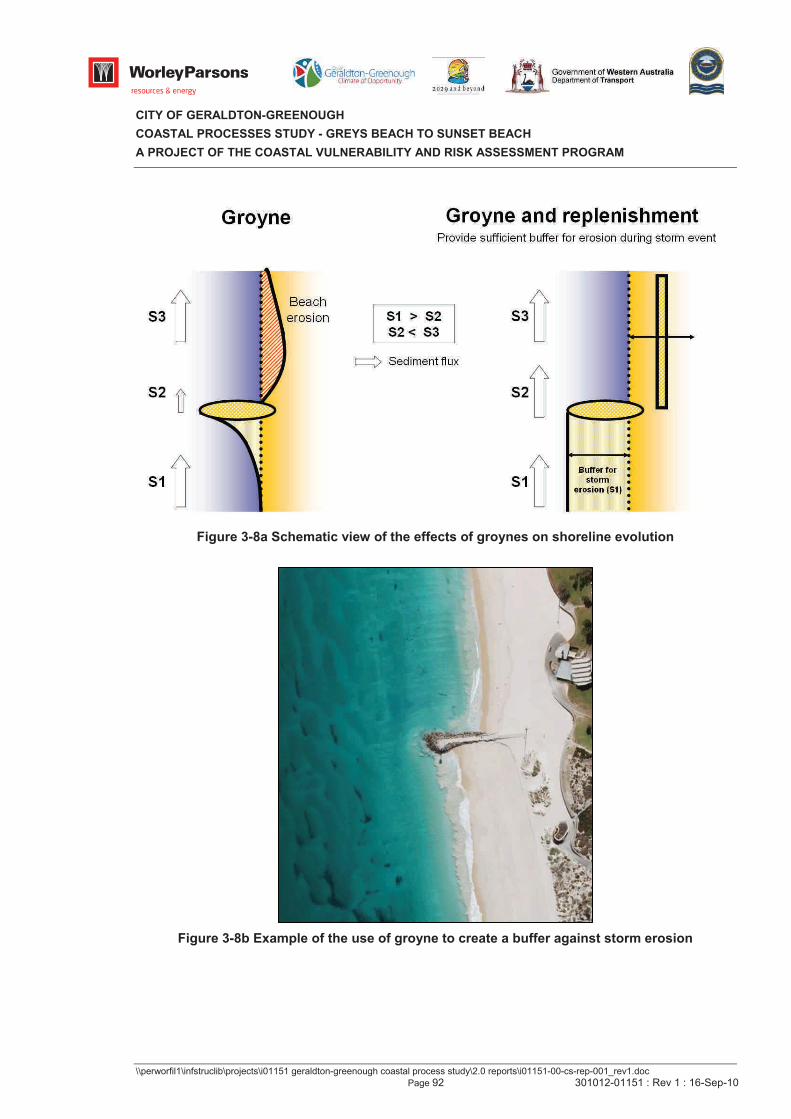
CITY OF GERALDTON-GREENOUGH
COASTAL PROCESSES STUDY - GREYS BEACH TO SUNSET BEACH
A PROJECT OF THE COASTAL VULNERABILITY AND RISK ASSESSMENT PROGRAM
\\perworfil1\infstruclib\projects\i01151 geraldton-greenough coastal process study\2.0 reports\i01151-00-cs-rep-001_rev1.doc
Page 92 301012-01151 : Rev 1 : 16-Sep-10
Figure 3-8a Schematic view of the effects of groynes on shoreline evolution
Figure 3-8b Example of the use of groyne to create a buffer against storm erosion
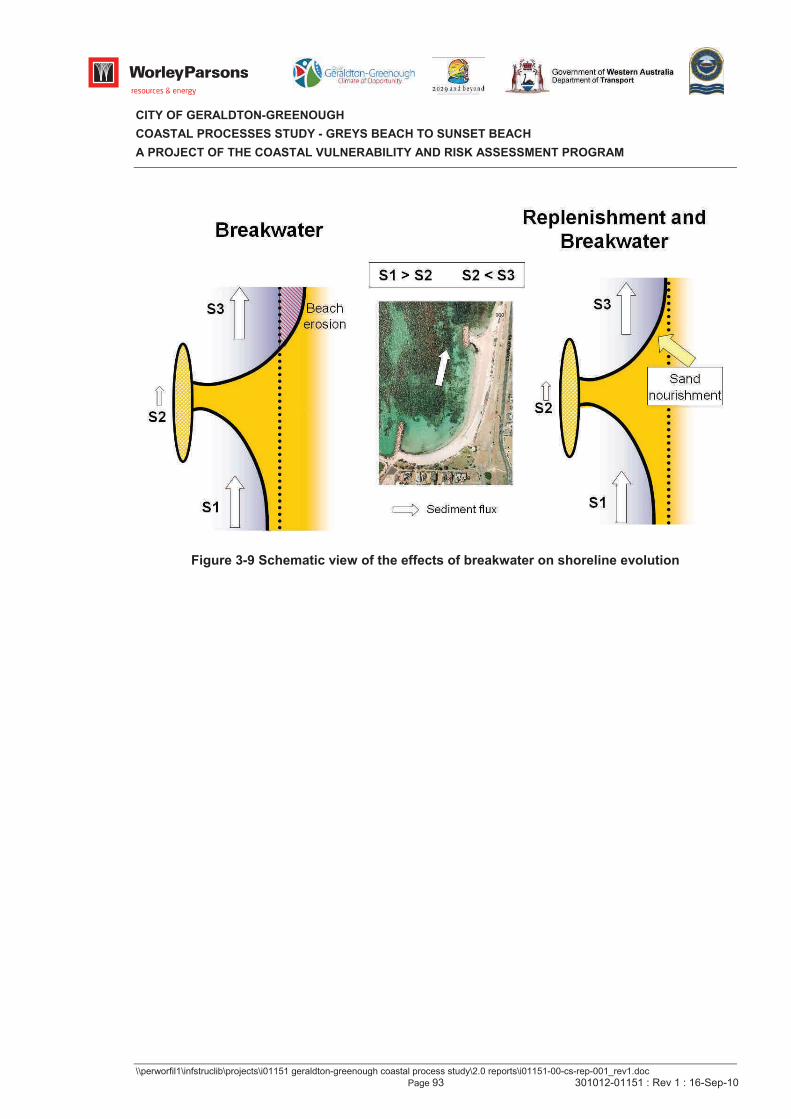
CITY OF GERALDTON-GREENOUGH
COASTAL PROCESSES STUDY - GREYS BEACH TO SUNSET BEACH
A PROJECT OF THE COASTAL VULNERABILITY AND RISK ASSESSMENT PROGRAM
\\perworfil1\infstruclib\projects\i01151 geraldton-greenough coastal process study\2.0 reports\i01151-00-cs-rep-001_rev1.doc
Page 93 301012-01151 : Rev 1 : 16-Sep-10
Figure 3-9 Schematic view of the effects of breakwater on shoreline evolution
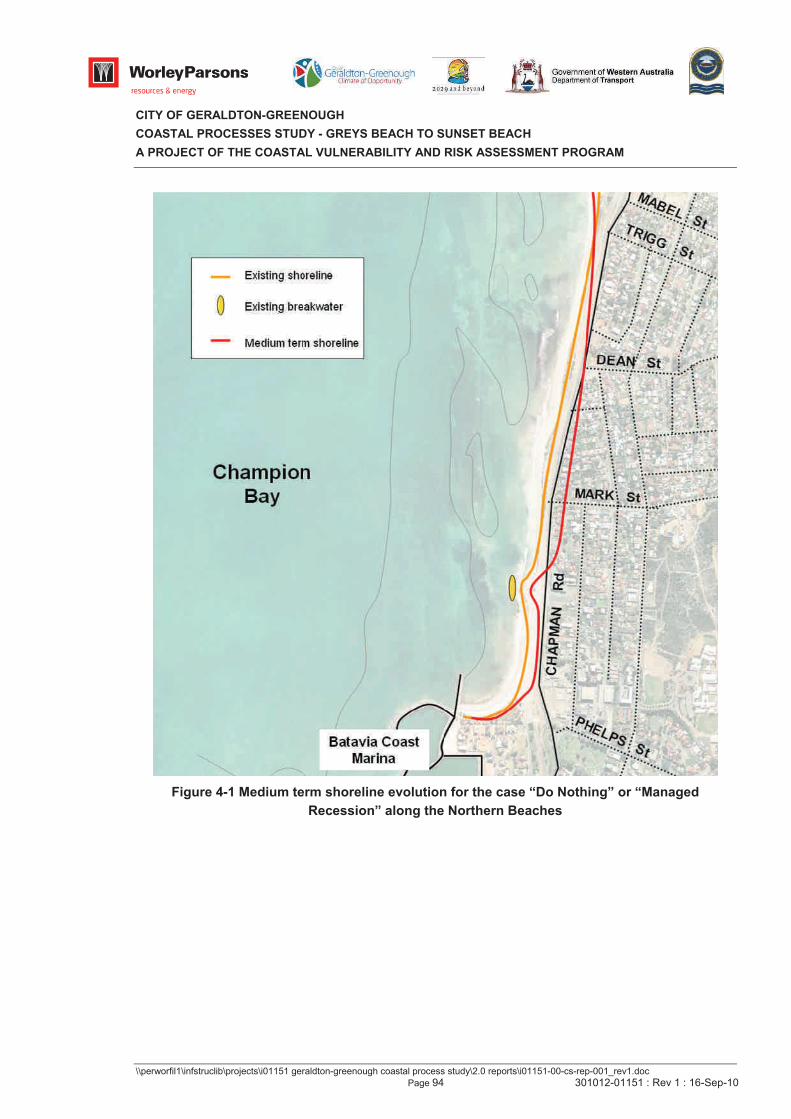
CITY OF GERALDTON-GREENOUGH
COASTAL PROCESSES STUDY - GREYS BEACH TO SUNSET BEACH
A PROJECT OF THE COASTAL VULNERABILITY AND RISK ASSESSMENT PROGRAM
\\perworfil1\infstruclib\projects\i01151 geraldton-greenough coastal process study\2.0 reports\i01151-00-cs-rep-001_rev1.doc
Page 94 301012-01151 : Rev 1 : 16-Sep-10
Figure 4-1 Medium term shoreline evolution for the case “Do Nothing” or “Managed
Recession” along the Northern Beaches
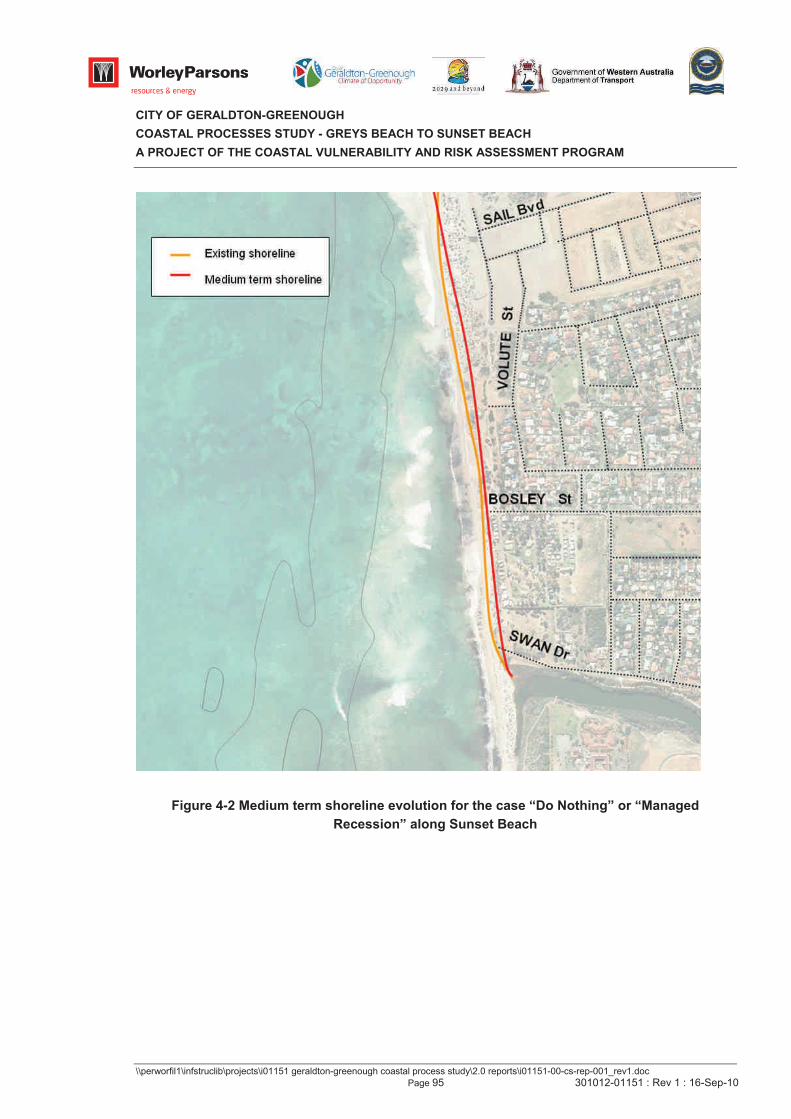
CITY OF GERALDTON-GREENOUGH
COASTAL PROCESSES STUDY - GREYS BEACH TO SUNSET BEACH
A PROJECT OF THE COASTAL VULNERABILITY AND RISK ASSESSMENT PROGRAM
\\perworfil1\infstruclib\projects\i01151 geraldton-greenough coastal process study\2.0 reports\i01151-00-cs-rep-001_rev1.doc
Page 95 301012-01151 : Rev 1 : 16-Sep-10
Figure 4-2 Medium term shoreline evolution for the case “Do Nothing” or “Managed
Recession” along Sunset Beach
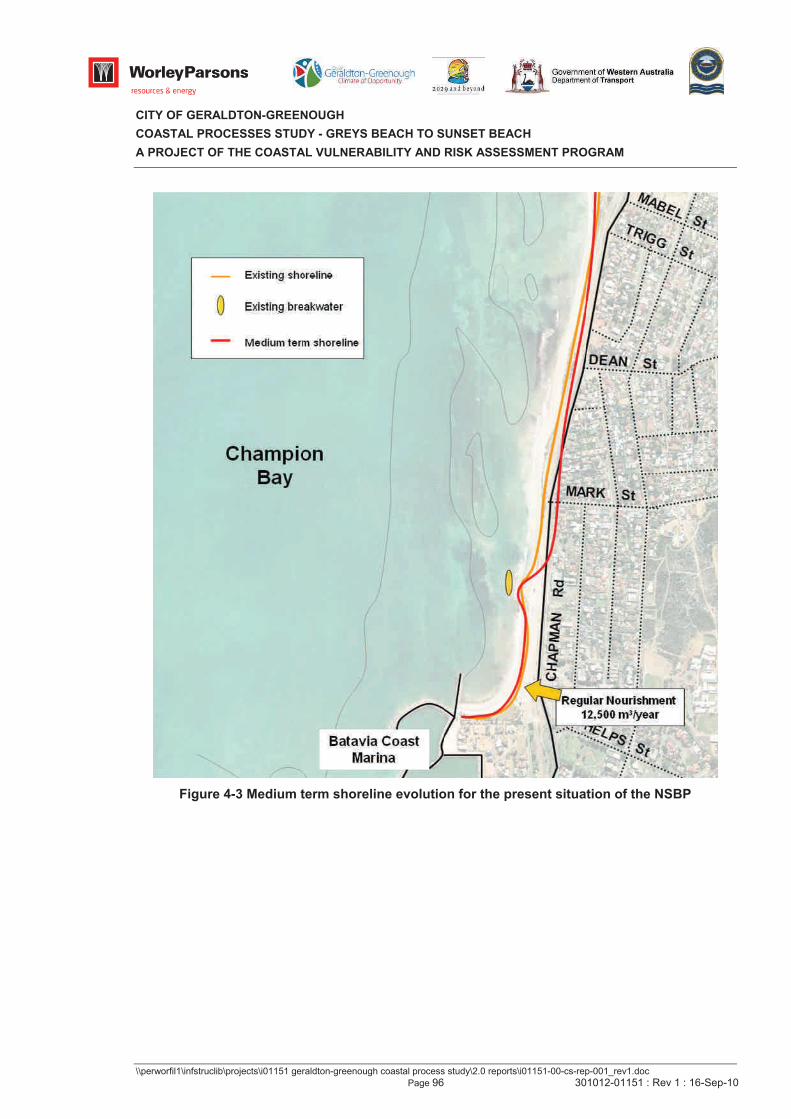
CITY OF GERALDTON-GREENOUGH
COASTAL PROCESSES STUDY - GREYS BEACH TO SUNSET BEACH
A PROJECT OF THE COASTAL VULNERABILITY AND RISK ASSESSMENT PROGRAM
\\perworfil1\infstruclib\projects\i01151 geraldton-greenough coastal process study\2.0 reports\i01151-00-cs-rep-001_rev1.doc
Page 96 301012-01151 : Rev 1 : 16-Sep-10
Figure 4-3 Medium term shoreline evolution for the present situation of the NSBP
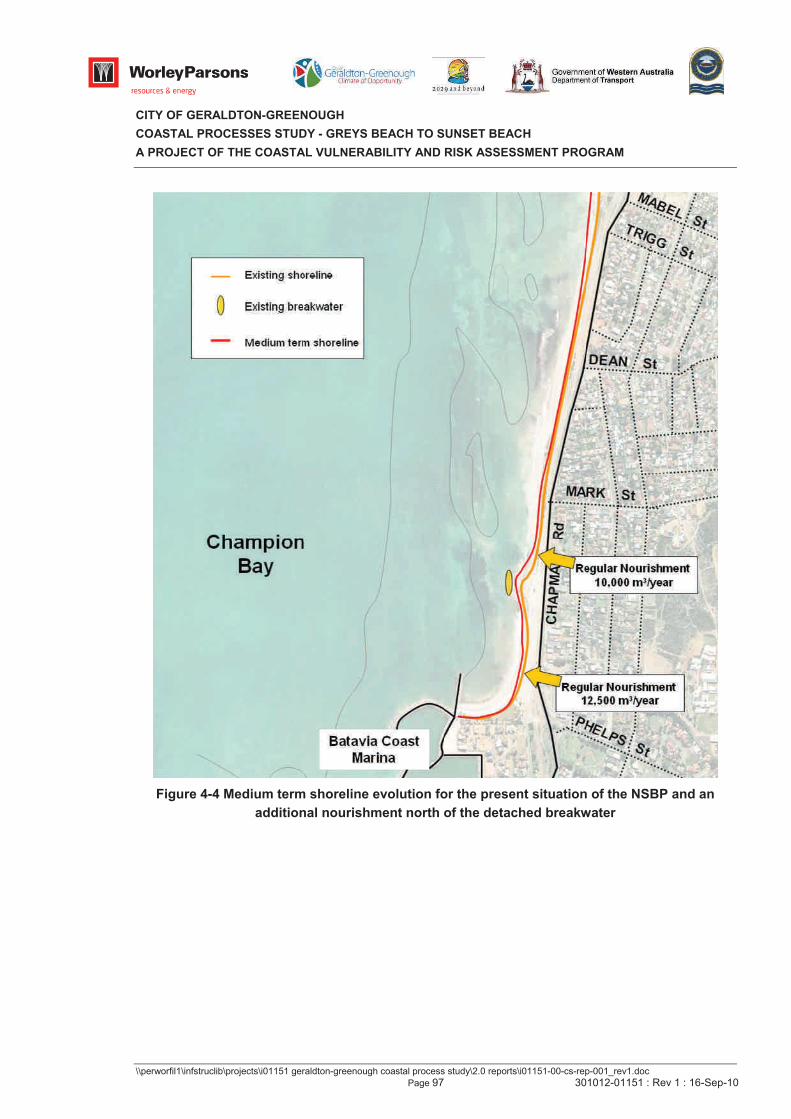
CITY OF GERALDTON-GREENOUGH
COASTAL PROCESSES STUDY - GREYS BEACH TO SUNSET BEACH
A PROJECT OF THE COASTAL VULNERABILITY AND RISK ASSESSMENT PROGRAM
\\perworfil1\infstruclib\projects\i01151 geraldton-greenough coastal process study\2.0 reports\i01151-00-cs-rep-001_rev1.doc
Page 97 301012-01151 : Rev 1 : 16-Sep-10
Figure 4-4 Medium term shoreline evolution for the present situation of the NSBP and an
additional nourishment north of the detached breakwater
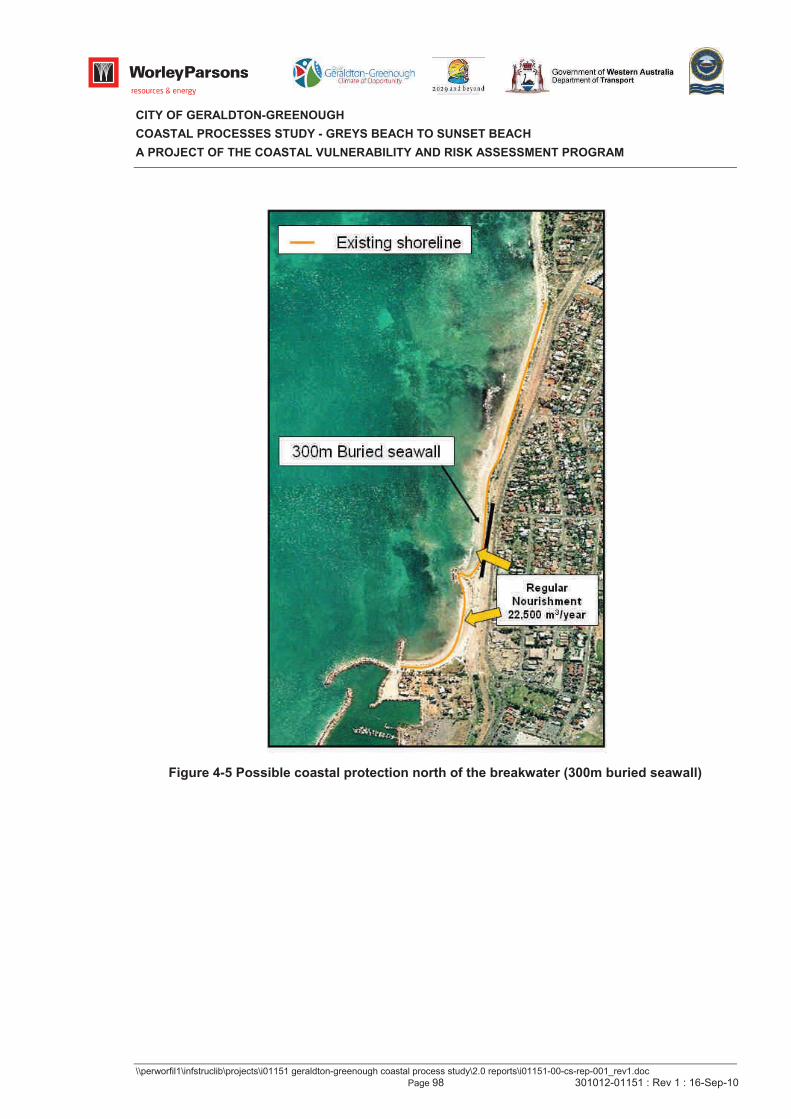
CITY OF GERALDTON-GREENOUGH
COASTAL PROCESSES STUDY - GREYS BEACH TO SUNSET BEACH
A PROJECT OF THE COASTAL VULNERABILITY AND RISK ASSESSMENT PROGRAM
\\perworfil1\infstruclib\projects\i01151 geraldton-greenough coastal process study\2.0 reports\i01151-00-cs-rep-001_rev1.doc
Page 98 301012-01151 : Rev 1 : 16-Sep-10
Figure 4-5 Possible coastal protection north of the breakwater (300m buried seawall)
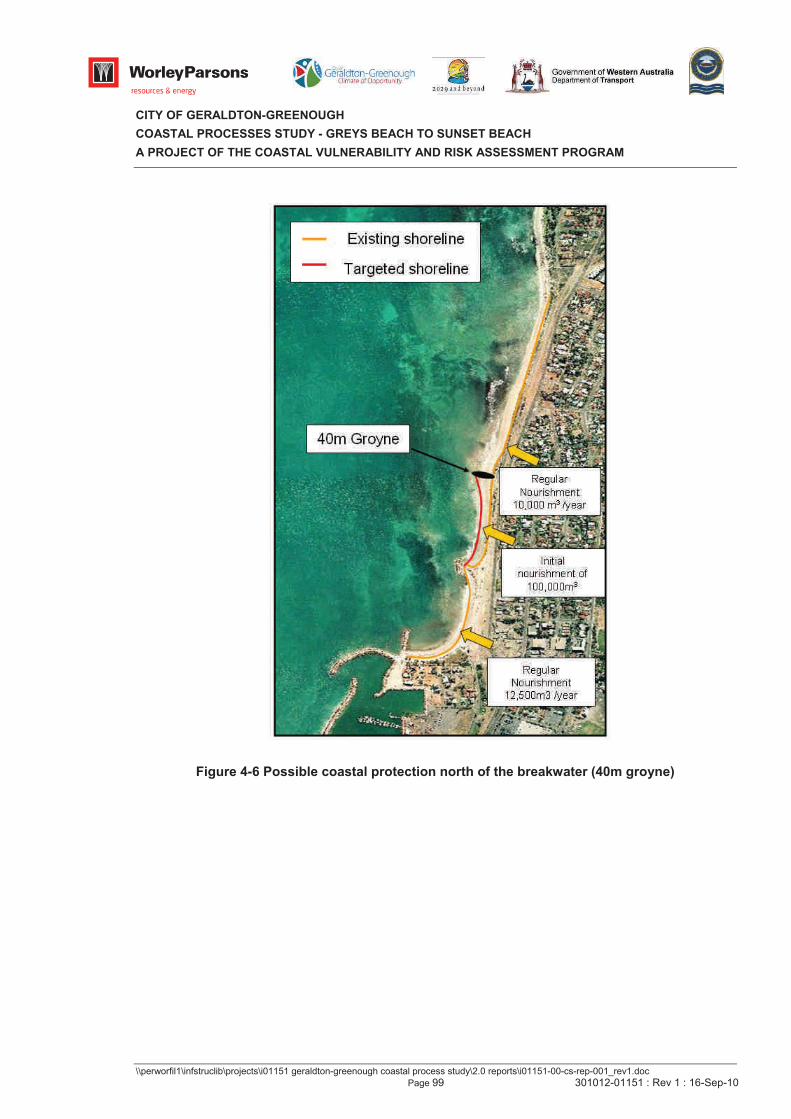
CITY OF GERALDTON-GREENOUGH
COASTAL PROCESSES STUDY - GREYS BEACH TO SUNSET BEACH
A PROJECT OF THE COASTAL VULNERABILITY AND RISK ASSESSMENT PROGRAM
\\perworfil1\infstruclib\projects\i01151 geraldton-greenough coastal process study\2.0 reports\i01151-00-cs-rep-001_rev1.doc
Page 99 301012-01151 : Rev 1 : 16-Sep-10
Figure 4-6 Possible coastal protection north of the breakwater (40m groyne)
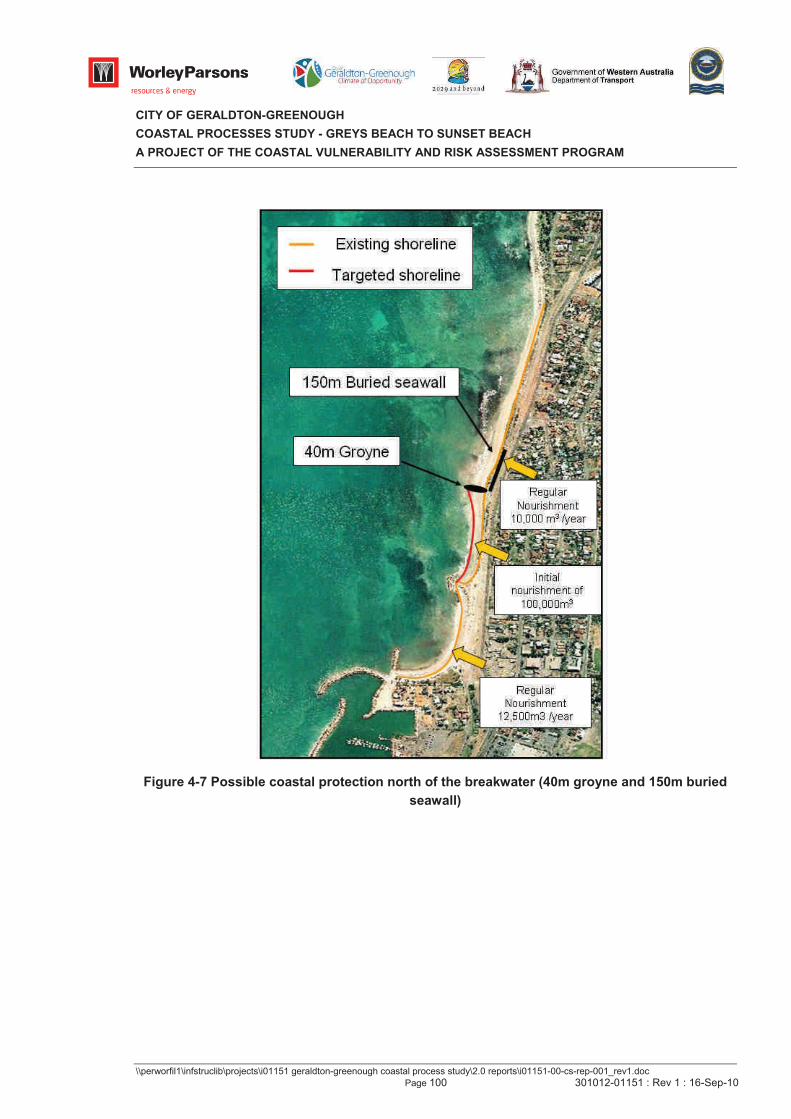
CITY OF GERALDTON-GREENOUGH
COASTAL PROCESSES STUDY - GREYS BEACH TO SUNSET BEACH
A PROJECT OF THE COASTAL VULNERABILITY AND RISK ASSESSMENT PROGRAM
\\perworfil1\infstruclib\projects\i01151 geraldton-greenough coastal process study\2.0 reports\i01151-00-cs-rep-001_rev1.doc
Page 100 301012-01151 : Rev 1 : 16-Sep-10
Figure 4-7 Possible coastal protection north of the breakwater (40m groyne and 150m buried
seawall)
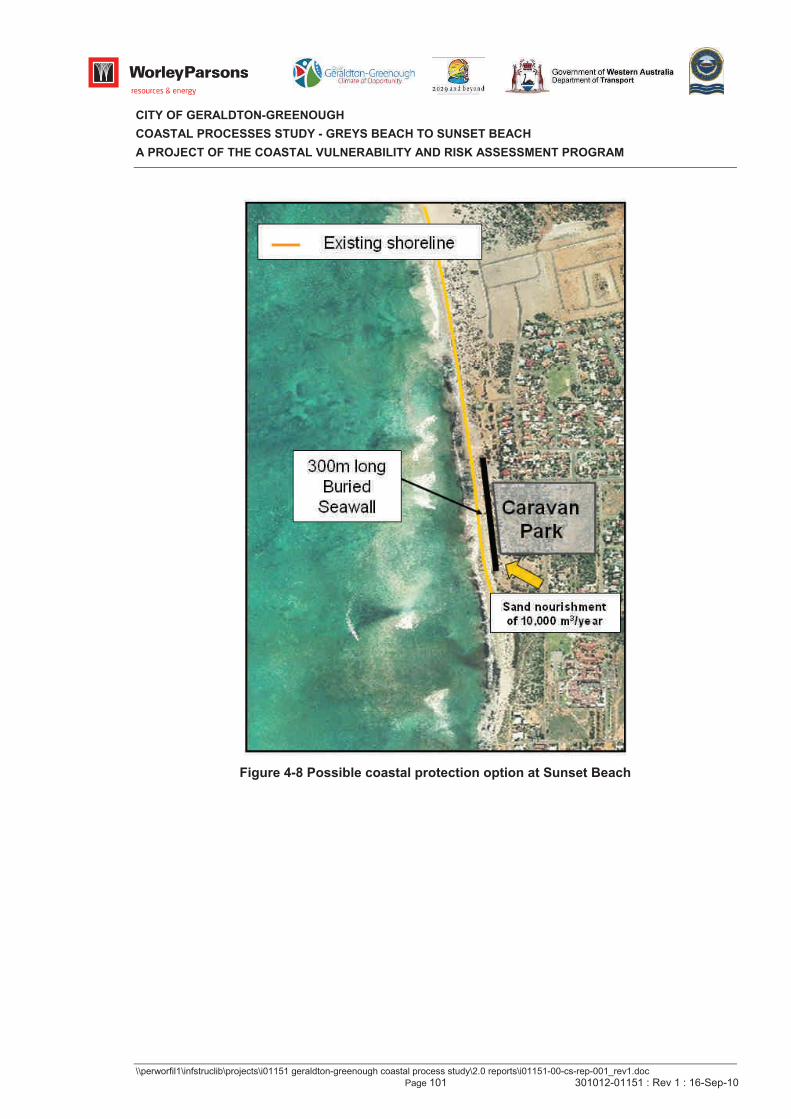
CITY OF GERALDTON-GREENOUGH
COASTAL PROCESSES STUDY - GREYS BEACH TO SUNSET BEACH
A PROJECT OF THE COASTAL VULNERABILITY AND RISK ASSESSMENT PROGRAM
\\perworfil1\infstruclib\projects\i01151 geraldton-greenough coastal process study\2.0 reports\i01151-00-cs-rep-001_rev1.doc
Page 101 301012-01151 : Rev 1 : 16-Sep-10
Figure 4-8 Possible coastal protection option at Sunset Beach
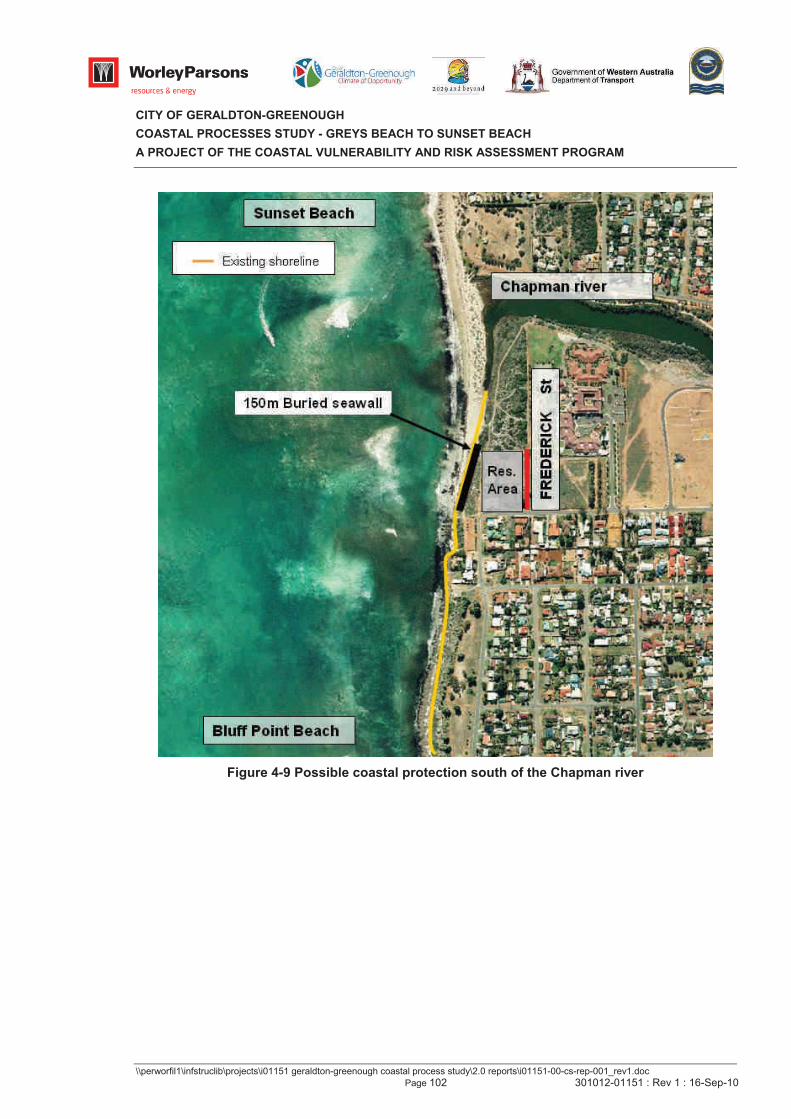
CITY OF GERALDTON-GREENOUGH
COASTAL PROCESSES STUDY - GREYS BEACH TO SUNSET BEACH
A PROJECT OF THE COASTAL VULNERABILITY AND RISK ASSESSMENT PROGRAM
\\perworfil1\infstruclib\projects\i01151 geraldton-greenough coastal process study\2.0 reports\i01151-00-cs-rep-001_rev1.doc
Page 102 301012-01151 : Rev 1 : 16-Sep-10
Figure 4-9 Possible coastal protection south of the Chapman river
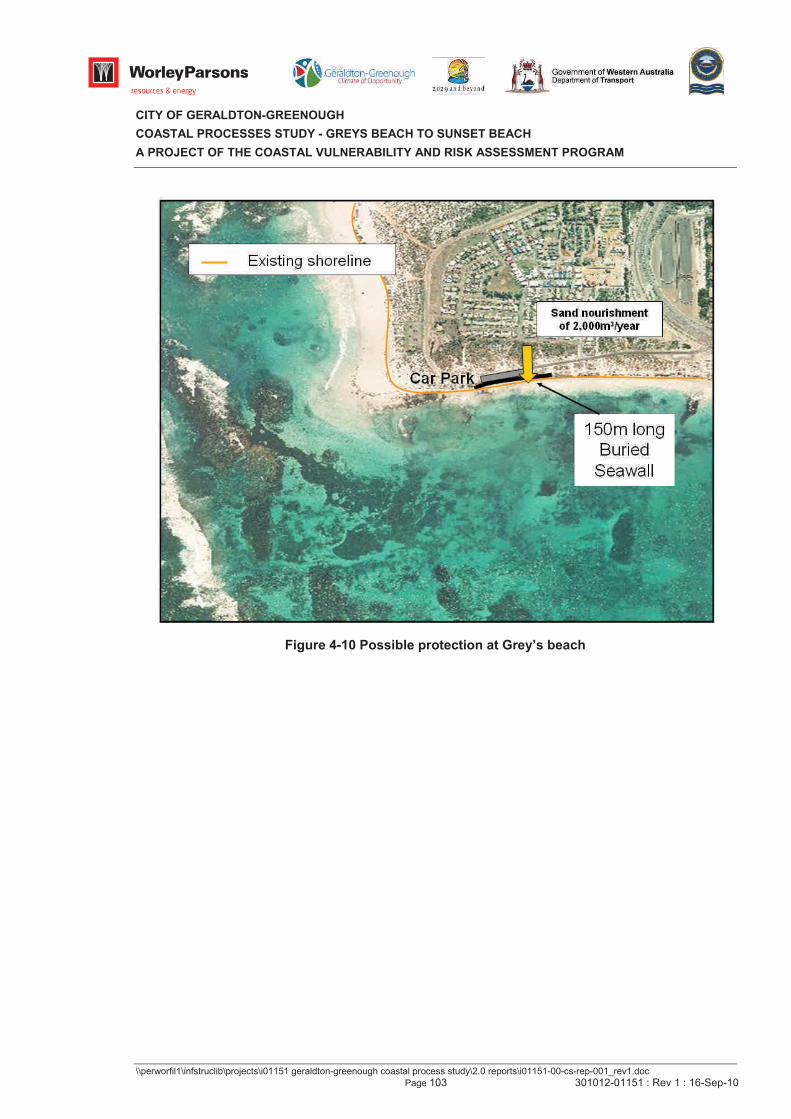
CITY OF GERALDTON-GREENOUGH
COASTAL PROCESSES STUDY - GREYS BEACH TO SUNSET BEACH
A PROJECT OF THE COASTAL VULNERABILITY AND RISK ASSESSMENT PROGRAM
\\perworfil1\infstruclib\projects\i01151 geraldton-greenough coastal process study\2.0 reports\i01151-00-cs-rep-001_rev1.doc
Page 103 301012-01151 : Rev 1 : 16-Sep-10
Figure 4-10 Possible protection at Grey’s beach
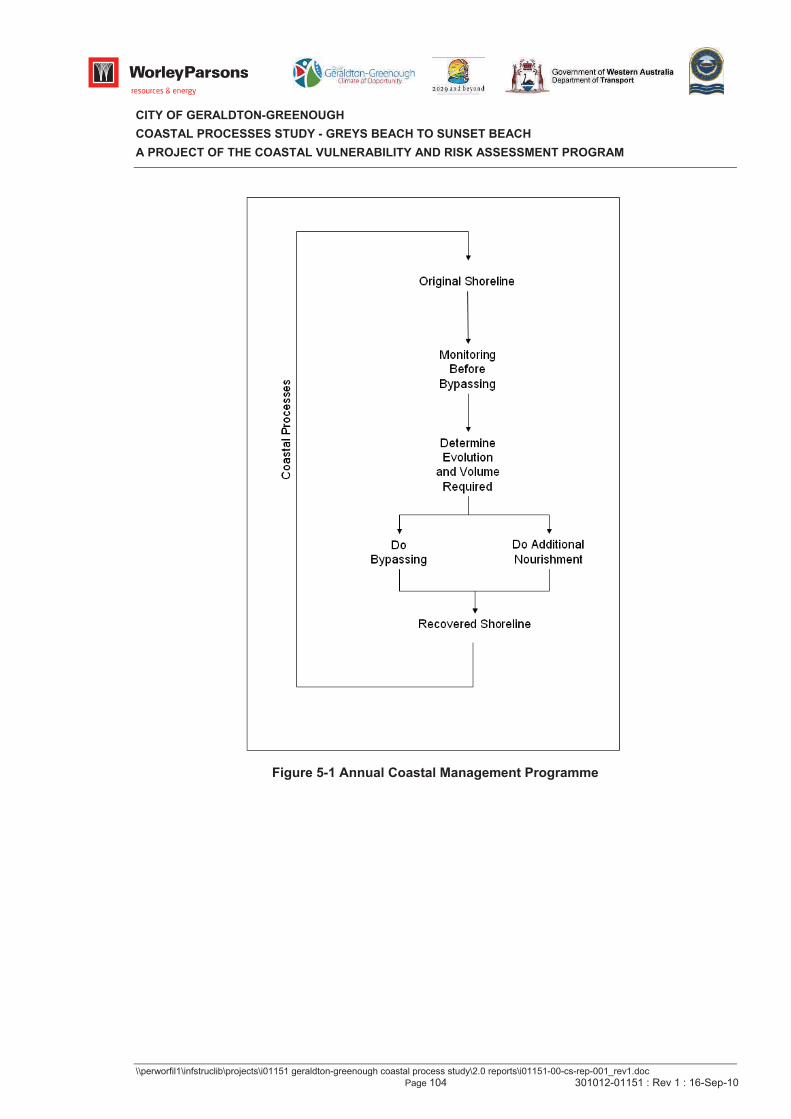
CITY OF GERALDTON-GREENOUGH
COASTAL PROCESSES STUDY - GREYS BEACH TO SUNSET BEACH
A PROJECT OF THE COASTAL VULNERABILITY AND RISK ASSESSMENT PROGRAM
\\perworfil1\infstruclib\projects\i01151 geraldton-greenough coastal process study\2.0 reports\i01151-00-cs-rep-001_rev1.doc
Page 104 301012-01151 : Rev 1 : 16-Sep-10
Figure 5-1 Annual Coastal Management Programme
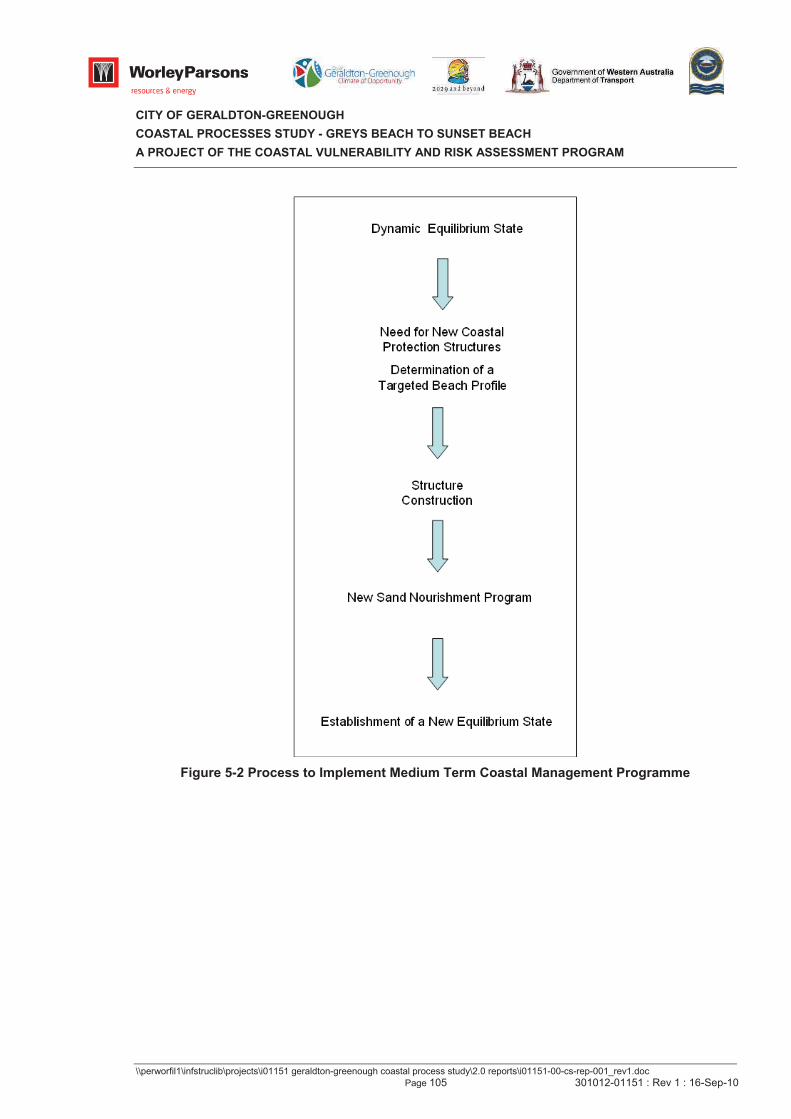
CITY OF GERALDTON-GREENOUGH
COASTAL PROCESSES STUDY - GREYS BEACH TO SUNSET BEACH
A PROJECT OF THE COASTAL VULNERABILITY AND RISK ASSESSMENT PROGRAM
\\perworfil1\infstruclib\projects\i01151 geraldton-greenough coastal process study\2.0 reports\i01151-00-cs-rep-001_rev1.doc
Page 105 301012-01151 : Rev 1 : 16-Sep-10
Figure 5-2 Process to Implement Medium Term Coastal Management Programme
Recommended


