
Policy Brief
July 2015
The Illinois Institute for Rural Affairs (IIRA)
works to improve the quality of life for
rural residents by partnering with public and private agencies on local development and enhancement efforts.
www.IIRA.org
Cooperation and Competition in the Local Food Movement: A Focus on Community Supported Agriculture1 Christopher D. Merrett, Timothy Collins, and Fred Iutzi, Illinois Institute for Rural Affairs, Western Illinois University Heather McIlvaine-Newsad, Department of Sociology and Anthropology, Western Illinois University Tom Sadler, Department of Economics, Western Illinois University
Over the past three decades, American consumers have witnessed the growing popularity of locally grown foods. Several factors are driving this interest, including worries about food safety and environmental damage associated with industrial agriculture, the desire for better-quality foods that are associated with local producers, and concern that the industrial model of agriculture has harmed rural communities through farm consolidation that encourages population outmigration.
One model of local production is called Community Supported Agriculture (CSA). A CSA is a farmer direct marketing enterprise that creates a coop-eration-based relationship with consumers. In this arrangement, multiple households purchase “shares” or subscriptions from a local farm at the beginning of each growing season. In exchange for the initial investment the farmer delivers baskets of seasonally appropriate vegetables, fruits, and other produce to each member/subscriber throughout the season. The sub-scribers effectively share production risks with the farmer over the growing season. CSA operations often also feature other dimensions of community involvement in the life of the farming operations, such as volunteer labor in lieu of part of the share price or social events on the farm. The CSA model has become an important part of the expanding local food movement in North America, with an emphasis on “civic agriculture” rather than the “industrial agriculture” paradigm. The model is touted as a sustainable form of agricul-ture because these farms are environmentally friendly, supportive of com-munities, and economically profitable.
This Policy Brief examines highlights of CSA farm operations gleaned from a national survey conducted in the summer of 2014 by the Illinois Institute for Rural Affairs Illinois Cooperative Development Center for the United
1 Adapted from Merrett, Chris et al, “Trends in Local Food Production: The Growing Importance and Impacts of Community Supported Agriculture in the United States.” in Sadler, Thomas R., et al, eds. Local Food Networks and Activism in the Heartland. Champaign, IL: Common Ground Publishing, 2014.

2 Illinois Institute for Rural Affairs Policy Brief
States Department of Agriculture (USDA).2 The findings discussed here suggest that CSA operations have dis-tinctive characteristics, but face some similar issues to larger, more traditional farms. Findings about CSA farms include:
• Women operate more than 60 percent of CSA farms.
• CSA operators are highly educated, with about 82 percent holding a college or postgraduate degree.
• CSA farms face problems with the “cost-price squeeze” that also affects larger farms. CSA operators have increased the number of acres planted; maintained labor-intensive operations and used volunteers; and slightly increased the use of machinery. In addition, they have raised prices for consumers.
• Most CSA operators tended to be committed to environmentally-friendly farming strategies.
• CSA operators appeared to be less motivated by profit than they were by other more idealistic considerations.
• Generally, CSA operations provide supplemental income for farm families.
This report summarizes some key survey findings, including:
• a profile of the CSA population;
• likely impacts of the “cost-price squeeze” on CSAs;
• owners’ motivations for running a CSA; and
• CSA income.
A policy discussion follows the data analysis.
What does the CSA Population Look Like?
Community supported agriculture operators appear to have some demographic differences from operators of conventional farms. For example:
2 Funding for the survey and this report came from a USDA Rural Cooperative Development Grant to the Illinois Institute for Rural Affairs at Western Illinois University.
• About 62 percent of the CSA operators surveyed were women. This compares with 30 percent of operators who were operators on U.S. farms of all types, according to the 2012 Agriculture Census.3
• About 45 percent of the CSA operators were aged 41 to 60, and about 28 percent were aged 26 to 40. As a group, CSA operators were younger on average than traditional farmers, whose average age was 58.3 years in the most recent Census of Agriculture.4
• More than 45 percent of the CSA operators who responded said they had a college degree, and about 36 percent said they had a post graduate degree. This education level far exceeds the attainment of farmers, ranchers, and other agricultural managers — about 26 percent reported an associate’s or bachelor’s degree, while 3.5 percent reported a master’s, doctoral, or professional degree, according to the Department of Labor.5
• More than three-quarters of the CSA farmers did not grow up on a farm.
CSA survey respondents were overwhelmingly Caucasian. Apparently, no Hispanic, Asian American, or African American CSA operators responded to the survey, and it is impossible to determine if any minorities were in the sample.
The “Cost-Price Squeeze”
The traditional farm “cost-price squeeze” appears to be a reality for CSA operations. Although they are set-ting their own distinctive course, CSA farms surveyed in 2014 reported adaptations over time to deal with the threat to profitability posed by the increasing cost of inputs, competition, and other factors. To meet the
3 United States Department of Agriculture. “2012 Census Highlights: Farm Demographics.” http://www.agcen-sus.usda.gov/Publications/2012/Online_Resources/Highlights/Farm_Demographics/. Accessed May 15, 2015.
4 Ibid5 United States Department of Labor Bureau of Labor
Statistics. “Educational attainment for workers 25 years and older by detailed occupation, 2010 — 11.” http://www,bls.gov/emp/ep_table_111.htm. Accessed May 21, 2015.

Illinois Institute for Rural Affairs Policy Brief 3
challenge CSA operators have increased the number of acres planted, maintained labor-intensive opera-tions and used volunteers, and slightly increased the use of machinery. In addition, they raised prices for subscribers.
Farm Size
This survey found that one response to the cost-price squeeze was to increase the number of acres under cultivation to generate more revenue. CSA farms have
grown in size since they were started when measured as a percentage of the total acres on the farm (Figure 1 and 2). About three-fourths of the farms started with less than 5 percent of the farms’ total acres were dedi-cated to the CSA in their first year. In the 2014 survey, about 46 percent of the respondents reported opera-tions of less than 5 percent of farm acreage. Smaller size operations were still most common, but largest acreages were represented in percentages greater than they were when the CSA was started.
Figure 1. Total Acreage of Farm Dedicated to the CSA During the First Season
0% 10% 20% 30% 40% 50% 60% 70% 80%
Less than 5%
6% to 10%
11% to 20%
21% to 30%
31% to 40%
41% to 50%
51% to 60%
More than 60%
What was the total acreage of farm dedicated to the CSA during the first season?
% of farmers responding

4 Illinois Institute for Rural Affairs Policy Brief
Figure 2. Total Acreage of Farm Dedicated to the CSA Currently
0% 5% 10% 15% 20% 25% 30% 35% 40% 45% 50%
Less than 5%
6% to 10%
11% to 20%
21% to 30%
31% to 40%
41% to 50%
51% to 60%
More than 60%
What is the total acreage of farm dedicated to the CSA currently?
% of farmers responding
Farm Labor
Cost cutting can be achieved by maintaining a labor-intensive operation and using volunteers and family members. The survey indicated most CSA farms were labor intensive. Almost two-thirds of the operators agreed that finding workers had moderate to high impacts on their farms.
Owner operators provided most of their own labor (Table 1). Operators were engaged in all of the jobs associated with the CSA with a major focus on market-ing, public relations, and social networking, as well as planning for crops. They spent considerable time on other tasks, too. Spouses also helped with all of the farm tasks, but mainly worked at peak times when intensive labor was needed, such as planting (36%), weeding (33%), and harvesting (39%).
Just over two-thirds of the operation did not hire labor from the immediate family. Immediate family members — whether or not they were hired — pitched in with time-consuming and time-sensitive tasks such as planting (16%), weeding (15%), and harvesting (20%). Use of labor by extended family members was a rarity.
Use of off-farm labor was more common than use of family labor, a practice used by approximately 60 percent of the CSA operations. Operators typically reported hiring between one and five workers. Paid employees also were mainly brought in at peak times: planting (58%), weeding (61%), and harvesting (65%). Although there were differences by full-time and part-time and by gender. CSA operations employed similar numbers of female and male employees in both part-time and full-time work. The farms tended to employ a greater percentage of part-time workers.

Illinois Institute for Rural Affairs Policy Brief 5
Table 1. Who Performs Tasks on the CSA
You (%)
Spouse (Partner)
(%)Immediate Family (%)
Extended Family (%)
Paid Employee
(%)Subscriber
(%)Volunteer
(%)Intern
(%)
Planning for crops 84.7 22.5 5.4 0.9 17.1 0.0 0.0 1.8
Seed Selection 80.9 19.1 5.5 0.9 19.1 0.9 0.0 1.8
Planting 73.6 36.4 15.5 1.8 57.3 13.6 23.6 24.5
Weeding 70.9 32.7 14.5 2.7 60.9 18.2 39.1 30.0
Harvesting 74.8 38.7 19.8 1.8 64.9 18.9 34.2 29.7
Bookkeeping 76.1 17.7 4.4 1.8 19.5 1.8 1.8 0.9
Marketing 92.9 18.8 4.5 0.9 17.9 1.8 2.7 3.6
Public relations 94.5 20.0 3.6 1.8 16.4 0.9 2.7 3.6
Social networking 88.6 15.2 5.7 1.0 16.2 4.8 4.8 3.8
Other (please specify) 94.7 26.3 15.8 0.0 15.8 0.0 10.5 5.3
More than two-thirds of the respondents reported that they used help provided by interns, volunteers or sub-scribers. Most of the operations (63%) used one to five volunteers, but a few used more, with 14 percent using six to ten volunteers. About 43 percent of the CSA farms had one to five interns who wanted to work for the experience. Meanwhile, about 56 percent of the CSA’s used interns who worked for a stipend and received reduced unit rates. In addition, almost two thirds of the operations let subscribers work for reduced rates on units. Operators mainly used volunteers for planting (24%), weeding (40%), and harvesting (34%).
The cost-price squeeze also played out on the con-sumer side. Almost 70 percent of the respondents reported increased subscription rates over the past five years (Figure 3). About 37 percent of the opera-tions increased rates by 25 percent or more, while approximately 18 percent raised rates between 15
percent and 24 percent. A few operators reported reduced prices, but this was rare.
Machinery
The level of mechanization increased slightly between the 2009 and 2014 surveys, probably to save time for owner operators, to reduce labor costs, and to account for perceived labor shortages. An increased capital investment in equipment, however small, could address efforts to cut costs in the long run. Even so, CSA opera-tions remained labor intensive; more than 96 percent of them reported using hand tools. Approximately 83 percent reported using tractors, and only about 25 percent reported using harvesting machinery. The vast majority of farms used refrigeration (95%), but less than half used washers. Almost 82 percent reported using drip irrigation, a technology that saves considerable labor in caring for crops.

6 Illinois Institute for Rural Affairs Policy Brief
Figure 3. Subscription Rates Increased Over the Last Five Years
0% 5% 10% 15% 20% 25% 30% 35% 40%
1% to 5%
6% to 9%
10% to 14%
15% to 19%
20% to 24%
25% or more
If yes, by how much have your rates increased?
What Motivates CSA Operators?
CSA operators appeared to be less driven by profit motives than they were by other considerations (Table 2). While 55 percent of the respondents considered profit to be important or very important, 92 percent considered providing wholesome food to the com-munity to be important or very important. Only 1.8 percent of the respondents listed this motivation as not important.
Environmental concerns also were more important than profits. Nearly 88 percent of the CSA operators listed promoting sustainable agriculture as important or very important. Land stewardship/environmental concerns were also high motivators, with about 82
percent of the respondents listing them as important or very important.
Personal satisfaction also was important to CSA operators, with nearly 80 percent listing this value as important or very important. Generating a sense of community had similar interest, about 79 percent. Approximately 70 percent of the respondents listed life style as important or very important, while nearly 12 percent did not think it was all that important.
Keeping farmland in the family was not as important as other motivating factors; more than half of the respon-dents said it was not all that important, while nearly 27 percent saw it as important or very important. About 8 percent were unsure about this factor.

Illinois Institute for Rural Affairs Policy Brief 7
Table 2. Motivating Factors for CSA OperatorsPlease rank the following factors motivating you to operate a CSA (1 = not important and 5 = very important
Not important (%)
1(%)
2
Moderately important (%)
3(%)
4
Very important (%)
5Don’t
know (%)
Providing wholesome food to the community 1.8 0.9 2.7 17.9 74.1 2.7 n=112
Promoting sustainable agriculture 2.6 1.8 6.1 25.4 62.3 1.8 n=114
Land stewardship/environmental concerns 4.5 5.5 6.4 23.6 58.2 1.8 n=110
Personal satisfaction 1.8 6.2 9.7 23.0 56.6 2.7 n=113
Generating a sense of community 0.9 5.3 13.3 22.1 56.6 1.8 n=113
Life style 6.3 5.4 13.4 27.7 42.9 4.5 n=112
Profit 6.3 15.3 22.5 31.5 23.4 0.9 n=112
Keeping farmland within the family 40.4 11.0 13.8 12.8 13.8 8.3 n=109
Despite their apparent altruism, CSA operators seemed keenly aware of obstacles to the success of their opera-tions. It is important to understand that in listing the obstacles, moderate impact was the main choice of respondents. By combining categories, we get a better idea of operators’ overall concerns.
Even though profit seemed to have a lower level of motivation for CSA operators, low profits rated a moderate to high impact by about 68 percent of the respondents (Table 3). This was a leading concern.
Several obstacles related to attracting and keeping cus-tomers were seen as having moderate to high impact, including marketing (66%), retaining subscribers (61%), competition with commercial/retail outlets (61%),
variety of products offered (59%), and competition with other CSA’s (57%).
Labor availability was another major concern, with almost two-thirds of the operators agreeing that find-ing workers had moderate to high impacts on their farms.
A majority of operators demonstrated concern about climate change, with 63 percent of the respondents listing moderate to high impacts as an obstacle.
Other obstacles of moderate to high impact included on-farm labor (54%) and transportation (43%). Nearly 79 percent of the operators did not see persuading subscribers to work on the farm as a major obstacle.

8 Illinois Institute for Rural Affairs Policy Brief
Table 3. Perceived Obstacles for CSA OperatorsPlease rate the level of impact for the following obstacles to your CSA’s success (1 = no impact and 5 = high impact)
No Impact (%)1
(%)2
Moderate Impact (%)3
(%)4
High Impact (%)5
(%)Don’t Know
Low profits 15.9 15.0 28.3 14.2 25.7 0.9Availability of labor 22.3 11.6 25.9 18.8 20.5 0.9Competition with commercial/retail outlets 23.0 13.3 27.4 15.9 17.7 2.7On-farm labor 26.2 14.0 21.5 15.9 16.8 5.6Climate change 21.3 13.0 26.9 17.6 16.7 4.6Marketing 12.8 20.2 34.9 17.4 13.8 0.9Transportation issues (e.g. delivery) 28.1 28.9 20.2 12.3 10.5 0.0Retaining subscribers 18.4 18.4 31.6 19.3 10.5 1.8Variety of products offered 28.6 9.8 33.0 16.1 9.8 2.7Competition with other CSAs 21.9 21.1 32.5 16.7 7.0 0.9Persuading subscribers to work on farm 75.0 3.6 8.0 4.5 2.7 6.3
CSA Income
Survey responses clearly shows that CSA operators, pri-marily women, were engaged in what is predominantly a low-profit enterprise that supplements family income.
Family Supplemental Income
More than 55 percent of the CSA operators reported net profits of less than $10,000 per year, and almost
three-fourths reported net profits of less than $20,000 (Figure 4). Most CSA farms clearly fit into the small-farms category in terms of net profits and acreage. A small percentage of respondents (about 8%) reported net profits of greater than $75,000.

Illinois Institute for Rural Affairs Policy Brief 9
Figure 4. Estimated Net Profit from CSA
0% 5% 10% 15% 20% 25% 30% 35% 40%
Less than $5,000
$5,001 to $10,000
$10,001 to $20,000
$20,001 to $30,000
$30,001 to $40,000
$40,001 to $50,000
$50,001 to $75,000
$75,001 to $100,000
$100,001 to $200,000
More than $200,000
What is your estimated net profit from the CSA this year?
% of farmers responding
More than 90 percent of the respondents reported that they had other employment besides farming. Even on large-scale traditional farms, it is not unusual for one or both spouses to report off-farm income. The smaller scale of CSA operations, with their lower revenue levels, makes off-farm income important.
Meanwhile, about 7 percent of the respondents said that their CSA operated at a loss. About 65 percent
of the CSA operators earned less than 50 percent of their household income from their farm. On the other hand, slightly more than a third of the farmers reported that the CSA provided more than half of their family’s income. Despite their relatively small size, a CSA can, under some circumstances, provide a significant portion of a family’s income (Figure 5).

10 Illinois Institute for Rural Affairs Policy Brief
Figure 5. Percentage of Family’s Income from Off-farm Employment
0% 5% 10% 15% 20% 25% 30% 35% 40% 45%
Less than 10%
10% to 25%
26% to 50%
51% to 75%
76% to 100%
What percentage of your family's income is from off-farm employment?
% of farmers responding
Summary and Discussion
Findings from the 2014 national survey of community supported agriculture were consistent with results from the 2002 and 2009 surveys.6 The data suggest many CSA operations successfully used their distinctive coop-eration-based farmer-consumer relationship model to deliver fresh foods to communities across America. With their widespread commitment to locally produced, healthy food, the organization of their operations and the operators’ motivations suggest they are special segment of small farms that are locally and regionally based and provide an alternative to the larger, global agricultural system.
Because of this special position in the larger system, CSA’s offer their operators the opportunity to do
6 Note: There was a lack of responses from minority opera-tors in the most recent survey, even though such opera-tions exist.
fulfilling work, but they also face some obstacles that appear to have definite impacts on their operations. It is possible that the motivations of these farmers form something of a buffer between their farms and the obstacles that affect their operations, but the data suggest there is clearly a realization of the economic realities they face in their communities and in the wider world.
The question for CSA operators is: “How big do I want my farm to get?” This is a matter of scalability. The survey data indicated that these farmers placed other motivators above profitability, yet they understood the need to be profitable. This is a difficult balance to maintain. The seemingly high loss of CSA operations from the sources on our sample list and from our efforts to invite operators to participate in the survey suggests many operators went out of business. It is reasonable to hypothesize that profitability played a role in many
Illinois Institute for Rural Affairs Policy Brief 11
individuals’ decisions to fold their operations, it would require additional study to verify that assumption.
About three-fourths of CSA operators reported net profits of less than $20,000. Even though profit seemed to have a lower level of motivation for respondents, low profits were rated as moderate to high impact con-cerns by about 68 percent of the respondents. This was a leading concern and likely a source of worry to the farmers.
For consumers, CSA price increases raise questions about food affordability and the value of the perceived quality of the product. With dietary concerns holding a major focus of food policy, the issue of healthy food takes on more importance. Again, a CSA, like other farm operations, is engaged in an effort to balance input costs with profitable production of healthy, marketable products.
Many CSA operators considered subscriber turnover as a negative factor in their success, so consumer pricing is a crucial issue in a local landscape with large-scale competition at the commercial/retail level. The respon-dents noted other obstacles related to attracting and keeping customers with moderate to high impact, including marketing, variety of products offered, and competition with other CSA operations.
The local nature of CSA operations present perplexing issues for policy makers. The obstacles that these farms face appear to be similar to those of any farm, but they occur in a specific local or small regional context that has a number of twists prevalent among these farmers:
• An idealistic or altruistic approach to conducting business;
• Self-reliance;
• The predominance of female operators;
• The supplementary nature of the income from most CSA operations;
• Relatively low levels of collaboration with other farmers in providing produce or goods from the outside;
• The moderate importance of direct sales to restaurants, stores, and institutions.
The first question from a policy perspective is whether CSA operators face problems that require federal policy intervention. If it is a goal of the federal government to have increased production of healthy, locally produced food, then federal policy prescriptions may be in order.
But, as already suggested, any federal policy prescrip-tions are complicated by the diversity of locally owned and operated CSA farms across the country — making a one-size-fits-all approach virtually impossible. Scale is a key issue, but any efforts to help CSA operations scale up would need to be approached in a measured
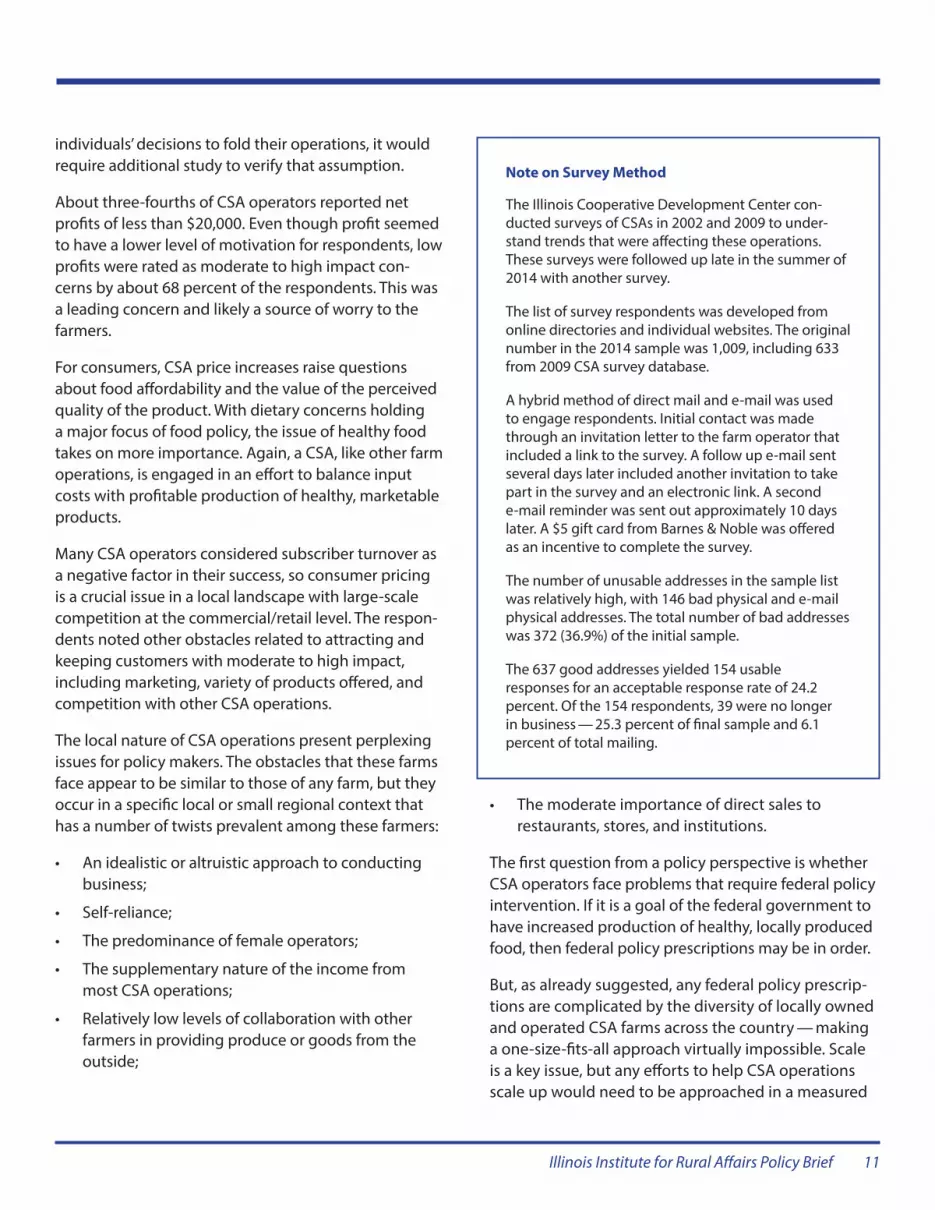
Note on Survey Method
The Illinois Cooperative Development Center con-ducted surveys of CSAs in 2002 and 2009 to under-stand trends that were affecting these operations. These surveys were followed up late in the summer of 2014 with another survey.
The list of survey respondents was developed from online directories and individual websites. The original number in the 2014 sample was 1,009, including 633 from 2009 CSA survey database.
A hybrid method of direct mail and e-mail was used to engage respondents. Initial contact was made through an invitation letter to the farm operator that included a link to the survey. A follow up e-mail sent several days later included another invitation to take part in the survey and an electronic link. A second e-mail reminder was sent out approximately 10 days later. A $5 gift card from Barnes & Noble was offered as an incentive to complete the survey.
The number of unusable addresses in the sample list was relatively high, with 146 bad physical and e-mail physical addresses. The total number of bad addresses was 372 (36.9%) of the initial sample.
The 637 good addresses yielded 154 usable responses for an acceptable response rate of 24.2 percent. Of the 154 respondents, 39 were no longer in business — 25.3 percent of final sample and 6.1 percent of total mailing.

Illinois Institute for Rural Affairs Policy Brief 12
way, to avoid damaging or even destroying the core features that make these farms a distinct segment of contemporary American agriculture. Smaller size is a hallmark of personalized, local CSA farms, and major increases in the scale of operations would certainly change their nature and possibly their ability to main-tain high levels of food quality.
In some ways, CSA operations mirror traditional farm-ing of the early twentieth century, especially with the self-reliance of operators and labor-intensive practices. The modern CSA is also a variant on the truck farms that once ringed American cities. The CSA organiza-tion that invites customers to share production risks is a new twist that strengthens connections between the grower and community members. The conundrum is today’s CSA operators, like their forebears of a century ago, are increasing in size and leaning toward increased mechanization. This is a response to market forces that demand bigger, more efficient operations to balance costs and prices, as well as challenges from within farming operations related to labor and quality of life. Competition and the economic realities of farming challenge altruistic operators.
If nothing else, policies need to be locally oriented with the goal of “letting CSA farms be CSA farms.” Policy efforts should be carefully crafted to avoid incentiv-izing scaling up simply for the sake of scaling up, and should instead focus on increasing the environmental, economic, and social sustainability of individual CSA farms — at whatever scale this represents for any given farm. This approach is accommodated by several pro-grams under the 2014 Farm Bill, including for which qual-ifying CSA farms may be eligible, including the Farmers Market and Local Food Promotion Program, Value-Added Producer Grant program, Rural Microentrepreneur Assistance Program, and national organic certification cost sharing.7 Direct support for CSA farmers could also be derived from conservation assistance and specialized
7 National Sustainable Agriculture Coalition. “2014 Farm Bill Drilldown: Local and Regional Food Systems, Healthy Food Access, and rural Development.” http://sustain-ableagriculture.net/blog/2014-farmbill-local-rd-organic/. Accessed February 2018.
crop insurance that reward sustainable farming practices and provide some protection from risk.
In addition to efforts on an individual farm basis, another option for farmers is the formation of multi-farmer CSAs. Often structured as cooperatives, these ventures allow farmers to increase the volume of production output delivered to a single CSA subscriber base without scaling up their individual operation, create the opportunity to distribute production risk over multiple farms, and if desired can facilitate labor or equipment sharing and joint purchase of marketing services. Efforts to form multi-farmer CSAs can in some cases by supported by the Farm Bill programs mentioned above, and they can benefit from technical assistance funded through the Rural Cooperative Development Grant program.
CSAs can also be substantially aided by policies that focus on wider rural development goals that strengthen local and regional marketing opportunities. In fact, the 2014 Farm Bill made major strides in this direc-tion, with assistance for local farmers’ markets and food production, a specialty crop block grant, rural microen-trepreneur assistance, senior farmers market nutrition program, food insecurity nutrition incentives, and com-munity food projects.8
CSA farms have evolved into a growing niche of American agriculture. They have the potential to con-tinue to fill a growing need for sustainable agriculture on what some would call a more human scale. Based on the attitudes of the farmers and their customers, allowing these farms to operate on a scale that prom-ises reasonable return for labor, and high quality locally produced foods for consumers, and emphasizes the triple bottom line9, is a central policy consideration not only for the federal government, but also for local and state governments.
8 National Sustainable Agriculture Coalition. “2014 Farm Bill Drilldown: Local and Regional Food Systems, Healthy Food Access, and Rural Development.” http://sustain-ableagriculture.net/blog/2014-farmbill-local-rd-organic/. Accessed February 2018.
9 People, Profits, and Planet
Recommended


