
Cross-Layer Design Gains in MANETs
Ammar Alhosainy and Thomas Kunz
Systems and Computer Engineering
Carleton University
Ottawa, Canada
{amammar, [email protected]}
Li Li and Philip J. Vigneron
CRC Canada
Ottawa, Canada
{li.li, [email protected]}
Abstract—In this paper we propose and implement cross-layer
network design models with three different MAC protocols:
CSMA-CA, CSMA-CA with RTS/CTS, and ALOHA. These
network models are used to study the behavior of Cross-Layer
Designs (CLDs) in case of dynamic network topologies with
different transmission ranges and network sizes. A similar
network model but with a conventional Oblivious Layered Design
(OLD) is also implemented to compare the performance of the
cross-layer models and to show the impact and potential benefit
of cross-layering. Our results show that the CLD gain is
comparable to the gain that results from selecting a better MAC
protocol. The results also show that CLD, unlike OLD, fully
utilizes the link capacities and its gain is proportional to the
average number of the session hops.
Index Terms— Multihop wireless network, cross-layer design,
network utility maximization, CSMA-CA, mobile ad-hoc
networks.
I. INTRODUCTION AND RELATED WORK
A Mobile Ad-hoc Network (MANET) is an infrastructure-
less network of dynamic nodes communicating via wireless
links in a multi-hop fashion. Efficiently using the network
resources of such networks is challenging. Communicating via
shared wireless links raises a contention problem (typically
addressed at the MAC layer). The absence of a fixed
infrastructure and centralized administration add a congestion
problem where flows or data sessions are typically routed
through the same central part of the network. Multi-hop
transmissions cause flows not only to interfere with each other,
but also with themselves. Finally, node mobility requires
adaptive solutions to handle the constant change of the network
topology and the node’s local contention neighborhood.
Cross-layer network design provides vertical coordination
between network layers. Cross-layering along with a
distributed horizontal coordination system between nodes
provides flexibility and efficiency to the network that
compensates for the absence of a centralized administration.
The key idea here is that rather than individual protocol layers
solving one or a subset of the stated problems, potentially
conflicting with the solution of other problems at other layers,
all layers jointly address these problems to derive a consistent,
optimal operation of the network.
Much work has been done on cross-layer design showing
its advantages over traditional layered designs, referred to as
Oblivious Layered Design or OLD in the following, in
enhancing TCP over wireless networks [12, 13], congestion
control [16], power control [15], or adapting different layer
parameters for a specific application [11]. Most of the
approaches interchange signals and information between
network layers, not considering the impact of cross-layering on
network modularity [14] and the fact that it violates the concept
of designing protocols in isolation. Furthermore, these papers
typically show the advantage of CLD vs. OLD for very specific
simulated scenarios. In this paper, we therefore focus on CLD
approaches that can allow decisions to be made separately at
different layers. Furthermore, as CLD requires the exchange of
information among nodes to jointly optimize their behavior,
CLD approaches incur costs. In the long run, we are interested
in quantifying both costs and benefits of a suitable CLD
approach, and in this paper start by providing a more rigorous
evaluation of the benefits of such an approach in MANETs.
Distributed cross-layer optimization algorithms are
proposed in [1]-[3] to find the optimum values of different
parameters at the MAC and the Transport layers that jointly
solve the contention and congestion control problem in the
wireless network. The Network Utility Maximization (NUM)
framework [5, 6] was employed to maximize the network
utilities and achieve different types of fairness among the users.
This work was extended in [7, 8] to include the network layer
parameters in the optimization process. In this paper, we are
exploring whether cross-layering with distributed coordination
among MANET nodes is indeed advantageous in solving the
contention and congestion control problems as compared to an
OLD, and, if so, how much performance gains to expect under
what conditions.
Lee et al. [4] developed a distributed optimization
algorithm that can find the optimum link rates along with the
optimum medium access attempt probabilities of an ALOHA
MAC layer in mobile ad-hoc wireless networks meeting
specific fairness criteria through a utility function. The
algorithm is distributed: every node is communicating with at
most its two-hop neighbors to exchange topology information
and parameters. The algorithm showed robustness and stability
against a high rate of packet loss and inaccurate topology
information when compared to other similar algorithms [1].
The algorithm in [4] can withstand high rates of update
message loss due to the fact that it only needs to exchange price
values that represent the weights of the link rates. The authors
translated all parameter values that need to be exchanged
between network nodes into link rate prices that can be used in
the optimization process vertically between layers and
horizontally between nodes. Yu et al. [3] extended the
algorithm in [4] to include the transport layer in the
optimization process. They divided the link prices into smaller

values to separately represent each session in each link so that
the algorithm can optimize the end-to-end session rates instead
of the link rates based on a specific fairness criterion. Yet, this
algorithm has neither been tested with any other MAC
protocols nor evaluated against a comparable oblivious layer
design to explore the potential CLD benefit.
The medium access attempt probability used in the
ALOHA protocol represents the transmission opportunity
given to the node. This transmission opportunity is determined
by the algorithm based on the need for each link to offer
enough capacity to carry, at a minimum, all sessions passing
through it. This transmission opportunity can be controlled in
the IEEE 802.11 MAC protocol by tuning the contention
window [9] to achieve node fairness, but in the optimization
process it will be used to optimize end-to-end session rates
subject to specific fairness criteria.
In this paper we implemented the CLD employing the
ALOHA MAC protocol as discussed in [3]. We also designed
and implemented alternative MAC protocols within this
framework, CSMA-CA with RTS/CTS and basic access
mechanisms. The CSMA-CA protocols with the two different
access mechanisms are implemented using Bianchi’s models
[10]. Finally, we implemented a simulation that models a
traditional OLD employing the same protocols at the MAC,
network, and transport layers. Using extensive simulations, we
then study the network performance varying transmission range
and network size. The results show that for all MAC protocols,
CLD provides up to twice the network capacity provided by the
equivalent OLD approach. The performance gain is particularly
pronounced in scenarios where flows/data sessions extend over
multiple hops.
The rest of the paper is organized as follows. The cross-
layer and oblivious layer network models with a CSMA-CA
MAC protocol are discussed in Section II. Section III presents
a detailed example with numerical results as well as a
discussion about the performance gain of CLD vs. different
network parameters. The paper finishes with our conclusions
and future work in Section IV.
II. NETWORK MODEL
As our interest is concentrated on comparing CLD and
OLD, the absolute performance results are of less importance.
We developed an abstract model that can calculate optimistic
time-independent utilities for both designs. This means that the
topology and the feedback information are known
instantaneously and also that the algorithm converges to the
optimum immediately. Consequently we ignore the costs of
informing neighbors via the exchange of control messages, the
impact of inaccurate knowledge, and the delay in acquiring
information about the local neighborhood via periodic HELLO
messages, for example. This optimistic model helps in finding
the upper boundary of the network gain and reveals the actual
power of the CLD.
A. Cross-layer network model with CSMA-CA MAC protocol
Consider a single channel wireless network modeled as
unidirected graph with number of nodes and
logical links, each link has a fixed physical capacity of
bps, and sources, each transmitting at a source rate of bps.
Each source emits one flow, using a fixed set of links in
its path, and has a utility function . Each link can be
shared by a set of sources.
We start from the NUM,
∑ (1)
∑
where is the link capacity.
With the CSMA-CA MAC protocol, the link capacities will
be derived from Bianchi’s model [10]. This model will provide
us with the saturation throughput as a function of different
parameters as follows,
where:
Probability that there is at least one transmission in
the considered time slot.
Probability of successful transmission.
Average message payload.
The average time the channel is sensed busy due to
a successful transmission.
The average time the channel is sensed busy during
a collision.
Slot time size.
The saturation throughput as a function of the number of
contending nodes represents the percentage of the useful
transmission opportunities given to the nodes. In saturation
condition, each node always has a packet available for
transmission, so changing the nodes’ fairness via contention
window tuning [9] will not affect the resultant aggregate
throughput. Given the transmission opportunity of each node
that is derived from the optimization algorithm we can
calculate the link capacity using the following equation:
where is the physical capacity of the link, is the
transmission opportunity of the outgoing link , and is
the percentage of useful transmission opportunity given to the
transmitter .
The utility maximization problem will be divided into three
sub-problems connected to each other by the Lagrange
parameter (the prices). Two subproblems, addressing the
transport layer to optimize the total sessions rate and the link
utility fraction of each session, respectively, will be derived by
following the same steps as in [3],
∑

where is the fraction of the rate on link that is contributed
by source session , ∑ is the
projection operator for , is the Lagrange parameter for
sessions on link , ∑ , and is the set of
links that uses.
The third maximization sub-problem addresses the MAC
layer. It will be derived using the price analogy. Assume that
∑ is the link price and ∑ is the
total price of the outgoing links from node , the node
transmission opportunity will be as the following,
∑
where is the set of nodes in the same contention area
with node . The link transmission opportunity will be given
by,
∑
The interpretation of formula (7) is simple, the price is the
network benefit, and the denominator represents the sum of the
network benefit if all the nodes in the same contention area
transmit at the same time. However, as this cannot happen in a
wireless network, the network gives more chance (i.e. higher
transmission opportunity) to the node that can pay more (i.e.
with higher price ). This interpretation applies to formula (8)
too. The optimization process in each node can be divided into
different functions as shown in Fig. 1.
B. Oblivious layered network model
The only difference in our OLD design compared with the
above cross-layered model is the absence of any prices being
exchanged between the network layers. Each layer makes its
own decisions based on the local information seen by the layer.
The transmission opportunity for the nodes will be equally
divided over the number of active nodes in the same contention
area. We assume that the transport layer at the session source
gets an instantaneous feedback about the minimum link
capacity in the session paths and can adjust the session rate
accordingly.
III. SIMULATIONS AND NUMERICAL RESULTS
We designed and implemented a simulator using Matlab.
During the simulation, we assume that the topology
information is well known all the time. The random waypoint
mobility model is used in the dynamic topology test. After the
topology changes, sessions may be rerouted or dropped. The
routing problem is not the focus of this paper; the rerouting
events are done instantly based on a shortest hop routing
protocol. The maximum physical capacity is 1. The
utility function that will be used is the log function that
achieves proportional fairness among the network sessions. In
comparisons we use the sum of the utilities values as our
performance metric, a higher sum reflects maximized rates
combined with proportional fairness among different sources.
Fig. 1. CLD Flowchart per Node
A. The CSMA-CA model
The values of the parameters used to obtain the numerical
result with the CSMA-CA Bianchi model [10] are summarized
in Table 1.
TABLE 1. CSMA-CA MODEL PARAMETERS
Average message payload 8184 bits
Tc (RTS/CTS) 417 bits
Ts (RTS/CTS) 9569 bits
Tc (basic) 8713 bits
Ts (basic) 8982 bits
50 μs
Bit rate 1 Mbit/s
Figure 2 shows the throughput values as a function of the
number of stations for the two access mechanisms, assuming a
physical link capacity of 1.
B. Detailed Example
For the wireless network shown in Fig. 3, four sessions are
generated according to the paths indicated in Table 2. Using
both CLD and OLD models, the link capacities along with their
utilized percentages for the three MAC protocols are presented
in Table 3. The results show that the network operation derived
by CLD for any of the three MAC protocols efficiently assigns
No
Yes
Calculate Outgoing Link prices
Outgoing session prices
Calculate Node access opportunity
Calculate outgoing Link access
opportunity
Calculate the fraction
of each session on each
link
Calculate
session
rates
New prices for the outgoing sessions
Prices converged
Start
End
Calculate
outgoing links
capacity
2 hop
neighbors
All nodes in the
session’s path
2 hop
neighbors
Transport layer
MAC layer

transmission opportunities to the links so that the resulting
capacities are fully utilized by the sessions. In contrast, in the
OLD, inefficient transmission opportunity assignments lead to
link utilizations of 57% on average, only the bottleneck links
are fully utilized. So even though the sum of link capacities is
higher, the network utilization is lower as the flows end up with
very different rates, which the objective function (aiming for
fair sharing) penalizes. Table 4 shows the session rates and the
aggregate log rates of the four sessions, which are the objective
function value. For each MAC protocol, the solution derived
via the cross-layered design has higher aggregate session rate
and aggregate utility, indicating that the solution is indeed
better (i.e., results in higher user utility).
Fig. 2. CSMA-CA Throughput vs. Number of Nodes.
Fig. 3. Wireless Network.
TABLE 2. SESSION PATHS
Session Path
S0 B, C, D, F, I
S1 B, C, E, F, I
S2 A, C, D, G, H
S3 G, D, C, A
C. Varying Network Parameters
The benefit of a cross-layered design is further explored in
this section varying a number of network parameters and when
nodes move according to the random waypoint mobility model.
Note that, given the above stated assumptions, mobility does
not directly impact the results, as we assume that any topology
changes are immediately reflected in CLD and OLD
optimizations. However, having nodes move around allows us
to generate many different scenarios from the same initial
configuration and paves the way for future work discussed
later. In a simulation of 100s, we take a network snapshot every
0.2s, resulting in 500 topologies, allowing us to derive
statistically meaningful results. Table 5 lists the default
simulation parameter values.
TABLE 3. THE LINK CAPACITIES WITH UTILIZATIONS FOR THE THREE MODELS, CROSS-LAYER AND OBLIVIOUS LAYER DESIGNS
CSMA-CA protocol with RTS/CTS mechanism
Link Cross-layer design Oblivious layer design
Capacity Utilization (%) Capacity Utilization (%)
C-A 0.0687 100 0.0299 100
A-C 0.0609 100 0.1668 18
B-C 0.1217 100 0.1668 36
D-C 0.0687 100 0.0398 75
C-D 0.1212 100 0.0597 100
G-D 0.0687 100 0.1040 29
C-E 0.0614 100 0.0299 100
D-F 0.0604 100 0.0398 75
E-F 0.0614 100 0.1392 21
D-G 0.0609 100 0.0398 75
G-H 0.0609 100 0.1040 29
F-I 0.1217 100 0.1668 36
Total 0.9366 100% 1.0865 57.82%
CSMA-CA protocol with basic mechanism
C-A 0.0655 100 0.0281 100
A-C 0.0581 100 0.1620 17
B-C 0.1161 100 0.1620 35
D-C 0.0655 100 0.0374 75
C-D 0.1156 100 0.0562 100
G-D 0.0655 100 0.1029 27
C-E 0.0586 100 0.0281 100
D-F 0.0575 100 0.0374 75
E-F 0.0586 100 0.1330 21
D-G 0.0581 100 0.0374 75
G-H 0.0581 100 0.1029 27
F-I 0.1161 100 0.1620 35
Total 0.8933 100% 1.0494 57.32%
ALOHA protocol
C-A 0.0537 100 0.0286 76
A-C 0.0520 100 0.0980 19
B-C 0.1137 100 0.0980 43
D-C 0.0537 100 0.0218 100
C-D 0.1067 100 0.0367 100
G-D 0.0537 100 0.0735 30
C-E 0.0590 100 0.0238 100
D-F 0.0547 100 0.0317 58
E-F 0.0590 100 0.1143 21
D-G 0.0520 100 0.0357 52
G-H 0.0520 100 0.1000 18
F-I 0.1137 100 0.2000 21
Total 0.8239 100% 0.8621 53.14%
Figure 4 shows the impact of increasing the number of
nodes as well as the number of sessions on the aggregate
network utility in a fixed area size. The number of sessions
equals half the number of nodes. For all MAC protocols, the
network utility of the CLD solution exceeds the corresponding
network utility of the OLD solution, with the gap widening as
the network contains more nodes and sessions. Consistent with
the results in Fig. 2, the CSMA-CA protocol with RTS/CTS
provides higher network utility than the basic CSMA-CA
0 10 20 30 40 50 600.55
0.6
0.65
0.7
0.75
0.8
0.85
0.9
Number of nodes in the contention area
Th
rou
gh
pu
t
RTS/CTS
Basic
G
F
E
D
A
C
B
I
H

approach as the number of nodes (and therefore the network
density and the size of a node’s neighborhood) increases.
TABLE 4. SESSION RATES AND AGGREGATE LOG RATES
S0 S1 S2 S3 AGGREGATE
LOG RATES
CSMA-CA RTS/CTS
CLD 0.0604 0.0614 0.0609 0.0687 -11.0746
OLC 0.0299 0.0299 0.0299 0.0299 -14.0444
CSMA-CA BASIC
CLD 0.0575 0.0586 0.0581 0.0655 -11.2637
OLC 0.0281 0.0281 0.0281 0.0281 -14.2900
ALOHA CLD 0.0547 0.0590 0.0520 0.0537 -11.6161
OLD 0.0184 0.0238 0.0184 0.0218 -15.5593
TABLE 5. DEFAULT SIMULATION PARAMETERS VALUES
Simulation period 100 s
Area 200 x 200 m2
Transmission range 100 m
Node speed 4 m/s
Number of nodes 20
Number of sessions 10
Node density 0.0005 node/m2
Session density 0.5 session/node
Table 6 shows the 95% confidence interval of the aggregate
utilities for 500 snapshots of a dynamic network topology with
70 nodes and 35 sessions. We can see that all the performance
differences between CLD and OLD, as well as the different
MAC protocols, are statistically significant at the 95%
confidence level.
Fig. 4. Average Network Utility vs. Number of Nodes
TABLE 6. THE 95% CONFIDENCE INTERVAL
CSMA-CA RTS/CTS CSMA-CA Basic ALOHA
CLD [-144.27, -144.64] [-153.25, -153.66] [-153.75, -154.16]
OLD [-159.24, -160.10] [-168.27, -169.13] [-171.24, -172.07]
Figure 5 shows the average network utility vs. the
transmissions range of the nodes. The figure also shows the
average number of per-session hops and the percentage of
average number of active sessions which have a complete valid
path. We can see that varying the transmission range parameter
reveals the two factors affecting the network utility: the number
of active sessions and the average number of per-session hops.
As indicated in Table 5, the network area square length is
200m. The deployed 20 nodes are scattered in the entire area,
which leads to disconnected nodes and a very low number of
active sessions in case of a short transmission range, as shown
in Fig. 5. Increasing the transmission range tends to increase
the number of active sessions in the network.
Fig. 5. Average Network Utility vs. Node Transmission Range
Once the network is connected, further increases in the
transmission range primarily cause the lengths of any path to
decrease, until, in the limiting case, the network is fully
connected and therefore the length of each path is one hop. The
network utility steeply decreases with the increase in the
number of active sessions (as it sums up the utility, a negative
value, for all active flows), then when all sessions are active,
the trend in network utility achievable with CLD respectively
OLD changes. At that point, the CLD session rates and utilities
keep decreasing with a very small slope affected by the number
of active sessions. But the OLD session rates and therefore the
network utility start to increase due to the decreasing average
number of per-session hops (reducing self-interference of
flows). This increase stops as soon as the number of per-
20 25 30 35 40 45 50 55 60 65 70-180
-160
-140
-120
-100
-80
-60
-40
-20
Number of nodes
Ave
rag
e n
etw
ork
utility
CLD with ALOHA
OLD with ALOHA
CLD with CSMA-CA basic
OLD with CSMA-CA basic
CLD with CSMA-CA RTS/CTS
OLD with CSMA-CA RTS/CTS
0
25
50
75
100
20 40 60 80 100 120 140 160 180 200 220 240 260 2801
1.5
2
2.5
3
Transmission Range (m)
-35
-30
-25
-20
-15
-10
-5
0
Ave
rag
e n
etw
ork
utility
CLD with ALOHA
OLD with ALOHA
CLD with CSMA-CA basic
OLD with CSMA-CA basic
CLD with CSMA-CA RTS/CTS
OLD with CSMA-CA RTS/CTS
Average number of per-session hops
Average active sessions (%)
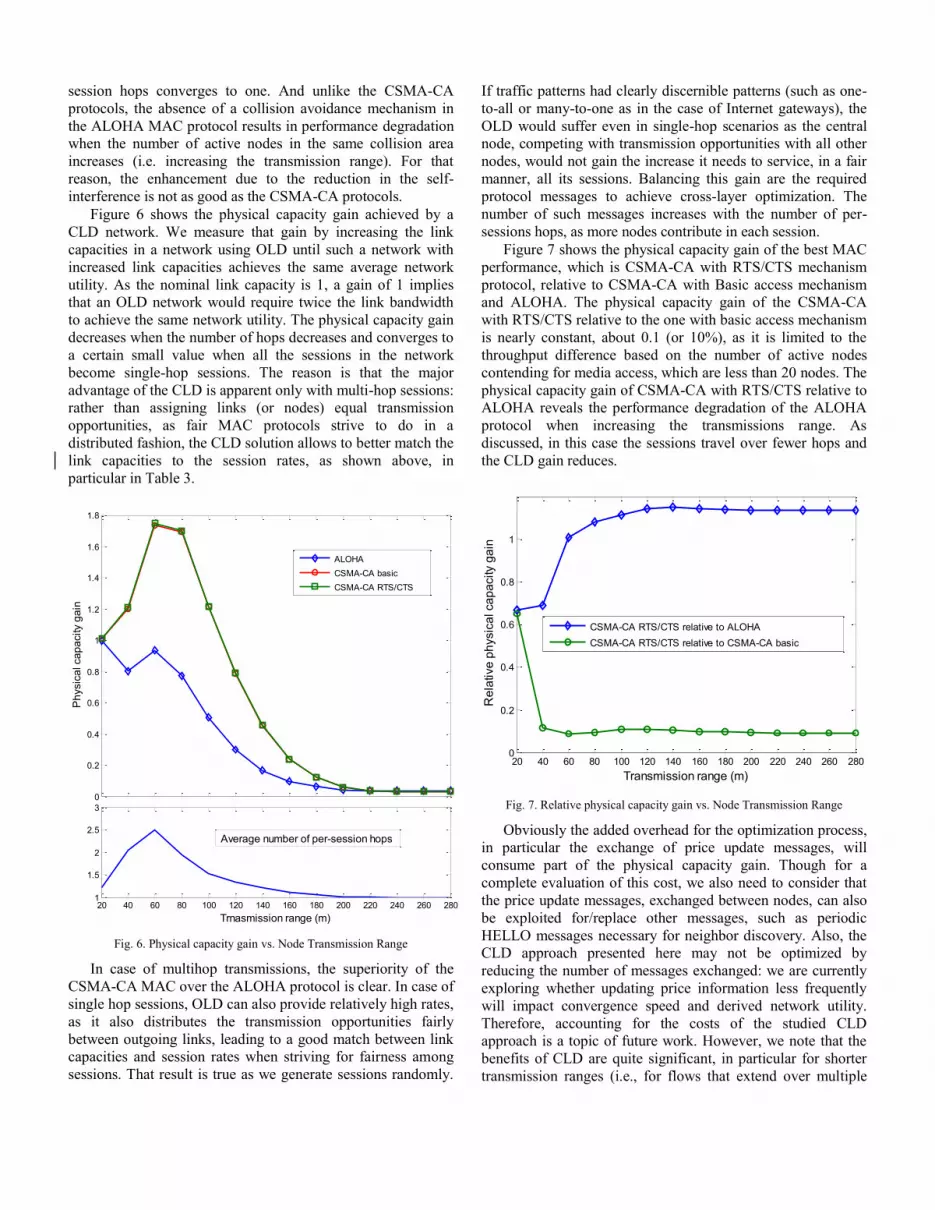
session hops converges to one. And unlike the CSMA-CA
protocols, the absence of a collision avoidance mechanism in
the ALOHA MAC protocol results in performance degradation
when the number of active nodes in the same collision area
increases (i.e. increasing the transmission range). For that
reason, the enhancement due to the reduction in the self-
interference is not as good as the CSMA-CA protocols.
Figure 6 shows the physical capacity gain achieved by a
CLD network. We measure that gain by increasing the link
capacities in a network using OLD until such a network with
increased link capacities achieves the same average network
utility. As the nominal link capacity is 1, a gain of 1 implies
that an OLD network would require twice the link bandwidth
to achieve the same network utility. The physical capacity gain
decreases when the number of hops decreases and converges to
a certain small value when all the sessions in the network
become single-hop sessions. The reason is that the major
advantage of the CLD is apparent only with multi-hop sessions:
rather than assigning links (or nodes) equal transmission
opportunities, as fair MAC protocols strive to do in a
distributed fashion, the CLD solution allows to better match the
link capacities to the session rates, as shown above, in
particular in Table 3.
Fig. 6. Physical capacity gain vs. Node Transmission Range
In case of multihop transmissions, the superiority of the
CSMA-CA MAC over the ALOHA protocol is clear. In case of
single hop sessions, OLD can also provide relatively high rates,
as it also distributes the transmission opportunities fairly
between outgoing links, leading to a good match between link
capacities and session rates when striving for fairness among
sessions. That result is true as we generate sessions randomly.
If traffic patterns had clearly discernible patterns (such as one-
to-all or many-to-one as in the case of Internet gateways), the
OLD would suffer even in single-hop scenarios as the central
node, competing with transmission opportunities with all other
nodes, would not gain the increase it needs to service, in a fair
manner, all its sessions. Balancing this gain are the required
protocol messages to achieve cross-layer optimization. The
number of such messages increases with the number of per-
sessions hops, as more nodes contribute in each session.
Figure 7 shows the physical capacity gain of the best MAC
performance, which is CSMA-CA with RTS/CTS mechanism
protocol, relative to CSMA-CA with Basic access mechanism
and ALOHA. The physical capacity gain of the CSMA-CA
with RTS/CTS relative to the one with basic access mechanism
is nearly constant, about 0.1 (or 10%), as it is limited to the
throughput difference based on the number of active nodes
contending for media access, which are less than 20 nodes. The
physical capacity gain of CSMA-CA with RTS/CTS relative to
ALOHA reveals the performance degradation of the ALOHA
protocol when increasing the transmissions range. As
discussed, in this case the sessions travel over fewer hops and
the CLD gain reduces.
Fig. 7. Relative physical capacity gain vs. Node Transmission Range
Obviously the added overhead for the optimization process,
in particular the exchange of price update messages, will
consume part of the physical capacity gain. Though for a
complete evaluation of this cost, we also need to consider that
the price update messages, exchanged between nodes, can also
be exploited for/replace other messages, such as periodic
HELLO messages necessary for neighbor discovery. Also, the
CLD approach presented here may not be optimized by
reducing the number of messages exchanged: we are currently
exploring whether updating price information less frequently
will impact convergence speed and derived network utility.
Therefore, accounting for the costs of the studied CLD
approach is a topic of future work. However, we note that the
benefits of CLD are quite significant, in particular for shorter
transmission ranges (i.e., for flows that extend over multiple
20 40 60 80 100 120 140 160 180 200 220 240 260 2801
1.5
2
2.5
3
Trnasmission range (m)
0
0.2
0.4
0.6
0.8
1
1.2
1.4
1.6
1.8
Ph
ysic
al ca
pa
city g
ain
ALOHA
CSMA-CA basic
CSMA-CA RTS/CTS
Average number of per-session hops
20 40 60 80 100 120 140 160 180 200 220 240 260 2800
0.2
0.4
0.6
0.8
1
Transmission range (m)
Re
lative
ph
ysic
al ca
pa
city g
ain
CSMA-CA RTS/CTS relative to ALOHA
CSMA-CA RTS/CTS relative to CSMA-CA basic

hops). Whether CLD will outperform OLD for shorter flows,
once all the costs are accounted for as well, is more
questionable.
IV. CONCLUSIONS AND FUTURE WORK
We propose and implement network utility maximization
models that optimize the medium access probabilities at the
MAC layer jointly with the end-to-end source rates at the
transport layer with three different MAC protocols: ALOHA,
basic CSMA-CA, and CSMA-CA with RTS/CTS. We then
evaluated the performance benefit of CLD as compared to
OLD under different network scenarios. The results indicate
the superiority of the CLD in dealing with multi-hop network
transmissions in the way of medium access opportunity
assignments and link capacity utilization, with consistent gains
for all three MAC protocols studied. The CLD physical
capacity gain is roughly proportional to the average number of
session hops. In case of single hop transmissions, the CLD gain
reaches its lowest value, assuming a random traffic pattern. The
results also explore the relative importance of different MAC
protocols and their performance gain with CLD. Overall, the
results show that the gains a CLD scheme can achieve are
comparable to the gains that result from the choice of a better
MAC protocol. Comparing Figures 6 and 7, CLD has the
highest impact when sessions travel over relatively longer
paths, selecting a good MAC protocol results in the biggest
gains when session paths are short.
In future work, we will include the network layer
parameters in the optimization algorithm and more
systematically explore the impact of specific traffic patterns, as
exist for example in the presence of Internet gateways. We will
also explore the CLD performance gain with more realistic
time-dependent network models to reflect the effect of mobility
and the impact of inaccurate topology information. We will
further quantify the added overhead associated with this gain as
a function of the average number of per-sessions hops. A fair
evaluation of the network gain vs. added overhead would
necessitate a more complete study of the costs as well as the
benefits from exchanging price update messages (reduction in
neighborhood discovery overhead, for example). Finally,
TDMA-based MAC models will also be explored.
REFERENCES
[1] X. Wang and K. Kar, “Cross-layer rate optimization for
proportional fairness in multihop wireless networks with random
access,” IEEE J. Sel. Areas Commun., vol. 24, no. 8, pp. 1548–
1559, Aug. 2006.
[2] J. W. Lee, M. Chiang, and R. A. Calderbank, “Jointly optimal
congestion and contention control in wireless ad hoc networks,”
IEEE Commun. letters, vol. 10, no. 3, Mar. 2006.
[3] Y. Yu and G. B. Giannakis, “Cross-layer congestion and
contention control for wireless ad hoc networks,” IEEE
Trans.Wireless Commun., vol. 7, no. 1, pp. 37–42, Jan. 2008.
[4] J.-W. Lee, M. Chiang, and A. R. Calderbank, “Utility-optimal
random-access control,” IEEE Trans. Wireless Commun., vol. 6,
no. 7, pp. 2741–2751, Jul. 2007.
[5] F. P. Kelly, A. K. Maulloo, and D. K. H. Tan, “Rate control in
communication networks: shadow prices, proportional fairness
and stability,” J. Optical Research Society, vol. 49, pp. 237–252,
Mar. 1998.
[6] D. Feijer and F. Paganini "Krasovskii's method in the stability of
network control", American Control Conference (ACC '09), St.
Louis, Missouri, USA, pp. 3292 – 3297, 2009.
[7] M. Mardani, S.-Jun Kim, and G. B. Giannakis “Cross-layer
design of wireless multihop random access networks,” IEEE
Trans. Signal Processing, vol. 60, no. 5, May 2012.
[8] S. Supittayapornpong and P. Saengudomlert, “Joint flow control,
routing and medium access control in random access multi-hop
wireless networks,” IEEE Int. Conference Commun. (ICC),
Dresden, Germany, pp. 1–6, Jun. 2009.
[9] Z. Li, S. Nandi, and A. K. Gupta, “Achieving MAC fairness in
wireless ad-hoc networks using adaptive transmission control,”
in Proc. of the Ninth International Symposium on Computers
and Commun., vol. 2, 2004.
[10] G. Bianchi “Performance Analysis of the IEEE 802.11
Distributed Coordination Function,” IEEE J. Sel. Areas
Commun., vol. 18, no. 3, March 2000.
[11] E. Setton, T. Yoo, X. Zhu, A. Goldsmith, and B. Girod, “Cross-
layer design of ad hoc networks for real-time video streaming,”
IEEE Wireless Commun. pp. 59–65, Aug. 2005.
[12] S.S. Priya and K. Murugan, “Cross layer approach to enhance
TCP performance over wireless networks,” Students'
Technology Symposium (TechSym), 2010 IEEE, Kharagpur,
pp.171-176, April 2010.
[13] E. C. Park, D. Y. Kim, H. Kim, and C. H. Choi, “A cross-layer
approach for per-station fairness in TCP over WLANs,” IEEE
Trans. Mobile Computing, vol. 7, no. 7, pp 397-413, 2008.
[14] V. Kawadia and P. Kumar, “A Cautionary perspective on cross
layer design,” IEEE Wireless Commun. Mag., vol. 12, no. 1,
pp. 3–11, Feb. 2005.
[15] Weilan Huang and K. B Letaief, "Cross-layer scheduling and
power control combined with adaptive modulation for wireless
ad hoc networks" in Proc. Global Telecommunications
Conference (GLOBECOM'2005), St. Louis, MO, Dec. 2005.
[16] X. Wang and D. Perkins, “Cross-layer hop-by-hop congestion
control in mobile ad hoc networks,” IEEE Wireless Commun.
Conference (WCNC), LA, Apr. 2008.
Recommended


