Crystallization of tetragonal (Bs) and cubic modifications of zeolite NaP from
freshly prepared gel. Part 1. Mechanism of the crystallization
Andrea Katovi~, Boris Suboti~, Ivan Smit and Ljerka A. Despotovi~ "Ruder Bo~kovi~ Institute, P.O. Box 1016, 41001 Zagreb, Croatia, Yugoslavia (Received 25 April 1988; accepted 13 June 1988)
Simultaneous crystallization of tetragonal (Bs) and cubic (B1) modifications of zeolite NaP from freshly prepared aluminosilicate gel as well as the transformation of tetragonal into cubic modification were studied using various experimental techniques (XRD, SEM, EDX, chemical analysis of the solid and the liquid phase). Analysis of our results has shown that crystallization of the tetragonal form of zeolite P takes place by linear, size-independent growth of the increased number of nuclei, released from gel dissolved, during the autocatalytic stage of the crystallization process. The appearance of the cubic form of zeolite P coincides with the increase in the Si/AI molar ratio of the liquid phase and with the decrease in the crystallization rate of the tetragonal modification. The cubic modification crystallizes by the same mechanism as the tetragonal one until all the gel has been dissolved. At extended reaction time, primarily formed tetragonal zeolite P completely transforms into the cubic form by solution- mediated processes.
Keywords: Zeolite P; nucleation; crystal growth; crystallization; transformation
I N T R O D U C T I O N
The crystallization fields of many types of zeolites overlap, so that two or more different types of zeolites can co-crystallize under given conditions, l-Is Such possibilities may present a serious disadvantage in the attempt to obtain the desired type of zeolite in a pure form. Therefore, it is of major importance to know the conditions under which a given zeolite crystallizes and transforms into other types in order to determine the crystallization conditions for the synthesis of zeolites in pure form. The types of zeolites that can crystallize simultaneously or consecutively are deter- mined by the chemical composition of the crystalliz- ing system, 1-16 while the order of appearance and yields of different types of zeolites in the reaction mixture depend on the relative thermodynamic stabilities of the co-crystallized zeolites, i0.17-19 Gener- ally, in accordance with Ostwald's law of successive transformation 2° and with the simplexity principle of Goldsmith, 17 the first type of zeolite to be formed tends to be least stable thermodynamically and is replaced by more and more stable forms. It is well known that zeolites of the type NaP co-crystallize with
3 7 1 2 1 4 21 faujasites (zeolites X and Y) . . . . and also that 2 4 1 1 2 4 9 1 4 1 6 phi l l ips i te ' ' and hydroxysodalite . . . . can be
found as byproducts or even as the main products in admixture with faujasites. The typical reaction sequ- ence, under the appropriate synthesis conditions,
is 12'19 amorphous aluminosilicate gel ~ faujasite zeolite NaP, but the reaction sequence zeolite Y hydroxysodalite ~ zeolite NaP has also been de- scribed in the literature.14 Since A 1 . . . A1 interaction energy of faujasite is considerably higher than A 1 . . . AI interaction energy of zeolite P (Ref. 12), faujasite is the unstable phase r2Ag'22 relative to zeolite P, and in accordance with Ostwald's law and Goldsmith's prin- ciple, the transformation of amorphous gel into faujasite and the transformation of faujasite into zeolite P are spontaneous processes. The transforma- tions: amorphous gel ~ faujasite ~ phillipsite 4 and zeolite Y ~ hydroxysodalite ~ zeolite NaPc (Ref. 14) can be explained in a similar way. However, in some cases, zeolite P appears as the first crystalline phase 3'23'24 when freshly prepared gel has been heated at the appropriate temperature; in these cases, faujasite can be crystallized either by adding the seed crystals into the freshly prepared gel 16'24-'25 or by aging the gel at ambient temperature prior to the crystallization at the appropriate temperature. 16.26.27 Our preliminary study of the crystallization of zeolites from freshly prepared aluminosilicate gels have shown that the tetragonal form of zeolite P (desig- nated as zeolite Bs)2Z-appears as the first crystalline phase and transforms completely into the cubic form of zeolite P (designated as BI or NAP1) at extended reaction time. If the same gel has been aged at ambient temperature for 1 day or more, zeolite X
(~ 1989 Butterworth Publishers ZEOLITES, 1989, Vol 9, January 45
Crystallization of zeolite NaP: Part 1: A. Katovi6 et al.
appears as the first crystalline phase and transforms into cubic zeolite P. The direct transformation of freshly" prepared gels into zeolite P and/or other stable forms (hydroxysodalite, phillipsite), without previous crystallization of faujasite, cannot be ex- plained solely by the differences in the thermodyna- mic stability. Other factors such as activation energies of nucleation and growth, the mechanisms of nuclea- tion and growth, and the "structure" of gel and the liquid phase at given conditions should be taken into consideration.
The aim of this work is to investigate the mechan- isms of the crystallization of tetragonal and cubic zeolite P from freshly prepared aluminosilicate gel in order to account for such types of crystallization/ transformation.
EXPERIMENTAL
Preparation of gel An aqueous aluminosilicate gel having a molar
composition 4.24 Na20.AI203.3.56 SIO2.230.6 H20 was prepared by adding 150 ml of silicate solution into a plastic vessel containing an equivalent volume of sodium aluminate solution. Silicate solution ( 1.715 mol dm -a SiO2 and 0.65 mol dm -3 Na20) was prepared by the dilution of technical water-glass and by the addition of a needed amount of NaOH into the solution. Sodium aluminate solution was prepared by dissolving AI(OH)a-6 H20 in a hot NaOH solution. After all AI(OH)a-6 H20 has been dissolved, the volume was adjusted so that the solution contained 0.482 mol dm -~ AI2Oa and 1.39 mol dm -~ Na20. The silicate solution was added slowly to the sodium aluminate solution in a 1000 ml plastic vessel with vigorous stirring by a propeller stirrer. After the addition of the silicate solution, the precipitated gel was additionally stirred for 15 min prior to the crystallization.
Crystallization procedure The gel prepared as described above was poured
into a stainless-steel reaction vessel and then heated at crystallization temperature (80°C). The reaction ves- sel was provided with a thermostatedjacket and fitted with a water-cooled reflux condenser and a thermo- meter. The reaction mixture was stirred with a Teflon-coated magnetic bar driven by a magnetic stirrer. At various times, to, after the beginning of the crystallization process, aliquots of the reaction mix- ture were drawn off to prepare samples for analyses. The moment the gel was added into the preheated reaction vessel was taken as the zero time of the crystallization process.
Preparation of samples for analyses The aliquots of the reaction mixture drawn off at
given crystallization times, to, were poured into two previously weighed cuvettes and centrifuged to sepa- rate the solid from the liquid phase and to stop the crystallization process. The clear liquid phase above
the sediment was used for the analysis of silicon, aluminum, and sodium concentrations in the liquid phase. The parts of the liquid phase used for chemical analysis were stabilized by concentrated orthophosphoric acid (1 vol%) and diluted (50 times) prior to the analysis. After the removal of the clear liquid phase above the sediment, the solid phase was redispersed in doubly distilled water and the suspen- sion obtained centrifuged repeatedly. The procedure was repeated until the pH value of the clear liquid phase above the sediment was about 8. The wet solid phase (sediment) from the first cuvette was dried at 105°C for 24 h, pulverized, and used for XRD, SEM, and EDX analyses. The wet solid sample from the second cuvette was dissolved in the concentrated orthophosphoric acid and, after dilution, used for measuring the Si/AI molar ratio in the solid phase.
Analysis of the samples The fractionsfG of gel,fp(0 of tetragonal, andfpc of
cubic modification of zeolite P in the powdered solid samples were taken by a Philips diffractometer with CuK0~ radiation in the region of Bragg's angles 20 = 100-46 °. The weight fractions were calculated by the mixing method 2s using the measured integral intensi- ty of the amorphous maximum (20 -- 17°-39 °) and the sharp maximums 310 (20 = 28.1 °) and 110 (20 = 12.5 °) corresponding to the diffraction from the (310) and (110) crystal lattice planes of the cubic form (B l) of zeolite P as well as the sharp maximums 121 (20 = 23.0 °) and 011 (20 = 13.4 °) corresponding to the diffraction from the (121) and (011) crystal lattice planes of the tetragonal form (Bs) of zeolite P.
The average values of crystallite size were deter- mined by the integral width of the diffraction maximums 121 (20 = 23.0 ° ) and 031 (20 = 29.7 ° ) corresponding to the diffraction from the (121) and (031) crystal lattice planes of the tetragonal form (Ba) of zeolite P and by the integral width of the diffraction maximum 310 (20 = 28.1 °) corresponding to the diffraction from the (3 I0) crystal lattice planes of the cubic modification (BI) of zeolite P. After subtracting the background and resolving the indi- vidual lines, the. profiles were corrected for in- strumental broadening using the germanium diffrac- tion profile corresponding to the diffraction from the (111) crystal lattice planes of germanium. The crystal- lite size was calculated by using the Scherrer formula. 29 Scanning electron micorgraphs of the samples were taken with a JEOL JSM-840 scanning electron microscope.
The Si/A1 molar ratio in the samples of the solid phase was measured by two methods: (i) X-ray energy dispersive analysis (EDX) of powders by means of the TRACOR TN-2000 system for X-ray microanalysis in combination with theJEOLJSM-35 scanning electron microscope, and (ii) measuring the Si and A1 concen- trations in the previously dissolved solid samples (see above) by atomic absorption spectrometry.
Concentrations of silica, aluminum, and sodium in solutions (liquid phase of the crystallizing system and the solutions obtained by the dissolution of the solid
46 ZEOLITES, 1989, Vol 9, January
phase) were measured by atomic absorption spec- trometry (Perkin-Elmer 3030 atomic absorption spec- trometer).
RESULTS A N D D I S C U S S I O N
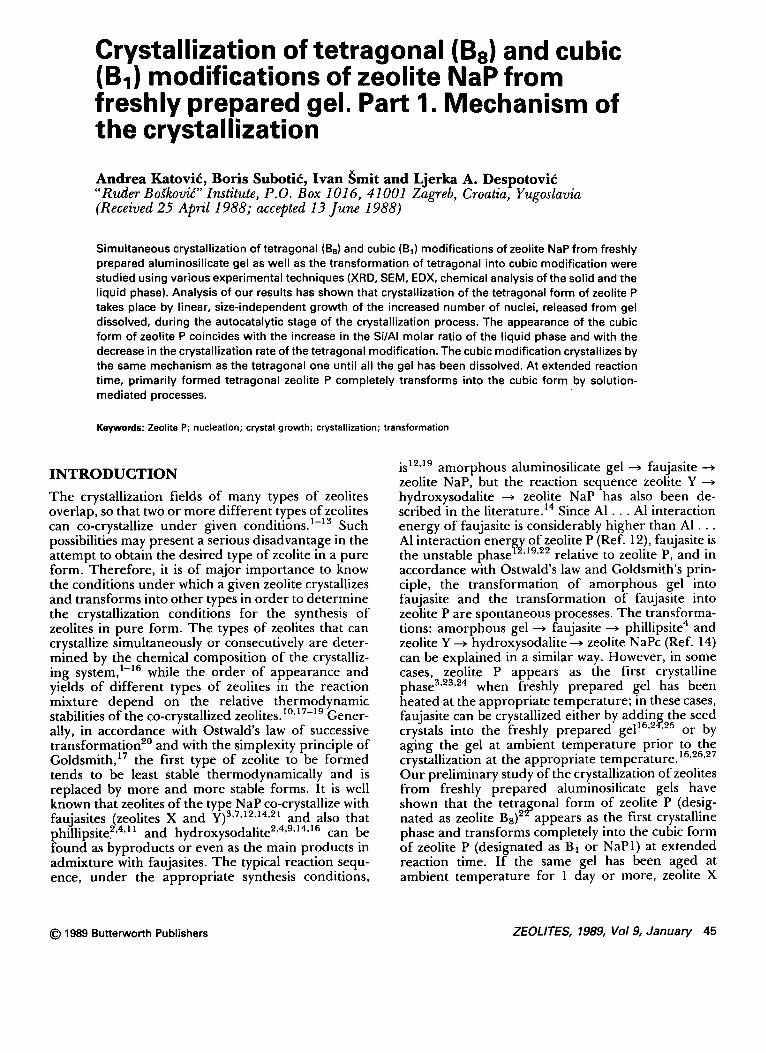
XRD analysis of the solid samples extracted from the reaction mixture at vartous crystallization times, to, showed that the solid phase is amorphous up to tc 5.2 h; thereafter, the amorphous phase starts to transform into the crystalline phase whose XRD pattern is identical with the XRD pattern of zeolite designated as Linde B8 (Ref. 22) and quadratic phillipsite 31 (see Table I and Figure 1). At tc = 6 h, the second crystalline phase identified as the cubic modification of zeolite P (Na-PI [Ref. 30], Na-Pc [Ref. 32], Linde B1 [Ref. 22]; see Figure I and Table 2) starts to co-crystallize together with the previous crystalline phase (see Figure 1). At extended reaction time, the complete solid phase (gel + zeolite Ba) transforms into the most stable form, that is, the cubic form of zeolite P (see Figure I). It has been found that the structure of zeolite Ba is tetragonal at with the lattice constants ao = 0.953 nm and co = 0.91 nm, which is very close to the lattice constant (a0 = 1 nm) of the cubic form of zeolite P (Refs. 22, 31). In order to differentiate it from the tetragonal modification of zeolite P (a0 = 1.001 nm, Co = 0.982 nm) designated as Linde Be (Ref. 22), NaPe (Ref. 22), and Na-Pt (Ref. 32), the designation Na-P(t) for zeolite Ba will be used here. Figure 2A shows the kinetics of the crystalliation/ transformation process at 80°C in the reaction mix- ture with the composition: 4.24 NaeO.A12Os.3.56 SiOe'230.6 HeO. The crystallization/transformation process can be roughly divided into four parts: (1) the induction period from tc = 0 to t~ = 5.2 h; (2) the rapid crystallization of zeolite Na-P(t) with increasing rate from t~ -~ 5.2 h to t~ = 6 h; (3) simultaneous crystallization of zeolites Na-P(t) and Na-Pc from t~ 6 h to t~ = 6.35 h; and (4) the transformation of zeolite Na-P(t) into zeolite Na-Pc from tc = 6.35 h to the end of the crystallization/transformation process.
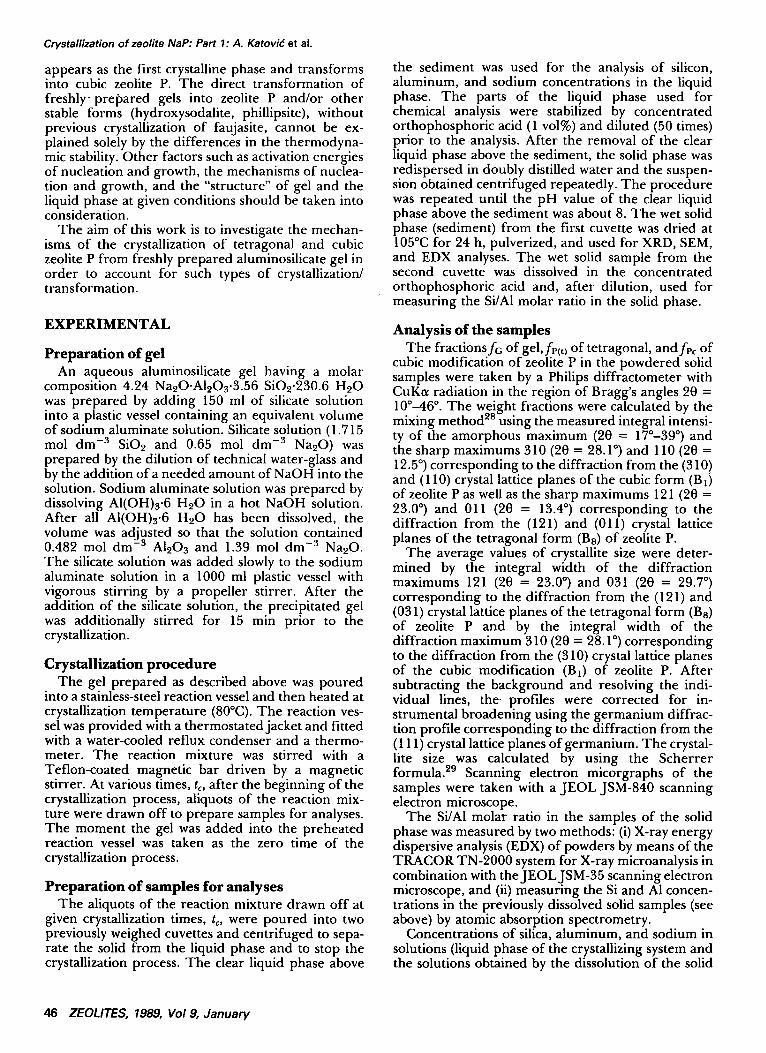
As shown in Figure I, the solid phase of the reaction mixture is X-ray amorphous and the chemical com- position of the liquid phase (concentrations of Na, Si, and AI) and the solid phase (Si/AI molar ratio), respectively, keeps constant (see Figures 2B and C and
Table 1 XRD spacings dhkl and relative intensities I/Io of zeolite Be, quadratic philipsite, and the first crystalline phase that appeared during the heating of freshly prepared gel
Quadratic Linde Be philipsite This work (Ref. 22) (Ref. 31) (Figure 1)
hkl dt,,l(A) I/Io dh,l(A) I/Io dh,i I/Io
011 6.56 100 6.58 100 6.59 100 020 4.79 50 4.77 37 4.75 46 121 3.86 67 3.86 74 3.855 95 031 3.00 88 3.00 70 3.00 97 222 - - 2.70 15 2.702 21 123 - - 2.45 5 2.46 14
Crystallization of zeolite NaP: Part 1: A. Katovid et al.
6 ~ tc=gh
-2'j , ,2z2 :::L
1 tc= 0 I I I I [ I I I I I
t6 /,2 38 34 30 26 22 16 14 10 2 0 °
Figure 1 X-ray diffractograms (relative intensity Ir vs. Bragg's angles 20) of the solid samples drawn offthe reaction mixture at various crystallization times to: (1) fo = 1, fPItl = 0, fp¢ = 0; (2) fG = 1, fP¿tl = 0, fPc = 0; (3) fG = 0.93, fP(t~ = 0.07, fPc = 0; (4) fG = 0.64, fPCt~ = 0.35, fPc = 0.01; (5) fG = 0.17, fPCt~ = 0.49, fp¢ = 0.34; (6) fG = 0, fP)t) = 0.06, fPc = 0.94. fG, fP¢t), and fPc are, respectively, the weight fractions of the gel, zeolite Na-P(t), and zeolite Na-Pc in the solid Samples
3B and Table 3) during the induction period. The small increase in Na, Si, and AI concentrations in the liquid phase, just at the beginning of the crystalliza- tion process, is caused by the heating of the reaction mixture from 25°C to the crystallization temperature (80°C), that is, by the increase of the solubility of the gel with the increasing temperature.
It is interesting that the XRD patterns of the amorphous solids exhibit two amorphous maximums (d = 0.314 nm and d = 0.736 nm) corresponding to the diffraction maximums 310 and 110, respectively, of the cubic modification of zeolite P (see Figure I). Hence, it can be concluded that the short-range ordering of Si and AI, similar to the ordering of Si and A1 in zeolite Na-Pc, or even very small particles of quasicrystalline cubic zeolite P are included into the gel structure. Such specific short-range ordering of Si and AI inside amorphous regions of aluminosilicate gels were predicted by Zhdanov ~3 and, subsequentl.y, e x p e r i m e n t a l l y e v i d e n c e d by spec t ro sc op i c
2 5 34---38 methods. ' Even, in some cases, very small particles (with the size below the detection limit by X-ray diffractometry) of long-range ordered phase have been observed inside the predominantly amor- phous regions of aluminosilicate gels. 3a'4° Since the position of the amorphous maximums and their intensities do not change during the induction period, it is reasonable to assume (i) that the quasi- crystalline zeolite Na-Pc has been formed inside the amorphous matrix at an early stage of the gel
ZEOLITES, 1989, I/ol 9, January 47
Crystallization of zeolite NaP: Part I: A. Katovid et a l.
Table 2 XRD spacings dhkl and relat ive intensit ies I/Io of zeolite Linde B1, zeol i te Na-PI, zeol i te Na-Pc, and the second crystalline phase that appeared during the heating of f reshly prepared gel
i
Linde B1 (Ref. 22) Na-PI (Ref. 30) Na-Pc (Ref. 32) This work (Figure 1)
hkl dhkl(A) //Io dhkl(A) I/Io dhkl(A) I/Io dhkl(A) I/Io
110 7.08 86 7.10 s 7.10 55 7.09 45 200 4.98 44 5.00 m 5.01 35 5.01 33 211 4.10 83 4.10 s 4.10 55 4.09 48 310 3.18 100 3.18 vs 3.16 100 3.165 100
- 2.88 15 2.90 vw - - 2.89 12 321 2.67 69 2.68 s 2.67 55 2.68 50 400 - - 2.52 vw - - 2.52 6 411 2.36 13 2.36 w 2.36 7 2.37 9
330, 422 . . . . 2.05 5 2.052 5 510 1.97 19 - - 1.965 10 1.968 12 440 1.77 10 - - 1.77 7 1.775 8 530 1.72 17 - - 1.719 7 1.72 11
433, 600 1.67 13 - , - 1.667 7 1.67 99
vs = very strong, s = strong, m = medium, w = weak, vw = very weak
formation and (ii) that the range of ordering does not change considerably during the induction period of the crystallization process. The former assumption leads to the conclusion that the particles of quasicrys- talline phase, surrounded by the amorphous matrix of aluminosilicate gel, cannot grow or that their growth is considerably decelerated because of the slow material transport processes inside the gel particles. This is in accord with Lechert s conclusion 24 that the growth of crystalline particles inside the gel matrix is blocked considerably and that they can grow only in full contact with the solution phase. At t~ = 5.33 h, the first crystalline phase, identified as zeolite Na-P(t), appears in the solid phase of the reaction mixture; thereafter, the Na-P(t) crystallizes with the increasing rate up to tc = 6 h, when about 35 wt% of
1.0 ~- ~- ~ ~-
O.8 o f = fpitl,,
0.6 ° f= A fPc 0.4 & f= tG
f 02.
0 -- ~ == •
I ~ OJD15F o ~ O o ~,
-= 0.0101-
~ 0t-
2 .,ol-- u
F I I I 0 1 2
' I I
, Z /
, .
~ i I N ~ ~ o - - - - - - - - - - o ' ' ~ I I I
I I I I I I
I I I I I I I I I 3 4 5 6 7 8 9
to(h)
Figure 2 (A) Change in the weight fractions fG, of gel, fP(t), of zeolite Na-P(t), and fPc, of zeolite Na-Pc, with crystallization time t=. (B) Change in the molar concentration AI(L), of aluminium dissolved in the liquid phase of the reaction mixture, with crystallization time t¢. (C) Change in the molar concentration Si(L), of silicon dissolved in the liquid phase of the reaction mixture, with crystallization time tc
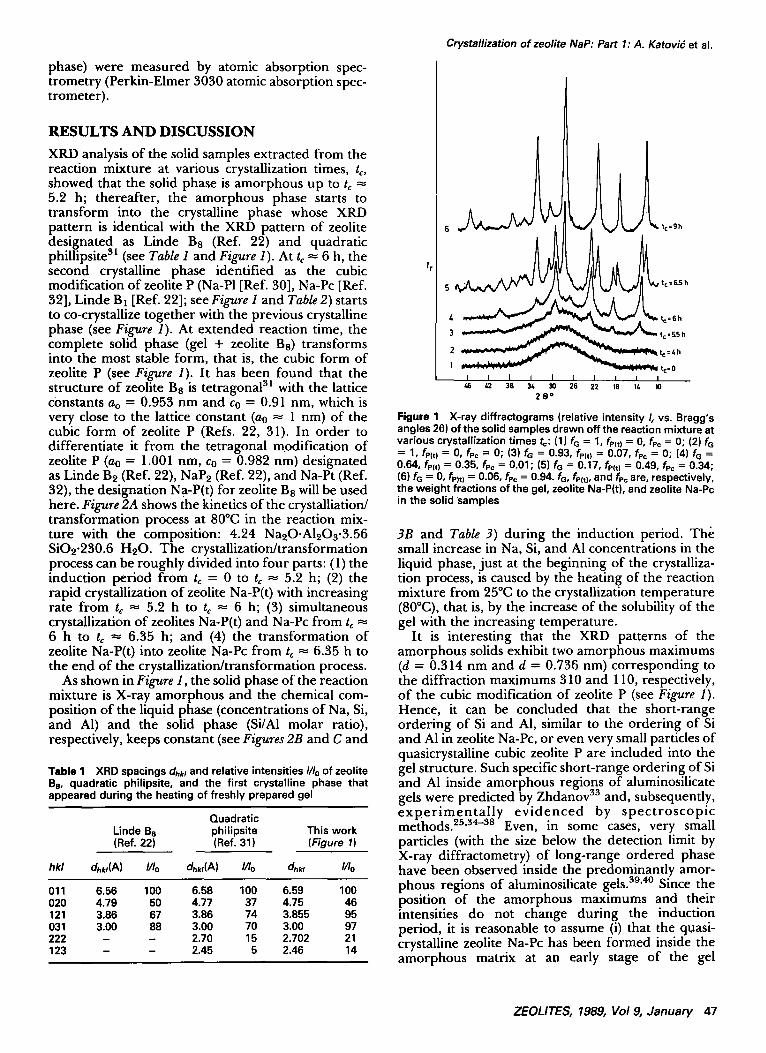
the gel has been transformed into Na-P(t) (see Figure 2A). In the same time interval, the concentration of AI in the liquid phase remains constant (see Figure 2B), while the concentration of Si in the liquid phase increases (see Figure 2C) because of the lower Si/AI molar ratio in the crystalline phase than in the starting aluminosilicate gel (see Figure 2B). The constant value Si/AI = 1.72 of the Si/AI molar ratio of the solid phase (gel), retained during the induction period, decreases with the increase in the fraction of zeolite Na-P(t) and reaches an approximately con- stant value of Si/A1 ~ 1.58 at tc ~ 6.5 h, as shown in Figure 3B. Knowing that the measured Si/AI molar ratio of the solid phase is an average value of the Si/AI molar ratio of all constituents of the solid phase (gel, zeolite Na-P(t), zeolite Na-Pc), its value [Si/Al]s can be expressed as:
[Si/Al]s = fG" [Si/Al]c + fP(t) • [Si]Al]p(t) +fPc" [Si/Al]p~ (1)
where [Si/A1]G = 1.72 (see Figure 3B), [Si/AI]p(0, and [Si/Al]w are the Si/AI molar ratio of aluminosilicate gel, Na-P(t), and Na-Pc, respectively. For the time interval from tc = 0 to tc = 6 h (/'Pc = 0), Equation (1) can be reduced to the form:
Table 3 Concentration [Na]L o f sod ium d isso lved in the l iquid phase of the crystal l iz ing system at var ious crystal l izat ion times, t=
Crystal l izat ion t ime, tc (h) [Na]L (mol dm -3)
0 1.55 1 1.93 2 1.68 3 1.69 4 1.70 4.5 1.86 5 1.70 5.33 1.70 5.57 1.73 6 1.96 6.33 2.07 7 2.17
48 ZEOLITES, 1989, Vol 9, January
1.0
(10 0 = fP(t )
(16 e f = fPc f
0A
O2
120140 B [SilAI]L : /" _ ~ &
100 [SilAI]s :0 AAS • EDX
80 1 l.o
40 It ~ 1.6
I I I I { I I I I I 0 1 2 3 4 5 6 ? 6 9
tc(h)
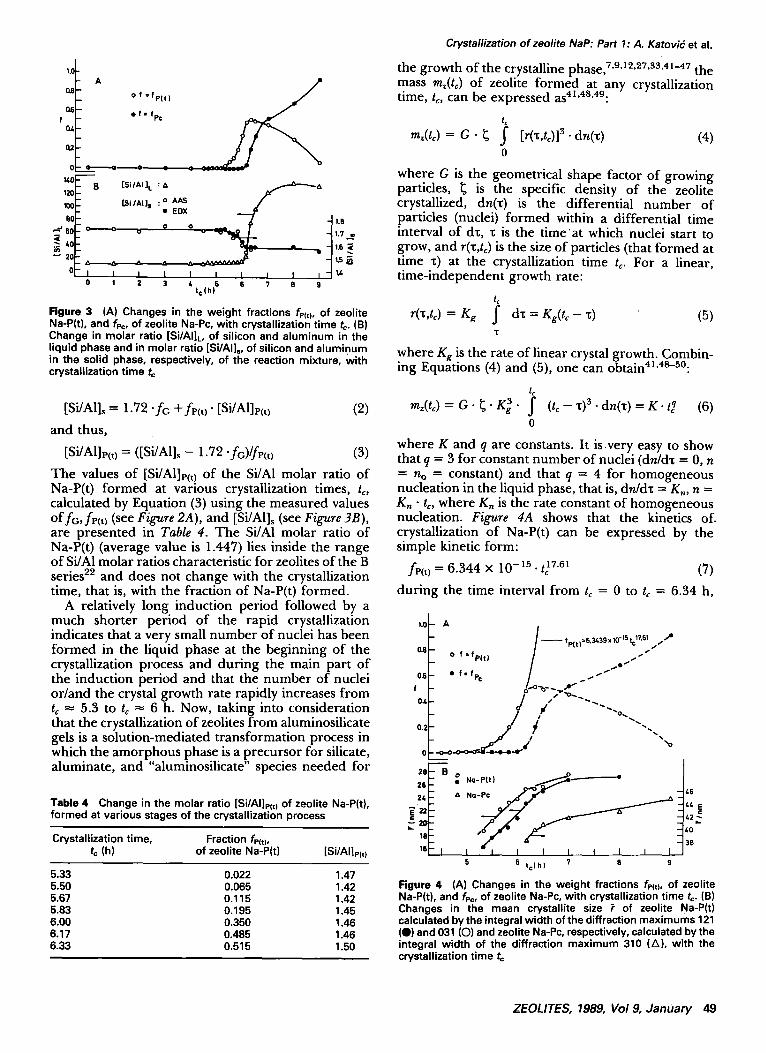
Figure 3 (A) Changes in the weight fractions fP(t), of zeolite Na-P(t), and fp¢, of zeolite Na-Pc, with crystallization time t~. (B) Change in molar ratio [Si/AI]~, of silicon and aluminum in the liquid phase and in molar ratio [Si/AI]., of silicon and aluminum in the solid phase, respectively, of the reaction mixture, With crystallization t ime t~
[Si/A1]~ = 1.72 "re +fl,(t) • [Si/A1]p(0 (2)
and thus,
[Si/hl]e(t) = ([Si/hl]~ - 1.72 "fG)/fI'(O (3)
The values of [Si/Al]e(t) of the Si/Al molar ratio of Na-P(t) formed at various crystallization times, t,, calculated by Equation (3) using the measured values o f fG, fI,(t) (see Figure 2A), and [Si/hl]~ (see Figure 3B), are presented in Table 4. The Si/A1 molar ratio of Na-P(t) (average value is 1.447) lies inside the range of Si/A1 molar ratios characteristic for zeolites of the B series 22 and does not change with the crystallization time, that is, with the fraction of Na-P(t) formed.
A relatively long induction period followed by a much shorter period of the rapid crystallization indicates that a very small number of nuclei has been formed in the liquid phase at the beginning of the crystallization process and during the main part of the induction period and that the number of nuclei or/and the crystal growth rate rapidly increases from t~ ~- 5.3 to t, ~ 6 h. Now, taking into consideration that the crystallization of zeolites from aluminosilicate gels is a solution-mediated transformation process in which the amorphous phase is a precursor for silicate, aluminate, and "aluminosilicate" species needed for
Table 4 Change in the molar ratio [Si/AI]p(t) of zeolite Na-P(t), formed at various stages of the crystallization process
Crystallization time, Fraction fP(t), tc (h) of zeolite Na-P(t) [Si/Allp(,)
5.33 0.022 1.47 5.50 0.065 1.42 5.67 0.115 1.42 5.83 0.195 1.45 6.00 0.350 1,46 6.17 0.485 1.46 6.33 0.515 1.50
Crystallization of zeolite NaP: Part 1: A. Katovid et al.
the growth of the crystalline phase, 7,9A2,27.33,4 ]-47 the mass mz(tc) of zeolite formed at any crystallization time, to, can be expressed as41'48'49:
mz(tc) = G • ~ f [r(z,t~)] 3-dn(z) (4) 0
where G is the geometrical shape factor of growing particles, ~ is the specific density of the zeolite crystallized, dn(z) is the differential number of particles (nuclei) formed within a differential time interval of dz, z is the t imea t which nuclei start to g.row, and r(z,tc) is the size of particles (that formed at ume z) at the crystallization time t~. For a linear, time-independent growth rate:
t¢
r('~,t~) = Kg ~ d'c = Kg(t~ - ~) (5) T
where Kg is the rate of linear crystal growth. Combin- ing Equations (4) and (5), one can obtain41'4s-~°:
tc m~(t~) = G . ~ . K~ . ~ (tc - ~)a . dn(~) = K . t q (6)
0
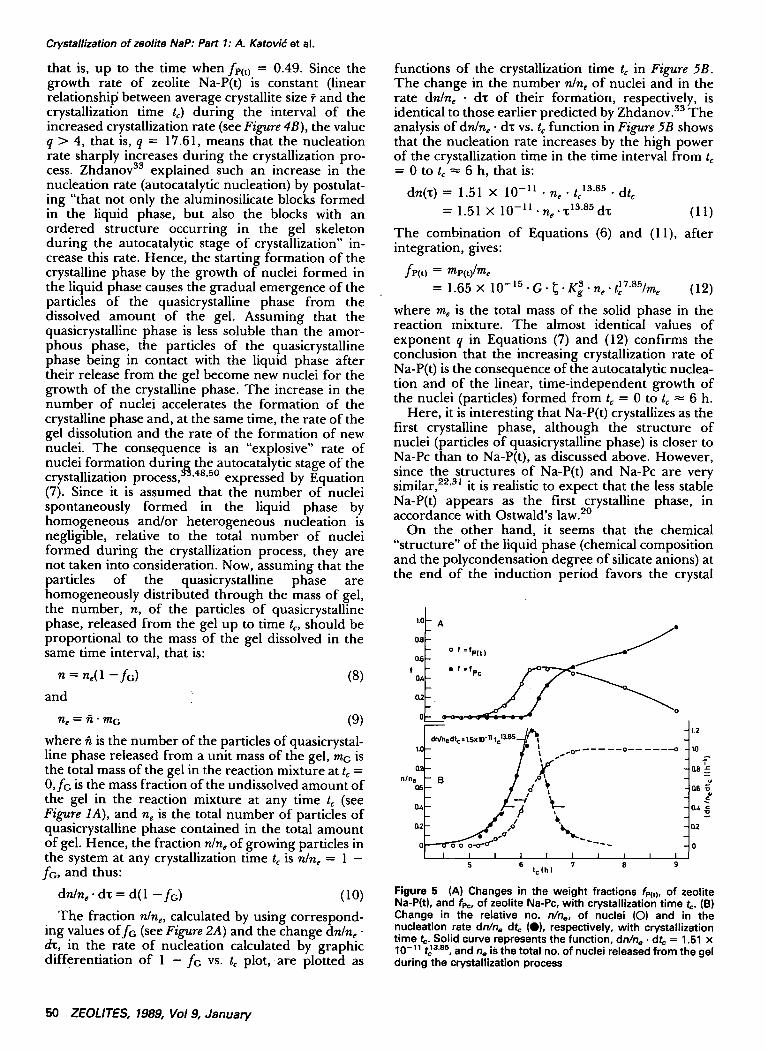
where K and q are constants. It is.very easy to show that q = 3 for constant number of nuclei (dn/d~ = 0, n = no = constant) and that q = 4 for homogeneous nucleation in the liquid phase, that is, dn/d'c = K, , n = K, • t~, where K, is the rate constant of homogeneous nucleation. Figure 4A shows that the kinetics of. crystallization of Na-P(t) can be expressed by the simple kinetic form:
f r ( t ) = 6.344 x 10 - I s . t 17"61 (7)
during the time interval from t~ = 0 to t~ = 6.34 h,
1.0 ~ A I / - - fp[t)=6.3439x10⁻¹⁵tc 17"61 i ~
0.6-- O f = fP(tJ / I " *
-- /.-O' e s 0.6 - • f " fp¢ . ~ /
f - o --o" ~'~'O~
°, i I / - o . 0.2 -o-o-o" ~ - ~ -o-.o I-e~d' "o
2 6 - - ' B o 26 •
46 .26 & ~ 46 ¢E
~.zo 60
16 39 l e - I I I I { I I I I I
r, 6 tc[h ) 7 6 9
Figure 4 (A) Changes in the weight fractions fp(z), of zeolite Na-P(t), and fPc, of zeolite Na-Pc, with crystallization time tc. (B) Changes in the mean crystallite size ? of zeolite Na-P(t) calculated by the integral width of the diffraction maximums 121 (e) and 031 (O) and zeolite Na-Pc, respectively, calculated bythe integral width of the diffraction maximum 310 (Zl), with the crystallization time t¢
ZEOLITES, 1989, Vol 9, January 49
Crystallization of zeolite NaP: Part 1: A. Katovid et sl.
that is, up to the time when fe(t) = 0.49. Since the growth rate of zeolite Na-P(t) is constant (linear relationshil5 between average crystallite size P and the crystallization time t~) during the interval of the increased crystallization rate (see Figure 4B), the value q > 4, that is, q = 17.61, means that the nucleation rate sharply increases during the crystallization pro- cess. Zhdanov as explained such an increase in the nucleation rate (autocatalytic nucleation) by postulat- ing "that not only the aluminosilicate blocks formed in the liquid phase, but also the blocks with an ordered structure occurring in the gel skeleton during the autocatalytic stage of crystallization" in- crease this rate. Hence, the starting formation of the crystalline phase by the growth of nuclei formed in the liquid phase causes the gradual emergence of the particles of the quasicrystalline phase from the dissolved amount of the gel. Assuming that the quasicrystalline phase is less soluble than the amor- phous phase, the particles of the quasicrystalline phase being in contact with the liquid phase after their release from the gel become new nuclei for the growth of the crystalline phase. The increase in the number of nuclei accelerates the formation of the crystalline phase and, at the same time, the rate of the gel dissolution and the rate of the formation of new nuclei. The consequence is an "explosive" rate of nuclei formation durin~ the autocatalytic stage of the crystallization process, °°'48'5° expressed by Equation (7). Since it is assumed that the number of nuclei spontaneously formed in the liquid phase by homogeneous and/or heterogeneous nucleation is negligible, relative to the total number of nuclei formed during the crystallization process, they are not taken into consideration. Now, assuming that the particles of the quasicrystalline phase are homogeneously distributed through the mass of gel, the number, n, of the particles of quasicrystalline phase, released from the gel up to time t~, should be proportional to the mass of the gel dissolved in the same time interval, that is:
n = n~(l --fG) (8)
and
n e = n " m G (9)
where fi is the number of the particles of quasicrystal- line phase released from a unit mass of the gel, mG is the total mass of the gel in the reaction mixture at tc = 0,fG is the mass fraction of the undissolved amount of the gel in the reaction mixture at any time t~ (see Figure 1A), and n~ is the total number of particles of quasicrystalline phase contained in the total amount of gel. Hence, the fraction n/n~ of growing particles in the system at any crystallization time t~ is nine = 1 - fc , and thus:
dn/n~, d~ = d(1 - fG) (10)
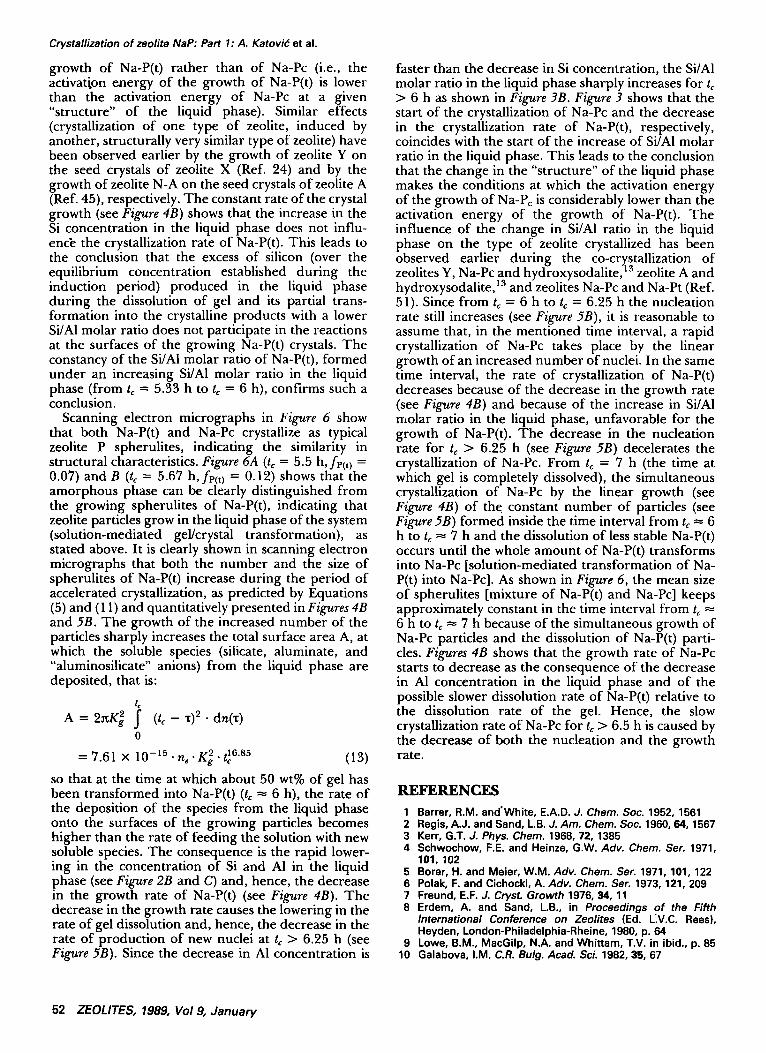
The fraction n/n~, calculated by using correspond- ing values offG (see Figure 2A) and the change dn/n,. d~, in the rate of nucleation calculated by graphic differentiation of 1 - f c vs. t~ plot, a r e plotted as
functions of the crystallization time t~ in Figure 5B. The change in the number n/n~ of nuclei and in the rate dn/n, • dx of their formation, respectively, is identical to those earlier predicted by Zhdanov. 33 The analysis of dn/n~, dx vs. t~ function in Figure 5B shows that the nucleation rate increases by the high power of the crystallization time in the time interval from t~ = 0 t o t ~ 6 h , thatis:
dn(x) = 1.51 x 10 - l l • n~ • t~ 13"a5 • dt~
= 1.51 x 10 - ] l .n~.z]a'asd~ (11)
The combination of Equations (6) and (11), after integration, gives:
fP( t ) = mP( t ) /me
= 1.65 X lO-15.G.~.K~.ne.t~7"aS/m, (12)
where me is the total mass of the solid phase in the reaction mixture. The almost identical values of exponent q in Equations (7) and (12) confirms the conclusion that the increasing crystallization rate of Na-P(t) is the consequence of the autocatalytic nuclea- tion and of the linear, t ime-independent growth of the nuclei (particles) formed from t~ = 0 to t~ = 6 h.
Here, it is interesting that Na-P(t) crystallizes as the first crystalline phase, although the structure of nuclei (particles of quasicrystalline phase) is closer to Na-Pc than to Na-P(t), as discussed above. However, since the structures of Na-P(t) and Na-Pc are very similar, 22'3~ it is realistic to expect that the less stable Na-P(t) appears as the first crystalline phase, in accordance with Ostwald's law. ~°
On the other hand, it seems that the chemical "structure" of the liquid phase (chemical composition and the polycondensation degree of silicate anions) at the end of the induction period favors the crystal
1~ A
0.8
f
0.2 .
--~/'~t 1.2 1,0 dn/nedtc=l"SxlO'ntcl~85g ~ s~ 0 . . . . . . o . . . . . --o tO
0,8 0.8 .,n% ~ ff
0.~ 11.4 ~
O.2 (12
I I I I I I I I I I 5 6 7 8 9 tc(h)
Rgure 5 (A) Changes in the weight fractions feet), of zeolite Na-Plt), and fPc, of zeolite Na-Pc, with crystallization time to. (B) Change in the relative no. n/ne, of nuclei (0) and in the nucleation rate dn/n. dt~ (@), respectively, with crystallization t ime t~. Solid curve represents the function, dn/ne • dt~ = 1.51 x 10 -1~ t~ 3"es, and no is the total no. of nuclei released from the gel during the crystallization process
50 ZEOLITES, 1989, Vol 9, January
Crystallization of zeolite NaP: Part 1: A. Katovid et al.
(a) (b)
(c) (d)
(e)
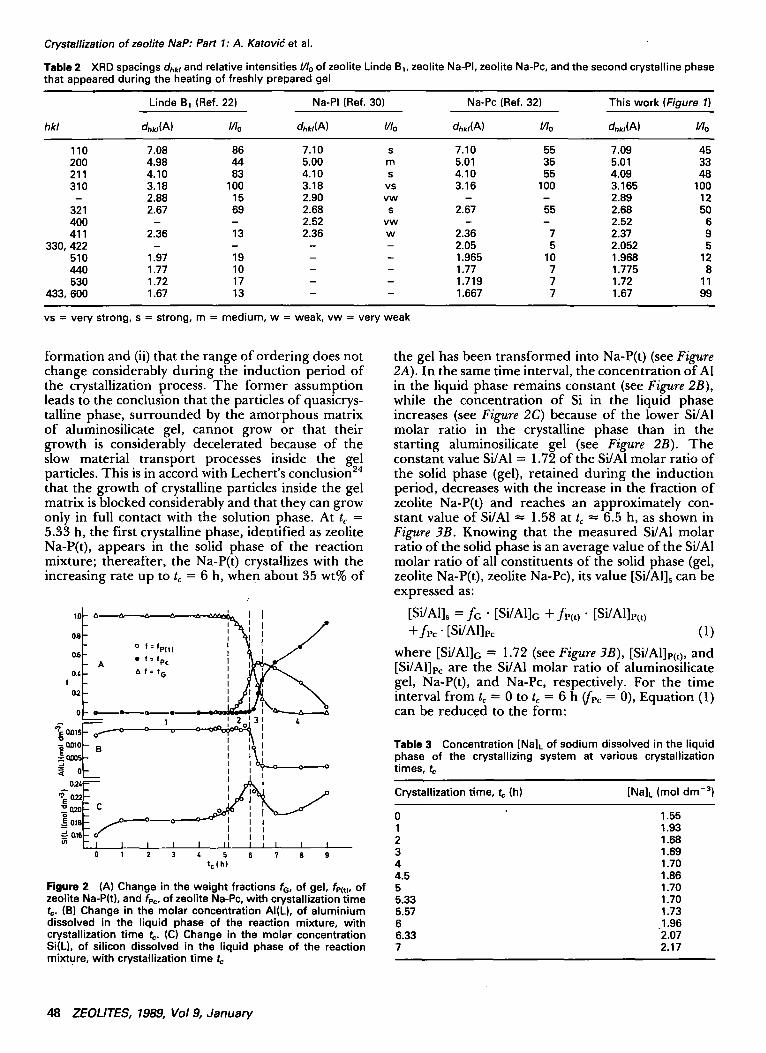
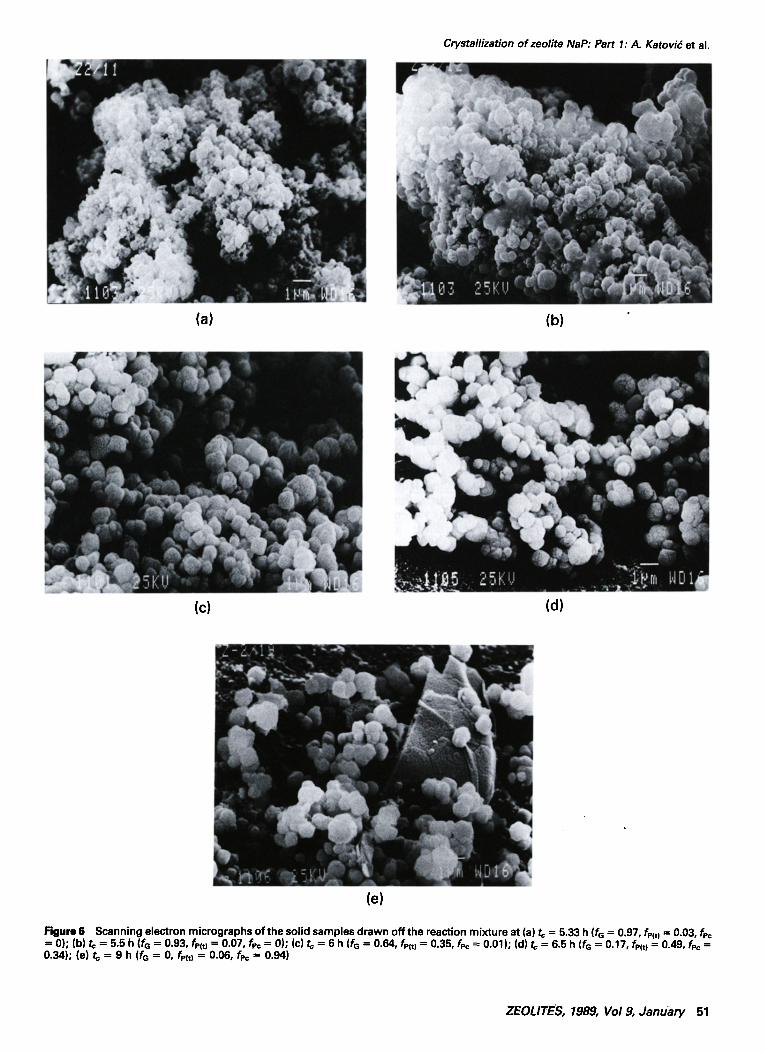
Rgure 6 Scanning electron micrographs of the solid samples drawn off the reaction mixture at (a) t¢ = 5.33 h (fG = 0.97, fPCt) = 0.03, fec = 0); (b) t= = 5.5 h (fG ---- 0 .93 , fP(t) ---- 0 .07 , fPc ---- 0); (C) t c = 6 h (fG ---- 0 .64 , fP(t) = 0 .35 , fp¢ = 0.01); (d) tc = 6.5 h (fG = 0 .17, fP(t) = 0 .49, fPc = 0.34); (e) tc = 9 h (fG = 0, fPm = 0.06, fp= = 0.94)
ZEOLITES, 1989, Vol 9, January 51
Crystallization of zeolite NaP: Part 1: A. Katovi6 e t a l .
growth of Na-P(t) rather than of Na-Pc (i.e., the activation energy of the growth of Na-P(t) is lower than the activation energy of Na-Pc at a given "structure" of the liquid phase). Similar effects (crystallization of one type of zeolite, induced by another, structurally very similar type of zeolite) have been observed earlier by the growth of zeolite Y on the seed crystals of zeolite X (Ref. 24) and by the growth of zeolite N-A on the seed crystals of zeolite A (Ref. 45), respectively. The constant rate of the crystal growth (see Figure 4B) shows that the increase in the Si concentration in the liquid phase does not influ- enc~ the crystallization rate of Na-P(t). This leads to the conclusion that the excess of silicon (over the equilibrium concentration established during the induction period) produced in the liquid phase during the dissolution of gel and its partial trans- formation into the crystalline products with a lower Si/AI molar ratio does not participate in the reactions at the surfaces of the growing Na-P(t) crystals. The constancy of the Si/AI molar ratio of Na-P(t), formed under an increasing Si/AI molar ratio in the liquid phase (from t~ = 5.33 h to t~ = 6 h), confirms such a conclusion.
Scanning electron micrographs in Figure 6 show that both Na-P(t) and Na-Pc crystallize as typical zeolite P spherulites, indicating the similarity in structural characteristics. Figure 6A (t~ = 5.5 h,fp(t) = 0.07) and B (t~ = 5.67 h, fe(t) = 0.12) shows that the amorphous phase can be clearly distinguished from the growing spherulites of Na-P(t), indicating that zeolite particles grow in the liquid phase of the system (solution-mediated gel/crystal transformation), as stated above. It is clearly shown in scanning electron micrographs that both the number and the size of spherulites of Na-P(t) increase during the period of accelerated crystallization, as predicted by Equations (5) and (11) and quantitatively presented in Figures 4B and 5B. The growth of the increased number of the particles sharply increases the total surface area A, at which the soluble species (silicate, aluminate, and "aluminosilicate" anions) from the liquid phase are deposited, that is:
tc
A = 2 s r K 2 J" ( t ~ - x ) 2"dn(x) 0
= 7.61 × 10 -15 " n e ' K 2 , t~6 .85 (13)
so that at the time at which about 50 wt% of gel has been transformed into Na-P(t) (to ~ 6 h), the rate of the deposition of the species from the liquid phase onto the surfaces of the growing particles becomes higher than the rate of feeding the solution with new soluble species. The consequence is the rapid lower- ing in the concentration of Si and AI in the liquid phase (see Figure 2B and C) and, hence, the decrease in the growth rate of Na-P(t) (see Figure 4B). The decrease in the growth rate causes the lowering in the rate of gel dissolution and, hence, the decrease in the rate of production of new nuclei at t~ > 6.25 h (see Figure 5B). Since the decrease in A1 concentration is
faster than the decrease in Si concentration, the Si/AI molar ratio in the liquid phase sharply increases for tc > 6 h as shown in Figure 3B. Figure 3 shows that the start of the crystallization of Na-Pc and the decrease in the crystallization rate of Na-P(t), respectively, coincides with the start of the increase of Si/AI molar ratio in the liquid phase. This leads to the conclusion that the change in the "structure" of the liquid phase makes the conditions at which the activation energy of the growth of Na-Pc is considerably lower than the activation energy of the growth of Na-P(t). The influence of the change in Si/AI ratio in the liquid phase on the type of zeolite crystallized has been observed earlier during the co-crystallization of zeolites Y, Na-Pc and hydroxysodalite, t3 zeolite A and hydroxysodalite, 13 and zeolites Na-Pc and Na-Pt (Ref. 51). Since from tc = 6 h to tc = 6.25 h the nucleation rate still increases (see Figure 5B), it is reasonable to assume that, in the mentioned time interval, a rapid crystallization of Na-Pc takes place by the linear growth of an increased number of nuclei. In the same time interval, the rate of crystallization of Na-P(t) decreases because of the decrease in the growth rate (see Figure 4B) and because of the increase in Si/AI molar ratio in the liquid phase, unfavorable for the growth of Na-P(t). The decrease in the nucleation rate for tc > 6.25 h (see Figure 5B) decelerates the crystallization of Na-Pc. From tc = 7 h (the time at which gel is completely dissolved), the simultaneous crystallization of Na-Pc by the linear growth (see Figure 4B) of the. constant number of particles (see Figure 5B) formed inside the time interval from tc ~ 6 h to tc -~- 7 h and the dissolution of less stable Na-P(t) occurs until the whole amount of Na-P(t) transforms into Na-Pc [solution-mediated transformation of Na- P(t) into Na-Pc]. As shown in Figure 6, the mean size of spherulites [mixture of Na-P(t) and Na-Pc] keeps approximately constant in the time interval from t~ 6 h to t~ ~ 7 h because of the simultaneous growth of Na-Pc particles and the dissolution of Na-P(t) parti- cles. Figures 4B shows that the growth rate of Na-Pc starts to decrease as the consequence of the decrease in AI concentration in the liquid phase and of the possible slower dissolution rate of Na-P(t) relative to the dissolution rate of the gel. Hence, the slow crystallization rate of Na-Pc for t~ > 6.5 h is caused by the decrease of both the nucleation and the growth rate.
REFERENCES
1 Barrer, R.M. and'White, E.A.D.J. Chem. Soc. 1952, 1561 2 Regis, A.J. and Sand, L.B.J. Am. Chem. Soc. 1960, 64, 1567 3 Kerr, G.T.J. Phys. Chem. 1968, 72, 1385 4 Schwochow, F.E. and Heinze, G.W. Adv. Chem. Ser. 1971,
101, 102 5 Borer, H. and Meier, W.M. Adv. Chem. Ser. 1971, 101,122 6 Polak, F. and Cichocki, A. Adv. Chem. Ser. 1973, 121,209 7 Freund, E.F.J. CrysL Growth 1976, 34, 11 8 Erdem, A. and Sand, L.B., in Proceedings of the Fifth
International Conference on Zeolites (Ed. L~V.C. Rees), Heyden, London-Philadelphia-Rheine, 1980, p. 64
9 Lowe, B.M., MacGilp, N.A. and Whittam, T.V. in ibid., p. 85 10 Galabova, I.M.C.R. Bulg. Acado Sci. 1982, 35, 67
52 ZEOLITES, 1989, Vol 9, January
11 Burriesci, N., Crisafulli, L., Giordano, N. and Bart, J.C.J. Mater. Lett. 1984, 2, 401
12 Shuije, M., Liansheng, L., Ruren, X. and Zhaohui, Y. in Studies in Surface Science and Catalysis, Vol. 24 (Eds. B. Driaj, S. HoEevar and S. Pejovnik) Elsevier, Amsterdam- Oxford-New York-Tokyo, 1985, p. 191
13 Tassopoulos, M. and Thompson, R.W. Zeolltes 1987, 7, 243 14 Ueda, S., Kageyama, N. and Koizumi, M. in Proceedings of
the First International Symposium of Hydrothermal Reac- tions (Ed. S. Shigeyuki) Gakujutsu Bunken Fukyu-kai, Tokyo, 1983, p. 695
15 Ueda, S., Kageyama, N., Koizumi, M., Kobayashi, S. and Fujiwara, Y. J. Phys. Chem. 1984, 88, 2128
16 Kasahara, S., Itabashi, K. and Igawa, K., in Proceedings of the Seventh International Conference on Zeolites (Eds. Y. Murakami, A. lijima, and J.W. Ward), Kodansha Ltd., Tokyo, 1986, p. 185
17 Goldsmith, J.R.J. Geol. 1953, 61,439 18 Aielo, R., Barrer, R.M. and Kerr, I.S. Adv. Chem. Ser. 1971,
101, 44 19 Barrer, R.M. Hydrothermal Chemistry of Zeolites, Academic
Press, London, 1982, p. 174 20 Ostwald, W. Z. Physik. Chem. 1897, 22, 290 21 Fieler, F.J., Lohse, H.H. and Schuermann, K.N. Jb. Miner.
Mh. 1983, 8, 358 22 Beard, W.C. Adv. Chem. Ser. 1971, 101,237 23 Wieker, W. and Fahlke, B. in Studies in Surface Science and
Catalysis, Vol. 24 (Eds. B. Dr~aj, S. HoEevar and S. Pejovnik), Elsevier, Amsterdam-Oxford-New York-Tokyo, 1985, p. 161
24 Kacirek, H. and Lechert, H. J. Phys. Chem. 1975, 79, 1589 25 Ruren, X. and Jianmin, Z. Chem. J. Chin. Univ. 1982, 3, 287 26 Dewaele, N., Bodart, P., Gabelica, Z. and Nagy, J.B. Acta
Chim. Hung. 1985, 119, 233 27 Fahlke, B., Starke, P., Wieker, W. and Wendlandt, K.P.
Zeolites 1987, 7, 209 28 Zevin, L.S. and Zavyalova, L.L. Kolichestvenniy Rentgenog-
raphicheskiy PrazoviyAnaliz, Nedra, Moscow, 1974, p. 37 29 Klug, H.P. and Alexander, L.E. X-ray Diffraction Procedures,
John Wiley and Sons, New York, 1954, p. 491 30 Barrer, R.M., Bultitude, F.W. and Kerr, I.S.J. Chem. Soc.
1959, 1521 31 Cruchaudet, J., Simonot-Grange, M.H. and Thrierr-Sorel, A.
C. R. Acad. Sci. [D] (Paris) 1971, 272C, 37 32 Taylor, A.M. and Roy, R. Am. Mineral. 1964, 49, 656
Crystallization of zeolite NaP: Part 1: A. Katovi~ et al.
33 Zhdanov, S.P. Adv. Chem. Ser. 1971, 101, 20 34 Engelhardt, G., Fahlke, B., M~gi, M. and Lippmaa, E. Zeolites
1983, 3, 292 35 Dutta, P.K. and Shieh, D.C.J. Phys. Chem. 1986, 90, 2331 36 Tsuruta, Y., Satoh, T., Yoshida, T., Okumura, O. and Ueda,
S., in Proceedings of the Seventh International Conference on Zeolites (Eds. Y. Murakami, A. lijima and J.W. Ward) Kodansha Ltd., Tokyo, 1986, p. 1001
37 Dutta, P.K., Shieh, D.C. and Purl, M. J. Phys. Chem. 1987, 91, 2332
38 Okumura, O., Tsuruta, Y. and Satoh, T. Gyp. Lime 1987, 206, 23
39 Bursill, L.A. and Thomas, J.M., in Fifth International Confer- ence on Zeolites, Recent Progress Report and Discussions (Eds. R. Sersale, C. Colella and R. Aiello) Giannini, Naples, Italy, 1981, 25
40 Gabelica, Z., Nagy, J,B., Debras, G. and Derouane, E.G. Acta Chim. Hung. 1985, 119, 275
41 Ciric, J. J. Colloid Interface ScL 1968, 28, 315 42 Culfaz, A. and Sand, L.B. Adv. Chem. Ser. 1973, 121, 140 43 Meise, W. and Schwochow, F.E. Adv. Chem: Ser. 1973, 121,
169 44 Cournoyev, R.A., Kranich, W.L. and Sand, L.B.J. Phys.
Chem. 1975, 79, 1578 45 Kacirek, H. and Lechert, H., in Molecular Sieves-II, ACS
Symp. Ser. 40 (Ed. J.R. Katzer), Am. Chem. Soc., Washing- ton, D.C., USA, 1977, p. 244
46 Zhdanov, S.P. and Samulevich, N.N., in Proceedings of the Fifth International Congress on Zeolites (Ed. R.V.C. Rees) Heyden, London-Philadelphia-Rheine, 1980, p. 75
47 Thompson, R.W. and Huber, M.J.J. Cryst. Growth 1982, 56, 711
48 Subotid, B. and Graovac, A., in Studies in Surface Science and Catalysis, Vol. 24 (Eds. B. Dr~aj, S. Ho~evar and S. Pejovnik), Elsevier, Amsterdam-New York-Tokyo, 1985, p. 199
49 Subotid, B. and Sekovanid, L. J. Cryst. Growth 1986, 75, 561 50 Broni~, J., Suboti~, B., ~mit, I. and Despotovi~, Lj.A., in
Studies in Surface Science and Catalysis, Vol. 37 (Eds. P.J.' Grobet, W.J. Mortier, E.F. Vansant and G. Schulz-Ekloff), Elsevier, Amsterdam-Oxford-New York-Tokyo, 1988, p. 107
51 Subotid, B., ~;mit, I., Had~ija, O. and Sekovanid, L. Zeolites 1982, 2, 135
ZEOLITES, 1989, Vol 9, January 53
Recommended


