
BioMed CentralBMC Medical Genetics
ss
Open AcceTechnical advanceDesign considerations in a sib-pair study of linkage for susceptibility loci in cancerRichard A Kerber†1, Christopher I Amos†2, Beow Y Yeap3, Dianne M Finkelstein*3 and Duncan C Thomas†4Address: 1Population Sciences Program, Hunstman Cancer Institute, Salt Lake City, UT, USA, 2Department of Epidemiology, M. D. Anderson Cancer Center, Houston, TX, USA, 3Biostatistics Center, Massachusetts General Hospital, Boston, MA, USA and 4Department of Preventive Medicine, University of Southern California, Los Angeles, CA, USA
Email: Richard A Kerber - [email protected]; Christopher I Amos - [email protected]; Beow Y Yeap - [email protected]; Dianne M Finkelstein* - [email protected]; Duncan C Thomas - [email protected]
* Corresponding author †Equal contributors
AbstractBackground: Modern approaches to identifying new genes associated with disease allow very fineanalysis of associaton and can be performed in population based case-control studies. However,the sibpair design is still valuable because it requires few assumptions other than acceptably highpenetrance to identify genetic loci.
Methods: We conducted simulation studies to assess the impact of design factors on relativeefficiency for a linkage study of colorectal cancer. We considered two test statistics, one comparingthe mean IBD probability in affected pairs to its null value of 0.5, and one comparing the mean IBDprobabilities between affected and discordant pairs. We varied numbers of parents available,numbers of affected and unaffected siblings, reconstructing the genotype of an unavailable affectedsibling by a spouse and offspring, and elimination of sibships where the proband carries a mutationat another locus.
Results: Power and efficiency were most affected by the number of affected sibs, the number ofsib pairs genotyped, and the risk attributable to linked and unlinked loci. Genotyping unaffectedsiblings added little power for low penetrance models, but improved validity of tests when therewas genetic heterogeneity and for multipoint testing. The efficiency of the concordant-only test wasnearly always better than the concordant-discordant test. Replacement of an unavailable affectedsibling by a spouse and offspring recovered some linkage information, particularly if several offspringwere available. In multipoint analysis, the concordant-only test was showed a small anticonservativebias at 5 cM, while the multipoint concordant-discordant test was generally the most powerful test,and was not biased away from the null at 5 cM.
Conclusion: Genotyping parents and unaffected siblings is useful for detecting genotyping errorsand if allele frequencies are uncertain. If adequate allele frequency data are available, we suggest asingle-point affecteds-only analysis for an initial scan, followed by a multipoint analysis of affectedand unaffected members of all available sibships with additional markers around initial hits.
Published: 10 July 2008
BMC Medical Genetics 2008, 9:64 doi:10.1186/1471-2350-9-64
Received: 19 December 2007Accepted: 10 July 2008
This article is available from: http://www.biomedcentral.com/1471-2350/9/64
© 2008 Kerber et al; licensee BioMed Central Ltd. This is an Open Access article distributed under the terms of the Creative Commons Attribution License (http://creativecommons.org/licenses/by/2.0), which permits unrestricted use, distribution, and reproduction in any medium, provided the original work is properly cited.
Page 1 of 17(page number not for citation purposes)
BMC Medical Genetics 2008, 9:64 http://www.biomedcentral.com/1471-2350/9/64
BackgroundThe sib pair design has been widely used in human studiesfor mapping genes that affect both quantitative anddichotomous traits. The objective of sibling studies is todetermine whether the siblings (or other close relatives)tend to express the same disease phenotype (or similarvalues of a quantitative trait) when they share a com-monly inherited genomic segment measured by geneticmarkers. Because two loci located close together on thesame chromosome tend to be inherited together, sibs whohave inherited an allele predisposing them to disease willalso inherit a variety of other genetic characteristicslocated in the same genomic segment as the gene respon-sible for disease susceptibility. By examining, in a set ofpairs of affected sibs, the degree of sharing of geneticmarker alleles located throughout the genome, research-ers can identify regions that are shared more often thanwould be expected by chance. This excess allele sharingconstitutes the statistical evidence for linkage between theshared markers and putative disease susceptibility loci.
The popularity of the sib-pair and related small-familystudy designs reflects several attractive characteristics. Forhighly penetrant alleles, extended families can often berecruited and so provide a powerful source of informationfor disease localization and fine mapping. However, forcomplex diseases that result from interactions among locior that result from both genetic and environmentaleffects, large pedigrees that include multiple affected indi-viduals may be rare and may not reflect a single etiologi-cally-related genetic factor. Since the pioneering work ofHaseman and Elston [1] on quantitative trait mapping,many alternative approaches and extensions to the designhave been developed to handle multilocus data [2],extended relative pairs [3-6], consideration of environ-mental risk factors [7-9], and other situations encoun-tered in studies of complex diseases. In concept, for thestudy of complex diseases, the design and execution of asib-pair study is simple. Straightforward power calcula-tions (e.g. [10]) suggest that adequate power to detectlinkage might be obtained with relatively modest samplesizes even for complex, low-penetrance susceptibility syn-dromes. Readily available software packages [11] obtainexact IBD sharing distributions and compute linkage testsusing exact methods without requiring explicit specifica-tion of an inheritance model, penetrance function, or dis-ease allele frequencies. Numerous authors have observedthat nonparametric or model-free linkage statistics, inspite of their name, make hidden assumptions aboutmode of inheritance and penetrance (e.g., [12-14]) whichdetermine the situations in which they become most pow-erful. Nevertheless, these methods have been highly pop-ular because of the ease in implementing them and ininterpreting the results, as well as the perception that they
remain powerful across a broad spectrum of underlyinggenetic mechanisms.
The modern approaches to identifying new genes associ-ated with disease allow very fine analysis of associatonand can be performed in population based case-controlstudies. However, the sibpair design is still valuablebecause it requires few assumptions other than acceptablyhigh penetrance to identify genetic loci. There remainsskepticism about relying solely on genome-wide-associa-tion studies [15], and sib-pair studies continue to be uti-lized and published in the literature [16-18]. Whileassociation based studies have provided many novelinsights into the genetic architecture of complex diseases,they require that linkage disequilibrium is presentbetween genetic markers and disease causing variants.Such a requirement might not be met for diseases that aredue to susceptibility loci undergoing recurrent mutations[19] or for genomic regions that show copy number vari-ation and so do not yield reliable SNP data without theimplementation of specialized procedures because ofdeviations from Hardy-Weinberg disequilibrium [20].
Sibships and small families are relatively easy to identifyand recruit (compared with designs that make use of largemultiplex families). Moreover, a number of familial dis-ease registries and high-risk clinics have been establishedand have enrolled substantial numbers of sib pairs andother groupings of affected relatives, so that in many casesrecruitment has already occurred. In practice, however,the design of an effective small-family linkage studyrequires more care than is immediately apparent, particu-larly for complex diseases such as cancer, in which lateonset, incomplete penetrance, large numbers of pheno-copies, gene-environment interaction, and locus hetero-geneity must be anticipated. The purpose of this paper isto evaluate the impact of choices of family sampling strat-egies in selecting the design of a study aimed at identifyingnovel genetic factors that predispose individuals to coloncancer. The study is a collaborative effort by two NationalCancer Institute-sponsored consortia investigating thegenetics of cancer: the Cancer Genetics Network (CGN)and Cooperative Family Registry for Colon Cancer Studies(CFRCCS).
All population based studies of colon cancer have docu-mented its strong familiality [21-24]. Historical cohortstudies show an approximately 2.5 fold increased risk forcolorectal cancer in the first degree relatives of colorectalcancer cases compared to first degree relatives of unaf-fected controls [25-28]. Nongenetic factors specificallyimplicated as protecting individuals from risk for coloncancer include use of nonsteroidal anti-inflammatorydrugs, a diet rich in leafy vegetables, and exercise [29-34].Although these environmental risk factors have been
Page 2 of 17(page number not for citation purposes)

BMC Medical Genetics 2008, 9:64 http://www.biomedcentral.com/1471-2350/9/64
identified as substantially affecting the risk for colon can-cer they display only a weak correlation in family mem-bers, which is insufficient to explain the high familial risk[35]. Moreover, Khoury, et al. [36] point out that both thecorrelations of exposure among siblings and relative risksdue to shared exposures need to be very large in order toproduce observable increases in relative risk to siblings ofcases. It seems unlikely that such a combination of highlycorrelated exposures and large relative risk exists for color-ectal cancer.
MethodsThe choice of sampling schemes for a colon sibpair studyrequires evaluation, as several different options existsimultaneously for the sampling plan (how many familiesand which relatives to sample), disease model (pene-trance, allele frequency, etc), and statistical test of linkage.These aspects, in addition to the method of generating thedata sets for the simulations comprise the methods ofdetermining an optimal design strategy for a colon sibpairstudy. In our analysis of design issues we have pursued adeterministic simulation approach. The first step was tocheck that the tests we considered had appropriate size,using extensive simulations. For those tests that werevalid, we then performed a moderate number of simula-tions of a large number of families, to obtain the noncen-trality parameters describing the behavior of each designconfiguration and test. We were then able to compare theattributes of these studies across the different design con-figurations genetic models and tests by fitting regressionmodels, as further described below.
Disease Model Parameter ChoicesGenetic HeterogeneityThe genetic basis of many complex human diseases,including some common cancers, is known to includemutations in loci that confer a high penetrance to carriers.In order to minimize the impact that such genetic hetero-geneity may have on the statistical efficiency to identifynovel loci, gene-hunting studies are often restricted tothose cases that have been determined not to be related toany known susceptibility locus. For example, the secondsusceptibility locus for breast cancer, BRCA2, was mappedby Wooster et al. [37] based on high-risk families forwhom BRCA1 linkage was excluded. Genetic syndromessuch as juvenile polyposis, Peutz-Jeghers syndrome andfamilial adenomatous polyposis can be readily eliminatedprior to sample collection on the basis of phenotypic char-acteristics. However, mutations in mismatch repair(MMR) loci such as hMSH2 or hMLH1 cannot beexcluded without performing molecular studies. (Meas-ures of tumor microsatellite instability or immunohisto-chemistry can be helpful in identifying likely carriers, butare neither fully sensitive nor specific.) Estimating the pro-portion of affected families that might be excluded from
analysis because they carry MMR mutations is difficult.Population-based estimates of the prevalence of germ-lineMMR mutations among subjects diagnosed with colorec-tal cancer vary widely even within populations of Euro-pean descent [38-41], and only a few estimates areavailable for other ethnic groups [42,43]. Moreover,recruiting from high-risk clinics may lead to dispropor-tionate over-representation of families who have MMRmutations. One large study in Finland [44] found that12% of affected sib pairs (ASP) showed MMR defects.
The basic assumption for our studies was thus a two-locusnon-interacting model, with a rare high-penetrance gene(e.g. hMSH2/hMLH1 for HNPCC in the case of colon can-cer), unlinked to the search region for new loci and a morecommon but less penetrant gene being sought by the link-age analysis. We also evaluated the effect of experimentalelimination of a previously-known predisposition syn-drome such as HNPCC. We investigated both the powerand the relative efficiency of different designs under arange of assumptions about the contribution of an addi-tional unlinked locus. The single unlinked locus with var-ying allele frequency and penetrance that we simulatedcould also approximate the effects of a few unlinked non-interacting alleles. Although our efforts focused on a studyof colorectal cancer, the general issues identified above aresimilar to considerations encountered in the design ofgenetic studies of other common conditions such as othercancers, diabetes, hypertension and many other chronicdiseases that arise from both environmental and geneticcauses.
Allele Frequency and PenetranceMost of the models we studied include a two-locus non-interacting model for which neither locus had beenmolecularly determined and only one was linked to themarkers under consideration. The unlinked locus variedin allele frequency and penetrance. In some simulationsthe unlinked locus had no effect on disease, but in othersthe penetrance and/or allele frequency were assumed tobe greater than that of the linked locus. The two loci con-tributed multiplicatively in a logistic model for pene-trance of the form
logit Pr(Y = 1|G1, G2) = α + β1Dom(G1) + β2Dom(G2)
where Dom(G) indicates a dominant coding of the geno-type, i.e. presence of one or two copies of the deleteriousallele identically increases the risk of the disease. We alsosimulated some situations in which only one autosomaldominant predisposition syndrome was present in thepopulation.
In the U.S. population, lifetime risks for colorectal cancerare approximately 2.5–5 percent [45]. In the context of a
Page 3 of 17(page number not for citation purposes)

BMC Medical Genetics 2008, 9:64 http://www.biomedcentral.com/1471-2350/9/64
high-risk cancer clinic, however, patients are frequentlyseen at younger ages, and hence the background risk ofcolorectal cancer among sibships ascertained throughhigh-risk clinics is considerably less than 5%. We set thenatural log of the background rate of colorectal cancer inour simulations to α = -4, so that the overall populationprevalence of disease was approximately 2%. Objectiveestimates of allele frequencies and relative risks forunknown mutations are not available, so we chose valuesthat were consistent both with frequencies of knownmutations [46,47] and with population attributable riskestimates for familial colorectal cancer [24,48]. As anexample, with an allele frequency of q1 = 0.003 and a logrelative risk of β1 = 3 (relative risk = 20.1), q2 = 0.001 andβ2 = 4.6 (relative risk = 99.5), the resulting penetrances are0.018 for carriers of neither mutation, 0.268 for carriers ofa mutation in the linked gene, 0.646 for carriers of a muta-tion in the unlinked gene, and 0.973 for carriers of bothmutations. The linked locus accounts for approximately7.2% of colorectal cancers and the unlinked locusaccounts for approximately 6.0% of colorectal cancers.Table 1 lists the parameters that we used in combinatiosfor the simulations, along with the values we assigned invarious simulations.
Sampling PlansThe primary concern in the design of CFRCCS-CGN coloncancer study is to maximize the relative efficiency per gen-otype, i.e., to find the combination of family structuresand numbers of families that will produce the greatestpower for a given number of genotypings. While thenumber of ASPs available for study will affect the powerof the study, at the time when we were designing thestudy, approximately 425 ASPs (plus about 400 other rel-
ative pairs) were already available from the combinedCFRCCS resources, and samples were already availablefrom many of the potential subjects. An additional 500+sib pairs were anticipated from the CGN sites. Thus, theprimary constraint was the total cost of genotyping in afull genome scan, not the number of families. We there-fore chose to concentrate on four main questions of effi-ciency: 1) whether (and how many) unaffected sibsshould be genotyped, 2) how critical the absence of paren-tal genotypes is to the efficiency of the analysis; 3) the rel-ative loss in efficiency of genotyping spouses andoffspring of a deceased affected sib, and 4) how differentstrategies for addressing genetic heterogeneity might affectthese efficiency comparisons.
Although our primary interest was in the relative effi-ciency per genotype, we also wished to observe the effectson overall power and sample size requirements. We wereparticularly interested in the question of whether the totalnumber of families that might be available for study inthis large collaborative project would be adequate for thedetection of linkage given a set of realistic assumptionsconcerning the genetics of colorectal cancer susceptibility.
Linkage Tests for Concordant and Discordant Sib PairsModel-free linkage analysis is usually based on a compar-ison of the observed number of alleles at a marker locusshared identical by descent (IBD, i.e., derived from a com-mon ancestor) between pairs of relatives with given phe-notypes with that expected simply on the basis of theirrelationships. However, IBD status can only be deter-mined unambiguously when both parents are differentheterozygotes. Since late-onset diseases such as colon can-cer severely restrict the availability of parental genotypes,
Table 1: Parameters employed in simulations
Parameter Simulated Values
Families 500Affected Sibs Total 2, 3Affected Sibs Genotyped 1, 2, 3Unaffected Sibs Total 0, 1, 2, 3Unaffected Sibs Genotyped 0, 1, 2, 3Parents Genotyped 0, 1, 2Offspring Proxies 0, 1, 2Screen for Unlinked Syndrome No, YesPopulation Disease Prevalence 0.02, 0.05Mode of Inheritance Autosomal DominantRelative Risk to Carriers 10, 20Number of Disease Loci 0, 1, 2Disease Allele Frequency 0.003, 0.005, 0.01Marker Spacing (cM) 5.0, 10.0Admixture Models: Population 1 (80%) Population 2 (20%)Marker Allele Frequencies [0.25, 0.25, 0.25, 0.25] [0.1, 0.2, 0.3, 0.4]Disease Allele Frequencies [0.00325, 0.0035] [0.002, 0.001]
Parameters and parameter values employed in the simulations
Page 4 of 17(page number not for citation purposes)
BMC Medical Genetics 2008, 9:64 http://www.biomedcentral.com/1471-2350/9/64
the first step is to estimate the IBD probabilities from themarker data on all available pedigree members, using sta-tistical approaches such as those as implemented in suchsoftware as GENEHUNTER [49], GENIBD [50], Simwalk 2[51], or Merlin [52]. The family structure to be analyzedcan include parents, affected and unaffected sibs, as wellas the spouse and offspring of an unavailable affected sibif they were sampled.
For the simulation studies reported here, we comparedthe power and efficiency of two tests: the classic "meanstest" for linkage [53], which compares the observed pro-portion of alleles shared IBD against the expected propor-tion of 0.5; and a modified means test which comparesthe observed proportion of alleles shared IBD amongASPs with the observed proportion shared IBD amongdiscordant sib pairs. The latter test has been suggested tocontrol for potential bias (as discussed below) as well asto improve power. For this analysis, we followed the gen-eral approach described by Guo and Elston [54] but withmodifications. Since combinations of pairs of IBD valueswithin a family are not independent [55], we constructedthe test using the mean IBD sharing among pairs of eachtype (concordant affected and discordant) within eachfamily. We allowed for the correlation in mean IBD valuesfor the concordant affected and discordant sib pairs byconstructing a paired t-test that allowed for the correlationin mean IBD values between the sets of concordant anddiscordant pairs. Specifically, letting pfjki denote the esti-mated probability that sib pair (j, k) in family f = 1,. . .,Fshares i = 0,1,2 alleles IBD, we first computed the mean pcfof (pfjk1/2 + pfjk2) in all affected pairs in family f and thecorresponding mean pdf in discordant pairs in the samefamily. We then computed the means pc and pd and stand-ard deviations sc and sd of these quantities across families,and conducted a standard one-sample t-test comparing pcto 1/2 and a two-sample t-test comparing pc to pd, where Fis the total number of families in the sample:
Zc = √F (Pc - 1/2)/Sc
Zd = √F (Pc - Pd)/√(Sc2 + Sd
2)
both of which are tested against a standard Normal distri-bution. Note Zd does not take account of the correlation inIBD status between the two types of pairs within a sibship,so we used a paired t-test to allow for this, i.e.,
Zp = √F (Pcf - Pdf)/Sw
where sw denotes the empirical standard deviation of pcf -pdf across families.
Simulation MethodsFor a given family structure and choice of parameters(described below), we simulated phenotype and markerdata as follows. First, we generated genotypes G at the twodisease loci by sampling from their respective populationdistributions (commonly called gene dropping). We thenretained the simulated genotype vector with probabilityPr(Y|G), where Y = (1,...,1,0,...,0) denotes the phenotypevector of the sibship under the design being considered(with D affected (Yi = 1) and U unaffected (Yi = 0) mem-bers). This process was continued until the total samplesize of F families was ascertained. For each family struc-ture, marker data were then simulated conditional on thegenotypes at the linked locus. We assumed each markerlocus had four alleles and that it was linked to the diseaselocus with two different recombination values of 5 and 10centiMorgans between the disease and marker loci.
Regardless of the number of markers, marker alleles weresimulated by dropping, for each parent, the parental allelecorresponding to the chromosome of origin of the alleleinherited at marker l - 1 with probability 1 - θl, or theopposite chromosome with probability θl, for marker locil = 1 ... L, l = 0 at the disease locus, where θl is the proba-bility of recombination between loci l - 1 and l. All markeralleles were independent of the second (unlinked) diseaselocus, if one was employed in a given simulation.
We computed IBD probabilities for each marker locus byenumerating all possible alleles for each untyped founderand all possible segregation indicators for all nonfoundersthat are consistent with the observed marker data. Wethen accumulated the probabilities pfjki of each of theseconfigurations into an array [56]. These probabilitiesdepend upon the population marker allele frequencies,which we estimated in each replicate by a simple countingprocedure from all the subjects available for study [57].We did not adjust for correlations among family membersas the estimates of allele frequencies so obtained are con-sistent [57] and are accurate for the large number of fam-ilies we are here evaluating in each simulation.
In order to compare the test size of each linkage test weemployed, we carried out 10,000 replicate simulations ofF = 100 families under the null hypothesis of no linkagebetween the marker and either disease locus. For theseanalyses, we simulated families of two affected sibs, bothgenotyped, and two unaffected sibs, both genotyped.
We also considered the behavior of multipoint variants ofthe Zc and Zp statistics under the null. To calculate these,we initially simulated six markers with four alleles eachspaced at 10 cM intervals, and obtained multipoint esti-mates of pairwise IBD sharing at 20 cM from the originusing the program Merlin [58], then calculated Zmc and
Page 5 of 17(page number not for citation purposes)

BMC Medical Genetics 2008, 9:64 http://www.biomedcentral.com/1471-2350/9/64
Zmp using the formulas given above. The disease geneswere unlinked to the six markers. We then repeated thesimulations after reducing the marker distance by half. Wedid not go below 5 cM.
For each non-null simulation, we generated 20 replicatesimulations of F = 500 families each. As a measure of costefficiency per genotype, we divided the average Zc
2 (or Zp2)
scores across the 20 replicates by the number of genotypesrequired, and reported the ratio (times 100) of this valueto that based on Zc
2 for families consisting only of twosampled affected sibs. We call this the asymptotic relativeefficiency (ARE). We chose to generate 20 replicate obser-vations for any given combination of parameter valuesbecause we wished to simulate a wide variety of non-nullconditions, while producing an adequate number of rep-licate observations to obtain reliable estimates of noncen-trality parameters.
The number of families F required for a desired level ofpower sample was calculated in the standard way [59] bysolving
for F, where Zα and Z1-β are the quantiles of the standardnormal distribution for selected values of α and β, andZsim is the sample mean of the Z-scores (Zc or Zp) based onthe sample size Fsim of the simulation run.
Comparison of Sampling Strategies
The relative efficiency and absolute power comparisonswere evaluated over a range of assumptions about diseaseallele frequency, penetrance, and heterogeneity. Summa-ries are provided for the relative efficiency from the non-null simulations of each combination of parameters andsample sizes required to attain 80% power. Our simula-tions involved the manipulation of 16 parameters, withover 725,000 possible combinations arising just amongthe limited set of settings we chose for each parameter. Inpractice, we were able to simulate 20 replicates for 332actual parameter combinations. In order to assess theimpact of each variable parameter setting on the powerand efficiency of each study design, and to facilitate gen-eralization of our results to other similar situations thatwe did not specifically simulate, we constructed linearregression models of the square root of the per-family
contribution to the noncentrality parameter (Zsim/ )
and ARE estimates resulting from each simulation as afunction of the simulation parameters. Residuals from themodels were approximately normally distributed, and
scale-location plots did not suggest the data were hetero-scedastic. We evaluated the fit of alternative regressionmodels with quadratic, inverse, or logarithmic transfor-mations of both the predictor and outcome variables;none fit the observed data better than a simple linear mul-tiple regression model. The proportion of variance in
Zsim explained by the linear regression (R2) ranged
from 70–75%. The open source statistical package R [60]was used to perform all regression analyses.
In order to facilitate interpretation, the genetic effects(baseline disease prevalence, allele frequencies, and rela-tive risks of the linked and unlinked loci) were collapsedinto "attributable risks" (AR) for the linked and unlinkedloci respectively. The attributable risk is the proportion ofthe total disease risk attributable to variation at eachgenetic locus. The fit of linear regression models employ-ing the two AR values is as good as those employing thefive original terms to fit the data, using the Akaike Infor-mation Criterion (not shown; [61]).
ResultsTest SizeIn Tables 2 and 3 we compare the performance of eachlinkage statistic under the null hypothesis of no linkage toits asymptotic expectation. The values in Tables 2 and 3were obtained for 10,000 replicate observations of adesign with two affected sibs (both sampled), and twounaffected sibs (both sampled), with no parents or off-spring sampled. The observed mean and standard devia-tion of each statistic is reported, along with theprobability of Type I error for assumed one-tailed testsizes ranging from 0.1 to 0.0005. Overall, the concordanttest, Zc, and the paired test, Zp, most closely matched thenominal test size. Both the mean and standard deviationof Zc were close to theoretical expectations. The standarddeviation of Zp was only slightly larger, and the mean wasslightly less than zero (0.05 > p > 0.01). The standard devi-ation of Zd was about 9% larger than expected, so the sig-nificance of tests based on this statistic will be overstatedunless adjustments are made. We therefore omit Zd fromfurther consideration.
The mean multipoint estimate of allele sharing was signif-icantly below 0.5 for concordant pairs in these null simu-lations, leading to a conservative bias in Zmc. Zmp is alsoconservatively biased, but much less so, because the statis-tic compares estimated sharing between concordant pairswith estimated sharing between discordant pairs, which isalso estimated to be significantly less than 0.5 by themultipoint algorithm. Schork and Greenwood, Cordell,and others [62,63] recently demonstrated the bias towardthe null that occurs when using an NPL statistic with anincompletely informative marker unless an adjustment is
Z Z
FZsimFsim
α β+ − =1
Fsim
Fsim
Page 6 of 17(page number not for citation purposes)

BMC Medical Genetics 2008, 9:64 http://www.biomedcentral.com/1471-2350/9/64
made for incomplete marker informativity. Since markerinformativity decreases with increasing marker intervals,the increasing conservativism of the Zmc with increasingmarker intervals is not surprising.
When we ran null simulations in the presence of hetero-geneity of marker alleles, disease alleles, or both, weobserved that Zc and Zp behaved differently depending onthe heterogeneity model we simulated. Although Zp wasconservatively biased when disease allele frequencies dif-fered between populations, regardless of whether marker
allele frequencies differed, its small conservative bias wasnot significantly different from that observed in thehomogeneous population of Table 2. In contrast, Zcexhibited an anticonservative bias when marker allele fre-quencies differed between populations, regardless ofwhether disease allele frequencies differed.
Alternative Model Simulation ResultsA subset of results from alternative model simulations inwhich there were linkages are given in Table 4, based on20 replicate simulations for each combination of parame-ters. The numbers given represent mean Z statistics, theirARE values, and sample sizes required to attain 80%power. The results displayed were chosen to highlight theeffect of sampling (and genotyping) varying the numbersof unaffected sibs and/or parents from families with twoor three affected sibs and two unaffected sibs. Full resultsare available online [64]. On average, the concordant testwas always more efficient on a per-genotype basis thanthe paired test, although the power of the paired test wasusually greater when the number of unaffected sibs testedwas > 2.
Regression Models
Table 5 shows the effect of various design and populationparameters on the noncentrality parameter for both the
concordant-only test (Zc/ ) and the paired test (Zp/
). The only change in parameterization of the modelfor the paired test vis-a-vis the concordant test involvedsubstituting the number of typed unaffected sibs for the
F
F
Table 2: Simulation results
Statistic
One-Tailed p Zca Zd
b Zpc Zmc
d Zmpe
0.1 0.0987 0.1169 0.0966 0.0663 0.09710.05 0.0505 0.0637 0.0451 0.0317 0.04730.01 0.0107 0.0170 0.0094 0.0028 0.0039
0.005 0.0053 0.0097 0.0048 0.0003 0.00100.001 0.0013 0.0022 0.0008 0.0001 0.0006
0.0005 0.0010 0.0013 0.0004 0.0001 0.0000Mean -0.005 -0.004 -0.0175 -0.246 -0.036
SD 1.002 1.087 1.004 1.015 1.016p-valuef 0.309 0.356 0.041 < 0.0001 0.0002
Observed versus expected distributions of linkage test statistics, based on 10,000 simulations of 100 families with the following configuration: 2 affected sibs, both sampled, and 2 unaffected sibs, both sampled, disease locus unlinked to markers (null model).amean concordant test; bmean discordant (unpaired) test; cmean paired test; dmean multipoint concordant test (10 cM spacing between markers); emean multipoint paired test; fp-value of test that mean does not equal 0;
Table 3: Simulation results under varied conditions of heterogeneity
Heterogeneity Model
Disease Allele Onlyg Markers Onlyh Disease and Markersi
One-Tailed p Zc Zp Zc Zp Zc Zp
0.1 0.0966 0.0939 0.1153 0.1022 0.1038 0.09510.05 0.0471 0.0426 0.0626 0.0515 0.0527 0.04420.01 0.0087 0.0084 0.0139 0.0096 0.0113 0.0088
0.005 0.0043 0.0034 0.0078 0.0044 0.0055 0.00340.001 0.0011 0.0006 0.0015 0.0005 0.0014 0.0008
0.0005 0.0009 0.0003 0.0006 0.0004 0.0006 0.0003Mean -0.015 -0.027 0.059 -0.007 0.041 -0.026
SD 1.001 1.007 1.019 1.017 1.004 1.008p-valuef 0.067 0.0037 < 0.0001 0.246 < 0.0001 0.0049
Observed versus expected distributions of linkage test statistics under varying conditions of disease allele and/or population heterogeneity in marker allele frequencies, based on 10,000 simulations of 100 families with the following configuration: 2 affected sibs, both sampled, and 2 unaffected sibs, both sampled, disease locus unlinked to markers (null model).emean multipoint paired test; fp-value of test that mean does not equal 0; gtwo populations modeled in an 80%/20% mixture: 1) marker allele frequencies for all markers [0.25,0.25,0.25,0.25], unlinked disease allele 0.0035; 2) marker alleles [0.25,0.25,0.25,0.25], unlinked disease allele 0.001; htwo populations modeled in an 80%/20% mixture: 1) marker allele frequencies for all markers [0.25,0.25,0.25,0.25], unlinked disease allele 0.003; 2) marker alleles [0.4,0.3,0.2,0.1], unlinked disease allele 0.003; itwo populations modeled in an 80%/20% mixture: 1) marker allele frequencies for all markers [0.25,0.25,0.25,0.25], unlinked disease allele 0.0035; 2) marker alleles [0.4,0.3,0.2,0.1], unlinked disease allele 0.001.
Page 7 of 17(page number not for citation purposes)

BMC Medical Genetics 2008, 9:64 http://www.biomedcentral.com/1471-2350/9/64
total number of unaffected sibs. The AR for the linkedlocus had the largest positive effect on power of the con-cordant test, followed closely by the negative effect onpower of increasing AR at the unlinked locus and increas-ing recombination fraction between the marker and traitloci. Increasing the number of affected sibs per family andincreasing the number of affected sibs genotyped per fam-ily both substantially improved power. The number ofunaffected sibs present in sampled families had little orno effect on power. Increased power was also observed forincreasing numbers of available parents, the size of the
effect on Zc/ being about 15% of the effect of increas-
ing numbers of affected sibs. Substituting spouse and off-spring for an unavailable affected sib reduced powersubstantially, but genotyping a second child recoveredmuch of that lost power.
In general, the effects on power of changes to the geneticand design parameters were very similar for the discordanttest. Increasing the number of unaffected sibs typed didyield a small increase in power, but increasing the numberof affected sibs, parents or offspring proxies increased
F
Table 4: Alternative Model Simulation
Model A – no heterogeneity:Affected Sibs Unaffected Sibs
Parents Total Sampled Total Sampled Zc Zp ARE(Zc) ARE(Zp) Nc(80%) Np(80%)
0 2 2 2 0 3.19 100 3040 2 2 2 1 2.70 2.42 72 38 424 5280 2 2 2 2 3.03 3.17 90 49 337 3080 3 2 2 0 6.09 364 830 3 2 2 1 6.46 6.00 410 236 74 860 3 2 2 2 6.12 6.47 368 206 83 742 2 2 2 2.88 41 3732 2 2 2 1 3.17 2.69 49 28 308 4272 2 2 2 2 3.17 3.33 49 36 308 279
Model B – less common, equally penetrant locus:
0 2 2 2 0 2.37 100 5500 2 2 2 1 3.04 2.88 165 98 334 3730 2 2 2 2 2.73 2.81 133 70 415 3910 3 2 2 0 4.66 387 1420 3 2 2 1 5.29 5.11 498 310 110 1180 3 2 2 2 4.86 5.18 421 239 131 1152 2 2 2 0 2.73 66 4152 2 2 2 1 2.46 2.22 54 35 511 6272 2 2 2 2 2.92 2.95 76 52 363 355
Model C – equally common, equally penetrant locus:
0 2 2 2 0 2.38 100 5460 2 2 2 1 1.93 1.95 66 45 830 8130 2 2 2 2 2.33 2.36 96 49 569 5550 3 2 2 0 3.45 210 2600 3 2 2 1 3.47 3.33 213 131 257 2790 3 2 2 2 3.48 3.84 214 130 255 2102 2 2 2 0 2.26 45 6052 2 2 2 1 2.56 2.44 58 42 472 5192 2 2 2 2 2.22 2.14 44 27 627 675
Mean Z score, asymptotic relative efficiency per genotype (ARE–see text), and sample size required to attain 80% power for two-point linkage (θ = 0.05) for predisposition to colorectal cancer with a baseline risk of 0.018, a relative risk to carriers of 20, allele frequency of 0.003, with a lifetime penetrance of 0.27, under 3 different heterogeneity models: A) no heterogeneity; B) an equally penetrant, less common (allele frequency 0.001) unlinked predisposing locus; C) an equally penetrant, equally common unlinked predisposing locus. All results based on 500 simulated families and 20 replicate simulations per parameter set.Zc mean concordant test; Zp mean paired test; ARE(Zc) asymptotic relative efficiency concordant test; ARE(Zp) asymptotic relative efficiency paired test; Nc(80%) number of families required for 80% power using concordant test; Np(80%) number of families required for 80% power using paired test.
Page 8 of 17(page number not for citation purposes)

BMC Medical Genetics 2008, 9:64 http://www.biomedcentral.com/1471-2350/9/64
power by a larger amount, even with the discordant pairtest.
The effect of experimental screening for the unlinked syn-drome varied substantially depending on the relativemagnitude of the effects of the unlinked syndrome: if theunlinked syndrome had an attributable risk greater thanor equal to that of the linked syndrome, experimentalscreening resulted in a large increase in power. Otherwise,the effect of experimental screening was negligible.
Power for a given sample size F and test size α with a spec-ified combination of design and genetic parameters canbe derived from the regression models in Table 5 by firstobtaining an estimate of the noncentrality parameter Z/
from the appropriate column of Table 4, multiplying
by to obtain , and then solving for β in the equa-tion below:
where β is the probability of Type II error (hence power is1-β) and Φ(z) is the cumulative standard normal distribu-tion. A script for computing the predicted power for anyparticular combination of these parameters, using the sta-tistical languages S-plus or R is also available from thewebsite [65].
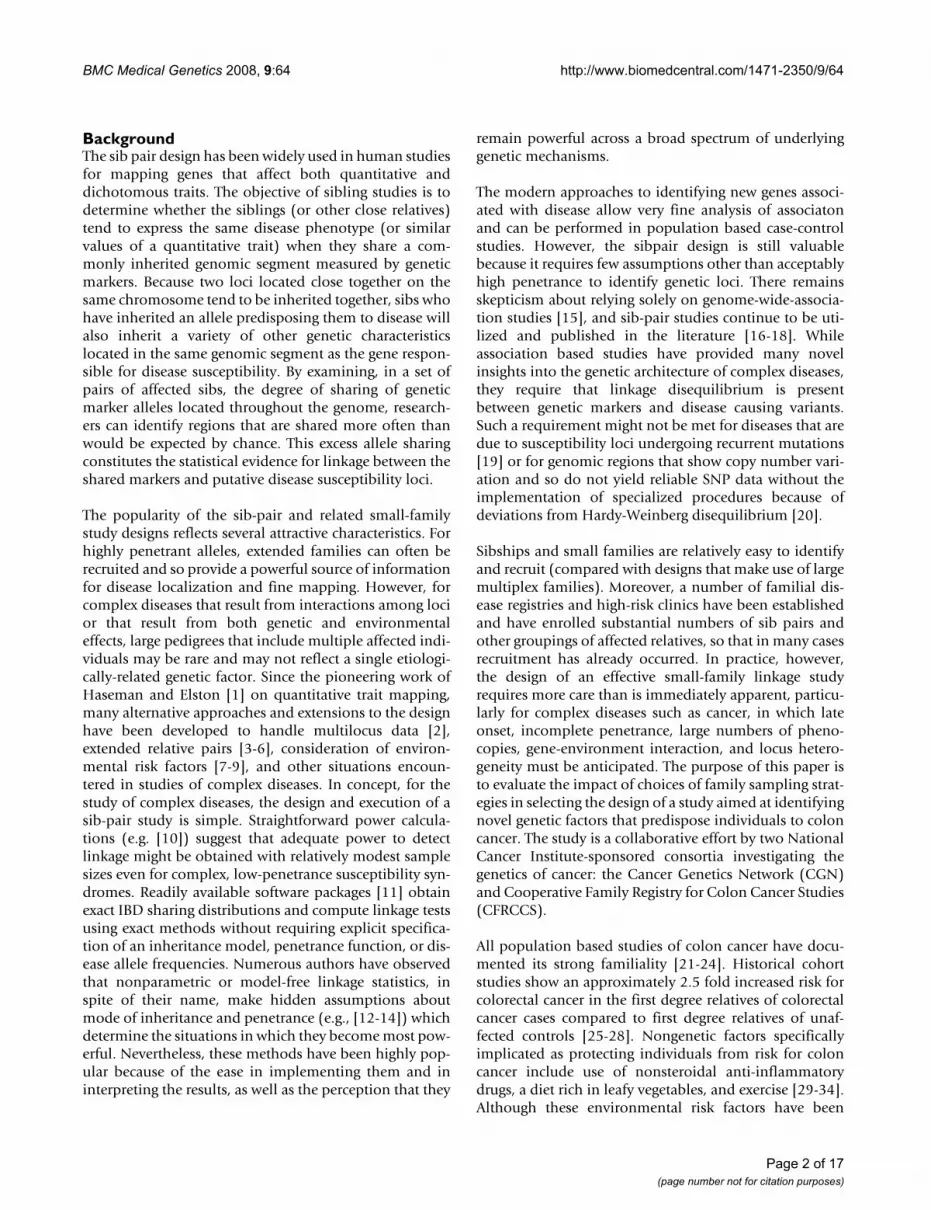
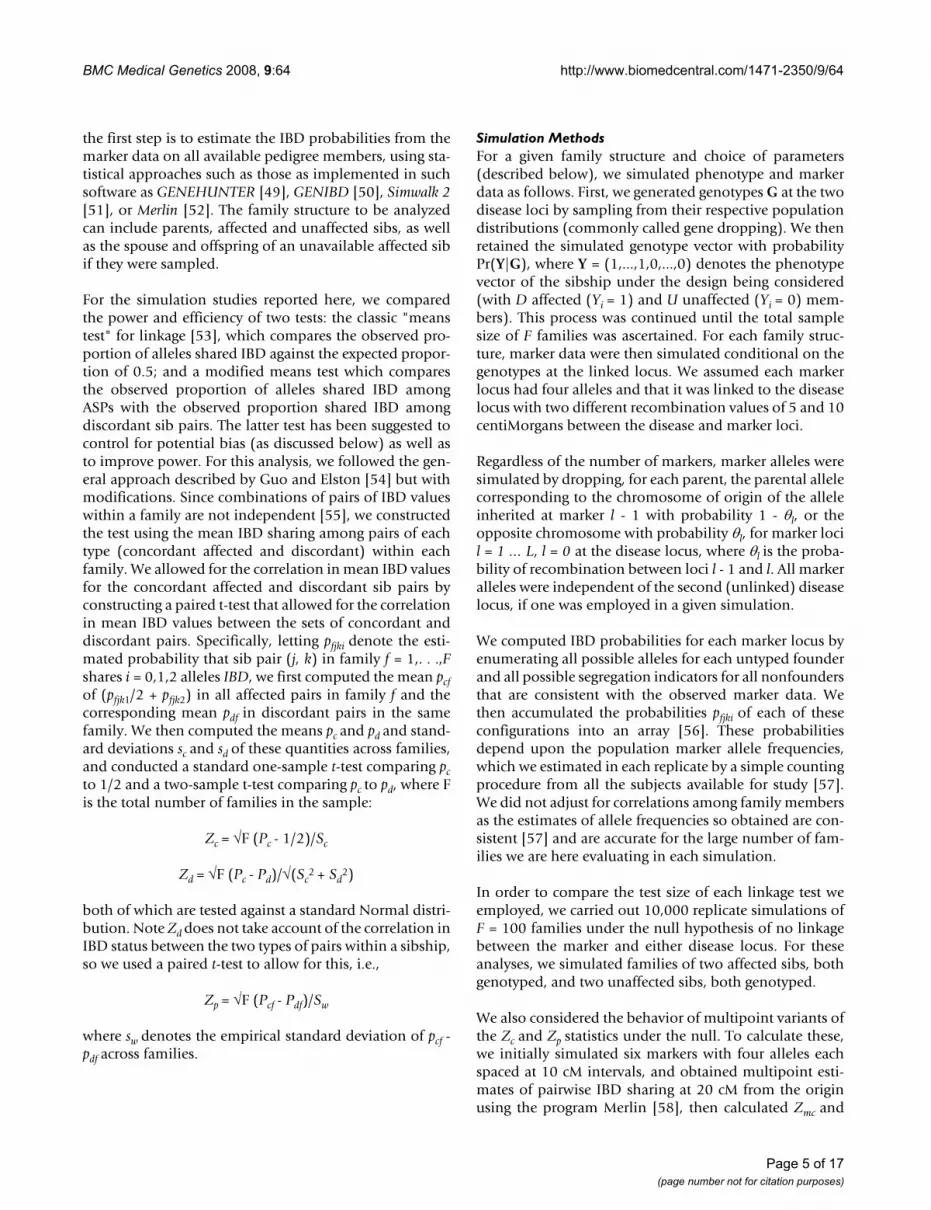
Figures 1, 2, 3, 4, 5, 6 show estimated power of the Zc testfor varying sample sizes given several values of AR for thelinked and unlinked loci, recombination fraction (θ),number of parents genotyped, and number of offspringproxies. Except as noted, the power estimates are based onthe following settings of the genetic and design parame-ters: two total affected sibs, both sampled, two unaffected
sibs (not sampled), no parents or offspring proxies, AR1(linked locus) = 0.1, AR2 (unlinked locus) = 0.05, θ =0.05, and no screening to exclude unlinked families.
Relative Efficiency of Alternative DesignsBecause the power of the discordant test was rarely muchgreater than that of the concordant test, and the concord-ant test requires genotyping of only the affected sibs, theARE of the concordant test was always greater on averagethan that of the discordant test. Nevertheless, we wereinterested in specific combinations of design and geneticparameters that might have resulted in better relative effi-
F
F z
β α= −Φ( ),Z z
Table 5: Effect of design and population parameters or non-centrality parameters
Simulated Range Zc/√F Zp/√F
Estimate SEa Estimate SE
(Intercept) -0.3392 0.0064 -0.2941 0.0085Recombination Fraction 0.025–0.25 -0.5783 0.0247 -0.5757 0.0228Total Affected Sibs 2–3 0.0948 0.0020 0.1088 0.0026Affected Sibs Typed 2–3 0.1111 0.0022 0.0670 0.0029Total Unaffected Sibsb 0–3 0.0003 0.0011 0.0043 0.0021Parents Typed 0–2 0.0156 0.0009 0.0099 0.0012Spouse-Offspring Proxy 0–1c -0.0222 0.0028 -0.0179 0.0041Spouse-2 Offspring Proxy 0–1 c -0.0050 0.0027 -0.0050 0.0038AR Linked Locus 0.025–0.12 1.5785 0.0360 1.5154 0.0402AR Unlinked Locus 0.0–0.12 -0.9867 0.0252 -0.7830 0.0295Screen for Unlinked (AR1 > AR2) 0–1 c -0.0016 0.0057 0.0054 0.0053Screen for Unlinked (AR1 ≤ AR2) 0–1 c 0.0666 0.0042 0.0661 0.0040
Multiple linear regression of Z/ on simulation parameters.aStandard error of Estimate; bNumber available for Zc, number genotyped for Zp; cIndicator variable.
F
Effect of sample size and varying attributable risk at the linked locus on estimated powerFigure 1Effect of sample size and varying attributable risk at the linked locus on estimated power.
Page 9 of 17(page number not for citation purposes)
BMC Medical Genetics 2008, 9:64 http://www.biomedcentral.com/1471-2350/9/64
ciency for the discordant test. Overall, the ARE for the dis-cordant test was larger than that for the concordant test in13% of the replications. We used a logistic regressionmodel with the same parameters as those in Tables 2, 3and 4 to predict the probability that Zp would outperformZc in terms of relative efficiency (not shown). Only undercircumstances that would result in very low power, such asattributable risks for the unlinked locus more than twice
as large as attributable risks for the linked locus, or recom-bination fractions > 0.1, was Zp predicted to outperform Zcin our simulated sample of 500 families.
Effect of sample size and varying attributable risk at the unlinked locus on estimated powerFigure 2Effect of sample size and varying attributable risk at the unlinked locus on estimated power.
Effect of sample size and varying recombination fraction on estimated powerFigure 3Effect of sample size and varying recombination frac-tion on estimated power.
Effect of sample size and varying number of typed parents on estimated powerFigure 4Effect of sample size and varying number of typed parents on estimated power.
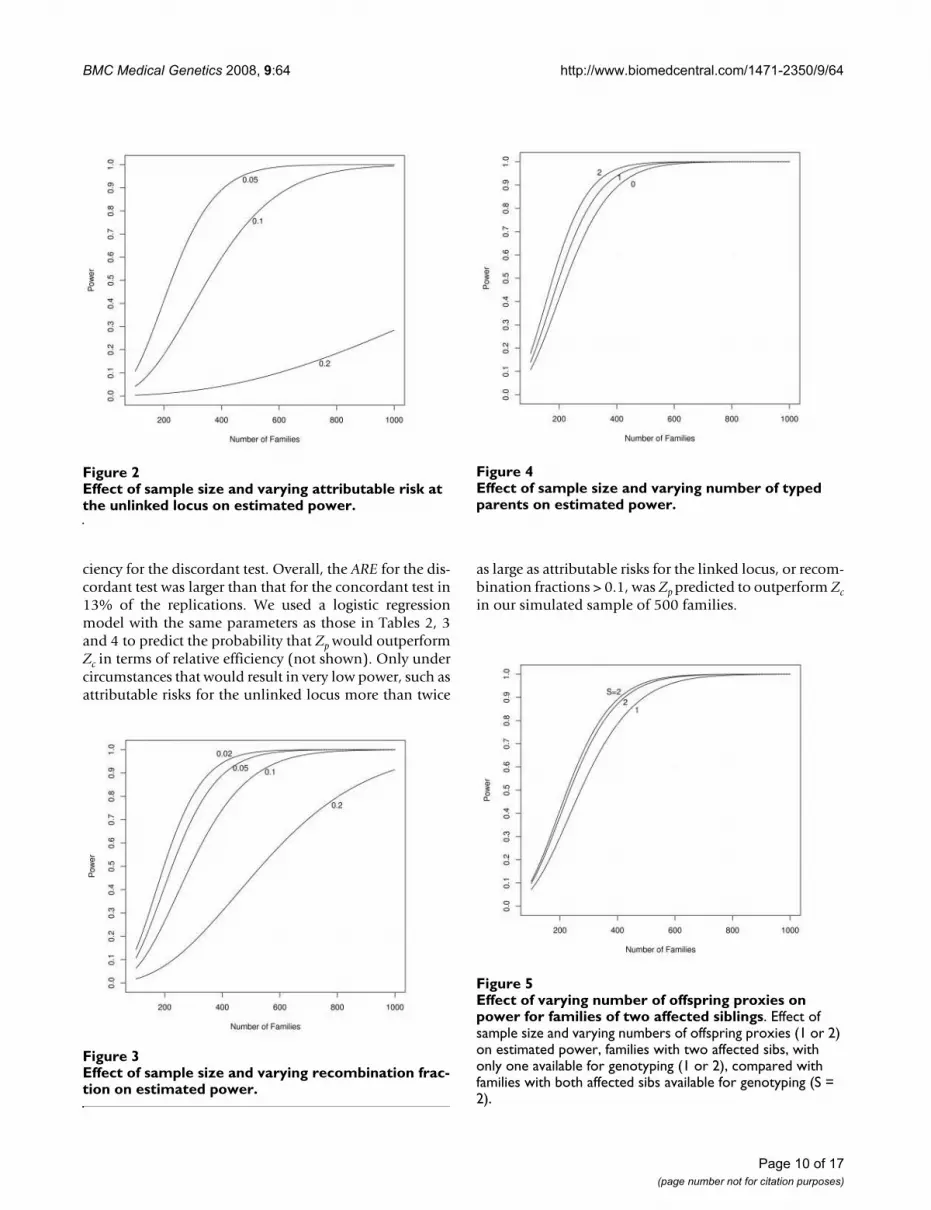
Effect of varying number of offspring proxies on power for families of two affected siblingsFigure 5Effect of varying number of offspring proxies on power for families of two affected siblings. Effect of sample size and varying numbers of offspring proxies (1 or 2) on estimated power, families with two affected sibs, with only one available for genotyping (1 or 2), compared with families with both affected sibs available for genotyping (S = 2).
Page 10 of 17(page number not for citation purposes)

BMC Medical Genetics 2008, 9:64 http://www.biomedcentral.com/1471-2350/9/64
In principle, including genotype data from unaffected sib-lings can improve the ability to estimate haplotypes andthereby improve power when multipoint data are studied.Table 6 compares estimates of Zc and Zp for a selected setof simulations with multipoint Zm scores for the same
families as calculated by the computer program Merlin[58]. In these simulations, when markers were spaced nocloser than 10 cM from one another, as is usually the casein an initial genome scan, we observed no improvementin power with the concordant multipoint statistic, but animprovement in power with the discordant test. Whenmarkers were spaced at 5 cM intervals, however, the powerof both multipoint statistics to detect linkage exceededthat of both Zc and Zp. The conservative bias of Zmc notedin Tables 2 and 3 appears to decrease as marker intervalsbecome smaller. To test this, we conducted additionalsimulations under the null hypothesis as described abovefor Tables 2 and 3, with 1000 repetitions and markersspaced at 5, 10, and 20 cM. The magnitude of the conserv-ative bias in Zmc decreases consistently (mean Zmc = -0.58at 20 cM, -0.23 at 10 cM, and 0.06 at 5 cM) as markerintervals contract, becoming significantly anti-conserva-tive at 5 cM.
Replacement of a missing affected individual by a spouseand offspring is not generally as efficient per genotype asif that individual had been available, although the effi-ciency improves with each additional offspring included.Figure 5 shows the effect of replacing one member of anASP with one or two offspring and the spouse. Figure 6shows the effect of replacing one member of an affectedsib trio with one or two offspring and the spouse. Becausefamilies with three affected sibs are more likely to be seg-regating a disease-predisposing allele than families withtwo affected sibs, each family is more informative for link-age, even if DNA is available for only two sibs. Substitut-ing the spouse and one or more offspring for the missing
Effect of varying number of offspring proxies on power for families of three affected siblingsFigure 6Effect of varying number of offspring proxies on power for families of three affected siblings. Effect of sample size and varying numbers of offspring proxies (O) on estimated power, families with three affected sibs, with only two available for genotyping (O = 0, 1, or 2), compared with families with all three affected sibs available for genotyping (S = 3).
Table 6: Comparison of two-point vs. multipoint linkage scores under various non-null simulation conditions.
Simulation Model Marker Interval Zc Zp Zmc Zmp
No Heterogeneity a 5 cM 3.26 3.24 3.62 3.6010 cM 2.94 2.91 2.85 3.3620 cM 2.36 2.30 2.14 2.52
Locus Heterogeneityb 5 cM 3.10 3.08 3.75 3.5310 cM 2.76 2.70 2.72 3.1320 cM 2.05 2.01 1.91 2.23
Marker Heterogeneity – Mildc 5 cM 2.80 2.72 3.57 3.2410 cM 2.62 2.54 2.59 2.9920 cM 2.22 2.13 2.14 2.35
Marker Heterogeneity- Severed 5 cM 2.10 1.95 2.61 2.3510 cM 1.70 1.56 1.49 1.8620 cM 1.42 1.27 1.18 1.33
All simulations employed 20 replicates of 500 families with 2 affected and 2 unaffected sibs, all sibs typed, no parents or children typed.a Baseline risk of 0.018, a relative risk to carriers of 20, allele frequency of 0.003, with a lifetime penetrance of 0.27, no genetic heterogeneity.b Baseline risk of 0.018, a relative risk to carriers of 20, allele frequency of 0.003, with a lifetime penetrance of 0.27, and a less common (allele frequency 0.001), equally penetrant unlinked predisposition syndrome.c Two populations modeled in an 80%/20% mixture: 1) marker allele frequencies for all markers [0.25,0.25,0.25,0.25], disease allele 0.00325; 2) marker alleles [0.4,0.3,0.2,0.1], disease allele 0.002.d Two populations modeled in an 80%/20% mixture: 1) marker allele frequencies for all markers [0.25,0.25,0.25,0.25], disease allele 0.0035; 2) marker alleles [0.4,0.3,0.2,0.1], disease allele 0.001.
Page 11 of 17(page number not for citation purposes)

BMC Medical Genetics 2008, 9:64 http://www.biomedcentral.com/1471-2350/9/64
sib adds additional power, although at the cost of addi-tional genotyping.
DiscussionIn studying a disease like colon cancer with both incom-plete penetrance and a high incidence of sporadics, priorstudies have shown that to be efficient, families mustinclude two or more individuals with the same diseasefrom whom samples can be obtained. The practical expe-rience of many investigators suggests that once an initialentree is gained into a family, the chances of enrollingother members are quite high. Close relatives are oftenvery motivated to participate in research into a diseasethat has afflicted their family, especially when the com-mitment is minimal, involving only a blood specimenand a signed consent, which are all that are required for alinkage study of diseases that have an easily establishedphenotype, like cancer. In our simulations, we consideredinclusion of unaffected sibs and the use of spouse and off-spring to replace missing affected sibs. Including unaf-fected siblings in the design of a study can improve thepower to detect linkage for highly-penetrant diseases[53,66]. However, our simulation studies demonstratethat for the model-free linkage tests we studied, for lowpenetrance loci, and with no genotyping error, littleincrease in power can be gained by including unaffectedsiblings in the design of a sib-pair study of a late onset,complex disease such as colorectal cancer. The inclusionof unaffected siblings can be useful, however, in reducinganti-conservative biases arising from heterogeneity ormisspecification of marker allele frequencies or genotyp-ing errors, and conservative biases arising if multipointstatistics are used with an insufficiently dense marker set.Table 2 shows that, with markers spaced at 10 cM inter-vals, Zmc is conservatively biased, while exhibiting an anti-conservative bias in Table 3 under conditions ofheterogeneity in marker allele frequencies. In Table 6, Zmpoutperforms with markers spaced at 10 and 20 cM. At 5cM, Zmc becomes anticonservatively biased, as notedabove. It may be useful to perform simulations to assessthe characteristics of the tests when the marker spacingdecreases, as would be possible with the newer SNP array-based platforms. Further, since genome-wide-associationstudies do not utilize the full power of the sibpair design,future research should be aimed at assessing the optimalsetting for relying on the sibpair design, as it is prematureto move completely away from this study design [15].
If a secondary goal of a study is to estimate the penetrance,then unaffected relatives should be included in the designof the study; also unaffected siblings could help in evalu-ating the impact of environmental factors upon diseaserisk. Genotyping errors for microsatellites scans are cur-rently very low but are hard to assess without the availa-bility of parents or siblings. Our findings parallel those of
Holmans et al. [67], who suggested that genotypingaffected individuals only is efficient.
Unaffected siblings can be used for studies that takeadvantage of linkage disequilibrium to identify associa-tions. Colorectal cancer and other late onset diseases withincompletely penetrant susceptibility alleles complicatethe identification of unaffected individuals for associationstudies, because the probability that a person who doesnot currently exhibit the disease will become affectedsometime in the future can be relatively large. In associa-tion studies using families, the oldest unaffected sibling isthe most informative because s/he is more likely to haveattained the age at which all the cases in the family werediagnosed (although Kraft and Thomas [68,69] haveshown how younger siblings can also be used).
The inclusion of unaffected sibs is also advantageous withrespect to the common practice of genotyping in batches,particularly by nuclear family. A correlation may beinduced artificially if the genotyping errors are resolvedwithin families by requiring Mendelian segregation ofalleles, which can lead to false positive evidence for link-age, unless the unaffected relatives are used for compari-son. Such excess evidence for linkage tends to accrue fromthe families with available parents because these pedi-grees are the mostly likely to yield non-Mendelian segre-gation due to genotyping errors, which have to beresolved in turn [70,71]. Good laboratory practicerequires that at least some samples receive duplicate gen-otyping so that it would be possible to identify problem-atic markers showing excess genotyping error rates.Meiotic drive exists in some mammals and if present inhumans could conceivably increase the expected IBDsharing at a locus above 0.5. If meiotic drive is present inhumans then multiple studies of many different diseasesshould show this effect [72].
One sampling option that we have shown can be viableincludes sibships in which an affected member is dead butthe spouse and offspring of the deceased are available,thus effectively increasing the number of pairs and yieldeda total information content per family approaching otherdesigns based on affected sibs. In the context of a high-riskclinic, pursuing the family of a dead sib can be quite laborintensive compared with the cost of recruiting more sib-ships. However, in an established registry, the oppositemay be true, so that extending the relatives to be sampledbecomes a more cost-effective strategy. Such a schemecould be worthy of further consideration in situationswhere the prospects of recruiting additional sibships arelimited. Using spouses and offspring as proxies for miss-ing or deceased sibs is obviously less efficient than had theaffected sibs themselves been available, but still can pro-vide adequate linkage information and may be required if
Page 12 of 17(page number not for citation purposes)

BMC Medical Genetics 2008, 9:64 http://www.biomedcentral.com/1471-2350/9/64
the disease is often lethal so that samples from affectedsibs are hard to obtain. Even when affected siblings areunavailable for study, it is still possible to genotype blocksthat may be available from residual tissues, such as lymphnodes, that were obtained for the purposes of staging.However, genetic analysis of blocks is more difficult thanfrom blood samples because the DNA is partiallydegraded, which may preclude multiplex genotyping.Therefore, genotyping the relatives of the affected but una-vailable cosib may be more efficient than genotypingresidual tissues.
Available parents contributed somewhat to the efficiencyobtained in our simulated linkage studies. There are otherbenefits of including parents when they are available,including greatly reduced sensitivity to allele frequencymisspecification, substantial improvements to haplotypeestimation, and identifying nonpaternities or other errorsin family structure or in genotyping. There are some prac-tical advantages to including both parents of each sibship,whenever possible. However, parents are likely to be avail-able only for a small minority of the families becausemost inherited cancers have a relatively late onset, albeittypically earlier than for sporadic cases. For example, datafrom the high-risk families of the CFRCCS and the popu-lation-based Diet, Activity and Reproduction in ColonCancer (DARCC) study [26] show that about 3–4% of theliving ASPs have two parents alive while about 12%(DARCC) to 22% (CFRCCS) have only one. The sib pairprotocol of the Eastern Cooperative Oncology Group(ECOG) for mapping the interactive susceptibility loci offour major malignancies includes the accrual of parentsonly when both are available. However, their rationale isquite different from that of allele-sharing methodologybecause the parental data are collected for a separate par-allel analysis using the transmission disequilibrium test(TDT) [73].
The family structures that could be studied are not neces-sarily restricted to the sibs of a proband ascertainedthrough a registry or clinic. Consideration should also begiven to collecting the extended family members of theaffected sibs. Familial cancer registries such as theCFRCCS and CGN routinely collect family history fromall their participants. Recent reports indicate that studysubjects are capable of accurately reporting cancer statusamong their close relatives, with accuracy varying by can-cer site and degree of relationship [74]. Pedigrees thatextend to affected aunts and uncles or grandparents of theaffected sibs could be used in a confirmatory analysis forthe source of the segregating disease allele by the methodof Olson and Elston [75], without obtaining their bloodspecimens, by correlating the parent of origin of sharedalleles with the side of the family of the affected aunt oruncle.
For rare autosomal dominant traits, Risch [76] showedthat cousin pairs actually provide more information fordetecting tight linkage than sib pairs. Narod and Amos([77]) also showed through simulation the efficacy ofincorporating cousins in a linkage study of breast cancer,which like colorectal cancer shows genetic heterogeneity,a likely high proportion of phenocopies, and environ-mental and life-style related risk factors. However, Rischalso found that for recessive conditions or when the dis-ease and marker loci were not tightly linked, a sib pairdesign was more effective than other designs. Since themode of inheritance for as yet unidentified genetic factorsremains unknown, the sibship design remains preferableto other family units since it provides power under allgenetic models.
We estimated the numbers of families required to studycolorectal cancer and similar diseases with reasonablepower, if our assumptions about disease allele frequen-cies, mode of inheritance, and heterogeneity are not toofar from the truth. Our simulation studies show that atleast 500–1000 families are required to provide reasona-ble assurance of adequate power across a range of geneticmodels that are consistent with the observed familialityand population prevalence of colorectal cancer. Coloncancer risk is strongly associated with certain environmen-tal factors, some of which might interact with the gene(s)being sought. Although 1000 pairs will most likely pro-vide adequate power to identify genetic risk factors, thefurther delineation of gene-environment interactions mayyet require larger sample sizes [78]. Our simulation studyfocused upon efficiency of various genotypingapproaches, where we assumed that samples from indi-viduals are already available. If samples are not available,then additional design constraints may become impor-tant. For instance, the collection of sib pairs affected bydisease can be a slow process and trade-offs between effi-ciency in genotyping versus power from available samplesmay need to be evaluated.
Because the costs of drawing blood and extracting DNAare far smaller than those of genotyping the 400–1000markers needed for a genome scan, and because the unaf-fected and affected siblings can contribute different infor-mation, we suggest collecting all available members ofeach sibship, but only genotyping affected sibs, parents,and any spouse/offspring proxies for an initial genomescan. DNA from the unaffected sibs may still be useful forfine mapping and association studies and for estimatingthe penetrance. The CFRCCS and DARCC databases indi-cate that about 90% of the living ASPs have at least oneunaffected sib alive, with a mean of about 2.5. Since theoptimal number of unaffected sibs to sample per sibshipif more than one were available has not been resolved, anad-hoc plan may be to obtain the blood specimens from
Page 13 of 17(page number not for citation purposes)

BMC Medical Genetics 2008, 9:64 http://www.biomedcentral.com/1471-2350/9/64
all those who consent. If the genotyping resources wereconstrained (e.g. to at most two unaffecteds per sibship),an efficient protocol is to start with the oldest first-degreerelative and to proceed downwards, i.e. include both par-ents if available, otherwise one parent and the oldest unaf-fected sib, etc.
Population heterogeneity and allele frequencies have animportant impact on the study design. In the absence ofparents, the marker allele frequencies in the study popula-tion have to be estimated as the basis for estimating theIBD probabilities, which requires an assumption ofhomogeneity of marker allele frequencies. Populationheterogeneity arises when the allele frequencies varyacross subgroups, because of demographic, geographical,or other factors. Table 3 shows that an incorrect assump-tion of population homogeneity so the assumption of acommon allele frequency across the entire collection offamilies can bias affecteds-only linkage results, dependingon the degree of admixture and the degree to which theallele frequencies vary among the subpopulations.
We observed moderate to substantial losses of power todetect linkage in the limited number of simulations weperformed with population heterogeneity of this sort (seeTable 6). The use of unaffected sibs provides one means ofovercoming the problem of heterogeneity in marker allelefrequencies, since both concordant and discordant pairstend to be biased in a similar manner by any misspecifica-tion of allele frequencies. To fully exploit this advantage,however, a matched comparison is needed so that theanalysis focuses on the within-family differences in IBDprobabilities between the two types of pairs. This wouldovercome any problems of imbalance in the ethnic distri-bution of concordant and discordant pairs. While this canbe accomplished by means of a simple paired t-test, likeZp, a more sophisticated GEE-2 approach is possible,modeling the entire vector of phenotypes in each familyin relation to its IBD matrix [79]. This would have theadvantage of combining information from both types ofcomparison in a matched fashion, so that all families,including those with no unaffected sibs, would contrib-ute. The simulations summarized in Table 6 do not showany power advantage for either Zp or multipointapproaches under the simulated conditions of populationadmixture, although the anti-conservative bias in Zc underheterogeneity of marker allele frequencies may partiallyobscure a real power difference between the concordantand discordant tests. Population admixture presents a par-ticularly insidious threat to the validity of tests for linkageif parents or unaffected siblings are not available. How-ever, it might be possible to detect population substruc-ture by checking for the departure from disequilibriumthat it engenders.
We did not directly study the asymptotic relative efficiencyof 10 cm versus 5 cm linkage scans. At the time wedesigned our study, the usual practice in genotyping facil-ities is to first apply a 10 cm map and then to follow upwith denser mapping in linked regions. We generallyanticipated that an initial 5 cM mapping strategy is notcost effective and that some version of grid tighteningwould ordinarly be employed [67]. Currently with theavailability of more modern technology, a 10 cM scan isnow considered rather sparse, and the 5 cM scan is consid-ered a better standard, with fine mapping at 1 cM(although you still see published studies that use 10 cMscans; see [16-18]). Many studies now use SNP platforms,although it is not clear whether these are optimal for sib-pair studies. When dense sets of SNPs are analyzed, thereis much more potential for biases to appear if parentaldata are unavailable and linkage disequilibrium amongthe markers is not adequately modeled [80]. Such biasesare reduced when an additional unaffected sibling or aparent is included in the analysis. Other than the need toaddress the potential for bias, the high marker informativ-ity of microsatellites compared with SNPs would suggestthat results from our simulation studies should shed lighton optimal designs for studies of small families, whethermicrosatellites or SNPs are used for analysis.
Crude stratification by recruitment center is unlikely to bereliable enough for controlling population heterogeneitywithout additional adjustment. Stratification by ethnicityis generally more crucial than by geography, althoughboth factors should ideally be incorporated. However,collection of ethnicity is not entirely trivial if it is to beworthwhile. Although various coding systems have beenestablished by different agencies, no consensus has beenestablished regarding the level of detail required on eth-nicity data in genetic research, e.g. category distinctions,mixed-race marriages. Mandal et al. [81] have shown thatmarker allele frequencies are less important if there arefour or more persons per family, especially when very pol-ymorphic markers are used. When the parents of the sib-pair have been genotyped, then there is no dependence onpopulation marker allele frequencies and no source ofbias in linkage analysis.
ConclusionWe have shown that for a wide variety of situations rele-vant to sib-pair studies of colon cancer and similar late-onset complex diseases, standard concordant-pair allele-sharing statistics based on identity by descent probabili-ties are more efficient than similarly constructed discord-ant statistics in homogeneous populations, but may bebiased away from the null in situations where subjects arechosen from multiple populations having differingmarker allele frequencies or other sources of bias. Whereheterogeneity in marker allele frequencies is anticipated
Page 14 of 17(page number not for citation purposes)

BMC Medical Genetics 2008, 9:64 http://www.biomedcentral.com/1471-2350/9/64
because of underlying population admixture, linkage testsbased on comparison of concordant vs. discordant allelesharing should be considered. Either of these approachesshould allow studies of 500–1000 families containing anASP to achieve reasonable power to detect linkage underconditions including genetic and population heterogene-ity, unavailable parents, misspecified allele frequencies,and other afflictions of the sib-pair design. While collect-ing DNA samples from unaffected sibs can be useful for awide variety of purposes–especially if multipoint methodsare used–in many circumstances it should be unnecessaryto genotype these samples for purposes of performing agenome scan. If adequate allele frequency data are availa-ble and microsatellites are being used, we suggest a single-point affecteds-only analysis for a initial scan, followed bya multipoint analysis of affected and unaffected membersof all available sibships with additional markers aroundinitial hits. For dense SNP mapping studies, analysis usingindividual SNPs will not be sufficiently informative andso multipoint analyses will be required, but unless theparents are all available, analyses should be restricted tomarkers that show low levels of linkage disequilibrium(the reference here would be to a paper by Bacanu SA.Multipoint linkage analysis for a very dense set of markersGenet Epidemiol. 2005 Nov;29(3):195–203.) or estimatehaplotype frequencies (Abecasis and Wigginton, Han-dling marker-marker linkage disequilibrium: pedigreeanalysis with clustered markers. Am J Hum Genet. 2005Nov;77(5):754–67. Epub 2005 Sep 20.) If the parents areavailable, even though we have shown that genotypingthem is inefficient, an argument can be made for genotyp-ing them because their inclusion ameliorates any poten-tial effect of population admixture, greatly facilitates theidentification of any genotyping errors and reduces thedependence upon correct specification of haplotype fre-quencies when multipoint analyses are conducted (canrefer to Huang et al, 2004 Ignoring linkage disequilibriumamong tightly linked markers induces false-positive evi-dence of linkage for affected sib pair analysis.
Am J Hum Genet. 2004 Dec;75(6):1106-12. Epub 2004Oct 18.). The choice of whether or not to genotype unaf-fected individuals also would depend upon the feasibilityand cost of cherry-picking for regional genotyping ofregions showing evidence for linkage, but we have notstudied either of these issues in this paper. Admixture ismore likely to be of concern when studying populationsthat are known to have been founded by different ethnicgroups or races such as Hispanics and African-Americans.
We have also observed that, if genetic testing is availablefor previously-identified syndromes, and if those syn-dromes are thought to account for a larger portion of thedisease burden than the syndrome of interest, prior exclu-
sion of families linked to the known syndrome can mean-ingfully increase the power of the study.
Finally we note that the colon sibpair study, for which thispaper was written, was completed after accruing less than100 families. In fact, most of the colon sibpair studies thathave been published include fewer than 100 families,because recruitment is a major challenge. Although theresults discussed here suggest numbers that may be chal-lenging to accrue, the published literature has reportedpositive studies, suggesting that the assumptions used inour calculations may have been too conservative. In addi-tion, linkage studies are meant to be performed in an iter-ative fashion so that the results from ongoing studies canbe combined. Since our conclusions and recommenda-tions arising from the simulations describe relative advan-tage of various designs, our results are of value in futurestudy design.
Competing interestsThe authors declare that they have no competing interests.
Authors' contributionsRAK took the lead in developing the results (performedsimulations) and in writing the manuscript; CIA was amajor participant in developing the results and preparingthe manuscript; BYY drafted the manuscript and partici-pated in manuscript preparation discussions, DMF coor-dinated the draft and development of the manuscript andparticipated in manuscript preparation discussions, DCTwas a major participant in developing the results and pre-paring the manuscript. All authors read the final manu-script.
AcknowledgementsThe authors wish to thank Robert Elston and Dan Schaid for helpful sugges-tions at the design stage of this project, John Morrison for help with the computer programming, and Hang Lee and Deb Neklason for helpful com-ments on the manuscript. Supported in part by NIH U24 CA78174, R01 CA040641, and P01 CA73992 (RK), NIH HG02275, NIH 5 U42 CA78142 (CA), U01 CA78284, and R01 CA74302 (DF, BY), U01 CA78284, and CA52862, GM58897, and U01 CA78296 (DT).
References1. Haseman JK, Elston RC: The investigation of linkage between a
quantitative trait and a marker locus. Behav Genet 1972, 2:3-19.2. Fulker DW, Cardon LR: A sib-pair approach to interval map-
ping of quantitative trait loci. Am J Hum Genet 1994,54:1092-1103.
3. Amos CI, Elston RC: Robust methods for the detection ofgenetic linkage for quantitative data from pedigrees. GenetEpidemiol 1989, 6:349-360.
4. Cordell HJ, Wedig GC, Jacobs KB, Elston RC: Multilocus linkagetests based on affected relative pairs. Am J Hum Genet 2000,66:1273-1286.
5. Weeks DE, Lange K: The affected-pedigree-member methodof linkage analysis. Am J Hum Genet 1988, 42:315-326.
6. Olson JM: A general conditional-logistic model for affected-relative-pair linkage studies. Am J Hum Genet 1999,65:1760-1769.
Page 15 of 17(page number not for citation purposes)

BMC Medical Genetics 2008, 9:64 http://www.biomedcentral.com/1471-2350/9/64
7. Khoury MJ, Flanders WD, Lipton RB, Dorman JS: Commentary:the affected sib-pair method in the context of an epidemio-logic study design. Genet Epidemiol 1991, 8:277-282.
8. Greenwood CM, Bull SB: Analysis of affected sib pairs, with cov-ariates–with and without constraints. Am J Hum Genet 1999,64:871-885.
9. Gauderman WJ, Morrison JL, Siegmund KD, Thomas DC: A jointtest of linkage and gene × environment interaction, withaffected sib pairs. Genet Epidemiol 1999, 17(Suppl 1):S563-568.
10. Goldin LR, Gershon ES: Power of the affected-sib-pair methodfor heterogeneous disorders. Genet Epidemiol 1988, 5:35-42.
11. Kruglyak L, Lander ES: Complete multipoint sib-pair analysis ofqualitative and quantitative traits. Am J Hum Genet 1995,57:439-454.
12. Whittemore AS: Genome scanning for linkage: an overview.Am J Hum Genet 1996, 59:704-716.
13. Knapp M, Seuchter SA, Baur MP: Linkage analysis in nuclear fam-ilies. 2: Relationship between affected sib-pair tests and lodscore analysis. Hum Hered 1994, 44:44-51.
14. Hodge SE: Model-free vs. model-based linkage analysis: a falsedichotomy? Am J Med Genet 2001, 105:62-64.
15. Thomas DC: Are we ready for genome-wide association stud-ies? Cancer Epidemiol Biomarkers Prev 2006, 15:595-598.
16. Kemp Z, Carvajal-Carmona L, Spain S, Barclay E, Gorman M, MartinL, Jaeger E, Brooks N, Bishop DT, Thomas H, et al.: Evidence for acolorectal cancer susceptibility locus on chromosome 3q21-q24 from a high-density SNP genome-wide linkage scan.Hum Mol Genet 2006, 15:2903-2910.
17. Tomlinson I, Webb E, Carvajal-Carmona L, Broderick P, Kemp Z,Spain S, Penegar S, Chandler I, Gorman M, Wood W, et al.: Agenome-wide association scan of tag SNPs identifies a sus-ceptibility variant for colorectal cancer at 8q24.21. Nat Genet2007, 39:984-988.
18. Wiesner GL, Daley D, Lewis S, Ticknor C, Platzer P, Lutterbaugh J,MacMillen M, Baliner B, Willis J, Elston RC, Markowitz SD: A subsetof familial colorectal neoplasia kindreds linked to chromo-some 9q22.2-31.2. Proc Natl Acad Sci USA 2003, 100:12961-12965.
19. Slager S, Huang J, Vieland V: Effect of allelic heterogeneity on thepower of the transmission disequilibrium test. Genet Epidemiol2000, 18:143-156.
20. Macconaill LE, Aldred MA, Lu X, Laframboise T: Toward accuratehigh-throughput SNP genotyping in the presence of inher-ited copy number variation. BMC Genomics 2007, 8:211.
21. Johns LE, Houlston RS: A systematic review and meta-analysisof familial colorectal cancer risk. Am J Gastroenterol 2001,96:2992-3003.
22. La Vecchia C, Negri E, Franceschi S, Gentile A: Family history andthe risk of stomach and colorectal cancer. Cancer 1992,70:50-55.
23. Cannon-Albright LA, Thomas A, Goldgar DE, Gholami K, Rowe K,Jacobsen M, McWhorter WP, Skolnick MH: Familiality of cancerin Utah. Cancer Res 1994, 54:2378-2385.
24. Slattery ML, Kerber RA: Family history of cancer and colon can-cer risk: the Utah Population Database. J Natl Cancer Inst 1994,86:1618-1626.
25. Le Marchand L, Zhao LP, Quiaoit F, Wilkens LR, Kolonel LN: Familyhistory and risk of colorectal cancer in the multiethnic pop-ulation of Hawaii. Am J Epidemiol 1996, 144:1122-1128.
26. Kerber RA, Slattery ML, Potter JD, Caan BJ, Edwards SL: Risk ofcolon cancer associated with a family history of cancer orcolorectal polyps: the diet, activity, and reproduction incolon cancer study. Int J Cancer 1998, 78:157-160.
27. Goldgar DE, Easton DF, Cannon-Albright LA, Skolnick MH: System-atic population-based assessment of cancer risk in first-degree relatives of cancer probands. J Natl Cancer Inst 1994,86:1600-1608.
28. Kune GA, Kune S, Watson LF: The role of heredity in the etiol-ogy of large bowel cancer: data from the Melbourne Color-ectal Cancer Study. World J Surg 1989, 13:124-129. discussion129-131
29. Garabrant DH, Peters JM, Mack TM, Bernstein L: Job activity andcolon cancer risk. Am J Epidemiol 1984, 119:1005-1014.
30. Colditz GA, Cannuscio CC, Frazier AL: Physical activity andreduced risk of colon cancer: implications for prevention.Cancer Causes Control 1997, 8:649-667.
31. Gertig DM, Hunter DJ: Genes and environment in the etiologyof colorectal cancer. Semin Cancer Biol 1998, 8:285-298.
32. Hensrud DD, Heimburger DC: Diet, nutrients, and gastrointes-tinal cancer. Gastroenterol Clin North Am 1998, 27:325-346.
33. Schottenfeld D, Winawer SJ: Cancers of the large intestine. InCancer epidemiology and prevention Edited by: Schottenfeld D, Frau-meni JF. New York: Oxford University Press; 1996:813-840.
34. Potter JD: Colorectal cancer: molecules and populations. JNatl Cancer Inst 1999, 91:916-932.
35. Vachon CM, Sellers TA, Kushi LH, Folsom AR: Familial correlationof dietary intakes among postmenopausal women. Genet Epi-demiol 1998, 15:553-563.
36. Khoury MJ, Beaty TH, Liang KY: Can familial aggregation of dis-ease be explained by familial aggregation of environmentalrisk factors? Am J Epidemiol 1988, 127:674-683.
37. Wooster R, Bignell G, Lancaster J, Swift S, Seal S, Mangion J, CollinsN, Gregory S, Gumbs C, Micklem G: Identification of the breastcancer susceptibility gene BRCA2. Nature 1995, 378:789-792.
38. Mecklin JP, Jarvinen HJ, Hakkiluoto A, Hallikas H, Hiltunen KM,Harkonen N, Kellokumpu I, Laitinen S, Ovaska J, Tulikoura J, et al.:Frequency of hereditary nonpolyposis colorectal cancer. Aprospective multicenter study in Finland. Dis Colon Rectum1995, 38:588-593.
39. Wang Q, Lasset C, Desseigne F, Saurin JC, Maugard C, Navarro C,Ruano E, Descos L, Trillet-Lenoir V, Bosset JF, Puisieux A: Preva-lence of germline mutations of hMLH1, hMSH2, hPMS1,hPMS2, and hMSH6 genes in 75 French kindreds with non-polyposis colorectal cancer. Hum Genet 1999, 105:79-85.
40. Peel DJ, Ziogas A, Fox EA, Gildea M, Laham B, Clements E, KolodnerRD, Anton-Culver H: Characterization of hereditary nonpoly-posis colorectal cancer families from a population-basedseries of cases. J Natl Cancer Inst 2000, 92:1517-1522.
41. Percesepe A, Borghi F, Menigatti M, Losi L, Foroni M, Di Gregorio C,Rossi G, Pedroni M, Sala E, Vaccina F, et al.: Molecular screeningfor hereditary nonpolyposis colorectal cancer: a prospective,population-based study. J Clin Oncol 2001, 19:3944-3950.
42. Weber TK, Chin HM, Rodriguez-Bigas M, Keitz B, Gilligan R, O'MalleyL, Urf E, Diba N, Pazik J, Petrelli NJ: Novel hMLH1 and hMSH2germline mutations in African Americans with colorectalcancer. Jama 1999, 281:2316-2320.
43. Bai YQ, Akiyama Y, Nagasaki H, Lu SL, Arai T, Morisaki T, KitamuraM, Muto A, Nagashima M, Nomizu T, et al.: Predominant germ-line mutation of the hMSH2 gene in Japanese hereditarynon-polyposis colorectal cancer kindreds. Int J Cancer 1999,82:512-515.
44. Aaltonen LA, Salovaara R, Kristo P, Canzian F, Hemminki A, Pelto-maki P, Chadwick RB, Kaariainen H, Eskelinen M, Jarvinen H, et al.:Incidence of hereditary nonpolyposis colorectal cancer andthe feasibility of molecular screening for the disease. N Engl JMed 1998, 338:1481-1487.
45. Rudy DR, Zdon MJ: Update on colorectal cancer. Am Fam Physi-cian 2000, 61:1759-1770. 1773–1754
46. Hemminki K, Li X: Familial colorectal adenocarcinoma andhereditary nonpolyposis colorectal cancer: a nationwide epi-demiological study from Sweden. Br J Cancer 2001, 84:969-974.
47. Salovaara R, Loukola A, Kristo P, Kaariainen H, Ahtola H, EskelinenM, Harkonen N, Julkunen R, Kangas E, Ojala S, et al.: Population-based molecular detection of hereditary nonpolyposis color-ectal cancer. J Clin Oncol 2000, 18:2193-2200.
48. Risch N: The genetic epidemiology of cancer: interpretingfamily and twin studies and their implications for moleculargenetic approaches. Cancer Epidemiol Biomarkers Prev 2001,10:733-741.
49. Kruglyak L, Daly MJ, Reeve-Daly MP, Lander ES: Parametric andnonparametric linkage analysis: a unified multipointapproach. Am J Hum Genet 1996, 58:1347-1363.
50. SAGE: Statistical Analysis for Genetic Epidemiology. In Com-puter program package 5.0th edition. Cork, Ireland: Statistical Solu-tions Ltd; Computer program package; 2004.
51. Sobel E, Lange K: Descent graphs in pedigree analysis: applica-tions to haplotyping, location scores, and marker-sharingstatistics. Am J Hum Genet 1996, 58:1323-1337.
52. Abecasis GR, Cardon LR, Cookson WO: A general test of associ-ation for quantitative traits in nuclear families. Am J HumGenet 2000, 66:279-292.
Page 16 of 17(page number not for citation purposes)

BMC Medical Genetics 2008, 9:64 http://www.biomedcentral.com/1471-2350/9/64
Publish with BioMed Central and every scientist can read your work free of charge
"BioMed Central will be the most significant development for disseminating the results of biomedical research in our lifetime."
Sir Paul Nurse, Cancer Research UK
Your research papers will be:
available free of charge to the entire biomedical community
peer reviewed and published immediately upon acceptance
cited in PubMed and archived on PubMed Central
yours — you keep the copyright
Submit your manuscript here:http://www.biomedcentral.com/info/publishing_adv.asp
BioMedcentral
53. Blackwelder WC, Elston RC: A comparison of sib-pair linkagetests for disease susceptibility loci. Genet Epidemiol 1985,2:85-97.
54. Guo X, Elston RC: Two-stage global search designs for linkageanalysis II: including discordant relative pairs in the study.Genet Epidemiol 2000, 18:111-127.
55. Hodge SE: The information contained in multiple sibling pairs.Genet Epidemiol 1984, 1:109-122.
56. Amos CI, Elston RC, Bonney GE, Keats BJ, Berenson GS: A multi-variate method for detecting genetic linkage, with applica-tion to a pedigree with an adverse lipoprotein phenotype.Am J Hum Genet 1990, 47:247-254.
57. Boehnke M: Allele frequency estimation from data on rela-tives. Am J Hum Genet 1991, 48:22-25.
58. Abecasis GR, Cherny SS, Cookson WO, Cardon LR: Merlin–rapidanalysis of dense genetic maps using sparse gene flow trees.Nature Genetics 2002, 30:97-101.
59. Snedecor G, Cochran W: Statistical Methods 6th edition. Ames: IowaState University Press; 1967.
60. The R Project for Statistical Computing [http://www.r-project.org]
61. Akaike H: A Bayesian analysis of the minimum AIC proce-dure. Annals of the Institute of Statistical Mathematics 1978, 30A:9-14.
62. Schork NJ, Greenwood TA: Inherent bias toward the nullhypothesis in conventional multipoint nonparametric link-age analysis. Am J Hum Genet 2004, 74:306-316.
63. Cordell HJ: Bias toward the null hypothesis in model-free link-age analysis is highly dependent on the test statistic used. AmJ Hum Genet 2004, 74:1294-1302.
64. Colon Cancer Sibling Pair Study [http://hedwig.mgh.harvard.edu/cgn/public/studies/colon_sib_pair]
65. Cancer Genetics Network [http://hedwig.mgh.harvard.edu/cgn]66. Ott J: Analysis of Human Genetic Linkage. 1999:382.67. Holmans P, Craddock N: Efficient strategies for genome scan-
ning using maximum-likelihood affected-sib-pair analysis.Am J Hum Genet 1997, 60:657-666.
68. Kerber RA, Slattery ML: The impact of family history on ovariancancer risk. The Utah Population Database. Arch Intern Med1995, 155:905-912.
69. Kraft P, Thomas DC: Case-sibling gene-association studies fordiseases with variable age at onset. Stat Med 2004,23:3697-3712.
70. O'Connell JR, Weeks DE: PedCheck: a program for identifica-tion of genotype incompatibilities in linkage analysis. Am JHum Genet 1998, 63:259-266.
71. Goring HH, Terwilliger JD: Linkage analysis in the presence oferrors I: complex-valued recombination fractions and com-plex phenotypes. Am J Hum Genet 2000, 66:1095-1106.
72. Zollner S, Wen X, Hanchard NA, Herbert MA, Ober C, Pritchard JK:Evidence for extensive transmission distortion in the humangenome. Am J Hum Genet 2004, 74:62-72.
73. Spielman RS, McGinnis RE, Ewens WJ: Transmission test for link-age disequilibrium: the insulin gene region and insulin-dependent diabetes mellitus (IDDM). Am J Hum Genet 1993,52:506-516.
74. Ziogas A, Anton-Culver H: Validation of family history data incancer family registries. Am J Prev Med 2003, 24:190-198.
75. Olson JM, Elston RC: Using family history information to distin-guish true and false positive model-free linkage results. GenetEpidemiol 1998, 15:183-192.
76. Risch N: Linkage strategies for genetically complex traits. II.The power of affected relative pairs. American Journal of HumanGenetics 1990, 46:229-241.
77. Narod SA, Amos C: Estimating the power of linkage analysis inhereditary breast cancer. Am J Hum Genet 1990, 46:266-272.
78. Gauderman WJ, Thomas DC: The role of interacting determi-nants in the localization of of genes. In Genetic dissection of com-plex traits: challenges for the next millenium Edited by: Rao DC. Chicago:Academic Press; 2000:393-412.
79. Thomas DC, Qian D, Gauderman WJ, Siegmund K, Morrison JL: Ageneralized estimating equations approach to linkage analy-sis in sibships in relation to multiple markers and exposurefactors. Genet Epidemiol 1999, 17(Suppl 1):S737-742.
80. Huang Q, Shete S, Amos CI: Ignoring linkage disequilibriumamong tightly linked markers induces false-positive evidence
of linkage for affected sib pair analysis. Am J Hum Genet 2004,75:1106-1112.
81. Mandal DM, Wilson AF, Elston RC, Weissbecker K, Keats BJ, Bailey-Wilson JE: Effects of misspecification of allele frequencies onthe type I error rate of model-free linkage analysis. HumHered 2000, 50:126-132.
Pre-publication historyThe pre-publication history for this paper can be accessedhere:
http://www.biomedcentral.com/1471-2350/9/64/prepub
Page 17 of 17(page number not for citation purposes)
Recommended


