
DETERMINANTS OF GROWTH IN YOUTH OWNED
MICRO AND SMALL ENTERPRISES IN KENYA
PETER MUGAMBI KIMURU
DOCTOR OF PHILOSOPHY
(Entrepreneurship)
JOMO KENYATTA UNIVERSITY OF
AGRICULTURE AND TECHNOLOGY
2018
Determinants of Growth in Youth Owned Micro and Small Enterprises in Kenya
Peter Mugambi Kimuru
A thesis submitted in partial fulfillment of the Degree of Doctor of Philosophy in
Entrepreneurship in the Jomo Kenyatta University of Agriculture and Technology
2018

ii
DECLARATION
This thesis is my original work and has not been presented for a degree in any other
University.
Signature…………………. Date………………….
Peter Mugambi Kimuru
This thesis has been submitted for examination with our approval as University
Supervisors.
Signature…………………… Date…………………
Dr. Patrick Karanja Ngugi
JKUAT, Kenya
Signature…………………… Date……………….
Prof. Christopher Kanali
JKUAT, Kenya
Signature…………………… Date…………………
Dr. Assumptah Kagiri
JKUAT, Kenya

iii
DEDICATION
To the young upcoming entrepreneurs whose hard work has continued to positively
transform communities in Kenya.

iv
ACKNOWLEDGEMENT
With devoted love, I dedicate this piece of work to my late grand mum Dorcas
Mberenya may her soul through the mercy of God rest in peace. To my parents Mr. and
Mrs. Kimuru, thank you for sponsoring my PhD studies; you always taught me
perseverance when hard work is ahead. Special thanks to my supervisors Dr. Patrick
Karanja, Prof. Christopher Kanali and Dr. Assumptah Kagiri for their scholarly support
in this journey. God bless you all.

v
TABLE OF CONTENTS
DECLARATION ............................................................................................................................ I
DEDICATION ............................................................................................................................. III
ACKNOWLEDGEMENT .......................................................................................................... IV
TABLE OF CONTENTS ............................................................................................................. V
LIST OF TABLES .................................................................................................................... VIII
LIST OF FIGURES .................................................................................................................... XI
LIST OF APPENDICES ........................................................................................................... XII
ABBREVIATIONS AND ACRONYMS................................................................................. XIII
DEFINITION OF TERMS ...................................................................................................... XIV
ABSTRACT ............................................................................................................................ XVII
CHAPTER ONE ........................................................................................................................... 1
INTRODUCTION ......................................................................................................................... 1
1.1 Backgrounds to the Study ......................................................................................................... 1
1.2 Statement of the Problem .......................................................................................................... 6
1.3 Objectives the Study ............................................................................................................... 8
1.4 Hypotheses ................................................................................................................................ 9
1.5 Significance of the Study ........................................................................................................ 9
1.6 Scope of the Study .................................................................................................................. 10
1.7 Limitations of the Study .......................................................................................................... 10
1.8 Delimitation ............................................................................................................................ 11
CHAPTER TWO ........................................................................................................................ 12
LITERATURE REVIEW ........................................................................................................... 12
vi
2.1 Introduction ............................................................................................................................. 12
2.2 Theoretical Frame Work ....................................................................................................... 12
2.3 Conceptual Frame Work ......................................................................................................... 18
2.4 Empirical Review .................................................................................................................. 29
2.5 Critique of Literature Relevant to the Study ......................................................................... 38
2.6 Research Gap .......................................................................................................................... 40
2.7 Summary of Empirical and Theoretical Studies ..................................................................... 41
CHAPTER THREE .................................................................................................................... 43
RESEARCH METHODOLOGY .............................................................................................. 43
3.1 Introduction ........................................................................................................................... 43
3.2 Research Philosophy ............................................................................................................... 43
3.3 Research Design ...................................................................................................................... 43
3.4 Target Population .................................................................................................................. 44
3.5 Sampling Frame .................................................................................................................... 45
3.6 Sample and Sampling Technique .......................................................................................... 46
3.7 Data Collection Instruments ................................................................................................. 48
3.8 Data Collection Procedure ...................................................................................................... 49
3.9 Pilot Testing .......................................................................................................................... 49
3.10 Data Analysis and Presentation ............................................................................................. 52
CHAPTER FOUR ....................................................................................................................... 55
RESEARCH FINDINGS AND DISCUSSION ......................................................................... 55
4.1 Introduction ............................................................................................................................. 55
4.2 Response Rate ......................................................................................................................... 55
vii
4.3 Pilot Study Results .................................................................................................................. 56
4.4 Demographic Data ................................................................................................................ 57
4.5 Descriptive Analysis of Study Variables and Growth of MSE ............................................... 61
4.6 Legal and Regulatory ............................................................................................................ 67
4.7 Access to Market ................................................................................................................... 68
4.8 Adoption of Technology ....................................................................................................... 70
4.9 Entrepreneurial Characteristics ............................................................................................... 73
4.10 Micro and Small Enterprise Growth ..................................................................................... 77
4.11 Regression Analysis .............................................................................................................. 80
4.12 Hypotheses Testing ........................................................................................................... 84
4.13 Overall Model ................................................................................................................... 94
CHAPTER FIVE ........................................................................................................................ 97
SUMMARY, CONCLUSION AND RECOMMENDATIONS ................................................ 97
5.1 Introduction ............................................................................................................................. 97
5.2 Summary of the Research Findings ...................................................................................... 97
5.3 Conclusions ........................................................................................................................... 100
5.4 Recommendations ............................................................................................................... 102
5.5 Recommendations for Future Research ................................................................................ 103
REFERENCES .......................................................................................................................... 105
APPENDICES ........................................................................................................................... 125
viii
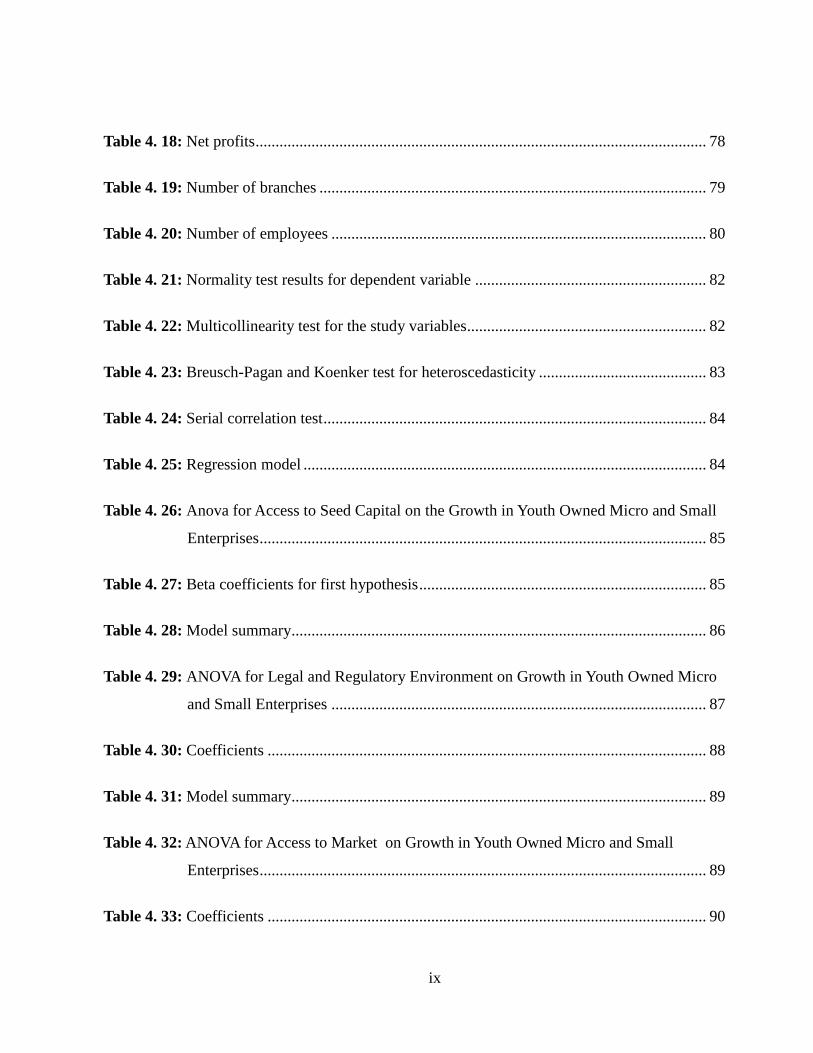
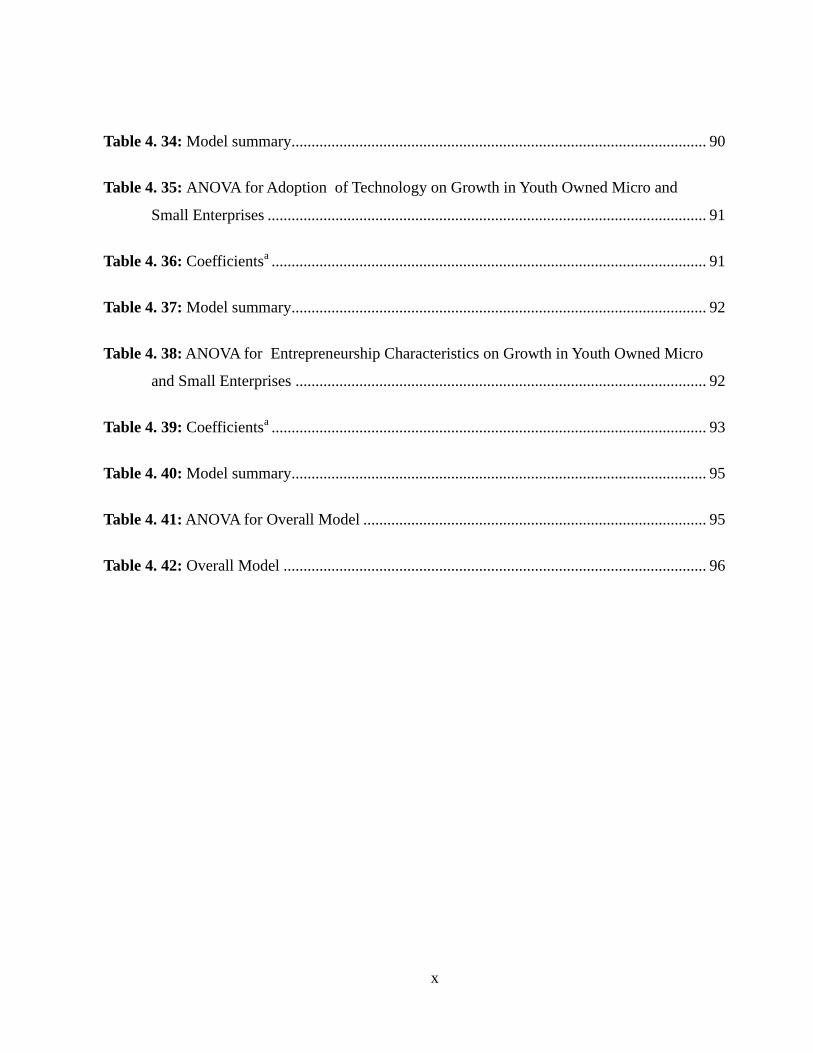
LIST OF TABLES
Table 4. 1: Response rate .............................................................................................................. 56
Table 4. 2: Reliability results........................................................................................................ 57
Table 4. 3: Demographic factors for the respondent .................................................................... 59
Table 4. 4: Firms demographics ................................................................................................... 61
Table 4. 5 : Cost of seed capital ................................................................................................... 63
Table 4. 6: Appraisal..................................................................................................................... 64
Table 4. 7: Collateral factors ........................................................................................................ 66
Table 4. 8: Source of funding ....................................................................................................... 67
Table 4. 9: Legal and regulatory ................................................................................................... 68
Table 4. 10: Access to market....................................................................................................... 69
Table 4. 11: Number of competitors ............................................................................................. 70
Table 4. 12: Adoption of technology ............................................................................................ 73
Table 4. 13: Work experience ....................................................................................................... 74
Table 4. 14: Level of education .................................................................................................... 75
Table 4. 15: Innovativeness .......................................................................................................... 76
Table 4. 16: Risk taking................................................................................................................ 77
Table 4. 17: Sales turnovers ......................................................................................................... 78
ix
Table 4. 18: Net profits ................................................................................................................. 78
Table 4. 19: Number of branches ................................................................................................. 79
Table 4. 20: Number of employees .............................................................................................. 80
Table 4. 21: Normality test results for dependent variable .......................................................... 82
Table 4. 22: Multicollinearity test for the study variables............................................................ 82
Table 4. 23: Breusch-Pagan and Koenker test for heteroscedasticity .......................................... 83
Table 4. 24: Serial correlation test ................................................................................................ 84
Table 4. 25: Regression model ..................................................................................................... 84
Table 4. 26: Anova for Access to Seed Capital on the Growth in Youth Owned Micro and Small
Enterprises ................................................................................................................ 85
Table 4. 27: Beta coefficients for first hypothesis ........................................................................ 85
Table 4. 28: Model summary ........................................................................................................ 86
Table 4. 29: ANOVA for Legal and Regulatory Environment on Growth in Youth Owned Micro
and Small Enterprises .............................................................................................. 87
Table 4. 30: Coefficients .............................................................................................................. 88
Table 4. 31: Model summary ........................................................................................................ 89
Table 4. 32: ANOVA for Access to Market on Growth in Youth Owned Micro and Small
Enterprises ................................................................................................................ 89
Table 4. 33: Coefficients .............................................................................................................. 90
x
Table 4. 34: Model summary ........................................................................................................ 90
Table 4. 35: ANOVA for Adoption of Technology on Growth in Youth Owned Micro and
Small Enterprises .............................................................................................................. 91
Table 4. 36: Coefficientsa ............................................................................................................. 91
Table 4. 37: Model summary ........................................................................................................ 92
Table 4. 38: ANOVA for Entrepreneurship Characteristics on Growth in Youth Owned Micro
and Small Enterprises ....................................................................................................... 92
Table 4. 39: Coefficientsa ............................................................................................................. 93
Table 4. 40: Model summary ........................................................................................................ 95
Table 4. 41: ANOVA for Overall Model ...................................................................................... 95
Table 4. 42: Overall Model .......................................................................................................... 96
xi
LIST OF FIGURES
Figure 2. 2: Conceptual Frame Work ............................................................................... 19
Figure 4. 1: Access to credit. ............................................................................................ 65
Figure 4. 2: Test for outliers. ............................................................................................ 81

xii
LIST OF APPENDICES
Appendix 1: Letter of Introduction……………………………………………...101
Appendix 11: Questionnaire…………………………………………...................110

xiii
ABBREVIATIONS AND ACRONYMS
AC Access to Marketing
ACEPD Africa Centre for Entrepreneurship Proficiency Development
C-YES Constituency Youth Enterprise Scheme
DOI Diffusion of Innovation Theory
EC Entrepreneurial Characteristics
ILO International Labour Organization
KPIA Kenya Poverty and Inequality Assessment
KIPPRA Kenya Institute for Public Policy, Research and Analysis
LG Legal and Regulatory
MTP Medium Term Plan
MFIs Micro Finance Institutions
MSEs Micro and Small Enterprises
ROK Republic of Kenya
SEAF Small Enterprise Assistance Funds
SE Seed Capital
SMEs Small and Medium Enterprises
SSA Sub-Sahara Africa
SPSS Statistical Program for Social Science
TC Technology Adoption
UYF Umsombovu Youth Fund
WEF Women Enterprise Development Funds
YEP Youth Empowerment Project
YEDF Youth Enterprise Development Funds
YREs Youth Run Enterprises
xiv
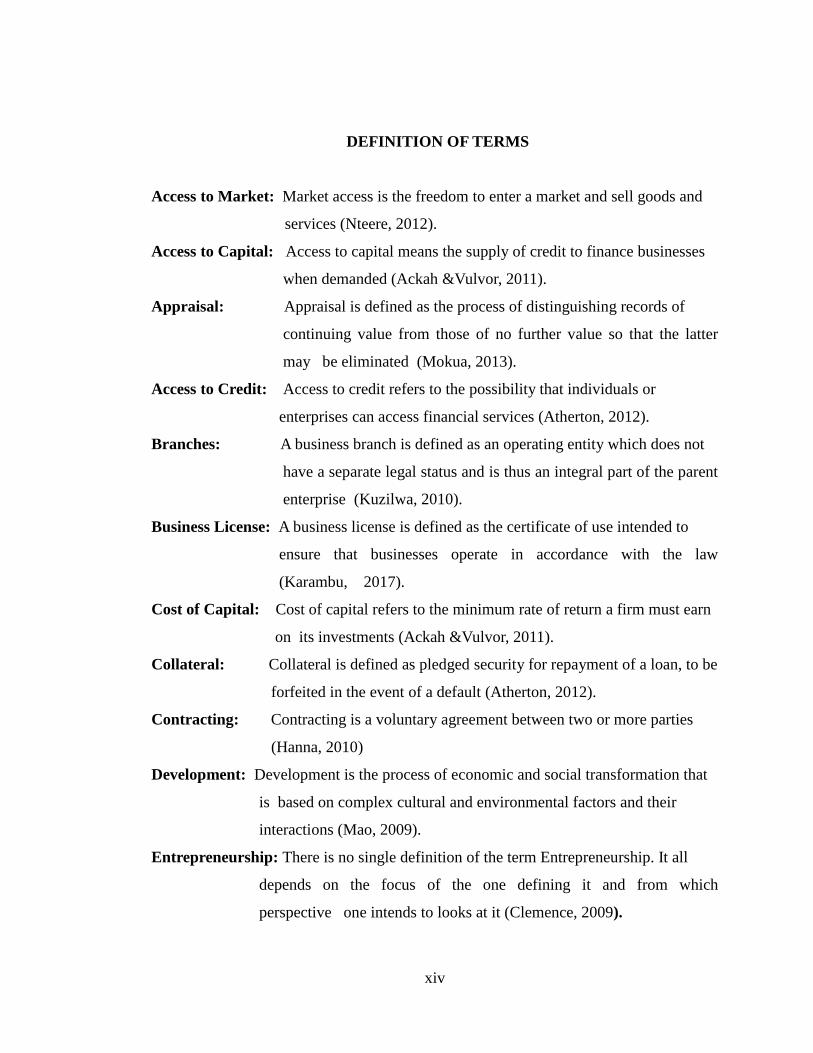
DEFINITION OF TERMS
Access to Market: Market access is the freedom to enter a market and sell goods and
services (Nteere, 2012).
Access to Capital: Access to capital means the supply of credit to finance businesses
when demanded (Ackah &Vulvor, 2011).
Appraisal: Appraisal is defined as the process of distinguishing records of
continuing value from those of no further value so that the latter
may be eliminated (Mokua, 2013).
Access to Credit: Access to credit refers to the possibility that individuals or
enterprises can access financial services (Atherton, 2012).
Branches: A business branch is defined as an operating entity which does not
have a separate legal status and is thus an integral part of the parent
enterprise (Kuzilwa, 2010).
Business License: A business license is defined as the certificate of use intended to
ensure that businesses operate in accordance with the law
(Karambu, 2017).
Cost of Capital: Cost of capital refers to the minimum rate of return a firm must earn
on its investments (Ackah &Vulvor, 2011).
Collateral: Collateral is defined as pledged security for repayment of a loan, to be
forfeited in the event of a default (Atherton, 2012).
Contracting: Contracting is a voluntary agreement between two or more parties
(Hanna, 2010)
Development: Development is the process of economic and social transformation that
is based on complex cultural and environmental factors and their
interactions (Mao, 2009).
Entrepreneurship: There is no single definition of the term Entrepreneurship. It all
depends on the focus of the one defining it and from which
perspective one intends to looks at it (Clemence, 2009).
xv
Entrepreneur: An entrepreneur is one who takes riskier decisions for greater rewards,
exploiting opportunities that others have not noticed. Becoming an
employer is an entrepreneurial act in the sense that it involves taking on
risk (Osunde, 2014).
Enterprise: An enterprise is a unit of economic organization or activity; especially a
business organization (Oni & Dania, 2012)
Entrepreneurial Characteristics: Entrepreneurial characteristics are actions of an
entrepreneur who is a person always in search of
something new and exploits such ideas into useful
opportunities by accepting the risk and uncertainty
(Dereje, 2008).
Enterprise Growth: Enterprise growth is the development process of enterprise from
small to big and from weak to strong (Mao, 2009).
Legal and Regulatory: Legal and regulatory constitutes the many foreign and domestic
laws governing how businesses must operate (Geringer, 2012).
Level of Technology Capacity: Technology capacity refers to the change or innovation
through technological means (Jolly, 2011).
Micro and Small Enterprises Growth: Micro and small enterprises are businesses in
both formal and informal sector, classified into
farm and non-farm categories employing 1-50
workers (Nteere , 2012).
Registration of Business: Business Registration is a process of providing more
prominent visibility on the business essential items i.e.
business name, logo, business links, images, business
hours, coupons, and even a local map that highlights an
enterprise location (Karambu, 2017).
Risk Taking: A risk taker is an investor or entrepreneur who is intrigued from the
market volatility, viewing it as an opportunity to realize a higher return on
their investment (Gatangs & Matavire, 2013).
xvi
Sales Turnover: Sales turnover is the total amount of money that a company receives
from the sale of products or services in a particular period of time (Dutta,
2009).
Seed Capital: Seed capital is the funding required for getting a new business started
(Viswanadham, 2017).
Technology Adaption: Technology adoption can be defined as the acceptance of an
innovation or invention by at least one user (Jolly, 2011).
Youth: A youth is defined as all individuals who have attained the age of 18 years but
have not attained the age of 35 years (ROK, 2010).
xvii
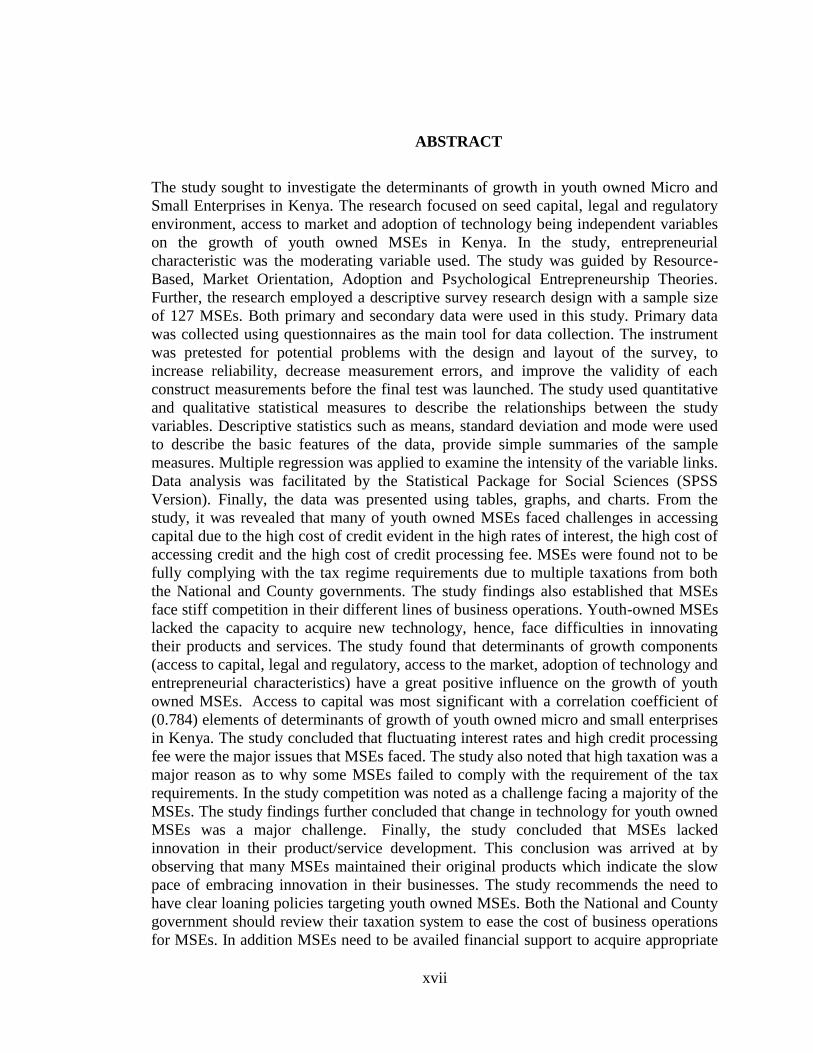
ABSTRACT
The study sought to investigate the determinants of growth in youth owned Micro and
Small Enterprises in Kenya. The research focused on seed capital, legal and regulatory
environment, access to market and adoption of technology being independent variables
on the growth of youth owned MSEs in Kenya. In the study, entrepreneurial
characteristic was the moderating variable used. The study was guided by Resource-
Based, Market Orientation, Adoption and Psychological Entrepreneurship Theories.
Further, the research employed a descriptive survey research design with a sample size
of 127 MSEs. Both primary and secondary data were used in this study. Primary data
was collected using questionnaires as the main tool for data collection. The instrument
was pretested for potential problems with the design and layout of the survey, to
increase reliability, decrease measurement errors, and improve the validity of each
construct measurements before the final test was launched. The study used quantitative
and qualitative statistical measures to describe the relationships between the study
variables. Descriptive statistics such as means, standard deviation and mode were used
to describe the basic features of the data, provide simple summaries of the sample
measures. Multiple regression was applied to examine the intensity of the variable links.
Data analysis was facilitated by the Statistical Package for Social Sciences (SPSS
Version). Finally, the data was presented using tables, graphs, and charts. From the
study, it was revealed that many of youth owned MSEs faced challenges in accessing
capital due to the high cost of credit evident in the high rates of interest, the high cost of
accessing credit and the high cost of credit processing fee. MSEs were found not to be
fully complying with the tax regime requirements due to multiple taxations from both
the National and County governments. The study findings also established that MSEs
face stiff competition in their different lines of business operations. Youth-owned MSEs
lacked the capacity to acquire new technology, hence, face difficulties in innovating
their products and services. The study found that determinants of growth components
(access to capital, legal and regulatory, access to the market, adoption of technology and
entrepreneurial characteristics) have a great positive influence on the growth of youth
owned MSEs. Access to capital was most significant with a correlation coefficient of
(0.784) elements of determinants of growth of youth owned micro and small enterprises
in Kenya. The study concluded that fluctuating interest rates and high credit processing
fee were the major issues that MSEs faced. The study also noted that high taxation was a
major reason as to why some MSEs failed to comply with the requirement of the tax
requirements. In the study competition was noted as a challenge facing a majority of the
MSEs. The study findings further concluded that change in technology for youth owned
MSEs was a major challenge. Finally, the study concluded that MSEs lacked
innovation in their product/service development. This conclusion was arrived at by
observing that many MSEs maintained their original products which indicate the slow
pace of embracing innovation in their businesses. The study recommends the need to
have clear loaning policies targeting youth owned MSEs. Both the National and County
government should review their taxation system to ease the cost of business operations
for MSEs. In addition MSEs need to be availed financial support to acquire appropriate

xviii
technology. To increase MSEs market access, the County and National governments are
recommended to increase their consumption of products and services from youth-run
enterprises. Enhancing the studies recommendations will ensure that youth owned MSEs
will be able to effectively contribute to the realization of Kenyans Vision 2030.
1
CHAPTER ONE
INTRODUCTION
1.1 Backgrounds to the Study
The study sought to investigate the determinants of growth in youth owned micro and
small enterprises in Kenya. MSEs play an important role in the economic growth and
sustainable development of every nation hence its importance in youth empowerment
through employment creation. This chapter discussed the background of the study that
includes MSEs, youth owned enterprises and growth. The chapter also discussed the
statement of the problem, objectives of the study, research hypothesis, significance of
the study, justification, scope of the study and limitations of the study.
1.1.1 Micro and Small Enterprises
Youth-owned micro and small enterprises (MSEs) have increasingly been seen as
playing an important role in the economies of many countries. Many, governments
throughout the world have focused on the development of MSE sector in order to
promote economic growth, (Olawe & Garwe, 2010). Youth-owned MSEs evolve in
difficult business environments that are characterized by globalization, the
internationalization of markets and there is a need to enhance greater efficiency,
effectiveness, and competitiveness that are based on innovation and knowledge,
(Mateev & Anastasov, 2010). The MSEs have faced many barriers that have prevented
their start-up or growth and hinder their potential.
Njuguna (2015), states that MSEs represent about 78 percent of all the firms operating
globally (USAID, 2010). Non-farm micro and small enterprises account for over 35
2
percent of total employment and 20% of the gross domestic product (GDP) in many
developed and emerging economies , (IFC,2013). In countries like Indonesia, Singapore,
Thailand and India, MSEs contribute over 40% of the GDP, (Fink, 2012). In 2012, the
contribution of MSEs in the industrial sector to the national GDP was estimated at 40,
52, 55 and 47.5% for India, Japan, Sri Lanka, and Thailand, respectively. Similarly,
micro and small-sized enterprises (MSEs) are the backbones of Singapore’s economy,
contributing about 47% of the country’s GDP and generating 62% of available jobs ,
(UNCTAD, 2013). In the European Union countries, some 21 million MSEs provide
around 59 million jobs and represent 73% of all enterprises. For instance in Britain,
SMEs are the backbone of the British economy, (Rowe, 2010).
Njuguna, (2015) further explain that the UK economy is 48% MSEs, and the sector is
said to be employing 14.47 million people, out of a working population of
approximately 30 million. In regards to the UK turnover and GDP, MSEs accounted for
1.48 trillion British Pounds in 2011. In the UK MSEs with employing at least 1
employee perform better than the large UK corporations in terms of better productivity
despite having minimal resources, less support and being largely ignored. Bigger UK
Corporations are said to have 250 employees and over account for 52% of employment
in the country but less than 50.8% of the UK turnover. The UK economy, just like many
world economies, is supported by MSE performance, (The UK, 2012).
Regionally, the support of youth owned MSEs in the informal and formal sector is
viewed as a viable approach to sustainable development because it suits the resources in
Africa (Njuguna, 2015). MSEs are the main source of employment in developing
countries and comprise of over 70% of African business operations. They contribute to
over 50% of African employment and GDP. In Nigeria, MSEs contributed an estimated
37 percent of the GDP, (SMEDAN, 2011). In Kenya, the MSE sector has both the
potential and the historic task of bringing millions of people from the survival list level
including the informal economy to the mainstream economy (Njuguna, 2015). MSEs are
largely found in the informal sector, mostly employing 1-2 people, although, there are
3
many others that operate in the formal sector. Most of the local investment businesses in
Kenya fall under the MSE business sector, (ACEPD, 2011). Employment within the
MSEs sector increased from 4.2 million persons in 2000 to slightly over 7 million
persons in 2014. This accounts for 74.2% of the total persons engaged in employment.
The sector contributes up to 18.4% of the country’s GDP and is not only a provider of
goods and services but also a driver in promoting competition and innovation, (RoK,
2014).
Njuguna ,(2015) acknowledges that recognizing the important role small businesses play
in the Kenya economy, the Government through Kenya Vision 2030 envisages the
strengthening of MSEs to become the key industries of tomorrow by improving their
productivity and innovation (Ministry of Planning, National Development & Vision
2030 (ROK, 2007). If Kenyans goal towards industrialization by the year of 2030 is to
be realized, then the government has to support and encourage youth owned MSEs to
play a greater role towards providing additional jobs in the country. The Kenyan
government has made some steps towards developing a legal and regulatory framework
that is aimed at guiding and accelerating youth owned MSEs growth. The developed
MSEs policy framework of MSEs in Kenya is contained in the Sessional paper No. 2 of
2005, (ROK, 2010). This policy paper forms the background for enacting the MSE act
to operationalize MSE policy in Kenya. The act is supposed to give direction on issues
relating to the legal and regulatory environment, markets and marketing, business
linkages, the tax regime, skills and technology, and financial services, (Syekei & Opijah,
2012).
The government has further set up funds that actualizes policies and support the sector.
These funds include Women Enterprise Fund (WEF) and the youth enterprise
development funds (YEDF). These support programs are meant to provide guidance,
promotion, production efficiency, research and development activities, and product
development. The net effect should be an increase in job opportunities among the young
people, an expanded market for MSEs’ products, increased capacity to service the
4
market, and improved returns for MSEs, (Vinod, 2006). Being an important pillar
towards the realization of Kenya vision 2030 and the leading job provider in Kenya and
Nairobi, Youth owned MSEs should play a role in the growth and development of the
sector in the country and is the subject of the present study.
1.1.2 Youth Owned Enterprises
This study defines youth as any individual aged between 18-35 years. The status of
Kenyan young people just like in most developing countries especially in the Sub-
Saharan Africa (SSA) still faces a lot of challenges especially that of unemployment.
Recent statistics in Kenya indicated that, those under the age of thirty-five form 80% of
the Country‘s population The authors further explained that employment rates were
lowest among those without post-secondary education at 15%. By comparison, 32% of
those with post-secondary education were unemployed. They concluded that 1 in 2
graduates were unemployed and only one in five youth with university degrees were in
self-employment (Alex & Bruce, 2016). Youth form about 60% of the total labor force
in the country, but a majority, about 65% is unemployed. In Kenya currently, 750,000
young people graduate from various tertiary institutions, and only 25% are able to
access employment. The rest, 75% have to bear the burden of unemployment (Kimando,
2012). However, it is important to note that the youth have remained on the periphery of
the country's affairs and their status has not been accorded due recognition. They have
been excluded, for the better part of previous years, from designing, planning and
implementing programs and policies that affect them. In the year 2006 the Government
of Kenya devised a way of helping young people in growing their business. The
government also availed funds to initiate new business starts ups through the Youth
Enterprise Development Fund (Munene, 2013).
White and Kenyon (2011), argue that social and cultural identity is mostly promoted
through youth enterprises, as is a stronger sense of community where young women and
men are valued and better connected to society. Youth enterprises empower young
5
people, especially the marginalized youth. They offer a sense of meaning and belonging
as well as supporting innovations in communities. This can shape the identity of youth
and encourage others to treat them as equal members of society, (White & Kenyon,
2011).
Naikuru (2017), explains that efforts to initiate youth led MSEs were formally
actualized through the creation of policy documents such as Sessional Paper No. 2 of
1992 on Small Scale and Jua kali enterprise, the 1997 – 2001 Development Plans, the
National Poverty Eradication Plan of 1999 – 2015 and the Sessional Paper No. 1 of
2005 on Education Training and Research. She further observes that consequently,
entrepreneurship training was made compulsory for youth undergoing training in all
courses offered at tertiary institutions as well as in national universities with a hope that
after the training, these youths will opt for self-employment initiatives by starting their
own sustainable business enterprises. Youth fund was thereafter launched to enable the
youth access the seed capital required to start their MSE's. Youth have also informally
engaging in their owned MSEs as a way of earning a living throughout the country.
(GOK, 2004) as cited by (Kithae, 2012).
1.1.3 Growth of Enterprises
In his studies, Mao (2009) explained that growth is used to describe a development
process of enterprise from small to big and from weak to strong. The meanings of
development exceed the meanings of growth, and it includes not only the growth
process of things, but the generation stage growing out of noting before growth and the
periodic process of the stage, i.e. the cycle process going round and round, (Mao, 2009).
However, it is noted that the enterprise growth is a complex adjustment process which is
different to the simple scale extension. It takes the balance adjustments of various
relations in the interior and the exterior of the enterprise as the essential character, and it
is the process of balanced development from unbalance to balance, and from lower
balance to higher balance. Therefore, the meanings of enterprise growth is the
6
development process that enterprise keeps the tendencies of balanced and stable growth
of total performance level (including output, sales volume, profit and asset gross) or
keeps realizing the large enhancement of total performance and the stage spanning of
development quality and level, (Sun, 2004).
In understanding enterprise growth the time property of enterprise growth the premise to
analyze the growth of enterprise is long period in which the long-term development
tendency and process of enterprise are observed, and it is not the status of enterprise in
certain time point (Mao, 2009). The growth of enterprise is not a stable process without
troubles. In the growth process, MSEs always transits from balance to unbalance, and
the result is to transit from unbalance to balance and from lower balance to higher
balance through unbalance. MSEs growth is the unification of quantity and quality. The
increase of quantity is embodied in the extension of MSEs scale such as the increases in
sales volume, market share, production value, profit and employee. The growth of
quality is embodied in the enhancement of MSEs quality, which includes the
technological innovation ability from immature to mature production technology, the
optimal efficiency of investment and output, the organizational innovation and reform
(Sun,2004).
1.2 Statement of the Problem
The Kenyan government, in line with the Medium Term Plan (MTP) of Vision 2030,
chose to support entrepreneurship development through the start-up and growth of youth
enterprises. The government’s policy towards youth owned MSEs was an important
factor taken into consideration when looking at the available opportunities that MSEs
have for enhancing their business growth, (Gatt, 2012). The Kenyan government
through its budget allocations has demonstrated its interest and acknowledgement of the
crucial role entrepreneurship plays in economic development, and hence, it came up
with policies for energizing and supporting youth owned MSEs i.e. via the Youth
Enterprise Development Funds (YEDF). The government availed funds to support
7
youth-owned business ventures. Since its inception, the funds have advanced loans
worth KSH 11.9 billion to 886,303 youth enterprises in Kenya (ROK, 2016). The funds
were supposed to assist the young people in self-employment initiatives that would lead
to profitable businesses through increased sales, business growth and employment
creation.
Gichuki, Njeru & Trimba (2014) studies on the challenges facing mico and small
enterprises in accessing credit facilities in Kangemi Harambee market in Nairobi
County, explained that MSEs encounter unique issues. They further explain that these
issues do affect their growth and profitability and hence, decrease their ability to
contribute effectively towards sustainable development. Among those issues was
inadequate access to credit facilities. Other challenges included access to market,
adoption of technology and legal and regulatory environment. The central role of MSEs
focuses on employment, industrial transformation, and poverty reduction.
Competitiveness and growth prospects of MSEs are noted to have fallen below the
levels that are required to meet the challenges of an increasing changing MSEs business
environment as a result of competition (Moyi & Njiraini, 2005).
However in spite of the availed government’s funds via the YEDF to support
entrepreneurship through youth owned enterprises. Youth owned MSEs have not made
significant impact on growth in relation to sales turnover, profitability, expansion of
MSEs and creating employment opportunities and income for the poor. MSEs are the
majority at about 70% of the total business operations in the country (Okafor, 2012).
They employ about 74.2% of the Kenyan workforce contributing to about 18.4% of the
country’s GDP (RoK, 2014).
According to the National Economic Survey report by the Central Bank of Kenya
(CBK) SMEs constitutes 98% of all business in Kenya. They also create 30 percent of
the jobs annually as well as contribute 3% of the GDP. The report further indicates that
80% of the 800,000 jobs created in that year came from the informal sector which is
8
dominated by the SMEs. SMEs have indeed continued to perform much better compared
to MSEs. Franklin (2017) explains that currently in Kenya out of the working age
population of 24 million, one in every six young Kenyans is unemployed. These indicate
that many young people have not fully embraced entrepreneurship as an alternative
source of employment. Considering the significance of MSEs in Kenya, the study
therefore investigates the determinants of growth in youth owned micro and small
enterprises in Kenya.
1.3 Objectives the Study
1.3.1 General Objective
To examine the determinants of growth in youth owned micro and small enterprises in
Kenya.
1.3.2 Specific Objectives
1. To examine how access to seed capital influences growth in youth owned micro
and small enterprises in Kenya.
2. To establish how legal and regulatory environment affects the growth in youth
owned micro and small enterprises in Kenya.
3. To examine the effect of access to market on the growth in youth owned micro and
small enterprises in Kenya.
4. To establish the influence of technology adoption on the growth in youth owned
micro and small enterprises in Kenya.
5. To examine the moderating effect of entrepreneurial characteristics in the growth
of youth owned micro and small enterprises in Kenya.
9
1.4 Hypotheses
Ho1: Access to seed capital does not influence growth in youth owned micro and small
enterprises.
Ho2: legal and regulatory environment does not affect growth in youth owned micro
and small enterprises.
Ho3: Access to market does not affect growth in youth owned micro and small
enterprises.
Ho4: The level of technological adoption does not influence growth in youth owned
micro and small enterprises.
Ho5: An entrepreneurial characteristic does not have a moderating effect on the growth
in youth owned micro and small enterprises.
1.5 Significance of the Study
The study findings are expected to assist policy makers in coming up with appropriate
measures that will address the growth challenges faced by youth owned MSEs in the
country. The government can also use the findings of this study to assist in policy
formulation and development for a framework for critical access to credit, legal and
regulatory, access to market, and adoption of technology as the determinants that affect
the growth of MSEs.
The research findings also provide information for suggesting improvement in service
delivery of the respective sectors that facilities growth of MSEs in Kenya. The private
sector together with the Non-Governmental Organizational (NGOs) can also use the
findings to develop various strategies and programs that aim to empower the youth and
address the challenges they face in the operations and management of their MSEs.
10
The results of this study also gives feedback to the existing financial intermediaries that
are supporting youth owned MSEs on the effects of their services to youth owned MSEs
in relation to accessibility of credit. The findings of this study will help MSEs in the
country, into the benefits of using different factors studied in this research to predict the
factors that affect the growth of their businesses. Findings from this study will assist
academicians in broadening of the prospectus with respect to this study hence providing
a deeper understanding of the critical factors that affect the growth of MSEs.
1.6 Scope of the Study
The study sought to establish the determinants of growth in youth owned micro and
small enterprises, a study of Nairobi County. Nairobi County is currently the highest
beneficiary of youth empowerment support funds, for example since the inception of the
youth enterprise development funds the County has received 2.3 billion which translates
to 20% of the total amount disbursed by the government (ROK, 2016). Nairobi County
has also a total of 35,238 youth owned funded enterprises which translates to 13.5%.
The study focused on the determinants of seed capital, legal and regulatory,
entrepreneurial marketing, adoption of technology and entrepreneurial characteristics.
The study concentrated on the owners of the MSEs. The study was undertaken to
research on activities within the scope of the issues addressed by the research objectives.
The study reviewed the past activities and this will be explained by the literature review
of the study.
1.7 Limitations of the Study
The researcher experienced a number of challenges during the period in which the study
was undertaken. One of the challenges was locating youth owned MSEs previously
supported by the youth enterprise development funds. A number of MSEs in Nairobi had
shut down their operations and others relocated their businesses elsewhere. MSEs were
also not permanently located at a particular place where they could be found all the
11
time. For example some MSEs were engaged in hawking and personal selling as a way
of reaching out to potential customers and that made it difficult to interview them.
However, questionnaires were administered to those who were highly mobile for them
to fill them up at their own convenient time. Some respondents were also uncooperative
and failed to fill up the entire questionnaire or failed to present it back completely.
Travel and other logistics were also a big challenge due to limited financial capacity.
1.8 Delimitation
In mitigation, a humble explanation to the respondents on the importance of the study
was made. The explanation indicated to them that the recommendations of the study
were geared towards improving the MSE sector in Kenya. It was further clarified that
the study was solely for academic purposes. To increase the respondent’s questionnaires
response rate, venues where youth owned MSEs frequented for networking purposes
were identified and used as appropriate places to give out the questionnaires. The
respondents were allowed to fill the questionnaires at their own free time. The
questionnaires then would be picked up later by the research assistant.
12
CHAPTER TWO
LITERATURE REVIEW
2.1 Introduction
This chapter reviewed scholarly literature and provided the conceptual and theoretical
foundation of the determinants of growth of youth owned micro and small enterprises
and the postulated variables. The chapter further reviewed the meaning of the concept
from the perspectives of various scholars regionally and globally. The chapter also
highlighted the gaps in the existing literature whose investigation is the subject of the
current study. The chapter has seven sections the first section is the introduction whereas
the second section covered the theories and models used in the study. The third section
is the conceptual framework and the fourth section covers secondary research. The fifth,
sixth and seventh sections covered empirical review, critique and research gaps
respectively.
2.2 Theoretical Frame Work
Theoretical frameworks are explanations about the phenomenon. A theoretical
framework provides the researcher the lens to view the world. A theoretical framework
can also be thought of as a map or travel plan. Theories are meant to explain, predict and
master a certain phenomena e.g. relationships, events, or behavior. The chapter
developed theoretical review, conceptual framework, empirical review that was used in
the study in regard to each variable in the study. This study was based on Resource
Based Theory, Market Orientation Theory, Adoption Theory and Psychological
Entrepreneurship Theory. Many theories have been established in an attempt to explain
the growth of MSEs. These models are many and varied. However, not a single theory
has adequately offered an explanation why some enterprises grow and others fail. This
study sought to concentrate on four widely acclaimed theories that attempt to offer an
explanation on the framework of enterprises growth.
13
2.2.1 Resource Based Theory
The resource-based theory of entrepreneurship explains that access to resources by
MSEs is an important indicator of opportunity based entrepreneurship and new MSEs
growth, (Alvarez & Busenitz, 2001).This theory emphasizes the importance of financial,
social and human resources in support of youth owned MSEs (Aldrich, 1999). Hence,
access to resources enables the MSEs ability to detect and act upon different
opportunities that may arise, (Davidson & Honing, 2003). It is also of importance to
note that financial, social and human capital are representatives of three classes of
theories under the resource-based entrepreneurship theories that are very important in
the determination of growth of MSEs.
Nkansah (2011) argues that this theory explains how entrepreneurs build their
businesses from the available resources they possess or can be able to acquire in order to
gain a sustainable business competitive advantage and growth prospects. The resource-
based theory also notes that the choice of which industry to venture and what business to
undertake is not enough to ensure successful business growth. The theory says that
nature and the quality of the resources that entrepreneurs possess and can acquire can
lead to long-run success. The resource-based theory recognizes six types of resources:
financial, physical, human, technology, reputational and organizational. These six types
of resources are broadly drawn and they include all assets, capabilities, organizational
processes, firms’ attributes, information and knowledge, (Nkansah, 2011).
The theory further explains that tangible assets are physical resources which can be seen
and evaluated. They include plant, equipment, land, stocks, financial (debtors, creditors,
cash in hand and at bank). It further states that intangible assets are those items that
cannot be seen and quantified. For example, reputational resources like trademarks,
patents, brand and goodwill as well as networks, individual and group skills,
interactions and the organizational routines and processes used to organize and co-
ordinate these resources. The theory also notes that external resources critical for the
14
success of business enterprises include relationships with and knowledge acquired
through suppliers and customers, competitors and institutions like universities
(Simpeh,2011).
2.2.2 Market Orientation Theory
Market orientation theory holds that the key to achieving organizational goals is being
more effective than competitors in integrating marketing activities to determine the
needs of target markets, (Kotler, 1999). Firms with better understanding of their
customers, competitors and environment have a competitive edge. Enterprises should
thus strive to understand customer needs which should then be translated into products
or services. To achieve this, enterprises need market information to effectively market
its products. Market research and consumer analysis are important to enable firms meet
their customer needs to remain competitive. Market orientation aims at delivering
superior customer value. There is a positive relationship between market orientation and
firm performance, (KIPPRA, 2006).
Another close link to market orientation theory is the evolutionary systems change
theory which explains that the ability of a firm to survive and succeed depends upon its
ability to search for and respond to the needs of the market niches. However market
systems are dynamic, changing in response to evolving needs and the behavior of
competitors; making the market system to be in a continuous shift towards
disequilibrium. Firms thus need to adapt to the new environment and find a competitive
edge through improvements, maintaining high quality, selecting strategic market sites,
promoting products and services, identifying niche markets and access other markets
outside their localities. Relationship marketing theory posits that customers are
increasingly looking for suppliers who provide value not only in terms of acceptable
prices and an attractive range, but also in terms of relationship value. This approach
leads to the need for relationship marketing which is defined as establishing, developing
and maintaining successful relational exchanges, (KIPPRA, 2006). The theory further
15
explains that collaborative relationships, networks and processes, encompassing
horizontal and vertical stakeholder relationships is an important effort to improve
customer value. Firms need to develop customer relationship to obtain and retain
customers.
2.2.3 Adoption Theory
According to Straub (2011), technology adoption is a complex, inherently social,
developmental process. He further notes that individuals construct unique but malleable
perceptions of technology that influence the adoption process. He concludes that
successfully facilitating a technology adoption needs to address cognitive, emotional,
and contextual concerns. Rogers (1995) further asserts that potential adopters of a
technology progress over time through five stages in the diffusion process. He notes that
first, they must learn about the innovation knowledge, second they must be persuaded of
the value of the innovation, and they then must decide to adopt it (decision). He further
notes that the innovation must then be implemented, and finally, the decision must be
reaffirmed or rejected (Mairura, 2017).
According to Oliveira & Martins, (2011) diffusion of innovation theory (DOI) is a
theory of how and why, and at what rate new ideas and technology are spread through
cultures, operating at the individual and firm level. The theory, however, does not
specifically point out at specific business types in addressing issues of technology
adoption. DOI theory evaluates innovations as a process that is communicated through
certain channels over a period of time and within a particular system in the society
(Rogers, 1995). The theory also argues that business owners must be in possession of
different capabilities and the willingness to adopt innovations, and thus it is normally
observed that the percentage of the population adopting an innovation is approximately
normally distributed over time, (Rogers, 1995). According to the DOI theory at the
organizational level innovativeness is related independent variables i.e. organizational
16
leader characteristics, internal organizational structural and external factors of the
organization, (Oliveira & Martins 2011).
Oliveira & Martins, (2011) argue that individual characteristics are able to describe the
leader’s attitude toward embracing change in an organization. They further note that
internal characteristics of the organizational structure include observations according to
Rogers, (1995) through centralization whereby power and control in a system are
concentrated in the hands of a few individuals. The theory further notes that complexity
issues relate to the degree in which organization’s members are able to acquire a
relatively high level of knowledge and expertise in relation to the technology adoption.
Formalization is the extent to which an organization encourages its members with a
view of embracing changes that are brought along by embracing new technology. The
theory acknowledges the importance of organizations ability to avail uncommitted
resources that are available to an organization to enhance its capacity of handling and
affording new technology (Oliveira & Martins (2011). The theory, however, does not
touch much on MSEs but looks at the whole issue of technology in a broader
perspective. The theory emphasizes on the business owners creativity as key to
acquiring new and appropriate technology that can forester growth in firms.
2.2.4 Psychological Entrepreneurship Theory
Psychological Entrepreneurship Theory explains the personal characteristics that are
used to define entrepreneurship. The theory notes that personality traits need for
achievement and locus of control are seen and empirical evidence presented for three
other new characteristics that have been identified as closely associated with
entrepreneurial inclination. These include risk taking, innovativeness, and tolerance for
ambiguity (Mohar, Singh, & Kishore (2007). Recent finding on risk taking strengthens
earlier empirical studies which had indicated that aversion to risk declines as wealth
raises, that is, one’s net assets and value of future income. He further argues that that
success in entrepreneurship, by increasing wealth, can reduce the entrepreneur’s degree
17
of risk aversion, and encourage more venturing. In his view, entrepreneurship is
therefore being a self perpetuating process. Further evidence also suggests that some
entrepreneurs exhibit mildly risk-loving behavior. These individuals prefer risks and
challenges of venturing to the security of stable income (Szpiro, 1986). It has been
further argued that some of the characteristics or behaviors associated with
entrepreneurs are that they also tend to be more opportunity driven in their business
ventures. Many of these entrepreneurs demonstrate high level of creativity and
innovation, by showing high level of management skills and business know how.
Innovative entrepreneurs have also been found to be optimistic, emotionally resilient
and have mental energy, they are hard workers, show intense commitment and
perseverance, thrive on competitive desire to excel and win, tend to be dissatisfied with
the status quo and desire improvement. Innovative entrepreneurs are also
transformational in nature, who are lifelong learners and use failure as a tool and
springboard. They also believe that they can personally make a difference, are
individuals of integrity and above all visionary (Simpeh, 2011).
The theory further explains that an entrepreneurial characteristic gives an understanding
of these traits or inborn potentials. It explains that personality traits could mean making
inference from behavior. It is also important to note that some of the characteristics or
behaviors associated with entrepreneurs are that they tend to be more opportunity driven
demonstrates high level of creativity and innovation, and show high level of
management skills and business know how. Entrepreneurs have also been has also been
found to be optimistic, they are able to see the cup as half full than as half empty, they
are emotionally resilient and have mental energy, they are hard workers, show intense
commitment and perseverance, thrive on competitive desire to excel and win, tend to be
dissatisfied with the status quo and desire improvement. Entrepreneurs are also
transformational in nature, people who are lifelong learners and use failure as a tool and
springboard. They also believe that they can personally make a difference in society and
are individuals of integrity and above all visionary (Simpeh, 2011).
18
However it is important to note that the trait model is still not supported by research
evidence. The only way to explain or claim that it exists is to look through the lenses of
one’s characteristics behaviors and conclude that one has the inborn quality to become
an entrepreneur.
Eser & Ozdemirci (2016) explained that according to Thompson (2004) today’s
environment we need talent of entrepreneurs more than ever, and we need them to start a
business. But he further notes that the difficulty is that we only know them when they
appear. He further developed a BTEI (Bolton Thompson Entrepreneur Indicator) where
he made an effort to identify those who are most likely to succeed as entrepreneurs,
regardless of the context. Thompson makes a distinction between enterprising person
and entrepreneur. He states that being innovative and creative in what one’s doing is not
the same as building something new. His other view was that everyone cannot be an
entrepreneur and people should not be encouraged to believe so. He concludes that
knowledge without talent and temperament is useless in becoming an entrepreneur
(Thompson, 2004).
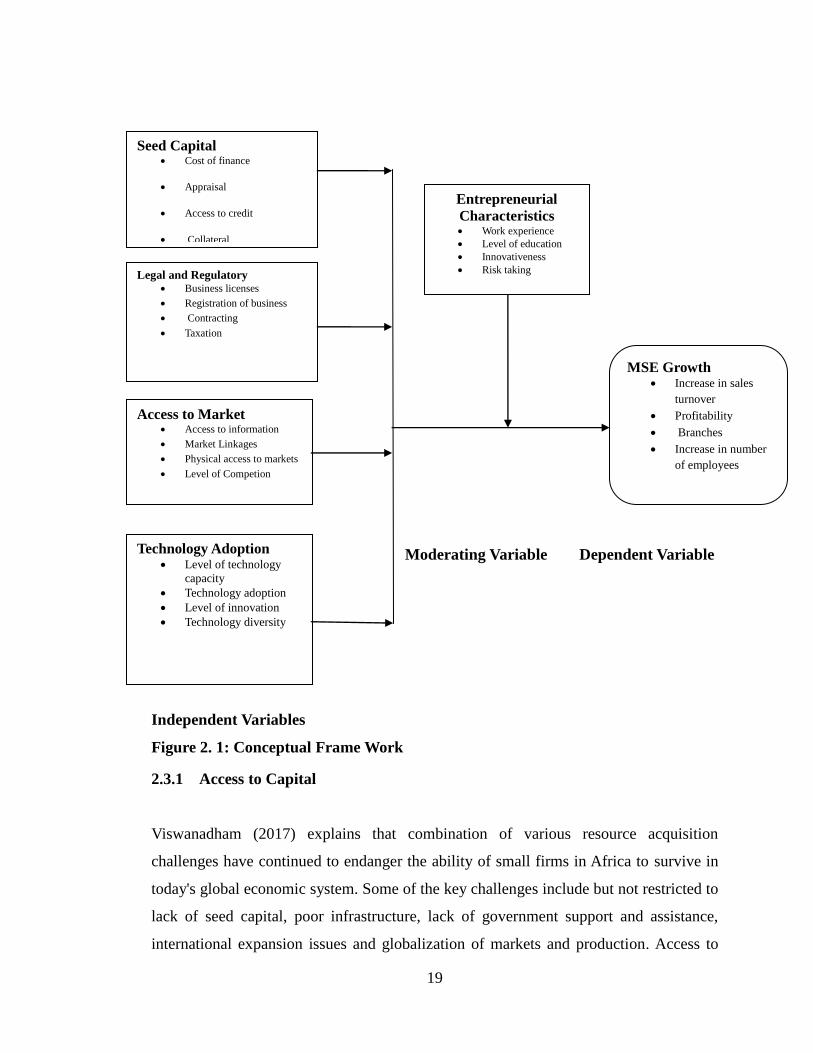
2.3 Conceptual Frame Work
Mugenda & Mugenda (2008) defines conceptual framework as a concise description of
the phenomenon under study. According to Young (2009), conceptual framework is a
diagrammatical representation that shows the relationship between dependent variable
and independent variables. A conceptual frame work is made up of dependent,
independent and intervening variables. According to Saunders (2003), a dependent
variable is the variable that changes to other variables whereas the independent variable
is the variable that causes change to the dependent variables. A moderator variable is
one that has a strong contingent effect on the independent variable relationship such that
its presence modifies the original relationship between the independent and the
dependent variable, (Sekaran, 2010). Figure 2.1 presents the conceptual framework used
in this study.
19
pendent Variables
Independent Variables Moderating Variable Dependent Variable
Independent Variables
Figure 2. 1: Conceptual Frame Work
2.3.1 Access to Capital
Viswanadham (2017) explains that combination of various resource acquisition
challenges have continued to endanger the ability of small firms in Africa to survive in
today's global economic system. Some of the key challenges include but not restricted to
lack of seed capital, poor infrastructure, lack of government support and assistance,
international expansion issues and globalization of markets and production. Access to
Seed Capital Cost of finance
Appraisal
Access to credit
Collateral
Legal and Regulatory Business licenses
Registration of business
Contracting
Taxation
Access to Market Access to information
Market Linkages
Physical access to markets
Level of Competion
Technology Adoption Level of technology
capacity
Technology adoption
Level of innovation
Technology diversity
Entrepreneurial
Characteristics Work experience
Level of education
Innovativeness
Risk taking
MSE Growth Increase in sales
turnover
Profitability
Branches
Increase in number
of employees

20
seed capital means the supply of credit finance to MSEs when demanded. Improving
capital access means improving the extent to which financial services are available to
MSEs at a fair price (CGAP, 2010). Capital structure has proved to be a perennial puzzle
in finance, (Aleke 2011) The original Modigliani and Miller, 1958 and 1963
propositions highlighted the important issue involved in financial structure decisions
namely: the cheaper cost of debt compared to equity, the increase in risk in the cost of
equity as the debt increase and the benefit of tax deductibility of debt. The conclusion
was that with taxes and deductibility of interest charges, firms should use as much debt
as possible.
According to Jalilian & Kirkpatrick (2010), there is substantial theoretical literature on
financial sector depth which use measures of financial depth collected from financial
institutions themselves, such as the total value of bank deposits, or private credit, which
do not capture the distribution of these bank deposits or credit across the population. In
many countries, household survey evidence shows that most bank deposits and loans are
held by only a small proportion of the population with relatively high incomes, and that
relatively few people have access to any kind of formal financial services. Many people
rely instead on informal or semi-formal providers such as microfinance institutions or
cooperatives etc. for which data is not usually available.
Provision of loans to very small businesses and it is an increasingly becoming a
common weapon in the fight to reduce poverty and promote economic growth.
Businesses often use these lines of credit to expand, explore new areas of their industry,
acquire another company, or pay employees. These are essential to the overall success of
a business. It has been noted that the lack of access to credit has been indicated as a key
problem for SMEs worldwide. In some situations, where credit is available, again the
entrepreneur may find difficulties because of the lending conditions that may require
collateral for the loan. Further review indicates that credit constraints operate in variety
of ways for entrepreneurs. Capital market force entrepreneurs to rely on self-financing
or borrowing from friends or relatives. The lack of access to long term credit for small
21
enterprises has often forced them to rely on high cost short term finance. For many
SMEs the formal banking system is too expensive and inconvenient, (Mokua, 2013).
Lending to small businesses has also been seen to be time consuming and costly for
banks and other financial lending institutions. Small enterprises are again said to lack
proper accounting procedures and owners easily mix their business and personal
finances. This makes their financial statements often unreliable. Banks consider MSEs
with no transaction history as too risky because their ability to repay loans is not yet
known. These MSEs may also not be in a position of availing collateral to access formal
credit. Another issue with unbanked MSEs is their lack of skills to run the business
professionally. Many of them lack proper inventory systems, bookkeeping procedures,
business plans or income statements. This makes it hard for banks and other lending
institutions to evaluate their financial performance, (Frempong, 2010).
Youth owned MSEs collateral requirement have been noted as an obstacle to youth-
owned MSEs growth. Scholars have noted that of lack of collateral could be ranked as
obstacle number two from lack of finance. The lack of collateral is the most widely cited
challenge encountered by MSEs accessing finance. Many MSEs for example may be
unable to provide sufficient collateral because it is too new or is not firmly enough
established, (Olawale & Garwe, 2010). Lending to MSEs has been seen as a high-risk
business since most of these enterprises lack collateral. The challenge does not appear to
be the lack of funds but it’s on how to make the funds accessible to MSEs, (Kihimbo,
2012). There are a number of lending institutions such as banks and nonbank financial
institutions that are willing to provide credit to MSEs although the businesses are not
able to meet the requirements from these financial institutions. Among these
requirements is the issue of collateral, which most MSEs cannot provide, (Ackah &
Vulvor, 2011).The demand for collateral by banks and other financial institutions affects
the growth of MSEs, (Kunateh, 2009). Finally lending to MSEs has been based on
collateral than it is the case for loans borrowed by bigger firms. This had lead to the
situation in which lending is no longer based on expected return but rather upon access
to collateral requirements. Many MSEs lacking access to good collateral end up
22
suffering from credit rationing, (Ndumana, 2013).
2.3.2 Legal and Regulatory
An enabling environment legal and regulatory environment is important for the MSE
sector to play effective role as an engine for economic growth, poverty eradication and
employment creation. Despite the significant achievement made in reforming the legal
and regulatory framework, a number of existing laws and regulations are still
cumbersome and are hostile to the growth of MSE sector, (Nteere, 2012). Regulatory
constraints also pose serious challenges to MSEs development and although wide
ranging structural reforms have led to some improvements, prospects for enterprise
development remain to be addressed at the firm-level. The high start-up costs for firms,
including licensing and registration requirements, can impose excessive and
unnecessary burdens on MSEs. The high cost of settling legal claims, and excessive
delays in court proceedings adversely affect MSE operations. In the case of Ghana, the
cumbersome procedure for registering and commencing business are key issues often
cited.
The World Bank Doing Business Report (2006) cited in Abor & Quartey (2010),
indicated that it takes 127 days to deal with licensing issues and there are 16 procedures
involved in licensing a business in Ghana. It takes longer (176 days) in South Africa and
there were 18 procedures involved in dealing with licensing issues. Meanwhile, the
absence of antitrust legislation favors larger firms, while the lack of protection for
property rights limits MSEs’ access to foreign technologies. The legal and regulatory
environment still impend business operations, thus scaring away potential investors and
squeezing revenues from those in operations. As such, there is need for a business
environment that is at par with international best practice so that the country can attract
the requisite private investments. There has been complains regarding tedious
registration and certification process in Kenya. Various bodies have their requirements
and require money and time. One option left to an entrepreneur is to evade the process
23
but this process is more expensive at the end because of penalty charged, (Wanjohi,
2009).
Registration of business names, obtaining licenses, adhering to statutory requirements,
taxation and contracting still poses major challenges to MSEs in Kenya. Contracts
involve long legal processes such as leasing, drawing up business contracts, legal
representation and other aspects that place the MSEs in a disadvantaged position. Most
of these enterprises find these processes lengthy and time consuming, hindering growth
or expansion of enterprises (Muraguri, 2010). According to KRA , the principle factor
contributing to poor tax collection include; poor compliance at the informal sector
economy, narrow coverage of the existing tax instruments, poor administration and tax
collection efforts. As a result of poor taxation system, the costs of running business in
Kenya continue to heighten.
2.3.3 Access to Market
According to Muthee (2014) entrepreneurial marketing is a central concern of
entrepreneurial research, even though entrepreneurs are not typically marketing experts.
It is further argued that Entrepreneurial marketing represents an exploration of ways in
which entrepreneurial attitudes and behaviors can be applied to the development of
marketing strategy and tactics (Jones, 2013). Access to markets and marketing
information remains a severe constraint to MSEs development and competitiveness in
Kenya. Overall aggregate demand in low market are saturated due to dumping and over
production and in many cases market do not function well due to lack of information
and high transaction cost, (Nteere, 2012). Prescribed policies to address these challenges
seem not to be effective, (ROK, 2005). Most of the MSEs are ill prepared to compete in
globalised liberalized markets while fewer are capable of venturing into the export
markets to tap into new market frontiers. This confines majority of MSEs to narrow
local markets characterized by intense competition. It has been noted that small capital
base and limited technology also confines MSEs to poor product quality that cannot
24
compete effectively in a global competitive market environment, (KIPPRA, 2006).
MSEs seem ill equipped to embrace opportunities presented while confronting
challenges of globalization. Globalization offers MSEs Opportunities to participate in
the regional and international markets while internationalization presents opportunity for
growth and development beyond the local market. However globalized production by
multinationals presents new threats in form of increased competition., (Kaushalesh &
Peedoly, 2012) Limited access to global markets denies MSEs significant opportunities
confining them to saturated local markets whereas internationalization is necessary for
their survival and expansion.
Barriers that limit MSEs internationalization include limited information on foreign
markets and technology, lack of managerial skills, limited knowledge, limited resources
to finance exports, inefficient transactions and limited product and service quality to
meet customer requirements, (OECD, 2010). The ability of MSEs to survive in an
increasingly competitive global environment is largely dependent upon their capacity to
leverage information as a resource and to benefit from the value of information. MSEs
need ready access to comprehensive relevant information since they operate in severe
time and capacity constraints. They require information on business trends and markets;
business environment, legal and regulatory aspects, business management, customer
needs, business expansion and diversification; technology; business opportunities;
linkages and business partnerships, (Schleberger, 2010). Limited access to opportune,
current, relevant and adequate information is a notable constraint to MSEs in Kenya.
The enterprises struggle to gain access to important information needed for improved
productivity, customer satisfaction, improved cycle time and opportunities at the market
place, (Hanna, 2010).
Market signals on business opportunities and customer trends are not communicated
effectively to MSEs, who perform better in information rich environments, (KIPPRA,
2006). Major challenges in relation to market information relate to acquisition and
capacity to interpret and effectively use the acquired information. Without access to
25
timely, simplified, reliable and relevant information on market opportunities, production
technology, the sector is unable to survive and grow in a highly globalised and
competitive market environment, (ROK, 2005). Even though acquisition of information
is costly in developing countries, there is evidence to suggest that MSEs are willing to
pay significant sums for relevant information where available, (KIPPRA, 2006).
Difficulties associated with information acquisition have negative implications; lack of
information may reduce the extent of mutually beneficial exchanges and lead to
uncertainty concerning economic decisions in the enterprises, Information asymmetries
leads to high transaction costs, uncertainty and therefore market failure, (Matambalya &
Wolf, 2002).
2.3.4 Technology Adoption
Jolly (2011) explains that adoption is a decision of full use of an innovation as the best
course of action available and rejection is a decision not to adopt an innovation Rogers
further defines diffusion as the process in which an innovation is communicated
thorough certain channels over time among the members of a social system. As
expressed in this definition he notes that, innovation, communication channels, time,
and social system are the four key components of the diffusion of innovations (Mairura,
2017). Rogers (2003) further categorized technology adopters into four categories that
include innovators who tend to be experimentalists and techies interested in technology
itself, early adopters who may be technically sophisticated and interested in technology
for solving professional and academic problems, early majority who are pragmatists and
constitute the first part of the mainstream and late majority who are less comfortable
with technology and are the skeptical second half of the mainstream. Finally he
describes the laggards who may never adopt technology and may be antagonistic and
critical of its use by others. According to Morse, (2007) technology capabilities benefits
small businesses in several ways: Technology enhances small businesses efficiency,
reduce cost and broadens market share both locally and globally. Also noted by Lee
26
(2001) a small business that adopts greater levels of technology can be expected to grow
more rapidly than a similar firm that does not. Yusuf (2003) explains that low
technology capabilities hider and discourage small businesses from fully reaching their
potential.
Muthoni, Omato & Kithinji, (2013) argues that the history of technology development
in relation to small enterprises in developing countries started with the emergence of
Appropriate Technology (AT) Movements in the 1970s. The AT movements saw
technology as a resource that can only be useful if adapted by businesses to improve
their efficiency and factor productivity. The AT was initiated by international
organizations, (ILO/ UNDP, 2000).Technology is judged appropriate not just in terms of
their level of sophistication and complexity but also with regard to their suitability to
particular social context and their consistency with desired social goals. Technologies
used by SMEs in developing countries might be inappropriate because their choice is
based on insufficient information and ineffective evaluation, (Harper, 1987). According
to Kaplan (2000), firms should have new approaches that examine accumulation of
technological capacity at the level of the firm. Lall (1992) suggests that capabilities
assist a firm to access, identify, implement, absorb and develop knowledge that
advances its position in the market. Dhungana (2003) argues that the ability of
developing countries to receive, transfer, adopt, develop and manage technologies
depends on development of endogenous technological capability and human resources.
Kenya has put a lot of emphasis on human capital development as a way of facilitating
economic growth. Training nurtures creativity, critical thinking, produces innovative
and adaptive human resources with appropriate skills and improves attitude and values
for wealth creation, employment and prosperity. Lall (1999) suggests that education, on
the other hand contributes to development of technical skills. The desire for
competitiveness requires that countries shift from simple operational skills to advanced
innovative skills. Dadabi (2003) submits that good technology may cost more initially
but it later works effectively for a longer time. Small businesses that try to minimize
27
initial capital investment may end-up acquiring outdated and inefficient technologies.
These happen since they are forced to look at short-term profit, rather than long-term
returns. They end up obtaining obsolete tools and equipments which makes their
operation unviable in the longer-run, (Muthoni, Omato & Kithinji 2013).
2.3.5 Entrepreneurial Characteristics
Entrepreneurs enter into business with different motives. Some will enter because they
have identified a market opportunity and there is need to utilize their skills, others to
generate income, while others will enter into business because of the desire for
independence to be one’s own boss, (McCormick & Pedersen, 1996; Dutta, 2009). Other
factors that may attract or pull an entrepreneur into business are financial incentives, a
hobby, previous work experience and family culture acting as a role model, (DATI,
2000). On the other hand factors such as lack of employment, retrenchment, retirement
or death of a breadwinner are likely to push one into business. The characteristics of an
entrepreneur are widely accepted as vital ingredients that influences business growth.
Research indicates that particular characteristics of the entrepreneur that are associated
with growth of the enterprise include motivation, previous management experience and
demographics of the entrepreneur i.e. age, education. If the entrepreneur’s reasons for
starting the business originated in pull or opportunity driven motivates rather that push
or necessity driven motivates, the resulting enterprise is more likely to grow.
Research in developed countries has shown that an entrepreneur’s level of education
may be associated with MSEs characteristics, such as growth and performance. This is
because higher levels of education are associated with greater verbal communication
and comprehension skills, all of which are important in business decision making and
management, (McCormick & Pedersen, 1996). Previous experience from an
entrepreneurial activity or occupation is considered to be an incentive for one to become
a successful entrepreneur. McCormick & Pedersen (1996) found that entrepreneurs with
no previous occupation began firms which were relatively small and remained in the
28
smallest category. On the other hand it was found that the largest enterprises were
almost entirely set up by entrepreneurs with previous experiences either in
manufacturing or in the retail trade.
2.3.6 Micro and Small Enterprise Growth
In general, MSEs are an integral element of the informal sector in most developing
countries. In the majority of cases, these enterprises are initially informal but gradually
some of them survive and become formal businesses, thereby providing the foundation
of modern private companies, (Cook & Nixson, 2011). Hence, the growth of these
enterprises is part and parcel of a dynamic growth process in the corporate sector, as
argued by, (Liedholm & Mead 1994 &, Prasad 2005). As noted by Cook & Nixson
(2011) although a number of measures have been used to identify and describe MSEs,
there is no consensus on any one measure and it is customary to use several metrics,
including the value of fixed assets of the enterprise, enterprise turnover and the number
of employees. Ryan (2005) has pointed out that the term may be used to cover a wide
range of economic activities for an indicative number of employees; for example
survival activities 1 employees, household activities, microenterprise sector (5), small
emergent enterprises (25) and growth businesses (100 employees). It has further been
argued that in poorest countries, on average almost two thirds of their workers are
employed in enterprises with have less than 5 employees while the majority work for
enterprises with less than 100 employees, (Cull, 2004).
During the last 50 years, considerable insight into the characteristics of MSEs has been
gained. Early literature, particularly Staley & Morse (1965), enhanced the
conceptualization of the main characteristics of MSEs and the pattern of growth of these
enterprises. However, Anderson (1982) notes that there was lack of basic data on the
management and characteristics of MSEs. Industrial censuses tended to concentrate on
large enterprises; censuses of MSEs were often non-existent or quite infrequent and
published after a long delay. The lack of data hampered any attempts to undertake
29
serious empirical work on measuring the characteristics of MSEs and explaining the
behavior of these enterprises, (Cook & Nixson , 2011).
However, during the 1980s, some efforts were made to collect baseline data on MSEs
by, among other tasks, identifying universes, constructing samples and devising methods
to deal with incomplete entries. However, due to poor book keeping by MSEs, the data
were often incomplete, unreliable and not repeated across samples. Hence, while the
baseline data could be used for measuring the characteristics of MSEs, it was not
adequate for testing theoretical propositions about the expected behavior of the MSEs.
However gradual improvements have been achieved over the years. In the year 1990s,
some basic databases were available for empirical studies aimed at identifying the
constraints facing the growth and development of MSEs in developing countries, (Levy,
1993). One of the main findings from these studies was that the growth and
development of MSEs in developing countries were mainly inhibited by access to
finance, poor managerial skills, lack of training opportunities and high cost of inputs
(Cook & Nixson, 2011). Importantly, further studies especially those conduced in the
late 1990s and thereafter suggest that finance is the most important constraint for the
MSE sector.
2.4 Empirical Review
2.4.1 Seed Capital
The study by Ahiawodzi & Adade (2012), in Accra Ghana analyzed the access to seed
capital and growth of SMEs in the Ho Municipality of Ghana. The objective of their
study was to examine access to credit and growth of MSEs in Ghana and more
especially Ho Municipality. The study was explorative in nature which used survey
method mainly in data collection. The study employed a causal design which aimed at
accessing credit on one side and its effect on growth of SMEs. The survey involved a
sample of 78 SMEs in the manufacturing sector from the Ho Municipality. The study
30
findings indicated that both survey and econometric results show that access to credit
exerts a significant positive effect on growth of MSEs in the Ho- Municipality of Ghana.
The multiple regression analysis results showed that, access to credit, increase in total
current investment, start- up capital and annual turnover have significant positive effect
on the growth of MSEs.
Kuzilwa (2010) did a survey study on the role of credit for small business success in
Tanzania. The Tanzania government through parliament’s approval was to provide loans
to MSEs. The funds were supposed to be loaned out initial borrowers and recovered
with interest so that new businesses would borrow. All potential borrowers were
supposed to go through special training as one of the preconditions for receiving credit.
7,610 applications were received with only 20% being successful for funding, Out of
which 81% were in urban areas whereas 19% of were from rural areas. All entrepreneurs
used the loan for the intended purpose with majority using the credit to fund business
start-up while some undertook investments. The success indicators were; increase in
demand for products, change in investment level, expanding business space, creation of
employment and increase in profits. The study however only focused on the role of
credit towards the success of small businesses.
Macharia (2012) conducted a study on the effects of access to seed capital on MSEs
investment growth in Ongata Rongai Township. The objective of the study was to
establish the effects of access to finance by MSEs in Ongata Rongai Township on their
growth in investments. The research study employed a descriptive design since it sought
to determine the relationship between access to finance and MSEs investment growth.
The findings indicated that first, MSEs derive their finances majorly from: family and
friends, business saving and financial institutions both formal and informal. Secondly,
financial access, regulation, security, literacy, competition and other factors like
transportation, high rent, and debt collection are all constraints that bar investment
growth of MSEs.
31
2.4.2 Legal and Regulatory
Karambu, (2017) conducted a study on commercial banks lending strategies and growth
of micro and small enterprises in Kenya. The research sought to establish how product
accessibility, customer relationship marketing (CRM), collaterals, capacity building and
technological innovation lending strategies by commercial banks influence growth of
MSEs in Kenya. The study did an investigation of the moderating effect of legal and
regulatory environment on the commercial bank lending strategies on the growth of
MSEs in Kenya. This study used descriptive survey design. The researcher used
purposive sampling to select respondents. The sample was purposively selected and
comprised of 352 respondents. The study findings indicated that the interaction between
independent variables and legal regulatory environment (moderator) was negative and
significantly related. The study recommended that commercial banks together with
MSEs need to put in place legal and regulatory framework management strategies.
Bouazza, Ardjouman & Abada (2015) investigated the factors affecting the growth of
SMEs in Algeria. The study objective was to analyze the external and internal factors
affecting the growth of MSEs in Algeria. The results findings reflected in the study
indicated that unfair competition from the informal sector, cumbersome and costly
bureaucratic procedures, burdensome laws, policies, and regulations, an inefficient tax
system, a lack of access to industrial real estate, a lack of access to external financing,
and low human resources capacities are the key business environmental factors affecting
Algerian MSEs. The study recommended that policy makers should strive in
strengthening the legislative and regulatory framework for the creation and development
of SMEs by designing rules according to the think small first principle; in addition,
policies to promote SMEs need to be tailored to each sector. The study however did not
bring out other internal business factors that have affected the growth of MSEs and
critically evaluate how the legal and regulatory environment can address MSEs internal
challenges.
32
2.4.3 Access to Market
Clough (2011) conducted a study on marketing challenges and strategies for MSEs in
east Africa. The research objective was to establish entrepreneurial marketing challenges
faced by MSEs and the opportunities they have identified to grow their businesses. The
research study employed a descriptive design. The research findings indicated that many
entrepreneurs rely on local households as their main source of customers and face a lot
of competition within the local area. They may feel limited in the markets they can
access by their business location, available stock and finances. The findings further
noted that many entrepreneurs perceive lack of finance as a hindrance to their marketing
and business growth yet there is a lot that can be done with quality, price, placement and
promotion within existing business resources. The study recommends that entrepreneurs
need to have a clearer sense of their target customers and understanding of what
motivates them to buy.
Kiveu & Ofafa (2013) conducted a research on enhancing market access in Kenyan
SMEs using ICT. The study objectives to determine the various Market Access
constraints faced by SMEs in Kenya, and to explore opportunities in ICT that SMEs in
Kenya can harness to improve market access. The study was exploratory in nature. To
achieve the research objectives, desk research that used secondary data was employed.
The study findings indicated that ICT holds a lot of potential for enhancing market
access and yet use by SMEs is limited as compared to larger enterprises. The use of ICT
for marketing by SMEs still remains low despite SMEs having access to these tools.
Majority of SMEs use ICT for communication, social networking and general
information acquisition. There seems to be lack of awareness of the range of
opportunities that ICT offers for increased market access. Limited use of ICT for
marketing was also be attributed to perceived high costs of appropriate applications,
security issues and limited knowledge and skills on some ICT applications e.g. e-
commerce. The study recommended the need for awareness creation for ICT use,
improvement in ICT literacy levels and infrastructure, development of user friendly
33
relevant ICT programs for SMEs. The study however did not look into how ICT would
enhance the growth of SMEs and cost implications that SMEs face as they try to
embrace ICT Marketing.
Akwalu (2014) investigated the factors influencing the performance of youth owned
SMEs in Tharaka-Nithi County. His study objective was to examine how access to
market influences performance of youth owned SMEs in Maara Sub-County. The study
used descriptive research design. The study findings indicated that market access
influence the performance of youth businesses. There was relationship between extents
to which the respondents think that the market access influences performance. The study
recommended that more cheaper and efficient marketing strategies be advocated among
youth entrepreneurs to improve their reach to their customers.
2.4.4 Adoption of Technology
In his studies Mairura, (2017) conducted a research on the determinants of modern
automobile technology adoption among mechanics in micro and small enterprises in
Kenya. The main objective of the study was to establish the role of: relative advantage,
compatibility, complexity and observability in the adoption of technology. In the study
technology adoption was the dependent variable. The study adopted a descriptive cross
sectional survey design and employed both probability and non-probability sampling
techniques to collect quantitative and qualitative data from 132 mechanics sampled from
an estimated population of 5,000 mechanics operating in the micro and small
enterprises. The research findings indicated that along with formal education, technical
training and experience levels of the mechanics, the conceptualized variables: relative
advantage, compatibility, complexity and observability of a particular innovation play a
significant role in technology adoption among automobile mechanics in micro and small
enterprises. The study recommends that the relevant stake holders should create and
encourage avenues that enable: technology transfer, technology promotion, technology
deployment, technology innovation, technology development, technology research,
34
technology assessment, technology information and communication, technology
investment, technology collaboration and technology commercialization.
Kenneth & Rebecca (2012) conducted a study on the factors affecting adoption of
electronic commerce among small medium enterprises in Kenya: survey of tour and
travel firms in Nairobi. Their study sought to explore the factors that affect adoption of
electronic commerce among MSEs in Kenya, through a survey of tours and travel firms
in Nairobi. The study used survey research design to collect data from the respondents.
They also used simple random sampling procedure to select a sample that represented
the entire population. Of all of the tour firms surveyed have adopted the use of
electronic commerce in their business transactions in hotel booking, safari tours, emails
and advertising. However, it was noted from the findings that there is low use of
electronic commerce in marketing. This implies that there are still a lot of growth
opportunities for SMEs to utilize electronic commerce for marketing their products and
services. The study recommends the importance of innovation factor and product
positioning as an influence to the uptake of electronic commerce.
Ocha (2011) conducted a study on the factors that influence adoption and frequency of
use of e-commerce by Micro and Small Enterprises in Kisumu. The objective of his
study was to find out the factors that influence the adoption of e-commerce and
frequency of use of e-commerce in Kisumu. The research was carried out in the form of
a survey design. The study established that e-commerce has been adopted and
implemented in MSEs at various levels. Some of the factors that have contributed to the
ease or difficulty of adoption in both the owners and the employees in the enterprises
include the knowledge of benefits of e-commerce, cost of implementing e-commerce,
infrastructure and technical skills needed in implementing and sustaining e-commerce in
the businesses. The research recommended that workshops should be conducted for
MSE’s owners. Its further recommends that employees should be educated on the
importance of and benefits of e-commerce in business.
35
Renny (2011) conducted a study on MSEs sector and existing systems with emphasis on
high-tech oriented entrepreneurship in Kenya. The study objective was to document the
existing government support services to MSEs and draw policy implications for future
support efforts. The broad objective of the research was to document the exiting
government support services to MSEs and draw policy implications for future support
efforts. The study specific objective was to investigate the extent of government support
services to MSEs and identify the technological gaps facing MSEs in Kenya. The
research reviewed existing studies and policy documents on the MSE sector in Kenya,
and it mainly relied on documentary analysis and analytical narratives in order to fully
address the issues raised. The study took stock of the various forms of government
support that is relevant to MSE development in order to understand the gaps in
government support services and specify policy options to fill the gaps. This was
conceptualized into two broad questions: what kind of support and how well the support
is delivered. The study findings indicated that technological situation of MSEs in Kenya
remain an uphill task and more needs to be done in technology development. The study
sited high cost of technology adoption as the major challenge facing MSEs.
2.4.5 Entrepreneurial Characteristics
Abdulwahab & Dame (2015) undertook a study on the impact of entrepreneurs’
characteristics on small business success at medical instruments supplies organizations
in Jordan. Their study surveyed the owners and managers working at these organizations
which consisted of 66 organizations. The studies main hypothesis was entrepreneurs’
characteristics do not have an impact on small business success at Medical Instruments
Supplies Organizations in Jordan. The study findings indicated that the entrepreneurs’
characteristics have positive impact on small business success of the Medical
Instruments Supplies Organizations in Jordan. The study recommended the need to
further investigate more entrepreneurs’ characteristics in the future researches to include
36
more personal entrepreneurs’ characteristics, skill, competencies, and traits of the
entrepreneurs.
Adegbite, Irefin & Abereijo (2007), evaluated the impact of entrepreneurial
characteristics on the performance of small scale manufacturing industries in Nigeria.
The study objective was to identifying these entrepreneurial characteristics and the
factors that influence their translation to optimum business performance. Primary data,
through structured questionnaire, were collected from the samples of 100 firms
randomly selected from among the small-scale manufacturing industries engaged in
food and beverage; textile and wearing apparel; wood and wood products; chemical and
pharmaceuticals; and fabricated metal products. The study results showed that human
resource factors and the sales revenue were found to be inadequate and severely
inhibited the potential of the entrepreneurs for performance and growth. However,
length of years in business and working experience were found to have positive
contribution on their performance.
Tefara, Gebremichael & Abera, (2013) in their study that investigated the growth
determinants of MSEs based on a survey covering 178 randomly selected MSEs from
Mekelle city, Tigray regional state of Ethiopia. The study identifies five potential MSEs
growth determinants: gender of owner, initial investment size, location and sector as key
determinants of MSES growth in northern Ethiopia. The study findings concluded that
over three-fourth of the MSEs that are found in Mekelle city are survival MSEs and
about one-fourth of them are growing MSEs. The study confirms that that about three-
forth of the MSEs are survival type and one-forth or less of MSEs are growing type in
this country as Wasihun & Paul (2010), & Gebreyesus (2007), found even though the
growing MSEs percentage is higher as compared to other African countries (Botswana,
Malawi, Swaziland and Zimbabwe except Kenya) in which the growing MSEs ranges
from 19.3-22.8 percent while it is 34.8 percent for Kenya, (Liedholm, 2001). The study
concludes that the dimensions and determinants of MSEs growth are vast and complex.
The growth of MSEs has a recognized effect on unemployment reduction and poverty
37
alleviation since MSEs have massive contribution in employment creation and income
generation than big enterprises but change in employment size in MSEs is subject to
different constraints such as financial, working premises and other socio-economic
conditions. Thus, proper understanding of these factors and conditions constitutes an
essential starting point and is a key to the formulation of policies, designing of
appropriate intervention strategies and practical steps by the government, non-
government organizations and other stake holders in order to reduce poverty,
unemployment and income inequality as well as to promote sustainable growth at micro
and macro levels. The study recommends that the government and the NGOs,
particularly operating at the local levels should design an awareness creation program to
put the already endorsed and existing MSEs development policy and strategy.
In his research, Dereje (2008) studied the nature, characteristics, economic performance,
opportunities and challenges of MSEs in the construction sector based on 125 sample
enterprises. The results of the study revealed that the main constraints of the MSEs were
shortage of capital, lack of raw materials, absence of government support, lack of
market, lack of credit facilities and high interest rate. Studies were also conducted
specifically with a purpose of identifying the problems that MSEs encounter. For
instance, Workneh’s (2007), research undertaken in Kolfe Keraneo sub-city of Addis
Ababa indicated that lack of capital, lack of market, unfavorable policy, and inadequate
infrastructure, absence of adequate and relevant training, bureaucratic structure and
procedures are among constraints faced by MSEs. Similarly, Adil’s (2007), research
carried out in Addis Ababa shows that inappropriate government intervention, shortage
of capital, location disadvantage, lack of market and lack of display room are the major
challenges that obstruct MSEs.
Roy & Wheeler (2006) conducted a survey of micro enterprise in Urban West Africa:
drivers shaping the sector. The study identified that the level of training of micro
entrepreneurs both formal and informal; experience and number of years in operation;
knowledge of the market; level of differentiation in terms of price, quality or other and
38
diversification of products; access to the necessary resources and technologies; level of
planning; vision for the future; and the entrepreneur’s level of poverty are among the
factors contributing to success of MSEs. The study also noted that lack of market
knowledge and training, limited access to capital, and lack of co-operation among
possible business partners are some of the factors inhibiting the growth and
development of the MSE sector.
2.5 Critique of Literature Relevant to the Study
Jalilian & Kirkpatrick (2010), argues that there is substantial theoretical literature on
financial sector depth which use measures of financial depth collected from financial
institutions themselves, such as the total value of bank deposits, or private credit, but
do not capture the distribution of these bank deposits or credit across the population.
Their arguments are valid however it remains to be seen how much data accessed by
financial institutions can assist in assessing the growth of youth owned micro and small
enterprises through access to credit facilities. Abor & Quarley (2010) argued that the
pledging of collateral by itself should not distinguish asset based lending from any of
the other lending technologies. They however fail to bring out other options available
for MSEs for them to be able to access affordable credit with ease. According to KRA
(1994), the principle factor contributing to poor tax collection include; poor compliance
at the informal sector economy, narrow coverage of the existing tax instruments, poor
administration and tax collection efforts. As a result of poor taxation system, the costs of
running business in Kenya continue to heighten. They however fail to address some of
the key challenges that cause MSEs failure to comply with the Kenyan taxation regime
and what new policy and regulation are needed to easy the tax burden facing MSES.
Karambu, (2017) conducted a study on commercial banks lending strategies and growth
of micro and small enterprises in Kenya. The research sought to establish how product
accessibility, customer relationship marketing (CRM), collaterals, capacity building and
technological innovation lending strategies by commercial banks influence growth of
39
MSEs in Kenya. The study recommended that commercial banks together with MSEs
need to put in place legal and regulatory framework management strategies. The study
however did not bring out the challenges facing MSEs as a result of legal and regulatory
barriers. The study just focused on Legal and regulatory environment as a moderating
variable.
Access to entrepreneurial markets and marketing information remains a severe
constraint to MSEs development and competitiveness in Kenya. Overall aggregate
demand in low market are saturated due to dumping and over production and in many
cases market do not function well due to lack of information and high transaction cost,
(Nteere, 2012). The argument however fails to offer solutions to MSEs noted challenges
of market saturation and over production. Kaushalesh & Peedoly (2006), explain that
limited access to global markets denies MSEs significant opportunities confining them
to saturated local markets whereas internationalization is necessary for their survival and
expansion. They findings reveal the importance of internationalization however do not
give valuable ways that MSEs can access markets.
National Development plan 1997 – 2001 notes that the informal sector has been growing
in importance to Kenya both as a source of employment as well as innovative
technologies. However, technological inefficiency, poor tools, limited access to market
and lack of national support have constrained the sector’s ability to upgrade its existing
technological base to boost their productivity and income. The findings fail to offer
solutions to the technological challenges facing MSEs in the country. Pedersen (1996)
found that entrepreneurs with no previous occupation began firms which were relatively
small and remained in the smallest category. On the other hand it was found that the
largest enterprises were almost entirely set up by entrepreneurs with previous
experiences either in manufacturing or in the retail trade. However past evidence
indicate that small firms if well incubated can also grow and compete with large firms if
the business environment favors and supports their growth. Importantly, further studies
especially those conduced in the late 1990s and thereafter suggest that finance is the
40
most important constraint for the MSE sector growth, (Green, 2002). However they fail
to draw attention to other factors that make access to credit difficult to the MSEs.
Although factors that influence MSEs growth have called for the attention of some
researchers both internationally little is still known about the determinants influencing
growth of MSEs in Kenyan enterprises especially those run by the youth in Nairobi
county. The literature reviewed has left a relative gap in state of the art on this subject,
particularly in the context of Nairobi County. Thus, there is little apparent evidence on
factors determining growth of MSEs owned by young people in Nairobi County. As a
consequence, the motivation for this study was: what are the main factors determining
growth of MSEs owned by the youth of Nairobi County? And how can we measure the
independent variables in the study and use them to analyse the determinants of growth
of youth owned MSEs in Kenya Nairobi County. The literature review has not
adequately spelt of such measure.
2.6 Research Gap
A number of researches have been carried out locally and internationally reviewing the
determinants of growth in youth owned MSEs but not in a comprehensive approach. A
few studies have been done but majority of them focused on the on the performance
other than growth of MSEs. Most of these researches concentrated on their study areas
based on their own objectives. Majority of studies done also explored government
policy programmes geared towards the support and funding of youth owned enterprises
through the YEDF, as in Sogwe (2011), his studies focused mainly on the performance
of the MSEs.
The literature available does not concern itself on seed capital, legal and regulatory,
access to market, technology adoption and entrepreneurial characteristics in one
combination. For example Wangui, Njeru & Ibrahim (2014), studies looked at the
challenges facing micro and small enterprises in accessing credit facilities in Kangemi
41
Harambee market in Nairobi. Their study focused on collateral requirements, cost of
credit, and availability of information on finance and business risk as its independent
variables. The study did not have a moderating variable.
Other studies by Tefera, Gebremichael & Abera (2013), on growth determinants of
micro and small enterprises: evidence from Northern Ethiopia focused on gender of
owner verses MSE growth, initial investment verses MSE growth, location verses MSE
growth, and sector verses MSE growth as its independent variable. Their study did not
have a moderating variable.
Mbugua, Mbugua, Wangoi, Oganda & karuki (2013) investigated the factors affecting
the growth of micro and small enterprises: a case of dressmaking and tailoring in
Eldoret, the study analyzed management, finances, market and marketing and
entrepreneurial characteristics as its independent variables. The study did not have a
moderating variable. Very few studies also focusing on legal and regulatory
environment and entrepreneurial characteristics determinants on growth of MSEs were
available.
2.7 Summary of Empirical and Theoretical Studies
The literature reviewed determinants of growth of youth owned micro and small
enterprises in Kenya. This included access to capital, law and regulatory, access to
market and adoption of technology. Research suggests that there is evidence that growth
can occur within MSEs given the right environment. A favorable country setting or
overall enabling environment for enterprises provides economic and political stability,
offers low costs for business transactions, and allows for efficient business operations
that lead to greater amounts of innovation creativity and better access to finance. It has
also been noted that an enabling environment legal and regulatory is important for the
MSE sector to play effective role as an engine for economic growth, poverty eradication
and employment creation.
42
The ability of MSEs to survive in an increasingly competitive market is largely
dependent upon their capacity to leverage information as a resource and to benefit from
the value of information. MSEs need ready access to comprehensive relevant market
information since they operate in severe time and capacity constraints. Moreover
research has shown that educational attainment of enterprise heads or the entrepreneurial
ability of owners may also interact with other constraints to MSE growth. Also,
education may interact with other individual characteristics such as gender. In addition
to this studies have shown that technology adoption is equally important, the role played
by technology is crucial to changing the ways in which MSEs have been operating in the
past.
43
CHAPTER THREE
RESEARCH METHODOLOGY
3.1 Introduction
This chapter addressed the methodology that was used in undertaking the study. This
includes the research design that was adopted; according to Sekaran (2010), a central
part of research is to develop an efficient research strategy. Based on the model and
variables developed in chapter two, this chapter covers the research design and research
methodology used to test the variables. In particular, issues related to research design,
the population, the type of data to be collected, sampling frame, sample and sampling
techniques, data collection instrument, data collection procedure, pilot test, validity and
reliability of the instrument, and the data analysis and presentation are discussed. Lastly,
the analytic techniques that were used to test the hypotheses are also presented.
3.2 Research Philosophy
Kathuku (2017) argues that research methodology and philosophy must be stated in
order to convince others of the credibility of the research. Based on the above concept
and nature of different research philosophies, this study adopted the positivism approach
which advocates for application of the methods of the natural sciences to the study on
social reality and more. According to Njuguna (2015) in such an approach, the research
associates objectivism with the concept of positivism (Saunders, Lewis & Thornhill,
2009). He further argues that positivist philosophy is also premised on the belief that
reality is stable and that it can be observed and described from an objective view point
without interfering with the phenomenon being observed.
3.3 Research Design
Kothari (2008) defines research design as the arrangement of strategies for the
collection and analysis of data according to defensible procedures. Cooper and
44
Schindler (2008), view research design as the plan and structure of scientific
investigation to respond to research questions. This study adopted descriptive survey
research design. According to Saunders, Lewis and Thornhill (2003), survey strategy is
a deductive approach popular in business research. Aggarwal (2008) explains that
descriptive research is all about to the gathering of information about certain conditions
or situations with a purpose of undertaking description and interpretation. He further
argues that this type of research method is not simply amassing and tabulating facts but
it also includes proper analyses, interpretation, comparisons, identification of trends and
relationships. The main advantage of this research design is its ability to adopt
applications of scientific method by critically analyzing and examining the source
materials, by analyzing and interpreting data, and by arriving at generalization and
prediction. A descriptive research design determines and reports the way things are,
(Mugenda & Mugenda, 2003). Creswell (2003) observes that a descriptive survey
research design is used when data are collected to describe persons, organizations,
settings or phenomena. The design also has enough provision for protection of bias and
maximized reliability (Kothari, 2008). Descriptive design uses a preplanned design for
analysis, (Mugenda & Mugenda, 2003). The research aimed to describe the
determinants of growth of youth owned micro and small enterprises in Kenya. It
described the behavior of all the independent, dependent and moderating variables with
the view to establish their relationship. The design was adopted since the research was
concerned with assessing the relationship between the variables and the description of
things such as access to finance, legal and regulatory, business location, adoption of
technology and entrepreneurial characteristics. The research data was summarized in a
way that provided the designed descriptive information.
3.4 Target Population
Population is defined as a full set of cases from which a sample is taken, (Saunders,
2003). The study population consisted of youth owned micro and small enterprises.
Youth owned MSEs information was retrieved from the list of registered youth groups at
45
the Ministry of Devolution. Data available from the ministry revealed that the total
number of youth group MSEs funded since the inception of the YEDF in Nairobi
County is 1,263 (ROK, 2013). Therefore the study targeted 1,263 enterprises
categorized as MSEs. The study targeted Nairobi County because it had the highest
number of beneficiaries in the country. Nairobi County is currently the highest
beneficiary of youth empowerment support funds, for example since the inception of the
youth enterprise development funds the County has received 2.3 billion which translates
to 20% of the total amount disbursed by the government (ROK, 2016). Nairobi County
has also a total of 35,238 youth owned funded enterprises which translates to 13.5%.
Due to the large numbers of beneficiaries it was impractical to survey the whole
population; as a result, a sample was scientifically selected to represent the population.
It was hoped that the target group would contribute greatly towards the study.
3.5 Sampling Frame
The sampling frame is a complete list of all the units of the population which is
purposely used to draw random samples, (Mugenda & Mugenda, 2003). In the study
stratified random sampling technique was used to draw the sample. This method helped
in improving the representation of each stratum (groups) within the population, as well
as ensuring that the strata were not over-represented. In a stratified random sampling
approach, the population was divided into two or more relevant and significant strata
based on one or a number of attributes, for example, the population of N units is first
divided into disjoint groups of NI,N2, N3 units, respectively. These subgroups, called
strata, together comprise the whole population, so N1+N2+N3=N. From each stratum, a
sample of pre-specified size was drawn independently using simple random sampling
table in different strata. Then the collection of these samples constituted a stratified
sample for the study, (Saunders 2003). For this study, constituencies were used as strata.
These were eight (8) in total as shown in Table 3.1. These categories were used as the
respective strata during sampling.
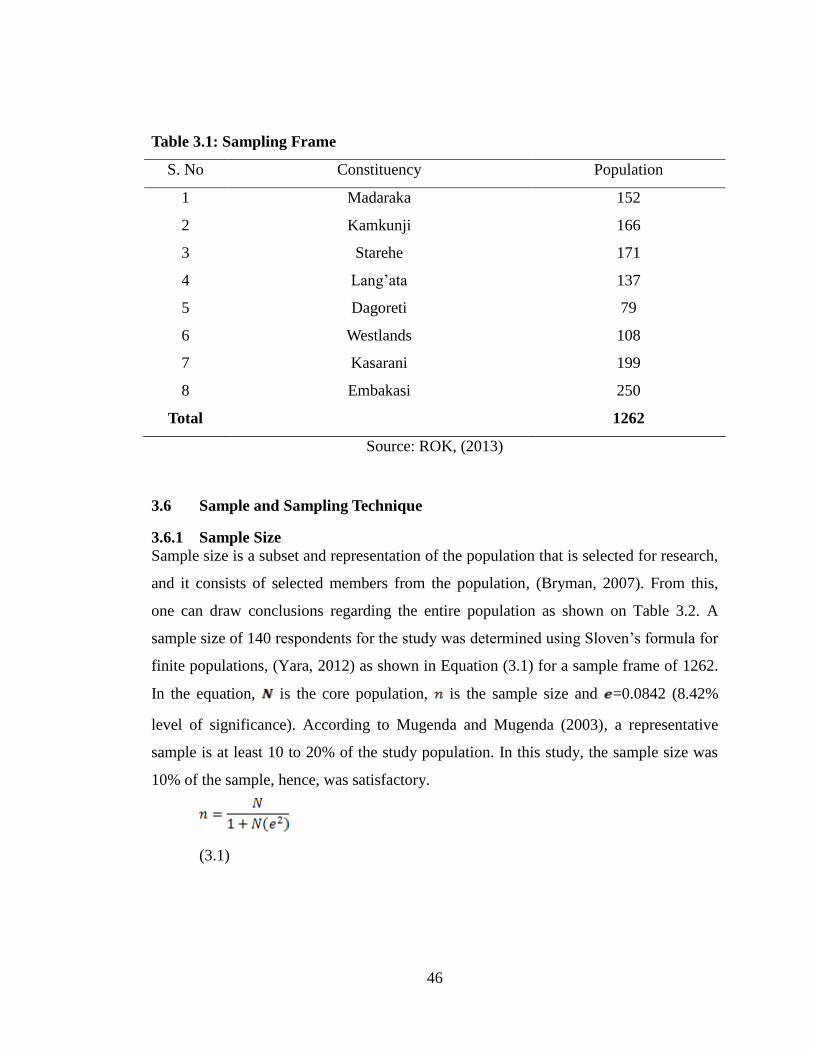
46
Table 3.1: Sampling Frame
S. No Constituency Population
1 Madaraka 152
2 Kamkunji 166
3 Starehe 171
4 Lang’ata 137
5 Dagoreti 79
6 Westlands 108
7 Kasarani 199
8 Embakasi 250
Total 1262
Source: ROK, (2013)
3.6 Sample and Sampling Technique
3.6.1 Sample Size
Sample size is a subset and representation of the population that is selected for research,
and it consists of selected members from the population, (Bryman, 2007). From this,
one can draw conclusions regarding the entire population as shown on Table 3.2. A
sample size of 140 respondents for the study was determined using Sloven’s formula for
finite populations, (Yara, 2012) as shown in Equation (3.1) for a sample frame of 1262.
In the equation, is the core population, is the sample size and =0.0842 (8.42%
level of significance). According to Mugenda and Mugenda (2003), a representative
sample is at least 10 to 20% of the study population. In this study, the sample size was
10% of the sample, hence, was satisfactory.
(3.1)
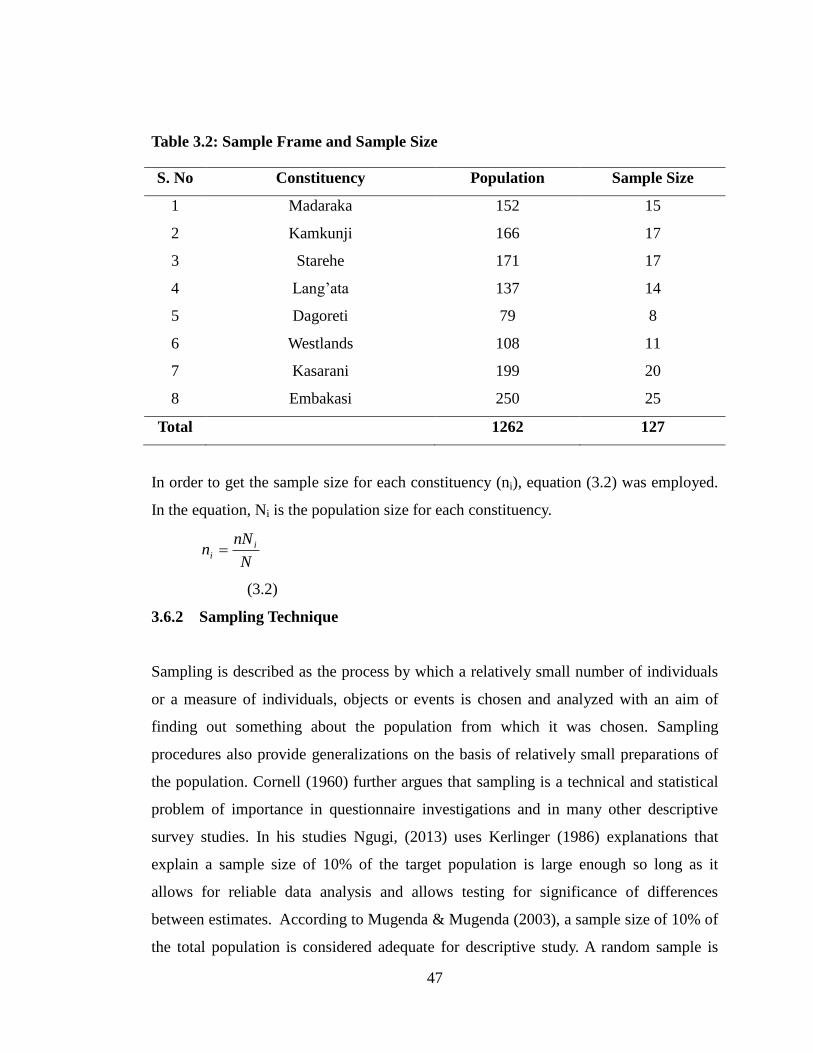
47
Table 3.2: Sample Frame and Sample Size
S. No Constituency Population Sample Size
1 Madaraka 152 15
2 Kamkunji 166 17
3 Starehe 171 17
4 Lang’ata 137 14
5 Dagoreti 79 8
6 Westlands 108 11
7 Kasarani 199 20
8 Embakasi 250 25
Total 1262 127
In order to get the sample size for each constituency (ni), equation (3.2) was employed.
In the equation, Ni is the population size for each constituency.
N
nNn i
i
(3.2)
3.6.2 Sampling Technique
Sampling is described as the process by which a relatively small number of individuals
or a measure of individuals, objects or events is chosen and analyzed with an aim of
finding out something about the population from which it was chosen. Sampling
procedures also provide generalizations on the basis of relatively small preparations of
the population. Cornell (1960) further argues that sampling is a technical and statistical
problem of importance in questionnaire investigations and in many other descriptive
survey studies. In his studies Ngugi, (2013) uses Kerlinger (1986) explanations that
explain a sample size of 10% of the target population is large enough so long as it
allows for reliable data analysis and allows testing for significance of differences
between estimates. According to Mugenda & Mugenda (2003), a sample size of 10% of
the total population is considered adequate for descriptive study. A random sample is
48
preferential because it is free from bias and therefore each unit has a chance to be
included in the sample. Random sampling is also easy to be conducted, (Srivastava,
1993). According to Lenth (2001), the sample size should have the adequate size. It
should be big enough so that an effect of such magnitude is of scientific and statistical
significance. Sample size is important for economic reasons: An under-size study can be
a waste of resources for not having the capacity to produce useful results, while an
oversized one uses more resources than are necessary, (Lenth, 2001).
3.7 Data Collection Instruments
Both primary and secondary data was used in the study. Reswell (2002), defines data
collection as a means by which information is obtained from the selected subjects of an
investigation. The primary research data was collected from the owners of the MSEs in
Nairobi County using a questionnaire. Questionnaire enabled the researcher to get first-
hand information about the issue that was being investigated. It also provided an
opportunity for anonymity to promote high response rate, (Mugenda & Mugenda, 2003).
A certain degree of flexibility was permitted to allow the respondents ask questions and
raise issues as this will be enriching in trying to solve the problem, (Srivastava, 1993).
The questionnaire employed both structured and unstructured questions. It also adopted
open ended and closed ended questions. Structured questions relied on closed-ended
categories pre-selected by the researcher. Structured questions reduced the amount of
thinking that a respondent needed to undertake to complete the task. This generally was
expected to lead to higher response and more accurate data. It was also easier also for
the researcher to code and analyze. Unstructured questions were used since they were a
bit more qualitative in feel. They do not require pre-defined categories and they allow
the respondent to express their views openly. Open-ended questions, as they are also
known, were expected to produce a higher cognitive load in the sense that the
respondents had to think harder to come to an answer.
49
3.8 Data Collection Procedure
Data refers to all the information the researcher gathers for his or her study, (Mugenda
& Mugenda 2003). Collins & Hussey (2003), define data as all the known facts or
things that a researcher could gather for his or her study and which could be used for
inference or estimation. Collective administration was used to administer the
questionnaires. Prior arrangements were made and appointments sought with each of the
127 MSE selected for the study. Research assistants were trained on both the content of
the questionnaire and the general presentation required of them. The research assistant’s
accompanied the researcher during the pilot study so as to obtain the practical induction
on the administration of the research instruments. Each MSE filled in the self-
administered questionnaires that were later collected. Data collection from each of the
127 MSEs groups was done during different appointments. A total of 127 respondent
questionnaires were distributed to the respondents.
3.9 Pilot Testing
The main aim of pilot studies was to access the feasibility so as to avoid potentially
disastrous consequences of embarking on a large study which could potentially drown
the whole research effort. In his studies Ngugi. (2013), points out at issues argued by
Cooper and Schindler (2008) which explains that a pilot test is conducted to detect
weaknesses in design and instrumentation and to provide proxy data for selection of a
probability sample. According to Babbie (2004), a pilot study is conducted when a
questionnaire is given to just a few people with an intention of pre-testing the questions.
Therefore in this study a pilot test was conducted on (10%) of youth owned MSEs
within Nairobi County using a pretest questionnaire.
The procedure used in pretesting the questionnaire was identical to the one used during
the actual study or data collection, and the number in the pretest was small about 1% to
10% of the target population, (Mugenda & Mugenda 2003). In this study the
50
questionnaire was tested on 10% of the entire sample size, which translates to (13)
respondents. These MSEs were selected randomly from a list of the study constituencies
to eliminate bias that which might have arisen from subjective judgments in sample
selection, (Sekaran, 2003). Pilot test was an activity that assisted the research in finding
out if there were flaws, limitations, or other weaknesses within the interview design.
The process then allowed the researcher to make necessary revisions prior to the
implementation of the study (Kvale, 2007).
3.9.1 Reliability of the Research Instruments
Reliability is described as the consistency in measurement (Bollen 1988), or stability of
measurement over a variety of conditions in which basically the same results should be
obtained. (Nunnally, 1978). Mugenda & Mugenda (2013), posit that reliability is a
measure of the degree to which a research instrument yields consistent results or data
after repeated trials. Reliability of measurement concerns the degree to which a
particular measuring procedure gives similar results over a number of repeated trials,
(Orodho, 2008). Abbott & Mc Kinney (2013), state that reliability is the extent to which
a given measuring instrument produces the same result each time it is used. Reliability is
the repeatability, stability or internal consistency of a questionnaire, (Bryman, 2012,
Cooper & Schindler 2011). Typical methods to estimate test reliability in behavioral
research are, test-retest reliability, alternative forms, split-halves, inter-rater reliability,
and internal consistency, (Drost, 2011). This study adopted the internal consistency
method to estimate test reliability. The fist is a measure of composite reliability. This test
assesses internal consistency and thus is analogous to coefficient alpha that is cronbach
alpha, (Jenkins 2006).
Shook, Ketchen, Hult and Kacmar (2004), composite reliability represents a better
choice. It draws on the standardized loading and measurement error for each item.
Bagozzi and Yi (1988), indicate that composite reliability should exceed.6. The second
test by Fornell and larcker (1981) is average variance extracted, while similar to
51
composite reliability. This measure is supposed to indicate the total amount variance that
is captured by the construct in relation to the amount of variance due to measurement
error. Results should exceed 0.5 Diamantopoulous & Singuaw (2000) explain that if not
then the variance due to measurement error is greater than the variance due to the
construct.
3.9.2 Validity of the Research Instruments
Mugenda & Mugenda (2003), define validity as the degree to which results obtained
from analysis of the data actually represent the phenomenon under study. Orodho (2008)
defines validity as the degree to which empirical measure or several measures of the
concept, accurately measure the concept. Validity also refers to the degree to which an
instrument measures what it purports to measure, (Mugenda, 2008; Bryman, 2012).
Validity therefore, therefore is concerned with the meaningfulness of research
components. The study adopted both content and discriminative validity. Content
validity was used to measure the degree to which elements of a measurement instrument
are relevant to and representative of the targeted construct for a particular assessment
purpose, (Netemeyer, Boles & McMurriam 1996). It was enhanced through precise
construct definition and conceptualization and by ensuring experts agree that items are
reflective of the overall construct. Discriminant validity refers to the degree to which
different model dimensions are unique, (Sethi & King, 1994). It requires that a measure
does not correlate too highly with measures from which it is supposed to differ,
(Netemeyer, Boles & McMurriam 2003). A common method for assessing this is to
determine whether the correlation between two variables is significantly less than 1. The
second method states that if the average variance extracted greater than the square of the
correlation between two latent variables then discriminant validity has been obtained,
(Fornell & Larcker, 1981).
Factors under investigation were operationalised using reliable and valid items obtained
from validated measuring instruments utilized in previous empirical studies, as well as
52
various self-generated items based on secondary sources. The items were rephrased
where necessary to make them more appropriate for the study, and subsequently used
empirically test the relationships hypothesized. The data that was collected using
questionnaires was subjected to several statistical analyses. Correspondingly, a
correlation factor analysis was undertaken and a Cronbach-alpha coefficient was
calculated to assess the discriminant validity and reliability of the measuring instrument,
(Cooper & Schindler, 2011).
3.10 Data Analysis and Presentation
Data analysis is the process of editing and reducing accumulated data to a manageable
size, developing summaries, looking for patterns, and applying statistical techniques
(Cooper, 2008). According to Mugenda (2008) data analysis is the process of cleaning
and summarizing data so that it becomes information that can be easily interpreted and
conclusions made to support decision making. This section discusses the techniques
that were used to analyze data and test the variables. Before processing the responses,
data preparation was done on the completed questionnaires through editing, coding,
entering and cleaning the data. Data collected was analyzed using descriptive statistics.
Descriptive statistics included statistical procedures used to describe the population
(Kothari, 2014). The study used the measures of central tendency to analyse the data.
According to Ary, Jacobs & Sorensen (2010), descriptive statistics recommended for
ordinal measurement scale items include a mode or median for central tendency. The
descriptive statistical tools helped in describing the data and determined the
respondents’ degree of agreement with the various statements under each factor.
The focus of the study was to evaluate and establish relationships between dependent
and multiple independent variables of interest and the causal effects. Therefore, to
address the study objectives, a multiple regression analysis technique was projected for
the study. Multiple regressions used multiple independent variables; with each
controlling for the other (Cooper & Schindler 2006). This technique was used to
53
investigate the relationships between determinants of growth and MSE growth. This
included an error term, whereby response variable were expressed as a combination of
explanatory variables, and the unknown parameters estimated using observed values of
the dependent and independent variables (Hesketh & Skrondal, 2008). Multiple linear
regression attempted to model the relationship between two or more explanatory
variables and a response variable by fitting a linear equation to observed data.
Data analysis was conducted with the help of SPSS (Version 21), which was the most
current version in the market. Micro and small enterprise growth (Y) was regressed
against five (5) variables namely; Seed Capital (X1), Legal and Regulatory (X2), Access
to Marketing (X3), Adoption of Technology (X4) and Entrepreneurial Characteristics
(X5) as presented in equation (3.3). In the equation, 0 is constant or coefficient of
intercept; I are regression coefficients for the independent variables; and is error
term.
55443322110 XXXXXY
(3.3)
This model was estimated using least squares regression technique. The model was
tested at 95% level of significance (p<0.05). The correlation analysis was used to
measure degree of association between seed capital, legal and regulatory, access to
market, and entrepreneurial characteristics. The coefficient of determination (R2) was
used to interpret the goodness of fit of the regression model. Data was presented in
tables and figures to enable ease of use, understanding and appreciation. The
computations were performed using the statistical program for Social Sciences (SPSS).
SPSS was the most preferred tool adapted to present data in this research work,
(Kothari, 2008). It assisted the researcher to make the study more scientific and reliable
as a number of different statistical tools were applied on the dissertation with the help of
the software (Ary, 2010), and between entrepreneurial characteristics and determinants
of growth based on the hypothesized relationships for testing. The study also used

54
Analysis of Variance (ANOVA) to analyze the degree of relationship between the
variables in the study. This provided an indication to the strength and direction of
association between the variables and hypotheses testing.
55
CHAPTER FOUR
RESEARCH FINDINGS AND DISCUSSION
4.1 Introduction
The chapter presents the empirical findings and results of the application of the variables
using the techniques mentioned in chapter three. The current study sought to examine
the determinants of growth in youth owned micro and small enterprises in Kenya. The
specific variables of the study were access to capital, legal and regulatory, access to
market and adoption of technology. The intervening variable was the moderating effect
of entrepreneurship characteristics on the growth of youth owned micro and small
enterprises in Kenya. Specifically, the data analysis was in line with specific objectives
where patterns were investigated, interpreted and implications drawn on them.
Descriptive and inferential statistics as well as qualitative data are used.
4.2 Response Rate
From the data collected, out of the 127 questionnaires administered, 80 were filled and
returned, which represents 63.0% response rate (Table 4.1). This response rate was
considered satisfactory to make conclusions for the study. Mugenda & Mugenda (2003)
observed that a 50% response rate is adequate, 60% good and above, while 70% rated
very good. This collaborates with Bailey (2000), assertion that a response rate of 50% is
adequate, while a response rate greater than 60% is good. This implies that based on this
assertion, the response rate in this case of 63.0% was therefore good. However the
recorded response rate of 63.0% can be attributed to the data collection challenges
especially locating the MSEs since some had closed up their businesses or moved
elsewhere. Many of the MSEs also lacked sufficient records relating to their business
performance. Table 4.1 below provides the findings.
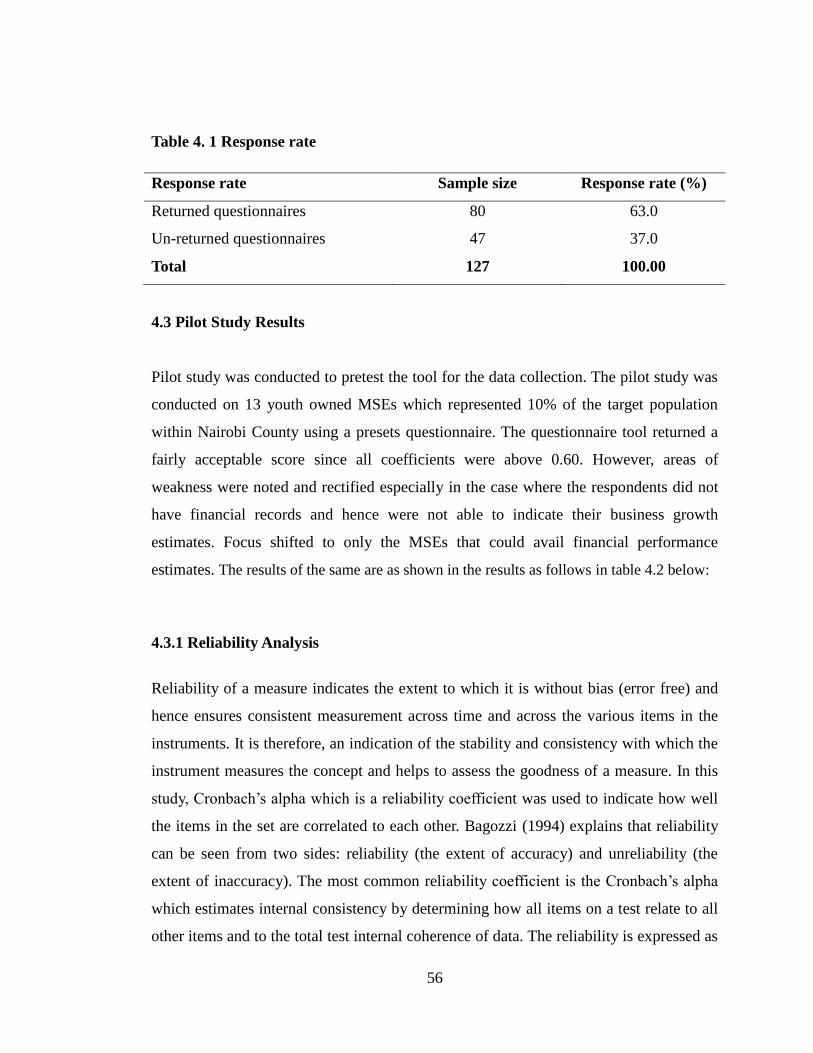
56
Table 4. 1 Response rate
Response rate Sample size Response rate (%)
Returned questionnaires 80 63.0
Un-returned questionnaires 47 37.0
Total 127 100.00
4.3 Pilot Study Results
Pilot study was conducted to pretest the tool for the data collection. The pilot study was
conducted on 13 youth owned MSEs which represented 10% of the target population
within Nairobi County using a presets questionnaire. The questionnaire tool returned a
fairly acceptable score since all coefficients were above 0.60. However, areas of
weakness were noted and rectified especially in the case where the respondents did not
have financial records and hence were not able to indicate their business growth
estimates. Focus shifted to only the MSEs that could avail financial performance
estimates. The results of the same are as shown in the results as follows in table 4.2 below:
4.3.1 Reliability Analysis
Reliability of a measure indicates the extent to which it is without bias (error free) and
hence ensures consistent measurement across time and across the various items in the
instruments. It is therefore, an indication of the stability and consistency with which the
instrument measures the concept and helps to assess the goodness of a measure. In this
study, Cronbach’s alpha which is a reliability coefficient was used to indicate how well
the items in the set are correlated to each other. Bagozzi (1994) explains that reliability
can be seen from two sides: reliability (the extent of accuracy) and unreliability (the
extent of inaccuracy). The most common reliability coefficient is the Cronbach’s alpha
which estimates internal consistency by determining how all items on a test relate to all
other items and to the total test internal coherence of data. The reliability is expressed as
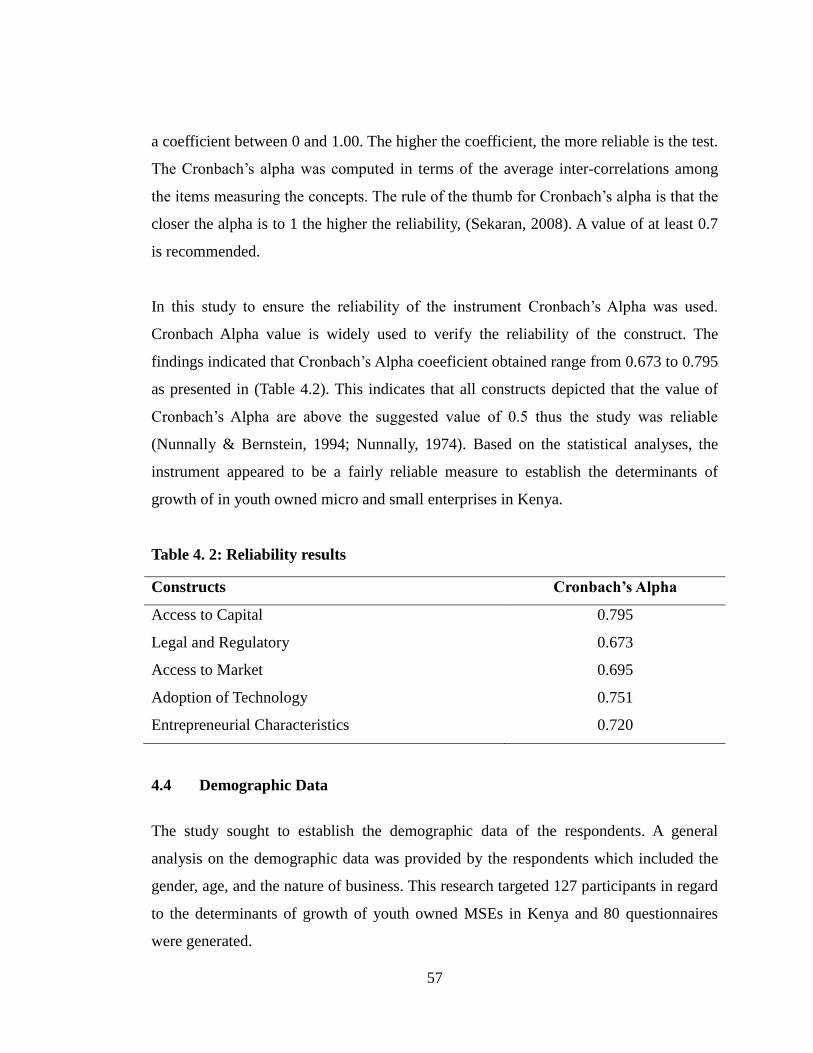
57
a coefficient between 0 and 1.00. The higher the coefficient, the more reliable is the test.
The Cronbach’s alpha was computed in terms of the average inter-correlations among
the items measuring the concepts. The rule of the thumb for Cronbach’s alpha is that the
closer the alpha is to 1 the higher the reliability, (Sekaran, 2008). A value of at least 0.7
is recommended.
In this study to ensure the reliability of the instrument Cronbach’s Alpha was used.
Cronbach Alpha value is widely used to verify the reliability of the construct. The
findings indicated that Cronbach’s Alpha coeeficient obtained range from 0.673 to 0.795
as presented in (Table 4.2). This indicates that all constructs depicted that the value of
Cronbach’s Alpha are above the suggested value of 0.5 thus the study was reliable
(Nunnally & Bernstein, 1994; Nunnally, 1974). Based on the statistical analyses, the
instrument appeared to be a fairly reliable measure to establish the determinants of
growth of in youth owned micro and small enterprises in Kenya.
Table 4. 2: Reliability results
Constructs Cronbach’s Alpha
Access to Capital 0.795
Legal and Regulatory 0.673
Access to Market 0.695
Adoption of Technology 0.751
Entrepreneurial Characteristics 0.720
4.4 Demographic Data
The study sought to establish the demographic data of the respondents. A general
analysis on the demographic data was provided by the respondents which included the
gender, age, and the nature of business. This research targeted 127 participants in regard
to the determinants of growth of youth owned MSEs in Kenya and 80 questionnaires
were generated.
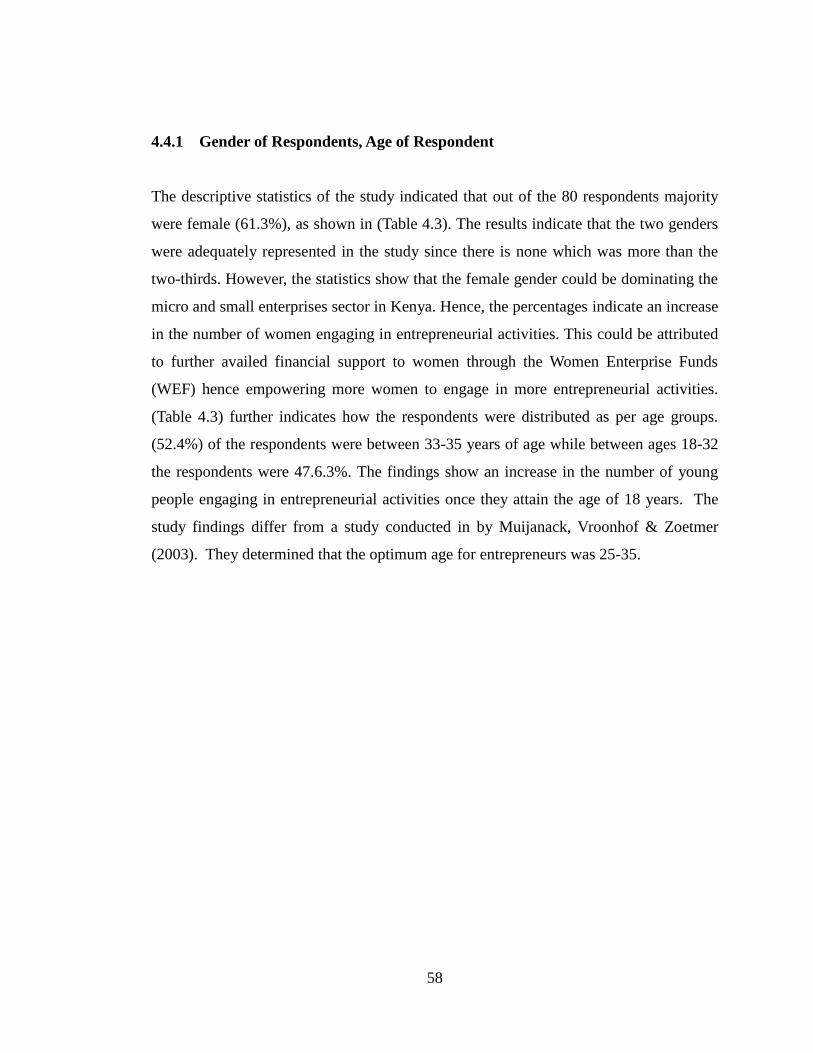
58
4.4.1 Gender of Respondents, Age of Respondent
The descriptive statistics of the study indicated that out of the 80 respondents majority
were female (61.3%), as shown in (Table 4.3). The results indicate that the two genders
were adequately represented in the study since there is none which was more than the
two-thirds. However, the statistics show that the female gender could be dominating the
micro and small enterprises sector in Kenya. Hence, the percentages indicate an increase
in the number of women engaging in entrepreneurial activities. This could be attributed
to further availed financial support to women through the Women Enterprise Funds
(WEF) hence empowering more women to engage in more entrepreneurial activities.
(Table 4.3) further indicates how the respondents were distributed as per age groups.
(52.4%) of the respondents were between 33-35 years of age while between ages 18-32
the respondents were 47.6.3%. The findings show an increase in the number of young
people engaging in entrepreneurial activities once they attain the age of 18 years. The
study findings differ from a study conducted in by Muijanack, Vroonhof & Zoetmer
(2003). They determined that the optimum age for entrepreneurs was 25-35.
59
Table 4. 3: Demographic factors for the respondent
Demographics Factor level Number Response rate
(%)
Gender of the respondents Male 31 38.7
Female 49 61.3
Total
80 100
Age of the respondents 18-22 years 11 13.8
23-27 years 14 17.5
28-32 years 13 16.3
33-35 years 42 52.4
Total 80
100.00
4.4.2 Firm Demographics, Nature of Business, Motivation
Nature of Business
The study investigated the nature of the business that the respondents were running.
(Table 4.4) indicates that that (36.3%) of the target enterprises were service enterprises.
(22.5%) were trading enterprises. The findings concur with a study by Ngugi (2013), on
influence of intellectual capital on the growth of small and medium enterprises in
Kenya. He supports the argument that service enterprises are easy to establish and this
could be attributed to the fact that service businesses accommodates diverse generalized
skills and a relatively lower initial investment capital as compared to trading,
manufacturing and agribusinesses reducing barriers to entry, (Moore, 2008).
Motivation of Starting the Business
The study reported that (32.5%) of the respondents noted that their motivation for
starting their business was as a result of the desire to exploit an opportunity. (27.5%)
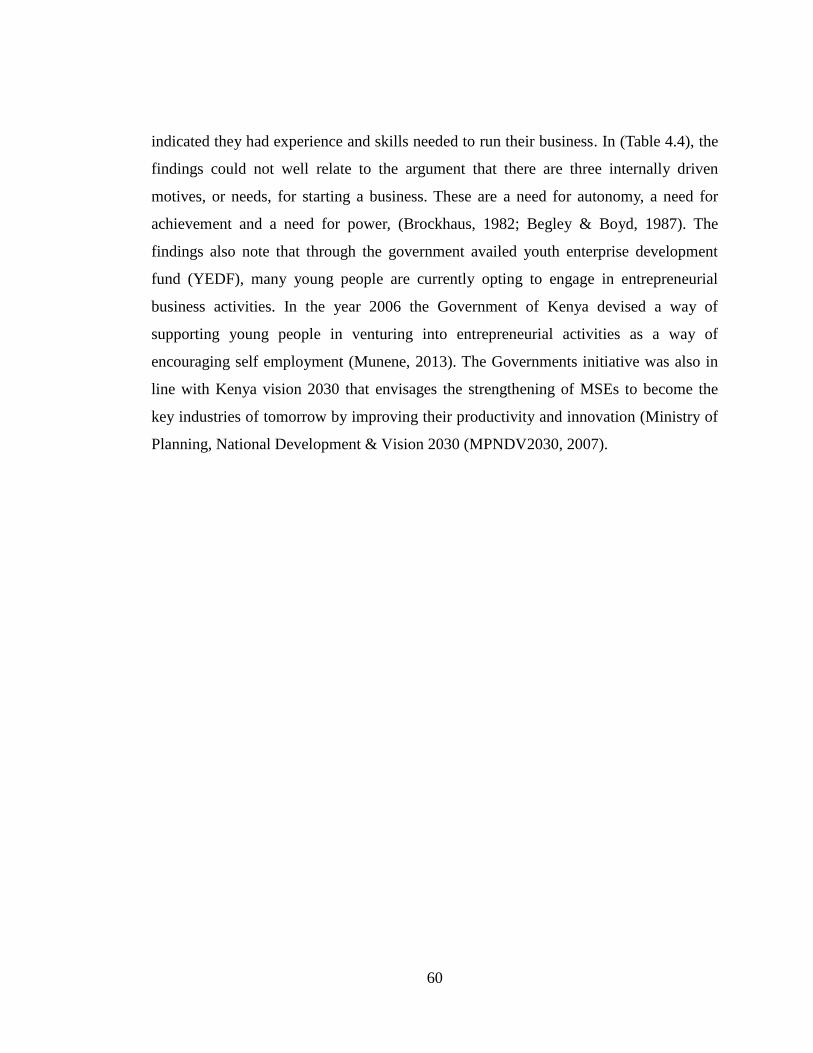
60
indicated they had experience and skills needed to run their business. In (Table 4.4), the
findings could not well relate to the argument that there are three internally driven
motives, or needs, for starting a business. These are a need for autonomy, a need for
achievement and a need for power, (Brockhaus, 1982; Begley & Boyd, 1987). The
findings also note that through the government availed youth enterprise development
fund (YEDF), many young people are currently opting to engage in entrepreneurial
business activities. In the year 2006 the Government of Kenya devised a way of
supporting young people in venturing into entrepreneurial activities as a way of
encouraging self employment (Munene, 2013). The Governments initiative was also in
line with Kenya vision 2030 that envisages the strengthening of MSEs to become the
key industries of tomorrow by improving their productivity and innovation (Ministry of
Planning, National Development & Vision 2030 (MPNDV2030, 2007).
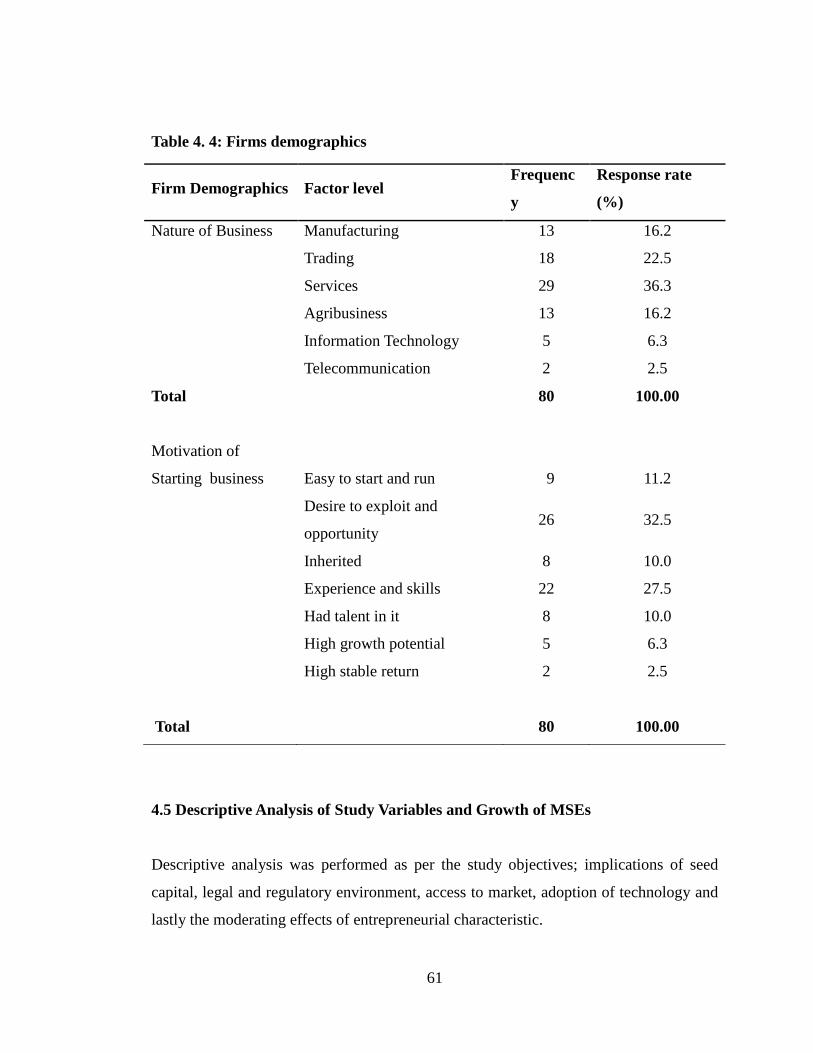
61
Table 4. 4: Firms demographics
Firm Demographics Factor level Frequenc
y
Response rate
(%)
Nature of Business Manufacturing 13 16.2
Trading 18 22.5
Services 29 36.3
Agribusiness 13 16.2
Information Technology 5 6.3
Telecommunication 2 2.5
Total
Motivation of
Starting business
Easy to start and run
80
9
100.00
11.2
Desire to exploit and
opportunity 26 32.5
Inherited 8 10.0
Experience and skills 22 27.5
Had talent in it 8 10.0
High growth potential 5 6.3
Total
High stable return 2
80
2.5
100.00
4.5 Descriptive Analysis of Study Variables and Growth of MSEs
Descriptive analysis was performed as per the study objectives; implications of seed
capital, legal and regulatory environment, access to market, adoption of technology and
lastly the moderating effects of entrepreneurial characteristic.

62
4.5.1 Cost of Seed Capital
The first objective of the study was to examine how access to seed capital influences
growth in youth owned micro and small enterprises in Kenya. MSEs owners were asked
to indicate the cost of access to seed capital, and to what extent had their businesses had
obtained credit. MSEs Owners were also requested to indicate seed capital appraisal
procedures and the collateral factors encountered as they tried to access seed capital.
The majority of the respondents 44.0% indicated that the cost of accessing credit was
very high. The respondents cited the amount of interest rate paid on loan as being very
high and thus making the cost of finance unaffordable. 35.0% reported that credit
processing fee was very high (Table 4.5) presents the findings.
The study concurs with Bouazza, Ardjouman & Abada (2015), studies investigating the
factors affecting the growth of MSEs in Algeria. The cost of accessing credit and
amount of loan repayment interest rates were cited as the major factors affecting the
growth of MSEs in Algeria. The findings are also similar to a study carried out by
Mwangi & Bwisa (2013) on challenges facing entrepreneurs in accessing credit: a case
of youth entrepreneurs in Makuyu, Kenya. Their findings indicated that most of the
youth entrepreneurs faced challenges in accessing credit due high cost of credit
evidenced in, high rate of interest, high rate of credit processing fees and high cost of
credit insurance. Resource based theory further highlighted the importance of capital by
stating that that people with financial capital are more able to acquire resources to
effectively exploit entrepreneurial opportunities, (Clausen, 2006).
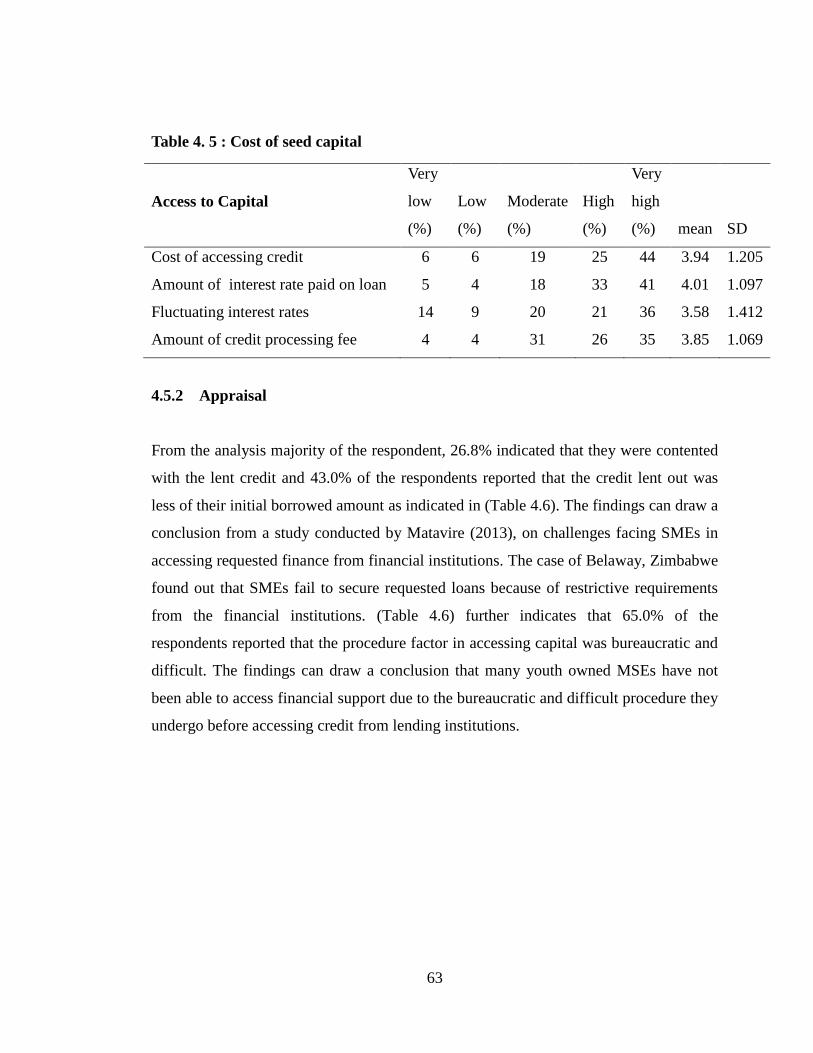
63
Table 4. 5 : Cost of seed capital
Access to Capital
Very
low
(%)
Low
(%)
Moderate
(%)
High
(%)
Very
high
(%) mean SD
Cost of accessing credit 6 6 19 25 44 3.94 1.205
Amount of interest rate paid on loan 5 4 18 33 41 4.01 1.097
Fluctuating interest rates 14 9 20 21 36 3.58 1.412
Amount of credit processing fee 4 4 31 26 35 3.85 1.069
4.5.2 Appraisal
From the analysis majority of the respondent, 26.8% indicated that they were contented
with the lent credit and 43.0% of the respondents reported that the credit lent out was
less of their initial borrowed amount as indicated in (Table 4.6). The findings can draw a
conclusion from a study conducted by Matavire (2013), on challenges facing SMEs in
accessing requested finance from financial institutions. The case of Belaway, Zimbabwe
found out that SMEs fail to secure requested loans because of restrictive requirements
from the financial institutions. (Table 4.6) further indicates that 65.0% of the
respondents reported that the procedure factor in accessing capital was bureaucratic and
difficult. The findings can draw a conclusion that many youth owned MSEs have not
been able to access financial support due to the bureaucratic and difficult procedure they
undergo before accessing credit from lending institutions.
64
Table 4. 6: Appraisal
Credit Statements Number
Response
rate %
Contented with the lent
amount
The amount was sufficient 38 56.7
The amount was less of
what was borrowed 29 42.3
Procedural factors in
accessing capital
Clear and simple
procedure
26 34.7
Bureaucratic and difficult
procedure 49 65.3
Credit
From the analysis (Figure 4.1) indicates that, only 34.0% of the respondents tried to
obtain credit to a moderate extent whereas 11.0% made no extent in seeking for credit.
The findings concur with the study of Ntakobajira, (2013) on factors affecting the
performance of MSEs traders at City Park hawkers market in Nairobi County, Kenya.
The study concluded that inefficient access to credit affected the performance of MSEs
to a great extent because it limited the entrepreneurs’ ability to take advantage of the
opportunity as and when they arise. The findings can affirm that that access to credit is a
determinant of MSEs growth in relation to increase in sales turnover, profitability,
business expansion and increase in employment opportunities. The findings further
concur with the resource based theory argument that most entrepreneurs start without
much capital however differs on the same where the theory emphasizes that financial
capital is not significantly related to the probability of being entrepreneurs, (Aldnek &
Keister, 2003).
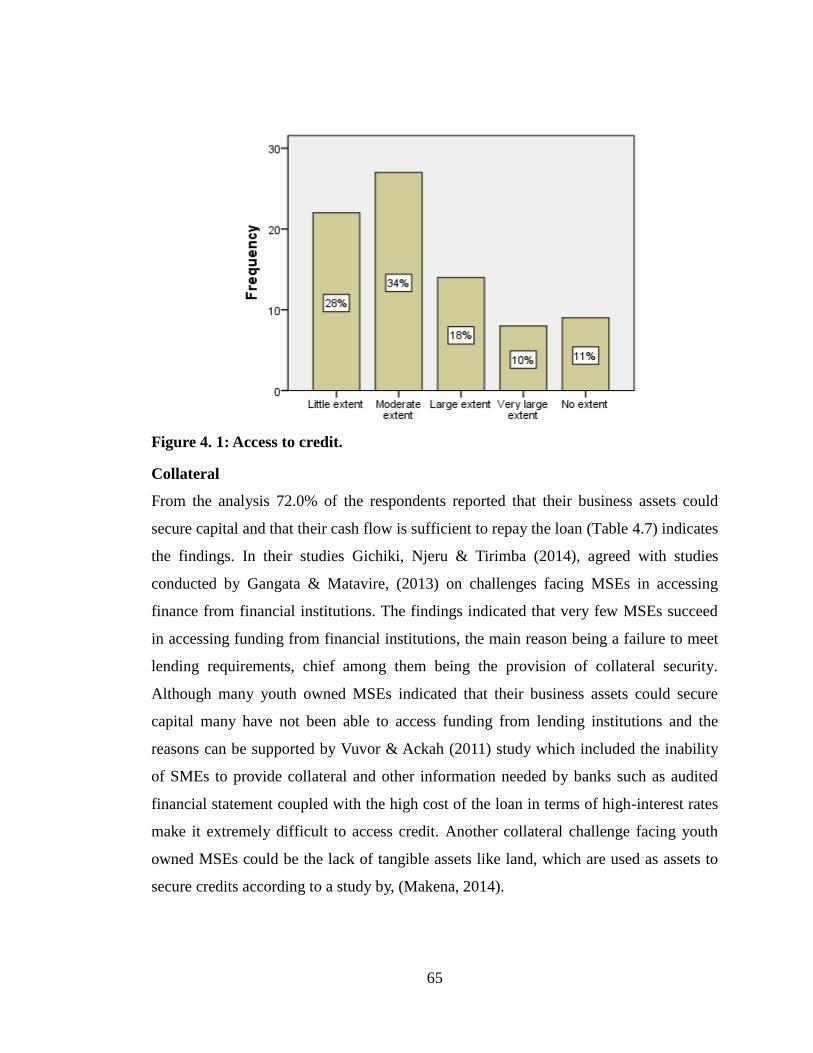
65
Figure 4. 1: Access to credit.
Collateral
From the analysis 72.0% of the respondents reported that their business assets could
secure capital and that their cash flow is sufficient to repay the loan (Table 4.7) indicates
the findings. In their studies Gichiki, Njeru & Tirimba (2014), agreed with studies
conducted by Gangata & Matavire, (2013) on challenges facing MSEs in accessing
finance from financial institutions. The findings indicated that very few MSEs succeed
in accessing funding from financial institutions, the main reason being a failure to meet
lending requirements, chief among them being the provision of collateral security.
Although many youth owned MSEs indicated that their business assets could secure
capital many have not been able to access funding from lending institutions and the
reasons can be supported by Vuvor & Ackah (2011) study which included the inability
of SMEs to provide collateral and other information needed by banks such as audited
financial statement coupled with the high cost of the loan in terms of high-interest rates
make it extremely difficult to access credit. Another collateral challenge facing youth
owned MSEs could be the lack of tangible assets like land, which are used as assets to
secure credits according to a study by, (Makena, 2014).
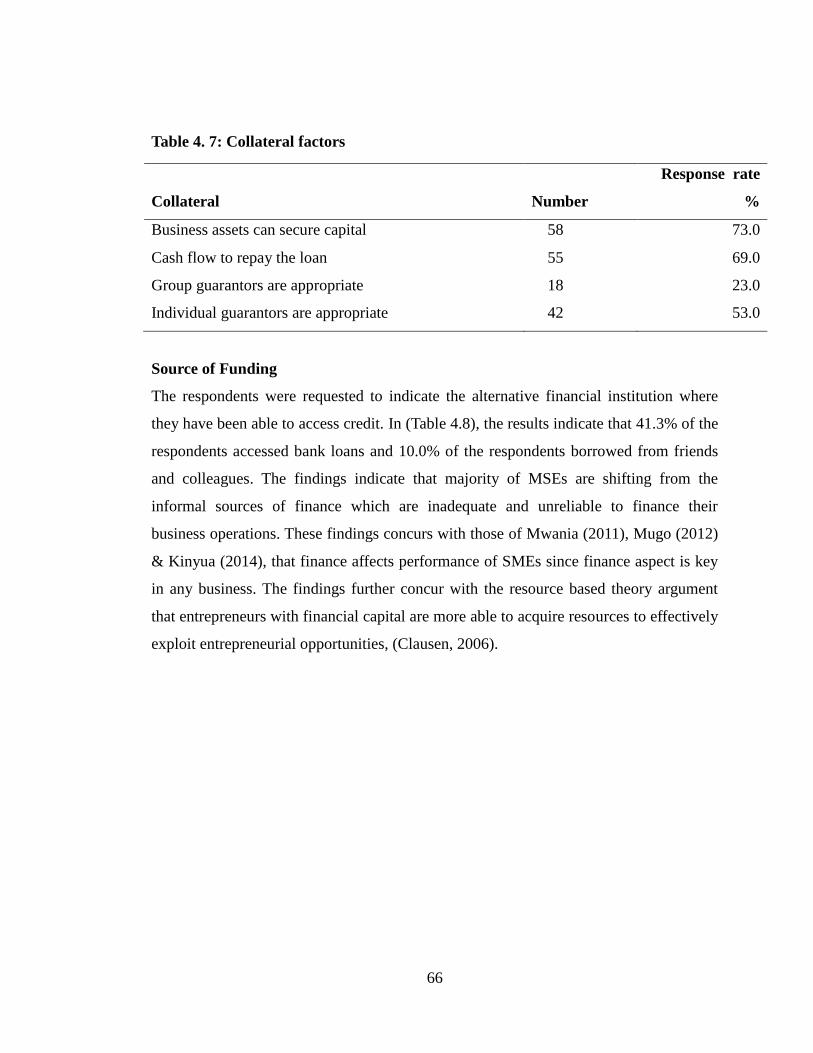
66
Table 4. 7: Collateral factors
Collateral
Number
Response rate
%
Business assets can secure capital 58 73.0
Cash flow to repay the loan 55 69.0
Group guarantors are appropriate 18 23.0
Individual guarantors are appropriate 42 53.0
Source of Funding
The respondents were requested to indicate the alternative financial institution where
they have been able to access credit. In (Table 4.8), the results indicate that 41.3% of the
respondents accessed bank loans and 10.0% of the respondents borrowed from friends
and colleagues. The findings indicate that majority of MSEs are shifting from the
informal sources of finance which are inadequate and unreliable to finance their
business operations. These findings concurs with those of Mwania (2011), Mugo (2012)
& Kinyua (2014), that finance affects performance of SMEs since finance aspect is key
in any business. The findings further concur with the resource based theory argument
that entrepreneurs with financial capital are more able to acquire resources to effectively
exploit entrepreneurial opportunities, (Clausen, 2006).
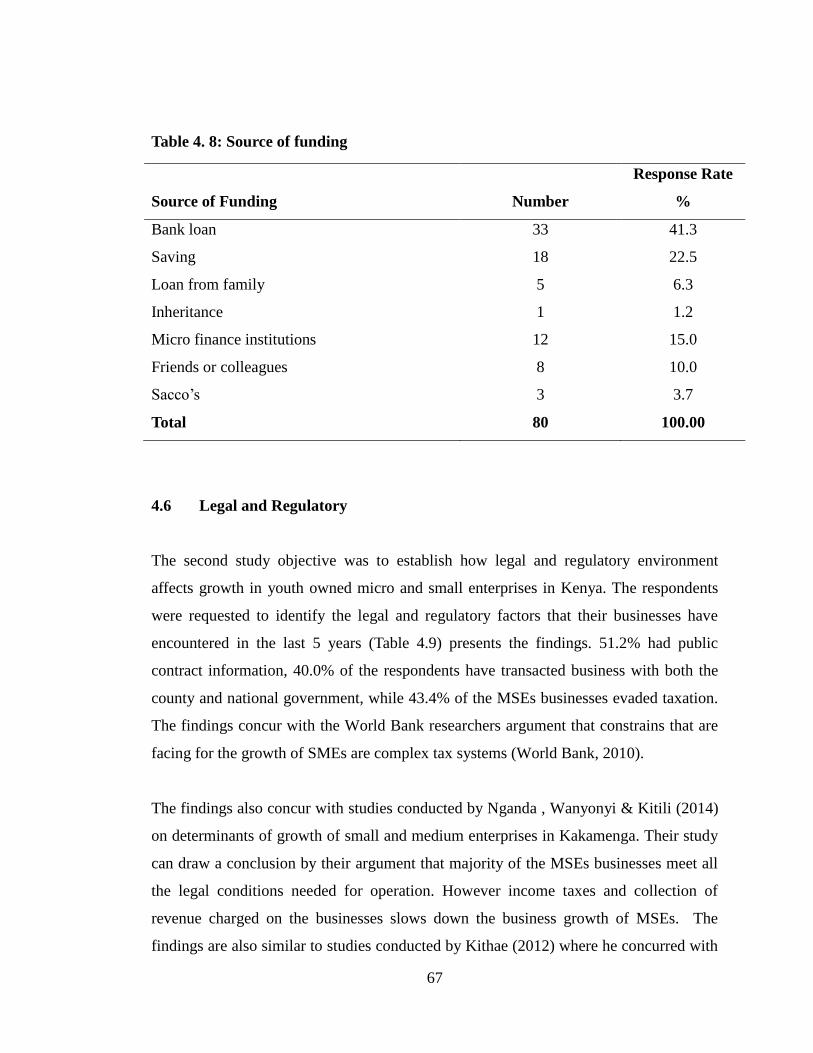
67
Table 4. 8: Source of funding
Source of Funding Number
Response Rate
%
Bank loan 33 41.3
Saving 18 22.5
Loan from family 5 6.3
Inheritance 1 1.2
Micro finance institutions 12 15.0
Friends or colleagues 8 10.0
Sacco’s 3 3.7
Total 80 100.00
4.6 Legal and Regulatory
The second study objective was to establish how legal and regulatory environment
affects growth in youth owned micro and small enterprises in Kenya. The respondents
were requested to identify the legal and regulatory factors that their businesses have
encountered in the last 5 years (Table 4.9) presents the findings. 51.2% had public
contract information, 40.0% of the respondents have transacted business with both the
county and national government, while 43.4% of the MSEs businesses evaded taxation.
The findings concur with the World Bank researchers argument that constrains that are
facing for the growth of SMEs are complex tax systems (World Bank, 2010).
The findings also concur with studies conducted by Nganda , Wanyonyi & Kitili (2014)
on determinants of growth of small and medium enterprises in Kakamenga. Their study
can draw a conclusion by their argument that majority of the MSEs businesses meet all
the legal conditions needed for operation. However income taxes and collection of
revenue charged on the businesses slows down the business growth of MSEs. The
findings are also similar to studies conducted by Kithae (2012) where he concurred with
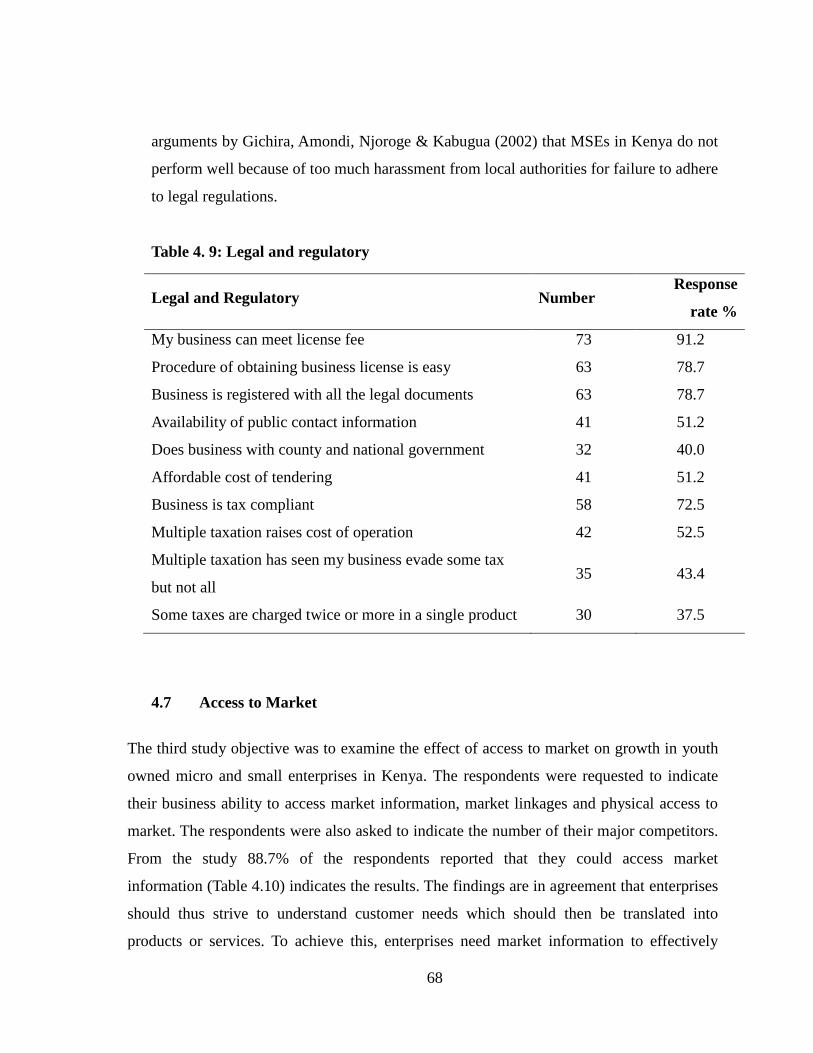
68
arguments by Gichira, Amondi, Njoroge & Kabugua (2002) that MSEs in Kenya do not
perform well because of too much harassment from local authorities for failure to adhere
to legal regulations.
Table 4. 9: Legal and regulatory
Legal and Regulatory Number Response
rate %
My business can meet license fee 73 91.2
Procedure of obtaining business license is easy 63 78.7
Business is registered with all the legal documents 63 78.7
Availability of public contact information 41 51.2
Does business with county and national government 32 40.0
Affordable cost of tendering 41 51.2
Business is tax compliant 58 72.5
Multiple taxation raises cost of operation 42 52.5
Multiple taxation has seen my business evade some tax
but not all 35 43.4
Some taxes are charged twice or more in a single product 30 37.5
4.7 Access to Market
The third study objective was to examine the effect of access to market on growth in youth
owned micro and small enterprises in Kenya. The respondents were requested to indicate
their business ability to access market information, market linkages and physical access to
market. The respondents were also asked to indicate the number of their major competitors.
From the study 88.7% of the respondents reported that they could access market
information (Table 4.10) indicates the results. The findings are in agreement that enterprises
should thus strive to understand customer needs which should then be translated into
products or services. To achieve this, enterprises need market information to effectively
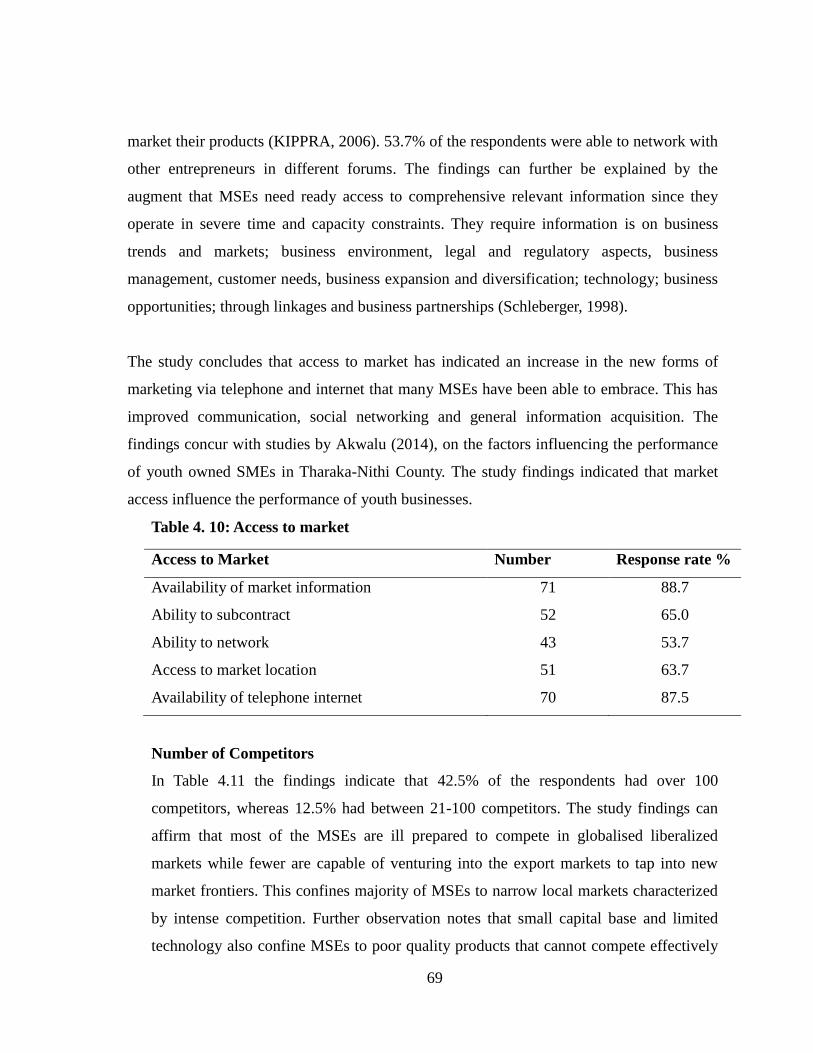
69
market their products (KIPPRA, 2006). 53.7% of the respondents were able to network with
other entrepreneurs in different forums. The findings can further be explained by the
augment that MSEs need ready access to comprehensive relevant information since they
operate in severe time and capacity constraints. They require information is on business
trends and markets; business environment, legal and regulatory aspects, business
management, customer needs, business expansion and diversification; technology; business
opportunities; through linkages and business partnerships (Schleberger, 1998).
The study concludes that access to market has indicated an increase in the new forms of
marketing via telephone and internet that many MSEs have been able to embrace. This has
improved communication, social networking and general information acquisition. The
findings concur with studies by Akwalu (2014), on the factors influencing the performance
of youth owned SMEs in Tharaka-Nithi County. The study findings indicated that market
access influence the performance of youth businesses.
Table 4. 10: Access to market
Access to Market Number Response rate %
Availability of market information 71 88.7
Ability to subcontract 52 65.0
Ability to network 43 53.7
Access to market location 51 63.7
Availability of telephone internet 70 87.5
Number of Competitors
In Table 4.11 the findings indicate that 42.5% of the respondents had over 100
competitors, whereas 12.5% had between 21-100 competitors. The study findings can
affirm that most of the MSEs are ill prepared to compete in globalised liberalized
markets while fewer are capable of venturing into the export markets to tap into new
market frontiers. This confines majority of MSEs to narrow local markets characterized
by intense competition. Further observation notes that small capital base and limited
technology also confine MSEs to poor quality products that cannot compete effectively
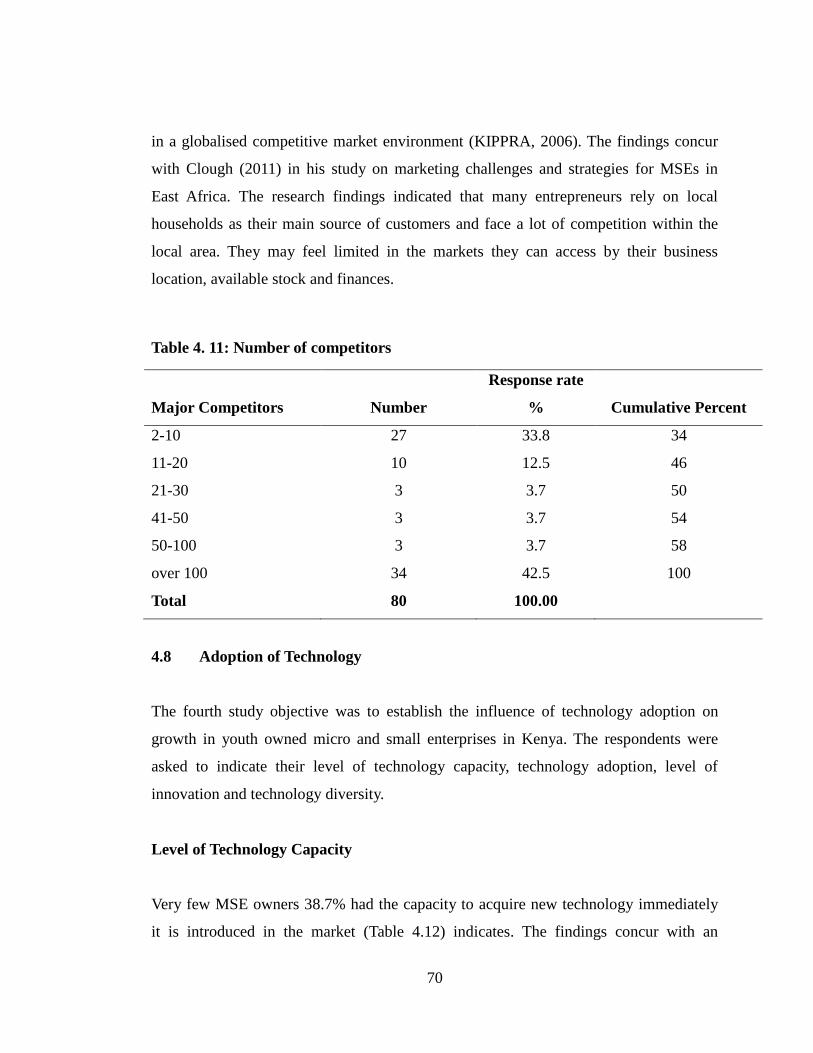
70
in a globalised competitive market environment (KIPPRA, 2006). The findings concur
with Clough (2011) in his study on marketing challenges and strategies for MSEs in
East Africa. The research findings indicated that many entrepreneurs rely on local
households as their main source of customers and face a lot of competition within the
local area. They may feel limited in the markets they can access by their business
location, available stock and finances.
Table 4. 11: Number of competitors
Major Competitors Number
Response rate
% Cumulative Percent
2-10 27 33.8 34
11-20 10 12.5 46
21-30 3 3.7 50
41-50 3 3.7 54
50-100 3 3.7 58
over 100 34 42.5 100
Total 80 100.00
4.8 Adoption of Technology
The fourth study objective was to establish the influence of technology adoption on
growth in youth owned micro and small enterprises in Kenya. The respondents were
asked to indicate their level of technology capacity, technology adoption, level of
innovation and technology diversity.
Level of Technology Capacity
Very few MSE owners 38.7% had the capacity to acquire new technology immediately
it is introduced in the market (Table 4.12) indicates. The findings concur with an
71
observation from Dadabi (2003) who suggests that good technology may cost more
initially but it later works effectively for a longer time. Hall (2002) studies can be used
to draw a conclusion that successful implementation of a technology in firms requires
new skills, it consumes time or costly to acquire. As a consequence, the overall levels
of technological skills available to the enterprise as well as the manner in which the
necessary skills are acquired are important components of technology diffusion.
Technology Adoption
Majority of the respondents had adopted some form of technology especially in areas of
communication, new product development and in the new forms of banking (Table 4.12)
indicates the findings. These new adoptions did impact significantly towards the growth
of their MSEs in a moderate effect. The findings can concur with a study by Kithaye
(2010) where he notes that technology adoption is not only the capability of acquiring
the new technology but modification of an existing technology to meet the needs of
specific types of producers or consumers, become compatible with locally available
materials or local tastes and preferences or take advantage of a relative abundance of
labour relative to capital (Van Dijk, 2001).
The findings can also concur with Hall (2002) who notes that the obvious determinants
of new technology adoption are the benefits received by the users and the cost of
adoption. He further notes that in many cases these benefits are simply the difference in
profits when a firm shifts from older technology to a newer however the status that the
strength of the relation to the firms customs and the importance of network is key to the
success of the adopted technology.
Level of Innovation
Majority of the respondents indicated that whereas they have introduced new products
and services using new technology, they also reported that change of technology has
poised a great challenge in their businesses (60.0%) (Table 4.12) explains the results.
72
The findings can conclude that the innovation ability of enterprises plays a critical role
in product innovation and organizational innovation which are the motivating factors for
firm growth the quality of managers, the intrinsic quality of MSEs and corporate
business development strategies are also important factors in determining its growth
(Tassey, 2004).
Technology Diversity
Majority of the respondents were able to embrace diversity in technology especially in
areas of communication where they embraced the use of websites, emails and mobile
phone for effective and efficient communication. The findings concur with studies
conducted by ILO/UNDP, (2000) where it was argued that the purpose of technology is
to improve productivity of enterprises, and enhance the quality of goods produced to
help the enterprises with-stand local and international competition (ILO/UNDP, 2000).
The findings are also supported by Nganda& Wanyonyi & Kitili (2014) where they
noted that mobile phones make it easy to run business and that both mobile phones and
internet contributed to business growth. (Table 4.12) presents the findings.
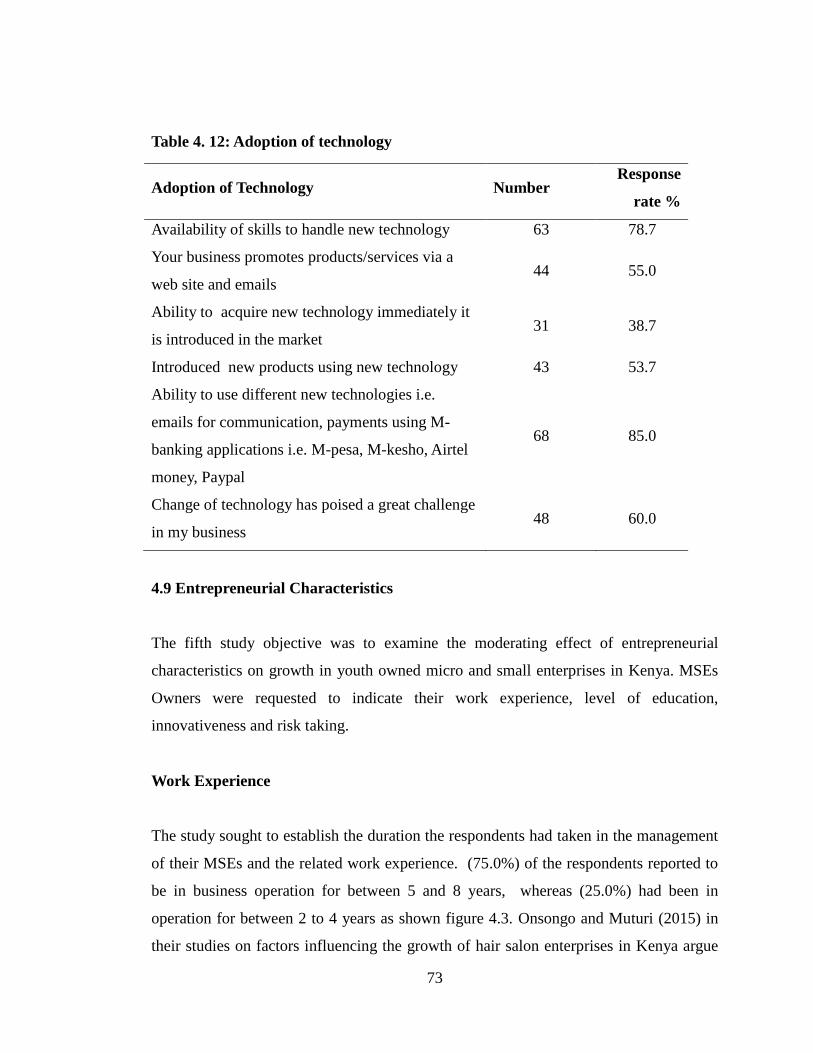
73
Table 4. 12: Adoption of technology
Adoption of Technology Number Response
rate %
Availability of skills to handle new technology 63 78.7
Your business promotes products/services via a
web site and emails 44 55.0
Ability to acquire new technology immediately it
is introduced in the market 31 38.7
Introduced new products using new technology 43 53.7
Ability to use different new technologies i.e.
emails for communication, payments using M-
banking applications i.e. M-pesa, M-kesho, Airtel
money, Paypal
68 85.0
Change of technology has poised a great challenge
in my business 48 60.0
4.9 Entrepreneurial Characteristics
The fifth study objective was to examine the moderating effect of entrepreneurial
characteristics on growth in youth owned micro and small enterprises in Kenya. MSEs
Owners were requested to indicate their work experience, level of education,
innovativeness and risk taking.
Work Experience
The study sought to establish the duration the respondents had taken in the management
of their MSEs and the related work experience. (75.0%) of the respondents reported to
be in business operation for between 5 and 8 years, whereas (25.0%) had been in
operation for between 2 to 4 years as shown figure 4.3. Onsongo and Muturi (2015) in
their studies on factors influencing the growth of hair salon enterprises in Kenya argue
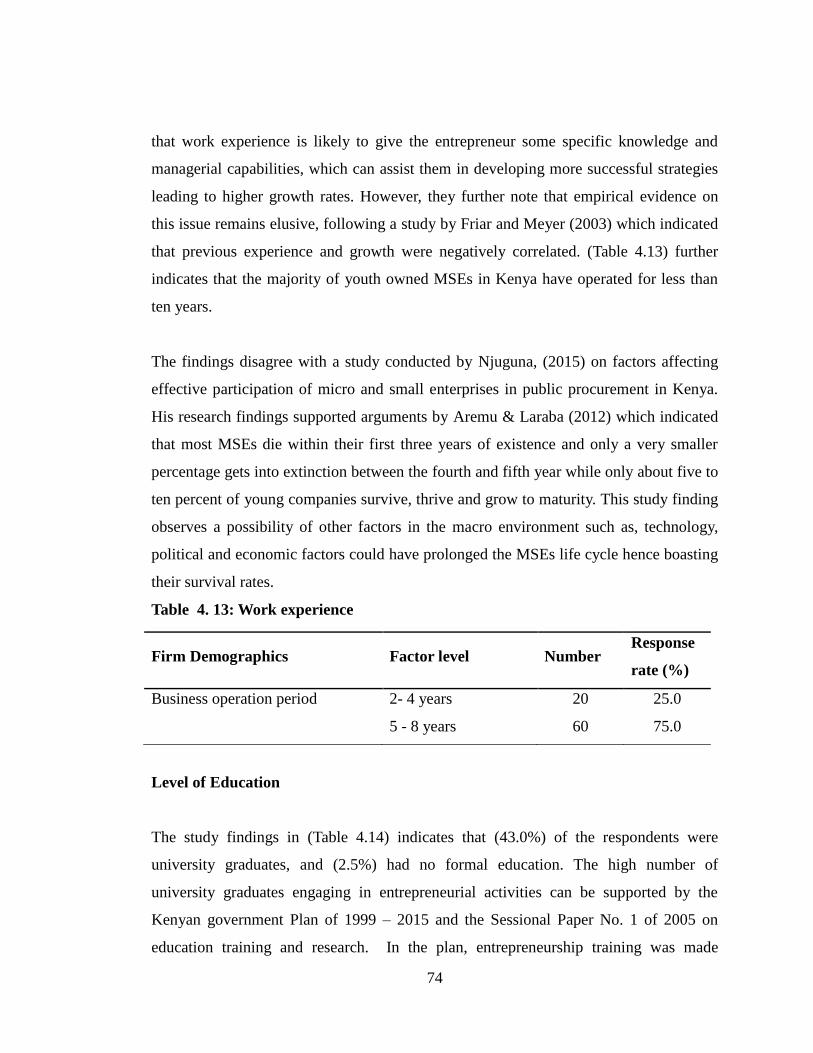
74
that work experience is likely to give the entrepreneur some specific knowledge and
managerial capabilities, which can assist them in developing more successful strategies
leading to higher growth rates. However, they further note that empirical evidence on
this issue remains elusive, following a study by Friar and Meyer (2003) which indicated
that previous experience and growth were negatively correlated. (Table 4.13) further
indicates that the majority of youth owned MSEs in Kenya have operated for less than
ten years.
The findings disagree with a study conducted by Njuguna, (2015) on factors affecting
effective participation of micro and small enterprises in public procurement in Kenya.
His research findings supported arguments by Aremu & Laraba (2012) which indicated
that most MSEs die within their first three years of existence and only a very smaller
percentage gets into extinction between the fourth and fifth year while only about five to
ten percent of young companies survive, thrive and grow to maturity. This study finding
observes a possibility of other factors in the macro environment such as, technology,
political and economic factors could have prolonged the MSEs life cycle hence boasting
their survival rates.
Table 4. 13: Work experience
Firm Demographics Factor level Number Response
rate (%)
Business operation period 2- 4 years 20 25.0
5 - 8 years 60 75.0
Level of Education
The study findings in (Table 4.14) indicates that (43.0%) of the respondents were
university graduates, and (2.5%) had no formal education. The high number of
university graduates engaging in entrepreneurial activities can be supported by the
Kenyan government Plan of 1999 – 2015 and the Sessional Paper No. 1 of 2005 on
education training and research. In the plan, entrepreneurship training was made
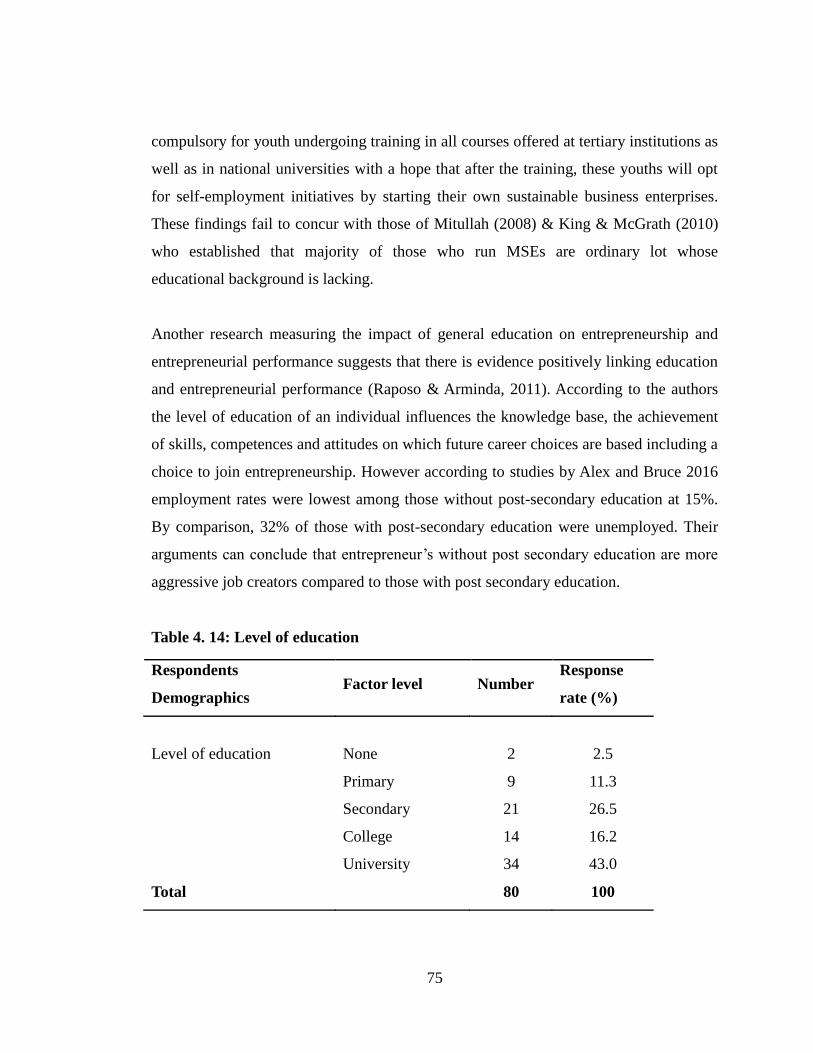
75
compulsory for youth undergoing training in all courses offered at tertiary institutions as
well as in national universities with a hope that after the training, these youths will opt
for self-employment initiatives by starting their own sustainable business enterprises.
These findings fail to concur with those of Mitullah (2008) & King & McGrath (2010)
who established that majority of those who run MSEs are ordinary lot whose
educational background is lacking.
Another research measuring the impact of general education on entrepreneurship and
entrepreneurial performance suggests that there is evidence positively linking education
and entrepreneurial performance (Raposo & Arminda, 2011). According to the authors
the level of education of an individual influences the knowledge base, the achievement
of skills, competences and attitudes on which future career choices are based including a
choice to join entrepreneurship. However according to studies by Alex and Bruce 2016
employment rates were lowest among those without post-secondary education at 15%.
By comparison, 32% of those with post-secondary education were unemployed. Their
arguments can conclude that entrepreneur’s without post secondary education are more
aggressive job creators compared to those with post secondary education.
Table 4. 14: Level of education
Respondents
Demographics Factor level Number
Response
rate (%)
Level of education None 2 2.5
Primary 9 11.3
Secondary 21 26.5
College 14 16.2
University 34 43.0
Total 80 100
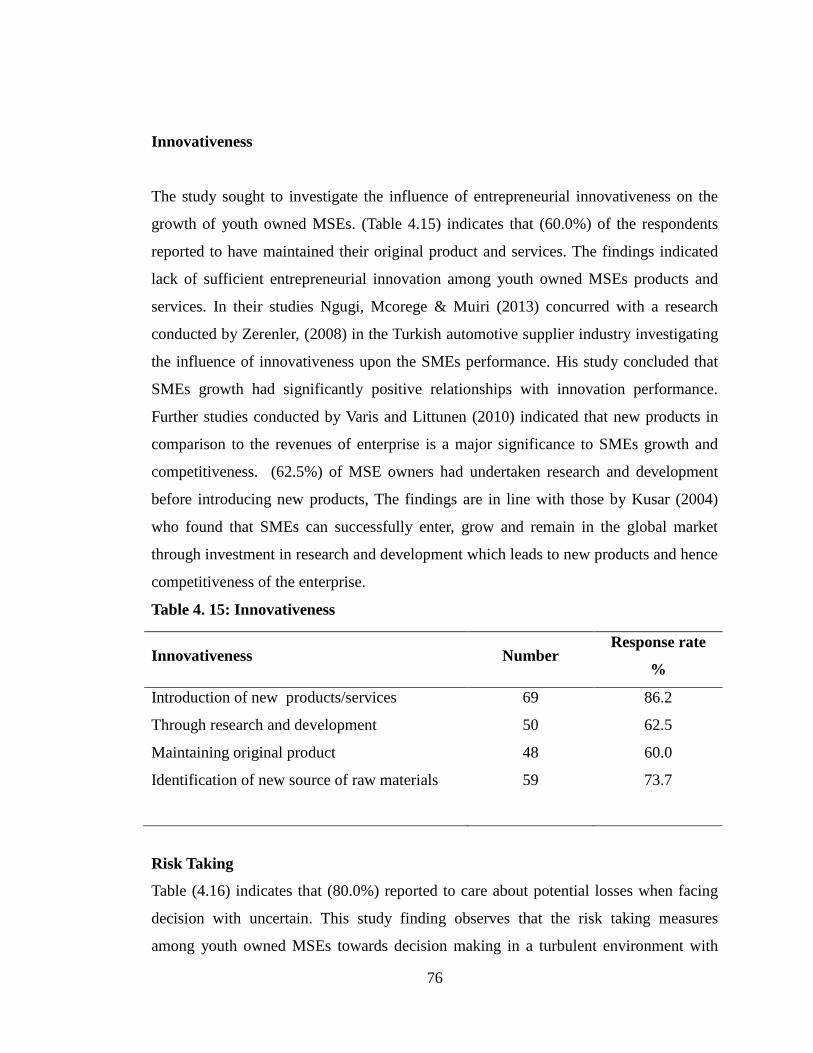
76
Innovativeness
The study sought to investigate the influence of entrepreneurial innovativeness on the
growth of youth owned MSEs. (Table 4.15) indicates that (60.0%) of the respondents
reported to have maintained their original product and services. The findings indicated
lack of sufficient entrepreneurial innovation among youth owned MSEs products and
services. In their studies Ngugi, Mcorege & Muiri (2013) concurred with a research
conducted by Zerenler, (2008) in the Turkish automotive supplier industry investigating
the influence of innovativeness upon the SMEs performance. His study concluded that
SMEs growth had significantly positive relationships with innovation performance.
Further studies conducted by Varis and Littunen (2010) indicated that new products in
comparison to the revenues of enterprise is a major significance to SMEs growth and
competitiveness. (62.5%) of MSE owners had undertaken research and development
before introducing new products, The findings are in line with those by Kusar (2004)
who found that SMEs can successfully enter, grow and remain in the global market
through investment in research and development which leads to new products and hence
competitiveness of the enterprise.
Table 4. 15: Innovativeness
Innovativeness Number Response rate
%
Introduction of new products/services 69 86.2
Through research and development 50 62.5
Maintaining original product 48 60.0
Identification of new source of raw materials 59 73.7
Risk Taking
Table (4.16) indicates that (80.0%) reported to care about potential losses when facing
decision with uncertain. This study finding observes that the risk taking measures
among youth owned MSEs towards decision making in a turbulent environment with
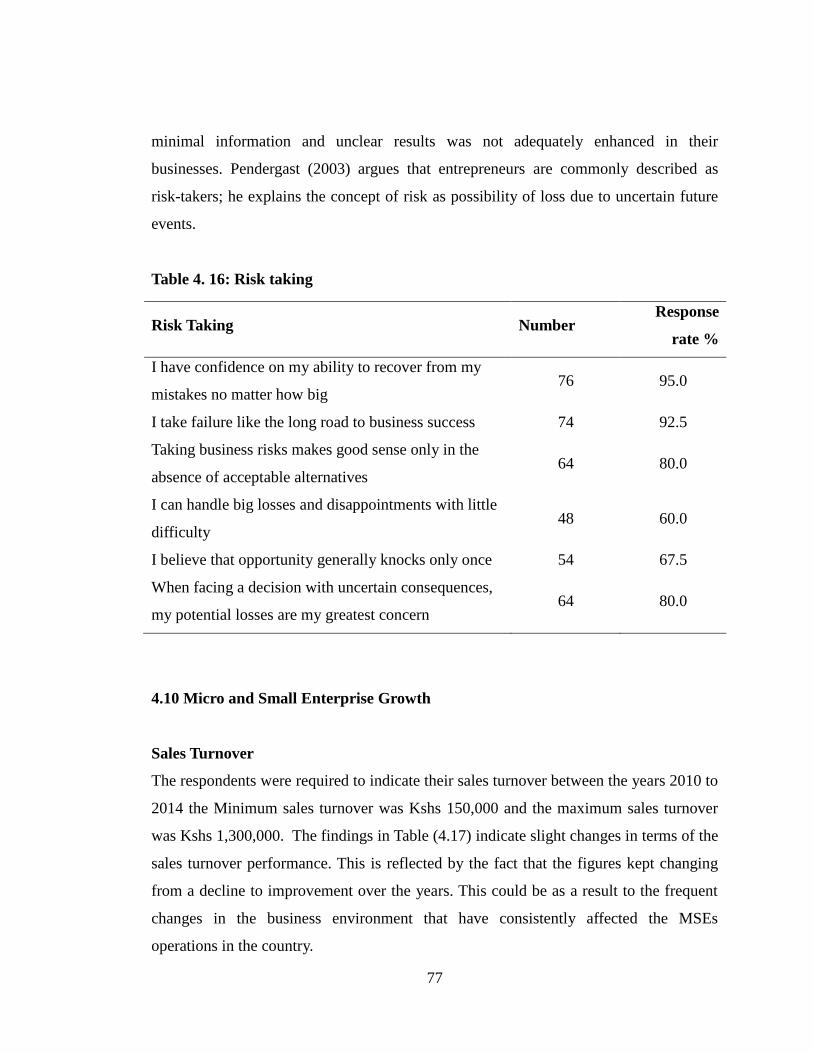
77
minimal information and unclear results was not adequately enhanced in their
businesses. Pendergast (2003) argues that entrepreneurs are commonly described as
risk-takers; he explains the concept of risk as possibility of loss due to uncertain future
events.
Table 4. 16: Risk taking
Risk Taking Number Response
rate %
I have confidence on my ability to recover from my
mistakes no matter how big 76 95.0
I take failure like the long road to business success 74 92.5
Taking business risks makes good sense only in the
absence of acceptable alternatives 64 80.0
I can handle big losses and disappointments with little
difficulty 48 60.0
I believe that opportunity generally knocks only once 54 67.5
When facing a decision with uncertain consequences,
my potential losses are my greatest concern 64 80.0
4.10 Micro and Small Enterprise Growth
Sales Turnover
The respondents were required to indicate their sales turnover between the years 2010 to
2014 the Minimum sales turnover was Kshs 150,000 and the maximum sales turnover
was Kshs 1,300,000. The findings in Table (4.17) indicate slight changes in terms of the
sales turnover performance. This is reflected by the fact that the figures kept changing
from a decline to improvement over the years. This could be as a result to the frequent
changes in the business environment that have consistently affected the MSEs
operations in the country.
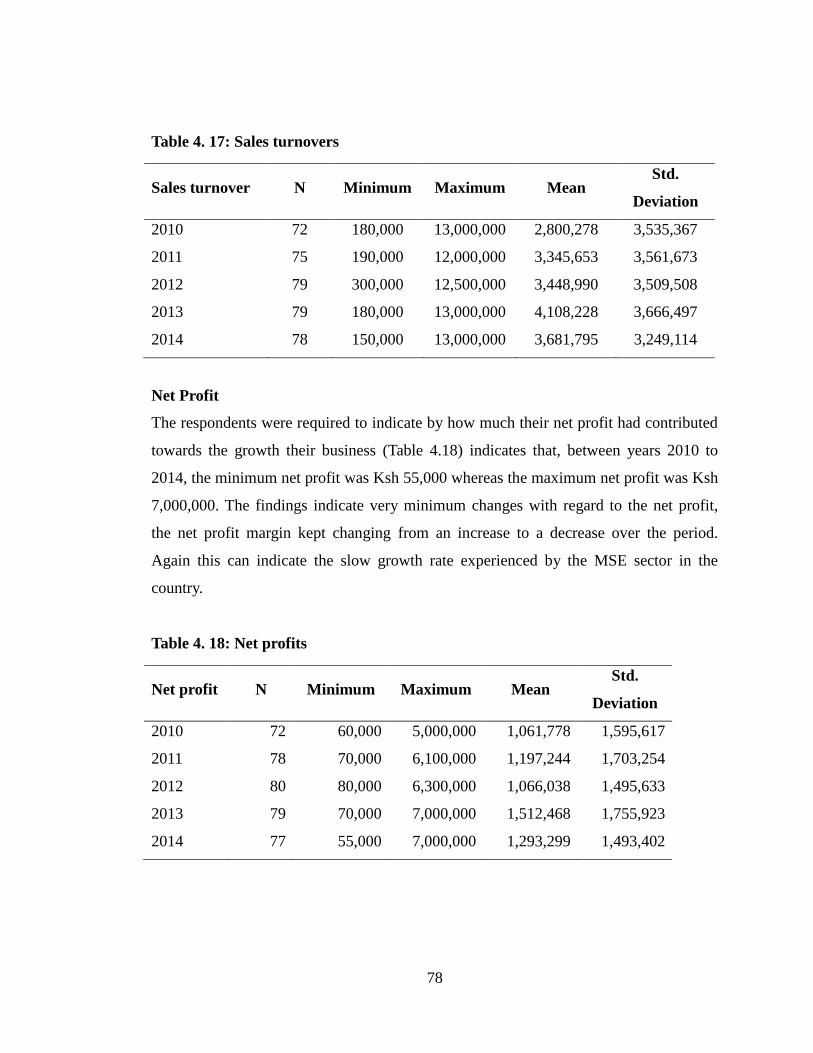
78
Table 4. 17: Sales turnovers
Sales turnover N Minimum Maximum Mean Std.
Deviation
2010 72 180,000 13,000,000 2,800,278 3,535,367
2011 75 190,000 12,000,000 3,345,653 3,561,673
2012 79 300,000 12,500,000 3,448,990 3,509,508
2013 79 180,000 13,000,000 4,108,228 3,666,497
2014 78 150,000 13,000,000 3,681,795 3,249,114
Net Profit
The respondents were required to indicate by how much their net profit had contributed
towards the growth their business (Table 4.18) indicates that, between years 2010 to
2014, the minimum net profit was Ksh 55,000 whereas the maximum net profit was Ksh
7,000,000. The findings indicate very minimum changes with regard to the net profit,
the net profit margin kept changing from an increase to a decrease over the period.
Again this can indicate the slow growth rate experienced by the MSE sector in the
country.
Table 4. 18: Net profits
Net profit N Minimum Maximum Mean Std.
Deviation
2010 72 60,000 5,000,000 1,061,778 1,595,617
2011 78 70,000 6,100,000 1,197,244 1,703,254
2012 80 80,000 6,300,000 1,066,038 1,495,633
2013 79 70,000 7,000,000 1,512,468 1,755,923
2014 77 55,000 7,000,000 1,293,299 1,493,402
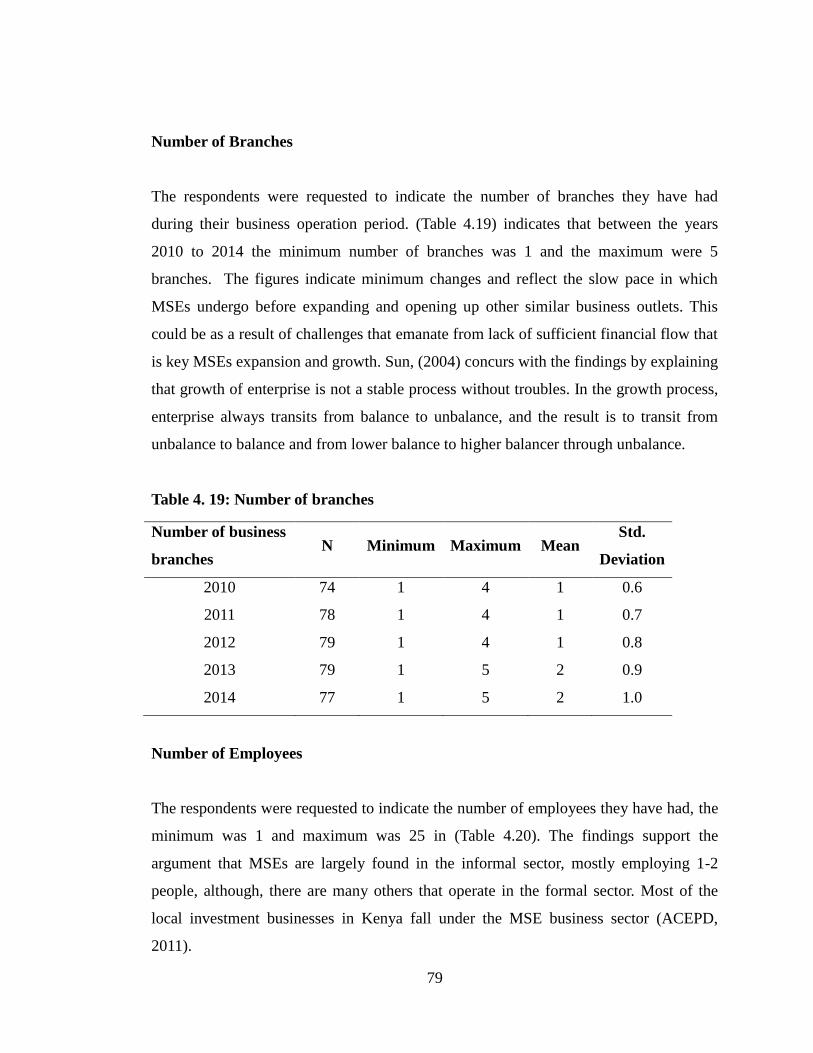
79
Number of Branches
The respondents were requested to indicate the number of branches they have had
during their business operation period. (Table 4.19) indicates that between the years
2010 to 2014 the minimum number of branches was 1 and the maximum were 5
branches. The figures indicate minimum changes and reflect the slow pace in which
MSEs undergo before expanding and opening up other similar business outlets. This
could be as a result of challenges that emanate from lack of sufficient financial flow that
is key MSEs expansion and growth. Sun, (2004) concurs with the findings by explaining
that growth of enterprise is not a stable process without troubles. In the growth process,
enterprise always transits from balance to unbalance, and the result is to transit from
unbalance to balance and from lower balance to higher balancer through unbalance.
Table 4. 19: Number of branches
Number of business
branches N Minimum Maximum Mean
Std.
Deviation
2010 74 1 4 1 0.6
2011 78 1 4 1 0.7
2012 79 1 4 1 0.8
2013 79 1 5 2 0.9
2014 77 1 5 2 1.0
Number of Employees
The respondents were requested to indicate the number of employees they have had, the
minimum was 1 and maximum was 25 in (Table 4.20). The findings support the
argument that MSEs are largely found in the informal sector, mostly employing 1-2
people, although, there are many others that operate in the formal sector. Most of the
local investment businesses in Kenya fall under the MSE business sector (ACEPD,
2011).
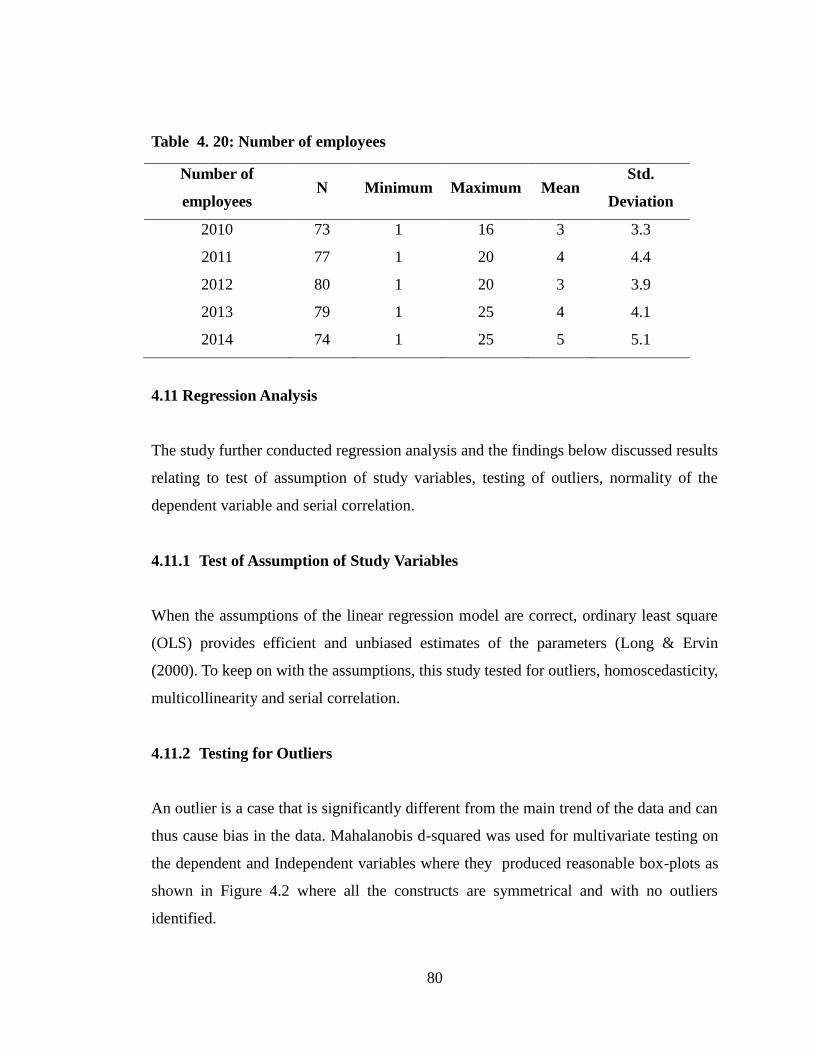
80
Table 4. 20: Number of employees
Number of
employees N Minimum Maximum Mean
Std.
Deviation
2010 73 1 16 3 3.3
2011 77 1 20 4 4.4
2012 80 1 20 3 3.9
2013 79 1 25 4 4.1
2014 74 1 25 5 5.1
4.11 Regression Analysis
The study further conducted regression analysis and the findings below discussed results
relating to test of assumption of study variables, testing of outliers, normality of the
dependent variable and serial correlation.
4.11.1 Test of Assumption of Study Variables
When the assumptions of the linear regression model are correct, ordinary least square
(OLS) provides efficient and unbiased estimates of the parameters (Long & Ervin
(2000). To keep on with the assumptions, this study tested for outliers, homoscedasticity,
multicollinearity and serial correlation.
4.11.2 Testing for Outliers
An outlier is a case that is significantly different from the main trend of the data and can
thus cause bias in the data. Mahalanobis d-squared was used for multivariate testing on
the dependent and Independent variables where they produced reasonable box-plots as
shown in Figure 4.2 where all the constructs are symmetrical and with no outliers
identified.
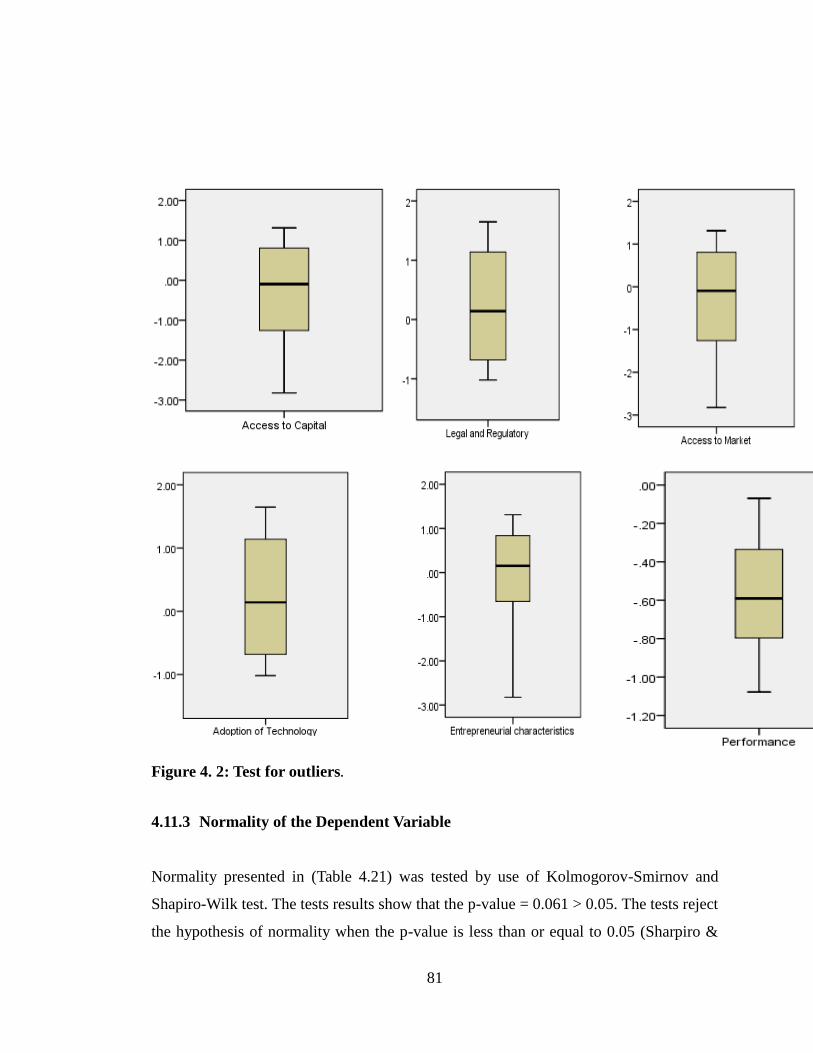
81
Figure 4. 2: Test for outliers.
4.11.3 Normality of the Dependent Variable
Normality presented in (Table 4.21) was tested by use of Kolmogorov-Smirnov and
Shapiro-Wilk test. The tests results show that the p-value = 0.061 > 0.05. The tests reject
the hypothesis of normality when the p-value is less than or equal to 0.05 (Sharpiro &
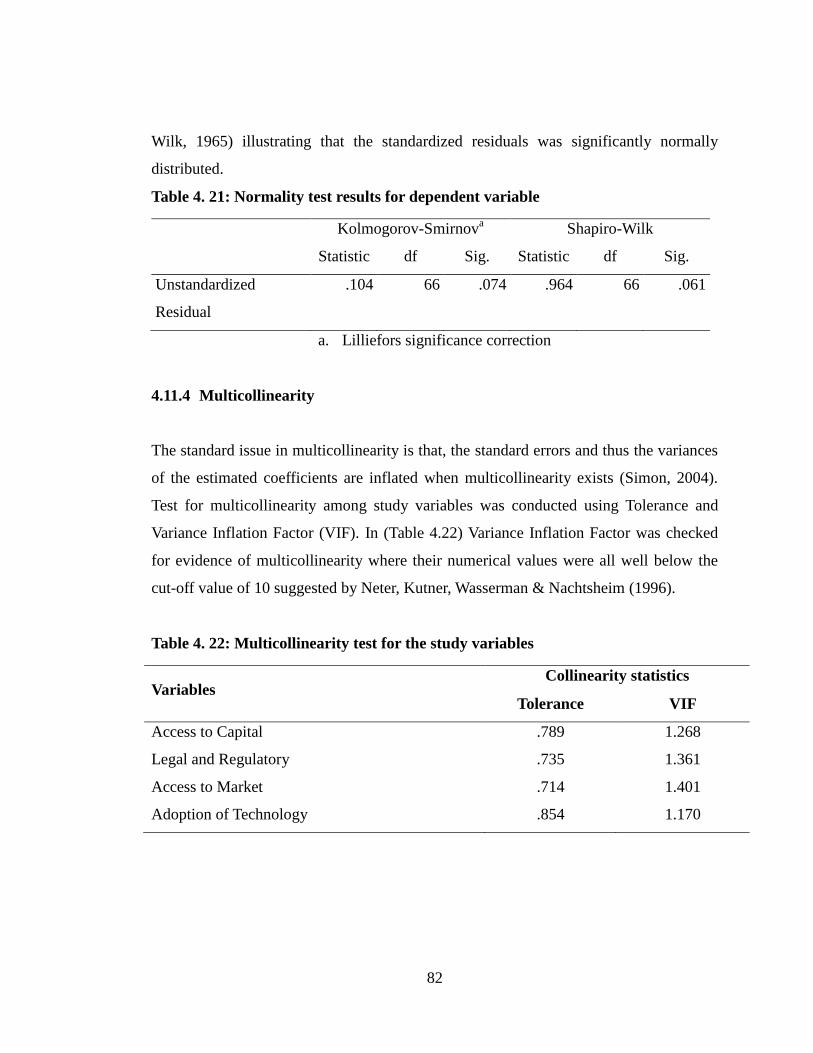
82
Wilk, 1965) illustrating that the standardized residuals was significantly normally
distributed.
Table 4. 21: Normality test results for dependent variable
Kolmogorov-Smirnova Shapiro-Wilk
Statistic df Sig. Statistic df Sig.
Unstandardized
Residual
.104 66 .074 .964 66 .061
a. Lilliefors significance correction
4.11.4 Multicollinearity
The standard issue in multicollinearity is that, the standard errors and thus the variances
of the estimated coefficients are inflated when multicollinearity exists (Simon, 2004).
Test for multicollinearity among study variables was conducted using Tolerance and
Variance Inflation Factor (VIF). In (Table 4.22) Variance Inflation Factor was checked
for evidence of multicollinearity where their numerical values were all well below the
cut-off value of 10 suggested by Neter, Kutner, Wasserman & Nachtsheim (1996).
Table 4. 22: Multicollinearity test for the study variables
Variables Collinearity statistics
Tolerance VIF
Access to Capital .789 1.268
Legal and Regulatory .735 1.361
Access to Market .714 1.401
Adoption of Technology .854 1.170
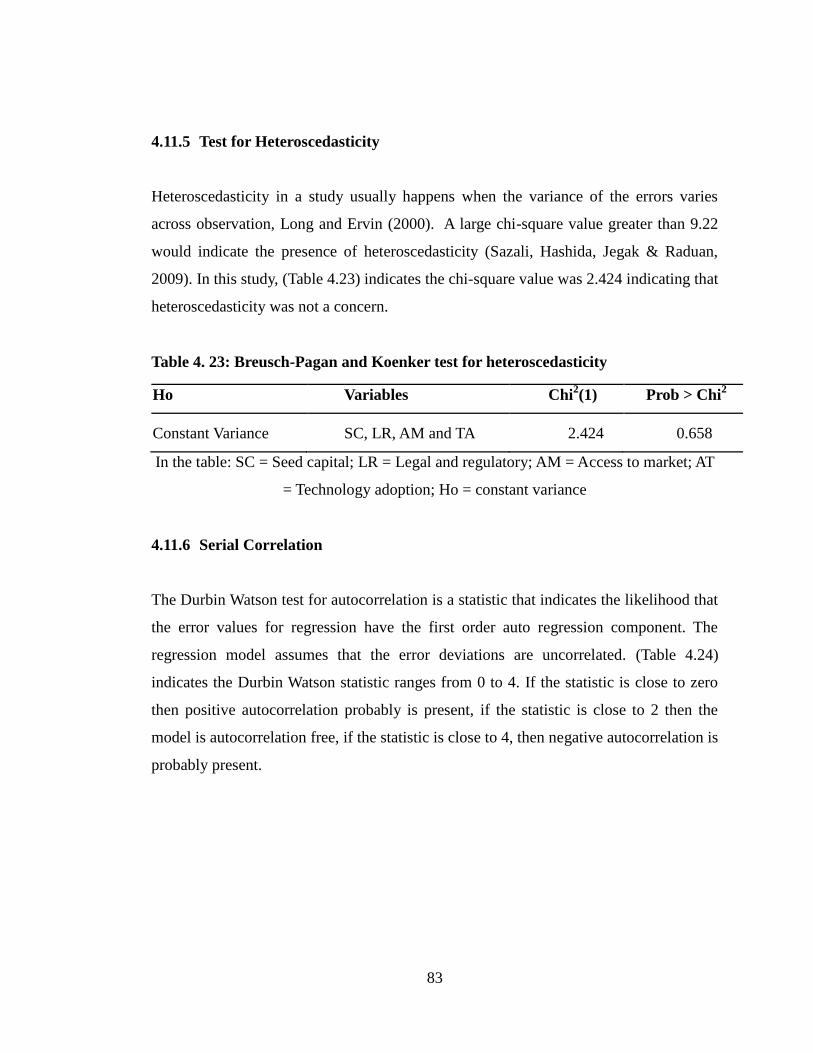
83
4.11.5 Test for Heteroscedasticity
Heteroscedasticity in a study usually happens when the variance of the errors varies
across observation, Long and Ervin (2000). A large chi-square value greater than 9.22
would indicate the presence of heteroscedasticity (Sazali, Hashida, Jegak & Raduan,
2009). In this study, (Table 4.23) indicates the chi-square value was 2.424 indicating that
heteroscedasticity was not a concern.
Table 4. 23: Breusch-Pagan and Koenker test for heteroscedasticity
Ho Variables Chi2(1) Prob > Chi
2
Constant Variance SC, LR, AM and TA 2.424 0.658
In the table: SC = Seed capital; LR = Legal and regulatory; AM = Access to market; AT
= Technology adoption; Ho = constant variance
4.11.6 Serial Correlation
The Durbin Watson test for autocorrelation is a statistic that indicates the likelihood that
the error values for regression have the first order auto regression component. The
regression model assumes that the error deviations are uncorrelated. (Table 4.24)
indicates the Durbin Watson statistic ranges from 0 to 4. If the statistic is close to zero
then positive autocorrelation probably is present, if the statistic is close to 2 then the
model is autocorrelation free, if the statistic is close to 4, then negative autocorrelation is
probably present.
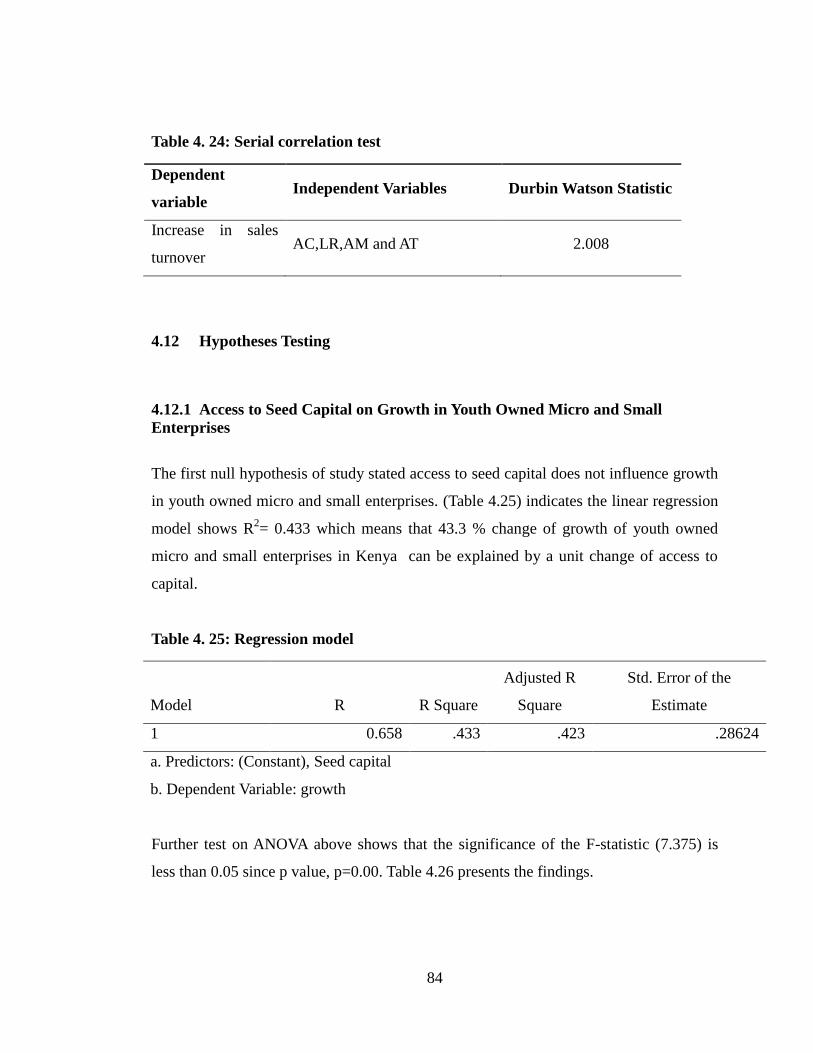
84
Table 4. 24: Serial correlation test
Dependent
variable Independent Variables Durbin Watson Statistic
Increase in sales
turnover AC,LR,AM and AT 2.008
4.12 Hypotheses Testing
4.12.1 Access to Seed Capital on Growth in Youth Owned Micro and Small
Enterprises
The first null hypothesis of study stated access to seed capital does not influence growth
in youth owned micro and small enterprises. (Table 4.25) indicates the linear regression
model shows R2= 0.433 which means that 43.3 % change of growth of youth owned
micro and small enterprises in Kenya can be explained by a unit change of access to
capital.
Table 4. 25: Regression model
Model R R Square
Adjusted R
Square
Std. Error of the
Estimate
1 0.658 .433 .423 .28624
a. Predictors: (Constant), Seed capital
b. Dependent Variable: growth
Further test on ANOVA above shows that the significance of the F-statistic (7.375) is
less than 0.05 since p value, p=0.00. Table 4.26 presents the findings.
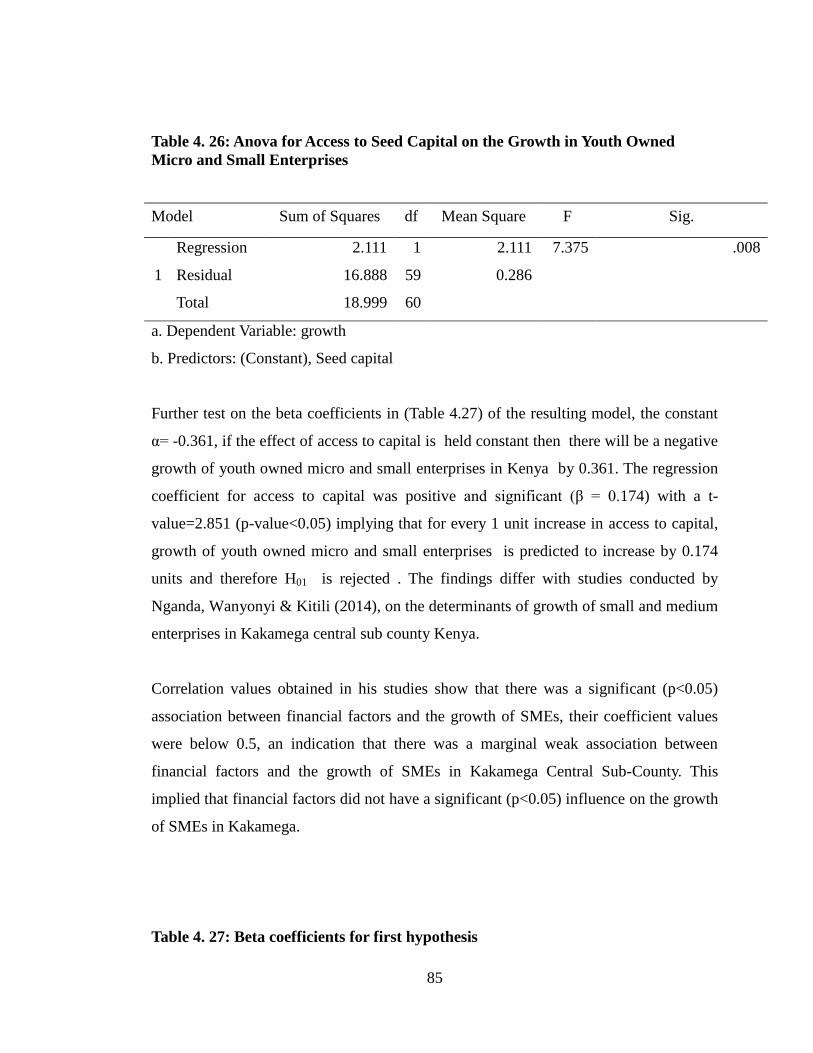
85
Table 4. 26: Anova for Access to Seed Capital on the Growth in Youth Owned
Micro and Small Enterprises
Model Sum of Squares df Mean Square F Sig.
1
Regression 2.111 1 2.111 7.375 .008
Residual 16.888 59 0.286
Total 18.999 60
a. Dependent Variable: growth
b. Predictors: (Constant), Seed capital
Further test on the beta coefficients in (Table 4.27) of the resulting model, the constant
α= -0.361, if the effect of access to capital is held constant then there will be a negative
growth of youth owned micro and small enterprises in Kenya by 0.361. The regression
coefficient for access to capital was positive and significant (β = 0.174) with a t-
value=2.851 (p-value<0.05) implying that for every 1 unit increase in access to capital,
growth of youth owned micro and small enterprises is predicted to increase by 0.174
units and therefore H01 is rejected . The findings differ with studies conducted by
Nganda, Wanyonyi & Kitili (2014), on the determinants of growth of small and medium
enterprises in Kakamega central sub county Kenya.
Correlation values obtained in his studies show that there was a significant (p<0.05)
association between financial factors and the growth of SMEs, their coefficient values
were below 0.5, an indication that there was a marginal weak association between
financial factors and the growth of SMEs in Kakamega Central Sub-County. This
implied that financial factors did not have a significant (p<0.05) influence on the growth
of SMEs in Kakamega.
Table 4. 27: Beta coefficients for first hypothesis
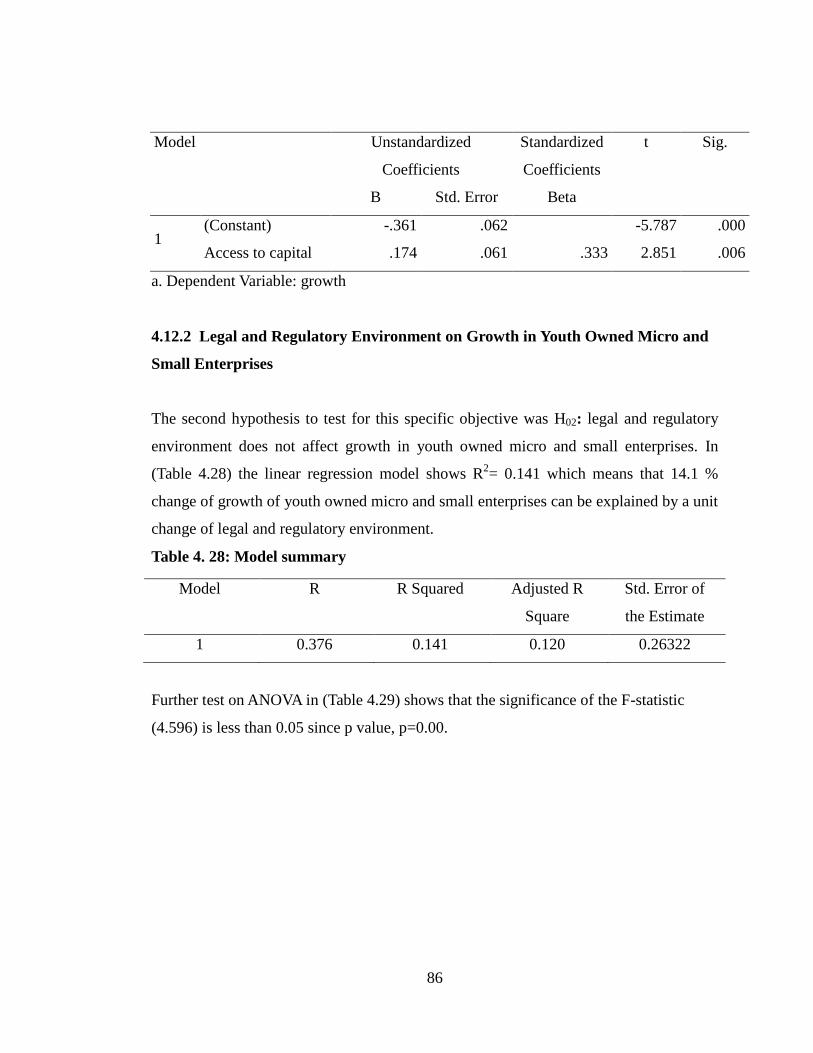
86
Model Unstandardized
Coefficients
Standardized
Coefficients
t Sig.
B Std. Error Beta
1 (Constant) -.361 .062 -5.787 .000
Access to capital .174 .061 .333 2.851 .006
a. Dependent Variable: growth
4.12.2 Legal and Regulatory Environment on Growth in Youth Owned Micro and
Small Enterprises
The second hypothesis to test for this specific objective was H02: legal and regulatory
environment does not affect growth in youth owned micro and small enterprises. In
(Table 4.28) the linear regression model shows R2= 0.141 which means that 14.1 %
change of growth of youth owned micro and small enterprises can be explained by a unit
change of legal and regulatory environment.
Table 4. 28: Model summary
Model R R Squared Adjusted R
Square
Std. Error of
the Estimate
1 0.376 0.141 0.120 0.26322
Further test on ANOVA in (Table 4.29) shows that the significance of the F-statistic
(4.596) is less than 0.05 since p value, p=0.00.
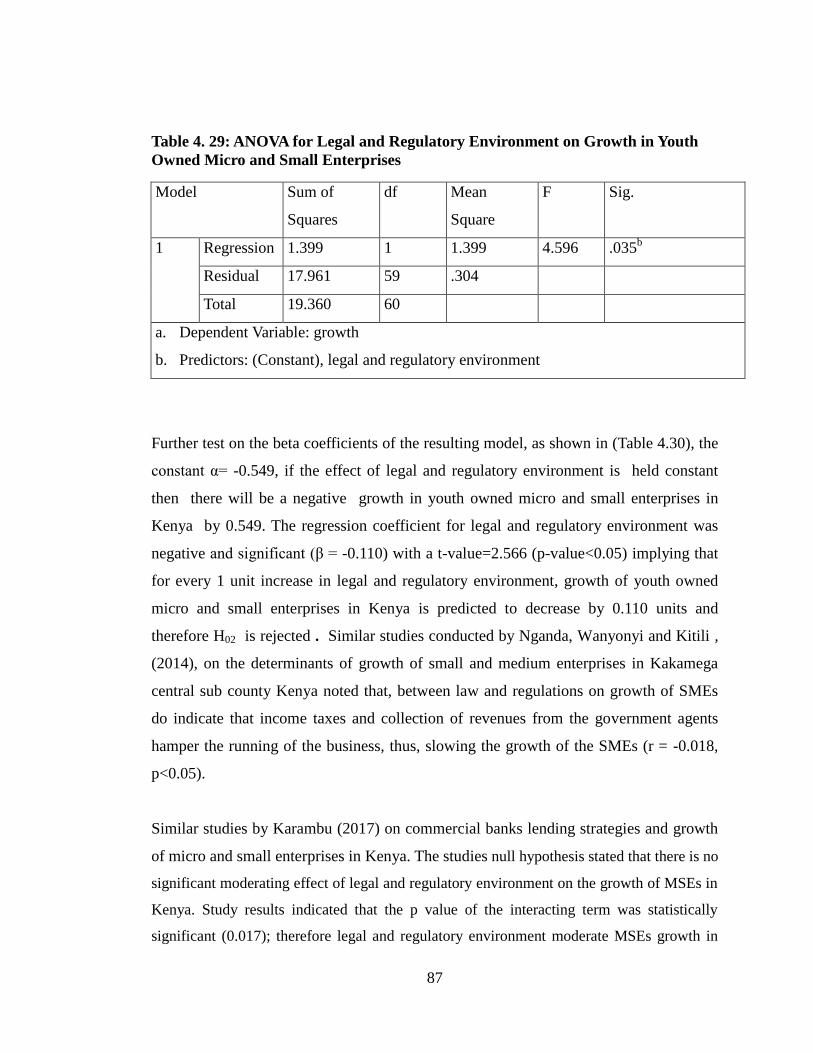
87
Table 4. 29: ANOVA for Legal and Regulatory Environment on Growth in Youth
Owned Micro and Small Enterprises
Model Sum of
Squares
df Mean
Square
F Sig.
1 Regression 1.399 1 1.399 4.596 .035b
Residual 17.961 59 .304
Total 19.360 60
a. Dependent Variable: growth
b. Predictors: (Constant), legal and regulatory environment
Further test on the beta coefficients of the resulting model, as shown in (Table 4.30), the
constant α= -0.549, if the effect of legal and regulatory environment is held constant
then there will be a negative growth in youth owned micro and small enterprises in
Kenya by 0.549. The regression coefficient for legal and regulatory environment was
negative and significant (β = -0.110) with a t-value=2.566 (p-value<0.05) implying that
for every 1 unit increase in legal and regulatory environment, growth of youth owned
micro and small enterprises in Kenya is predicted to decrease by 0.110 units and
therefore H02 is rejected . Similar studies conducted by Nganda, Wanyonyi and Kitili ,
(2014), on the determinants of growth of small and medium enterprises in Kakamega
central sub county Kenya noted that, between law and regulations on growth of SMEs
do indicate that income taxes and collection of revenues from the government agents
hamper the running of the business, thus, slowing the growth of the SMEs (r = -0.018,
p<0.05).
Similar studies by Karambu (2017) on commercial banks lending strategies and growth
of micro and small enterprises in Kenya. The studies null hypothesis stated that there is no
significant moderating effect of legal and regulatory environment on the growth of MSEs in
Kenya. Study results indicated that the p value of the interacting term was statistically
significant (0.017); therefore legal and regulatory environment moderate MSEs growth in
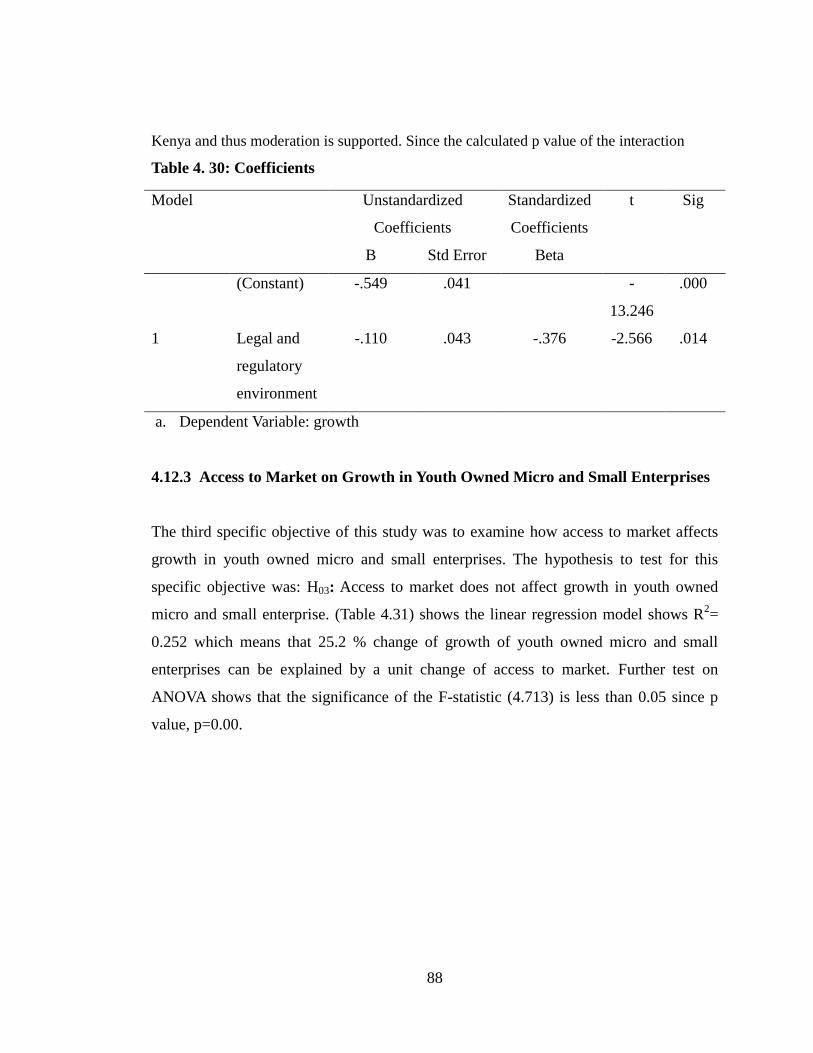
88
Kenya and thus moderation is supported. Since the calculated p value of the interaction
Table 4. 30: Coefficients
Model Unstandardized
Coefficients
Standardized
Coefficients
t Sig
B Std Error Beta
1
(Constant) -.549 .041 -
13.246
.000
Legal and
regulatory
environment
-.110 .043 -.376 -2.566 .014
a. Dependent Variable: growth
4.12.3 Access to Market on Growth in Youth Owned Micro and Small Enterprises
The third specific objective of this study was to examine how access to market affects
growth in youth owned micro and small enterprises. The hypothesis to test for this
specific objective was: H03: Access to market does not affect growth in youth owned
micro and small enterprise. (Table 4.31) shows the linear regression model shows R2=
0.252 which means that 25.2 % change of growth of youth owned micro and small
enterprises can be explained by a unit change of access to market. Further test on
ANOVA shows that the significance of the F-statistic (4.713) is less than 0.05 since p
value, p=0.00.
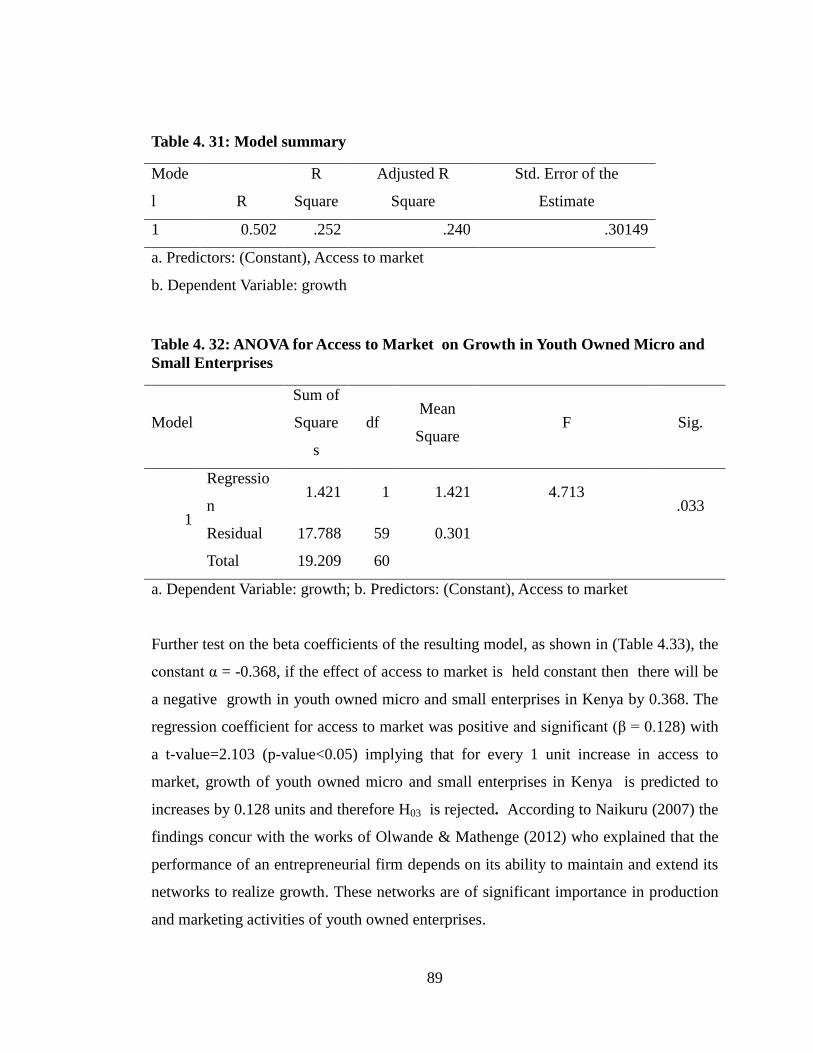
89
Table 4. 31: Model summary
Mode
l R
R
Square
Adjusted R
Square
Std. Error of the
Estimate
1 0.502 .252 .240 .30149
a. Predictors: (Constant), Access to market
b. Dependent Variable: growth
Table 4. 32: ANOVA for Access to Market on Growth in Youth Owned Micro and
Small Enterprises
Model
Sum of
Square
s
df Mean
Square F Sig.
1
Regressio
n 1.421 1 1.421 4.713
.033
Residual 17.788 59 0.301
Total 19.209 60
a. Dependent Variable: growth; b. Predictors: (Constant), Access to market
Further test on the beta coefficients of the resulting model, as shown in (Table 4.33), the
constant α = -0.368, if the effect of access to market is held constant then there will be
a negative growth in youth owned micro and small enterprises in Kenya by 0.368. The
regression coefficient for access to market was positive and significant (β = 0.128) with
a t-value=2.103 (p-value<0.05) implying that for every 1 unit increase in access to
market, growth of youth owned micro and small enterprises in Kenya is predicted to
increases by 0.128 units and therefore H03 is rejected. According to Naikuru (2007) the
findings concur with the works of Olwande & Mathenge (2012) who explained that the
performance of an entrepreneurial firm depends on its ability to maintain and extend its
networks to realize growth. These networks are of significant importance in production
and marketing activities of youth owned enterprises.
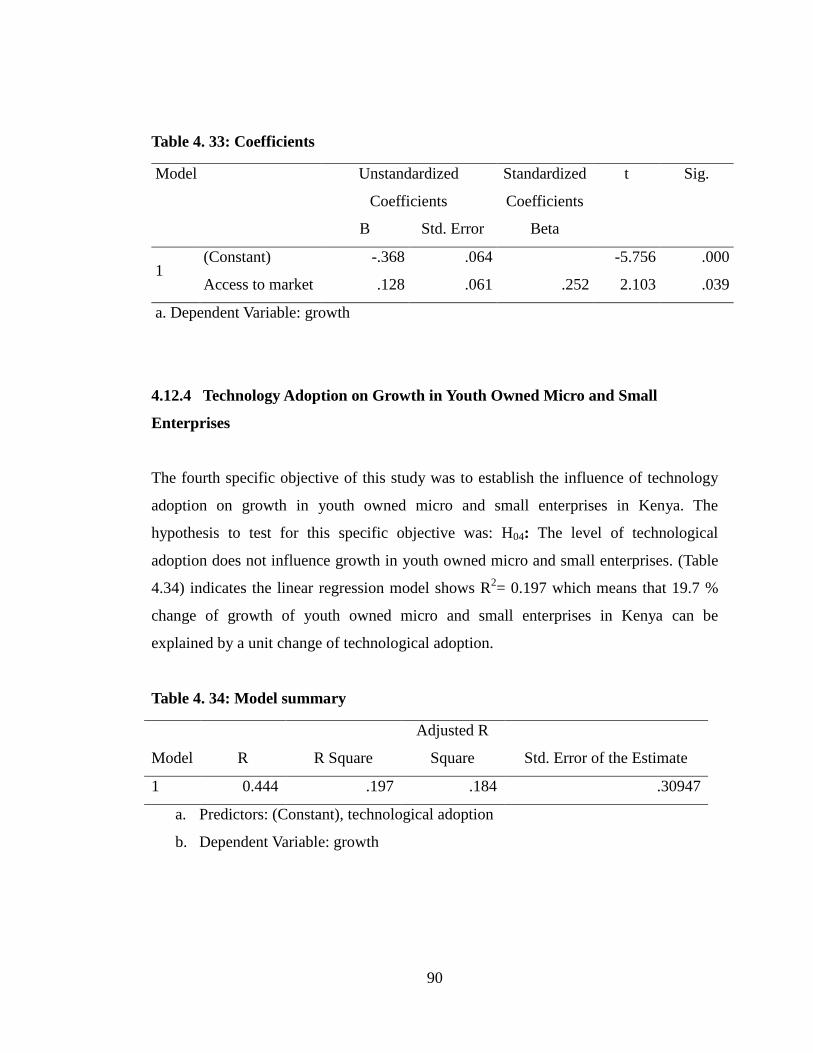
90
Table 4. 33: Coefficients
Model Unstandardized
Coefficients
Standardized
Coefficients
t Sig.
B Std. Error Beta
1 (Constant) -.368 .064 -5.756 .000
Access to market .128 .061 .252 2.103 .039
a. Dependent Variable: growth
4.12.4 Technology Adoption on Growth in Youth Owned Micro and Small
Enterprises
The fourth specific objective of this study was to establish the influence of technology
adoption on growth in youth owned micro and small enterprises in Kenya. The
hypothesis to test for this specific objective was: H04: The level of technological
adoption does not influence growth in youth owned micro and small enterprises. (Table
4.34) indicates the linear regression model shows R2= 0.197 which means that 19.7 %
change of growth of youth owned micro and small enterprises in Kenya can be
explained by a unit change of technological adoption.
Table 4. 34: Model summary
Model R R Square
Adjusted R
Square Std. Error of the Estimate
1 0.444 .197 .184 .30947
a. Predictors: (Constant), technological adoption
b. Dependent Variable: growth
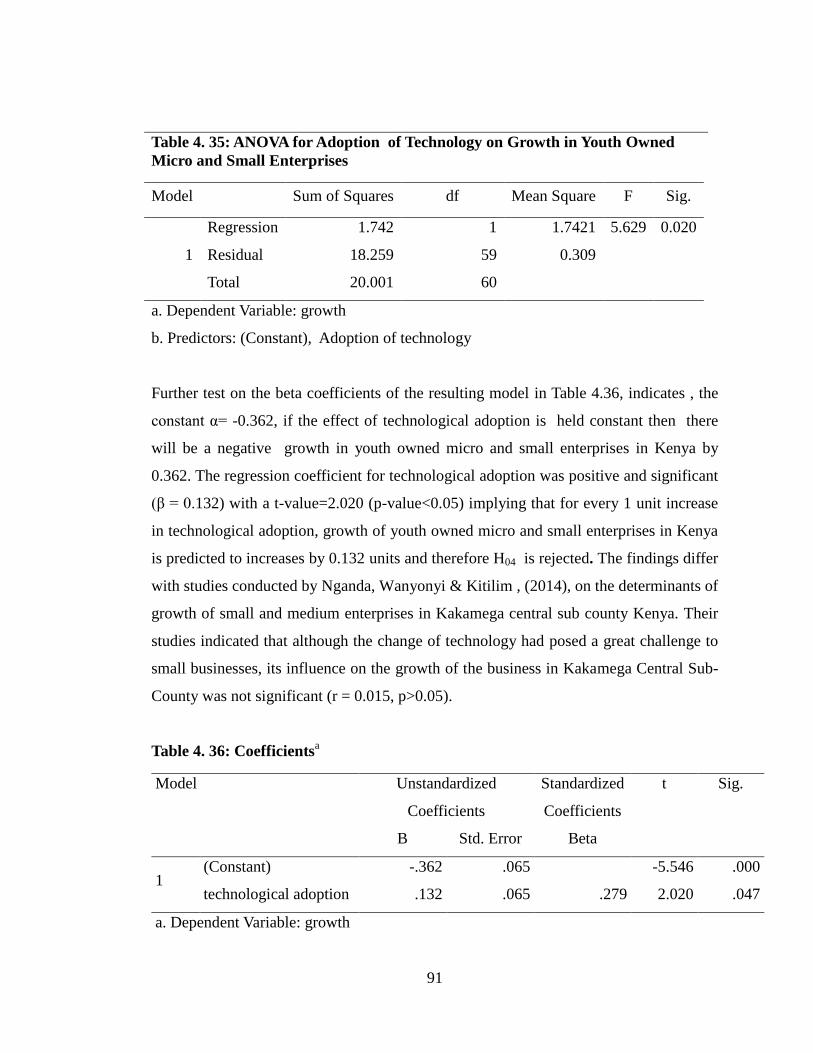
91
Table 4. 35: ANOVA for Adoption of Technology on Growth in Youth Owned
Micro and Small Enterprises
Model Sum of Squares df Mean Square F Sig.
1
Regression 1.742 1 1.7421 5.629 0.020
Residual 18.259 59 0.309
Total 20.001 60
a. Dependent Variable: growth
b. Predictors: (Constant), Adoption of technology
Further test on the beta coefficients of the resulting model in Table 4.36, indicates , the
constant α= -0.362, if the effect of technological adoption is held constant then there
will be a negative growth in youth owned micro and small enterprises in Kenya by
0.362. The regression coefficient for technological adoption was positive and significant
(β = 0.132) with a t-value=2.020 (p-value<0.05) implying that for every 1 unit increase
in technological adoption, growth of youth owned micro and small enterprises in Kenya
is predicted to increases by 0.132 units and therefore H04 is rejected. The findings differ
with studies conducted by Nganda, Wanyonyi & Kitilim , (2014), on the determinants of
growth of small and medium enterprises in Kakamega central sub county Kenya. Their
studies indicated that although the change of technology had posed a great challenge to
small businesses, its influence on the growth of the business in Kakamega Central Sub-
County was not significant (r = 0.015, p>0.05).
Table 4. 36: Coefficientsa
Model Unstandardized
Coefficients
Standardized
Coefficients
t Sig.
B Std. Error Beta
1 (Constant) -.362 .065 -5.546 .000
technological adoption .132 .065 .279 2.020 .047
a. Dependent Variable: growth
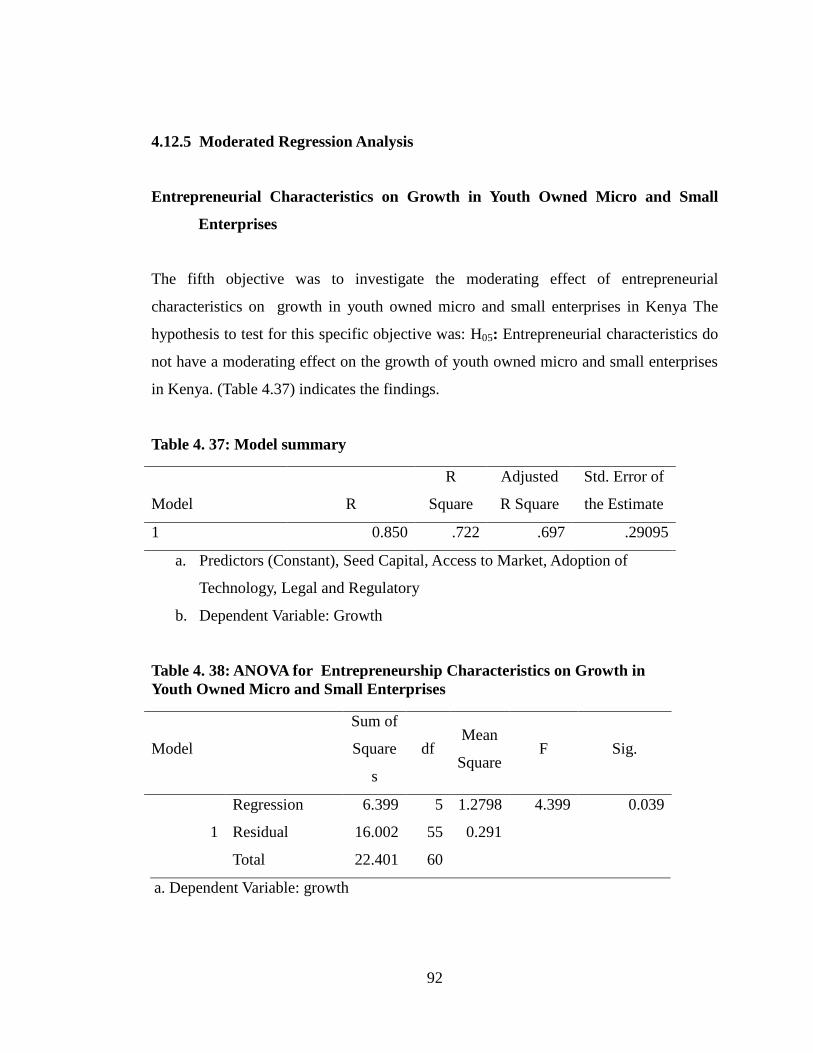
92
4.12.5 Moderated Regression Analysis
Entrepreneurial Characteristics on Growth in Youth Owned Micro and Small
Enterprises
The fifth objective was to investigate the moderating effect of entrepreneurial
characteristics on growth in youth owned micro and small enterprises in Kenya The
hypothesis to test for this specific objective was: H05: Entrepreneurial characteristics do
not have a moderating effect on the growth of youth owned micro and small enterprises
in Kenya. (Table 4.37) indicates the findings.
Table 4. 37: Model summary
Model R
R
Square
Adjusted
R Square
Std. Error of
the Estimate
1 0.850 .722 .697 .29095
a. Predictors (Constant), Seed Capital, Access to Market, Adoption of
Technology, Legal and Regulatory
b. Dependent Variable: Growth
Table 4. 38: ANOVA for Entrepreneurship Characteristics on Growth in
Youth Owned Micro and Small Enterprises
Model
Sum of
Square
s
df Mean
Square F Sig.
1
Regression 6.399 5 1.2798 4.399 0.039
Residual 16.002 55 0.291
Total 22.401 60
a. Dependent Variable: growth
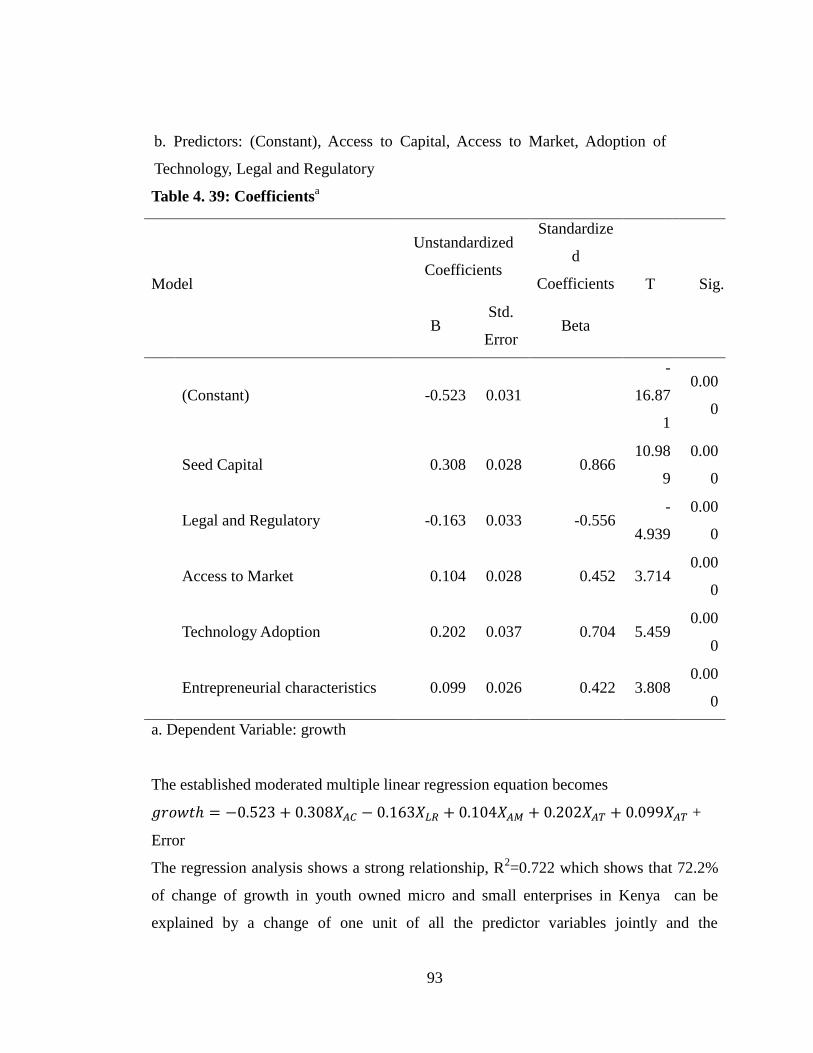
93
b. Predictors: (Constant), Access to Capital, Access to Market, Adoption of
Technology, Legal and Regulatory
Table 4. 39: Coefficientsa
Model
Unstandardized
Coefficients
Standardize
d
Coefficients T Sig.
B Std.
Error Beta
(Constant) -0.523 0.031
-
16.87
1
0.00
0
Seed Capital 0.308 0.028 0.866 10.98
9
0.00
0
Legal and Regulatory -0.163 0.033 -0.556 -
4.939
0.00
0
Access to Market 0.104 0.028 0.452 3.714 0.00
0
Technology Adoption 0.202 0.037 0.704 5.459 0.00
0
Entrepreneurial characteristics 0.099 0.026 0.422 3.808 0.00
0
a. Dependent Variable: growth
The established moderated multiple linear regression equation becomes
+
Error
The regression analysis shows a strong relationship, R2=0.722 which shows that 72.2%
of change of growth in youth owned micro and small enterprises in Kenya can be
explained by a change of one unit of all the predictor variables jointly and the
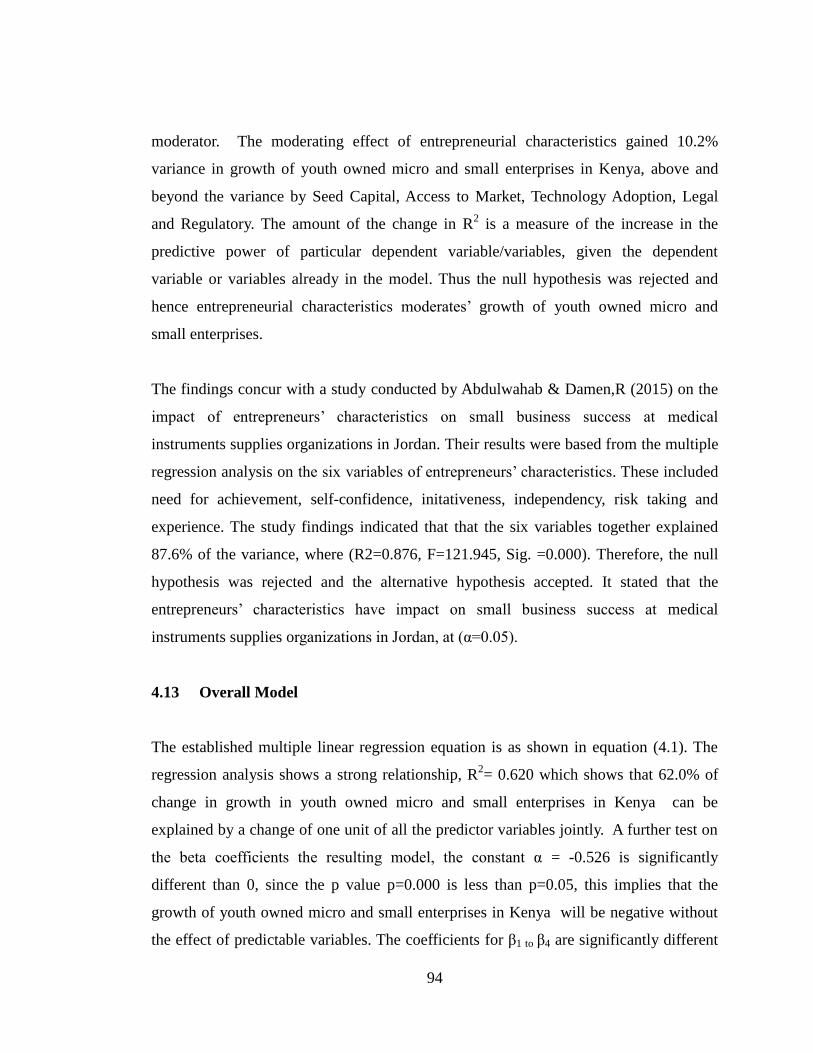
94
moderator. The moderating effect of entrepreneurial characteristics gained 10.2%
variance in growth of youth owned micro and small enterprises in Kenya, above and
beyond the variance by Seed Capital, Access to Market, Technology Adoption, Legal
and Regulatory. The amount of the change in R2 is a measure of the increase in the
predictive power of particular dependent variable/variables, given the dependent
variable or variables already in the model. Thus the null hypothesis was rejected and
hence entrepreneurial characteristics moderates’ growth of youth owned micro and
small enterprises.
The findings concur with a study conducted by Abdulwahab & Damen,R (2015) on the
impact of entrepreneurs’ characteristics on small business success at medical
instruments supplies organizations in Jordan. Their results were based from the multiple
regression analysis on the six variables of entrepreneurs’ characteristics. These included
need for achievement, self-confidence, initativeness, independency, risk taking and
experience. The study findings indicated that that the six variables together explained
87.6% of the variance, where (R2=0.876, F=121.945, Sig. =0.000). Therefore, the null
hypothesis was rejected and the alternative hypothesis accepted. It stated that the
entrepreneurs’ characteristics have impact on small business success at medical
instruments supplies organizations in Jordan, at (α=0.05).
4.13 Overall Model
The established multiple linear regression equation is as shown in equation (4.1). The
regression analysis shows a strong relationship, R2= 0.620 which shows that 62.0% of
change in growth in youth owned micro and small enterprises in Kenya can be
explained by a change of one unit of all the predictor variables jointly. A further test on
the beta coefficients the resulting model, the constant α = -0.526 is significantly
different than 0, since the p value p=0.000 is less than p=0.05, this implies that the
growth of youth owned micro and small enterprises in Kenya will be negative without
the effect of predictable variables. The coefficients for β1 to β4 are significantly different
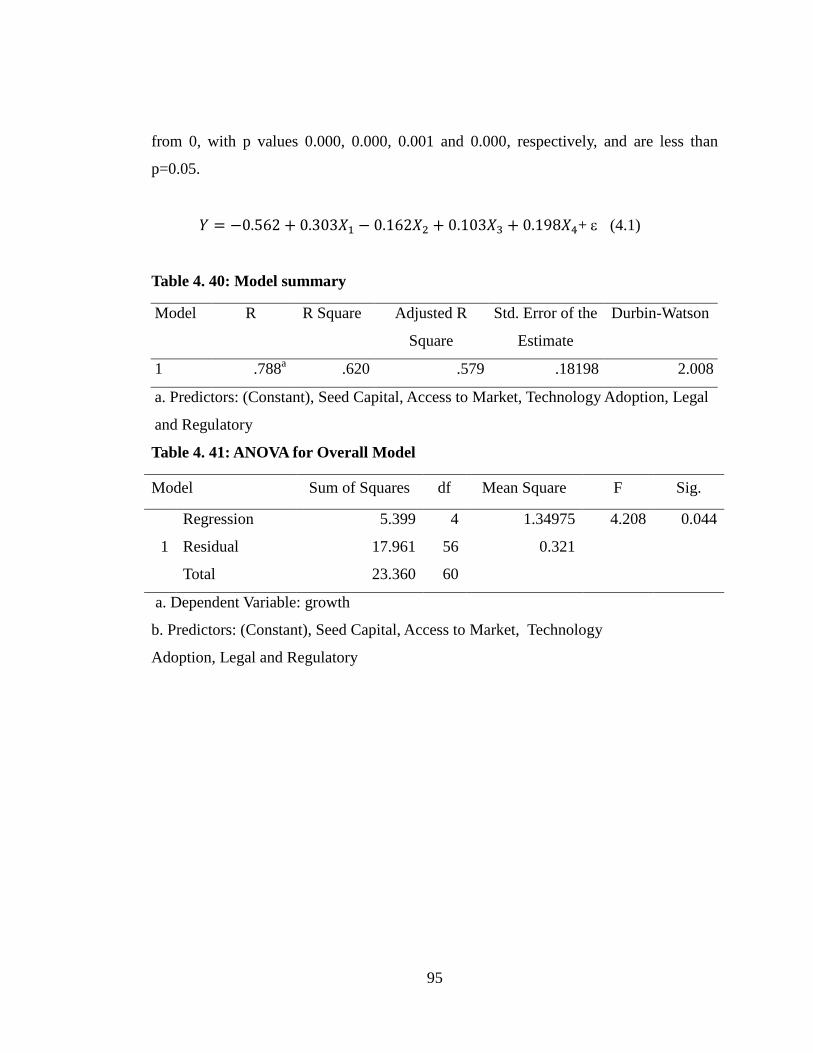
95
from 0, with p values 0.000, 0.000, 0.001 and 0.000, respectively, and are less than
p=0.05.
+ (4.1)
Table 4. 40: Model summary
Model R R Square Adjusted R
Square
Std. Error of the
Estimate
Durbin-Watson
1 .788a .620 .579 .18198 2.008
a. Predictors: (Constant), Seed Capital, Access to Market, Technology Adoption, Legal
and Regulatory
Table 4. 41: ANOVA for Overall Model
Model Sum of Squares df Mean Square F Sig.
1
Regression 5.399 4 1.34975 4.208 0.044
Residual 17.961 56 0.321
Total 23.360 60
a. Dependent Variable: growth
b. Predictors: (Constant), Seed Capital, Access to Market, Technology
Adoption, Legal and Regulatory
96
Table 4. 42: Overall Model
Model
Unstandardized
Coefficients
Standardize
d
Coefficients t Sig.
B Std. Error Beta
(Constant) -0.526 0.03 -17.732 .00
0
Seed Capital 0.303 0.028 0.784 10.623 .00
0
Legal and Regulatory -0.162 0.032 -0.554 -5.059 .00
0
Access to Market 0.103 0.027 0.445 3.769 .00
1
Technology Adoption 0.198 0.034 0.691 5.764 .00
0
a. Dependent Variable: growth
Similar studies conducted by Nganda, Wanyonyi & Kitili , (2014), on the determinants
of growth of small and medium enterprises in Kakamega central sub county Kenya
noted that, financial factors (r = 0.3462,) were found to have a greater significant
(p<0.05) influence than all the other three growth determinants. The second variable in
terms of the influence on the growth of SMEs was advancement in technology (r =
0.334), followed by law and regulation (r =0.2063) which was significant and lastly
market (r = 0.270) which was insignificant.
97
CHAPTER FIVE
SUMMARY, CONCLUSION AND RECOMMENDATIONS
5.1 Introduction
The study sought to examine the determinants of growth in youth owned micro and
small enterprises in Kenya. This chapter presents a brief summary, conclusion, and
recommendations of the study findings. The conclusion relates directly to the research
objectives / hypotheses and the recommendations were derived from the discussion of
the study findings and conclusion. The chapter also presents suggested studies that could
be carried out in future to extend knowledge in this particular area.
5.2 Summary of the Research Findings
The present study targeted youth owners of various micro and small enterprises in
Nairobi County, Kenya. A total of 127 youth owners of MSEs were sampled. The
summary of the study findings presented herein followed the research hypotheses
formulated in chapter one of the study. A pilot study was undertaken with 13 MSEs
youth owners to test the reliability and validity of the questionnaire. The stratification
was based on the type of business that the 13 youth owned MSEs were operating. This
comprised of manufacturing, trade, service, agri-business and information
technology/telecommunication.
5.2.1 Access to Capital
The first objective of the study was to examine how access to capital influences growth
in youth owned micro and small enterprises in Nairobi County. The study established
that majority of the respondents reported that the cost of accessing credit was very high.
The respondents also pointed out that interest rates paid on loans including interest rates
fluctuations was very high making access to capital unaffordable to many MSEs youth
owners. For the MSEs that were not able to meet the required standards by financial
98
institutions but merited for some financial support, they were not contented with the
amount lent to them. The respondents also indicated that the credit processing fee was
high but many of the respondents had at some extent tried to obtain credit from different
lending institutions in the country. Mean while a small percentage made no extent in
trying to access credit from lending institutions. MSEs were also able to approach other
available funding institutions to access financial support.
Majority of the respondents were contented with the availed financial support however
majority of the respondents reported that the procedure of accessing financial support
was a very bureaucratic and difficult procedure. The findings also noted that many of
the MSEs business assets could indeed secure capital according to the respondents
feedback. They indicated they had enough cash flow to repay the loan. However it was
noted that different financial institutions had different measures of accessing business
viabilities before availing credit. The study concludes that access to capital is an
essential ingredient that is essential for the growth of youth owned MSEs.
5.2.2 Legal and Regulatory
The second objective of the study was to establish how legal and regulatory
environment affects growth in youth owned micro and small enterprises in Nairobi
County. The study established that majority of the respondents were able to comply
with the legal and regulatory requirements in relation with the business requirement.
These could mean that the MSEs improved their competitiveness quite well. The
respondents indicated that they could meet license fee, and they also reported that the
procedure of obtaining business licenses was easy. Majority of the MSEs were
registered with all the legal documents and had public contract information but only a
few of the MSEs transacted business with the county and national government. The
findings noted the challenges MSEs face in acquiring tenders in the competitive
business environment. The study noted that multiple taxation from both the county and
national government was reported to have had raised the cost of MSE, business
99
operations. It was therefore noted and legal and regulatory entrepreneurial business
environment was an important factor that determines the growth of youth owned MSEs
in Kenya.
5.2.3 Access to Market
The third objective was to examine how access to market affects growth in youth owned
micro and small enterprises in Nairobi County. The study found out that a majority of
the MSEs had access to market information; many of the MSEs were also able to
subcontract businesses and a slight majority could network with other similar
businesses. The market space was also sufficient among the majority of the MSEs. The
respondents also indicated that their businesses could access telephone communication
and internet. Majority of the respondents explained that they had more than 100
competitors in their business area of operation. Competion and failure to network was
noted as the immediate challenge affecting youth owned MSEs.
5.2.4 Technology Adoption
The fourth objective was to establish the influence of technology adoption on growth in
youth owned micro and small enterprises in Nairobi County. The findings revealed that
the majority of the MSEs owners reported that they indeed had the necessary needed
skills to handle new technology. Majority of the respondents indicated their ability to
promote their products and services using emerging new technology. However, only a
few of the MSEs were able to acquire new technology once it was introduced in the
market. Majority of the MSEs indicated that change in technology had poised a great
challenge in their businesses. It was noted that change in technology brings in a
challenge to MSEs since it carries along with it cost implications that many MSEs
cannot not afford. Technology indeed was a contributing factor relating to the growth of
youth owned MSEs in Kenya.
100
5.2.5 Entrepreneurial Characteristics
The fifth objective of the study was to establish the influence of entrepreneurial
characteristics on growth in youth owned micro and small enterprises in Nairobi County.
The findings reveled that many of the MSEs owners reported to be in business for a
period of between 5 to 8 years. Further analysis indicated that majority of the MSEs
owners were university graduates. The study also noted that many of the MSEs owners
cared about potential losses when facing decision with uncertain. They further
maintained their original products and services. Youth owners of MSEs should possess
the relevant entrepreneur’s characteristics since it determines the growth of their
businesses.
5.3 Conclusions
Seed Capital
The objective of this study was to explore the determinants of growth in youth owned
MSEs in Kenya. The study concluded that MSEs face challenges in trying to access
seed capital due to high cost of accessing capital, high interest rates. The study found
out that fluctuating interest rates and high credit processing fee were the major issues
that MSEs faced. This conclusion was arrived by observing that many youth owned
MSEs have had moderate extent in trying to access capital from lending institutions.
Further the study concluded that the bureaucratic and difficult procedures encountered
by MSEs in the process of trying to access capital has resulted to many of them not
seeking for financial assistance from lending institutions to expand their businesses.
Legal and Regulatory
The study concluded that many MSES complied with the legal and regulatory
environment. The conclusion was arrived at by observing that many MSEs could meet
101
their business license fee as a result of having an easy and efficient procedure in
obtaining business license. The study concluded that high taxation was a major reason
as to why some MSEs failed to comply with the requirement of the tax requirements.
The conclusion was arrived at by observing that some MSEs did not fully comply with
the tax regime.
Access to Market
Based on the study finding the study concluded that entrepreneurial marketing and
market information was not a major challenge since most of the MSEs were able to
address the market barriers challenges. This conclusion was arrived at by observing that
most MSEs had access to market information through their mobile phones and internet.
The study concluded that competion was a challenge facing majority of the MSEs, this
conclusion was arrived at by observing the high number of competitors noted by the
MSEs in the study.
Technology Adoption
The study concluded that change in technology for youth owned MSEs was a major
challenge. This conclusion was arrived at after observing that MSEs including those that
were able to embrace technology previously could not embrace new technology
immediately as a result of cost implications.
Based on the study findings the study concluded that MSEs lacked innovation in their
product/service development. This conclusion was arrived at by observing that many
MSEs maintained their original products which indicate the slow pace of embracing
innovation in their businesses. Many of the youth owned MSEs were cautions on taking
business risks due to fear of incurring losses.

102
5.4 Recommendations
Arising from the study conclusion, research recommends as follows.
5.4.1 Access to Seed Capital
Financial and other lending institutions need to take note of the expensive and difficult
lending conditions facing youth owned MSEs in the country. Then they should address
the critical issue of lending rates i.e. how to lower the cost of credit through lowering
the interest rates. Credit lending procedure should also be simple and clear. It is
therefore important for the government to come up with a policy that redesigns the
available credit programmes for MSEs i.e. the YEDF in order to address the high cost
access to capital that is affecting youth owned MSEs. That will make access to credit
affordable to MSEs.
The government should also formulate effective policies to ensure that the interest rates
suggested by the Central Bank of Kenya are also adopted by both commercial banks and
micro financial institutions so as to encourage MSEs owners to access micro-credit
facilities. There is a need to have clear loaning policies that support MSEs to avoid
misunderstanding on expectations on repayment period and the interest rate on the
borrowed loan. MSEs also need to undergo business management training for them to
adopt critical knowledge relating to accounts, bookkeeping procedures, inventory
system, and business plan development. The proposed training areas are important since
they are the parameters that lending institutions use to evaluate MSEs viability to access
credit.
5.4.2 Legal and Regulatory
The government should review its taxation system that is both the National and County
governments to ease the cost of business operations for MSEs. Considerations should be
103
given to youth owned MSEs given their small scale financial strength.
5.4.3 Access to Market
To increase market access for youth owned MSEs the government should increase its
consumption of products from youth run enterprises from the current 30% to 50% across
all its ministries and parastatals. The government should also improve its tendering
system by making it easier for youth enterprises to win government tenders. Youth
owned MSEs should be encouraged to venture in different sectors to reduce the
competition amongst them. Youth enterprise could be availed tax holiday during the
start-up so that they can compete effectively with others.
5.4.4 Adoption of Technology
MSEs should be supported to be able to adopt better production technology that will
enable them increase efficiency, improve quality and diversity of products. The
government should also encourage and support MSEs manufacturing enterprises to
acquire the new technology. It is also necessary to train MSEs on how to identify and
adopt appropriate technology based on the needs of specific types of products, services
or consumer needs. The government also needs to reduce importation of technologies
and increase the usage of local technologies from the existing MSE.
5.5 Recommendations for Future Research
An assessment of the reasons for ineffectiveness/effectiveness of sponsored seed capital
programmes for youth run enterprises, i.e., YEDF towards business growth and
development should be conducted. This is after it emerged from the present study that
youth owned MSEs continue to face credit challenges even with the availed government
sponsored financial support funds. The study looked at the determinants of growth of
youth owned micro and small enterprises in Kenya. The study recommends a similar

104
study on youth owned SMEs to look out for possible similarities. The literature
reviewed indicated that SMEs had no significant advantage when seeking access to seed
capital, legal and regulatory business environment, entrepreneurial marketing and
adoption of technology.
105
REFERENCES
Abor, J., & Quarley, P. (2010). Issue in SMEs development in Ghana and South Africa.
International Research. Journal of Finance and Economics Issue, 39(2), 218 -
228.
Abdulwahab, M., & Damen, R.(2015). The Impact of Entrepreneurs’ Characteristics on
Small Business Success at Medical Instruments Supplies Organizations in
Jordan. International Journal of Business and Social Science Vol. 6, No. 8, 200-
220.
Ackah, J., & Vulvor, S. (2011). The challenges faced by Small and Medium Enterprises
(SMEs) in obtaining Credit in Ghana. Blekinge, Sweden: Blekinge Institute of
Management.
Adil, D. (2007). Challenges and Constraints of Micro and Small Scale Enterprises in
Addis Ababa: The case of 2 Sub-cities’ Industrial Zones. MA thesis in Regional
and Local Development Studies, RLDS, Addis Ababa University.
African Centre for Entrepreneurship Proficiency Development. (2011). Should MSE
growth be tied to development policy? Nairobi: ACEPD.
African Centre for Entrepreneurship Proficiency Development (2011). Should MSE
Growth be tied to Development Policy? Nairobi: ACEPD.
Ahiawodzi, K., & Adade, T. (2012). Access to Credit and Growth of Small and Medium
Scale Enterprises in the Ho Municipality of Ghana. British Journal of
Economics, Finance and Management Science, Vol. 6 (2), 130-139.
106
Alex, O., & Bruce, S. (2016.) The Kenya Youth Survey Report. The Aga Khan
University.
Alvarez, S., & Busenitz, L. (2001). The entrepreneurship of resource based theory.
Journal of Management, Vol (27), 755-775.
Aldri, R., & Gustavo., C. 2003. Determinants of Technical Efficiency in Small Firms.
Small Business Economics, 20: 233–244.
Aldrich, H.E. (1999). Organizations Evolving. Sage Publications.
Aleke, D. C. (2011). Improving access to physical infrastructure for the development of
the micro and small enterprise sector. Nairobi, Kenya.
Aldrich, H. E. (1999).Organizations Evolving. Sage Publications.
Aggarwal, Y. (2008), Science of Educational Research. Nirmal Book Agency.
Armington, C., & Z. J. Acs. (2002). The Determinants of Regional Variation in New
Firm Formation Regional Studies, Vol. 36, Issue 1, Routledge.
Ary, D., Jacobs, L. C., Razavieh, A., & Sorensen, CK. (2010). Introduction to Research
in Education (8th
ed.) California: Thomson Wadsworth.
Atsede, (2008).Factors influencing Small and Medium Enterprises (SMEs): An
Exploratory Study of Owner/Manager and Firm Characteristics. Banks and
Bank Systems, Vol.3 issue.
Atherton, A . (2012). Cases of Startup Financing: An Analysis of New Venture
Capitalization Structures and Patterns. International Journal of Entrepreneurial
Behaviour & Research, 18(1), 28-47.
107
Bouazza, A., Ardjouman.,D & Abada., O. (2015) Establishing the Factors Affecting the
Growth of Small and Medium-sized Enterprises in Algeria. American International
Journal of Social Science. Vol 4, No 2, 103-105.
Baskerville, R. F. (2003). Hofstede Never Studied Culture. Accounting, Organizations
and Society.
Beck, T., Demirguc K, & Martinez., M. (2007). Reaching out: Access to and use of
Banking Services Across Countries. Journal of Financial Economics, Elsevier.
Vol 5,234-266.
Begley, T., M. & Boyd, D.P. (1987). Psychological characteristics associated with
performance In entrepreneurial firms and smaller businesses. Journal of Business
Venturing, Vol 2, 79-93.
Blanchflower, D. G., Oswald, A. & Stutzer, A. (2001). Latent Entrepreneurship across
Nations. European Economic Review.
Blanchflower, D. G. & Oswald, A. 1998. What Makes an Entrepreneur? Journal of
Labor Economics 26-60, 680-91.
Bowen., M., Morara., M, & Mureithi, S. (2009). Management of Business Challenges
among Small and Micro Enterprises in Nairobi Kenya. KCA Journal of Business
Management ,Vol.2, Issue 1.
Brautigam, D. (1997). Substituting for the State: Institutions and Industrial Development
in Eastern Nigeria. World Development, Vol 7, 63-83.
Bryman, A. (2012). Social Research Methods, (2nd
ed). New Yoke: Oxford University
Press.
108
Brockhaus, S.R., R.H. (1982). The psychology of the entrepreneur in: Encyclopaedia of
Entrepreneurship. Englewood Cliffs, New Jersey.
Bouazza, A,. Ardjouman.,D. & Abada,O. (2015) Establishing the Factors Affecting the
Growth of Small and Medium-sized Enterprises in Algeria. American
International Journal of Social Science Vol. 4, 12-18.
Bureau of Statistics. Republic of Kenya (2010) .The Prevention of organized crimes
ACT. Nairobi: Government Printer.
CGAP, (2009). Measuring Access to Financial Services around the World. CGAP.
Clausen, T. H. (2006). Who identifies and Exploits entrepreneurial opportunities,
Retrieved from www.ccsr.ac.uk.
Clemence, R. (2009). Essays on Entrepreneurship, Innovations, Business Cycles and the
Evolution of the Capitalism. New Jersey: Transaction Publishers.
Clanchy, Michael T. (1993) From Memory to Written Record: England. 2nd. Ed.,
Oxford: Blackwell.
Clough, L. (2011). Marketing Challenges and Strategies for Micro and Small Energy
Enterprises in East Africa, GVEP.
Cook, P., & Nixson, F. (2011). Finance and Small and Medium-Sized Enterprise
Development. In Finance and Development: Surveys of Theory, Evidence and
Policy, Green CJ, Kirkpatrick CH, Murinde V (eds). Edward Elgar: Cheltenham.
Cooper, D,. R. & Schindler, P.S. (2011). Business Research Methods, 11th, edition.
Coon, D. (2004). Introduction to Psychology (9th Ed) Minneapolis: West Publishing
Company.
109
Creswell, J. W. (2003). Research design: Qualitative, Quantitative, and Mixed Methods.
Cull, R,. Davis, L.E., Lamoreaux. N.R., Rosenthal, J. (2004). Historical Financing of
Small and Medium Size Enterprises. World Bank Policy Research Working Paper
No. 2334.
Eser, G, & Ozedemirci,. A. (2016). Personality Characteristics and Business Philosophy:
An Entrepreneurship Experiment. European Journal of Business and Social
Sciences, Vol.4, No. 11, 71-72.
Dabadi, H. (2003). Technology Transfer: Capacity-Building and the Private Sector of
Nepal. United Nations, New York.
Davidson, P., & Honing, B. (2003). The Role of Social and Human Capital Among
Nascent Entrepreneurs. Journal of Business Venturing, 12(4), 20-121.
Davidsson, P., & Wiklund. J. (1997). Values, Beliefs and Regional Variations in New
Firm Formation Rates. Journal of Economic Psychology, Vol. 18, No. 2, 8-12.
Dereje, L. (2008). Micro and Small Scale Enterprises in the Construction Sector in
Addis Ababa: The case of Gullele, Kirkos and Yeka sub-cities. MA thesis in
Regional and Local Development Studies. RLDS, Addis Ababa University.
Diamantopoulous, A., & (2000). Modelling with LISREL: A Guide for Uninitiated. A
Journal of Marketing Management, 10,105-36.
Dhungana, B. P. (2003) Foreign Direct Investment and Technological Capacity-
Building in East Developed Countries: A Case for Nepal: United Nations, New
York.
110
Dooley, K.E. (1999). Towards a Holistic Model for the Diffusion of Educational
Technologies: An integrative review of educational innovation studies.
Educational Technology & Society, 35-45.
Dutta, B. (2009). Entrepreneurship Management Text and Cases. 1st Edt. New Delhi.
Excel Books.
Fornell, C., & Larcker. D. (1981). Structural Equation Models with Unobservable
Variables and Measurement Error: Algebra and Statistics. Journal of Marketing
Research, 328-330.
Frempong, G. (2007). Towards an African e-Index: Small & Medium Business Survey
Wireless Opportunities and Solutions: A regulatory perspective LIRNE Expert
Meeting and International Workshop.
Franklin. (2017). Kenya’s Economy Groans under Weight of its Jobless Youth.
Gangata, K., & Matavire. E. (2013). Challenges Facing SMEs in Accessing Finance
From Financial Institutions: The Case of Bulawayo, Zimbabwe.
Gartner, W.B., Shaver, K.G. Carter, N. M., & Reynolds, P. D. (2004). Handbook of
Entrepreneurial Dynamics. Thousand Oaks, CA: Sage Publications.
Gatt, L. (2012). SMEs in Africa. Growth despite Constraints. Consultancy Africa
Intelligence. Retrieved from http://www.consultancyafrica.com.
Gichiki, J., Njeru., A. & Tirimba. O. (2014). Challenges Facing Micro and Small
Enterprises in Accessing Credit Facilities in Kangemi Harambee Market in
Nairobi City County, Kenya. International Journal of Scientific and Research
Publications, Vol 4, 2-9.
111
Gichira, R., Amondi R., Njoroge, J & Kabugua. M. (2002) E-Trade bridge programme
for Kenya. A draft for discussion, International Trade Centre.
Gov, UK. (2013).Making it easier to set-up and grow a business policies. Retrieved
from http://www.gov.uk/government.
Grosh, B., & Somolekae G. (1996). Mighty Oaks from Little Acorns: Can
Microenterprise Serve as the Seedbed of Industrialization?” World Development.
Vol. 24, No. 12, 1879-1880.
Harper, M. (1987). The Development of a Cost Effective Extension Service for Small
Business. University of Nairobi Kenya. A Kenyan Expert, University of Nairobi
Kenya, PLO Thesis.
Hanna, N. K. (2010). Enabling enterprise transformation. Business and grassroots
innovation for the knowledge economy. New York: Springer.
International Labour Organization. (2008). A Fair Globalization: Creating
Opportunities for All. ILO.
Jalilian, H,. & Kirkpatrick, C. (2010). Financial Development and Poverty Reduction in
Developing Countries. Working Paper No. 30, IDPM, Manchester University.
Jolly, A. (2011). The innovation handbook (2nd ed). London: Kagan Page.
Karambu, K. (2017). Commercial Banks Lending Strategies and Growth of Micro and
Small Enterprises in Kenya. (Unpublished PhD Thesis). Jomo Kenyatta U
University of Agriculture and Technology. Nairobi.
Kaplan, D. (2000). Innovation, Technological Capability and Exporting an Empirical
Analysis of Small Manufacturing firms in the South African Electronics Industry,
Pretoria. Nesika Enterprise Promotion Agency.
112
Kanis, H., Pablo A. &Virginia K. (2004). Desarrollo Emprendedor América Latina
Experiencia Internacional. Inter-American Development Bank.
Kaushalesh, L,. & Peedoly, A. S. (2012). Small Islands, New technologies and
Globalization: A case of ICT adoption by SMEs in Mauritius. United Nations
University, UNU-MERIT Working Paper Series, Netherlands.
Kenya Institute for Public Policy Research and Analysis. (2006). Developing a
marketing framework for Micro and Small Enterprises in Kenya. Nairobi:
KIPPRA.
Kerlinger, F. (1986). Foundations of behavior research (3rd ed.). New York:
Holt,Rinehart, and Winston.
Kithaye, P. (2012). Effect of Technology Adoption on Performance of Youth Led Micro
and Small Enterprises. (Published PhD Thesis). Jomo Kenyatta University of
Agriculture and Technology, Nairobi.
Kihimbo, B. W. (2012). Collateral Requirements for Financing of Small and Medium
Enterprises (SMEs) in Kakamega Municipality. Kenya. International Journal of
Current Research, Vol. 4 (06), 021-026.
Kimando, L., & Njogu, G. (2012). Factors Affecting the Success of Youth Enterprise
Development Funded Projects in Kenya; A Survey of Kigumo District Muranga
County. International Journal of Business and Commerce, Vol. 1 (10), 62-63.
Kiveu, M. & Ofafa,G. (2013). Enhancing Market Access in Kenyan SMEs using ICT.
Global Business and Economics Research Journal ISSN Vol. 2 (9). 2302-4593.
Kunateh, M. A. (2009).Demand for Collateral Security by Financial Institutions stifles
growth of SMEs.
113
Kothari, CR. (2008). Research Methodology: Methods and Techniques (2nd
Edition).
New Delhi: New Age International Publishers.
Kuzilwa. J. (2010). The role of credit from Small Business Success: A Study of the
National Entrepreneurship development fund in Tanzania. Journal of
Entrepreneurship, 14-131.
Kotler, P. (1999). Marketing Management, 10th Ed., Glencoe: IL Free Press.
Kyendo, M. (2010). Small Business Loans in Kenya. Reteaved from
www.investmentnewskenya.com
Kvale, S. (2007).Doing interviews. Thousand Oaks. CA: Sage.
Lall ,S. (1999). The Technological Response to Import Liberalization in Subsaharan
Africa,London, Macmillan.
Lall, S. (1992). Technological Capacities and Industrialization. World Development.
Lee, J. (2001). Education for technology readiness: Prospects for developing countries.
Journal of Human Development, 2(1), 115–151.
Liedholm, C. (2001). Small firm dynamics: Evidence from Africa and Latin America.
The International Bank of Reconstruction and Development, Washington D.C.,
USA: The World Bank.
Longenecker, J. G., Petty, C. W., Moore, J. W. and Palich, L. E. (2006). Small Business
Management, An entrepreneurial emphasis. London: Thomson South Western.
Longenecker, J,. G, Petty, C. W, Moore, J. W. & Palich, L. E. (2006). Small Business
Management, An Entrepreneurial Emphasis. London: Thomson South Western.
114
Mairura, K. (2017). Determinants of Modern Automobile Technology Adoption among
Mechanics in Micro and Small Enterprises in Kenya. JKUAT: PhD Thesis.
Makena, P., Kubaison,. S. & Njati, C. (2014). Challenges Facing Women Entrepreneurs
in Accessing Business Finance in Kenya: Case of Ruiru Township, Kiambu
County.
Matambalya, F. and Wolf, S. (2002). The Role of ICT for the performance of SMEs in
East Africa. ZEF Discussion Papers on Development Policy 42, Bonn.
Mateev, M,. & Anastasov, Y. (2010).Determinants of small and medium sized fast
growing Enterprises in Central and Eastern Europe: Panel Analysis Data.
Financial Theory and Practice 34(3) 269-295.
Mao, H. (2009). Review of Growth Enterprise Theories. International Journal of
Business and Management. Vol. 4, No .8
McCormick,. D & Pedersen,. P. O. (1996). Small Enterprise Flexibility and Networking
in Africa Context. Nairobi: Longhorn Kenya Ltd.
Mitchell,. R.K., Smith, J.B., Morse, E.A., Seawright, K.W., Peredo, A., & McKenzie, B.
(2002). Are Entrepreneurial Cognitions Universal? Assessing Entrepreneurial
Cognitions across Cultures” Entrepreneurship, Theory and Practice.
Moyi, E., & Njiraini,. P. (2005). Towards technology models for MSES in Kenya:
Common principles and best practices. Kippra Discussion Paper No. 51.
Moore, M. J., Boulding, W., & Goodstein,. R. C. (2008). Pioneering and Market Share:
Is entry time endogenous and does it matter? Journal of Marketing Research, 28,
97−104.
115
Morse,. E.A. Fowler, S.W. Lawrence,. T.B. (2007). The Impact of virtual Embedness on
New Venture Survival: Overcoming the Liabilities of Newness.
Entrepreneurship Theory & Practice, 139-159.
Mohar,. Y .M.S, Singh,. J & Kishore,. K. (2007). Relationship Between Psychological
Characteristics and Entrepreneurial Inclination: A Case Study of Students
at University Tun Abdul Razak. Journal of Asia Entrepreneurship and
Sustainability, 8. ProQuest Information and Learning Publishers
Munene, C. (2013). Factors Affecting Financial Performance of Youth Owned
Enterprises Kenya: A case of Youth Owned Enterprises in Kisii Town.
Interdisciplinary Journal of Contemporary Research in Business. Vol 5 (6), 545-
546.
Muthee,. J & Ngugi,. K. (2014). Influence of Entrepreneurial Marketing on the Growth
of SMES in Kiambu Town-CBD, Kenya. European Journal of Business
Management. Vol 1(11),2-3.
Mueller, S. & S. Goić, (2002). Entrepreneurial Potential in Transition Economies: A
View from Tomorrow’s Leaders. Journal of Developmental Entrepreneurship,
Vol. 7, No.4,399-414.
Mugenda, A.G. (2008). Social Science Research. Nairobi: Acts Press.
Mugenda, & Mugenda, (.2003). Research Methods; Quantitative and Qualitative
Approaches. Nairobi: Acts Press.
Mugenda, O.M. & Mugenda, A.G. (2012). Research Methods Dictionary. Nairobi:
ARTS Press.
116
Mugenda, A.G. (2008). Social Science Research. Nairobi: Acts Press.
Muthoni,.P & Omato,. P & Kithinji,. A. (2013). Analysis of Factors Influencing Transfer
of Technology among Micro and Small Enterprises in Kenya. International
Journal of Business and Social Science Vol. 4 No. 17.
Mwangi,. J.M,. & Bwisa H (2013). Challenges facing entrepreneurs in accessing credit:
A case of youth entrepreneurs in Makuyu, Kenya. Prim.
Naikuru, S. (2017). Determinants of Performance of Youth Led Micro and Small
Agribusinesses In Kenya. JKUAT: PhD Thesis.
Netemeyer, R., Boles, J., & McMurriam R. (1996). Development and Validation of
Work Family Conflict Scales. Journal of Applied Psychology, 81(4), 400-10.
Nganda, J. Wanyonyi, K. Kitili E., (2014). Determinants of growth of small and
medium enterprises in Kakamega central sub-county, Kenya. Journal of Business
Administration and Management Sciences Research Vol. 3(3) 022-031.
Ngugi,K.J. (2013). Influence of Intellectual Capital on Growth of Small and Medium
Enterprises in Kenya. Jomo Kenyatta University of Agriculture and Technology:
Published PhD Thesis.
Ngugi, K. .J., Mcorege, O.M., & Muiru, M. J. (2013). The Influence of Innovativeness
on the Growth of SMEs in Kenya. International Journal of Business and Social
Research (IJBSR), Volume -3, No.-1.
Njuguna, H.K. (2015). Factors Affecting Participation of Micro and Small Enterprises
in Public Procurement in Kenya. Jomo Kenyatta University of Agriculture and
Technology: Published PhD Thesis.
117
Nkansah, K. (2011). Entrepreneurship Theories and Empirical Research. European
Journal of Business Management, 3 (6), 5-6.
North, D.C. (1990). Institutions, Institutional Change, and Economic Performance. New
York: Norton.
Ntakobajira, N. (2013). Factors affecting the performance of small and micro
enterprises (SMEs) traders at city park hawkers market in Nairobi County,
Kenya. Masters of Arts Degree in Project Planning and Management of the
University of Nairobi.
Nteere, K. (2012). Entrepreneurship a Global Perspective. Nairobi: Richard Press Ltd.
Oduol, S. (2013).Effect of Youth Enterprise Development Fund on youth enterprises in
Kenya.International Journal of Advances in Management and Economics. Vol. 2
Issue 1, 112-116.
OECD, (2012). Financing SMEs and Entrepreneurs: An OECD Scoreboard, OECD
Publishing. http://dx.doi.org/10.1787/9789264166769- en.
Olawale,. F. & Garwe,. D. (2010).Obstacles to the growth of new SMEs in South Africa:
A principal analysis approach. African Journal of Business Management vol.4(s),
729-738.
Olwande, J. & Mathenge, M. (2012) Market Participation among Poor Rural
Households in Kenya. The International Association of Agricultural Economists
(IAAE) Triennial Conference.
Oliveira,. T & Martins,. F. (2011). Literature Review of Information Technology
Adoption Models at Firm Level. The Electronic Journal Information Systems
Evaluation Volume 14.110- 121.
118
Onsongo,. S. K..& Muturi, W. (2015). Factors Influencing the Growth of Hair Salon
Enterprises In Kenya: A Survey of Hair Salon Enterprises in Kisii Town. IOSR
Journal of Business and Management, 17 (3):1-15.
Oni,. & Daniya. (2012). Development of Small and Medium Scale Enterprises: The
Role of Government and other Financial Institutions. Arabian Journal of
Business and Management Review, 16-29.
Organization for Economic Cooperation and Development (2010). Information
Technology Outlook 2000: ICTs, E-Commerce and the Information Economy.
Paris: OECD.
Orodho, J.A. (2008) Techniques of Writing Research proposals and Reports in
Education and Social Sciences. Nairobi: Kanezja HP Enterprises.
Osunde, C. (2014). Entrepreneurs and Entrepreneurship in Developing Countries: The
Nigerian Experience. The SIJ Transactions on Industrial, Financial & Business
Management, 26-32.
Renny, M. (2011). Micro and Small Enterprise Sector and Existing Support System with
emphasis on High-Tech oriented Entrepreneurship in Kenya. Journal of
Language, Technology & Entrepreneurship in Africa Vol. 3 No.1
Republic of Kenya. (2013). Kenya Vision 2030 second medium term plan 2013-2017:
Government Press.
Republic of Kenya. (2010) .The Prevention of Organized Crimes ACT, 2010. Nairobi:
Government Printer.
Republic of Kenya .(2009). Economic Survey Report. Nairobi: Government Printers.

119
Republic of Kenya (2007). Kenya Vision 2030: A long-term national planning strategy.
Nairobi: The Government Printer.
Republic of Kenya. (2005). Sessional paper no. 2 on Development of Micro and Small
Enterprises. Nairobi: Government Press.
Republic of Kenya. (2005). Sessional Paper No. 2 of 2005 on Development of Micro
and Small Enterprises for Wealth and Employment Creation for poverty
reduction. Nairobi: Government Printer.
Republic of Kenya. (2003). Sessional paper no. 2 on Development of Micro and Small
Enterprises. Nairobi: Government Press.
Republic of Kenya. (1992). Sessional paper no. 2 on small enterprise and jua kali
development in Ken Nairobi: Government Press.
Republic of Kenya. (2010) .The Prevention of organized crimes ACT, 2010. Nairobi:
Government Printer.
Republic of Kenya. (2006). Kenya National youth policy. Nairobi: Government Printer.
Republic of Kenya .(1997). National Development plan (1997-2001) Government Press.
Republic of Kenya, Sessional Paper No. 2 of 1996 “Industrial Transformation to the
year 2020.
Republic of Kenya. (2014). Economic Survey for 2013/14. Nairobi: Kenya National.
Rogers, E.M. (1995). Diffusion of innovations, Fourth Edition ed., New York, Free
Press.
120
Rogers, E.M. (2003). Diffusion of innovations (5th ed.). New York: Free Press.
Robson, P. J. A. &Bennet, R. J. (2001). SME Growth: The relationship with business
advice and external collaboration. Small Business Economics, 15: 193-208 Sept.
5 2001.
Roy, M. & Wheeler, D. (2006).A Survey of Micro-Enterprise in Urban West Africa:
Drivers Shaping the Sector. Development in Practice. (16):452-464.
Saunders, M., Lewis, P. and Thornhill, A. (2009). Research Methods for Business
Students (5th
Edition. London: Pearson Education Limited.
Saunders, M., Lewis,P., & Thornhill, A. (2003). Research Methods for Business for
Business Students, Essex, Pearson Education Ltd.
Saunders, (2003). Research methods for business students (3rd edition) New York –
Prentice Hall.
Schleberger, E. (1998). Report of Regional meeting of the working group:
Entrepreneurship development and training. Available at: wwwfes.de/fulltext.
Schiffer, M. & Weder, B. (2001). Firm Size and the Business Environment: Worldwide
Survey Results. International Finance Corporation. Understanding Micro and
Small Enterprise Growth.
Sekaran, U. (2010). Research Methods for business: A skill Building Approach (5th
Edition.) Shane, S.A (1994). The Effect of National Culture on the Choice
between Licensing and Direct Foreign Investment. Strategic Management
Journal, 15,627-642.
Shane, S. (1993). Cultural influences on national rates of innovation. Journal of
Business Venturing, 8, 1, 59-73.
121
Shook. C., Ketchen, D.,Hult.,T., & Kacmar,. K. (2004). An Assessment of the Use of
Structural Equation Modelling in Strategic Management Research. Strategic
Management Journal, 25,397-404.
Shield, G. (2013). Formative Influences on Technology Education: The Search for an
Effective Compromise in Curriculum Innovation. Journal of Technology
Education, 23(1), 50-60.
Simeon,. N., & Lara. G. (2009). Small Firm Growth in Developing Countries. World
Development, 37(9): 1453–1464. USA: John wiley & Sons Publisher.
Simpeh, K (2011), Entrepreneurship Theories and Empirical Research: A summery
review of the Literature. European Journal of Business and Management. Vol 3
No, 6, page 2-4.
Small Enterprise Assistance Fund [SEAF]. (2004).The Development Impact of Small
and Medium Enterprises: Lessons Learned from SEAF Investments.
Snodgrass,. D. R., & Winkler,. J. P. (2004). Enterprise Growth Initiatives: Strategic
Directions and Options. Prepared for the US Agency for International
Development, Bureau of Economic Growth, Agriculture and Trade. Final Report:
Development Alternatives, INC (DAI).
Straub, E. T. (2009). Understanding Technology Adoption: Theory and future directions
for Informal Learning. Review of Educational Research, 79 (2), 625–649.
Stuart, W.D. (2000). Influence of Sources of Communication, user Characteristics and
Innovation Characteristics on adoption of a communication technology.
Doctoral dissertation.
122
The SMEDAN. (2011). National Policy on Micro, Small and Medium Enterprises.
Retrieved From http://www.smedan.gov.ng/search.php?searWords=National%20
olicy%20on%20M SMEs. www.coulsonharney.com.
Syekei,. J. & Opijah., D. (2012).Kenya’s Vision 2030: Creating more dinner space for
SMEs on the IP table. CHcoulson Harney Advocates. Retrieved from
www.coulsonharney.com University of Kansas.
Sun, X. (2004). The Growth Essence and Ways of the Middle and Small Enterprises.
Journal of Zhengzhou University Philosophy and Social Science Edition, No.
34(4). 66-69.
Tassey,G.(2004).Policy Issues for R&D Investment in a Knowledge-based Economy.
Journal of Technology Transfer, 29(2):153-185.
Thornhill,A. (2003). Research Methods for Business Students. Prentice Hall.
Thompson, J.L. (2004). The Facets of the Entrepreneur: Identifying Entrepreneurial
Potential. Management Decision. 42, 2. 243-258.
UK (2012). Business Innovation and Skills and Support for the SMEs. London: UK
Crown Department for Business Innovation and Skills.
USAID PRISMS. (2010). Governance Issues in Microfinance: A Paper Presented at the
International Year of Micro Credit (IYMC) Workshop. Washington, D.C.:
USAID.
UNCTAD. (2013). Improving the Competitiveness of SMEs through Enhancing
Productive Capacity. Geneva: UNCTAD.
123
USAID PRISMS. (2010). Governance Issues in Microfinance: A Paper Presented at the
International Year of Micro Credit (IYMC) Workshop. Washington, D.C.:
USAID.
Van Dijki, (2001). Innovation and micro and small enterprise development in
developing Countries: linking knowledge as skills to produce employment:
University of Erasmus.
Viswanadham,N. (2017). Alternative Strategies on Improving Small and Medium
Enterprises Access to Seed Capital. A case of Dodoma Municipal, Tanzania.
International Journal of Research Granthaalayah. Vol. 5, No 9, 1-5.
Vinod, R. (2006). Transparency in government procurement: Issues of concern and
interest to developing countries. Journal of World Trade 35, 496.
Netherlands, Vuvor,. S. & Ackah, J. (2011). The Challenges Faced by Small & Medium
Enterprises (SMEs) in Obtaining Credit in Ghana. School of Management.
Wanjohi, A. (2009). Challenges facing SMEs in Kenya. Retrieved from
www.buzzle.com.
Wasihun,. R. & Paul, I. (2010). Growth determinants of women operated micro and
small enterprises in Addis Ababa. Journal of Sustainable Development in Africa,
12(6). 233-246.
White, S. & Kenyon, P. (2011). Enterprise-Based Youth Employment Policies, Strategies
and Programmmes. Geneva: ILO.
124
World Bank. (2011). Kosovo Unlocking Growth Potential: Strategies, Policies, and
Actions.
YEDF (2013). YEDF Status Report. Nairobi.
Young, N. (2009). Understanding the Research Process and Methods. An Introduction
to Research Methods. Las Vegas: Acts Press.
Yusuf, L. (2003). Innovative East Asia, the Future of Growth. Washington, D. C.: The
World Bank, a Co-publication of the World Bank and Oxford University Press.
125
APPENDICES
Appendix I: Letter of Introduction
Dear Respondent,
REF: DATA COLLECTION
I am a PhD student at the Department of Entrepreneurship and Procurement at Jomo
Kenyatta University of Agriculture and Technology. I am carrying out a study on
determinants of growth of youth owned micro and small enterprises in Kenya. The aim
of this questionnaire is to gather information related to this topic. You are therefore
requested to respond to the questions as honestly as possible and information given shall
be treated confidentially and used only for academic purpose. However, you
participation in this exercise is voluntary.
Thank you
Yours sincerely,
Sign…………………………………….
Mugambi Peter Kimuru
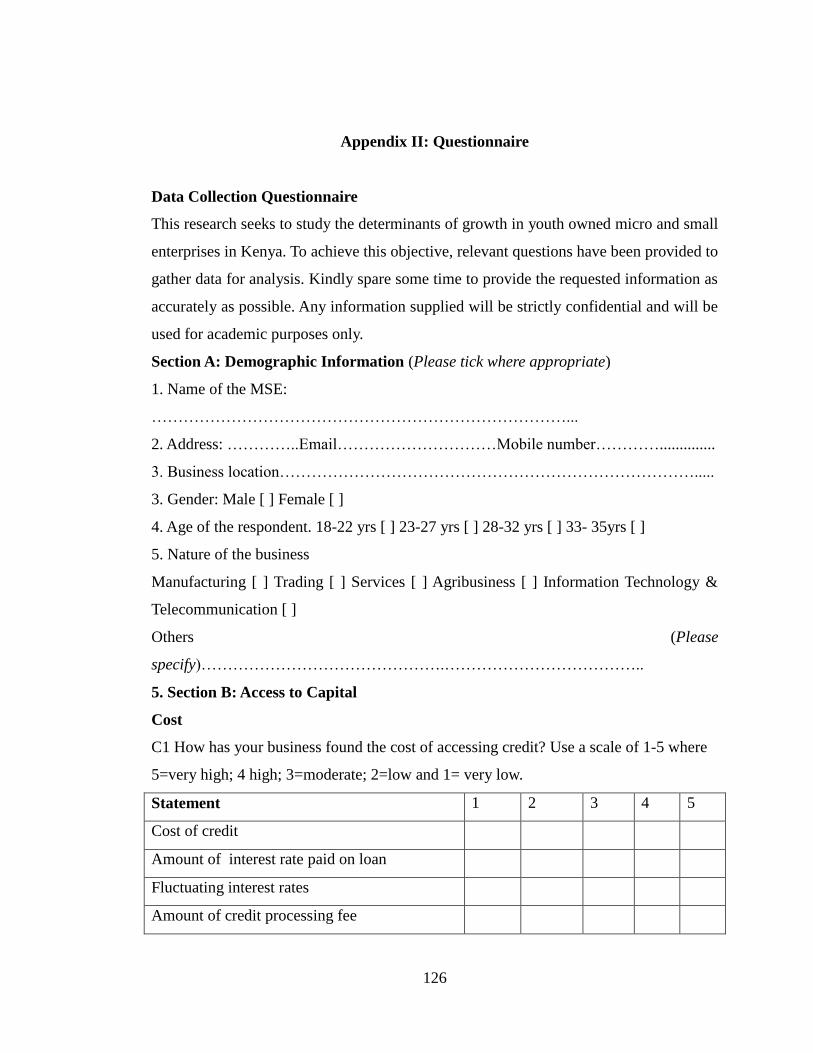
126
Appendix II: Questionnaire
Data Collection Questionnaire
This research seeks to study the determinants of growth in youth owned micro and small
enterprises in Kenya. To achieve this objective, relevant questions have been provided to
gather data for analysis. Kindly spare some time to provide the requested information as
accurately as possible. Any information supplied will be strictly confidential and will be
used for academic purposes only.
Section A: Demographic Information (Please tick where appropriate)
1. Name of the MSE:
……………………………………………………………………...
2. Address: …………..Email…………………………Mobile number…………..............
3. Business location…………………………………………………………………….....
3. Gender: Male [ ] Female [ ]
4. Age of the respondent. 18-22 yrs [ ] 23-27 yrs [ ] 28-32 yrs [ ] 33- 35yrs [ ]
5. Nature of the business
Manufacturing [ ] Trading [ ] Services [ ] Agribusiness [ ] Information Technology &
Telecommunication [ ]
Others (Please
specify)……………………………………….………………………………..
5. Section B: Access to Capital
Cost
C1 How has your business found the cost of accessing credit? Use a scale of 1-5 where
5=very high; 4 high; 3=moderate; 2=low and 1= very low.
Statement 1 2 3 4 5
Cost of credit
Amount of interest rate paid on loan
Fluctuating interest rates
Amount of credit processing fee

127
Credit
C.1 To what extent has your business obtained credit? (Tick one)
a) Little extent [ ]
b) Moderate extent [ ]
c) Large extent [ ]
d) Very large extent [ ]
e) No extent [ ]
C.2 Indicate the alternative financial institution where you have been able to access
credit?
(Tick one)
a) Bank loan [ ]
b) Own capital /savings [ ]
c) Loan from family [ ]
d) Inheritance [ ]
e) Micro finance institutions [ ]
f) Friends or colleagues [ ]
g) Sacco’s [ ]
h) Youth Enterprise Development Fund [ ]
i) Women Enterprise Development Fund [ ]
C.3 Were you contented with the maximum money that was lend to your business?
(Tick one)
a) The amount was sufficient [ ]
b) The amount was less of what was borrowed [ ]
C.4 If your answer was No Extent in C1 what factors impended you from accessing
credit? (Tick one)
a) Lack of accounting records [ ]
b) Lack of a business plan [ ]
c) Rules and procedures associated with lending [ ]
d) Lack of knowledge about lending sources [ ]
e) Lack of security [ ]
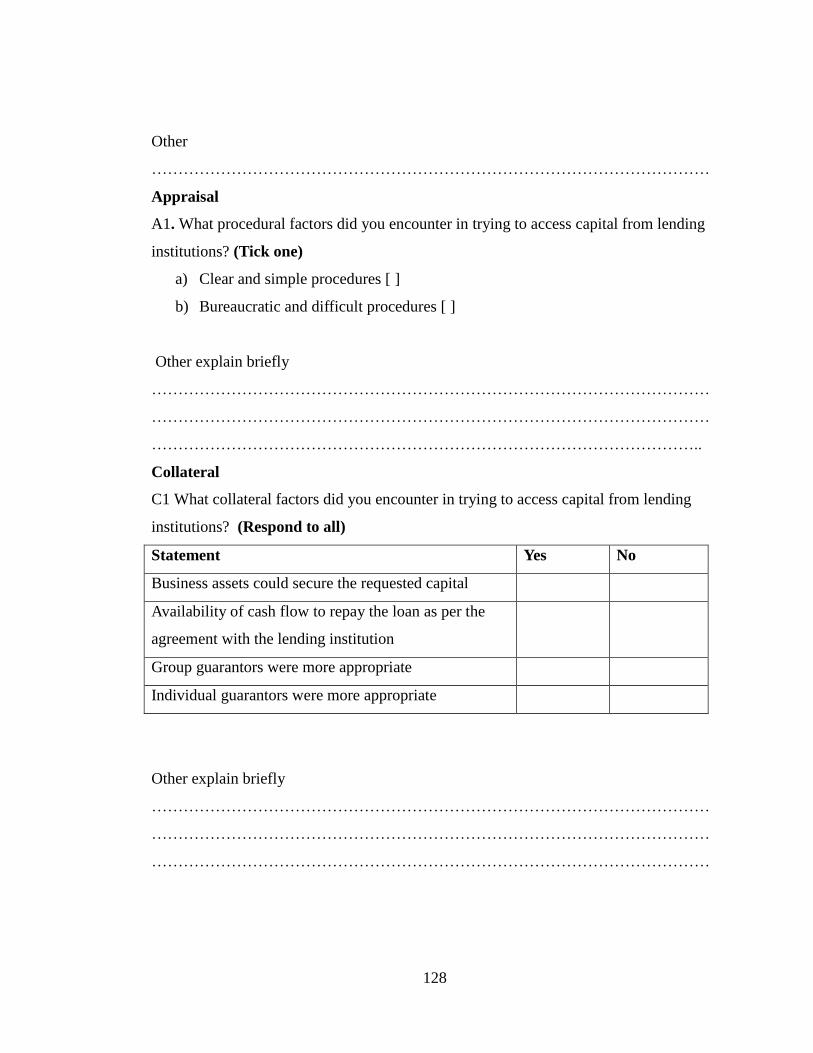
128
Other
……………………………………………………………………………………………
Appraisal
A1. What procedural factors did you encounter in trying to access capital from lending
institutions? (Tick one)
a) Clear and simple procedures [ ]
b) Bureaucratic and difficult procedures [ ]
Other explain briefly
……………………………………………………………………………………………
……………………………………………………………………………………………
…………………………………………………………………………………………..
Collateral
C1 What collateral factors did you encounter in trying to access capital from lending
institutions? (Respond to all)
Statement Yes No
Business assets could secure the requested capital
Availability of cash flow to repay the loan as per the
agreement with the lending institution
Group guarantors were more appropriate
Individual guarantors were more appropriate
Other explain briefly
……………………………………………………………………………………………
……………………………………………………………………………………………
……………………………………………………………………………………………
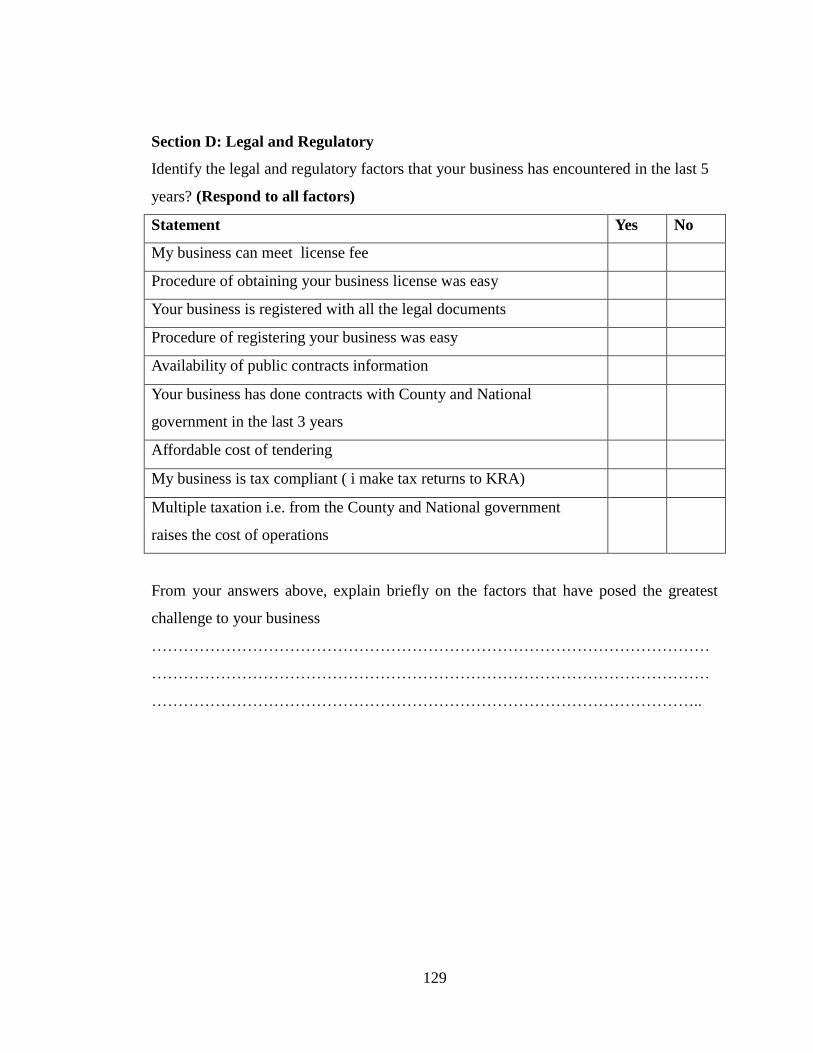
129
Section D: Legal and Regulatory
Identify the legal and regulatory factors that your business has encountered in the last 5
years? (Respond to all factors)
Statement Yes No
My business can meet license fee
Procedure of obtaining your business license was easy
Your business is registered with all the legal documents
Procedure of registering your business was easy
Availability of public contracts information
Your business has done contracts with County and National
government in the last 3 years
Affordable cost of tendering
My business is tax compliant ( i make tax returns to KRA)
Multiple taxation i.e. from the County and National government
raises the cost of operations
From your answers above, explain briefly on the factors that have posed the greatest
challenge to your business
……………………………………………………………………………………………
……………………………………………………………………………………………
…………………………………………………………………………………………..
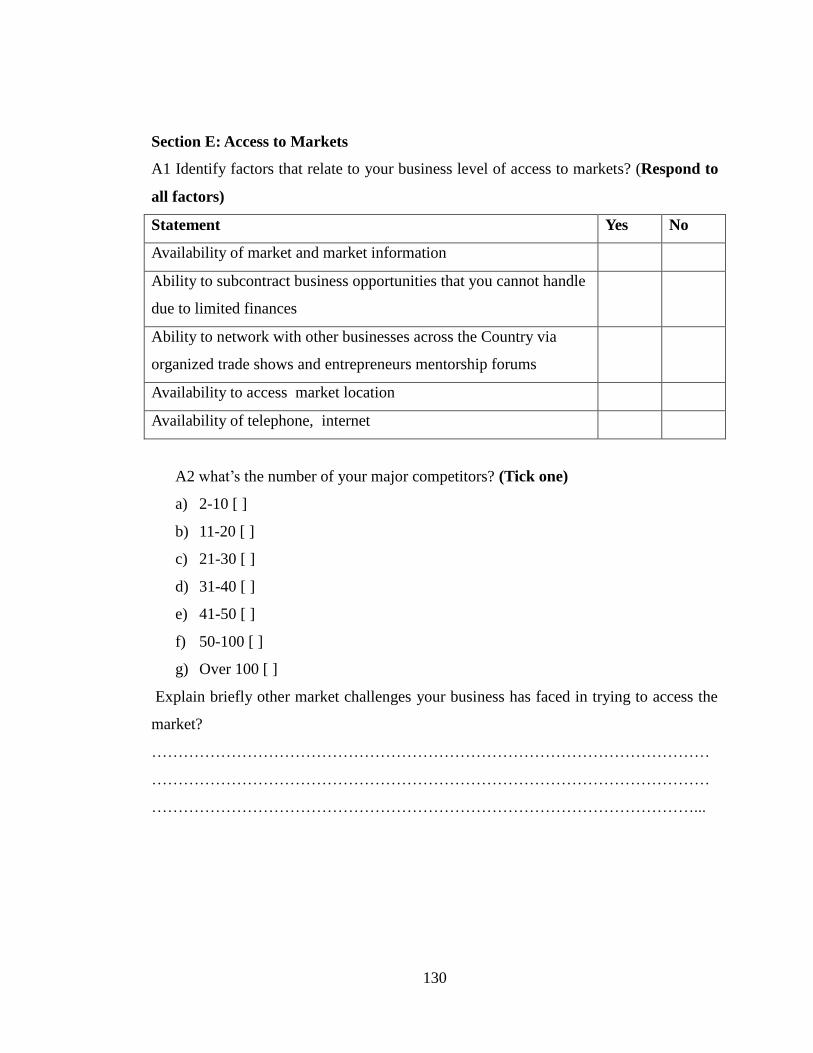
130
Section E: Access to Markets
A1 Identify factors that relate to your business level of access to markets? (Respond to
all factors)
Statement Yes No
Availability of market and market information
Ability to subcontract business opportunities that you cannot handle
due to limited finances
Ability to network with other businesses across the Country via
organized trade shows and entrepreneurs mentorship forums
Availability to access market location
Availability of telephone, internet
A2 what’s the number of your major competitors? (Tick one)
a) 2-10 [ ]
b) 11-20 [ ]
c) 21-30 [ ]
d) 31-40 [ ]
e) 41-50 [ ]
f) 50-100 [ ]
g) Over 100 [ ]
Explain briefly other market challenges your business has faced in trying to access the
market?
……………………………………………………………………………………………
……………………………………………………………………………………………
…………………………………………………………………………………………...
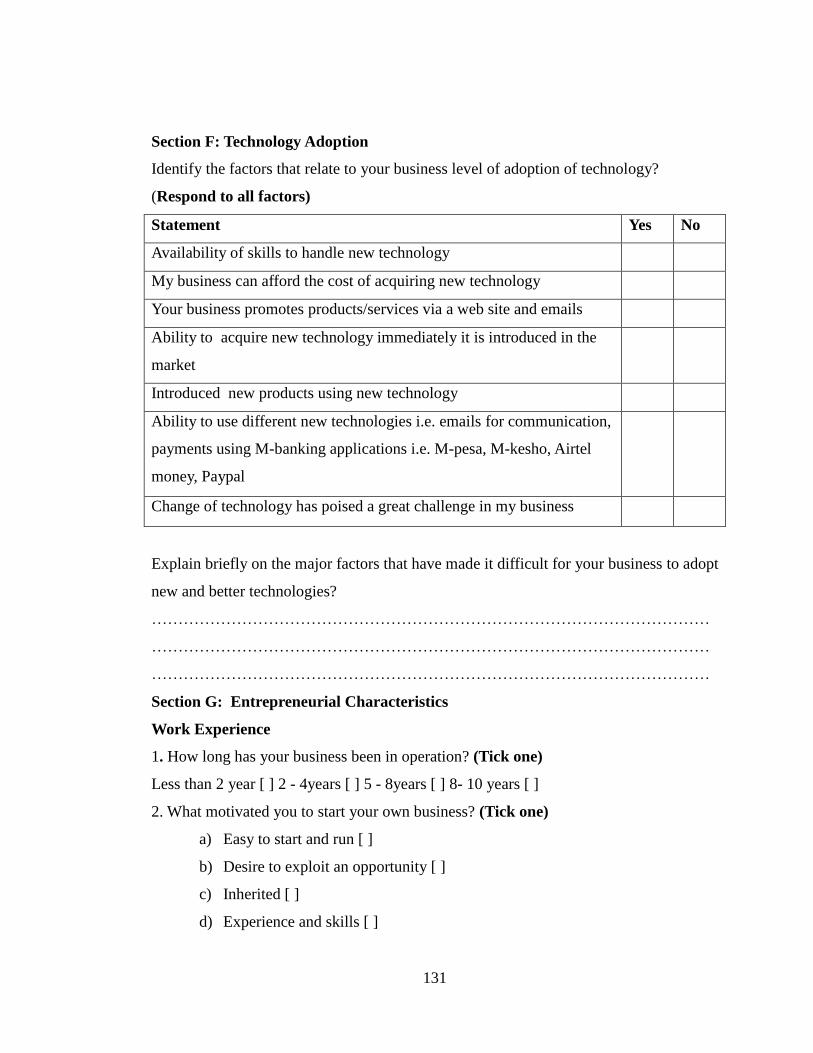
131
Section F: Technology Adoption
Identify the factors that relate to your business level of adoption of technology?
(Respond to all factors)
Statement Yes No
Availability of skills to handle new technology
My business can afford the cost of acquiring new technology
Your business promotes products/services via a web site and emails
Ability to acquire new technology immediately it is introduced in the
market
Introduced new products using new technology
Ability to use different new technologies i.e. emails for communication,
payments using M-banking applications i.e. M-pesa, M-kesho, Airtel
money, Paypal
Change of technology has poised a great challenge in my business
Explain briefly on the major factors that have made it difficult for your business to adopt
new and better technologies?
……………………………………………………………………………………………
……………………………………………………………………………………………
……………………………………………………………………………………………
Section G: Entrepreneurial Characteristics
Work Experience
1. How long has your business been in operation? (Tick one)
Less than 2 year [ ] 2 - 4years [ ] 5 - 8years [ ] 8- 10 years [ ]
2. What motivated you to start your own business? (Tick one)
a) Easy to start and run [ ]
b) Desire to exploit an opportunity [ ]
c) Inherited [ ]
d) Experience and skills [ ]
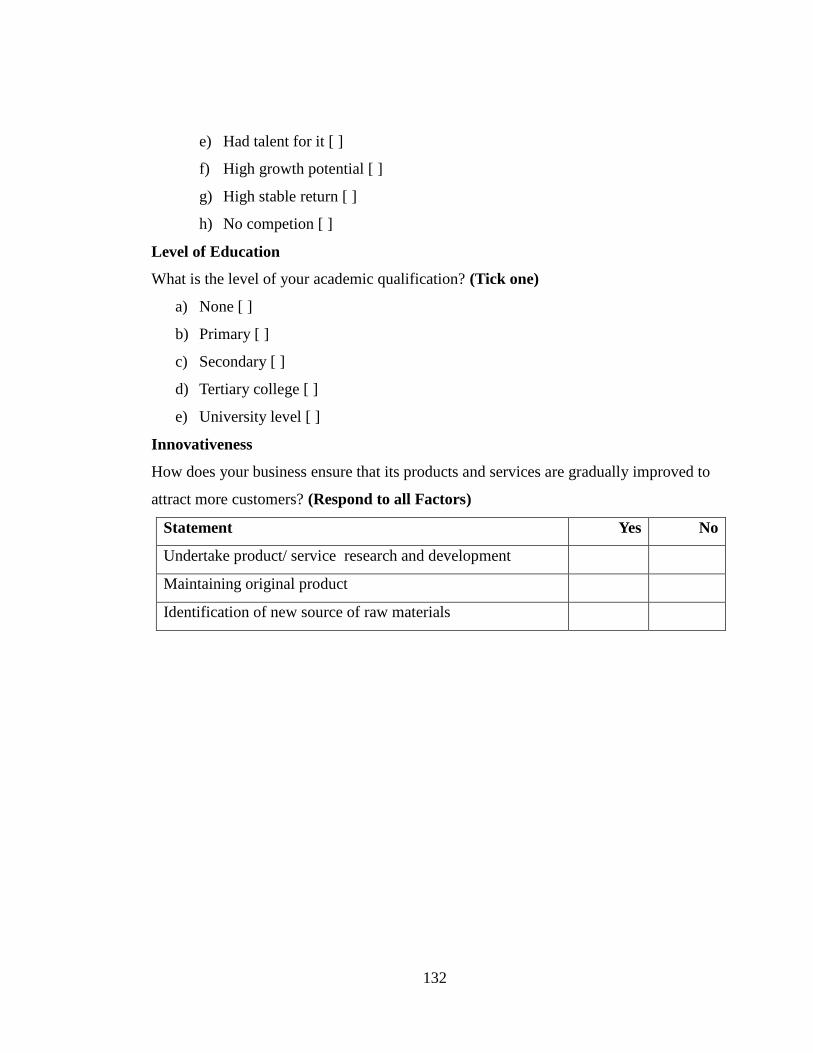
132
e) Had talent for it [ ]
f) High growth potential [ ]
g) High stable return [ ]
h) No competion [ ]
Level of Education
What is the level of your academic qualification? (Tick one)
a) None [ ]
b) Primary [ ]
c) Secondary [ ]
d) Tertiary college [ ]
e) University level [ ]
Innovativeness
How does your business ensure that its products and services are gradually improved to
attract more customers? (Respond to all Factors)
Statement Yes No
Undertake product/ service research and development
Maintaining original product
Identification of new source of raw materials
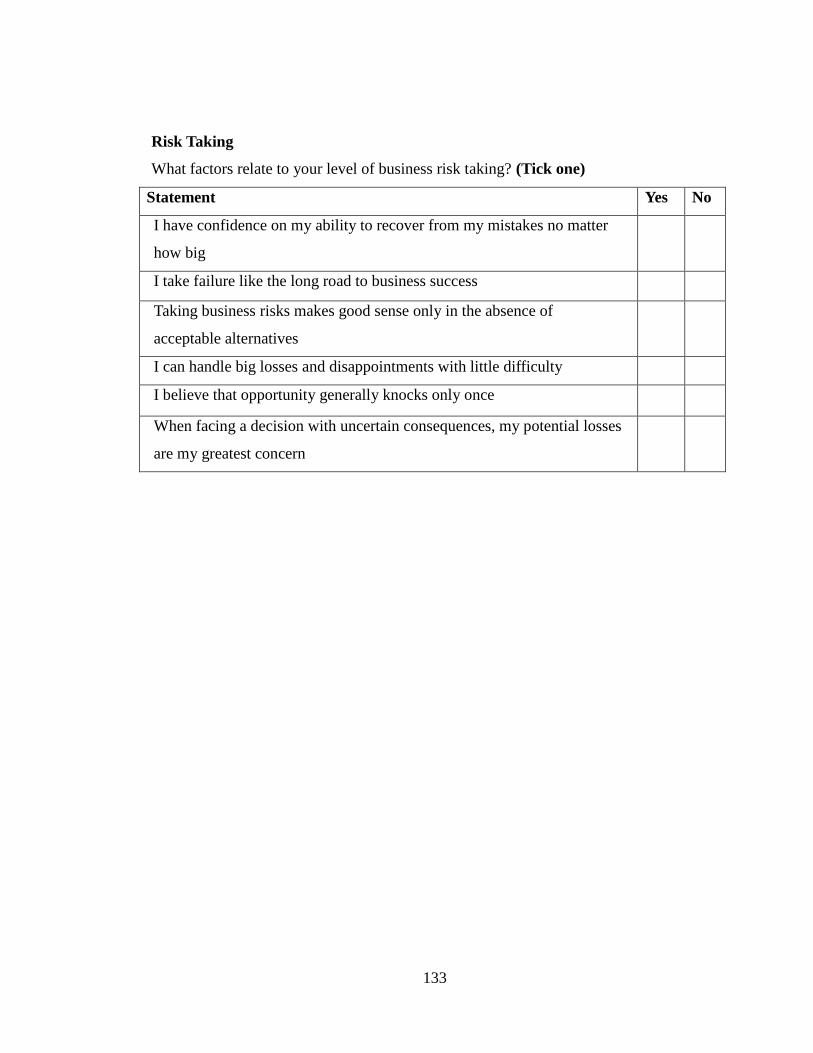
133
Risk Taking
What factors relate to your level of business risk taking? (Tick one)
Statement Yes No
I have confidence on my ability to recover from my mistakes no matter
how big
I take failure like the long road to business success
Taking business risks makes good sense only in the absence of
acceptable alternatives
I can handle big losses and disappointments with little difficulty
I believe that opportunity generally knocks only once
When facing a decision with uncertain consequences, my potential losses
are my greatest concern
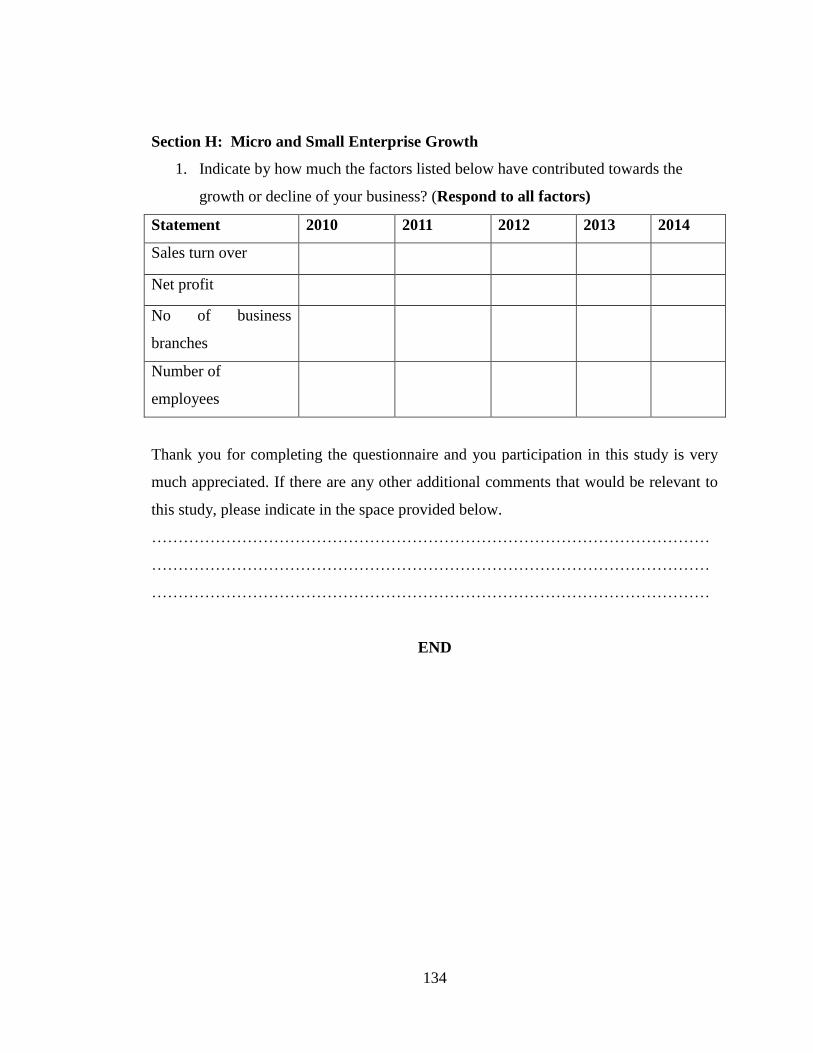
134
Section H: Micro and Small Enterprise Growth
1. Indicate by how much the factors listed below have contributed towards the
growth or decline of your business? (Respond to all factors)
Statement 2010 2011 2012 2013 2014
Sales turn over
Net profit
No of business
branches
Number of
employees
Thank you for completing the questionnaire and you participation in this study is very
much appreciated. If there are any other additional comments that would be relevant to
this study, please indicate in the space provided below.
……………………………………………………………………………………………
……………………………………………………………………………………………
……………………………………………………………………………………………
END
Recommended


