
This article appeared in a journal published by Elsevier. The attachedcopy is furnished to the author for internal non-commercial researchand education use, including for instruction at the authors institution
and sharing with colleagues.
Other uses, including reproduction and distribution, or selling orlicensing copies, or posting to personal, institutional or third party
websites are prohibited.
In most cases authors are permitted to post their version of thearticle (e.g. in Word or Tex form) to their personal website orinstitutional repository. Authors requiring further information
regarding Elsevier’s archiving and manuscript policies areencouraged to visit:
http://www.elsevier.com/copyright

Author's personal copy
Reproductive Toxicology 27 (2009) 307–318
Contents lists available at ScienceDirect
Reproductive Toxicology
journa l homepage: www.e lsev ier .com/ locate / reprotox
Developmental toxicity in white leghorn chickens following in ovo exposure toperfluorooctane sulfonate (PFOS)
Margie M. Peden-Adamsa,b,c,∗, Joyce E. Stuckeyc, Kristen M. Gaworeckid, Jennifer Berger-Ritchiee,Kathy Bryantd, Patrick G. Jodice f, Thomas R. Scottg, Joseph B. Ferrarioh, Bing Guanh,Craig Vigoh, J. Scott Booneh, W. David McGuinni, Jamie C. DeWitt j, Deborah E. Keil e
a Department of Pediatrics, Medical University of South Carolina, Charleston, SC, USAb Marine Biomedicine and Environmental Science Center, Medical University of South Carolina, Charleston, SC, USAc Grice Marine Laboratory, College of Charleston, Charleston, SC, USAd Institute of Environmental Toxicology, Clemson University, Pendleton, SC, USAe Clinical Laboratory Sciences, University of Nevada, Las Vegas, NV, USAf U.S. Geological Survey, South Carolina Cooperative Fish and Wildlife Research Unit and Departmentof Forestry and Natural Resources, Clemson University, Clemson, SC, USAg Department of Animal and Veterinary Science, Clemson University, Clemson, SC, USAh United States Environmental Protection Agency/OPP/BEAD/Environmental Chemistry Lab, John C. Stennis Space Center, MS, USAi United States Food and Drug Administration, Silver Spring, MD, USAj East Carolina University, Department of Pharmacology and Toxicology, The Brody School of Medicine, Greenville, NC, USA
a r t i c l e i n f o
Article history:Received 1 August 2008Received in revised form23 September 2008Accepted 31 October 2008Available online 21 November 2008
Keywords:PFOSImmuneDevelopmentalIn ovoEmbryonicBirdALTCholesterolBrain asymmetry
a b s t r a c t
Studies show that perfluorinated compounds cause various toxicological effects; nevertheless, effects onimmune function and developmental endpoints have not been addressed at length. This study examinedthe effects of perfluorooctane sulfonate (PFOS) in white leghorn hatchlings on various developmental,immunological, and clinical health parameters. In addition, serum PFOS concentrations were determinedby LC/MS/MS. Embryonic day (ED) 0 eggs were injected with either safflower oil/10% DMSO (control,0 mg/kg egg wt) or PFOS in safflower oil/10% DMSO at 1, 2.5, or 5 mg/kg egg wt, and the chicks weregrown to post-hatch day (PHD) 14. Treatment with PFOS did not affect hatch rate. Following in ovo expo-sure chicks exhibited increases in spleen mass at all treatment levels, in liver mass at 2.5 and 5 mg/kg eggwt, and in body length (crown-rump length) at the 5 mg/kg treatment. Right wings were shorter in alltreatments compared to control. Increases in the frequency of brain asymmetry were evident in all treat-ment groups. SRBC-specific immunoglobulin (IgM and IgY combined) titers were decreased significantlyat all treatment levels, while plasma lysozyme activity was increased at all treatment levels. The PHAskin test response decreased in relation to increasing PFOS dose. Serum concentrations where significantimmunological, morphological, and neurological effects were observed at the lowest dose (1 mg/kg eggwt) averaged 154 ng PFOS/g serum. These concentrations fall within environmental ranges reported inblood samples from wild caught avian species; thereby, verifying that the environmental egg concentra-tions used for the injections do indeed relate to serum levels in hatchlings that are also environmentallyrelevant. These data indicate that immune alterations and brain asymmetry can occur in birds following inovo exposure to environmentally relevant concentrations of PFOS and demonstrates the need for furtherresearch on the developmental effects of perfluorinated compounds in various species.
© 2009 Elsevier Inc. All rights reserved.
1. Introduction
Perfluorinated alkyl acids (PFAAs), have been manufactured forover 50 years and are currently used throughout industry as stainand water repellents, in floor waxes, as coatings on paper food
∗ Corresponding author at: MUSC, 221 Ft. Johnson Rd., Charleston, SC 29412,United States. Tel.: +1 843 762 8551; fax: +1 843 762 8700.
E-mail address: [email protected] (M.M. Peden-Adams).
containers, as firefighting foams, flame retardants, denture clean-ers, carpet spot cleaners, pharmaceuticals, and as pesticides [1].Due to the environmental persistence of these compounds, theU.S. Interagency Testing Committee (ITC) has identified 50 per-fluorinated compounds as chemicals of interest [2]. Two of themajor classes of concern are the perfluorinated carboxylates andthe perfluorinated sulfonates, which together are referred to asPFAAs. They are typically nonvolatile, with relatively high molec-ular weights, and surface-active properties related to the attachedcarboxylic acid or sulfonic acid moiety. Due to the high energy of the
0890-6238/$ – see front matter © 2009 Elsevier Inc. All rights reserved.doi:10.1016/j.reprotox.2008.10.009

Author's personal copy
308 M.M. Peden-Adams et al. / Reproductive Toxicology 27 (2009) 307–318
carbon–fluorine ionic bond, many perfluorinated compounds areresistant to hydrolysis, photolysis, biodegradation and metabolism;therefore, some of these compounds are very stable in the envi-ronment [3]. Environmental exposure is evident as compoundsfrom these perfluorinated classes such as perfluorooctane sulfonate(PFOS) and perfluorooctanoic acid (PFOA) are found in blood sam-ples both from wildlife and humans [2–16]. Concentrations in eggshave been reported in various avian species with levels in Caspiantern eggs from the Great Lakes area (max 3.4 �g/kg egg) beingamong the highest [11,13,17–20].
General toxicological effects of PFAAs indicate that they areperoxisome proliferator-activated receptor (PPAR)-� agonists thatcasue peroxisomal proliferation, hepatomegaly, body weight lossassociated with a wasting syndrome peroxisomal fatty acid �-oxidation, decreases in serum cholesterol, and increases in serumalanine amino transferase (ALT) [21–31]. More recent studies sug-gest PFOS and PFOA disrupt endocrine function. PFOS decreasesaromatase activity with corresponding increases in testosteroneand dihydrotestosterone and plasma 11-ketotestosterone andtestosterone, respectively, depending on the species [32,33]. PFOSalso decreases uterine weight in females [34,35]. Alternatively,PFOA increases aromatase activity and plasma estradiol levels andinduces Leydig cell adenomas [36,37].
Emerging data suggest that the immune system is a sensitivetarget for PFAAs. Studies indicate that PFOA suppresses antibodyproduction, causes thymic and splenic atrophy, and alters T-cellpopulations [38–42]. Perfluorodecanoic acid (PFDA) suppressesantibody production and perfluorononanoic acid (PFNA) altersinterleukin (IL)-4 and interferon (IFN)-� production [43,44]. PFOSsuppresses both T-dependent and T-independent antibody produc-tion [45]. In addition, PFOS causes increased ex vivo T-cell IL-4production (stimulated with phorbol myristate acetate) and B-cellIL-6 production (stimulated with either anti-CD40 or lipopolysac-charide), and modulates serum levels of IL-6 and tumor necrosisfactor (TNF)-� [34,45,46]. Moreover, liver levels of PFOS have beencorrelated with infectious disease states in sea otters [47].
Several studies have demonstrated that embryonic exposureto PFOS causes developmental and reproductive effects includ-ing increased incidence of prenatal mortality, low birth weights,structural defects, and developmental delays [18,27,31,48–52].Specifically, PFOS causes high pup mortality, chick mortality, alteredthyroid hormone levels in F1 mouse offspring, and in combinationwith maternal restraint stress decreases performance in an open-field test [18,49,53]. Only one study has assessed the integrity ofthe immune system following exposure to PFOS during develop-ment. Keil et al. [54] showed that mice exposed in utero exhibitedlong-term effects in both male and female offspring. Functionalimmune suppression of NK cell activity (males and females) andsheep red blood cell (SRBC)-specific IgM production (males only)were observed at 8 weeks of age, but not at 4 weeks of age.
Unlike mammalian studies, avian toxicity studies with PFAAsare limited and somewhat varied in scope. Studies in mallardsand quail assessing body weight, organ weight, and mortality fol-lowing a 5-day PFOS exposure via feed report an LD50 in juvenilemallards (Anas platyrhynchus) of 150 and 61 mg/(kg day) in bob-white quail (Colinus virginianus) [55]. In ovo exposures with whiteleghorn chickens (Gallus gallus) indicate a lowest observed adverseeffect level (LOAEL) of 0.1 mg PFOS/kg egg wt (based on decreasedhatch rates) and an LD50 of 4.9 mg PFOS/kg egg wt [18]. Only onestudy has assessed sublethal health effects in birds. Hoff et al. [56]noted increased serum ALT, and decreased serum cholesterol andtriglyceride levels in both the great tit (Parus major) and blue tit(Parus caeruleus) in relation to hepatic PFOS levels. Cwinn et al. [57]showed that embryonic hepatocytes from white leghorn chickensrespond to PPAR-� agonism following PFOS exposure leading toincreased mRNA for malic enzyme, peroxisomal acyl-CoA oxidase,
liver fatty acid binding protein, and enoly-Coenzyme A but do notexhibit an increase in PPAR� mRNA. Other gene expression studiesin chicken hepatocytes indicate differing gene expression patternsfollowing PFOS or PFOA exposure [58].
No avian studies to date have, however, assessed alterations inimmune function or sublethal toxicity following embryonic expo-sure to PFOS. PFOS is the predominate PFAA found in both humanand wildlife blood samples [3,7,8,14,16]. The developing embryoand immune system are often sensitive targets for xenobiotics, andrecent studies suggest that immune function may be highly sus-ceptible to effects of PFOS [45,54,59–64]. Therefore, the currentstudy utilized traditional measures of avian immunotoxicity [65,66]to assess developmental effects of embryonic exposure using thewhite leghorn chicken following air sac injection on embryonicday 0 (ED0). In addition, typical measures of developmental andreproductive toxicity (i.e., hatch rates, deformities, survival, limbmeasurements, length measurements, and weights) along withbrain asymmetry, hematology, clinical chemistry, and serum PFOSconcentrations were assessed to determine potential health effectsof egg concentrations documented in the literature and to identifywhat those injection concentrations would translate to in serumlevels at 14 days of age.
2. Materials and methods
2.1. Chemicals, antibodies, and supplies
Unless otherwise specified, all chemicals and mitogens were purchased fromSigma (St. Louis, MO). Perfluorooctane sulfonic acid (PFOS) potassium salt (statedpurity >98%) used for animal treatments was obtained from Fluka (via Sigma, CASNo. 2795-39-3). Perfluorooctane sulfonic acid potassium salt (PFOS; 98%) for ana-lytical chemistry determinations was obtained from Alfa Aesar (Ward Hill, MA).13C labeled sodium PFOS and perfluorooctanoic acid (PFOA) were from Welling-ton Laboratory (Guelph, Ontario, Canada). Sheep erythrocytes (sheep red bloodcells; SRBCs) in Alsever’s solution were obtained from Cambrex BioScience Walk-ersville, Inc. (Walkersville, MD). Non-essential amino acids (NEAA; 10 mM 100×) andsodium pyruvate (100 mM) were obtained from GIBCO Laboratories (Grand Island,NY). RPMI-1640 medium (with l-glutamine and sodium bicarbonate), phosphatebuffered saline (PBS; with or without Ca2+ and Mg), and penicillin/streptomycin(5000 IU/ml; 5000 �g/ml) were purchased from Cellgro (Mediatech, Herndon, VA).Tritiated thymidine (3H; specific activity 71 Ci/mmol) was acquired from ICN (CostaMesa, CA). The fetal bovine serum (FBS) was from Gemini Bio-Products (West Sacra-mento, CA). The fluorescent antibodies, mouse IgG 2a (isotype control), fluoresceinisothiocyanate (FITC) conjugated rat-anti-chicken CD4 (monoclonal), and phyco-erythrin (PE) conjugated rat-anti-chicken CD8 (monoclonal) were purchased fromSouthern Biotech (Birmingham, AL). Unifilter® plates and Microscint 20TM wereprocured from Packard (Meriden, CT). Tissue culture plates, syringes, needles, Vacu-tainers, stains, methanol (Spectrum Anhydrous A.C.S.), ammonium acetate (HPLCgrade), ammonium hydroxide (Certified A.C.S. Plus), formic acid (laboratory grade),and disposables were purchased from Fisher Scientific (Atlanta, GA). Leg bands werepurchased from National Band and Tag (Newport, KY). The spring-loaded caliperfor measurement of wing swelling was purchased from The Dyer Co. (Lancaster,PA). Oasis WAX solid-phase extraction SPE columns were purchased from Waters(Milford, MA).
2.2. Egg injections
White leghorn eggs were obtained from the Morgan Poultry Center, ClemsonUniversity. Egg injections were conducted as previously described [67]. Briefly, eggswere cleaned with 20% povidone iodine followed by 70% isopropyl alcohol. Eggswere then weighed and air cells marked with pencil following candling. Eggs wererandomized into treatment groups (0, 1, 2.5, or 5 mg PFOS/kg egg wt). The carriercontrol was 10% DMSO in safflower oil (0 mg/kg egg wt). The administered dosesreflect the concentration of the PFOS-potassium salt. The actual doses reflecting thePFOS ion only were 0, 0.93, 2.31 and 4.60 mg PFOS ion/kg egg wt. When comparingdoses or concentrations reported in other studies, it is often unknown whether thepotassium mass was subtracted from the calculations. When it is not removed, thePFOS concentration is overestimated by approximately 7.3%. The administered doseis identical for PFOS potassium salt or the PFOS ion when rounded to a single signif-icant digit (Peden-Adams et al. [45]). These doses are used throughout the paper forsimplicity.
Injection volumes ranged from 8 to 11 �l depending on egg weight (0.16 �l/gegg weight); egg weight ranged from 48.2 to 67.4 g. Following injection, holes weresealed with melted paraffin. Drilling, injections, and sealing of eggs were conductedin a sterile laminar flow hood. All procedures were approved by the Clemson Uni-

Author's personal copy
M.M. Peden-Adams et al. / Reproductive Toxicology 27 (2009) 307–318 309
Fig. 1. Schematic of experimental design. Egg, liver and spleen samples collected for analytical PFOS determination have not yet been assessed; therefore, that data is notincluded in the manuscript. *High mortality was expected based on previous research reported by Molina et al. [18] where the lowest observable adverse effect level of0.1 mg/kg egg wt was related to decreased hatch rates and the reported LD50 was 4.9 mg/kg egg wt. Therefore, in PFOS treatment groups additional eggs were injectedand incubated as compared to the control group to account for the expected mortality and still allow appropriate numbers of chicks for assessment at termination of theexperiment.

Author's personal copy
310 M.M. Peden-Adams et al. / Reproductive Toxicology 27 (2009) 307–318
versity Institutional Animal Care and Use Committee and Institutional BiohazardCommittee.
2.3. Animal care
Eggs were incubated, positioned with the air sac up, at 37 ◦C and 60% relativehumidity, in egg trays with holes in the bottom to allow airflow around the egg,in a circulated air incubator with an automatic egg turner that rotated the eggs ata 45◦ angle every 3–4 h. By using cardboard egg cartons the eggs were spaced sothat they were not in contact with one another. Eggs were also randomized as toplacement within the carton to achieve random placement of dose groups in theincubator. Eggs were candled on embryonic day (ED) 7, 14, and 17 and were movedto a hatcher on ED17. Dead embryos observed during candling were removed fromegg shells and examined for cause of death. On post-hatch day (PHD) one, chickswere affixed with leg bands (numbered white, green, pink, or blue size 4 coil bands),weighed and moved to a brooder (maintained at 35–38 ◦C in a room at 60% relativehumidity). The chicks were housed at a density no less than 0.076 square meters perbird. A 16/8 h light/dark cycle was maintained throughout the experiment. Chicksremained in the brooder for 14 days and were provided food (corn based starter mashprepared at the Morgan Poultry Center) and water ad libitum. On PHD 14 chicks wereasphyxiated with CO2. Chicks were separated into subgroups for sample collection.Descriptions of sample size and collection for each subgroup are outlined in Fig. 1.Blood was quickly collected from the right jugular vein with a 3 ml syringe and 21gauge needle following asphyxiation with CO2. Needles were replaced with 18 gaugeneedles (to prevent hemolysis) prior to placing samples into 3 ml sodium heparinVacutainer tubes. Plasma was collected and frozen at −20 ◦C until analysis.
2.4. Body and organ mass and organ cellularity
Spleen, thymus, bursa, liver, and brain were collected on PHD 14. All balanceswere calibrated, using standard weights, prior to use. Body mass was determinedusing an animal weighing balance (Denver Instrument, Denver, CO) that reportedan average of 15 measurements for each individual. Organ mass was normalized forbody weight and reported as a somatic index {(organ weight/body wt) × 100}. Addi-tionally, immune organs (spleen, thymus, and bursa) were aseptically processed intosingle cell suspensions with the use of sterile, frosted microscope slides. Cellularity(total numbers of lymphocytes/organ) was determined with a hemacytometer viatrypan blue exclusion.
2.5. Hematology and clinical plasma chemistry
White blood cell differential counts were conducted on blood smears stainedwith Wright–Giemsa stain. All slides were enumerated for consistency by a singletechnician who was blinded to the treatment group. The plasma chemistry ana-lytes [alanine aminotransferase (ALT), aspartate aminotransferase (AST), cholesterol(cholster), triglycerides (triglycerds), creatinine kinase (CK), �-glutamyl transpepti-dase (GGT), lactate dehydrogenase (LDH), high-density lipoproteins (HDL), alkalinephosphatase (Alk-Phos), albumin and total protein] were determined with an auto-mated analyzer (Sirrus®; Stanbio, Boerne TX). All samples were blinded to theoperator during the analysis process.
2.6. Lymphocyte proliferation
Proliferation measures the ability of lymphocytes to undergo clonal expansion,which is critical to mounting an adaptive immune response. The proliferation testutilizes mitogens to simulate exposure to antigen presented by macrophages andcauses the lymphocytes to proliferate. Different mitogens are historically known tostimulate the proliferation of T-cells or B-cells. Immune organs (spleen, thymus, andbursa) from unimmunized chicks were processed and diluted to 1 × 10⁷ cells/mlin supplemented RPMI-1640 medium (RPMI-1640, 10% fetal bovine serum, 1%nonessential amino acids, 1% sodium pyruvate, 10 mM HEPES, 1% pen–strep, pH6.9) as previously described [59]. Spleens were assessed for both T- and B-cellproliferation, while the thymus and bursa were assessed for only T-cell or B-cellproliferation, respectively. One hundred microliter aliquots of the resulting cell sus-pensions were dispensed into 96-well plates (1 × 10⁶ cells/well) containing triplicatewells of either 2.5 �g/ml concanavalin A (Con A, type IV-S), 200 ng/ml phorbol 12,13-dibutyrate (PDB), or supplemented RPMI-1640 (unstimulated wells) as previouslydescribed [59]. Scott and Savage [68] have shown that PDB stimulates prolifera-tion in avian B-cells. Cells with and without mitogen were incubated as previouslydescribed [59]. Using a modification of Peden-Adams et al. [59], cells were harvestedonto Unifilter plates using a Packard FiltermateTM 96-well plate harvester and theplates were allowed to dry. Once dry, 25 �l of Microscint 20TM was added to eachwell and the samples were analyzed using a Packard Top CountTM-NXT scintillationcounter. Results are reported as the stimulation index (SI = CPM stimulated/CPMunstimulated).
2.7. Phytohemagglutinin (PHA) skin test
The PHA skin test is a measure of cell-mediated immunity. The difference inswelling at a phosphate buffered saline (PBS) injection site and a PHA injection
site were determined in individual animals to assess the function of cell-meditatedimmunity. On PHD 13, 10 chicks per treatment were randomly selected, affixed withunnumbered blue size 4 bandette leg bands on the opposite leg from the animalnumbered identifier band (white, green, pink, or blue coil band) to indicate PHAinjection, and injected with 50 �l of 1 mg/ml PHA-P in the right wing web and 50 �lof sterile PBS in the left wing web [69]. Swelling was measured with a spring-loadedcaliper 24 h later. The thickness of the wing web at the saline injection location wassubtracted from the thickness of the wing web at the PHA injection location anddata reported as swelling in mm.
2.8. Splenic and thymic CD4/CD8 subpopulations
Splenic and thymic cells were assessed for the T-cell surface markers CD4 andCD8. T-cells from the thymus may also be double positive or double negative for thesemarkers depending on their state of maturation. CD4+/CD8− cells are functionallyclassified as T-helper cell, while CD4−/CD8+ cells are classified as cytotoxic T-cells.Each of these cell types has a different function in the immune system and alterationsin numbers of these cell types are indicative of immunotoxicity, especially when ashift in the ratio of CD4 to CD8 cells is observed.
Spleen or thymus cells from unimmunized chicks were labeled with fluorescent(phycoerythrin or fluorescein isothiocyanate) mouse IgG1 monoclonal antibodiesspecific for chicken CD4 or CD8 (mouse-anti-chicken). In this procedure, single cellsuspensions of thymocytes and splenocytes were washed and resuspended in phos-phate buffered saline (pH 7.4; containing 0.1% sodium azide and 1% bovine serumalbumin). Monoclonal antibodies were incubated with cells for 30 min at 6 ◦C inthe dark. Lastly, the cells were fixed with 1% paraformaldehyde and stored at 6 ◦Cin the dark. Flow cytometric analysis was performed using a Becton Dickinson flowcytometer (FACSCaliburTM; San Jose, CA). Non-stained cells and fluorescent antibodycontrols were used to establish gates for the CD4/CD8 subpopulations in thymic andsplenic cells. Data are represented as absolute number of cells in each organ, deter-mined by multiplying the percent gated cells by the total number of cells per organobtained by trypan blue exclusion.
2.9. Lysozyme activity
Plasma lysozyme activity is a measure of innate immune function. Lysozymeactivity was measured using a standard turbidity assay as previously described [45]in plasma collected from chicks not challenged with antigen (PHA or SRBC; Fig. 1).
2.10. Hemagglutination
Hemagglutination is a measure humoral immune function and assesses titers ofantigen (Ag) specific antibodies (Ab) following Ag challenge. Therefore, it determinesthe ability of the immune system to produce Ab after Ag challenge. On PHD 3, sixchicks per treatment were affixed with white size 4 unnumbered bandette leg bandson the opposite leg from the animal numbered identifier band (white, green, pink,or blue coil band) to indicate SRBC injection. Chicks were immunized with SRBC onPHD 3 and 10 as previously described [59] (100 �l of 25% SRBC solution in the rightwing web). Hemagglutination analysis was performed as described by Hudson andHay [70]. Results are reported as the log2 of the inverse of the dilution at whichagglutination occurred. Birds produce an immunoglobulin (Ig) historically knownas IgY that is analogous to the mammalian IgG. The first row of serial dilutions was ameasure of both IgY and IgM titers (IgM + IgY). By the addition of 2-ME, the secondrow of serial dilutions detected IgY agglutinins only. By subtracting these two values,a single titer for IgM was obtained.
2.11. Brain asymmetry measurements
Following immersion fixation in 10% phosphate-buffered formalin for a mini-mum of 1 month, brains were measured with a ruler, by eye, as previously described[71,72]. This was performed by a single person to ensure consistency. All brains werecoded with the chicken ID number only and were not immediately identifiable bydose to the reader (thereby blinded). Briefly, five dorsal measurements and two lat-eral measurements were made on each brain, which included: height (rostro-caudal,dorsal); width (medio-lateral, dorsal); angle (diagonal to the medio-lateral axis, dor-sal); depth (dorso-ventral, lateral); tectal width (medio-lateral, dorsal); tectal length(rostro-caudal, dorsal); and tectal depth (dorso-ventral, lateral).
For each of the seven measurements, differences between the two halves ofthe brain were calculated as the absolute value of measurements from the left sideminus measurements from the right side and were averaged for each dose group.For an individual brain, frequency was calculated by dividing the total number ofasymmetries by the total number of difference measurements made on the brain(maximum = 7). Per dose group, frequency was calculated as the average of the indi-vidual frequencies. Severity was calculated per brain with the following formula:
Severity = (A ∗ 0.25) + (B ∗ 0.5) + (C ∗ 0.75)N
where A = number of asymmetries of 0.25 mm; B = number of asymmetries of0.5 mm; C = number of asymmetries of 0.75 mm; and N = total number of difference
Author's personal copy
M.M. Peden-Adams et al. / Reproductive Toxicology 27 (2009) 307–318 311
measurements made on the brain (maximum = 7). N varied due to handling damageto the brain. If a particular landmark was damaged, then that measurement was notmade.
2.12. Limb measurements
Wing (right and left) and leg (right) measurements were made with a ruler, byeye. This was done post-mortem by a single person to ensure consistency.
2.13. Serum extraction and PFOS quantitation by LC/MS/MS
Serum extraction for PFOS determinations were conducted as previouslydescribed [45] with slight modifications. Standard stocks of PFOS (0.8–4000 ng/ml),13C PFOS (25 ng/ml), and 13C PFOA (125 ng/ml) were prepared in methanol. The lin-earity, recovery, precision, and accuracy were determined prior to the analysis ofsamples. Serum samples (10–150 �g), spiked samples, six PFOS standards (25 �l inmethanol), and method blanks, were placed into polypropylene tubes. Duplicatesand multiple fortified control samples were processed with each set of samplesto ensure method performance. All samples, standards, and blanks were brought to0.2 ml with reagent water. All samples were spiked with 100 �l of 13C PFOS (25 ng/mlin methanol) to act as a surrogate standard for PFOS. Six hundred microliters of 50%formic acid in water was added to each tube, vortexed, and sonicated for 10 min.Waters Oasis WAX 3 cc/60 mg [30 �m] SPE columns were placed on an Alltech vac-uum manifold for preconditioning with 2 ml of methanol followed by 2 ml of reagentwater. Samples were loaded onto the SPE columns and washed with 1 ml water, 1 ml2% formic acid in water, and 0.5 ml methanol. Polypropylene tubes were used forcollection and the PFOS was eluted from the SPE column with 1.5 ml of methanolfollowed by 2 ml of 1% ammonium hydroxide in methanol. The samples were con-centrated using a TurboVap LV evaporator (35 ◦C, 7 psi) to approximately 0.5–0.9 ml.The injection standard, 13C PFOA, was added (40 �l, 125 ng/ml in methanol) to eachtube; the sample was brought to 1 ml with methanol and vortexed. Standard concen-trations were: PFOS (0.02–100 pg/�l), 13C PFOS (2.5 pg/�l), and 13C PFOA (5 pg/�l).The methanol in the blanks\standards\samples at this stage can cause the com-pounds of interest to elute off the HPLC column, and therefore the samples need tobe diluted with water prior to injection. Into a LC sample vial, 500 �l of water wasadded and 500 �l of the sample was added, vortexed, and placed in an autosam-pler. Injection volumes of all standards and samples were 100 �l. The on-columninjection for the standards were: PFOS (1–5000 pg), 13C PFOS (125 pg), and 13C PFOA(250 pg). The amount of PFOS from samples was determined using the identifier ionof linear chain peak from the PFOS calibration curve and adjusted for 13C PFOS. Allstandards and samples were adjusted for potassium salt mass and reflect PFOS iononly.
The initial demonstration of capability indicated no detectable levels of PFOS inthe method blanks. Limit of quantitation (LOQ) was set at the lowest calibration stan-dard (0.02 pg/�l, 1 pg on-column) prepared as a sample with a signal to noise ratioof 5. The limit of detection (LOD) was set at 1/2 LOQ which was 0.01 pg/�l (0.5 pg on-column). Laboratory precision was ±15% and the accuracy of matrix spiked sampleswas >95%. The correlation coefficient of the weighted (1/x) linear regression curvewas on average 0.999.
All analyses were performed on a API 3000 PE Sciex LC MS/MS interfaced toa PerkinElmer 200 micro HPLC, a PerkinElmer 200 autosampler, a PerkinElmer200 column oven. The LC MS/MS was operated in a negative electrospray ion-ization mode. Samples were introduced using a 100 �l injection onto a ThermoBetasil C18 column (100 mm × 2 mm × 5 �m). Column temperature was maintainedat 23 ◦C.
The 20 mM ammonium acetate in water/methanol mobile phase was deliveredat a flow rate of 300 �l/min. The injection volume was 100 �l using a 200 �l loopwith three pre- and post-inject flushes. No guard column was used in this studysince all solvent lines were changed to PEEK material whenever possible and washedthoroughly with methanol and water extensively. The elution gradient started at 60%methanol and is held for 2 min, and then it was increased to 75% methanol in 9 minand held for 5 min, and it was then increased to 95% methanol in 4 min with a 2 minhold, before reverting to 60% in 0.5 min with an 8 min hold time.
The declustering potential (DP), entrance potential (EP) and focus potential (FP)were optimized for each parent compound. Collision energy (CE) and cell exit poten-tial (CXP) were optimized for each MRM transition using 13C labeled compoundsto avoid background from native compounds. Values obtained for 13C PFOS wereapplied directly to the native PFOS without change. The MRM transitions monitoredfor 13C PFOA were 417 → 169, 417 → 172, and 417 → 372. MRM transitions moni-tored for 13C PFOS were 503 → 80 and 503 → 99. The MRM transitions monitoredfor native PFOS were 499 → 80 and 499 → 99. The collision gas was N2 and CADvalue was 3. Nebulizer gas flow was set at 15, and curtain gas flow was set at 8. Theionspray voltage (IS) was set to −2000 V and the temperature was set to 300 ◦C.
2.14. Statistics
Data were tested for normality (Shapiro–Wilks W-test) and homogeneity(Bartlett’s test for unequal variances) and, if needed, appropriate transformationswere made. A one-way ANOVA was used to determine differences among doses foreach endpoint using JMP 4.0.2 (SAS Institute Inc., Cary, NC) in which the standarderror used a pooled estimate of error variance. When significant differences weredetected by the F-test (P < 0.05), Dunnett’s t-test was used to compare treatmentgroups to the control group. Data from the PHA skin test and plasma CK measurementwas additionally tested by Kendall’s Tau for relationship analysis (|Tau b| < 0.05).Dose–response determinations were assessed using Prism Graph Pad 4.0 (Graph-Pad Software, Inc., La Jolla, CA) with a standard curve for calculating dose–responseas outlined in the figure legends.
3. Results
3.1. Hatch rates and deformities
Neither hatching success nor egg viability was altered by PFOStreatment (Table 1). In the 2.5 mg/kg egg wt treatment four chicksout of 52 exhibited deformities (1 with cranial edema, 2 withabdominal cavities not formed correctly, 1 with exposed brain, beaknot formed, and right eye not formed). However, in the 5 mg/kg eggwt treatment only two out of 52 chicks exhibited deformities (1with crossbeak, 1 with cranial edema and missing leg and wing).
3.2. Body and organ mass, immune organ cellularity, anddevelopmental measures
Body, brain, bursa and thymus mass were not altered (Table 2).Spleen mass was increased at all treatment levels (Table 2). Livermass increased linearly (R2 = 0.65) and was significantly differ-
Table 1Mortality and hatching success in white leghorn chicks following in ovo exposure to PFOS on embryonic day 0.
PFOS (mg/kgegg wt)
Mortality during incubation (no. of eggs) Died during incubationa
(% mortality)No. didnot pip
No. did nothatchb
No. withdeformitiesc
Hatching successd
(% hatching)Week 1 Week 2 Week 3
0 3 0 0 3/31 (9.7%) 2 4 0 24/31 (77.4%)1 8 0 0 8/53e (15.1%) 3 5 0 40/53e (75.5%)2.5 6 0 1 7/52 (13.5%) 2 6 4f 39/52 (75%)5 3 2 0 5/52 (9.6%) 2 2 2g 45/52 (86.5%)
Note: No. = Number.a Number died/number set in incubator.b Number that did not hatch indicates only those eggs that were moved to the brooder and includes those that pipped and those that did not pip (i.e., in the control group
2 pipped and did not hatch and 2 did not pip [thereby they did not hatch] = 4 chicks that did not hatch).c Those with deformities did not hatch and are included in the number that did not hatch (i.e., 4 of the 6 chicks that did not hatch in the 2.5 mg/kg egg wt treatment
exhibited deformities).d Hatching success = {(the number of eggs set in the incubator) − [(the number of eggs that died during incubation) + (the number that did not hatch]/(the number set in
the incubator)}× 100.e 1 control egg was accidentally dosed with 1 mg PFOS/kg rather than with the carrier control; therefore, the sample size of the 1 mg/kg treatment is one greater than the
2.5 and 5 mg/kg egg treatments.f 1 with cranial edema, 2 with abdominal cavities not formed correctly, 1 with exposed brain, beak not formed, and right eye not formed.g 1 with crossbeak, 1 with cranial edema and missing leg and wing.

Author's personal copy
312 M.M. Peden-Adams et al. / Reproductive Toxicology 27 (2009) 307–318
Table 2Body and organ mass in 14-day-old white leghorn chicks following in ovo exposure to PFOS on embryonic day 0.
PFOS mg/kgegg wt
Body masschangea (g)
Normalizedbrain massb
Normalizedspleen massb
Normalizedthymus massb
Normalizedbursa massb
Normalizedliver massb
0 74.45 ± 2.88 1.31 ± 0.04 0.07 ± 0.01 0.39 ± 0.04 0.39 ± 0.02 3.3 ± 0.101 72.87 ± 6.70 1.31 ± 0.05 0.11 ± 0.01* 0.43 ± 0.02 0.46 ± 0.04 3.3 ± 0.072.5 70.80 ± 3.32 1.29 ± 0.02 0.13 ± 0.01* 0.41 ± 0.03 0.40 ± 0.02 3.6 ± 0.08*
5 79.72 ± 3.80 1.26 ± 0.05 0.11 ± 0.01* 0.41 ± 0.03 0.40 ± 0.04 3.9 ± 0.06*
Note: Data are presented as mean ± standard error of the mean. Sample size is 6/treatment.a Body mass change = final weight (g) PDH14 − initial weight (g) PHD1.b Organ mass normalized to body mass = (organ mass/body mass)100.* Significantly different from respective control (P ≤ 0.05). Body mass at PHD 1, 7, and 14 did not differ among treatment groups. Mass change between PHD1 and PHD7
also did not differ among treatment groups.
Table 3Body (crown-rump) and limb length in 14-day-old white leghorn chicks following in ovo exposure to PFOS on embryonic day 0.
PFOS mg/kg egg wt Crown-rump (cm) Right leg (cm) Right wing (cm) Left wing (cm) Wing differencea (cm)
0 13.0 ± 0.1 11.4 ± 0.1 8.4 ± 0.1 8.6 ± 0.1 0.15 ± 0.081 12.6 ± 0.2 10.9 ± 0.1 7.9 ± 0.2* 8.3 ± 0.1 0.4 ± 0.12b
2.5 12.7 ± 0.2 11.0 ± 0.2 7.9 ± 0.2* 8.1 ± 0.2 0.25 ± 0.085 13.4 ± 0.1* 11.4 ± 0.1 7.9 ± 0.1* 8.3 ± 0.1 0.35 ± 0.13
Note: Data are presented as mean ± standard error of the mean. Sample size is 10/treatment. Left leg not measured.a Length left wing (cm) − Length right wing (cm).b Different from control with both Dunnett’s comparison to control and Student’s t-test; however, ANOVA P = 0.08. Therefore, this is reported as not significantly different
but this information is provided to allow the reader to judge for themselves.* Significantly different from respective control (P ≤ 0.05).
ent from control in both the 2.5 and 5 mg/kg egg wt treatments(Table 2). No differences were observed in spleen, thymus, or bursacellularity (data not shown). Crown-rump length was significantlyincreased at the highest treatment level (5 mg/kg egg wt, Table 3).Limb and left wing lengths were not statistically altered by PFOStreatment as compared to control (Table 3). However, right winglengths in the chicks were significantly shorter in all treatmentgroups as compared to control (Table 3).
3.3. Hematology and clinical chemistry
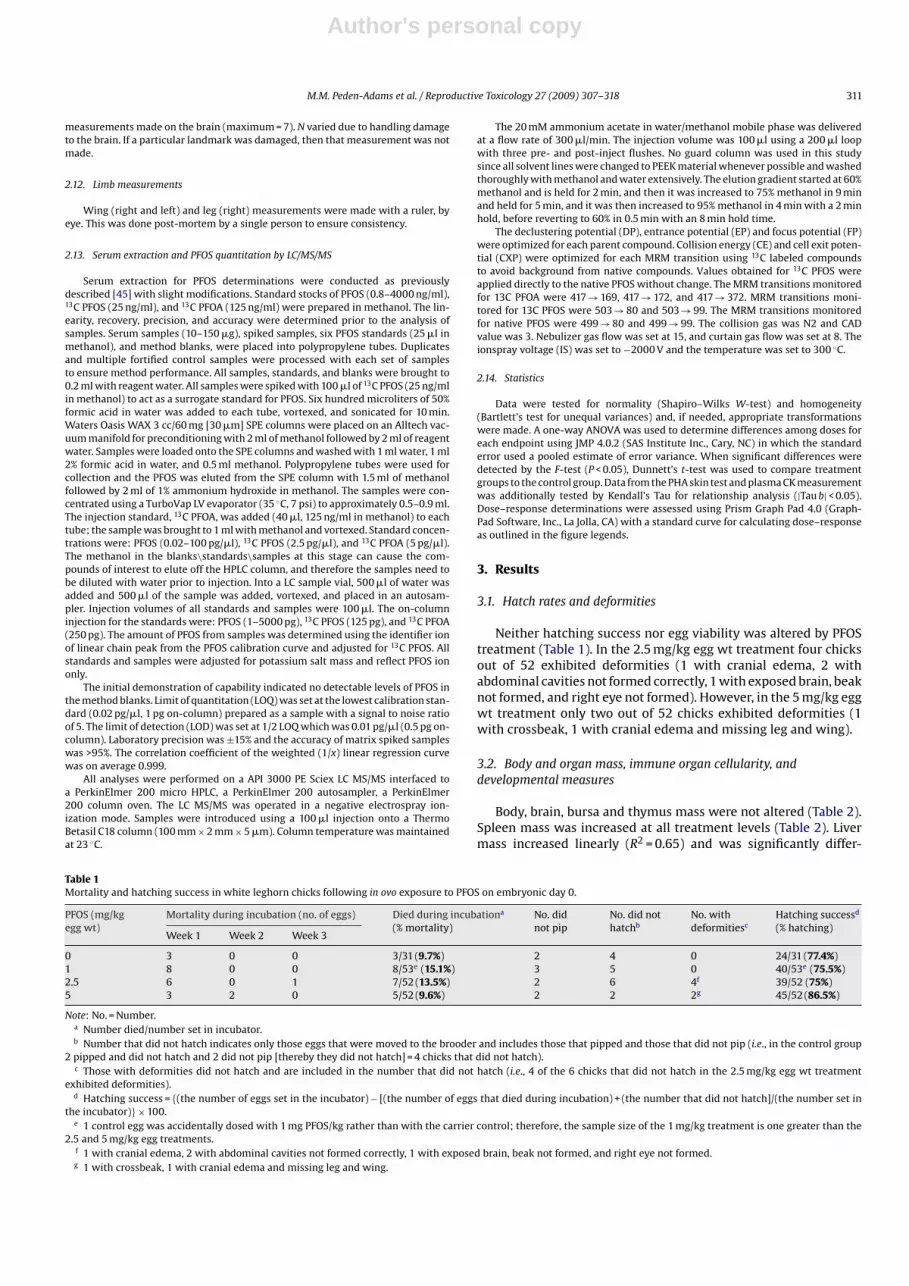
There were no differences in white blood cell differential countsas compared to control (data not shown). Plasma levels of ALT weresignificantly decreased in the 2.5 mg/kg egg wt treatment (Table 4).LDH levels were significantly decreased in the 1 and 2.5 mg/kgegg wt treatments as compared to control. Although not statisti-cally significant between treatment groups with ANOVA, CK levelsexhibited significant decreases in relation to increasing PFOS dose(Table 4; |Tau b| < 0.05). Albumin, total protein, triglycerides, GGT,HDL, creatinine, and alkaline phosphatase were not significantlydifferent from control in any of the PFOS treated animals (Table 4).Additionally, while they were not significant by ANOVA or Kendall’sTau due to sample variability, the data showing a small decrease inboth cholesterol and AST fit the standard dose–response equation:Response = T + (B − T)*(Dose/(Dose + ED50)). Where T was the upperlimit of response and B was the lower limit of response (Fig. 2).
3.4. Immune function
Splenic or thymic T-cell proliferation decreased but this decreasedid not reach statistical significance (data not shown). B-cell pro-liferation was not altered in either the spleen or bursa (datanot shown). Although decreased, plasma SRBC-specific antibodylevels (IgM and IgY individually) were not significantly differentfrom control due to variability around the control means (Fig. 3).Nevertheless, total SRBC-specific Ig (IgM + IgY) was significantlydecreased at all treatment levels (Fig. 3). While no significant dif-
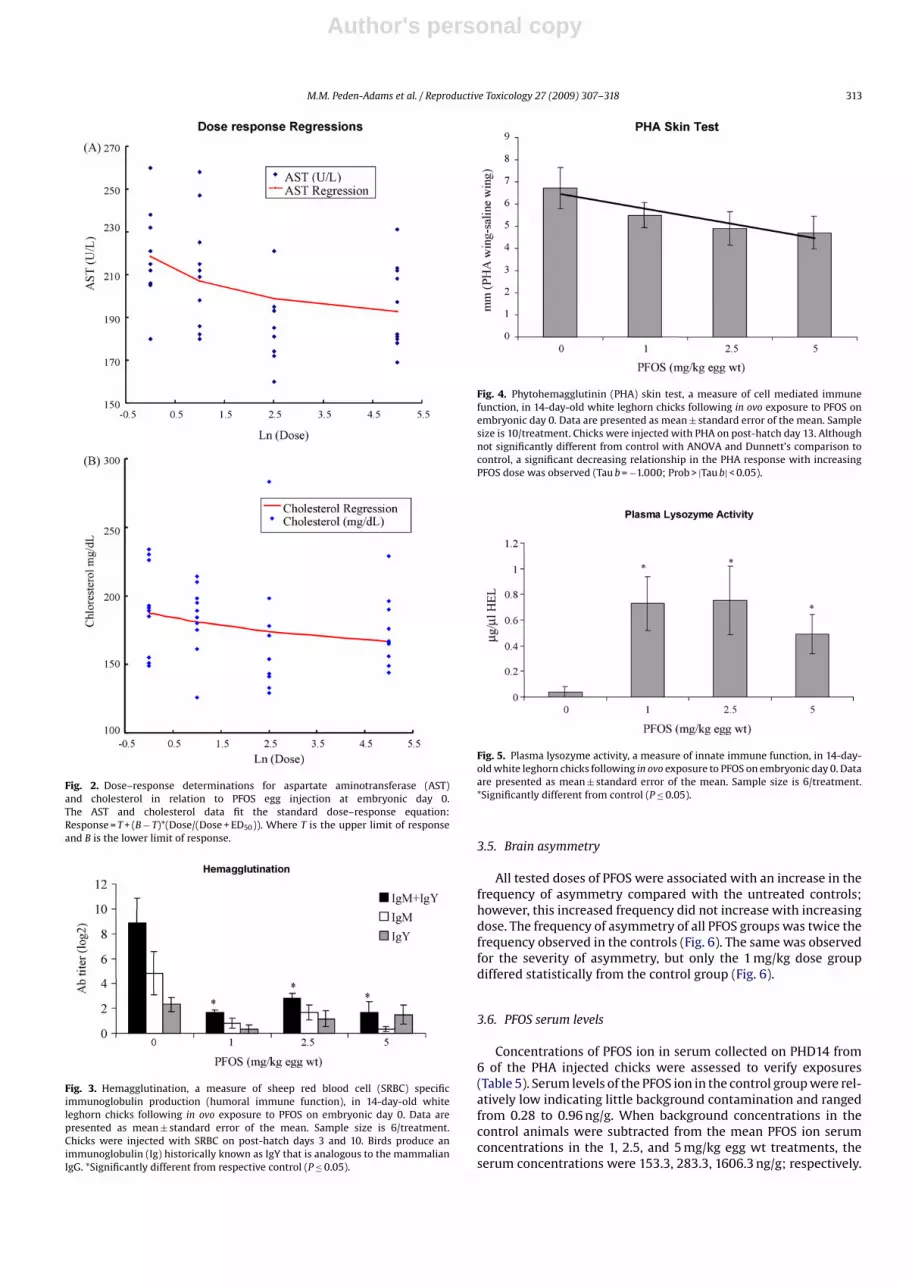
ference from control was observed in the PHA wing web responseusing ANOVA, this response did decrease with increasing doseand was significant using Kendall’s Tau (Fig. 4). Plasma lysozymeactivity was increased compared to control at all treatment levels(Fig. 5). Absolute numbers of CD4/CD8 immunophenotypes werenot altered by PFOS treatment in either the spleen or thymus (datanot shown).
Table 4Clinical chemistry in 14-day-old white leghorn chicks following in ovo exposure toPFOS on embryonic day 0.
Clinical chemistryendpoints
PFOS (mg/kg egg wt)
0 1 2.5 5
Albumin (g/dL) 1.46 ± 0.05 1.54 ± 0.03 1.44 ± 0.10 1.41 ± 0.06Total protein (g/dL) 3.03 ± 0.10 3.09 ± 0.05 2.92 ± 0.17 2.87 ± 0.10Alk-Phos (mg/dL)a 1453 ± 450 1628 ± 425 2416 ± 413 2190 ± 513ALT (U/L) 9.2 ± 0.5 9.1 ± 0.5 6.9 ± 0.7* 8.7 ± 0.4AST (U/L) 217.5 ± 6.9 211.2 ± 8.3 192.7 ± 9.5 195.1 ± 6.3GGT (U/L) 13.4 ± 0.4 12.5 ± 0.3 12.1 ± 0.6 12.3 ± 0.6LDH (U/L) 662 ± 41 505 ± 58* 503 ± 37* 526 ± 20b
CK (U/L) 867 ± 59 803 ± 130 604 ± 59 557 ± 47c
Cholster (mg/dL) 190 ± 10 183 ± 8 170 ± 16 174 ± 8Triglycrds (mg/dL) 119 ± 12 121 ± 8 111 ± 12 128 ± 8HDL (mg/dL) 107 ± 5 108 ± 4 95 ± 7 92 ± 3
Note: Data are presented as mean ± standard error of the mean. Sample sizeis 6/treatment. Abbreviations: alanine aminotransferase (ALT), aspartate amino-transferase (AST), cholesterol (Cholster), triglycerides (Triglycerds), creatininephosphokinase (CK), gamma-glutamyl transpeptidase (GGT), lactate dehydrogenase(LDH), high-density lipoproteins (HDL), and alkaline phosphatase (Alk-Phos).
a Alk-Phos in birds is generally relatively low, but elevated levels such as these aretypically indicative of osteoblast activity and boney change associated with growth[73].
b All treatment levels for LDH, including the 5 mg/kg egg wt dose, were sig-nificantly different from control using the Student’s t-test but only the 1 and2.5 mg/kg egg wt treatments were significantly different with Dunnett’s t-test(ANOVA P = 0.0291). As Dunnett’s test was the more conservative test chosen for thestudy, this is reported as not significantly different but this information is providedto allow the reader to judge.
c CK exhibited a significant decreasing trend (Kendall’s Tau; Prob |Tau b| < 0.05).* Significantly different from respective control (P ≤ 0.05; Dunnett’s t-test).
Author's personal copy
M.M. Peden-Adams et al. / Reproductive Toxicology 27 (2009) 307–318 313
Fig. 2. Dose–response determinations for aspartate aminotransferase (AST)and cholesterol in relation to PFOS egg injection at embryonic day 0.The AST and cholesterol data fit the standard dose–response equation:Response = T + (B − T)*(Dose/(Dose + ED50)). Where T is the upper limit of responseand B is the lower limit of response.
Fig. 3. Hemagglutination, a measure of sheep red blood cell (SRBC) specificimmunoglobulin production (humoral immune function), in 14-day-old whiteleghorn chicks following in ovo exposure to PFOS on embryonic day 0. Data arepresented as mean ± standard error of the mean. Sample size is 6/treatment.Chicks were injected with SRBC on post-hatch days 3 and 10. Birds produce animmunoglobulin (Ig) historically known as IgY that is analogous to the mammalianIgG. *Significantly different from respective control (P ≤ 0.05).
Fig. 4. Phytohemagglutinin (PHA) skin test, a measure of cell mediated immunefunction, in 14-day-old white leghorn chicks following in ovo exposure to PFOS onembryonic day 0. Data are presented as mean ± standard error of the mean. Samplesize is 10/treatment. Chicks were injected with PHA on post-hatch day 13. Althoughnot significantly different from control with ANOVA and Dunnett’s comparison tocontrol, a significant decreasing relationship in the PHA response with increasingPFOS dose was observed (Tau b = −1.000; Prob > |Tau b| < 0.05).
Fig. 5. Plasma lysozyme activity, a measure of innate immune function, in 14-day-old white leghorn chicks following in ovo exposure to PFOS on embryonic day 0. Dataare presented as mean ± standard error of the mean. Sample size is 6/treatment.*Significantly different from control (P ≤ 0.05).
3.5. Brain asymmetry
All tested doses of PFOS were associated with an increase in thefrequency of asymmetry compared with the untreated controls;however, this increased frequency did not increase with increasingdose. The frequency of asymmetry of all PFOS groups was twice thefrequency observed in the controls (Fig. 6). The same was observedfor the severity of asymmetry, but only the 1 mg/kg dose groupdiffered statistically from the control group (Fig. 6).
3.6. PFOS serum levels
Concentrations of PFOS ion in serum collected on PHD14 from6 of the PHA injected chicks were assessed to verify exposures(Table 5). Serum levels of the PFOS ion in the control group were rel-atively low indicating little background contamination and rangedfrom 0.28 to 0.96 ng/g. When background concentrations in thecontrol animals were subtracted from the mean PFOS ion serumconcentrations in the 1, 2.5, and 5 mg/kg egg wt treatments, theserum concentrations were 153.3, 283.3, 1606.3 ng/g; respectively.

Author's personal copy
314 M.M. Peden-Adams et al. / Reproductive Toxicology 27 (2009) 307–318
Fig. 6. Frequency (A) and severity (B) of brain asymmetry in 14-day-old whiteleghorn chicks following in ovo exposure to PFOS on embryonic day 0. Data arepresented as mean ± standard error of the mean. Samples size is 6/treatment. *Sig-nificantly different from control (P ≤ 0.05).
Table 5PFOS ion serum levels in 14-day-old white leghorn chicks following in ovo exposureto PFOS on embryonic day 0.
PFOS (mg/kg egg wt) Serum PFOS ion concentration (ng/g)
0 0.7 ± 0.11 154 ± 382.5 284 ± 575 1607 ± 234
Note: Data are presented as mean ± standard error of the mean. Sample size is sixper treatment. ng/g≈ng/ml = ppb.
4. Discussion
This is the first study to detail developmental and immune mod-ulation following PFOS exposure in an avian species. To survey forpotential clinical health effects following PFOS exposures, hema-tology and clinical chemistry were included along with organ andbody mass, and brain asymmetry measurements. In ovo exposurehad little effect on hematological parameters, but caused statis-tically significant changes in liver clinical chemistry parameterssuch as ALT and LDH. ALT in birds is not as specific a measure-ment for liver damage as it is in mammals. AST in birds is generallymore predicative of liver damage and is used in conjunction withCK to distinguish between muscle and liver damage [73,74]. Thisis important to remember when reviewing data that reports pos-itive correlations between ALT and PFOS liver concentrations inwild birds [56]. LDH elevations associated with normal CK arehighly suggestive of liver disease [74]. The effects seen in the cur-rent study were, however, associated with decreases in these threeparameters. Additionally, both cholesterol and AST fit a standarddose-response equation indicating a decrease in these parameters.
While the correlation coefficients were small (0.04 for cholesteroland 0.12 for AST), because of the inherent variability of these param-eters, the small magnitude of the effects and the correspondingdecreases in ALT and LDH, these results are strongly suggestive ofdiminished hepatic function at the cellular level that is distinct fromhepatic cell destruction.
No effect on body mass was observed, but slight (not signifi-cant) decreases were noted in brain mass. Liver mass increased withincreasing dose. This was not surprising as increased liver mass fol-lowing PFOS exposure is well documented in mammalian models[28]. Nevertheless, the observed increase in spleen mass was unex-pected. In adult murine models, PFOS does not alter spleen massat low doses (0–5 mg/kg total dose over 28 days) and spleen massactually decreases at higher doses (300 mg/kg total dose over 28days) [45,46].
In mice, the only other model for the effects of PFOS on develop-mental immunity yet studied, Keil et al. [54] showed that exposuredid not alter spleen mass. The highest treatment level in that studywas 5 mg PFOS/kg maternal weight/day on GD 1-17, which wouldresult in a total exposure of 85 mg/kg maternal weight as com-pared to the lowest dose in the current study which was a singleexposure of 1 mg/kg egg weight. Differences in timing of suscep-tible developmental windows between species or other speciesdifferences may be related to this observed discrepancy. Since theincrease in chick spleen weight was not anticipated and previousstudies in our lab with adult rodents have indicated no alterationin spleen histology [34] histopathology was not included in thecurrent study. Such inclusion may have provided insight into thecause of this splenomegaly. Increased innate immune function anddecreases in adaptive immune function accompanied this increasein spleen mass. It has long been suggested that increased spleenmass may be indicative of increased immunocompetence, but thesedata and others indicate this is not necessarily the case [75]. Infact, splenomegaly has been associated with disease in variousspecies [76–81]. However, chicks in the current study did not exhibitovert indications of parasites, infectious disease nor increases inwhite blood cell differential counts, suggesting the splenomegalywas related to the PFOS dose administered rather than apathogen.
Gross brain asymmetry has been measured in several avianspecies developmentally exposed to environmental mixtures ofpolyhalogenated aromatic hydrocarbons and reflects the influenceof an environmental stressor on development [71,72,82–84]. Brainasymmetry is reported to be associated with various neurologicaldisorders in children including dyslexia, autism, attention deficithyperactivity disorder, specific language impairment, and devel-opmental language disorder [85–89]. Brain asymmetry followingxenobiotic exposure could then be related to altered learning orbehavioral endpoints or other neurotoxic markers. In fact, evidenceof neurotoxicity following PFOS exposure is increasing. Neonatalexposure to PFOS in mice results in decreased habituation andhyperactivity in adulthood [90] while exposure in adult mice causesslight alterations in activity measurements (i.e., open-field and ver-tical activity) and decreased escape times in the retention phaseof the Morris water maze [49,91]. Increased norepinephrine con-centrations have been reported in the paraventricular nucleus ofthe rat hypothalamus, suggesting that PFOS can modulate the neu-roendocrine system in rats [92]. In the current study, in ovo PFOSexposure increased the frequency of brain asymmetry. PFOS hasbeen suggested to be included in the group of known develop-mental neurotoxicants [90] and taken together it appears thatdevelopmental PFOS exposure could alter neurological function inavian species as well as rodents.
The only measure of innate immune function assessed, plasmalysozyme activity, was increased at all doses. Circulating lysozymeis a marker of proinflammatory responses and has antibacterial

Author's personal copy
M.M. Peden-Adams et al. / Reproductive Toxicology 27 (2009) 307–318 315
functions [65,93]. Lysozyme specifically hydrolyses the �-1,4 link-age in the peptidoglycan of prokaryote cell envelopes; thereby,lysing the cell. In chickens, 3.5% of the albumen (∼2.5 mg/ml) ismade up of lysozyme [94,95]. Maternal lysozyme is part of thedeveloping egg and is considered to play a role in protection ofthe egg from infection. Lysozyme is found primarily in the albu-men until ED 16, when it appears to be transported to the yolk,and absorbed into the gut after hatching, where it provides earlyprotection from digestive infections [94,95]. During this processmaternal lysozyme is not detected in embryonic whole blood orserum even after hatching [94]. Therefore, confounding effects ofmaternal lysozyme are not expected.
Other studies have assessed lysozyme in relation to PFOS inadult and juvenile animals. In adult B6C3F1 mice, lysozyme wasnot altered in males but increased in females [45], while in juve-nile Western fence lizards lysozyme decreased with increasingPFOS dose [96]. Moreover, in juvenile wild loggerhead sea turtlesand adult bottlenose dolphin plasma PFOS concentrations corre-late with decreasing plasma lysozyme activity [97,98]. The reasonfor the observed increase in the current study is not clear, but inhumans, increased serum lysozyme is suggestive of various con-ditions other than acute infections such as acute myelomonocyticleukemia, chronic myelomonocytic leukemia, chronic myelocyticleukemia, renal insufficiency, glomerulonephritis, and nephrosis[99–103]. As white blood cell counts and differentials were notaltered in the chicks, indications of leukemia are not likely; how-ever, indicators of renal insufficiency, glomerulonephritis, andnephrosis were not specifically assessed. Further studies shouldassess plasma lysozyme activity in other developmental modelsto see if increased trends following developmental exposure areconsistent or vary among species.
Similar to reports in both adult and in utero studies with B6C3F1mice [45,54] in ovo PFOS exposure did not alter lymphocyte pro-liferative responses. The PHA skin test, a widely used marker ofcell-mediated immunity in birds [66,69] was also not significantlyaltered in treatment groups as compared to control. However, asignificant decrease in the response was noted in relation to increas-ing PFOS dose suggesting the potential for PFOS to modulate thisresponse.
Suppression of SRBC-specific immunoglobulin production wasnoted indicating decreased humoral immunity. Maternal IgY couldbe considered a possible confounding factor in the hemagglutina-tion assay as SRBC are a large antigen with various epitopes whichcan cross-react to yield non-specific binding to SRBC. This has beenobserved in unchallenged adult hens (Peden-Adams, unpublisheddata). However, in chickens, maternal IgY is catabolized by hatch-lings over the first 14 days post-hatch. By approximately PHD5offspring start to synthesize IgY and by PHD14 circulating IgY inchick plasma is primarily of endogenous origin. Confounding effectsof maternal IgY, therefore, were not likely in this study and cross-reactivity in 14-day-old chicks has not been noted (Peden-Adams,unpublished data).
Humoral immune function has been documented to be sup-pressed following PFOS exposure in rodent models and thissuppression was reported to be gender related with males beingmore sensitive to the effect than females [45,54]. PHA skin testsare also known to be influenced by gender [104]. Due to the ageof the chicks at the first injection, gender was not known. Whiteleghorn chicks do not begin to exhibit secondary sex characteris-tics until approximately PHD 21 (3 weeks of age) and do not reachpuberty to clearly determine gender via secondary sex character-istics until 20 weeks of age. Although non-invasive methods existto determine gender in day-old poultry, they are difficult to mas-ter and rely on slight color differences in colored and cross-bredchickens or on feather development (i.e., females have more highlydeveloped feathers at PHD1 than males) [105]. Moreover, these
early, and even late (i.e., beginning comb development at PHD21),characteristics can be influenced by compounds that effect theendocrine system, such as PFOS [32,33,106–112]. Therefore, gen-der determination at the time of the SRBC and PHA injections wasprecluded. Although gender determination at termination of theexperiment was possible, the inability to separate genders for anal-ysis (due to low sample sizes for each gender) may have increasedthe variability in the hemagglutination assay and PHA skin test.Despite this, these immune data suggest decreased humoral andcell-mediated immune functions and possible compensation by theinnate immune system for these decreases.
As a preliminary survey to verify PFOS absorption and distri-bution from the egg into the embryo, serum samples from sixchicks per treatment group at PHD 14 were assessed. Serum concen-trations where significant immunological and neurological effectswere observed at the lowest dose (1 mg/kg egg wt) averaged 154 ngPFOS/g serum. Studies have reported blood levels in the great tit(Paraus major) ranging from 24.3 to 1625 ng/ml (≈ng/g) and in baldeagles (Haliaeetus leucocephalus) from <1 to 2220 ng/ml [10,113].The toxicity reference value (TRV) for PFOS serum levels in birdshas been reported as 1700 ng/ml with a benchmark dose (BMD)of 1000 ng/ml [55,114]. The TRV and BMD were based on mortal-ity, histology, and reproductive endpoints. In this study, however,immunological and neurological effects were observed at serumconcentrations lower than these values and well within the rangeof levels reported in avian species. Immunological effects have beenpreviously reported to be highly sensitive to the effects of PFOS [45]and spleen PFOS levels are reported to be higher than those of liver[115] indicating it could be a potential target organ. Ongoing studiesare determining egg, liver, spleen, and additional serum levels fromthis in ovo exposure to better characterize PFOS distribution.
Based on previous studies it was expected that a high degreeof mortality would occur as the reported LD50 for egg injectionin white leghorns is 4.9 mg/kg egg wt [18]. However, this was notobserved in this study. Although injection volumes can influencemortality [67,116], the study by Molina et al. [18] used a slightlylower injection volume (0.06 �l lower) than the present study.Therefore, differences are most likely related to the carrier differ-ence between studies (100% DMSO in Molina et al. [18] vs. 10%DMSO in safflower oil in the current study) or differences in injec-tion technique rather than the volume of injection (0.1 �l/g egg wtvs. 0.16 �l/g egg wt). Regardless of the difference, the current studydoes not support the previously reported LD50 for PFOS egg injec-tion in this species and suggests that it is higher than 5 mg/kg eggwt.
In summary, the lowest exposure level evaluated (1 mg/kg eggweight) caused increased spleen mass, increased lysozyme activity,suppressed total SRBC-specific Ig (IgM + IgY), shorter right wings,and increased frequency and severity of brain asymmetry; there-fore, the LOAEL could not be clearly determined. These data supportthe hypothesis that at environmentally relevant concentrationssublethal effects on development, immune function, and neurolog-ical endpoints can occur suggesting that maternal transfer into eggscould pose risks to developing avian embryos. Future studies shouldclarify these results using a larger sample size of PHA and SRBCchallenged chicks to allow for separation of gender differences andinclude the plaque forming cell responses as a measure of IgM pro-duction as it is generally more sensitive than the hemagglutinationtest. Future studies should also assess host resistance endpoints andadditional neurological endpoints to better understand the effectsof in ovo PFOS exposure.
Conflict of interest statement
The authors have no conflict of interest to declare.

Author's personal copy
316 M.M. Peden-Adams et al. / Reproductive Toxicology 27 (2009) 307–318
Acknowledgments
The authors thank Carol Foster, Ann Miller, Jan Young, Ron Gos-set, and Norman Ellis for their assistance. The authors also thank thefollowing reviewers for their critical review of the manuscript: Dr.Jennifer Keller and Mr. Jeff Mollenhauer. The research described inthis paper has not been subject to the U.S. Environmental ProtectionAgency (EPA) peer and administrative review and therefore maynot necessarily reflect the views of the EPA; nor does the mentionof trade names or commercial products constitute endorsementor recommendation of use. The research described in this paperhas not been subject to the U.S. Food and Drug Administration(FDA) peer and administrative review and does not reflect the viewsof the FDA; nor does the mention of trade names or commercialproducts constitute endorsement or recommendation of use. TheSouth Carolina Cooperative Fish and Wildlife Research Unit is sup-ported by the South Carolina Department of Natural Resources,Clemson University, the U.S. Fish and Wildlife Service, and the U.S.Geological Survey. This project was supported by internal institu-tional funding (M.M.P.A., D.E.K., K.B., J.C.D., T.R.S., and J.B.F.) and aNevada EPSCOR undergraduate research fellowship (J.B.R.). Techni-cal Contribution No. 5533 of the Clemson University ExperimentStation.
References
[1] Moody CA, Field JA. Perfluorinated surfactants and the environmental impli-cations of their use in fire-fighting foams. Environ Sci Technol 2000;34:3864–70.
[2] Giesy JP, Kannan K. Perfluorochemical surfactants in the environment. EnvironSci Technol 2002;36:146A–52A.
[3] Giesy JP, Kannan K. Global distribution of perfluorooctane sulfonate in wildlife.Environ Sci Technol 2001;35:1339–42.
[4] Apelberg BJ, Goldman LR, Calafat AM, Herbstman JB, Kuklenyik Z, Heidler J.Determination of fetal exposure to polyfluoroalkyl compounds in Baltimore,Maryland. Environ Sci Technol 2007;41:3891–7.
[5] Calafet AM, Kuklenyik Z, Reidy JA, Caudill SP, Tulley JS, Needham LL. Serumconcentrations of 11 polyfluoroalkyl compounds in the U.S. population: datafrom the National Health and Nutrition Examination Survey (NHANES) 1999-2000. Environ Sci Technol 2007;41:2237–42.
[6] Calafat AM, Wong L-Y, Kuklenyik Z, Reidy JA, Needham L. Polyfluoroalkylchemicals in the U.S. population: data from the National Health and Nutri-tion Examination Survey (NHANES) 2003–2004 and comparisons to NHANES1999–2000. Environ Health Perspect 2007;115:1596–602.
[7] Olsen GW, Burris JM, Burlew MM, Mandel JH. Epidemiologic assessmentof worker serum perfluorooctanesulfonate (PFOS) and perfluorooctanoate(PFOA) concentrations and medical surveillance examinations. Occup EnvironMed 2003;45:260–70.
[8] Olsen GW, Church TR, Miller JP, Burris JM, Hansen KJ, Lundberg JK, et al.Perfluorooctanesulfonate and other fluorochemicals in the serum of Ameri-can Red Cross adult blood donors. Environ Health Perspect 2003;111:1892–901.
[9] Olsen GW, Church TR, Hansen KJ, Burris JM, Butenhoff JL. Quantitative eval-uation of perfluorooctanesulfonate (PFOS) and other fluorochemicals in theserum of children. J Children’s Health 2004;2:53–76.
[10] Kannan K, Koistinen J, Beckmen K, Evans T, Gorzelany JF, Hansen KJ, et al.Accumulation of perfluorooctane sulfonate in marine mammals. Environ SciTechnol 2001;35(8):1593–8.
[11] Kannan K, Franson JC, Bowerman WW, Hansen KJ, Jones PD, Giesy JP. Per-fluorooctane sulfonate in fish-eating water birds including bald eagles andalbatrosses. Environ Sci Technol 2001;35(15):3065–70.
[12] Kannan K, Corsolini S, Falandysz J, Fillman G, Kummar KS, Loganathan BG, etal. Perfluorooctanesulfonate in human blood from several countries. EnvironSci Technol 2004;38:4489–95.
[13] Kannan K, Tao L, Sinclair E, Pastva SD, Jude DJ, Giesy JP. Perfluorinated com-pounds in aquatic organisms at various trophic levels in a Great Lakes foodchain. Arch Environ Contam Toxicol 2005;48(4):559–66.
[14] Houde M, Wells RS, Fair PA, Bossart ED, Hohn AA, Rowles TK, et al. Polyfluo-roalkyl compounds in free-ranging bottlenose dolphins (Tursiops truncatus)from the Gulf of Mexico and the Atlantic Ocean. Environ Sci Technol2005;3:6591–8.
[15] Houde M, Bujas TAD, Small J, Wells RS, Fair PA, Bossart ED, et al. Muir DCGBiomagnification of perfluoroalkyl compounds in the bottlenose dolphin foodweb. Environ Sci Technol 2006;40:4138–44.
[16] Keller JM, Kannan K, Taniyasu S, Yamashita N, Day RD, Arendt MD, et al. Per-fluorinated compounds in the plasma of loggerhead and Kemp’s ridley seaturtles from the southeastern coast of the United States. Environ Sci Technol2005;39:9101–8.
[17] Bustnes JO, Borgå K, Erikstad KE, Lorentsen SH, Herzke D. Perfluorinated,brominated, and chlorinated contaminants in a population of lesser black-backed gulls (Larus fuscus). Environ Toxicol Chem 2008;27(6):1383–92.
[18] Molina ED, Balander R, Fitzgerald SD, Giesy JP, Kannan K, Mitchell R, et al.Effects of air cell injection of perfluorooctane sulfonate before incubationon development of the white leghorn chicken (Gallus domesticus) embryo.Environ Toxicol Chem 2006;25(1):227–32.
[19] Verreault J, Houde M, Gabrielsen GW, Berger U, Haukås M, Letcher RJ, etal. Perfluorinated alkyl substances in plasma, liver, brain, and eggs of glau-cous gulls (Larus hyperboreus) from the Norwegian arctic. Environ Sci Technol2005;39(19):7439–45.
[20] Verreault J, Berger U, Gabrielsen GW. Trends of perfluorinated alkyl substancesin herring gull eggs from two coastal colonies in northern Norway: 1983–2003.Environ Sci Technol 2007;41(19):6671–7.
[21] Kennedy GL. Dermal toxicity of ammonium perfluorooctanoate. Toxicol ApplPharmacol 1985;81:348–55.
[22] Kennedy GL. Increase in mouse liver weight following feeding ofammonium perfluorooctanoate and related fluorochemicals. Toxicol Lett1987;39:295–300.
[23] Pastoor TP, Lee KP, Perri MA, Gillies PJ. Biochemical and morphological stud-ies of ammonium perfluorooctanoate-induced hepatomegaly and peroxisomeproliferation. Exp Mol Pathol 1987;47:98–109.
[24] Cook JC, Murray SM, Frame SR, Hurtt ME. Induction of Leydig cell adenomasby ammonium perfluorooctanoate; a possible endocrine-related mechanism.Toxicol Appl Pharmacol 1992;113:209–17.
[25] Biegel LB, Hurtt ME, Frame SR, O’Connor JC, Cook JC. Mechanisms of extrahep-atic tumor induction by peroxisome proliferators in male CD rats. Toxicol Sci2001;60:44–55.
[26] Shipley JM, Hurst CH, Tanaka SS, DeRoos FL, Butenhoff JL, Seacat AM,et al. Trans-activation of PPAR-alpha and induction of PPAR-alpha tar-get genes by perfluorooctane-based chemicals. Toxicol Sci 2004;80(1):151–60.
[27] Luebker DL, Hansen KJ, Bass NM, Butenhoff JL, Seacat AM. Interactionof flurochemicals with rat liver fatty acid-binding protein. Toxicology2002;176:175–85.
[28] OECD. Hazard assessment of perfuorooctane sulfonate (PFOS) and its salts.ENV/JM/RD(2002)17/Final. <http://www.oecd.org/document/58/0,2340,en2649 34379 2384378 1 1 1 1,00.html>; 2002 [accessed 12.05.04].
[29] Seacat AM, Thomford PJ, Hansent KJ, Olsen GW, Case MT, Butenhoff JL.Subchronic toxicity studies on perfluorooctanesulfonate potassium salt incynomolgus monkeys. Toxicol Sci 2002;68:249–64.
[30] Seacat AM, Thomford PJ, Hansen KJ, Clemen LA, Eldridge SR, Elcombe CR, etal. Sub-chronic dietary toxicity of potassium perfluorooctanesulfonate in rats.Toxicology 2003;183:117–31.
[31] Thibodeaux JR, Hanson RG, Rogers JM, Grey BE, Barbee BD, Richards JH, et al.Exposure to perfluorooctane sulfonate during pregnancy in rat and mouse. I.Maternal and prenatal evaluations. Toxicol Sci 2003;74:369–81.
[32] Fort D, Rodgers RL, Guiney PD, Weeks JA. Effects of perfluorooctanesulfonate(PFOS) exposure on steroidogensis in juvenile Xenopus (Silurana) tropicalis.In: Society of environmental toxicology and chemistry—abstract book, 28thannual meeting. 2007 231.
[33] Ankley GT, Kuehl DW, Kahl MD, Jensen KM, Linnum A, Leine RL, et al.Reproductive and developmental toxicity and bioconcentration of perflu-orooctanesulfonate in a partial life-cycle test with the fathead minnow(Pimephales promelas). Environ Toxicol Chem 1985;24:316–2324.
[34] Fair PA, Driscoll E, Mollenhauer MAM, Bradshaw SG, Yun S, Kannan K, et al.Effects of environmentally relevant levels of perfluorooctane sulfonate (PFOS)on clinical parameters and immunological functions; submitted for publica-tion.
[35] Wetzel LT. Rat teratology study, T-3351, final report. Hazelton LaboratoriesAmerica, Inc. Project number 154-160. December 19, 1983 (8EHQ-0399-374).Available on USEPA Public docket AR-226 (No. 226-0014).
[36] Liu RC, Hurtt ME, Cook JC, Biegel LB. Effect of the peroxisome proliferator,ammonium perfluorooctanoate (C8) on hepatic aromatase activity in adultmale Crl;CD BR (CD) rats. Fundam Appl Toxicol 1996;30:220–8.
[37] Liu RC, Hahn C, Hurtt ME. The direct effect of hepatic peroxisome proliferatorson rat Leydig cell function in vitro. Fundam Appl Toxicol 1996;30:102–8.
[38] Yang Q, Xie Y, Depierre JW. Effects of peroxisome proliferators on the thymusand spleen of mice. Clin Exp Immunol 2000;122:219–66.
[39] Yang Q, Xie Y, Eriksson AM, Nelson BD, DePierre JW. Further evidence for theinvolvement of inhibition of cell proliferation and development in thymic andsplenic atrophy induced by the peroxisome proliferator perfluoroctanoic acidin mice. Biochem Pharmacol 2001;62:1133–40.
[40] Yang Q, Abedi-Valugerdi M, Xie Y, Zhao X, Möller G, Nelson BD, et al. Potent sup-pression of the adaptive immune response in mice upon dietary exposure tothe potent peroxisome proliferator, perfluorooctanoic acid. Int Immunophar-macol 2002;2:389–97.
[41] Dewitt JC, Copeland CB, Strynar MJ, Luebke RW. Perfluorooctanoic acid-induced immunomodulation in adult C57BL/6J or C57BL/6N female mice.Environ Health Perspect 2008;116(5):644–50.
[42] Loveless SE, Hoban D, Sykes G, Frame SR, Everds NE. Evaluation of the immunesystem in rats and mice administered linear ammonium perfluorooctanoate(APFO). Toxicol Sci 2008;105(1):86–96.
[43] Nelson DL, Frazier Jr DE, Ericson JE, Tarr MJ, Mathes LE. The effects of perflu-orodecanoic acid (PDFA) on humoral, cellular, and innate immunity in Fisher344 rats. Immunopharmacol Immunotoxicol 1992;14:925–38.

Author's personal copy
M.M. Peden-Adams et al. / Reproductive Toxicology 27 (2009) 307–318 317
[44] Fang X, Zhang L, Feng Y, Zhao Y, Dai J. Immunotoxic effects of perfluo-rononanoic acid on BALB/c mice. Toxicol Sci 2008;105(2):312–21.
[45] Peden-Adams MM, Keller JM, EuDaly JG, Berger J, Gilkeson GS, Keil DE. Sup-pression of humoral immunity in mice following exposure to perfluorooctanesulfonate (PFOS). Toxicol Sci 2008;104(1):144–54.
[46] DeWitt JC, Shnyra A, Badr MZ, Loveless SE, Hoban D, Frame SR, et al. Immuno-toxicity of perfluorooctanoic acid and perfluorooctane sulfonate and therole of peroxisome proliferator-activated receptor alpha. Crit Rev Toxicol2009;39(1):76–94.
[47] Kannan K, Perrotta E, Thomas NJ. Association between perfluorinated com-pounds and pathological conditions in southern sea otters. Environ Sci Technol2006;40(16):4943–8.
[48] Case MT, York RG, Christian MS. Rat and rabbit oral developmental toxicologystudies with two perfluorinated compounds. Int J Toxicol 2001;20:101–9.
[49] Fuentes S, Colomina MT, Vicens P, Franco-Pons N, Domingo JL. Concurrentexposure to perfluorooctane sulfonate and restraint stress during pregnancy inmice: effects on postnatal development and behavior of the offspring. ToxicolSci 2007;98(2):589–98.
[50] Grasty RC, Wolf DC, Grey BE, Lau CS, Rogers JM. Prenatal window of sus-ceptibility to perfluorooctane sulfonate-induced neonatal mortality in theSprague–Dawley rat. Birth Defects Res B: Dev Reprod Toxicol 2003;68:465–71.
[51] Grasty RC, Bjork JA, Wallace KB, Wolf DC, Lau CS, Rogers JM. Effects of prenatalperfluorooctane sulfonate (PFOS) exposure on lung maturation in the perinatalrat. Birth Defects Res B: Dev Reprod Toxicol 2005;74(5):405–16.
[52] Lau C, Thibodeaux JR, Hanson RG, Rogers JM, Grey BE, Stanton ME, et al.Exposure to perfluorooctane sulfonate during pregnancy in rat and mouse.II. Postnatal evaluation. Toxicol Sci 2003;74(2):382–92.
[53] Lau C, Butenhoff JL, Rogers JM. The developmental toxicity of perfluoroalkylacids and their derivatives. Toxicol Appl Pharmacol 2004;198(2):231–41.
[54] Keil DE, Mehlmann T, Butterworth L, Peden-Adams MM. Embryonic expo-sure to PFOS suppresses immunological function in F1 mice. Toxicol Sci2008;103(1):77–85.
[55] Newsted JL, Jones PD, Coady K, Giesy JP. Avian toxicity reference values forperfluorooctane sulfonate. Environ Sci Technol 2005;39(23):9357–62.
[56] Hoff PT, Van de Vijver K, Dauwe T, Covaci A, Maervoet J, Eens M, et al. Evalu-ation of biochemical effects related to perfluorooctane sulfonic acid exposurein organohalogen-contaminated great tit (Parus major) and blue tit (Paruscaeruleus) nestlings. Chemosphere 2005;61(11):1558–69.
[57] Cwinn MA, Jones SP, Kennedy SW. Exposure to perfluorooctane sulfonateor fenofibrate causes PPAR-alpha dependent transcriptional responses inchicken embryo hepatocytes. Comp Biochem Physiol C: Toxicol Pharmacol2008;148(2):165–71.
[58] Yeung LW, Guruge KS, Yamanaka N, Miyazaki S, Lam PK. Differential expres-sion of chicken hepatic genes responsive to PFOA and PFOS. Toxicology2007;237(1–3):111–25.
[59] Peden-Adams M, Alonso K, Godard C, Skipper S, Mashburn W, Hoover J, et al.Effects of environmentally relevant concentrations of 2,3,7,8-TCDD on domes-tic chicken immune function and CYP450 activity: F1 generation and egginjection studies. Chemosphere 1998;37(9–12):1923–39.
[60] Peden-Adams MM, EuDaly JG, Heesemann LM, Smythe J, Miller J, GilkesonGS, et al. Developmental immunotoxicity of trichloroethylene (TCE): stud-ies in B6C3F1 mice. J Environ Sci Health A: Tox Hazard Subst Environ Eng2006;41(3):249–71.
[61] Peden-Adams MM, EuDaly JG, Lee AM, Miller J, Keil DE, Gilkeson GS.Developmental effects of trichloroethylene (TCE) on immunity: studies inMRL (+/+) mice. J Environ Sci Health A: Tox Hazard Subst Environ Eng A2008;43(12):1402–9.
[62] Dietert RR, Holsapple MP. Methodologies for developmental immunotoxicity(DIT) testing. Methods 2007;41(1):123–31.
[63] Holsapple MP, Paustenbach DJ, Charnley G, West LJ, Luster MI, Dietert RR, etal. Symposium summary: children’s health risk—what’s so special about thedeveloping immune system? Toxicol Appl Pharmacol 2004;199(1):61–70.
[64] Holsapple MP, Burns-Naas LA, Hastings KL, Ladics GS, Lavin AL, Makris SL, etal. A proposed testing framework for developmental immunotoxicology (DIT).Toxicol Sci 2005;83(1):18–24.
[65] Weeks BA, Anderson DP, DuFour AP, Fairbrother A, Goven AJ, Lahvis GP, etal. Immunological biomarkers to assess environmental stress. In: Huggett RJ,Kimerle RA, Mehrle Jr PM, Bergman HL, editors. Biomarkers: biochemical,physiological, and histological markers of anthropogenic stress. Boca Raton(FL): Lewis Publishers; 1992. p. 211–34.
[66] Fairbrother A, Smits J, Grasman K. Avian immunotoxicology. J Toxicol EnvironHealth B: Crit Rev 2004;7(2):105–37.
[67] Henshel DS, DeWitt J, Troutman A. Avian egg injections. In: Maines MD, CostaLG, Hodgson E, Reed DJ, Sipes IG, editors. Current protocols in toxicology, vol.S14. 2002, 13.4.1-13.4.19.
[68] Scott TR, Savage ML. Immune cell proliferation in the harderian gland: an avianmodel. Microsc Res Technol 1996;34:149–55.
[69] Grasman KA, Fox GA, Scanlon PF, Ludwig JP. Organochlorine-associatedimmunosuppression in prefledgling caspian terns and herring gulls fromthe Great Lakes: an ecoepidemiological study. Environ Health Perspect1996;104(S4):829–42.
[70] Hudson L, Hay FC, editors. Practical immunology. Oxford: Blackwell Scientific;1989. p. 252–4.
[71] Henshel DS. Developmental neurotoxic effects of dioxin and dioxin-likecompounds on domestic and wild avian species. Environ Toxicol Chem1998;17:88–98.
[72] Henshel DS, Martin JW, DeWitt JC. Brain asymmetry as a potential biomarkerfor developmental TCDD intoxication: a dose–response study. Environ HealthPerspect 1997;105(7):718–25.
[73] Harr KE. Clinical chemistry of companion avian species: a review. Vet Clin Path2002;31(3):140–51.
[74] Doneley B. Biochemistries: What they do and don’t do. In: Proceeding ofthe small animal veterinary association. 32nd Annual congress, Sydney, Aus-tralia, August 19–23, 2007. <http://www.vin.com/proceedings/Proceedings.plx?CID=WSAVA2007&PID=18046&O=Generic> [accessed June 2008].
[75] Smith KG, Hunt JL. On the use of spleen mass as a measure of avian immunesystem strength. Oecologia 2004;138:28–31.
[76] Ali NMH, Behnke JM. Observations on the gross changes in the secondarylymphoid organs of mice infected with Nematospiroides dubius. J Helminthol1985;59:167–74.
[77] John JL. The avian spleen: a neglected organ. Q Rev Biol 1994;69:327–51.[78] John JL. Parasites and the avian spleen: helminths. Biol J Linnean Soc
1995;54:87–106.[79] Molyneux DH, Cooper JE, Smith WJ. Studies on the pathology of an avian
trypanosome (T. bouffardi) infection in experimentally infected canaries. Par-asitology 1983;87:49–54.
[80] Vincent AL, Ash LR. Splenomegaly in birds (Meriones unguiculatus) infectedwith Brugia malayi (Nematoda: Filarioidea) and related species. Am J TropMed Hyg 1979;27:514–20.
[81] Watkins RA, Moshier SE, O’Dell WD, Pinter AJ. Splenomegaly and reticulocyto-sis caused by Babesia microti infections in natural populations of the montanevole, Microtus montanus. J Protozool 1991;38:573–6.
[82] Henshel DS, Martin JW, Norstrom R, Whitehead P, Steeves JD, Cheng KM. Mor-phometric abnormalities in brains of great blue heron hatchlings exposed inthe wild to PCDDs. Environ Health Perspect 1995;103(S4):61–6.
[83] Henshel DS, Martin JW, Best D, Cheng KM, Elliott JE, Rosenstein D, etal. Evaluating gross brain asymmetry: A potential biomarker for 2,3,7,8-tetrachlorodibenzo-p-dioxin-related neurotoxicity. In: Bengtson DA, HenshelDS, editors. Environmental toxicology and risk assessment: biomarkers andrisk assessment, vol. 5th, ASTM STP 1306 American Society for Testing andMaterials, Philadelphia; 1996. p. 230–8.
[84] Henshel DS, Martin JW, Norstrom RJ, Elliott J, Cheng KM, DeWitt JC. Mor-phometric brain abnormalities in double-crested cormorant chicks exposedto polychlorinated dibenzo-p-dioxins, dibenzofurans, and biphenyls. J GreatLakes Res 1997;23(1):11–26.
[85] Uhlíkova P, Paclt I, Vaneckova M, Morcinek T, Seidel Z, Krasensky J, et al. Asym-metry of basal ganglia in children with attention deficit hyperactivity disorder.Neuro Endocrinol Lett 2007;28(5):604–9.
[86] Herbert MR, Ziegler DA, Deutsch CK, O’Brien LM, Kennedy DN, Filipek PA, et al.Brain asymmetries in autism and developmental language disorder: a nestedwhole-brain analysis. Brain 2005;128(1):213–26.
[87] Leonard CM, Lombardino LJ, Walsh K, Eckert MA, Mockler JL, Rowe LA, et al.Anatomical risk factors that distinguish dyslexia from SLI predict reading skillin normal children. J Commun Disord 2002;35(6):501–31.
[88] Leonard C, Eckert M, Given B, Virginia B, Eden G. Individual differences inanatomy predict reading and oral language impairments in children. Brain2006;129(12):3329–42.
[89] Leonard CM, Kuldau JM, Maron L, Ricciuti N, Mahoney B, Bengtson M, etal. Identical neural risk factors predict cognitive deficit in dyslexia andschizophrenia. Neuropsychology 2008;22(2):147–58.
[90] Johansson N, Fredriksson A, Eriksson P. Neonatal exposure to perfluorooctanesulfonate (PFOS) and perfluorooctanoic acid (PFOA) causes neurobehaviouraldefects in adult mice. Neurotoxicology 2008;29(1):160–9.
[91] Fuentes S, Vicens P, Colomina MT, Domingo JL. Behavioral effects inadult mice exposed to perfluorooctane sulfonate (PFOS). Toxicology2007;242(1–3):123–9.
[92] Austin ME, Kasturi BS, Barber M, Kannan K, MohanKumar PS, MohanKu-mar SM. Neuroendocrine effects of perfluorooctane sulfonate in rats. EnvironHealth Perspect 2003;111(12):1485–9.
[93] Burton JE, Dorociak IR, Schwedler TE, Rice CD. Circulating lysozyme and hep-atic CYP1A activities during a chronic dietary exposure to tributyltin (TBT)and 3,3′ ,4,4′ ,5-pentachlorobiphenyl (PCB-126) mixtures in channel catfish,Ictalurus punctatus. J Toxicol Environ Health A 2002;65:589–602.
[94] Greenfield J, Bigland CH. Detection of lysozyme in developing avian embryos.Poult Sci 1971;50(6):1748–53.
[95] Board RG, Fuller R. Non-specific antimicrobial defenses of the avian egg,embryo, and neonate. Biol Rev 1977;49:15–49.
[96] Guiney P, Talent L, Melson D, EuDaly J, Kannan K, Peden-Adams MM. Immuno-logical alterations in western fence lizards following oral exposure to PFOS. TheToxicologist, (Supplement to Toxicological Sciences); 2007, 96(S-1).
[97] Peden-Adams MM, Kannan K, EuDaly J, Hessemann L, Kucklick JR, ArendtMD, et al. Perfluorinated hydrocarbons measured in sea turtle blood correlateto modulations in plasma chemistry values and immune function measure-ments. In: Society of environmental toxicology and chemistry (SETAC), 25thannual meeting—abstract book; 2004.
[98] Peden-Adams MM, Romano T, Rice CD, EuDaly J, Hessemann L, Muir D, et al.Immune function and clinical blood parameters correlate with perfluorinatedhydrocarbon concentrations in bottlenose dolphins. In: Society of environ-mental toxicology and chemistry (SETAC), 25th annual meeting—abstractbook; 2004.
[99] Osserman EF, Lawlor DP. Serum and urinary lysozyme (muramidase) in mono-cytic and monomyelocytic leukemia. J Exp Med 1966;124:921–52.

Author's personal copy
318 M.M. Peden-Adams et al. / Reproductive Toxicology 27 (2009) 307–318
[100] Brierre J, Barthelemy J, Bachard G, Fiet J. Interet de la Determination deL’Activite Muramidasique Serique et Urinaire dans les Syndromes Myelopro-liferatifs Chroniques, Subaigus et les Myeloblastoses Partielles. II. Applicationa Divers Cas Pathologiques. Clin Chim Acta 1974;50:265.
[101] Falchuk KR, Perrotto JL, Isselbacher KJ. Serum lysozyme in Crohn’s disease andulcerative colitis. NEJM 1975;292(8):395–7.
[102] Hughes WT, Koblin BA, Rosenstein BJ. Lysozyme activity in cystic fibrosis.Pediatr Res 1982;16(10):874–6.
[103] Torsteinsdóttir I, Håkansson L, Hällgren R, Gudbjörnsson B, Arvidson N-G,Venge P. Serum lysozyme: a potential marker of monocyte/macrophage activ-ity in rheumatoid arthritis. Rheumatology 1999;38:1249–54.
[104] Fernandez-de-Mera IG, Vicente J, Hofle U, Rodriguez O, Gaspar-Lopez E, Gor-tazar C. The effects of sex and age on phytohaemagglutinin skin-testing ofdeer. NZ Vet J 2008;56(2):71–3.
[105] Warren DC. Distinguishing sex of chicks at hatching. Bulletin 307, agriculturalexperiment station, kansas state college of agriculture and applied science.<www.oznet.ksu.edu/historicpublications/pubs/SB307.PDF>; 1942 [accessedJune 2008].
[106] Furuya M, Sasaki F, Hassanin AMA, Kuwahara S, Tsukamoto Y. Effects ofbisphenol-A on the growth of comb and testes of male chicken. Can J Vet Res2003;67:68–71.
[107] Burlington H, Lindeman VF. Effect of DDT on testes and secondary sex char-acteristics of white leghorn cockerels. In: Proceedings of the society forexperimental biology and medicine, vol. 74. 1950. p. 48–51.
[108] Blomqvist A, Berg C, Holm L, Brandt I, Ridderstrale Y, Brunstrom B. Defectivereproductive organ morphology and function in domestic rooster embry-
onically exposed to o,p-DDT or ethynylestradiol. Biol Reprod 2006;74:481–6.
[109] Mayer JA, Chuong C-M, Widelitz MR. Rooster feathering, androgenic alopecia,and hormone-dependent tumor growth: what is in common? Differentiation2004;72:474–88.
[110] Jensen AA, Leffers H. Emerging endocrine disrupters: perfluoroalkylated sub-stances. Int J Androl 2008;31(2):161–9.
[111] Peden-Adams MM, EuDaly JG, Dabra S, EuDaly A, Heesemann L, Smythe J, et al.Suppression of humoral immunity following exposure to the perfluorinatedinsecticide sulfluramid. J Toxicol Environ Health Part A 2007;70:1130–41.
[112] Liu C, Du Y, Zhou B. Evaluation of estrogenic activities and mechanism of actionof perfluorinated chemicals determined by vitellogenin induction in primarycultured tilapia hepatocytes. Aquat Toxicol 2007;85(4):267–77.
[113] Dauwe T, Van de Vijver K, De Coen W, Eens M. PFOS levels in the blood andliver of a small insectivorous songbird near a fluorochemical plant. Environ Int2007;33(3):357–61.
[114] Beach SA, Newsted JL, Coady K, Giesy JP. Ecotoxicological evaluation ofperfluorooctanesulfonate (PFOS). Rev Environ Contam Toxicol 2006;186:133–74.
[115] Olivero-Verbel J, Tao L, Johnson-Restrepo B, Guette-Fernández J, Baldiris-AvilaR, O’byrne-Hoyos I, et al. Perfluorooctanesulfonate and related fluorochem-icals in biological samples from the north coast of Colombia. Environ Pollut2006;142(2):367–72.
[116] DeWitt JC, Meyer EB, Henshel DS. Environmental toxicity studies using chick-ens as surrogates for wildlife: effects of vehicle volume. Arch Environ ContamToxicol 2005;48(2):260–9.
Recommended


