
Effect of unmodified rice straw on the properties of ricestraw/polycaprolactone composites
Roshanak Khandanlou • Mansor B. Ahmad •
Kamyar Shameli • Mohd Zobir Hussein •
Norhazlin Zainuddin • Katayoon Kalantari
Received: 9 April 2014 / Accepted: 10 June 2014
� Springer Science+Business Media Dordrecht 2014
Abstract The composite materials based on rice straw (RS) fiber and polycap-
rolactone (PCL) were prepared by a solution-casting method and characterized. The
composites were prepared using different fiber loadings (1.0, 3.0, 5.0, and 7.0 wt%).
The prepared composites (Cs) were characterized by using powder X-ray diffraction
(XRD), scanning electron microscopy (SEM), electro-optical microscopy, Fourier
transform infrared spectroscopy (FT-IR), and thermogravimetric analysis, and
mechanical properties were investigated. The XRD results showed that the intensity
of the peaks decreased with the increase of RS content from 1.0 to 7.0 wt% in
comparison with PCL peaks. SEM micrographs indicated poor adhesion between
RS and PCL matrices, and FT-IR spectroscopy showed that, with the increase of
loading percentages of RS, the intensity of the peaks is decreased from 1.0 to
7.0 wt%, and the interaction between RS and PCL was a physical interaction.
Thermal stability was decreased with increasing the RS contents. Tensile mea-
surement showed an increase in tensile modulus from 1.0 to 7.0 wt% loading of RS
into the PCL, but a decrease in tensile strength and elongation at the break as the RS
contents are increased, although there is a modest increase in tensile strength of the
Cs material with 3.0 wt% loading of RS.
Keywords Polycaprolactone � Composites � Rice straw � Mechanical � Thermal
properties
R. Khandanlou (&) � M. B. Ahmad (&) � K. Shameli (&) � M. Z. Hussein � N. Zainuddin �K. Kalantari
Department of Chemistry, Faculty of Science, Universiti Putra Malaysia UPM, 43400 Serdang,
Selangor, Malaysia
e-mail: [email protected]
M. B. Ahmad
e-mail: [email protected]
K. Shameli
e-mail: [email protected]
123
Res Chem Intermed
DOI 10.1007/s11164-014-1746-y

Introduction
The growing of biodegradable polymers has attracted increasing attention due to the
environmental problem attributable to deposition involving waste plastic [1].
Polycaprolactone (PCL) is a biodegradable as well as biocompatible polyester
which has lots of potential applications in devices which are related to the
biomedical field and also in agricultural use. Until now, large-scale application of
PCL has been limited due to its comparatively high cost and to some lower intrinsic
properties. Mixing biodegradable polymers with other natural or synthetic materials
has proved to be a powerful and economical method in solving this problem [2].
Recently, various types of cellulose-based natural fibers, for instance sisal, jute
and hemp, have been successfully incorporated straight into biodegradable polymers
to produce the necessary materials at competitive prices. Agricultural by-products
like rice husk, wheat straw, corn stalk, etc., are alternative lignocellulosic products,
which have been produced in vast numbers each year. So far, the utilization of these
kinds of agricultural residues has not acquired sufficient consideration, and most of
them are simply flared or applied as animal feed [3].
Rice straw fiber may be considered as having great potential as a reinforcing filler
for thermoplastic composites due to its lingo-cellulosic characteristics [4].
Straw is considered a natural composite material, as it is composed mainly of
polysaccharides (cellulose and hemicellulose) and lignin. The first two components
are hydrophilic, and the second one is hydrophobic. Even so, they are hardly soluble
in water and, in organic solvents, only in part, because of the formation of hydrogen
bonds between polysaccharides along with adhesion from the lignin to the
polysaccharides. However, agricultural residues represent a plentiful, cheap and
readily accessible source of renewable lignocellulosic biomass, in particular for the
production involving chemical compounds, such as lignin and hemicellulose, for the
polymer industry with the exception of producing paper from cellulose [5].
The use of composite materials reinforced with natural fibers under diverse
environmental circumstances has become universal in recent years. A large number
of natural fibers have been used as a powerful reinforcement in polymer materials.
Fillers in fiber or particle form are processed with polymer materials to obtain the
desired thermal, mechanical and electrical properties. The properties of the fiber
composite products are highly dependent on the properties of the fiber, as well as the
microstructural parameters such as the diameter, length, distribution, orientation,
and packing arrangement of the fibers. The advantages of the natural fibers as
reinforcements in plastics are their non-abrasive characteristics, biodegradability,
and low power consumption along with low cost. Furthermore, natural fibers have
low density along with high specific properties [6].
Polymer composites are prepared by utilizing polymers and compatible natural or
synthetic fibers [7]. The common polar and hydrophilic fibers are inherently
incompatible with nonpolar matrices and hydrophobic polymers, and the incom-
patibility may cause problems in the processing of composite materials and the
material properties. Hydrogen bonds can be formed between the fibers which are
hydrophilic in nature, so that the fibers have a tendency to agglomerate into bundles
R. Khandanlou et al.
123

and distribute unevenly throughout the matrix of non-polar polymer composition
during processing [8, 9].
In this work, rice straw/polycaprolactone composites (RS/PCL-Cs) were
prepared with various percentage loadings of rice straw (1.0, 3.0, 5.0, and 7.0
wt%) in dichloromethane at room temperature, using PCL as a polymer matrix and
rice straw as a filler by a solution-casting method, and the effects of fiber loading on
the properties of composite materials were studied.
Experimental procedure
Materials
All chemicals used in this study were of analytical grade and used without further
purification. Rice straw was obtained from a local farm (Bukit Tinggi, Kedah,
Malaysia). Polycaprolactone (PCL) was from Sigma-Aldrich (USA). Dichloro-
methane (CH2Cl2) was used as a solvent (Qrec, Malaysia). All glassware used in the
experimental procedures was cleaned in a fresh solution of HNO3/HCl (3:1, v/v),
washed thoroughly with double-distilled water, and dried before use.
Preparation of PCL/RS composites
For the synthesis of RS/PCL-Cs, different ratios of RS (1.0, 3.0, 5.0, and 7.0 wt%)
were suspended in certain amounts of dichloromethane with stirring for half an
hour, and then 5 g PCL was dissolved in 50 ml dichloromethane, followed by RS
suspension being added slowly to a PCL solution with vigorous stirring. After
addition of the RS suspension, stirring was continued for an additional hour to get
the RS well dispersed in the principal composite. The suspensions were finally
poured into Petri dishes and kept for 2 days until icompletely dry. Finally, solidified
films with a thickness of approximately 0.5 mm were obtained. All the experiments
were conducted at ambient temperature.
Characterization methods and instruments
In order to investigate the morphology of RS and RS/PCL-Cs, cross-section photos
were taken with SEM (LEO1455 SEM; LEO & Leica, Cambridge, UK). Electro-
optical microscopy (EOM) was used to observe the structure of the samples. The
powder X-ray diffraction (XRD) with Cu Ka radiation was applied to measure the
crystallinity of the samples. Thermogravimetric analysis (TGA) and differential
thermal gravimetric (DTG) were used to study the thermal behavior of the samples.
Fourier transform infrared (FT-IR) in the range of 400–4,000 cm-1 was used to
study the structures of the RS, PCL and RS/PCL-Cs. The FT-IR spectra were
recorded using PerkinElmer 100 Series FT-IR 1650 spectrophotometer. Tensile
strength, Young’s modulus, and elongation at break were measured using Ian nstron
Universal Testing Machine model INSTRON 4302 at constant cross-head speed of
Properties of RS/PCL composites
123
5 mm/min and a load of 1 kN. Four samples were used for the tensile test and the
average values were calculated from five runs for each sample.
Result and discussion
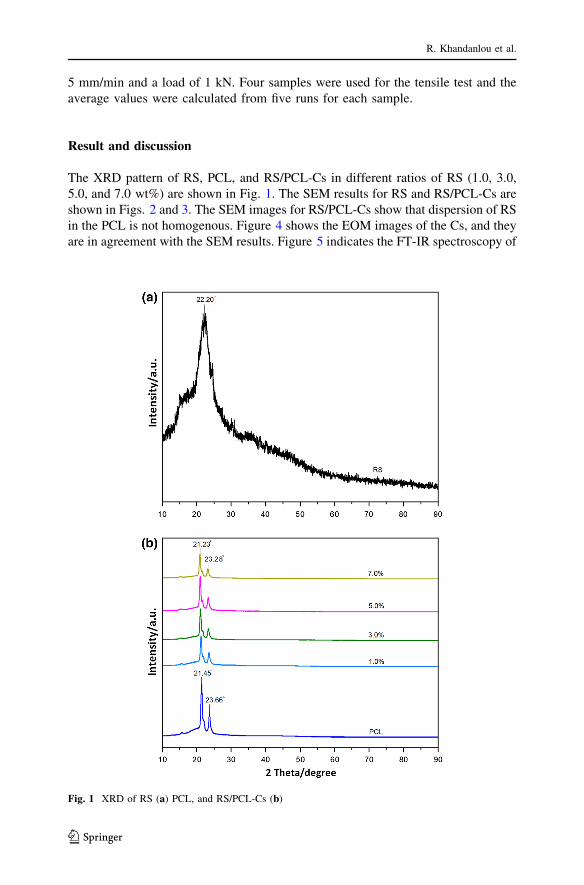
The XRD pattern of RS, PCL, and RS/PCL-Cs in different ratios of RS (1.0, 3.0,
5.0, and 7.0 wt%) are shown in Fig. 1. The SEM results for RS and RS/PCL-Cs are
shown in Figs. 2 and 3. The SEM images for RS/PCL-Cs show that dispersion of RS
in the PCL is not homogenous. Figure 4 shows the EOM images of the Cs, and they
are in agreement with the SEM results. Figure 5 indicates the FT-IR spectroscopy of
Fig. 1 XRD of RS (a) PCL, and RS/PCL-Cs (b)
R. Khandanlou et al.
123

RS, PCL and its Cs; it reveals that the interaction between PCL and RS is a physical
interaction. The mechanism of the interaction of PCL with RS showed that the
interaction was a physical interaction (Fig. 6).
Fig. 2 Scanning electron microscopy micrograph of RS
Fig. 3 Scanning electron microscopy micrographs of RS/PCL-Cs with a–d 1.0, 3.0, 5.0, and 7.0 wt%RS, respectively
Properties of RS/PCL composites
123

TGA analysis indicated that thermal stability decreased with increasing RS
content (Fig. 7). Tensile measurement (Fig. 8) shows that with increasing RS
content the tensile strength and elongation at break gradually decreases and tensile
modulus improves with increasing RS content.
Powder XRD analysis
Figure 1a, b shows the XRD pattern of RS, and RS/PCL-Cs with different RS
concentrations, respectively. The XRD pattern of the neat RS (Fig. 1a), shows the
diffraction peak in 2h = 22.20�, Due to its hydrophilic nature of RS, only a small
amount of RS is intercalated by PCL. The XRD pattern of PCL (Fig. 1b) shows a
diffraction peak in 2h = 21.45� and 23.66�. After incorporation of RS within PCL,
the diffraction peak of all RS/PCL-Cs had a small shift to the lower value of 2hangle, corresponding to the formation of composites. It can be seen that the intensity
of the diffraction peak in RS/PCL-Cs decreases with the increasing of RS content
(Fig. 1b). As the chain of PCL was the main component of the mixture, the
crystalline peak position was almost similar to the PCL; it shows that the PCL
matrix covers the RS, therefore the peaks of RS could not appear in the XRD
pattern.
Fig. 4 EOM images of RS/PCL-Cs with a–d 1.0, 3.0, 5.0, and 7.0 wt% RS respectively
R. Khandanlou et al.
123

Fig. 5 Fourier transforms infrared spectra of RS (a), PCL, and its composites with 1.0, 3.0, 5.0, and7.0 wt% RS (b)
Fig. 6 Schematic illustration of preparation of RS/PCL-Cs
Properties of RS/PCL composites
123
Morphology study
Figures 2 and 3 show the surface morphology images of RS, and RS/PCL-Cs,
respectively. Figure 4 shows EOM images of the RS/PCL-Cs. Figure 2 indicates
through SEM micrographs that neat RS possesses a rough surface. The SEM
micrograph of RS/PCL-Cs (Fig. 3) shows that the RS in composites agglomerated
into bundles distributed uniformly in the matrix. This poor adhesion was due to the
formation of hydrogen bonds between the RS and the disparate hydrophilicities of
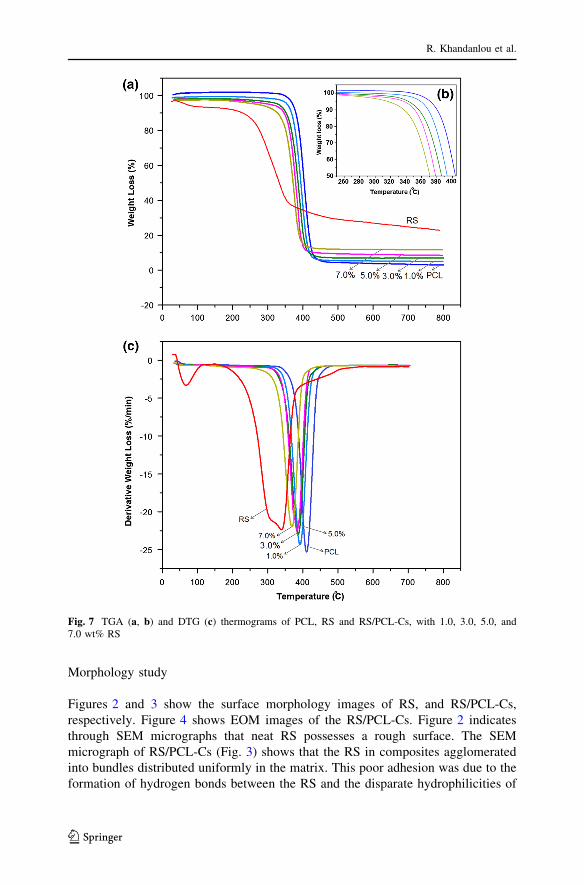
Fig. 7 TGA (a, b) and DTG (c) thermograms of PCL, RS and RS/PCL-Cs, with 1.0, 3.0, 5.0, and7.0 wt% RS
R. Khandanlou et al.
123

PCL and RS [9]. The low interaction between the two components, the
immiscibility of PCL and RS seen through the holes corresponding to unprocessed
RS under SEM, and lack of interfacial adhesion are the sources of shaping such a
rough surface. It demonstrated that the fibers were solely attached with the PCL that
relates to poor fiber wetting. After adding 3.0 wt% unmodified RS as shown in
Fig. 3b, some interactions form and the surface gets smoother, while there is still
some incompatibility between the filler and the polymer.
Furthermore, it can be seen in EOM images (Fig. 4) that the dispersion of RS in
the PCL matrix is inhomogeneous and the larger spherical shapes indicate the
agglomeration of RS in PCL, except in 3.0 wt% of RS. The structure of RS/PCL-Cs
Fig. 8 Tensile strength (a),tensile modulus (b) andelongation at break (c) of RS/PCL-Cs in different wt% of RS
Properties of RS/PCL composites
123

confirmed that, in the composite with 3.0 wt% RS (Fig. 4b), the external surface of
the composite develops spherulitic morphology, and the RS is more homogeneous
compared with other percentage loadings of RS, which is also consistent with the
observation of the SEM results.
FT-IR chemical analysis
Figure 5a, b shows the FT-IR spectra of RS, PCL, and RS/PCL-Cs with different
ratios of RS. In the FT-IR spectrum of neat RS (Fig. 5a), the absorption peaks at
3,377 and 2,933 cm-1 are attributed to stretching vibrations of –OH groups and the
C–H stretching, respectively [10]. The smaller shoulder peak at 1,735 cm-1 in the
RS is attributed to the aliphatic esters in lignin or hemicelluloses. The intense band
at 1,646 cm-1 is assigned to olefinic C=C stretching vibration [11]. The peak at
1,444 cm-1 is ascribed to the aromatic C=C stretch of aromatic vibration in bound
lignin [10]. The absorbance peaks in the 1,376–1,363 cm-1 originate from C–H
bending [12]. The region of 1,200–1,000 cm-1 illustrates C–O stretching and
deformation bands in cellulose, lignin, and residual hemicelluloses [13]. The peaks
observed in the region of 890–260 cm-1 are assigned to the linkages of glycoside
deforming with ring vibration and OH bending [14].
In the FT-IR spectrum of PCL (Fig. 5b), the peaks located at 2,943, 2,863, and
1,723 cm-1 are related to the stretching vibration of –CH2 and vibration of –C=O
bonds, respectively. The peak at 1,167 cm-1 is assigned to C–O stretching [15].
The IR spectra of RS/PCL-Cs (Fig. 5b) showed that the intensity of the peaks
are decreased with the increase of loading percentages of RS from 1.0 to 7.0 wt%
in comparison with the PCL peaks. It shows the existence of the RS in the PCL
matrix and formation of RS/PCL-Cs. In addition, RS has no chemical interaction
with the PCL matrix and the interaction may be a physical interaction since no
new band or any considerable shift occurred in comparison with the IR spectrum
of PCL.
According to the above results, it can be seen in Fig. 6 which PCL can be
interacted with RS via the hydrogen bonding between the –OH groups available in
RS and the carbonyl group present in the PCL. It shows the interaction between RS
and PCL can be a physical interaction.
Thermogravimetric analysis
TGA is a quantitative way of measuring the variation of the mass of product
encountered to manipulate the temperature range program. In addition, it records the
temperature of the region of the weight loss as well as the decomposition of the
maximum temperature. TGA detects one or a number of steps associated with the
loss of weight from room temperature to 800 �C. This kind of measurement was
conducted to specify the thermal stability of the samples. The mass loss of the
sample as a result of the volatilization associated with degraded by-product is
controlled as a function of temperature.
Figure 7a shows typical TGA thermograms of the PCL, RS/PCL-Cs, RS, and
degradation temperature regarding 50.0 wt% weight loss of PCL and its composites
R. Khandanlou et al.
123

(Fig. 7b). PCL has a two-step mechanism of degradation; in the first step
(200–400 �C), there is random chain scission via pyrolysis of the ester groups,
releasing of CO2, H2O and hexanoic acid; after that, in the second step
(400–530 �C), e-caprolactone (cyclic monomer) is constituted as a product of a
decompression process of depolymerization [16].
TGA of RS shows three stages of degradation: the first stage (50–130 �C) is
related to the removal of absorbed moisture; this moisture content could play an
important role in the degradation processes owing to the OH groups available in
water being more reactive compared to the OH groups of the RS. The second step of
thermal degradation happens at 180–360 �C and is mainly assigned to the
degradation of cellulosic materials like hemicellulose and cellulose; and the third
step of the weight loss (360–480 �C) is actually related to the degradation of non-
cellulosic substances in the RS [17].
It was shown in the TGA thermograms that the RS/PCL-Cs exhibit lower onset
temperature for the thermal degradation compares to neat PCL. PCL indicates an
onset temperature of 310.97 �C, which decreased to 277.18, 281.72, 286.26, and
300.83 �C when 7.0, 5.0, 3.0, and 1.0 wt% of RS, respectively, incorporated into the
PCL. The lower onset temperature for the thermal degradation of composites
compared to PCL is due to the low thermal stability of RS [17].
It can be seen that the RS/PCL-Cs in higher loading percentages of RS have a
lower onset temperature, and shows thermal stability reduced along with increasing
amounts of RS. This result can be related to a looser structure of PCL caused by the
expansion of PCL which induced by RS [18].
The DTG curve of PCL in Fig. 7c exhibits a single peak at 409.04 �C. This kind
of decomposition refers to the entire dissolution of PCL. The DTG curve of RS
shows three peaks at 61.29, 300.21, and 336.32. The DTG curves show that the Tmax
of the composites which correspond to the maximum degradation rate is lower, that
is 390.81, 386.27, 382.91, and 369.45 �C, for PCL containing 1.0, 3.0, 5.0, and
7.0 wt% of RS, respectively, compared to the PCL. The reduction in the degradation
temperature is the result of the low thermal stability of the RS which leads to the
heat transfer and increases the diffusion of volatile substances released by the
products. Table 1 shows the degradation temperature of RS, PCL, and composites
according to TGA, and DTG.
Table 1 Degradation temperature at 5.0, 10.0, 50.0, and 80.0 % fiber degradation, obtained by the TGA
and DTG
Sample T5 % (�C) T10 % (�C) T50 % (�C) T80 % (�C) Tmax (�C) Residue at 500 �C (%)
RS 163.56 219.95 331.78 – 336.32 30.0
PCL 370.83 380.01 404.16 418.50 409.04 5.0
1.0 % 356.75 368.10 393.06 409.27 390.81 5.9
3.0 % 331.43 354.48 386.26 400.45 386.27 7.2
5.0 % 309.08 346.40 378.15 395.34 382.91 9.8
7.0 % 277.18 327.24 370.37 387.51 369.45 12.5
Properties of RS/PCL composites
123

Mechanical properties
Tensile strength
The effect of fiber loading on the tensile strength of the RS/PCL-Cs is shown in
Fig. 8a. It can be seen that the addition of RS reduced the tensile strength of PCL,
even though there is a modest increase in tensile strength of the Cs material with
3.0 wt% loading of fiber. Beyond this point, the tensile strength reduced with
increasing the amount of RS. The highest tensile strength which is attributed to
3.0 wt% fiber loading is 16.95 MPa. The decrease in tensile strength with increasing
the amount of fiber may be as a result of the weak adhesion or interaction between
PCL and RS that occurs due to agglomeration. The composites of PCL at high fiber
loading tend to form agglomerates [19]. This was due to the lack of insufficient PCL
to wet the RS, caused in an incompetent transfer of stress when stress is used on the
tensile specimens. Increasing the tensile strength of 3.0 wt% RS loading demon-
strates the capability to absorb the stress which is transferred from the PCL matrix
by RS. In Cs along with higher amount of filler, there is a greater trend for filler-to-
filler interaction to happen [20].
Hence, more holes are generally formed, starting the formation of cracks and the
extension in the Cs material, in comparison with a lower amount of fiber loadings.
The decrease in tensile strength shows that there was no improvement within the
interaction between PCL and fiber.
Tensile modulus
Figure 8b shows that the tensile modulus was raised along with increasing the fiber
content. The increase of fiber content caused agglomeration, and therefore affects
the rigidity of the Cs. The increase in the tensile modulus is possibly due to the
greater stiffness of the fibers compared to the matrix [21]. It was mentioned that the
most eminent effect of the fibers is the increase of the Cs modulus. The tensile
modulus is a measure of the toughness of an elastic material and the growing
tendency of the tensile modulus to test the behavior of the rigidity of exposures
made of composite material. When these composites are subjected to tensile stress
within the elastic range, the Cs materials do not stretch a lot and will behave like a
rigid Cs product. The overall increase in modulus implies the capability of the fiber
to represent greater toughness to the Cs.
Elongation at break
Reduction in elongation at break is accompanied with an increase in RS content as
shown in Fig. 8c. It is probably caused by the presence of large agglomerates which
make the composites more fragile. The decrease in the elongation at break showed
that the ductility of the matrix gradually reduces with the increase of contents of RS.
The lignocellulose fibers such as RS are responsible for decreasing the elongation.
The PCL matrix supplies ductility while RS shows a brittle behavior with a
subsequent decrease in stiffness of the Cs. Adding RS will be interrupted by PCL
R. Khandanlou et al.
123

segment mobility and therefore converting the Cs to be more brittle as the amount of
RS increased in the Cs. Theoretically, a low percentage of elongation of the Cs
indicates that the Cs are brittle or have low ductility [22].
Conclusions
RS/PCL-Cs with different percentage loadings of RS were successfully prepared
through a solution casting of PCL and RS. The effect of different percentage
loadings of RS into the PCL was studied. The tensile strength and elongation at
break of the composites deceases by increasing the RS content, due to the poor
interaction between PCL and RS, but there is a slight increase in 3.0 wt% fiber
loading. The tensile modulus increases with the increase of loading percentages of
RS. The XRD results show, after incorporation of RS into the PCL, that the Cs make
a small shift to a lower angle and the intensity of peaks decreases with the increase
of RS content from 1.0 to 7.0 wt%; this result indicating the formation of the RS/
PCL-Cs. TGA characterization shows that the thermal stability of the RS/PCL-Cs
decreased with increasing the RS content compared to pristine PCL. The SEM
micrographs of composites illustrates the presence of holes, which would be due to
the weak adhesion between the fiber and matrix. FT-IR results exhibited a decrease
in the intensity of peaks with the increase of RS content from 1.0 to 7.0 wt%, In
addition, no chemical interaction between PCL and RS was observed, and the
interaction can be a physical interaction since there is no new band or any
considerable shift in comparison with the IR spectrum of PCL.
Acknowledgments The authors thank University Putra Malaysia (UPM) for its financial support. The
authors are also grateful to the staff of the Department of Chemistry UPM for their help in this research,
and to the Institute of Bioscience (IBS/UPM) for technical assistance.
References
1. D. Darwis, H. Mitomo, T. Enjoji, F. Yoshii, K. Makuuchi, Polym. Degrad. Stab. 62(2), 259 (1998)
2. L. Yu, K. Dean, L. Li, Prog. Polym. Sci. 31(6), 576 (2006)
3. Q. Zhao, J. Tao, R. Yam, A.C. Mok, R.K. Li, C. Song, Polym. Degrad. Stab. 93(8), 1571 (2008)
4. F. Yao, Q. Wu, Y. Lei, Y. Xu, Ind. Crops. Prod. 28(1), 63 (2008)
5. B. Xiao, X. Sun, R. Sun, Polym. Degrad. Stab. 174(2), 307 (2000)
6. S. Annie Paul, A. Boudenne, L. Ibos, Y. Candau, K. Joseph, S. Thomas, Composites A. 39(9), 1582
(2008)
7. M. Wollerdorfer, H. Bader, Ind. Crops. Prod. 8(2), 105 (1998)
8. M. Kazayawoko, J. Balatinecz, L. Matuana, J. Mater. Sci. 34(24), 6189 (1999)
9. R. Raj, B. Kokta, F. Dembele, B. Sanschagrain, J. Appl. Polym. Sci. 38(11), 1987 (1989)
10. X. Chen, J. Yu, Z. Zhang, C. Lu, Carbohydr. Polym. 85(1), 245 (2011)
11. L. Qin, J. Qiu, M. Liu, Chem. Eng. J. 166(2), 772 (2011)
12. R.C. Sun, J. Tomkinson, P.L. Ma, S.F. Liang, Carbohydr. Polym. 42(2), 111 (2000)
13. X.F. Sun, F. Xu, R.C. Sun, P. Flower, M.S. Baird, Carbohydr. Res. 340(1), 97 (2005)
14. W. Cao, Z. Dang, X.Q. Zhou, X.Y. Yi, P.X. Wu, N.W. Zhu, G.N. Lu, Carbohydr. Polym. 85(3), 571
(2011)
15. J. Han, C.J. Branford-White, L.M. Zhu, Carbohydr. Polym. 79(1), 214 (2010)
16. S. Sinha Ray, M. Bousmina, Prog. Mater. Sci. 50(8), 962 (2005)
17. Y. Zhao, J. Qiu, H. Feng, M. Zhang, L. Lei, X. Wu, Chem Eng. J. 173(2), 659 (2011)
Properties of RS/PCL composites
123

18. C.S. Wu, H.T. Liao, Ind. Eng. Chem. Res. 51(8), 3329 (2012)
19. N.A. Ibrahim, K.A. Hadithon, K. Abdan, J. Reinf. Plast. Compos. 29(14), 2192 (2010)
20. S. Siyamak, N.A. Ibrahim, S. Abdolmohammadi, W.M.Z. Wan Yunas, M.Z.A. Rahman, Molecules
17(2), 1969 (2012)
21. R. Ramli, R. Yunus, M. Beg, D.J. Prasad, Compos. Mater. 46(11), 1275 (2012)
22. Y. Xie, C.A. Hill, Z. Xiao, H. Militz, C. Mai, Composites A 41(7), 806 (2010)
R. Khandanlou et al.
123
Recommended


![[Murray Hollis] Practical Straw Bale Building(Bookos org)](https://img.pdfslide.net/doc/110x75/631325a15cba183dbf06f7fb/murray-hollis-practical-straw-bale-buildingbookos-org.jpg)
