1
EFFECTS OF IMPROVISED INSTRUCTIONAL MEDIA ON NIGER
STATE SECONDARY SCHOOL STUDENTS’ACHIEVEMENT IN
SELECTED BIOLOGY CONCEPTS
This study investigated the effects of improvised instructional media on secondary school
students’ achievement in biology in Niger State. It also investigated gender and ability
levels effects on achievement. Two hundred and seventy (270) students were drawn from
nine public senior secondary schools. The design adopted was pretest posttest control
group factorial design. The treatment involved teaching the experimental group 1 with
the use of improvised models, the experimental group 2 with developed video DVD
instructional package and the control group with lecture method. A 40-item Structured
Biology Achievement Test (SBAT) was developed and validated for data collection. Its
reliability coefficient was found to be 0.83. Seven hypotheses were tested at 0.05 level of
significance. The ANOVA Statistic was used to test the hypotheses. Scheffe’s post hoc
test was conducted where significant difference existed among more than two groups.
The major findings of the study showed that-there were significant differences between
the groups (1 (models) and 2 (video DVD)) respectively and the control group. (F-cal.
83:12 > F-tab. 3.92; P < 0.05) and (F-cal. 112.9 > F-tab. 3.92; p<0.05). There were also
significant differences between the male and female experimental groups (1 and 2)
respectively and male and female control group. (F-cal. 28.38> F-tab. 2.68; P < 0.05) and
(F-cal. 48.58 > F-tab. 2.68; P< 0.05). There were significant differences between the three
ability levels of students (high, average and low) in both experimental groups 1 and 2 and
their counterparts in the control group. (F-cal. 9.11 > f-tab. 2:29; P< 0.05) and (F-cal. 22.48 >
F-tab. 2.29; P< 0.05). Based on the above findings, it was recommended among others that
the use of improvised instructional media should be fully encouraged in the absence of
instructional media resources; either improvised models or video DVD package could be
used by teachers of biology and other science subjects.
2
CHAPTER ONE
INTRODUCTION
1.1: Background to the Study
The importance of science as a requirement for the development of any nation is
no longer in dispute. Science has contributed in no small measure to the development and
comfort of the modern world. For instance, for any nation to attain the status of self-
reliance, science must be an important component of the knowledge to be given to all
citizens of that nation irrespective of race, creed or sex (Nsofor, 2001). Indeed, science
has come to be recognized as the foundation upon which the bulk of the present day
technological breakthrough is built. No wonder Abilu (2005) expressed the opinion that
Nigerian citizens should pursue science, technology and mathematics education to
prevent Nigeria from being perpetual slave to the developed world. The prestige and
political power of any nation also resides largely in its level of scientific achievement.
Consequently, the pursuit of science as an imperative endeavor for achieving
prosperity and advancement is conspicuous in the national development plans of many
developed and developing nations. In Nigeria, these facts underscore the importance and
priority accorded science as manifested in various policy statements and steps that
encourage her citizens to pursue science courses (Federal Republic of Nigeria (FRN),
2004). Such policies include the establishment of special science schools, increasing the
ratio of students' enrolment in sciences in tertiary institutions (60:40 in favour of science),
and the introduction of basic science in primary school curriculum. All these are done
with the hope that a solid foundation in the sciences would equip millions of Nigerian
students for successful science-based careers, thereby contributing to the much-needed
scientific and technological advancement.
Unfortunately, literature in science education is replete with the fact that the
performance of science students in Nigerian schools still leaves much to be desired right
3
from the primary school through secondary school to the tertiary level of education
(Adewunmi, 1992; Kareem, 2003; West African Examination Council,2007;). A general
review of Nigerian students’ performances in the three science subjects {Biology,
Chemistry, Physics} in the West African Senior Secondary Certificates Examination
(WASSCE) from 2000 to 2007 revealed fluctuations and down-ward trends in students'
performance (See AppendixA). Appendix A reveals that the students' performance in the
sciences, which are the foundation subjects for scientific and technological take-off, is
not encouraging, especially in biology.
Biology is one of the science based career and compulsory subject for senior
secondary school. Biology, an integral part of the natural science, is of Greek origin,
coined from 'bios', meaning 'life' and ‘logos’ meaning 'the study of life (Ewusie, 1980).
Biology is conceptualized as a unique life subject which deals with animate objects, their
structure, function, growth, origin, evolution and distribution. Being a science of life,
biology occupies an important position in the school curriculum. It is designed ultimately
to educate individuals who may or may not pursue biological related careers, but could
at least acquire the knowledge as prerequisite for pursuing careers in science related
disciplines.
Basic principles and applications of biology have led to the design and production
of a number of artificial organs in the body. Also the applications of these basic principles
of biology (as in biotechnics and genetic engineering) have made man to perpetuate
desired favorable traits in the production of high breeds of crops and animals through
hybridization and cloning respectively. The knowledge of biology helps in conservation
of natural resources and checkmating population explosion. The inherent potentials of
biology may explain why biology is recognized and accorded a special position in the
school curriculum as the only core science subject made compulsory for both arts and
4
science students at senior secondary school level of the Nigerian education system. Thus,
it has become very popular among students as evidenced by large enrolment rate (see
Appendix A)
Bearing these points in mind, one expects students' performance in biology to
justify its continuous popularity among them. But on the contrary, it is sad to note
that the students' performance in the subject is not encouraging. For example, the
percentage passes at credit level and above in Biology between 2000 and 2005 fluctuated
between 19.3% and 42.2%. It increased from 19% in 2000 to 42% in 2003 and decreased
again to 29.08% in 2004. Since credit pass in biology is a prerequisite for admission into
most disciplines at the tertiary level of education, it then means that only these few
students, who sat for WASSCE in the year 2000 to 2007, were qualified to get admission
into the university, while the remaining students would have no admission into any
Nigerian University.
Similarly, when students’ result in biology is compared with that of other
sciences like Physics and Chemistry, Biology result is usually the poorest
(Ezekannaya and Ikeagu (2004). The analysis in table of appendix A reveals that
most of the students who sat for biology between 2000 and 2007 failed while
majority secured ordinary pass grade, which will not qualify them for admission
into any tertiary institution. There were very few students who passed at credit
level, for instance, in the year 2000, out of 620,291 students who sat for Biology
examination, 315,919 representing 50.93% failed. Also, 184,603 representing
29.76% had ordinary pass while only 119,769 representing 19.30% passed at
credit level and above.
5
Similarly in the year 2001, 995,346 students sat for the examination,
468,216 (47.04%) failed, 295,654 (29.70%) had ordinary pass and only 231,475
(23.25%) passed with credit and above. In 2003, 1,005,553 students sat for the
examination, 266,222 (26.47%) failed, 271,058 (26.95%) had pass and 424,636
(42.22%) passed with credit and above. The trend continues till date. A close look
at the failure rate of students in biology, chemistry and physics (as evidenced in
Appendix A) showed that biology ranked the highest with the mean percentage
failure of 42.82 % as against 31.52% and 25.56 % for chemistry and physics
respectively.
Specifically, a review of Niger State students' performances in biology, chemistry
and physics showed the same trend of high enrolment figure and high failure rate in
biology. This was evident from the analysis of the statistics of entries and results for
May/June WASSCE 2000-2008 as shown in (see Appendix B). From the analysis of the
results in appendix B above, it could be observed that students who registered for biology
almost doubled or tripled those who registered for physics and chemistry. It is also clear
that despite the high enrolments for biology, students' performance is poor. Even though
students' performance in the three science subjects is generally poor over the years, it is
lamentable that the performance in biology from 2000 to 2008 has been found to be the
poorest of the three science subjects. This is because it has the mean percentage failure
of 65.29% against 53.91% and 45.58% for chemistry and physics respectively.
Furthermore, it can be deduced from the result that the percentage of students that passed
biology at credit level and above was consistently less than 20%.
This trend in students' performance in biology is supported by the WAEC Chief
Examiners’ report which had consistently remarked that from 1992 up to date, there is
6
no appreciable improvement in students' performance in the WASSCE biology results.
This unimpressive performance in biology has been very disturbing and if it is not
checked, it may jeopardize the placement chances of students into tertiary institutions not
only in biology related areas but also in other science based disciplines. These problems
have raised a-lot of eyebrows in Nigeria and constitute a major catalyst for
initiating the present study.
The desire to know the causes of the problem of poor performance in biology has
been the focus of researchers in recent times and has culminated into diverse researches.
Ajayi (1998) reported that students perform poorly in biology because the classes are
usually too large and heterogeneous in terms of cognitive ability level, while Bassey
(2002) observed that the laboratories in schools are sub-standard and ill equipped. In
continuation, Bassey pointed out that in some laboratories where there are few equipment
and materials; they are not in good condition, usually they face technical, operational and
maintenance problems owing to sophistication in construction and operation. The few
that are in good conditions are not enough to go round the students. In support of this,
Adelakun (2003) echoed that there is serious shortage of instructional materials in schools
while Adebimpe (1997): 55 lamented thus:
There is a total or partial absence, inadequacy of the science
teaching resources, grossly inadequate finances for the
purchase of science equipment, galloping inflation, rising
enrolment of students, general downward trend in students'
performance in science, poor maintenance culture and at
times uncooperative attitude of some school heads towards
science and science equipment.
Foin (2001) went further to identify population explosion in schools, where the student
in-take out-weighed the number of staff available, classrooms and other school facilities
as other factors that contributes to poor performance of students in biology.
7
Ibe (2004) and Madu, (2004), in their various studies on why students perform
poorly in biology, revealed that the excessive use of expository method of teaching where
the instruction is more teacher-centered is a factor. Nsofor (1991), Nateinyin (1995) and
Ameh and Gunstone (1996) reported that misconceptions and difficulty of certain biology
concepts are also among the causes of poor performance in it. Ojiaku (2003) shared the
same view and pointed out that students blamed their poor performance in biology on the
complex nature of most concepts especially those relating to the internally situated organs
and systems which ordinarily they do not have access to. Such complex and abstract
internal systems include digestive system, excretory system, respiratory system, nervous
system, and blood circulatory system among others. Okwo, Amaka, Okoye, Ugwu and
Onyeka (2008) further noted that the students rated excretion and circulation highest in
complexity.
The question that comes up at this juncture is how best could these concepts be
effectively taught in the classroom? It has therefore become necessary for researchers to
continue the search for solutions to the multifarious problems confronting the teaching
and learning of biology concepts like the ones highlighted above. Reacting to the above
demand, Adewoyin (1991) pointed out that most of the problems confronting the teaching
and learning of biology concepts could be alleviated if instructional technology is
employed. Instructional technology according to (Adewoyin 1991) is a component of
educational technology which seeks to improve learning by ensuring the installation of
efficient and effective instructional system and managing the human and other resources
optimally. Indeed, instructional technology is technology applied to education. It
comprises of such components as the teacher, learner, subject matter and instructional
media. When these components, especially instructional media are efficiently
manipulated and managed in any instructional process, learning becomes effective. Based
8
on this, Onasanya and Adegbija (2007) emphasized on the need for massive use of
instructional media in the classroom.
Instructional media are projected and non-projected information carrying
technologies that constitute an integral part of the instructional process used for the
delivery of educational information very quickly, widely and effectively (Adewoyin,
1991). Some of the wide ranging instructional media materials that could be used for
biology instruction in secondary schools are non-projected two and three-dimensional
materials (charts, diagrams, models and others) and projected media materials (film
strips, audio-tapes, video CD and DVD and others). Umeoduagu (2000) emphasized that
for effective instructional processes, emphasis should be more on those media materials
that appeal to more than one sense of perception. This remark is based on the fact that
learning experiences, which evoke the involvement of as many sense organs as possible
enable the teacher to convey meaningful information to the learners and stimulate
students to receive and process all the necessary information for the development of
cognitive, affective and psychomotor skills. This is what has drawn attention to research
into models and video (DVD) instructional package. Of all non-projected media material
mentioned earlier, model is the only 3-dimensional medium and thus has appeal to many
senses of perception. Model simplifies complex objects and accent important features
with color, texture and illumination. Model scales down or scales up objects to an
observable size. Video DVD also has appeal to many senses of perception, and in addition
has an advantage of making knowledge reach a lot of students simultaneously. Video
DVD enables the teacher to process instruction, enhance its presentation, supervision and
management. The importance of these media materials in the teaching and learning
process cannot be overemphasized. But are these instructional media materials available
in our schools?
9
As important as these media materials are, it has been widely reported by a
growing body of research that the improvised version of such media materials are not
available in most Nigerian schools, also foreign types are not readily available (Ezeudu,
2000; Adelakun, 2003; Thomas, 2004; Gana, 2006 ). Specifically, Thomas (2004)
pointed out that complete models either improvised or foreign for teaching the concept
of blood circulation and excretion in man are not available in most secondary schools in
Niger State. Similarly Gana (2006) made it clear that most secondary schools in Niger
State do not have functional video instructional packages (tape, CD or DVD) in any
subject area.
Based on the foregoing, Adebimpe (1997) warned that teachers should not use the
absence or inadequacy of instructional media as an excuse to resort to poor teaching and
learning, instead they should resort to improvisation as an alternative approach towards
keeping science teaching and learning afloat and meaningful during such a difficult time.
This is in line with the view of Maduabum (1983), he emphasized that if science is best
learned with concrete objects, then teachers have no option than to devise methods of
complying through improvisation. Improvisation is the act of using local materials
obtained from the local environment or designed by either the teacher or with the help of
local personnel to enhance instruction (Balogun, 1982; Adebimpe, 1997). Improvisation
could also be referred to as the act of using alternative materials or resources to facilitate
instruction whenever there is lack or shortage of some commercially produced
instructional teaching materials. However in the act of improvisation, Araromi (1998)
cautioned that improvised instructional materials must necessarily serve the purpose for
which it is intended. It should not just be provision of a piece of media as a substitute for
what is not available. The present work is a step in this direction. Two sets of models
imaging the two concepts of excretion and circulation were improvised, video DVD
10
instructional package were produced and their effects on students’ achievement in
biology were sought
Media effects on learning outcome are common in the field of Educational
Technology. Examples of such studies are those of Okobi, (1994), Okoro and Etukudo,
(2001), Otegbayo, (2005), and Kutigi, (2006). Okobi (1994) investigated the effects of
Video Tape and Slide Tape Instruction on students’ performance in social studies; Okoro
and Etukudo, (2001) investigated the effects of Computer Aided Instruction (CAL) and
Extrinsic Motivation Traditional Method on students’ performance in chemistry;
Otegbayo, (2005) investigated the effects of Audio and Film Package on the teaching and
learning of phonetics in junior secondary schools, while Kutigi, (2006) investigated the
effects of Audio Tape and CAL on the teaching and learning of oral English at senior
secondary school level. Of all the researches mentioned, no known work has been
reported on the effects of video (DVD) instructional package and instructional model on
students’ achievement in biology.
Again, prominent among the prevalent problems in the school system are those of
the influence of students’ ability level (high, average and low) and gender differentials
on learning outcome. It is a common feature in the conventional classroom to find
students of mixed academic ability lumped together to be given the same treatment as if
they have everything in common. This phenomenon has been a point of concern to
researchers in the recent times and this was investigated in this study. Gender issues also
have been linked with performance of students in academic tasks in several studies
(Awoniyi, 2000; Balogun, 2000). Some studies revealed that male students perform better
than female students in science while others revealed that female students are better than
their male counter parts. Some studies could not even find any form of influence being
exerted by gender on academic performance. Despite various studies to examine the
11
relationship between gender, ability level and students’ academic performance, the issues
are still far from being conclusive. It is therefore reasoned that a considerable amount of
empirical research evidence is still required before a definite and convincing pattern of
relationship can emerge. These issues essentially set forth the problems that were
investigated in this study.
1.2: Statement of the Problem
Biology is regarded as "most popular" of the three basic sciences (Biology,
Chemistry, and Physics) that students are exposed to at secondary school level, but when
students' result in public examination in this subject is compared to other sciences,
biology result is usually the poorest (Ajayi, 1998 and Nsofor, 2007). Indeed the
performance of students in science generally and biology in particular has been quite
unsatisfactory over the years (Adewunmi, 1992; Kareem, 2003 WAEC, 2007;). The
examining bodies such as the West African Examination council (WAEC) and National
Examination Council (NECO) (2000-2008) have repeatedly recorded mass failure in the
subject. This particular problem has prevented the educational system in Nigeria from
producing required scientists and technologists (Gusen 2001). Also the poor performance
of students in science (Biology) has implications on university admission and might
explain the reason for the introduction of remedial programs in some Nigerian
Universities.
Researchers have traced the issue of unsatisfactory performance of students in
biology to a number of problems such as methods of instruction used by teachers, abstract
and complex nature of biology concepts and most importantly the unavailability or
inadequate supply of instructional materials in schools (Ojiaku, 2003: Adelakun, 2003).
Stressing further on the problem of instructional materials, Adebimpe (1997) reiterated
that the shortage of instructional materials is really a serious issue in Nigerian educational
12
system. With these multifarious problems in the school system, most teachers resort to
the teaching of science( biology) concepts with only “chalk” and “talk” method or by the
use of 2- dimensional materials (poster, chart, diagram, and others).
According to Martins and Oyebanji (2000), this situation in the school system has
made the teaching and learning of biology boring, uninteresting, and even meaningless
to most students. These students in turn develop phobia while nursing the impression that
science is meant for a gifted few with special mental ability. This situation has enhanced
the undesirable existence of a preponderant class majority of mere on-lookers learning
about science (biology) and not learning science. Consequently the product of the
educational system usually constitutes a generation of graduates who are not committed
to science and who cannot reason critically or analytically and so cannot transfer what is
learnt to a new but similar situation Osisioma (2005). Therefore, as a step towards
addressing these abnormalities and the inadequacies of instructional materials in
secondary schools, this study attempted to develop complete models and video DVD
instructional package for teaching the biology concepts of blood circulation and excretion
and investigate their effectiveness on students’ achievement.
1.3 Purpose of the Study
The of this study was to investigate the effects of video DVD and improvised
models on students’ achievement in biology. Specifically, the study intended
1. To investigate the effects of improvised models and lecture method on students’
achievement in biology.
2. To investigate the effects of improvised models and lecture method on gender in
biology.
3. To investigate the effects of improvised models and lecture method on students’
ability in biology.
13
4. To investigate the effects of video DVD and lecture method on students’
achievement in biology.
5. To investigate the effects of video DVD and lecture method on gender in biology.
6. To investigate the effects of video DVD and lecture method on students’ ability
in biology.
7 To investigate the effect of improvised models and video DVD on students’
achievement in biology.
1.4: Research Questions.
In order to find solutions to the problems raised, the study addressed the following
research questions:
1. What are the effects of Improvised models and Lecture method on Students’
Achievement in Biology?
2. What are the effects of Improvised models and Lecture method on gender in
Biology?
3. What are the effects of Improvised models and Lecture method on students’
ability in Biology?
4 What are the effects of Video DVD and lecture method on Students’ Achievement
in Biology?
5 What are the effects of Video DVD and lecture method on gender in Biology?
6 What are the effects of Video DVD and lecture method on Students’ ability in
Biology?
7 What are the effects of Video DVD and Improvised models on Students’ Achievement
in Biology?
14
1.5: Research Hypotheses
Based on the research questions, the following null hypotheses were tested;
HO1 There is no significant difference in the mean achievement of students taught with
improvised models and those taught with lecture method.
HO2 There is no significant difference in the mean achievement of students taught with
improvised models and those taught with lecture method irrespective of gender.
HO3 There is no significant difference in the mean achievement of students’ based on
their ability levels taught using improvised models and those taught with lecture
method.
HO4 There is no significant difference in the mean achievement of students taught
using developed video DVD Instructional package and those taught with lecture
method.
HO5 There is no significant difference in the mean achievement of students taught with
developed video DVD Instructional package and those taught with lecture method
irrespective of gender.
HO6 There is no significant difference in the mean achievement of student’s based on
their ability levels taught using developed video DVD instructional package and
those taught with lecture method.
HO7 There is no significant difference in the mean achievement of students taught using
improvised models and those taught with video DVD Instructional package.
1.6: Scope / delimitation of the Study
This study developed instructional models and video DVD instructional package
and found their effects on secondary school students' achievement in selected biology
concepts in Niger State. It was conducted in co-educational senior secondary schools
15
selected from 146 Government secondary schools (77 co-educational and 69 single sex
schools) distributed within the three educational zones (A, B, C) in Niger State.
The study was delimited to senior secondary two students (SS II) because the
concepts treated in this study were selected from their curriculum. The aspects of the
biology concepts focused on were human blood circulation, and excretion. It also
examined the influence of gender and ability levels on students’ achievement when taught
using improvised instructional models and video DVD instructional package.
1.7: Significance of the study
It is expected that the teaching and learning process, students, teachers, teacher
trainees, curriculum developers, policy makers, parents, government and the nation at
large would benefit from the findings in the following ways: The result of this study will
have positive impacts on teaching and learning of biology in secondary schools. It will
re-emphasize the need for teachers to always enrich the teaching-learning process with
instructional media. This would encourage head, hand and heart co-ordination on learners
and promote harmonious interaction between learners and the materials to be learnt. This
in turn would relieve passivity, monotony, excessive verbalism, thereby preventing
biology from being taught in a manner that produces in the mind of learners a feeling of
boredom and distaste for biology. The instructional media developed will enhance the
teaching and learning of the structure and function of human heart, components of blood
circulatory system and mechanism of blood circulation in man, structure of urinary
system, mammalian kidney and mechanism of excretion in man (urine formation).
Findings from the research will have positive impacts on the students'
participation and interest in biology in the sense that the developed media used would be
readily available for the learners' use during and after the lesson. This would enable the
learner to study a particular concept over and over at his / her own pace. This procedure
16
would provide for individual differences, eliminate tension in learners, make learning
easy, simple, and enjoyable and invariably culminate in better mastery of the subject
matter. Specifically, the model being 3-dimensional would enable the learners to see and
touch the features. Consequently, it will provide cognitive bridge to lead them from
abstraction to a nodding acquaintance with reality. By the use of video- tape instructional
package, the interest of the learners for irrelevant movies and entertainment programs
could systematically be transferred to a more productive and educative pursuit. Also the
learners listening skill which is vital to efficient learning would be improved upon.
It is expected that the media improvised will have positive effects on students'
performance, and would stimulate and encourage biology teachers' innovativeness,
resourcefulness, ingenuity and challenge them to use what they have to get what they
need. Again, the biology teacher is expected to benefit from this study, because the use
of videotape instructional package could provide some more positive approach to the
problem of large classes, while the use of model would aid the teaching of abstract and
complex biology concepts.
The findings from this study would attract the attention of teacher training
institutions to incorporate and emphasize more on the techniques for the production and
utilization of electronic and non-electronic instructional media in their programs. This is
to ensure that the teachers have the requisite knowledge, skills, attitude and interest to
generate and manipulate media materials in the teaching and learning process. The
importance of media in teaching process cannot be over emphasized but media do not
teach by themselves, they require the efforts of the teacher to make them effective.
The study would keep science curriculum developers abreast of the need to always
spell out specific instructional medium in relation to curriculum content. This is to give
17
direction and confidence to the teacher whose job it is to put the curriculum into use and
to ensure the attainment of specific objectives of learning science.
When the findings of this study get to the policy makers, they would enable them
to lay more emphasis on the introduction of improvisation as a course in all tertiary
institutions. This will equip Nigerians, most especially teachers, with the skills that will
enable them to improvise whenever there is lack of first hand materials. This may also
require the policy makers to emphatically make it a matter of policy that science teachers
and other supportive staff in education must be sponsored to attend refresher courses,
seminars, workshops and conferences to keep them abreast of the global developments
in science education in general and their specific areas of specialization in particular.
The findings of this study on the students' performance in the selected concepts will
encourage the development of similar models for teaching other biology concepts. This
ultimately will lead to improved performance generally in Biology as a discipline.
Equally, success in biology will enhance success in related professions, which is capable
of improving the economic and social status of families in particular and the nation in
general.
It is hoped, that the fundamental issue in this study which is improvisation, wi1l
be of great benefit to the government: This is because the economics of education is
generally economics of scarcity. Therefore, no matter how generous and rich the
government might be, they are generally not in position to provide the schools with all
the instructional media they need. Thus the improvised media in this study would
compliment the costly imported prototypes, increase the number of biology instructional
materials available in schools and help in conserving foreign exchange.
The study would be of immense benefit to the nation as it could lead to the turn
out of learners with solid foundation in science (biology) to meet the demands of science
18
and technology of the new millennium. This study may serve as a springboard for future
researchers who might wish to embark on a similar study but on other concepts in biology
or other discipline such as chemistry or physics.
1.8: Operational Definition of Terms
The following key terms which featured in this research are defined below as they
were used in this study;
Improvised Instructional Media: These are biological models (internal structure of the
heart, blood circulatory system, excretory system and kidney nephron) and video DVD
instructional package improvised by the researcher using materials available in the
environment to serve as channels through which message, information, ideas and
knowledge are disseminated to the learners. They are locally improvised devices that can
be used to enhance the quality of an instruction.
Ability Levels: This entails rating of academic level of the sampled students in biology
as high, average and low achievers. The rating was based on their performance in their
last terminal examination in biology. The students were divided into three levels - upper
25% as high achievers, middle 50% as medium achievers, and lower 25% as low
achievers.
Video DVD Instructional Package: This is an audio-visual self developed programmed
instruction on biology concepts of blood circulation and excretion stored in a DVD plate
that can be used in the teaching and learning process.
19
CHAPTER TWO
REVIEW OF RELATED LITERATURE
2.1 Introduction
This chapter contains the review of various works and concepts considered
relevant to this study. Areas reviewed include:
2.2 Conceptual Framework:
2.2.1 Educational Technology: Meaning and Scope
2.2.2 Instructional Media: Nature and Scope
2.2.3 Improvisation in the Teaching and Learning of Science
2.2.4 Biology in Secondary School Curriculum
2.2.5 Blood Circulation and Excretion Mechanisms in Man
2.3 Influence of Ability levels and Gender on Students’ Academic
Performance
2.4 Theoretical Framework on Instructional Media and
Learning
2.5 Empirical Framework on Instructional Media and Learning
2.6 Summary of Reviewed Literature
2.2 Conceptual Framework
This study is rooted on some basic concepts whose clarifications are considered
necessary. These concepts were discussed under these headings:
20
2.2.1 Educational Technology: Meaning and Scope
Educational technology is a relatively new field of study which is developing very
fast. Commenting on this, Chapin and Messiele (1992) asserted that educational
technology is rapidly becoming one of the most important and widely discussed issues
among researchers and/or scholars in education. With the rapid development in
educational technology, the concept has come to mean different things to different people
who have variously expressed their views. For instance, Lumsdaine (1964) defined
educational technology as media bone out of communication revolution which can be
used for instructional purposes alongside the teacher and chalkboard. This definition
emphasized product (gadgets or machines) and people. To Hoban (1965), educational
technology is a complex, integrated organization of men and machines, of ideas, of
procedures and of management. This definition emphasized three elements of educational
technology- men, their technological and scientific ideas, procedures and management
with machines. Men here represent teaching staff, pupils, administrators and other
resource persons. While procedures and management represents planning, identification
of needs, resources, constraints, evaluation and use of research findings in human
learning and machines represent mechanical hardware and software.
In another dimension, Encyclopedia of Education (1969) explained educational
technology as the purposeful utilization in combination or separately of objects,
techniques, devices, events and relationships to increase the effectiveness of educational
process. The helpfulness of educational technology to the understanding of instructional
process also finds support in the studies of (Dada, 1984; Ajayi-Depemu and Talabi, 1986;
Akanbi, 1988; Adebute, 1991; Momoh, 1997; Obodozie, 2002; Mohammed, 2004;
Nwadibia, 2005 and Olumba, 2007). Substantial amount of these researches carried out
centered on the specific role played by educational technology devices. These researches
confirmed educational technology as a strong force in facilitating effective
21
communication, resulting in higher level of performance in any learning situation.
Looking differently at educational technology, Davies (1978) presented three approaches
to educational technology, namely; the hardware approach, the software approach and
the system approach. To him, the hardware approach is seen as the traditional approach
to educational technology because it assumed that a technology of machine is intimately
related to a technology of teaching. It stressed that educational technology is the
application of physical science and engineering to the problems of education. Therefore
in this approach, educational technology is seen as a means of mechanizing or automating
the teaching-learning process with certain advantages.
The second approach which is the software approach saw educational technology
as a systematic way of designing, presenting and evaluating instruction. This approach
laid emphasis on the technology of message design, which involves (i) the identification
of appropriate aims, goals and objectives (ii) the selection of relevant and suitable subject
matter (iii) the choosing of effective and contrasting learning and teaching strategies,
methodologies, activities and experiences and (iv) the evaluation of not only the success
of the resulting learning outcomes but also the effectiveness of the very strategies
employed. This implies that software approach embraces the whole curriculum process.
The third approach is system approach; it saw educational technology as a
systematic process of managing ideas, people, hardware, software and the environment
in identifying and solving educational problems. This approach focused rather more
deeply on the process as well as the products of teaching and learning. It is the application
of system analysis concept to education. Here the major concerns are the quality and
relevance of the overall learning experience. It would be dictated that these three
approaches covered the transmission, reception of knowledge and information, the
purposeful shaping of behavior and the means of enhancing the worthwhile-ness of the
22
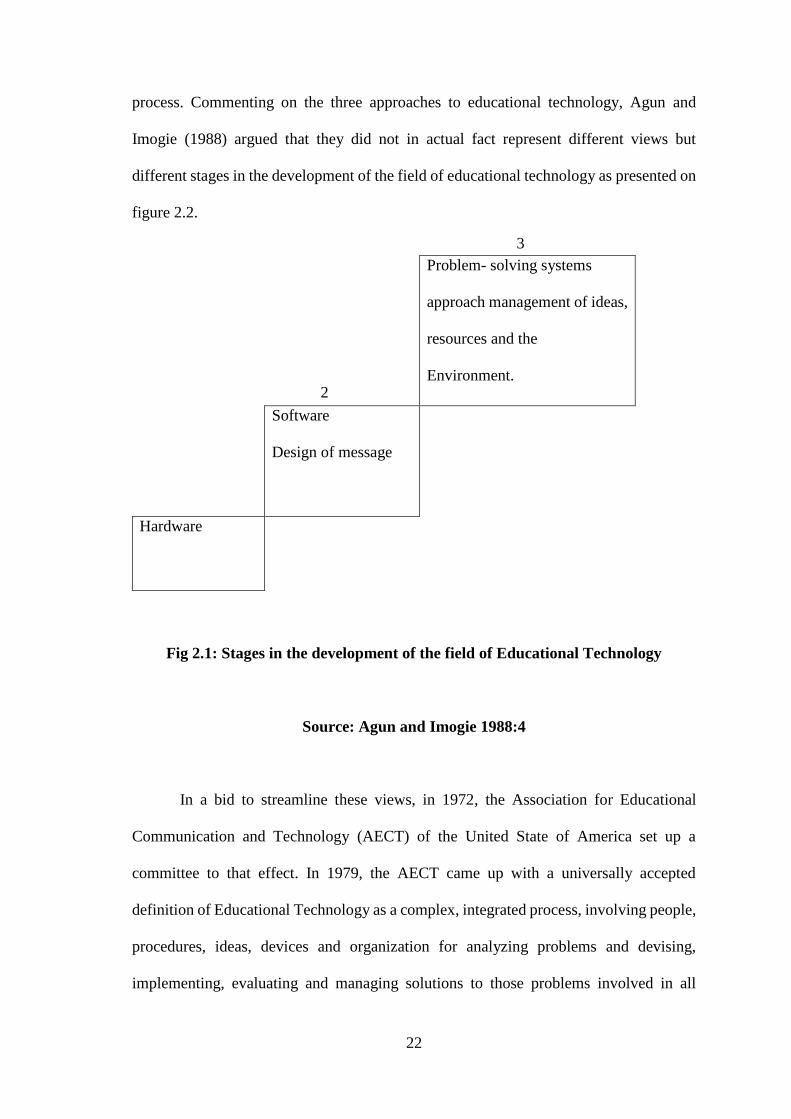
process. Commenting on the three approaches to educational technology, Agun and
Imogie (1988) argued that they did not in actual fact represent different views but
different stages in the development of the field of educational technology as presented on
figure 2.2.
Fig 2.1: Stages in the development of the field of Educational Technology
Source: Agun and Imogie 1988:4
In a bid to streamline these views, in 1972, the Association for Educational
Communication and Technology (AECT) of the United State of America set up a
committee to that effect. In 1979, the AECT came up with a universally accepted
definition of Educational Technology as a complex, integrated process, involving people,
procedures, ideas, devices and organization for analyzing problems and devising,
implementing, evaluating and managing solutions to those problems involved in all
Problem- solving systems
approach management of ideas,
resources and the
Environment.
Software
Design of message
Hardware
2
3
23
aspects of human learning. The above definition of educational technology as remarked
by Agun and Imogie (1988) is more lucid, concise, and yet comprehensive enough as an
adequate synthesis of the various definitions earlier given. It helped to stress the four
major components of Educational technology namely- Educational Management
Functions- Educational development functions – learning Resources- learner.
Educational technology from all indications includes all educational processes,
strategies and activities designed to achieve excellence in education. Ogunrati (1982)
remarked that educational technology involves principles and methods which bring
together men and resources in a systematic bid to effectively resolve educational
problems. Adewoyin (1991:4) shared this view and added that Educational technology
(in its holistic form) is for, and about people, process and products integrated in a
systematic manner to enhance learning efficiency and effectiveness. Also that the attitude
of mind, the methods, the philosophy behind the determination of what to learn, the
production and use of those mechanical hardware and software, the assessment of the
effectiveness and efficiency of all the procedures, the adequacy of the teaching-learning
environment and the application of systems approach are integral part of educational
technology.
From all these and from other perspectives, Dike (1999) deduced that educational
technology includes all of the following:
The production of teaching and learning materials, the storage, retrieval and
dissemination of information.
The psychological aspects of learning, audio and visual methods of presentation,
curriculum, planning, development and application.
The allocation of resources, the cost and effectiveness of media in education, the
design of learning spaces and the problems of innovation.
24
The efficient and effective communication of knowledge and development of
skills.
Dike (1999) maintained that educational technology covers the whole process of
education and aims specifically at the improvement of teaching-learning process.
Adewoyin (1991) completely agreed with this, and remarked that when educational
technology is wisely and judiciously applied in all its ramifications to the teaching-
learning process, it has the potentials to provide solution to some of the educational
problems, such as:
Shortage of adequately qualified teachers at all levels. This could be handled
through educational technology by development of modules and audiotapes and
video tapes which could be reproduced and utilized extensively.
Inadequate programs and facilities for the training of teachers. Here educational
technology can assist by helping to develop appropriate competency-based
teacher education program on the use of micro-teaching facilities and strategies.
Poor and inadequate funding of education. Educational technology here can help
through improvisation. A good educational technologist could use local materials
in the environment in the construction of inexpensive but effective teaching
materials as typified in this study.
Inadequate equipment, materials and facilities. Again, educational technology
here can assist in the development and production of inexpensive, low
technologies as well as the determination and development of alternative
strategies.
Inadequate and irrelevant curriculum. Educational technology can assist in the
development of new curriculum contents and design as well as the establishment
of flexible instructional strategies including programmed materials and modules.
25
Rote learning. By the use of different frames of reference and the evocation of the
various senses, educational technology should help to remove rote learning.
2.2.1a Trend of Educational Technology
According to Adewoyin (1991), no single individual can be credited with the
invention and development of educational technology. In continuation, Adewoyin
pointed out that the evolution of Educational technology was a gradual process and dates
back to the stone age period during which visual aids such as stones, pebbles, sticks and
cowries were used to enhance effective communication and learning. The evolution was
also as a result of the contribution of several individuals and organizations. The Egyptian
Hieroglyphics (visuals) marked the beginning of writing, the Old Persian and Assyrian
cuneiform served as media for human expression and communication of idea. As noted
by Agun and Imogie (1988), the sophists who lived in Athens in about the last half of the
fifth century BC were probably the first educational technologists. They were noted to be
the first people to develop techniques of analysis in teaching. This is because it was
observed that their lectures were carefully prepared and delivered in a systematic manner.
Others that contributed to the development of Educational Technology were educators
such as Socrates (479-399 BC), Plato (428-349 BC) and St. Thomas Aquinas, the
philosopher. These people emphasized on the right method to be employed in instruction,
the sequence to be followed and the type of evaluation to be adopted.
In 1450 AD, John Guttenberg made a significant contribution to the development
of Educational Technology by inventing a printing press which revolutionized the
communication process. This invention gave birth to the age of books which increased
accessibility to recorded information. In addition to this invention, other Greek teachers,
prominent among whom were Protagoras, Propilcos and Hippas evolved new techniques
26
of teaching and encouraged the use of apparatus in the teaching and learning process,
while Lancaster introduced the use of bold letters in writing and the use of different
colours on charts. Pestalozzi, Rabelis, and Cornelius made their marks, recommending
that learning should commence from concrete to abstract; Rabelis advocated for the use
of real objects and Cornelius advocated for the use of many text books with illustrations
and pictures.
Educational Psychologists were not left out in the evolution of Educational
Technology. Thorndike, (1874-1944), Pavlov, Skinner, Maria Montessori (1870-1952)
Robert Gagn all made their marks. They carried out various experiments with animals
and evolved new theories of learning. Skinner is the originator of the branch of
programmed instruction known as linear programming. Maria Montessori advocated that
in learning, learning activities should be ranked with different ages.
From the foregoing, it could be said that no single individual or field could be
credited with the evolution of Educational Technology. Educational Technology is an
eclectic field and not an island, which is to say that it borrows relevant ideas from other
fields such as Engineering, Psychology, Sociology, Cybernetics and others. Adewoyin
(1991) pointed out that analysis of the work of these contributors revealed that they had
in their minds the following ideas, principles and methods in common:
The nature and characteristics of learners.
Learners’ individual differences and learning styles.
Methodology of teaching and learning.
Application and coordination of the senses in learning.
Motivation, Reinforcement, stimulus response mechanism which include
immediate knowledge results
Learning activities (including the participatory role of learners).
27
The above ideas form the corner stone upon which effective learning ultimately rests and
which, in actual fact is the main concern of Educational Technology.
In Africa, the development of certain aspects of educational technology was
fostered by the early missionaries such as David Livingstone. David encouraged the use
of visual materials which gave rise to the formation of the audio-visual movements by
the mid 1950s. This movement introduced the use of audio-visual materials in the
teaching and learning situations. In Nigeria, the practice of Educational Technology
started with the use of simple teaching aids. Onyebunwa (1999) revealed that resources
in different local environments in Nigeria were utilized as aids to facilitate teaching and
learning. In Yoruba land for instance, Ayo, marbles and pegs (small sticks) were used by
pupils in schools. In Ibo land, cowries and sticks were effectively used, while in the
Northern part of the country, beads, pebbles have long been used effectively in teaching
and learning. Okafor (2000) explained that the practice of educational technology in
Nigeria is as old as western education. Up till the fifties, the term “teaching aids” was
used to aid learners. Simple addition and subtraction was taught with the use of counting
sticks and pebbles. This was however done at junior primary school level. Maps and
globes were used to teach subjects like Geography and History. Abdullahi (2001) agreed
that the use of educational technology in teaching and learning is not absolutely new,
perhaps what is new are the technological innovations and the great challenges which
education demands posed to the teaching and learning process.
1932 witnessed the establishment of the first Radio receiving station in Lagos which
transmitted certain amount of educational programs to learners (Ogunrati 1982).
According to Ogunranti, the educational program broadcasted at this period was limited
to English language. In 1947, Adewoyin (1991) noted that an instructional material
28
production center was opened in Lagos. In 1951, Nigerian Broadcasting Services (NBS)
was established to inherit and continue educational broadcasting program for teachers
and pupils. This was the situation until when the NBS was instituted into the Nigerian
Broadcasting Corporation (NBC) in 1957.
According to Olusola (1982) the year 1959 marked another turning point in the
history of the application of Educational Technology in Nigeria. Television was
introduced as a better medium which could be used to educate the masses. In 1974, the
Abadina Media Resources Center was established by the University of Ibadan. It was the
first resource center in Nigeria. The center was equipped with a wide range of
instructional materials for effective teaching and learning at the primary school level.
Following this step, in 1977, the National Educational Technology Center (NETC) was
established in Kaduna by the Federal Government of Nigeria. The center was responsible
for the following charges:
Local production of instructional materials that bear relevance to the
environmental and cultural talents and resources.
Training of teachers and student-teachers in the application of educational
technology through workshops, seminars, short courses and attachment training.
Training of personnel in the various fields of educational technology i.e. in audio-
visual aids, educational television and radio broadcasting, photographic and
cinematographic services, instructional graphics and self-instructional materials.
Production and transmission of educational programs on radio and television for
primary, secondary and teacher training colleges.
Preparing the young ones for formal education through the broadcasting of pre-
school educational programs.
Operation of a National library of Educational Resource materials.
29
The Monitoring of the marketing of imported instructional materials in the
country and ensuring that such materials are not only educationally sound but are
also relevant to the cultural needs of the Nigerian child.
Providing consultancy services in the field of educational technology to the
federal and state governments as well as individual institutions.
Establishment and maintenance of instructional media facilities which cannot be
easily duplicated by individual institutions.
According to Adelu, 1984) the efforts of the Federal Government to promote
Educational Technology in Nigeria were complemented by the state media services and
ministries of education. Today in Nigeria, educational technology is a popular course run
by colleges of education and universities (Nsukka, Ibadan, Ife, Zaria, Ilorin, Benin and
Minna) where NCE, first degree, masters and PhD are awarded. The Nigerian Association
for Educational Media and Technology also contributed to the development of
educational technology through conferences, symposia, seminars, workshops and
publications. The association has in various ways helped in clarifying various
misconceptions regarding the concept of educational technology.
2.2.1b Instructional Technology
According to Momoh (1997), educational technology has a broad scope. It is
eclectic in nature, includes a unique integration of theories and system approach which
draws ideas from nearly all the fields - Psychology (learning theories), Sociology (human
relation theories), Cybernetics (information handling techniques), and Management
theories. Ogunmilade (1984) lent support to this and pointed out that educational
technology is a system made up of different sub-systems, Designs, Management,
30
Production, Research and Evaluation. He stated that these components work together and
complement each other for the full value of educational technology to be realized.
Educational technology lays emphasis on improvement in Education generally with
particular reference to instructional process. The aspect of educational technology which
deals with instruction is called Instructional Technology.
Instructional technology can best be described as that component of
educational technology which seeks to improve learning by ensuring the installation of
effective and efficient instructional systems and managing the human and other resources
optimally to bring this about (Adewoyin 1991). Adewoyin (1991) clarified that
instructional technology performs this function not only by defining problems but also
by designing, organizing, sequencing, evaluating, managing and recycling data and
information for improved performance in subsequent efforts. Instructional technology
according to Rahman (2002) is viewed as an integrated and systematic method of
designing, planning, implementing and evaluating the total process of learning and
teaching in terms of specific objectives, research, information on human learning and
process of communication. Instructional technology is “a systematic way of designing,
carrying out and evaluating the process of teaching and learning based upon researches
in human learning and communication and employing a combination of human and non-
human resources to bring about more effective instruction”. The above descriptions of
instructional technology imply that for improvement of teaching and learning, systematic
planning and the skillful use of the products of technology are basic pre-requisites.
In a similar view, the Association for Educational Communications and
Technology (AECT) described instructional technology as a systematic way of designing,
carrying out, and evaluating the total process of teaching and learning in terms of specific
objectives based on research in human learning and communication and employing a
31
combination of both human and non-human resources to bring about a more effective
instruction. The above description by the AECT indicates that instructional technology
entails the use of machines, devices, Media and techniques with the source of power that
make teaching and learning easier, interesting and effective. The use of technology as
part of the process of learning becomes relevant and as such technology must be adapted
to the unique nature of the learner and the social expectations of the learner and the
society. Instruction must therefore be planned from the curriculum. The curriculum must
aim at achieving the goals of education.
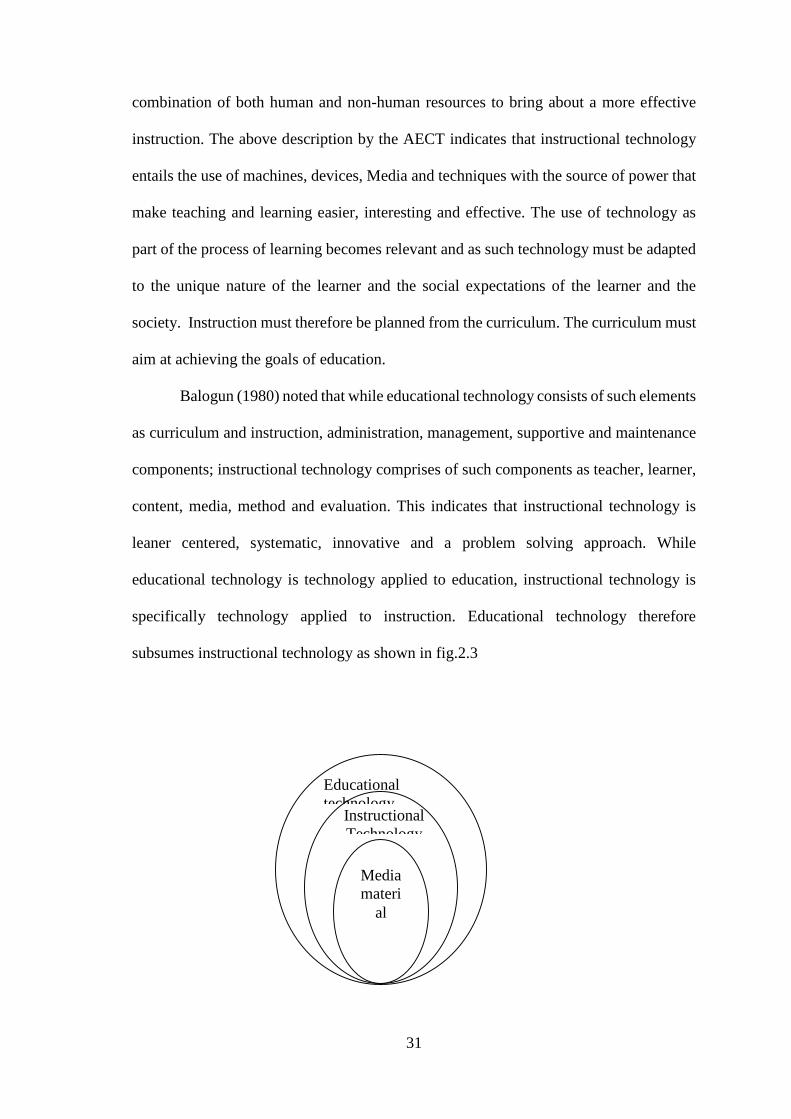
Balogun (1980) noted that while educational technology consists of such elements
as curriculum and instruction, administration, management, supportive and maintenance
components; instructional technology comprises of such components as teacher, learner,
content, media, method and evaluation. This indicates that instructional technology is
leaner centered, systematic, innovative and a problem solving approach. While
educational technology is technology applied to education, instructional technology is
specifically technology applied to instruction. Educational technology therefore
subsumes instructional technology as shown in fig.2.3
Media
materi
al
Educational
technology Instructional
Technology
32
Fig 2.2: Relationship between Educational Technology and Instructional Technology
Source: Adewoyin 1991:5
In stressing the importance of instructional technology in developing nations
including Nigeria, Okeke (1997) said that in many developing countries, technologies
will rejuvenate the traditional teaching method like in a world of social change
characterized by a world of technological innovation. He also itemized computers, video
tapes, radio, projectors, etc. as the various media employed for instruction. This
emphasized that instructional technology is mainly concerned with shifting emphasis
from the method of using chalk and repetitive talking to the use of combined human and
technological media to reach a greater number of learners with most adequate
information, knowledge and stimuli.
s Essential elements of instructional technology include identification of
educational problems that should be resolved, understanding of the audience and their
needs, establishment of prints in problem solving, examination of various alternatives for
solving educational problems, analysis of messages which would lead to the achievement
of objectives and development of evaluation techniques between the instructor and the
learner. Instructional Technology subsumes instructional media.
2.2.2 Instructional Media: Nature and Scope
Ogunrati (1984) described media as a part of educational technology, which is
defined as a go-in-between, a carrier of messages from one to the other. On a general
note, most media have the capacity to diffuse information, to show color, motion,
systematic representation and synchronize picture and sound. According to Adewoyin,
(1991:70) “media are channels through which, messages, information, ideas and
33
knowledge are conveyed and/or disseminated. They are the tools or instruments through
which stimuli can be passed and/or obtained”.. To Adeniran (2002) media are collection
of materials and equipment that can be used to help communication between two or more
system. They are essentially a working group organized around some devices to affect a
control of communication. Gusen (2001) agreed with this and remarked that the effect of
technological development on communication is clearly evident all around us and most
Nigerians are conscious of the effect and influence of the media. Dopemu (1988) pointed
out that there is hardly any home or industry around the world that does not employ the
media as a means of receiving or putting a story across. Media has occupied a part of our
daily life that without it, effective communication becomes impossible.
Adewoyin (1991) opined that media as information carriers are generally
characterized by the following points:
Some are audio in nature (radio, microphone), some are visual in nature (models,
charts) yet, others are Audio-visual in nature (films, videotape, and television).
Some are big (television, computer assisted instruction) and some are small
(models, charts, films).
Some are static (pictures, maps) while some are dynamic (motion films and
television).
Some are in the realm of mass media (radio, press and television).
Some are locally designed and produced while others are commercially produced:
When these media are used for instructional purposes, they are called instructional
or educational media, (Adewoyin 1991). In continuation, Adewoyin stated that
instructional media refer to all educational resources-graphics, photographic, electronic
or mechanized means of arresting, processing visual or verbal information or a
combination of both. Simply put, instructional media refer to all forms of communication
34
through which teaching and learning takes place. To Akanbi (1993), media materials are
information carriers designed specifically to fulfill objectives in a teaching-learning
situation. These materials can be used to record, store, preserve and transmit or retrieve
information. They can also be referred to and be used as sources to obtain knowledge,
new ideas and teachers can also use them to present learning tasks. They are also seen as
those resources which are manipulated, seen, heard, or talked about plus the instrument
which facilitate such activities. Obianwu and Azubike (1994) and Adeniran (2002)
described instructional media as all those devices such as man, machines and materials
which can be used by educators to present a complete body of information in teaching
and learning process for effective instruction.
The importance of instructional media cannot be overemphasized. Obianwu and
Azubike (1994) discovered that people generally remember: 10% of what they read; 20%
of what they hear; 30% of what they see; 50% of what they see & hear; 70% of what they
say; and 90% of what they say as they do a thing. Adewoyin (1991) summarized some of
the values of instructional media (model) in these words:
Instructional media increases retention and recall of whatever is seen and
manipulated. Media increases rate of learning and save teachers precious time
which can be used for other gainful activities.
With instructional media, learning becomes real, concrete and immediate. Media
add aural & visual dimension to learning. They broaden their knowledge, increase
their level of understanding and discourage rote-learning.
Media help to individualize instruction. It enables students to learn at their own
pace and time.
Instructional media makes education equal to all varying degrees e.g. rural and
remote dwellers, nomads, deaf, dumb, blind and others.
35
Instructional media helps in focusing attention and in motivating learners.
Instructional media lend support, authority or authenticity to whatever the teacher
says.
Instructional media provides experiences that may not otherwise be available to
learners
Instructional media helps in clarifying complex events or situations and in
magnifying or reducing objective events.
Instructional media enlists students’ participation.
Instructional media helps to educate more people in less time.
Hahm (2003) categorized instructional media into four groups namely mediating
media, obligatory media, optional media and criterion media.
Mediating media are media that are placed between the learner and the object he
wishes to learn, that is, they are used to bring into sharp focus what has to be
learnt in order to acquire the required skills. Examples are microscope, telescope,
quadrant and others.
Obligatory media are those media that are compulsory and must be obtained and
used if objectives are to be achieved. Examples are chalkboard, pens, pencil,
paper, maps.
Optional media are those media, which are not compulsory for the achievement
of the teacher’s objectives but if found and used will lead to the enrichment of
classroom presentation. Thus, while optional media aid learning, learning is not
entirely predicated on them. Examples are charts, sketches, flannel graphs or
magnetic boards or the use of tape recorder for language teaching instead of the
conventional language laboratory.
36
Criterion media are media-like models or mock-ups used by students in practicing
a skill in order to achieve mastery. They are media resources that provide
invaluable simulation opportunities and experiences in a learning situation when
direct and immediate hands (of professional jobs) may be absent or dangerous.
For instance, pilots learning to fly by first being exposed to flight simulators and
following their successful training move further up with exposure to real plane.
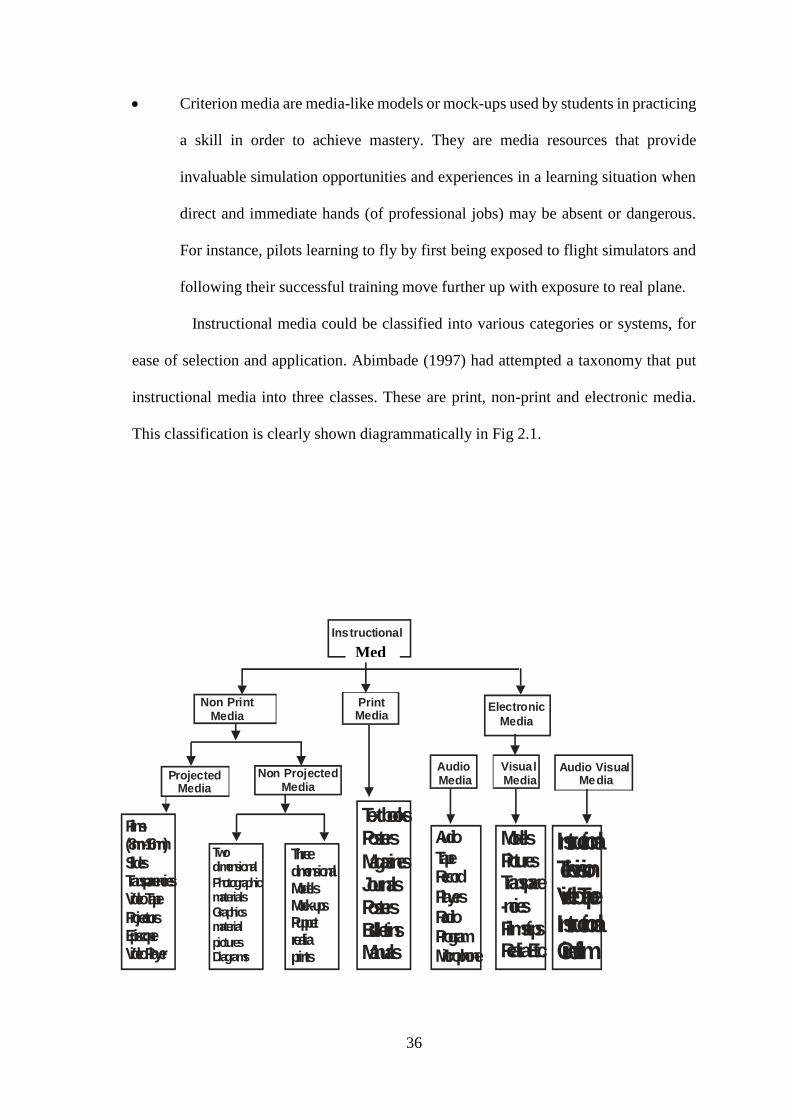
Instructional media could be classified into various categories or systems, for
ease of selection and application. Abimbade (1997) had attempted a taxonomy that put
instructional media into three classes. These are print, non-print and electronic media.
This classification is clearly shown diagrammatically in Fig 2.1.
InstructionalModels
Print Media
Electronic
Media
Non Print Media
Projected Media
Films-(8mm-16mm)SlidesTransparenciesVideo TapeProjectorsEpiscopeVideo Player
Twodimensional
PhotographicmaterialsGraphicsmaterial
picturesDiagrams
ThreedimensionalModelsMock-upsPuppetrealiaprints
Text booksPostersMagazinesJournalsPostersBulletinsManuals
Audio
TapeRecordPlayersRadio ProgramMicrophone
ModelsPicturesTranspare-nciesFilm stipsRealia Etc.
InstructionalTelevisionVideo Tape
Cine film Instructional
Non Projected Media
Audio Media
Visual Media
Audio Visual Media
Med
ia
37
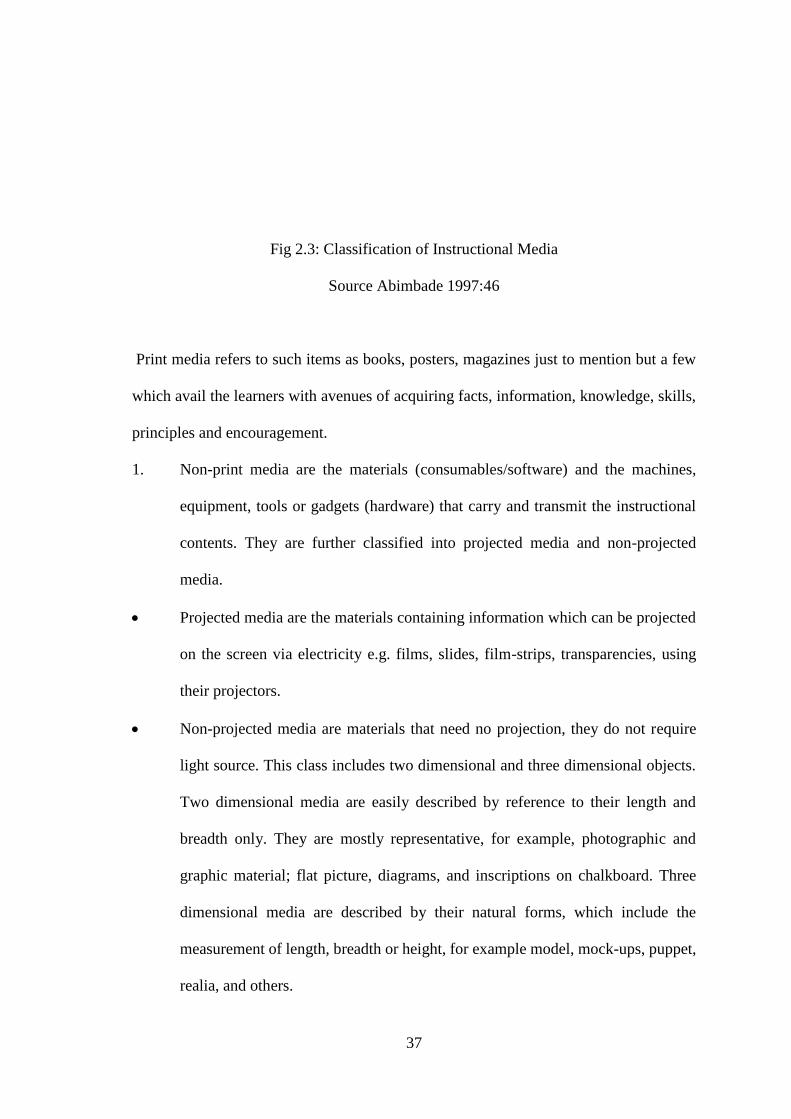
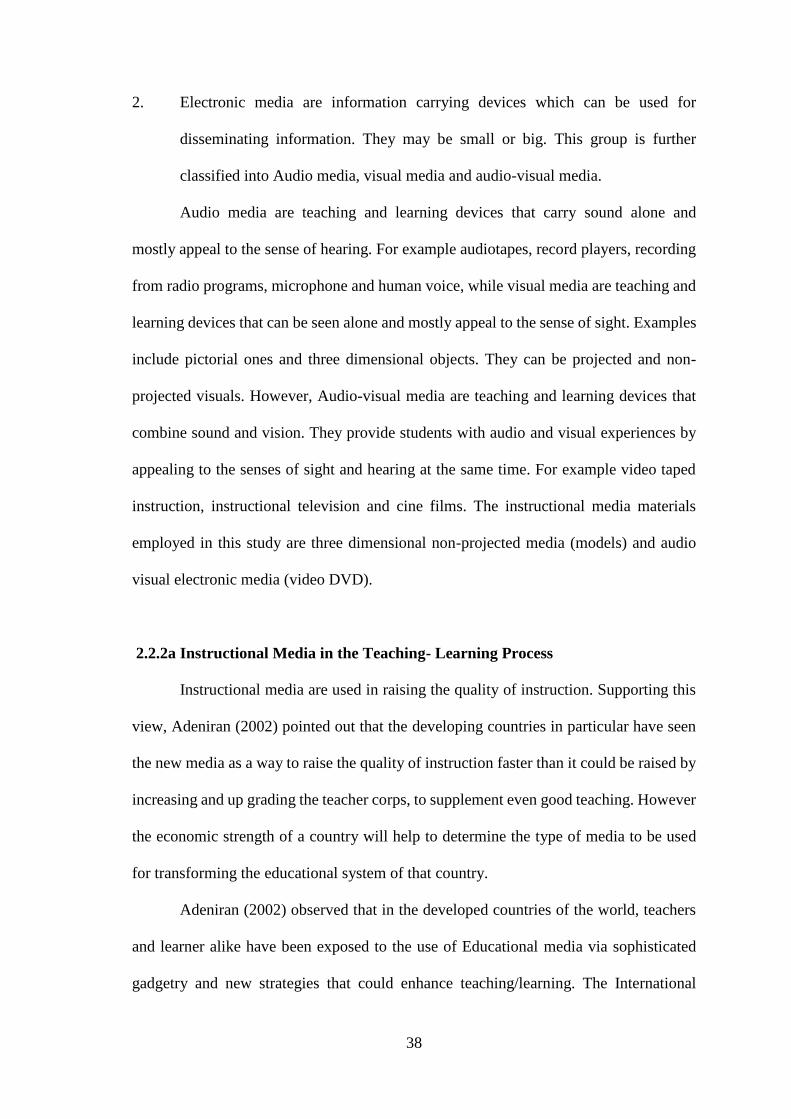
Fig 2.3: Classification of Instructional Media
Source Abimbade 1997:46
Print media refers to such items as books, posters, magazines just to mention but a few
which avail the learners with avenues of acquiring facts, information, knowledge, skills,
principles and encouragement.
1. Non-print media are the materials (consumables/software) and the machines,
equipment, tools or gadgets (hardware) that carry and transmit the instructional
contents. They are further classified into projected media and non-projected
media.
Projected media are the materials containing information which can be projected
on the screen via electricity e.g. films, slides, film-strips, transparencies, using
their projectors.
Non-projected media are materials that need no projection, they do not require
light source. This class includes two dimensional and three dimensional objects.
Two dimensional media are easily described by reference to their length and
breadth only. They are mostly representative, for example, photographic and
graphic material; flat picture, diagrams, and inscriptions on chalkboard. Three
dimensional media are described by their natural forms, which include the
measurement of length, breadth or height, for example model, mock-ups, puppet,
realia, and others.
38
2. Electronic media are information carrying devices which can be used for
disseminating information. They may be small or big. This group is further
classified into Audio media, visual media and audio-visual media.
Audio media are teaching and learning devices that carry sound alone and
mostly appeal to the sense of hearing. For example audiotapes, record players, recording
from radio programs, microphone and human voice, while visual media are teaching and
learning devices that can be seen alone and mostly appeal to the sense of sight. Examples
include pictorial ones and three dimensional objects. They can be projected and non-
projected visuals. However, Audio-visual media are teaching and learning devices that
combine sound and vision. They provide students with audio and visual experiences by
appealing to the senses of sight and hearing at the same time. For example video taped
instruction, instructional television and cine films. The instructional media materials
employed in this study are three dimensional non-projected media (models) and audio
visual electronic media (video DVD).
2.2.2a Instructional Media in the Teaching- Learning Process
Instructional media are used in raising the quality of instruction. Supporting this
view, Adeniran (2002) pointed out that the developing countries in particular have seen
the new media as a way to raise the quality of instruction faster than it could be raised by
increasing and up grading the teacher corps, to supplement even good teaching. However
the economic strength of a country will help to determine the type of media to be used
for transforming the educational system of that country.
Adeniran (2002) observed that in the developed countries of the world, teachers
and learner alike have been exposed to the use of Educational media via sophisticated
gadgetry and new strategies that could enhance teaching/learning. The International
39
Yearbook for Educational and Instructional Technology (IYEIT) (1999) cited in
Adeniran (2002) lent support to this and discussed extensively the different uses of
instructional media in many developed and the third world countries in the following
paragraphs. Thus Thailand decided to use low-cost radio to equalize some of the
opportunities between the metropolitan and small town and village schools. Upper Volta
and Niger decided to combine radio and slides in teaching agriculture and health to their
people. Columbia decided to teach functional literacy to its people by means of radio
broadcast and by a social newspaper delivered to study groups in villages. Right now,
Thailand, Upper Volta and Niger use television for teaching. It is interesting to note that
in Nigeria, radio, television, films and slides are not only used in teaching agriculture and
health education but also in teaching other subject matter areas. The conviction that
instructional technology could quickly transform educational opportunities made the
United States pay for establishing instructional television in the territory of American
Samao. Instructional television was installed in Niger and Ivory Coast with large grants
and technical assistance from France. Elsalvador was also to obtain large grants and loans
from the United State, France and UNESCO when it decided to make television a major
element in her educational development policy.
In continuation, Adeniran 2002 noted that about seventy years ago, Australia as a
rich country did not find it difficult to decide to use radio and correspondence study to
teach hundreds of students in the remote part of the country far from any school. The
United State, Japan, Sweden, France and others experimented with instructional
television because they were accustomed to technology, believed in its potential, and
were wealthy enough to make up for experimental failures. Instructional media were used
for extending learning opportunities especially to working adults, without indefinitely
multiplying campuses and schools. For instance, according to IYEIT (1999) Telekolleg
40
(Technical Preparatory school) in Germany was built around television and weekend
classes. In Britain according to Hahm (2003), the Open University, now the largest in
Britain, is teaching almost 50,000 students by a combination of television, radio,
correspondence study and tutorial opportunities. India has been using mostly puppets,
filmstrips and radio to reach its largely illiterate people, but now India has one of the most
sophisticated communication satellites in the world with which to beam education and
development to 2,400 of its remote villages. Iran is planning a national system of
educational television with or without satellite (Adeniran (2002). Indonesia decided to
install instructional television in 1976 and Korea which is embarking upon a revision of
its national curriculum is making major use of programmed instruction and of
instructional television relayed from captive balloons, moved two miles above the earth
in extending educational programs to its populace.
In the United States, a number of universities have decided upon the use of media
to extend their teaching beyond their campuses. For example Stamford University has
decided upon the use of media to extend teaching beyond its campuses, uses low-cost
high frequency television in a number of its engineering classes to employees in nearby
industries and laboratories. The University of Illinois has a programmed large number of
self instructional courses on its huge computer in order to offer the opportunity to people
in some hundreds of cities within and elsewhere studying such courses.
The role of instructional media in teaching-learning process cannot be over
emphasized. Kareem (2003) confirmed this assertion and stated that all teaching can be
greatly improved by the use of audio-visual media because they can make the learning
experience memorable. When used intelligently, they can promote the most effective kind
of learning in adults as well as in children. A range of vicarious experiences is provided
by audiovisual media. Most students can learn about New-York or Abuja through the
41
film, or by seeing them in the map without traveling to any of the places. Consequently
Gusen (2001) asserted that: a school will be an interesting place if it proves to be a place
where students have interesting experiences, where they see, hear, touch, taste, plan,
make, do and try. When motivated, pupils engage in exploratory activities and as their
curiosity cause them to probe, they become educated. This applies to students of all levels
of ability and age (from primary schools through university. Umeoduagu (2000)
submitted that students’ participation is a necessity for positive learning, whether the
lessons are verbalized or visualized and there must be student participation either before,
during or after the use of audiovisual media.
When the school provides many of these rich experience it will promote effective
learning and carry on the kind of education that will foster permanent learning. Kereem
(2003) stated that research concerning the use of various learning resources has resulted
in the general conclusion that where audiovisual media are used, learning environment is
highly stimulating and the students appear to take greater interest in learning. Debes
(1978) pointed out that educational media does seem to have had some success from the
visual literacy point of view by putting the software into the hands of the students. The
student has the opportunity to capture his world and his true visual arrays developed by
and for himself. By using the visual illiteracy tools, Debes indicated that children develop
more easily and are more highly motivated in the development of their schoolwork.
However, Gbodi (1998), noted that for more than a decade, the argument about
whether media do influence learning has been with us. According to her, the famous
assumption that media have no effect on learning is probably the most unduly quoted and
debated in educational technology. Clark (1983) said that there are no learning benefits
to be gained from employing different media in instruction. He explained that many
studies from the early days of educational technology which appeared to show a learning
42
difference brought about by an instructional medium had actually confounded medium
and method, or medium and novelty, or medium and amount of effort invested in
instructional design. This reassessment led Clark (1983) to the strong conclusion that
media research should come to an end until someone could come up with a novel theory
to relaunch it on a more useful basis. Nevertheless Cobb (1997) argued that the issue
could be resolved in a more principled manner with one minor adjustment to Clark’s
position. In the light of this argument, the researcher feels that media should have
influence on learning. This view was supported by a study carried out by Onyegegbu
(2001). Onyegegbu came out with the findings that the use of instructional media
improved performance of students more than the conventional instruction.
There is therefore the need for instructional media to be available in schools and
colleges in Nigeria so that pupils could play and interact with them. They should know
how to handle any media and operate any equipment if any concept is to be fully
internalized by them. Instructional media provide the teacher with means of extending
his students’ horizon of experiences. Salawu and Taiwo (2001) stressed that reading a
book and memorizing a series of conditions or a list of causes may not be rich enough in
meaning, but learners need actual and realistic, although frequently vicarious experience
built insight that will serve as a basis for forming new relationships from unfamiliar
verbal medias. They contended that motion pictures, television and carefully prepared
slide-tape sequences would be particularly valuable and they therefore suggested that
such ‘real’ experience be utilized in many teaching situations to assist the teacher in
overcoming the physical difficulties of presenting the subject matter. Salawu and Taiwo
(2001) therefore stressed strongly the need for teachers to produce and utilize various
resources (Films, slides, transparencies, globes and maps, models, video package, real
43
things) to enhance clarity of communication and to increase speed of comprehension. The
present study is focused on video package and models.
2.2.2b Video Package and Instructional Process
Video tape, (CD or DVD) is a medium of transmitting information in the form of
sound and image to be displayed on the screen of cathode ray tube. Video DVD which is
common in many studies uses magnetic tape similar to the audio recording. This makes
it possible to record anything and play it back immediately spanning 20 to 180 minutes
in colour or black and white (Onasanya, 2004). Video instruction is a form of non-
directive teaching technique in which the teacher produces an instructional video package
and put on for the learner to view. At interval he may choose to stop playing and explain
certain points or factors or probably wait till the end of the lesson to do so. Learne rs are
given the opportunity to view this production over and over again. With many homes
having a video system, it becomes easier for learners to learn at their own convenient or
leisure time. Having the advantage of playback mechanism, it can be played, rewind, and
replayed by the learner. This is to concretize learning. It can also be stopped several times
to allow room for discussion and questions on difficult concepts. Video DVD package is
thus an important tool in individualized learning.
Agommuoh and Nzewi (2003) provided support for the use of videotapes in
teaching and learning process. They indicated that the package could be used to provide
real experiences in almost all fields of learning. In continuation, Agommuoh and Nzewi
added that videotapes have the potentials of increasing the probability that students will
learn more, retain better and even improve their performance of the skills they are
expected to develop. According to Adekunle (2005), well-recorded programmes help to
meet the challenges of not only representing the event, but also offering the viewer a
44
functional equivalence of the experience. The video package gives the learner the
opportunity to see and hear an instructor, offers opportunity for behavior modeling,
demonstration, and instruction on abstract concepts. It offers a popular easy-to-use format
for instructional materials. Almost all students have access to a video player in the home
and they are also used in some schools. In the learning of science using video work, Nneji
(2000) clarified that video instruction possess the capacity to enhance quality learning,
seeks to arouse interest, modifying attitude, clarify concepts. In continuation, Nneji
(2000) added that video instruction stimulates thinking, summarizes, demonstrates and
concretize knowledge that could otherwise only be talked about in abstract terms, and
serves as a spring-board for further learning. Video instruction also breaks the old
traditional learning technique, to bring about better-motivated learning.
Still on the efficacy of video instructional package, Ayogu (2000) stated that when
video package is used to compliment instruction, they can:
Reduce abstractions in class lesson;
Reduce boredom among students and teacher;
Conserve the teacher’s energy;
Allow learning autonomy among students,
Restructure the learning environment;
Make learning interesting and motivating to students;
Minimize the problems of large class size;
Promote students’ participation in STM lessons,
Reduce problem of insufficient learning resources, and encourage individualized
learning
According to Amamize (2001), the flexibility of a video package makes it an effective
learning tool as students can manipulate it almost as easily as a book.
45
However in spite of its usefulness, Ogunmilade (1993) pointed out that if not
handled by the right personnel, video as an instructional technique could be misused. If
it is not properly used, students may enjoy just viewing it as any other film or probably
documentary or entertainment rather than a learning experience. Films should also be
carefully selected; so as to ensure that it goes along the line of instruction. Emphasis
should be placed on relevant facts or ideas. Another major problem stressed by
Ogunmilade (1993) with the video and television system is that it is not easily adapted to
the rural areas especially where there is no light; it cannot find any relevance there. Even
in urban areas, the teacher is at the mercy of PHCN, who may or may not provide light,
thus probably resulting into a shift in schedule. Another problem is cost in terms of
purchasing the video machine and production of the video instructional package. Many
state governments find it difficult to purchase video packages for the resources centers,
talk more of buying it for schools. Video is also a very fragile material that needs handling
with great care, thus it should not be entrusted to untrained hands during classroom
presentation. Lack of spare parts is also responsible for its irregular use in schools, and
also when damaged, it is usually very difficult to put it to good use again.
According to Ajelabi (2000), in a good video instructional package production, the
focus should be on teaching – learning goals. The message focus of the video instruction
must be carried from the educational goals and objectives. It is of vital importance that
information that can bring about distraction and irrelevancies should and must be
avoided. The teacher should be conscious of the quality, sound, vision of the video
package. He should be able to perceive, control materials and build them into
opportunities for the learner to learn and respond to what they have been taught. This
therefore translates that the teacher must and should be well-prepared. To achieve
46
effective and quality recording of instructional packages, Ajelabi (2000) added that the
following steps must be put in mind:
Start with an idea
Express this idea in form of clearly stated behavioral objectives; consider the
students’ interest and activities within the grips of the learner.
Write out your script. Build into the script activities and opportunities for
learners’ participation and where questions are appropriate.
Ensure that where the recording would take place, is well lighted. All
equipment must be test run to check proper functioning. Check all adaptors,
sockets and connecting cables.
Recording crews must be ready and handy.
Ajelabi (2000) reiterated that in the selection or production of video instructional
package, the following guidelines would be useful.
Select/produce instructional packages that are relevant to the objectives and
content of the lesson, preview selected/produced package and note key
elements, prepare a study guide, prepare your follow-up activities, check
gadgets and fix minor faults that could disturb smooth viewing
get trained personnel to handle actual viewing or else practice on your own.
Introduce the instructional package, giving a small talk on what the students
are about to see.
Ensure that students know what to look for and where to ask questions.
Explain the study guide (if any)
Show the package and keep quiet, do not run commentaries when running the
film.
47
If you must interpret a particular thing/fact pause and do so
When filming is completed, carrying out prepared follow-up activities – it can
be in form of test, quiz, project or discussion.
Use the result of the follow-up activities to evaluate students
Decide from the result of the evaluation if to show the package again or not.
2.2.2c Principles of Selection, Production and Utilization of Instructional Media
The identification and selection of the most appropriate media is a formidable task
for the teacher. So the wise choice of appropriate media by the teacher determines to a
large extent the success of the students in fulfilling the instructional objectives. Therefore,
the teacher being the principal actor must select the most appropriate media for his/her
instructional activities and also decide exactly what media materials to be used in a
particular course. To facilitate better judgment therefore, the teacher must develop
professional attitudes towards the selection and intelligent application of instructional
situation.
However, Essien (2001) noted that owing to the wide variety of instructional
media materials and their composite capabilities, difficulties often arise as to which one
to select or produced for use. Continuing, he remarked that more often than not, it is
intuition and subjectivity that form the basis of decisions about instructional materials
selection or production. To this effect, it should be made clear here that media selection
should better be analytical rather than intuitive. Akudolu (2002) emphasized that a
medium of instruction must be selected on the basis of its potentials for implementing
stated objectives. This implies that for any instructional media properly selected, the
objective is the reference point. The teacher should not be biased or subjective; he should
48
not choose a particular medium because of his personal interest in it even though it cannot
serve the objectives of the lesson.
Adewoyin (1991) suggested that availability of media scale of preference and
experience of users along with the size and content of instruction should constitute
intrinsic consideration in media selection decisions. In a summary, Adewoyin (1991)
outlined the following as factors to be considered when selecting media:-
Instructional objectives: He maintained that teachers’ instructional objectives which
could be cognitive, affective or psychomotor in nature should be considered. He
suggested the selection of audio media where the objective is cognitive and audio media
if it is affective or psychomotor.
Availability: Adewoyin clarified that before any form of media is selected, the teacher
must ascertain whether such media exist or not. If not available, the teacher must be sure
whether it could be borrowed or improvised. If not sure, it should not be selected.
Target Audience characteristics: the age, level, interest and the background of learners
should be taken into consideration when selection is being made of any media.
Teachers’ Capability: The teacher must ensure that he/she is capable of utilizing
effectively the form of media he wants to select.
Cost: Financial implications of whatever media to be selected should be considered. Thus
issues of availability of adequate fund for procurement and cost effectiveness for
production should be settled before selection is made.
Dynamic factors: These factors include the concentration and size of target audience,
the desire level of learners’ participation and available time. They should be taken into
consideration when selecting media for use..
Apart from knowing what to select and/or how to select instructional media, Agun
and Imogie (1988) emphasized that in Nigeria a teacher who is concerned with and about
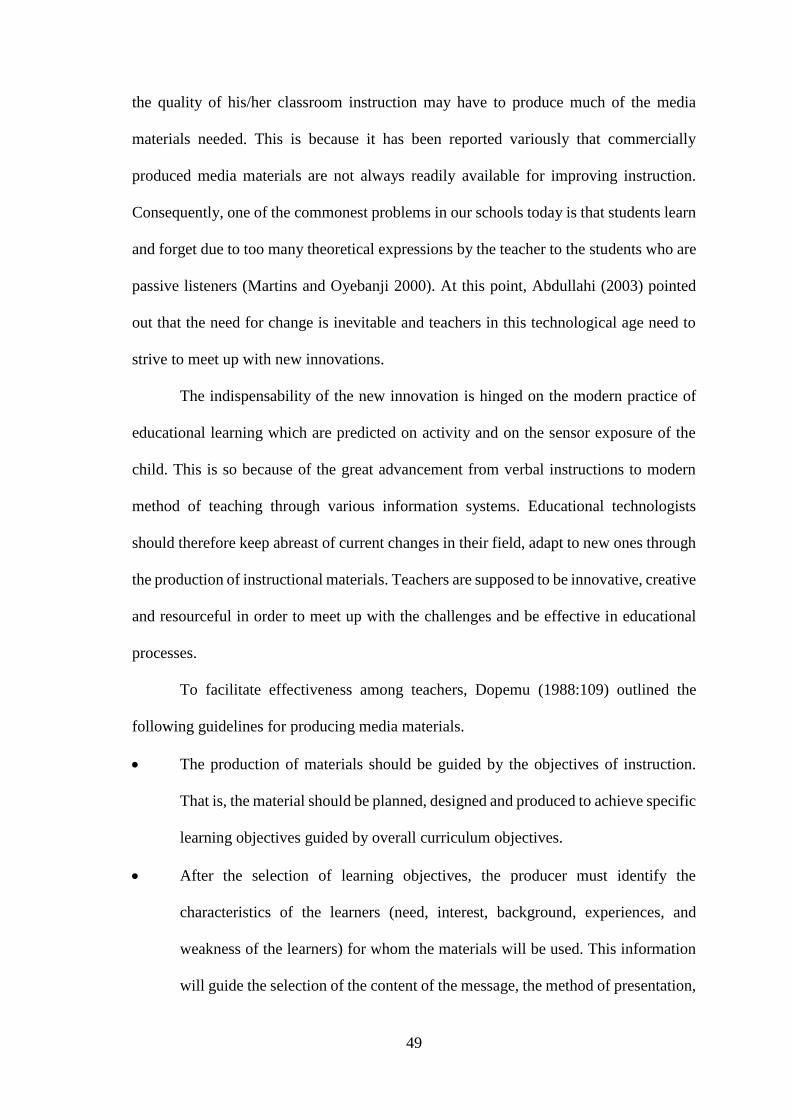
49
the quality of his/her classroom instruction may have to produce much of the media
materials needed. This is because it has been reported variously that commercially
produced media materials are not always readily available for improving instruction.
Consequently, one of the commonest problems in our schools today is that students learn
and forget due to too many theoretical expressions by the teacher to the students who are
passive listeners (Martins and Oyebanji 2000). At this point, Abdullahi (2003) pointed
out that the need for change is inevitable and teachers in this technological age need to
strive to meet up with new innovations.
The indispensability of the new innovation is hinged on the modern practice of
educational learning which are predicted on activity and on the sensor exposure of the
child. This is so because of the great advancement from verbal instructions to modern
method of teaching through various information systems. Educational technologists
should therefore keep abreast of current changes in their field, adapt to new ones through
the production of instructional materials. Teachers are supposed to be innovative, creative
and resourceful in order to meet up with the challenges and be effective in educational
processes.
To facilitate effectiveness among teachers, Dopemu (1988:109) outlined the
following guidelines for producing media materials.
The production of materials should be guided by the objectives of instruction.
That is, the material should be planned, designed and produced to achieve specific
learning objectives guided by overall curriculum objectives.
After the selection of learning objectives, the producer must identify the
characteristics of the learners (need, interest, background, experiences, and
weakness of the learners) for whom the materials will be used. This information
will guide the selection of the content of the message, the method of presentation,
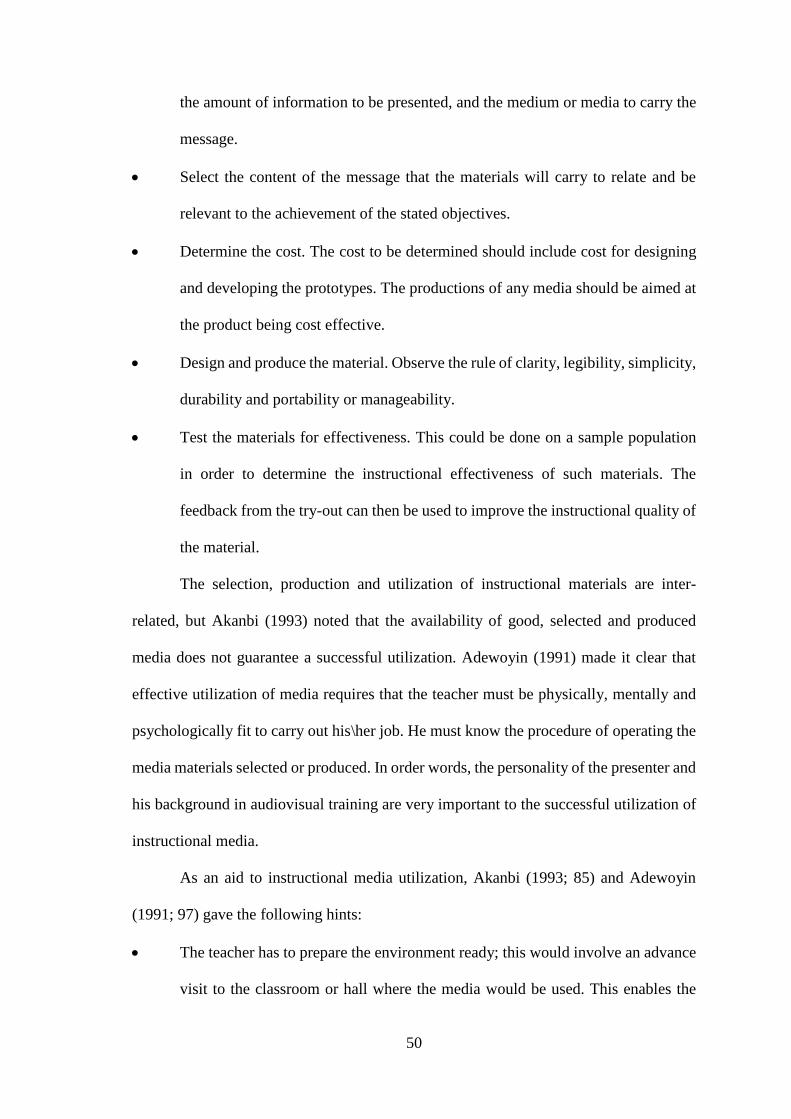
50
the amount of information to be presented, and the medium or media to carry the
message.
Select the content of the message that the materials will carry to relate and be
relevant to the achievement of the stated objectives.
Determine the cost. The cost to be determined should include cost for designing
and developing the prototypes. The productions of any media should be aimed at
the product being cost effective.
Design and produce the material. Observe the rule of clarity, legibility, simplicity,
durability and portability or manageability.
Test the materials for effectiveness. This could be done on a sample population
in order to determine the instructional effectiveness of such materials. The
feedback from the try-out can then be used to improve the instructional quality of
the material.
The selection, production and utilization of instructional materials are inter-
related, but Akanbi (1993) noted that the availability of good, selected and produced
media does not guarantee a successful utilization. Adewoyin (1991) made it clear that
effective utilization of media requires that the teacher must be physically, mentally and
psychologically fit to carry out his\her job. He must know the procedure of operating the
media materials selected or produced. In order words, the personality of the presenter and
his background in audiovisual training are very important to the successful utilization of
instructional media.
As an aid to instructional media utilization, Akanbi (1993; 85) and Adewoyin
(1991; 97) gave the following hints:
The teacher has to prepare the environment ready; this would involve an advance
visit to the classroom or hall where the media would be used. This enables the
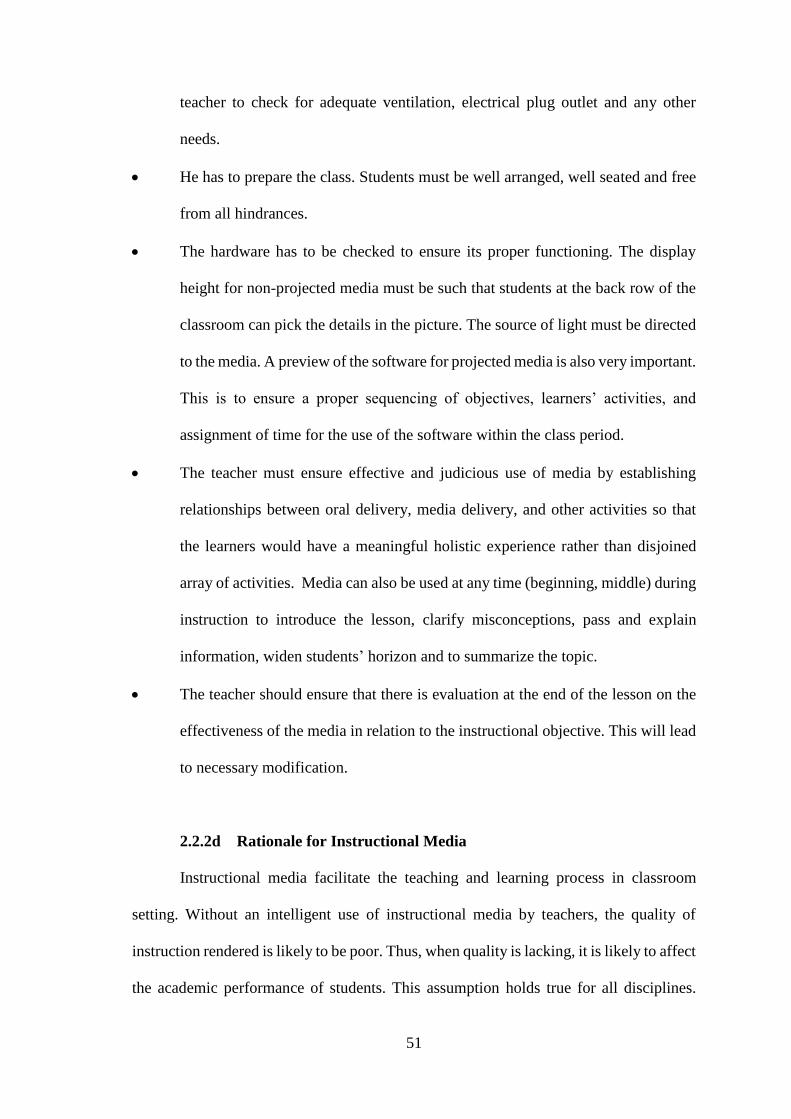
51
teacher to check for adequate ventilation, electrical plug outlet and any other
needs.
He has to prepare the class. Students must be well arranged, well seated and free
from all hindrances.
The hardware has to be checked to ensure its proper functioning. The display
height for non-projected media must be such that students at the back row of the
classroom can pick the details in the picture. The source of light must be directed
to the media. A preview of the software for projected media is also very important.
This is to ensure a proper sequencing of objectives, learners’ activities, and
assignment of time for the use of the software within the class period.
The teacher must ensure effective and judicious use of media by establishing
relationships between oral delivery, media delivery, and other activities so that
the learners would have a meaningful holistic experience rather than disjoined
array of activities. Media can also be used at any time (beginning, middle) during
instruction to introduce the lesson, clarify misconceptions, pass and explain
information, widen students’ horizon and to summarize the topic.
The teacher should ensure that there is evaluation at the end of the lesson on the
effectiveness of the media in relation to the instructional objective. This will lead
to necessary modification.
2.2.2d Rationale for Instructional Media
Instructional media facilitate the teaching and learning process in classroom
setting. Without an intelligent use of instructional media by teachers, the quality of
instruction rendered is likely to be poor. Thus, when quality is lacking, it is likely to affect
the academic performance of students. This assumption holds true for all disciplines.
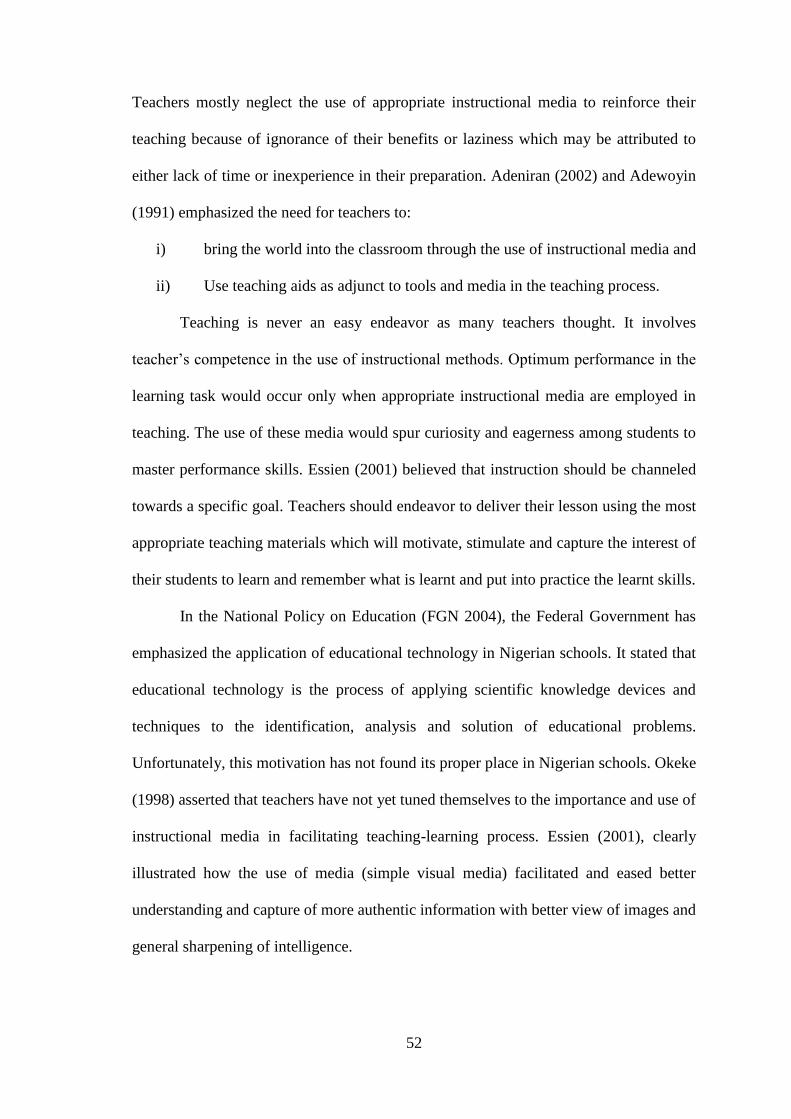
52
Teachers mostly neglect the use of appropriate instructional media to reinforce their
teaching because of ignorance of their benefits or laziness which may be attributed to
either lack of time or inexperience in their preparation. Adeniran (2002) and Adewoyin
(1991) emphasized the need for teachers to:
i) bring the world into the classroom through the use of instructional media and
ii) Use teaching aids as adjunct to tools and media in the teaching process.
Teaching is never an easy endeavor as many teachers thought. It involves
teacher’s competence in the use of instructional methods. Optimum performance in the
learning task would occur only when appropriate instructional media are employed in
teaching. The use of these media would spur curiosity and eagerness among students to
master performance skills. Essien (2001) believed that instruction should be channeled
towards a specific goal. Teachers should endeavor to deliver their lesson using the most
appropriate teaching materials which will motivate, stimulate and capture the interest of
their students to learn and remember what is learnt and put into practice the learnt skills.
In the National Policy on Education (FGN 2004), the Federal Government has
emphasized the application of educational technology in Nigerian schools. It stated that
educational technology is the process of applying scientific knowledge devices and
techniques to the identification, analysis and solution of educational problems.
Unfortunately, this motivation has not found its proper place in Nigerian schools. Okeke
(1998) asserted that teachers have not yet tuned themselves to the importance and use of
instructional media in facilitating teaching-learning process. Essien (2001), clearly
illustrated how the use of media (simple visual media) facilitated and eased better
understanding and capture of more authentic information with better view of images and
general sharpening of intelligence.
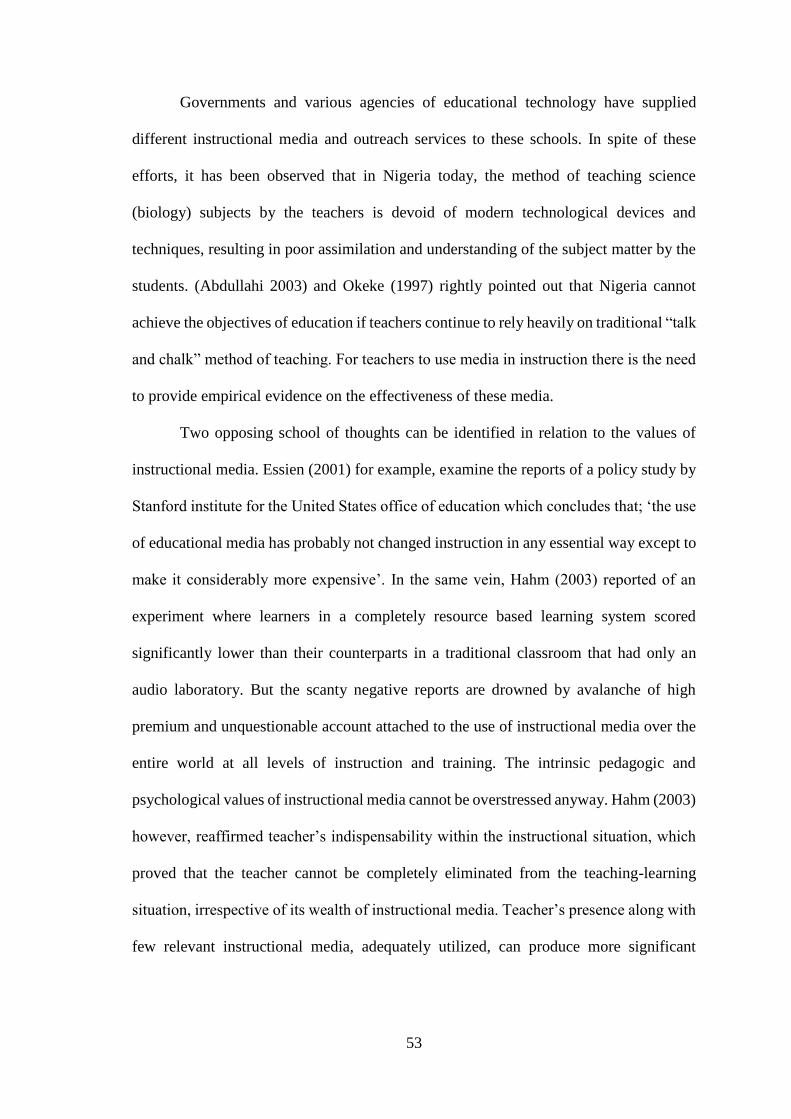
53
Governments and various agencies of educational technology have supplied
different instructional media and outreach services to these schools. In spite of these
efforts, it has been observed that in Nigeria today, the method of teaching science
(biology) subjects by the teachers is devoid of modern technological devices and
techniques, resulting in poor assimilation and understanding of the subject matter by the
students. (Abdullahi 2003) and Okeke (1997) rightly pointed out that Nigeria cannot
achieve the objectives of education if teachers continue to rely heavily on traditional “talk
and chalk” method of teaching. For teachers to use media in instruction there is the need
to provide empirical evidence on the effectiveness of these media.
Two opposing school of thoughts can be identified in relation to the values of
instructional media. Essien (2001) for example, examine the reports of a policy study by
Stanford institute for the United States office of education which concludes that; ‘the use
of educational media has probably not changed instruction in any essential way except to
make it considerably more expensive’. In the same vein, Hahm (2003) reported of an
experiment where learners in a completely resource based learning system scored
significantly lower than their counterparts in a traditional classroom that had only an
audio laboratory. But the scanty negative reports are drowned by avalanche of high
premium and unquestionable account attached to the use of instructional media over the
entire world at all levels of instruction and training. The intrinsic pedagogic and
psychological values of instructional media cannot be overstressed anyway. Hahm (2003)
however, reaffirmed teacher’s indispensability within the instructional situation, which
proved that the teacher cannot be completely eliminated from the teaching-learning
situation, irrespective of its wealth of instructional media. Teacher’s presence along with
few relevant instructional media, adequately utilized, can produce more significant
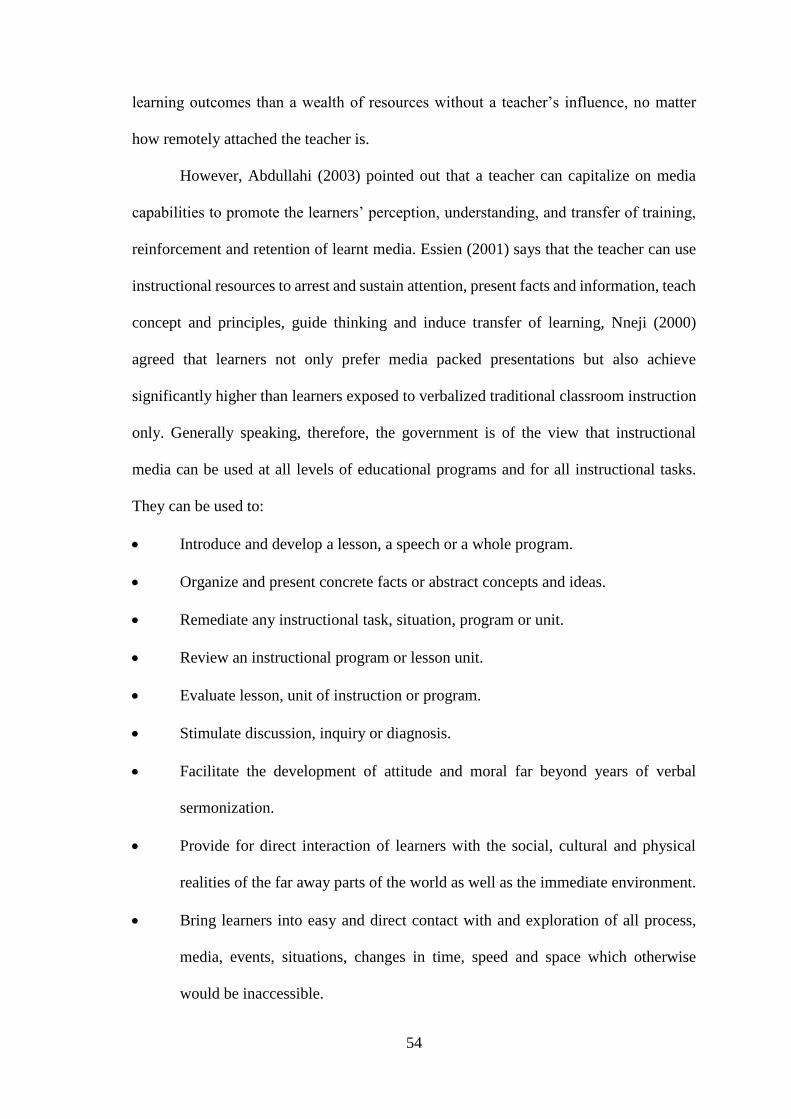
54
learning outcomes than a wealth of resources without a teacher’s influence, no matter
how remotely attached the teacher is.
However, Abdullahi (2003) pointed out that a teacher can capitalize on media
capabilities to promote the learners’ perception, understanding, and transfer of training,
reinforcement and retention of learnt media. Essien (2001) says that the teacher can use
instructional resources to arrest and sustain attention, present facts and information, teach
concept and principles, guide thinking and induce transfer of learning, Nneji (2000)
agreed that learners not only prefer media packed presentations but also achieve
significantly higher than learners exposed to verbalized traditional classroom instruction
only. Generally speaking, therefore, the government is of the view that instructional
media can be used at all levels of educational programs and for all instructional tasks.
They can be used to:
Introduce and develop a lesson, a speech or a whole program.
Organize and present concrete facts or abstract concepts and ideas.
Remediate any instructional task, situation, program or unit.
Review an instructional program or lesson unit.
Evaluate lesson, unit of instruction or program.
Stimulate discussion, inquiry or diagnosis.
Facilitate the development of attitude and moral far beyond years of verbal
sermonization.
Provide for direct interaction of learners with the social, cultural and physical
realities of the far away parts of the world as well as the immediate environment.
Bring learners into easy and direct contact with and exploration of all process,
media, events, situations, changes in time, speed and space which otherwise
would be inaccessible.
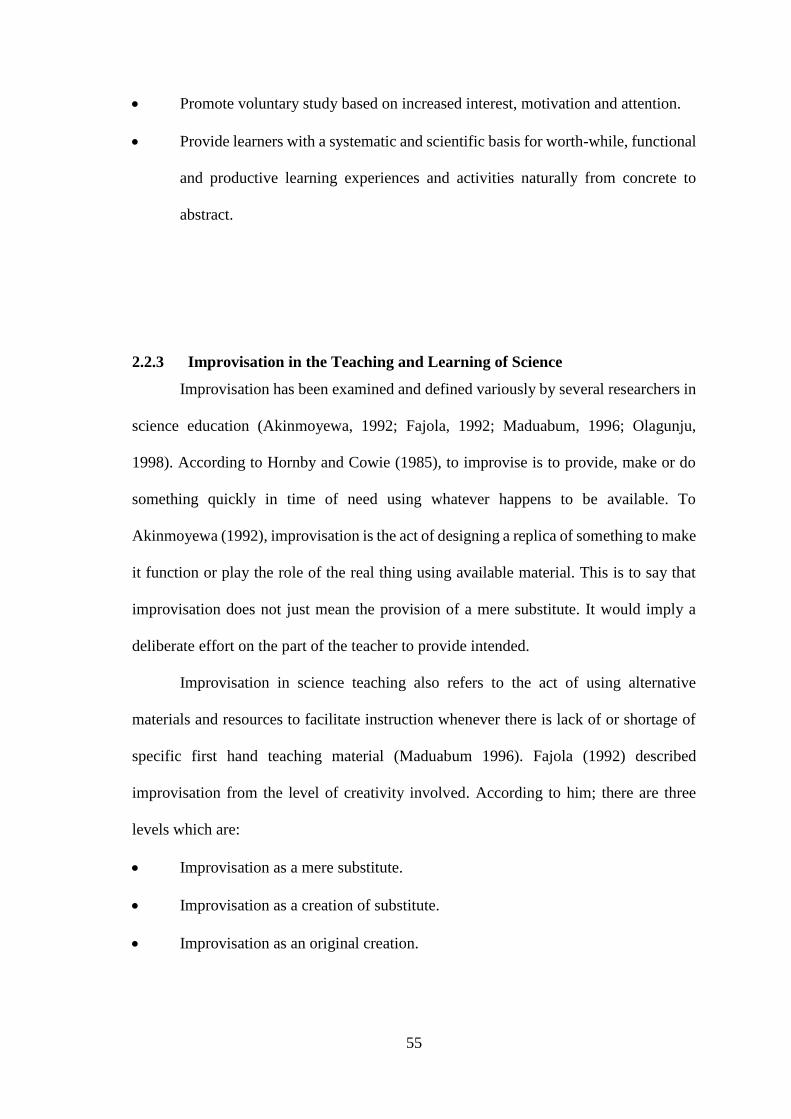
55
Promote voluntary study based on increased interest, motivation and attention.
Provide learners with a systematic and scientific basis for worth-while, functional
and productive learning experiences and activities naturally from concrete to
abstract.
2.2.3 Improvisation in the Teaching and Learning of Science
Improvisation has been examined and defined variously by several researchers in
science education (Akinmoyewa, 1992; Fajola, 1992; Maduabum, 1996; Olagunju,
1998). According to Hornby and Cowie (1985), to improvise is to provide, make or do
something quickly in time of need using whatever happens to be available. To
Akinmoyewa (1992), improvisation is the act of designing a replica of something to make
it function or play the role of the real thing using available material. This is to say that
improvisation does not just mean the provision of a mere substitute. It would imply a
deliberate effort on the part of the teacher to provide intended.
Improvisation in science teaching also refers to the act of using alternative
materials and resources to facilitate instruction whenever there is lack of or shortage of
specific first hand teaching material (Maduabum 1996). Fajola (1992) described
improvisation from the level of creativity involved. According to him; there are three
levels which are:
Improvisation as a mere substitute.
Improvisation as a creation of substitute.
Improvisation as an original creation.
56
Eyetsemitan (2004) shared this view and described these levels of improvisation
as role substitution and role simulation. Improvisation is seen as a role substitute or mere
substitute when the original material is slightly modified in order to perform novel
function in an experimental set up. For instance a glass cup substituting a beaker or
drinking straw for delivery tube. Improvisation as a creation of substitute is illustrated
with model creation, drawing charts, pictures and cartoon. The third level-original
creation or role simulation is when actual construction of material is undertaken by the
teacher with the aid of the local carpenter or other craftsmen as an emergency measure
because the needed material is not available or too expensive and not affordable.
Adebimpe (1997) and Momoh (2004) lent support to the above descriptions and
summarized that improvisation in all its usage means any of the following:
Substituting a material for another to serve the same purpose.
Altering a device or an idea to serve different functions
Converting a teaching material or equipment into another form.
Originating or formulating totally new material for serving a particular function
Initiating or devising an idea or material as a means of solving an instructional
problem at hand.
In continuation, Adebimpe made it clear that improvisation in science teaching
should be seen as making available for use materials which the teacher provides in the
absence of the readymade standard materials in order to facilitate learning or make lesson
more interesting. All said and done and for the purpose of this study, improvisation as
defined by Mohammed (1997) and Olagunju (1998) will be adopted which states that
improvisation is an act of using alternative materials obtainable from the local
environment or designed or constructed by the teacher or with the help of local person to
facilitate instruction.
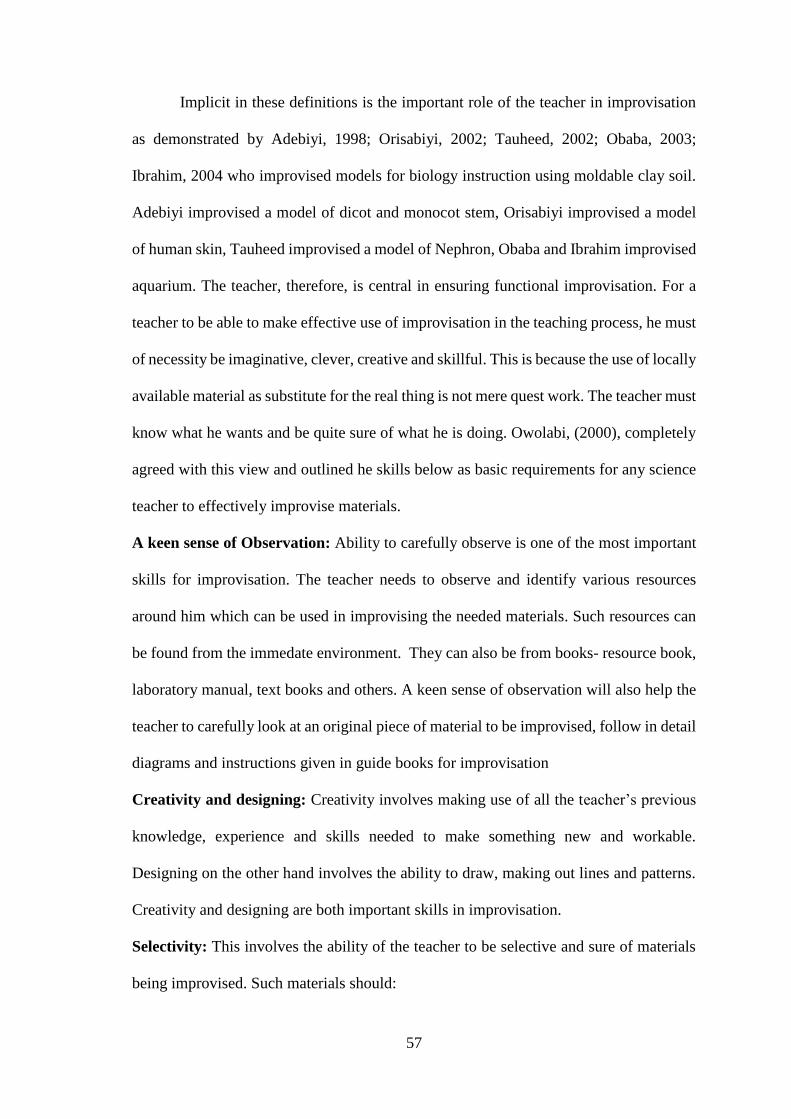
57
Implicit in these definitions is the important role of the teacher in improvisation
as demonstrated by Adebiyi, 1998; Orisabiyi, 2002; Tauheed, 2002; Obaba, 2003;
Ibrahim, 2004 who improvised models for biology instruction using moldable clay soil.
Adebiyi improvised a model of dicot and monocot stem, Orisabiyi improvised a model
of human skin, Tauheed improvised a model of Nephron, Obaba and Ibrahim improvised
aquarium. The teacher, therefore, is central in ensuring functional improvisation. For a
teacher to be able to make effective use of improvisation in the teaching process, he must
of necessity be imaginative, clever, creative and skillful. This is because the use of locally
available material as substitute for the real thing is not mere quest work. The teacher must
know what he wants and be quite sure of what he is doing. Owolabi, (2000), completely
agreed with this view and outlined he skills below as basic requirements for any science
teacher to effectively improvise materials.
A keen sense of Observation: Ability to carefully observe is one of the most important
skills for improvisation. The teacher needs to observe and identify various resources
around him which can be used in improvising the needed materials. Such resources can
be found from the immedate environment. They can also be from books- resource book,
laboratory manual, text books and others. A keen sense of observation will also help the
teacher to carefully look at an original piece of material to be improvised, follow in detail
diagrams and instructions given in guide books for improvisation
Creativity and designing: Creativity involves making use of all the teacher’s previous
knowledge, experience and skills needed to make something new and workable.
Designing on the other hand involves the ability to draw, making out lines and patterns.
Creativity and designing are both important skills in improvisation.
Selectivity: This involves the ability of the teacher to be selective and sure of materials
being improvised. Such materials should:
58
Be valid and authentic to knowledge and skills to be taught,
Cover topic intensively and extensively,
Be relevant to the fulfillment of the objectives of the topic,
be simple, readily replicable and durable,
be relatively cheap.
not differ significantly in quantity and reliability from conventional type,
Appeal to the senses,
Attract and hold attention
Focus the attention of learners on the essentials to be learnt at the proper time.
Basic woodwork and better work skills: These skills are necessary to carry out
improvisation. This is because wood and metal are the most common materials used in
improvisation of science material. It is therefore necessary for the teacher to be able to
know how to use basic tools like saws, chisels and land smoothing planers. However, it
is necessary to point out that a teacher does not have to be an expert in woodwork in order
to carry out improvisation. All that is necessary is the resourcefulness and the
determination of the teacher.
Iwuozor (2000) opined that the issue of improvisation in science teaching is so
important that no amount of discussion on it can be too much. In continuation, he
remarked that it is one thing to improvise and another thing for the improvised to be
effectively used. According to Iwuozor (2000) any teacher who intends to achieve
maximum result from the use of improvised materials should be guided by the following
hints:
General principles: The teacher should have comprehensive knowledge of the subject
matter to be taught and thorough understanding of the learning process generally.
59
Review of materials: The teacher should check for accuracy of the information contained
in the material and confirm that the material is in good order before the time for use.
According to Wasagu (2000) and Eyetsemitan (2004), improvisation for science
teaching has both intrinsic and extrinsic values. The intrinsic values of improvisation
consists of the aesthetic nature of such production which as a result of the producer’s
ingenuity, creative tendencies and productivity which makes the production good in itself
irrespective of the educational goals that could be achieved when it is applied in the
teaching-learning process. The extrinsic values on the other hand include the following
among others:
It presents next to real situations to students in the absence of real thing, in other
words, it fills the vacuum that otherwise would have existed in teaching and
learning process and provide a frame of reference on which students can focus
their attention during classroom activities
It enables the supplementing of verbal description and explanation with
observable or touchable/ manipulable objects thereby creating a context to focus
discussion, thus making teaching and learning process easier.
It is necessary as a way of widening inquiry, curiosity, creativity and productive
application of intellect as well as a means of local application of the universality
of science.
It helps to take care of population explosion by providing more materials which
would have been very expensive to procure. Thus it promotes the possibility of
self sustenance by the school.
It has pragmatic or instrumental value since it is used in achieving specific
educational goals.
60
2.2.3a Rationale for improvisation
The need to improvise some materials or substitute for others dates back to the
genesis of experimental science (Soyibo 1993). This is when the earliest pioneering
scientists had to originate both their ideas and the materials needed to empirically
demonstrate and authenticate their validity. However, it became prominent after the
Second World War when UNESCO sponsored a small publication meant for science
teachers in war devastated areas. Realizing that the publication is useful not only to war
devastated areas but wherever there is little or no equipment for science teaching, it was
expanded and has given birth to the present UNESCO source book for science teaching.
In Nigeria, the need for improvisation of materials become more urgent and
relevant from the 1970’s when the Nigerian school system began to experience
population explosion. This has given birth to greater demand for classroom instructional
facilities and equipment (Aguele 2000). This view was also confirmed by Akinrotohum
(2000) when he noted that public and private secondary schools are growing in Nigeria
at an alarming rate. The ever-thick students’ population in these schools justifies such
growth. The problem however is the inability of the owners of these schools to provide
adequate teaching materials required for effective learning in the areas of science in
general and biology in particular. Judging from the economic and political climate in the
country, things are not likely to improve, consequently, the demand for instructional
materials, tools and equipment will continue to increase. The only visible way to cope
with this high demands in the school system is to improvise as much as possible.
Biology as a science is activity-oriented. The suggested method for teaching it
which is guided-discovery method is resource based a consequence of the nature of the
subject as a living and practical subject. This suggests that the mastery of biology
concepts cannot be fully achieved without the use of instructional materials. Maduabum
61
(1989:56) shared this view and pointed out that “a professionally qualified science teacher
no matter how well trained would be unable to put his ideas into practice if the school
setting lacks the equipment and materials necessary for him/her to translate his
competence into reality”. The importance of instructional media material in the teaching
and learning of science cannot be over emphasized. Yet many science educators (Frazer,
Okebukola and Jegede, 1992; Soyibo, 1993; Mohammed 1997; Thomas 2004; Gana
2006) have shown that materials for teaching and learning science in Nigerian schools
are very much in short supply. The need to improvise some materials as substitutes for
the non-available therefore becomes imperative. Nwosu (2000) remarked that
improvisation should be an important and integral part of teaching and learning process.
Improvisation makes one to use self made equipment and materials made to one’s
specification (NTI 1990). Any biology teacher, who is conversant with certain visual
materials like models and charts bought from science equipment supplying companies,
would be amazed at the quality of some of these materials. Sometimes, these materials
are too detailed for the level of students a teacher is teaching. Some others play down on
the part that would have interested the students. Examples, of these are seen with the
models of the skin, the eye, the ear and the chart of the circulation of the blood and
respiration. Teachers made models and charts display only those features that need to be
known by the students. In addition, the teacher employs various devices such as
illumination that will aid the understanding of the concept. Consequent upon this stand,
the need to improvise in this study still finds its place.
The claim of huge amount of money being expended on education
notwithstanding, one of the major problems confronting curriculum reforms and
innovation in Nigeria can be traced to unavailability of funds and the consequent
inadequate or non-availability of teaching learning materials. Mogbo (1990) as cited in
62
Eyetsemitan (2004) noted that elaborate equipment made by commercial manufacturers
is prohibitively expensive and in most cases they are not readily available in the market.
Mogbo (1990) as cited in Eyetsemitan (2004) specifically stated that 74% of the standard
factory made instructional materials which were needed for teaching was either in short
supply or nonexistent. Adekola (1997) emphasized that high cost of materials negate their
use for ordinary classroom teaching. The sky rocketing cost of standard instructional
material is a cause of need for improvisation in science teaching.
In a period of economic recession, there is little hope that sufficient funds would
be provided by the government for the purchase of standard science teaching materials
for the science schools. This situation is further compounded by the galloping inflation
in the country and unrelated-ness of some of the standard sophisticated materials and
equipment. With the limited government resources, the teachers’ ingenuity to improvise
becomes tasking for learning to be effective and productive. Consequently, the need to
improvise more science instructional materials from locally available materials appears
more mandatory now. Nwosu (2000) visioned that the call for improvisation is very
appropriate and that the present financial predicament in the face of ever demanding
changing curricular and educational policies gives added impetus to drive towards
improvisation in schools.
Aguele (2000) summarized the reasons why improvisation may be needed in
schools and stated that:
Improvisation becomes imperative in a situation where there are scarce resources
and facilities.
Improvisation provides a cognitive “bridge” between abstraction and reality.
63
Improvisation undertaken by a teacher enables him to rethink and research for
cheaper, better and faster methods of making the teaching and learning process
easier for students.
Improvisation helps in focusing teaching to key classroom discussion.
Improvisation presents next to real situation to students in the absence of real
things.
Improvisation saves cost and in addition, the teacher makes positive efforts
towards effective instruction.
Nwankoby (1988) is of the opinion that the rationale for improvisation will not
only be to produce materials that are comparable in quality and utility to those produced
in the industrialized world’s but also to tailor the development specifically to the
educational needs of the learners and areas served by the improvised material. This is
because failure of most of the foreign audio-visual materials is usually attributed to their
sole reliance on electricity as the only source of power. Most of them are designed with
little or no regards to the fact that some rural areas do not have electricity. It is only
through improvisation that this problem could be tackled by finding alternative to
hitherto, strictly A-C-powered materials and equipment in the market today. Adekola
(1997) added that the sizes of materials can also call for improvisation. Materials that are
too big and cannot be brought to the classroom or are too small to be seen can be made
available for classroom use through improvisation. Akinmuyewa and Delu (1994)
supported this and stated that where an airplane is to be used for teaching in a class, an
airplane could be made to suit the classroom size and teaching purpose through
improvisation. Consequent upon the foregoing discussions, what comes to mind here is,
what is improvisation? The need for improvisation in the teaching-learning process
cannot be over emphasized.

64
2.2.3b Constraints on improvisation in the teaching and learning of Science
Improvisation of science teaching resources is not a come-easy-go-easy affair.
There are problems confronting it, which can be broadly classified as technical and
human factors.
Technical Factor
These include teaching and financial factors. Teaching factors according to
Dareng and Timku (1997) relate to the degree of accuracy and precision inherent in the
improvised material. They noted that the degree of accuracy and precision of the factory
made material is lost when they are improvised. However, Mohammed (1997)
enlightened that a way of combating this problem is to seek the assistance of local
personnel in the construction of certain improvised materials. The teacher should
supervise the construction to ensure that they conform to specifications. Other teaching
factors are the problems inherent in the use of improvised materials. Such include, ease /
difficulty of handling, durability of the materials, cleanliness / compactness and
convenience or otherwise at use.
Financial factors deal with the question of how cheap or expensive improvised
materials are availability of funds for the purchase of raw materials and/or handy simple
workshop tools or their availability in the school. Reacting to the above, Yoloye (1989)
and Boateng (1986) retorted that whether improvised materials cost less than standard
ones or not, the issue is that they still cost money. This money is usually not readily
available for the teacher.
65
Human Factor:
On the other hand, the human factors, which seem more crucial are problems
associated with the teacher’s professional commitments, creative ability, technical skills,
ingenuity and competence. The problem of commitment is very serious because
improvisation requires creative imagination. If a teacher is not committed to improving
his instruction, he will not creatively think of substitutes for materials and how to
improvise them. Maduabum (1990) identified lack of adequate professional training as a
major problem militating against the effective improvisation in teaching science.
Danjuma, Abdullahi and Gero (1997) conducted research on factors affecting chemistry
teacher’s attitude towards improvisation. The study used thirty two (32) chemistry
teachers drawn from fourteen (14) selected secondary schools in Bauchi and Gombe
states of Nigeria. A 22- item attitudinal questionnaire was administered. The result of the
study showed that there is a significant difference between the mean scores of trained and
untrained, and also between the experienced and inexperienced chemistry teachers on
attitude towards improvisation respectively. This is an indication that training could be a
factor in determining teacher’s attitude to improvisation. Nwaizugbe (1991) agreed with
this and remarked that many teachers find it difficult to improvise instructional materials
because of poor training exposure and lack of basic tools for improvisation. Maduabum
(1996) made it clear that improvisation demands adventure, creativity, curiosity and
perseverance on the part of the teachers and such skills are only realizable through well
planned training programe on improvisation. This, Maduabum emphasized that this is yet
to be solidly rooted into other teacher training programme.
Mohammed (1991) observed that the problem in Nigeria is that very few teachers
practice improvisation, while majority depend on either imported equipment or nothing.
66
Akinsola (2000) clarified the above observation through a study he carried out in
Kontagora to investigate the ability of primary school teachers towards improvisation.
He used 13 female and 9 male teachers, a total of 22 teachers drawn from five primary
schools. They were given 3-item questionnaires and were instructed to indicate which of
the materials they could improvise. The result proved that primary school teachers have
poor ability to improvise and there was no appreciable difference between the
performance of female and male teachers. Eyetsemitan (2004) similarly noted that many
Nigerian science teachers were aware of possibility of improvisation but many exhibited
negative attitude towards it. He almost discovered that most teachers claim that
improvisation is time consuming, fund depleting and a needless coloration.
2.2.4 Biology in the Senior Secondary School Curriculum
Biology is one of the science subjects in the Nigerian secondary school curriculum.
Richman (2001:44) defined it as “the scientific study of all forms of life including plants,
animals and microorganism”. It deals with the internal, external and behavioral aspects
of all living organisms. Richman (2001) described these aspects as the “numerous field”
of Biology and listed them as cytology (the study of cells); embryology (the study of
developments), genetics (the study of heredity); biochemistry (the study of chemical
structure of living things), morphology (the study of anatomy), taxonomy (the
identification, names and classification of organisms) and physiology (the study of how
organisms function and respond to stimuli).
Biology is traditionally divided into two components, which are Botany (the study
of plants) and Zoology (the study of animals). Plants and animals are regarded as living
organisms because they engage in certain processes such as nutrition (feeding),
respiration, movement, growth ,excretion, sensitivity(irritability) and reproduction
(Ewusie 1980). Plants and animals have different features, sizes, characteristics and so
67
on. All these diversified features lead to the concept of taxonomy of living forms where
organism are classified under kingdoms, phyla (division is used for plants only), classes,
orders, families, genus and species.
Biology, as a discipline, has experienced a number of changes since its inception.
Kareem (2003) observed that biology was “largely descriptive, weak in quantitative and
lacking in strong conceptual foundation that marked physics and chemistry up till the
beginning of 20th century. This position, however, changed towards the middle of the
century and emphasis shifted to morphological biology. The current Nigerian secondary
school biology curriculum is a product of research conducted by the Comparative
Education Study and Adaptation Centre (CESAC), University of Lagos, which was then
critiqued in a workshop in 1984. The Joint Consultative Committee (JCC) and in
particular, its Reference Committee on Secondary Education fine-tuned the
recommendation of CESAC in April 1985. This was finally adopted by the Federal
Government in that same year (Federal Ministry of Education, 2004) as the biology
curriculum for senior secondary schools in Nigeria.
The Biology Curriculum, therefore, is the learning experiences (topics) that students
are exposed to at a particular level in order to attain the set goals. The Secondary School
biology curriculum has seven basic conceptual headings which are biology and life,
interaction in nature, micro-organism man and health, unit of life, living organism in its
environment, sexual reproduction and the new organism, and variability heredity and
evolution. The senior secondary biology syllabus is spirally or concentrically arranged.
This spiral arrangement ensures that the concepts learnt in SSS 1 also feature in SSS II
and SSS III but in higher orders. The objectives of the Biology curriculum for senior
secondary schools were derived from the National Policy on Education (2004). They
include adequate laboratory and field skills in Biology, meaningful and relevant
68
knowledge in Biology, Reasonable and functional scientific attitudes and ability to apply
scientific knowledge to everyday life in matters of personal and community health and
Agriculture. Following the above objectives, it could be stated that Biology content
places emphasis on: - field studies, guided discovery, laboratory techniques and skills,
together with conceptual thinking. This curriculum then sets to provide modern Biology
course to meet the needs of the society. According to Oyekan (1999) Biology is a subject
of universal interest in human development, especially with regard to the usage of its
knowledge in real life situations. It has actually permeated most aspects of our economic
and public life. Biology embraces a variety of fields of study and is combined with other
subjects to satisfy senior secondary school certificate examination (SSCE) requirements
(Soyibo 1982). This has brought the dire need of Biology in the secondary schools science
curricula.
The interdisciplinary nature of Biology makes it to appeal to a wider audience.
Biology thus appears to be the centre point for Arts and Science subjects, because of this
it is the only laboratory science subject that non science students embrace in secondary
schools (Watson 1991). In spite of its interdisciplinary nature, coupled with the
preferential selection for the SSCE, WAEC (2007, 2009) it was observed that some
students still exhibit non-challant attitude in the learning of Biology which often manifest
in poor performance. This fact is borne out of the fact that majority of the candidates
would not offer it for advanced studies. Another reason for nonchalance is the candidates’
assumption that even though Biology is a science subject and somehow compulsory, it is
the least intellectually demanding of the three traditional science subjects-Physics,
Chemistry and Biology (WAEC 2009), and could be offered and passed with minimal
effort (Kareem 2003).

69
These types of erroneous beliefs usually make Biology class a mixture of students
with a broad spectrum of abilities, interests and expectations. These in turn reflect the
students’ ignorance which sometimes makes them to postpone the study of Biology with
respect to other school subjects. In this regard, majority of the students are likely to
display inadequate aptitude/ability for the cognitive and affective demands of the
enormous work in the current inquiry-based Biology curriculum. According to Oyekan
(1993), “these students’ weaknesses can significantly impede effective learning,
understanding and retention of Biological concepts”
2.2.5 Human Blood Circulation and Excretion Mechanisms
2.2.5.1 The Structure of the Heart and Circulation of Blood
The center of the circulatory system is the heart, which is the main pumping
mechanism. The heart is made of muscle, shaped something like a cone, with a pointed
bottom and a round top. The heart is in the middle of the chest. It fits snugly between the
two lungs. It is held in place by the blood vessels that carry the blood to and from its
chambers. The heart is tipped somewhat so that there is a little more of it on the left side
than on the right (TutorVista 2008).
The heart is divided into a left half and a right half by a muscular wall called
septum. The septum is solid so that blood cannot flow back and forth between
the left and right halves of the heart. Another wall separates the rounded top part
of the heart from the cone-shaped bottom part. So there are actually four
chambers (spaces) inside the heart. The top chambers are called auricles. The
bottom chambers are called ventricles. The auricles are often referred to as
holding chambers, while the ventricles are called pumping chambers.
70
Thus, each side of the heart forms its own separate system, a right heart
and a left heart. Each half consists of an auricle and a ventricle, and blood can
flow from the top chamber to the bottom chamber, or ventricle, but not between
the two sides .Blood can flow from the auricles down into the ventricles because
there are openings in the walls that separate them. These openings are called
valves (bicuspid and tricuspid valves) which open in one direction to let the
blood pass through then they close, so that the blood cannot flow backwards into
the auricles. There are also valves at the bottom of the large arteries that carry
blood away from the heart: the aorta and the pulmonary artery. These valves
keep the blood from flowing backward into the heart once it has been pumped
out. The heart is a pump whose walls are made of thick muscle that can squeeze
(contract) to send blood rushing out. The blood when it leaves the heart flows
smoothly in tubes called blood vessels. First, the blood flows into tubes called
arteries. The arteries soon branch again and again to form smaller and smaller
tubes called capillaries. These form a fine network of tiny vessels throughout the
body.
The capillaries have extremely thin walls so that the blood that they carry
can come into close contact with the body tissues to deliver the oxygen they carry
to nearby cells. As the blood flows through the capillaries, it also collects carbon
dioxide from the body cells. The capillaries containing carbon dioxide return this
used blood to the heart through a different series of branching blood vessels -the
veins which in turn unite with each other to form larger veins until the blood
from the body is finally collected into the large veins that empty into the heart.
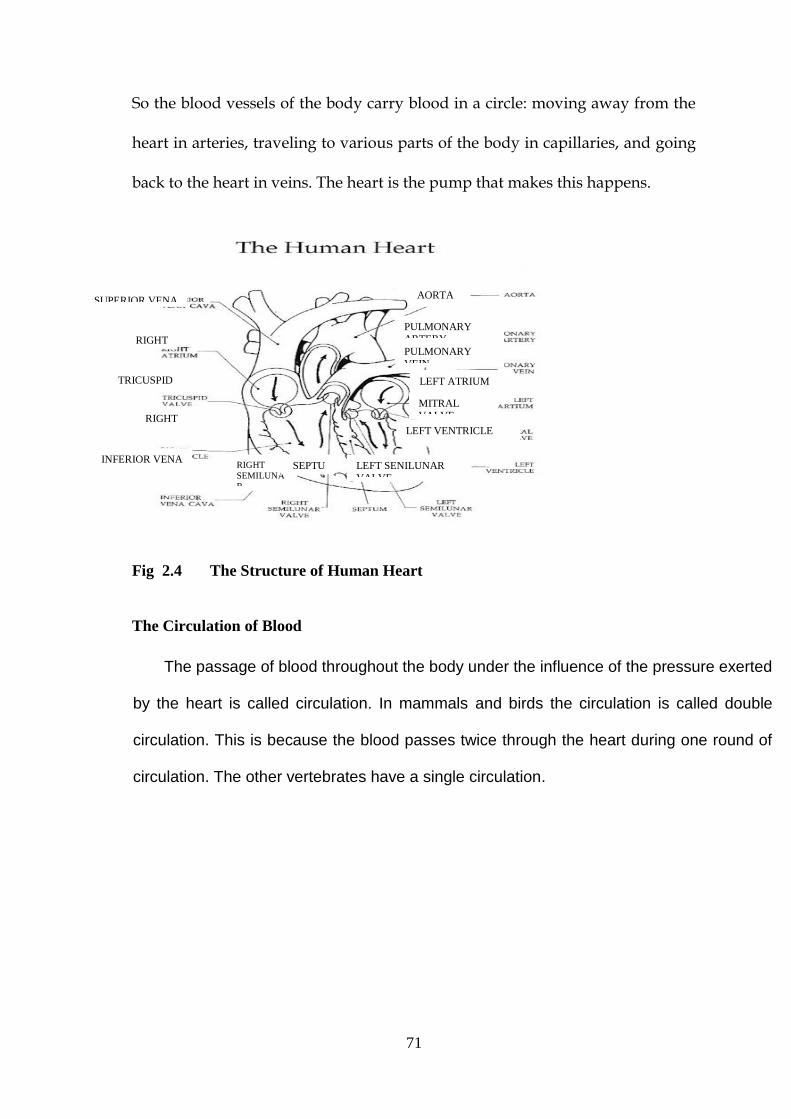
71
So the blood vessels of the body carry blood in a circle: moving away from the
heart in arteries, traveling to various parts of the body in capillaries, and going
back to the heart in veins. The heart is the pump that makes this happens.
Fig 2.4 The Structure of Human Heart
The Circulation of Blood
The passage of blood throughout the body under the influence of the pressure exerted
by the heart is called circulation. In mammals and birds the circulation is called double
circulation. This is because the blood passes twice through the heart during one round of
circulation. The other vertebrates have a single circulation.
SUPERIOR VENA
RIGHT ATRIUM
TRICUSPID VALVE
RIGHT VENTRICLE
INFERIOR VENA CAVA
RIGHT
SEMILUNA
R
SEPTUM
LEFT SENILUNAR VALVE
LEFT VENTRICLE
MITRAL VALVE
LEFT ATRIUM
PULMONARY
VEIN
PULMONARY ARTERY
AORTA
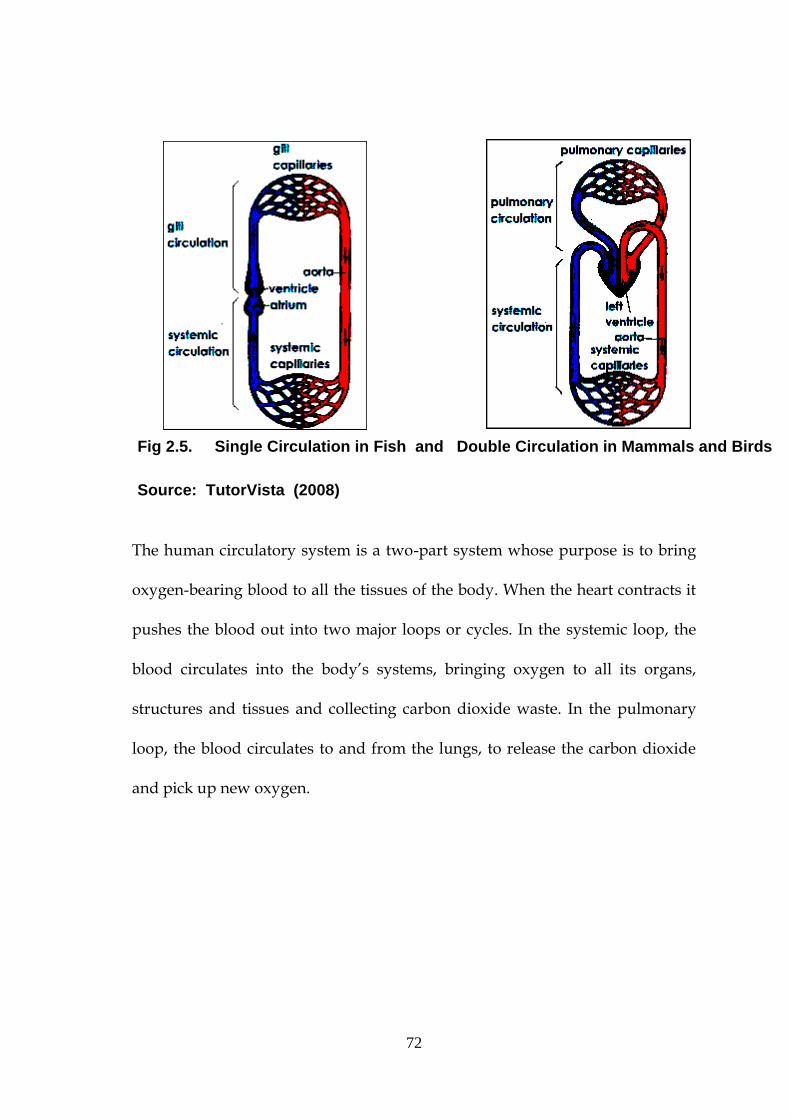
72
Fig 2.5. Single Circulation in Fish and Double Circulation in Mammals and Birds
Source: TutorVista (2008)
The human circulatory system is a two-part system whose purpose is to bring
oxygen-bearing blood to all the tissues of the body. When the heart contracts it
pushes the blood out into two major loops or cycles. In the systemic loop, the
blood circulates into the body’s systems, bringing oxygen to all its organs,
structures and tissues and collecting carbon dioxide waste. In the pulmonary
loop, the blood circulates to and from the lungs, to release the carbon dioxide
and pick up new oxygen.
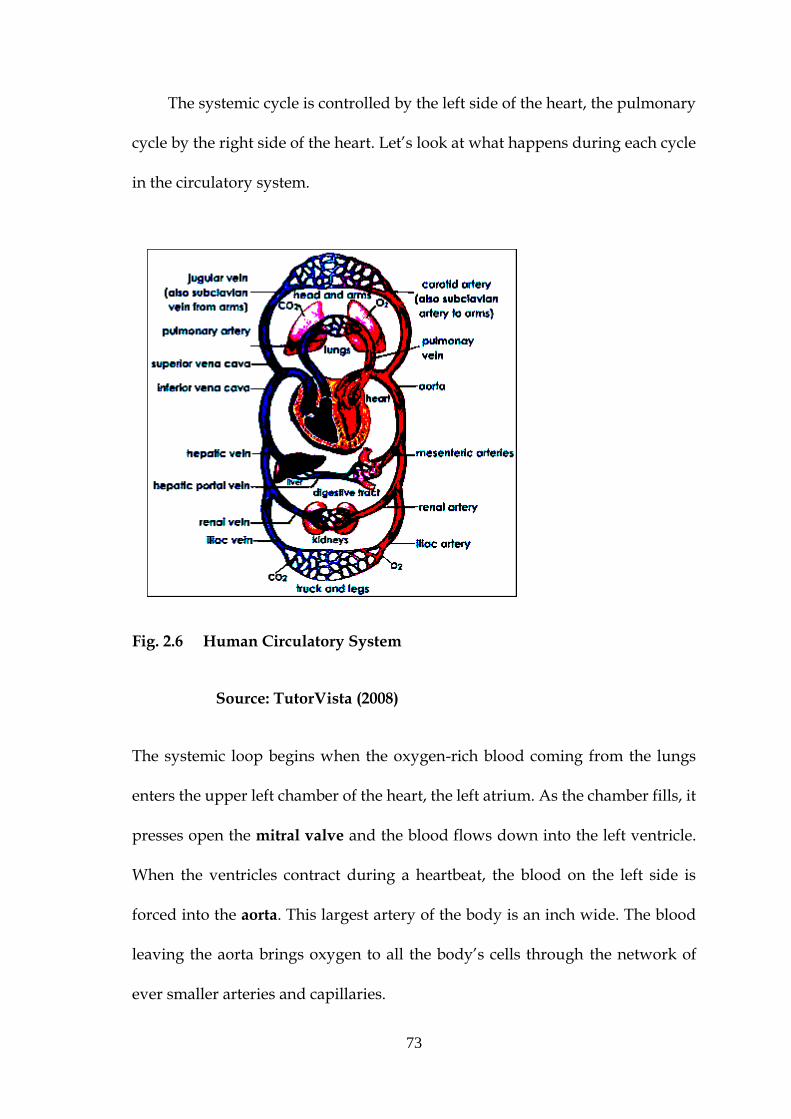
73
The systemic cycle is controlled by the left side of the heart, the pulmonary
cycle by the right side of the heart. Let’s look at what happens during each cycle
in the circulatory system.
Fig. 2.6 Human Circulatory System
Source: TutorVista (2008)
The systemic loop begins when the oxygen-rich blood coming from the lungs
enters the upper left chamber of the heart, the left atrium. As the chamber fills, it
presses open the mitral valve and the blood flows down into the left ventricle.
When the ventricles contract during a heartbeat, the blood on the left side is
forced into the aorta. This largest artery of the body is an inch wide. The blood
leaving the aorta brings oxygen to all the body’s cells through the network of
ever smaller arteries and capillaries.
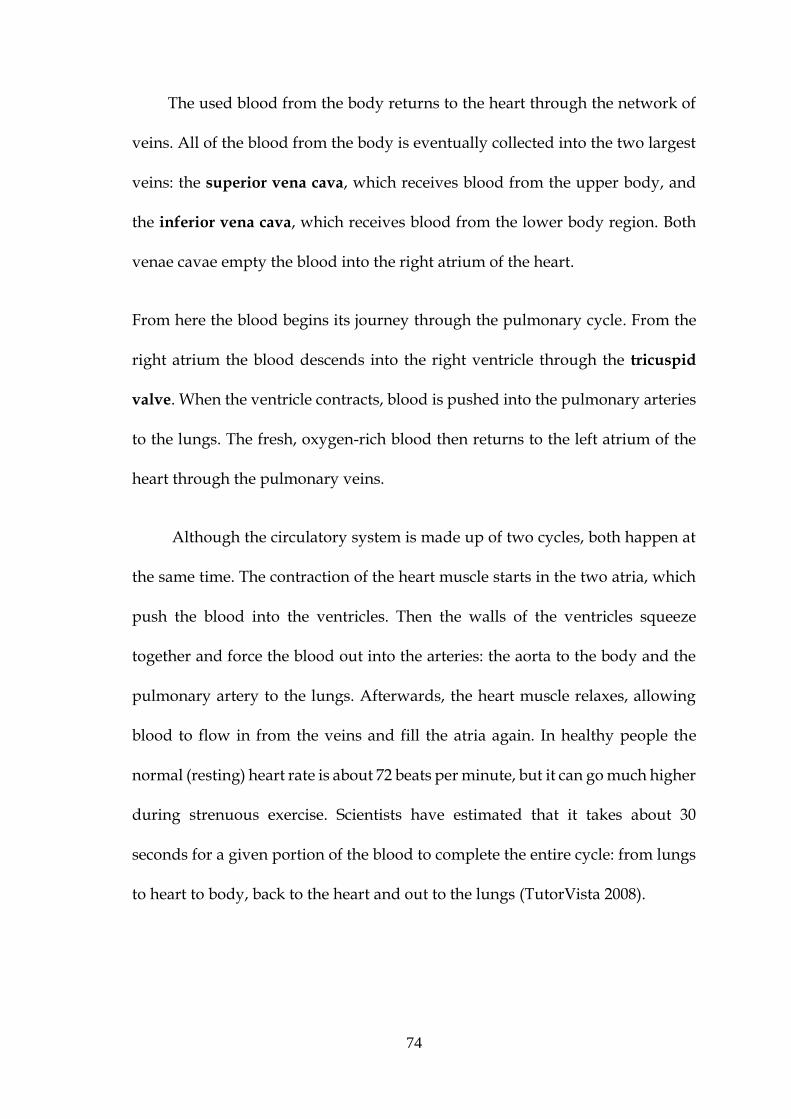
74
The used blood from the body returns to the heart through the network of
veins. All of the blood from the body is eventually collected into the two largest
veins: the superior vena cava, which receives blood from the upper body, and
the inferior vena cava, which receives blood from the lower body region. Both
venae cavae empty the blood into the right atrium of the heart.
From here the blood begins its journey through the pulmonary cycle. From the
right atrium the blood descends into the right ventricle through the tricuspid
valve. When the ventricle contracts, blood is pushed into the pulmonary arteries
to the lungs. The fresh, oxygen-rich blood then returns to the left atrium of the
heart through the pulmonary veins.
Although the circulatory system is made up of two cycles, both happen at
the same time. The contraction of the heart muscle starts in the two atria, which
push the blood into the ventricles. Then the walls of the ventricles squeeze
together and force the blood out into the arteries: the aorta to the body and the
pulmonary artery to the lungs. Afterwards, the heart muscle relaxes, allowing
blood to flow in from the veins and fill the atria again. In healthy people the
normal (resting) heart rate is about 72 beats per minute, but it can go much higher
during strenuous exercise. Scientists have estimated that it takes about 30
seconds for a given portion of the blood to complete the entire cycle: from lungs
to heart to body, back to the heart and out to the lungs (TutorVista 2008).
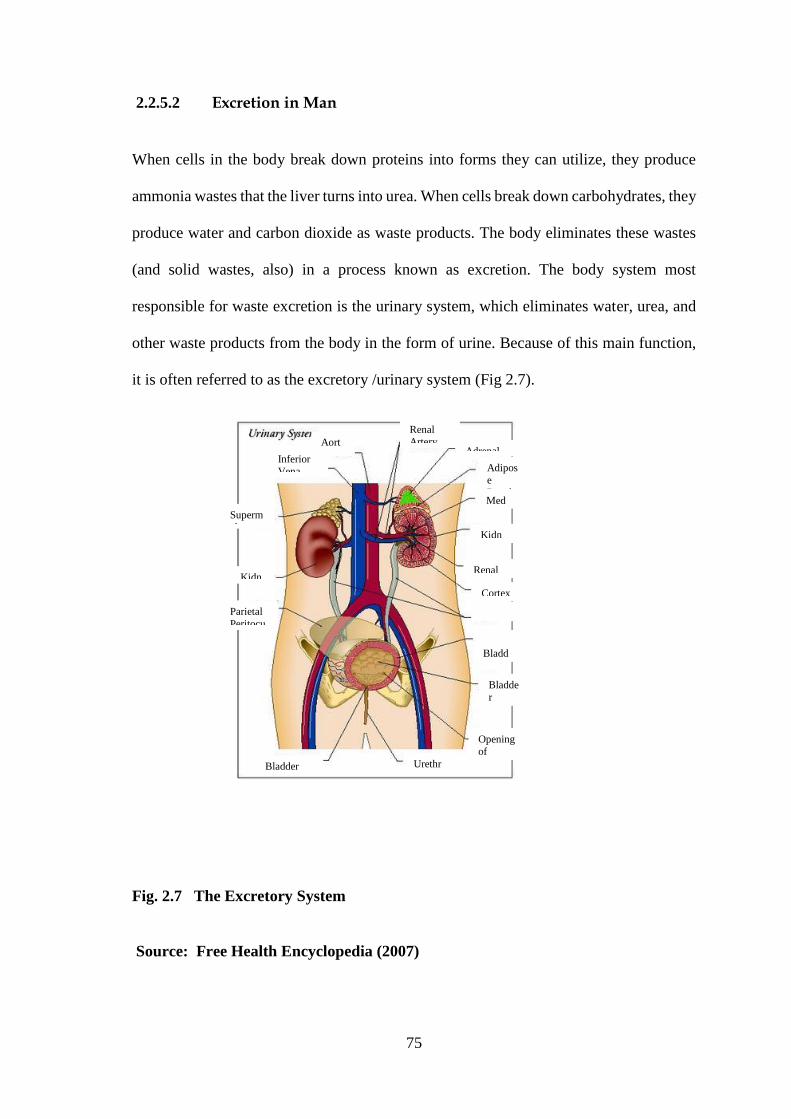
75
2.2.5.2 Excretion in Man
When cells in the body break down proteins into forms they can utilize, they produce
ammonia wastes that the liver turns into urea. When cells break down carbohydrates, they
produce water and carbon dioxide as waste products. The body eliminates these wastes
(and solid wastes, also) in a process known as excretion. The body system most
responsible for waste excretion is the urinary system, which eliminates water, urea, and
other waste products from the body in the form of urine. Because of this main function,
it is often referred to as the excretory /urinary system (Fig 2.7).
Fig. 2.7 The Excretory System
Source: Free Health Encyclopedia (2007)
Bladder
Outlet
Urethr
a
Opening
of
Ureters
Bladde
r
Lining
Bladd
er
Ureter
Cortex
Renal
Pelvis
Kidn
ey
Med
ula
Adipos
e
Renal
Adrenal
Renal
Artery Aort
a Inferior
Vena
Superm
al
Kidn
Parietal
Peritocu
76
The main organs of the urinary system are the kidneys, which form urine. The other parts
of the system—the ureters, the urinary bladder, and the urethra—neither form urine nor
change its composition. They are merely structures that transport urine from the kidneys
to the outside of the body.
The Kidneys
The kidneys are bean-shaped organs located on either side of the vertebral column. The
left kidney usually sits slightly higher than the right one. The size of an adult kidney is
approximately 4 inches (10 centimeters) long, 2.5 inches (6 centimeters) wide, and 1 inch
(2.5 centimeters) thick (Free Health Encyclopedia 2008). The upper portions of the
purplish-brown kidneys rest on the lower surface of the diaphragm. The lower portion of
the rib cage encloses and protects the kidneys. The kidneys are held in place by the
abdominal lining and supporting connective tissue.
On the side of each kidney facing the vertebral column is an indentation called
the hilus. Through the hilus the renal artery enters and the renal vein and ureter exit. The
renal artery brings blood to the kidneys from the abdominal aorta. The renal vein returns
blood to the inferior vena cava. Both the renal artery and renal vein have a right and left
branch, each connected to a corresponding kidney. Each kidney is covered with a thin yet
tough capsule of fibrous connective tissue which gives it a glistening appearance. Inside,
a kidney can be divided into three layers. The outer layer, light in color, is called the renal
cortex. The next layer, a darker reddish-brown, is called the renal medulla. It contains six
to eighteen pie-shaped structures called renal pyramids, the tips of which face toward the
center of a kidney.
Attached to the tips of the renal pyramids are cup-shaped tubes called calyces
(singular: calyx), which collect urine from structures in the renal pyramids. The smaller
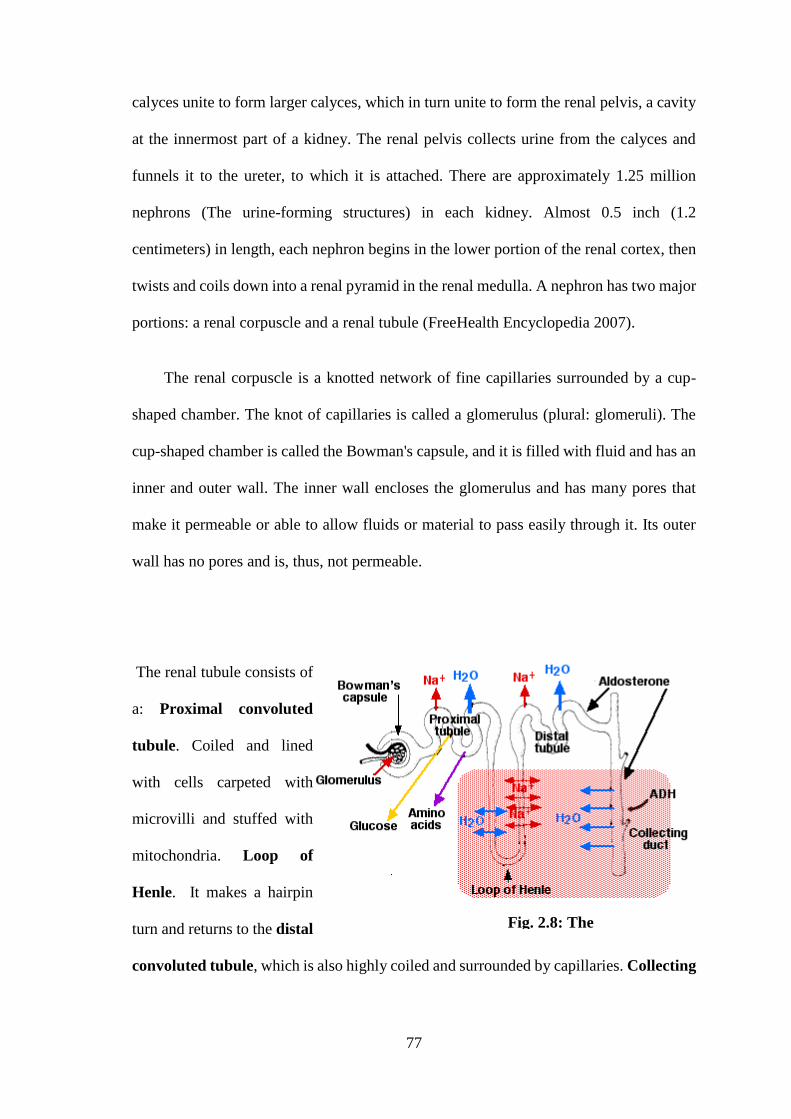
77
calyces unite to form larger calyces, which in turn unite to form the renal pelvis, a cavity
at the innermost part of a kidney. The renal pelvis collects urine from the calyces and
funnels it to the ureter, to which it is attached. There are approximately 1.25 million
nephrons (The urine-forming structures) in each kidney. Almost 0.5 inch (1.2
centimeters) in length, each nephron begins in the lower portion of the renal cortex, then
twists and coils down into a renal pyramid in the renal medulla. A nephron has two major
portions: a renal corpuscle and a renal tubule (FreeHealth Encyclopedia 2007).
The renal corpuscle is a knotted network of fine capillaries surrounded by a cup-
shaped chamber. The knot of capillaries is called a glomerulus (plural: glomeruli). The
cup-shaped chamber is called the Bowman's capsule, and it is filled with fluid and has an
inner and outer wall. The inner wall encloses the glomerulus and has many pores that
make it permeable or able to allow fluids or material to pass easily through it. Its outer
wall has no pores and is, thus, not permeable.
The renal tubule consists of
a: Proximal convoluted
tubule. Coiled and lined
with cells carpeted with
microvilli and stuffed with
mitochondria. Loop of
Henle. It makes a hairpin
turn and returns to the distal
convoluted tubule, which is also highly coiled and surrounded by capillaries. Collecting
Fig. 2.8: The
Nephron
78
duct. It leads to the pelvis of the kidney from where urine flows to the bladder and,
periodically, on to the outside world.
Formation of Urine
The nephron makes urine by filtering the blood of its small molecules and ions and
then reclaiming the needed amounts of useful materials. Surplus or waste molecules and
ions are left to flow out as urine. In 24 hours the kidneys reclaim 1,300 g of NaCl, 400 g
of NaHCO3, 180 g of glucose and almost all of the 180 liters of water that entered the
tubules. According to Free Health Encyclopedia (2008); the steps involve in urine
formation include the following:
Blood enters the glomerulus under pressure.
This causes water, small molecules (but not macromolecules like proteins) and
ions to filter through the capillary walls into the Bowman's capsule. This fluid is
called nephric filtrate. Nephric filtrate collects within the Bowman's capsule and
then flows into the proximal tubule.
Here all of the glucose, and amino acids, >90% of the uric acid, and ~60% of
inorganic salts are reabsorbed by active transport.
o The active transport of Na+ out of the proximal tubule is controlled by
angiotensin II.
o The active transport of phosphate (PO43-) is regulated (suppressed by) the
parathyroid hormone.
As these solutes are removed from the nephric filtrate, a large volume of the water
follows them by osmosis (80–85% of the 180 liters deposited in the Bowman's
capsules in 24 hours).
79
As the fluid flows into the descending segment of the loop of Henle, water
continues to leave by osmosis because the interstitial fluid is very hypertonic. This
is caused by the active transport of Na+ out of the tubular fluid as it moves up the
ascending segment of the loop of Henle.
In the distal tubules, more sodium is reclaimed by active transport, and still more
water follows by osmosis. Final adjustment of the sodium and water content of
the body occurs in the collecting ducts
2.3 Influence of Ability Levels and Gender on Students’ Academic Performance in
Science.
2.3.1 Ability Levels and Students’ Academic Performance.
The issue of achievement level and or ability grouping on academic
performance is among the oldest and most controversial issue in elementary and
secondary schools in Nigeria and elsewhere. It is a common practice in most schools in
Nigeria to find all sorts of children lumped together to be given the same treatment as if
they have everything in common. This is why Foin (2001) pointed out that within a given
classroom there are differences in the quality of work produced. Part of this variation in
performance may be due to mixed ability among students (high, medium and low). This
situation in the school system had led researchers into various studies.
Hollifield (1987) carried out a study on the effects of ability grouping in
elementary school students’ performance. He investigated the effects of the following
grouping plans on performance:
Ability grouped class assignment
Regrouping for reading and mathematics
Joplin plan
Non-graded plan
80
Within-class ability groups
Findings of this study revealed the following:
Ability group class assignment which placed students in one self-contained class
on the basis of ability level did not enhance students performance
Regrouping for reading and mathematics which assign students to heterogeneous
home room classroom which was later regrouped according to achievement level
for one or more subjects improved performance. However Slavin stressed that the
level and pace of instruction must be adapted to achievement level. Also, the
students must not be regrouped for more than one or two subjects.
Joplin plan which assigned students to heterogeneous classes for most of the day
but regrouped across reading instruction increased reading performance.
Within-class ability grouping which assigned students within their classes to a
small number of groups based on ability level, did not improve reading
performance but was very effective in mathematics performance.
Hollifield (1987) concluded that ability grouping increases students’
performance. The assumption is that ability grouping enabled teachers to increase the
pace and raise the level of instruction for high achievers, and to provide more individual
attention for low achievers. The higher achievers benefit from having to compete with
one another, and the low achievers benefit for not having to compete with their more able
peers. The study recommended that schools and teachers should use the grouping plans
which proved more effective such as within-class ability grouping and Joplin plan. One
of the main arguments against ability grouping is that the practice creates classes or
groups of low achievers who are deprived of example and stimulation provided by high
achievers. Labeling students according to ability and assigning them to low achievers
also communicate self-fulfilling low expectation. Further groups with low performance
81
often receive a low quality of instruction. Ability grouping creates academic elites, a
practice which is not democratically ideal.
Another study was carried out by Aiyedun (1995) on the influence of academic
ability of students on achievement. In his study, he used five hundred senior secondary
one (SS1) students drawn from fifteen schools in Kwara State. 1991 junior secondary
school certificate examination scores in mathematics were used as basis for the ability
level. The study revealed that academic ability influenced mathematics achievement. The
regression equation obtained showed that increase in academic ability is associated with
increase in achievement in mathematics.
Inyang and Ekpeyong (2000) conducted a pre-test, post-test study on the influence
of ability and gender groupings on senior secondary two (SS1) chemistry students’
achievement on the concept of redox reactions. One hundred and sixty chemistry students
drawn from two schools in Itu local government area of Akwa Ibom State formed the
sample for the study. They were assigned to experimental class of fifty mixed ability
group and control class of one hundred and ten homogeneous groups. Both groups were
exposed to activities on redox reactions as pre-test and post-test. T-test statistical analysis
of the data revealed significant difference between the mean post-test and pre-test scores
among the students of different ability levels in the performance on the concept of redox
reactions.
In another study conducted by Manrique, (1998), on the effects of display type
and spatial ability on performance during a virtual reality simulation, 76 Air force reserve
officer training corps cadets with high and low spatial ability level were used. The study
examined the effects of display type, spatial ability, and number of trials on simulation
performance and performance strategy. Results indicated that subjects with high spatial
ability performed significantly better on the simulation than subjects with low spatial
82
ability. Performance results revealed a significant interaction between spatial ability level
and trial. Separate analyses for each spatial ability group showed that the performance of
high spatial ability subjects improved significantly from trial to trial. The performance of
low spatial ability subjects did not significantly improve over time. Results for
performance strategy suggested that high spatial ability subjects used more effective
strategies during the simulation than low spatial ability subjects. Finally, he noted that
high spatial ability subjects benefited significantly more from practice than low spatial
ability subjects.
Lagoke, Oyebanmiji and Jegede (1999) investigated the efficacy of enriching
biology teaching with analogy on the performance of students of different achievement
level. One hundred and twenty six SS II students (75) below average and fifty one above
were used for the study. Each of the groups were stratified into experimental and control
groups. Both were given pre-test and then post-test after treatment was administered to
the experimental group. The data from the study was analyzed using analysis of variance
(ANOVA), it was revealed that experimental group taught with the inclusion of analogy
as a strategy for teaching biology performed better than the control group. The analysis
also revealed that the inclusion of analogy as a strategy was helpful to learners below and
above average with the low achievers gaining slightly more than the high achievers.
However, the result on interaction showed no significant effect.
In a similar study carried out by Okobi (1994) on the effects of audio taped
enrichment in teaching the structure of English on students’ performance, he assumed
that the ability level of students would always affect their academic performance
irrespective of the instructional material or strategy used in instruction. The study was a
pre-test, post-test control group type in which two hundred part one students of College
of Education formed the sample. The data obtained from the study was analyzed using
83
analysis of variance; the results showed that an audio taped enrichment bridges the gap
in understanding of English structure and the consequent disparity in performance of
students in high, medium and low ability level.
The present study investigated the influence of ability level on performance of
students when taught biology concept of circulation and excretion using improvised
model and video DVD instructional package.
2.3.2 Gender and Student’s Academic Performance
The concept “gender” has attracted the attention of many researchers, biologists,
psychologists; as a result a lot of literature exists on different aspects such as gender and
social role, gender and work role. In this study the differential gender achievement in
science was reviewed. The term “gender” was defined by Oakley (1993) as the amount
of masculinity and feminity found in a person and obviously while there are mixtures of
both in most human beings, the normal male has a preponderance of masculinity and the
normal female has a preponderance of feminity. Many researchers have carried out
studiess on the influence of gender on students’ achievement in science. This aspect of
educational research has generated a lot of conflicting and non conclusive findings. Some
findings indicated that significant differences existed between the performance of male
and female students while other findings showed that gender factor had no impact on
students performance. Such studies include that of Obe (1989), Ibitoye (1998), Jimoh
(1992) Adebayo (1997), Awoniyi (2000) Balogun (2000), and Mohammed (2000).
Obe (1989) carried out a research on Nigerian Secondary School Students’
conceptions of living things; she made use of six hundred (600) students, two hundred
(200) each from J.S.S. 1, J.S.S. III and form V, which were randomly selected from five
(5) secondary schools in Kwara State. She used twenty (20) pictures of living objects and
84
non-living for classification with reasons. The result showed significant difference
between the scores obtained by boys and girls in J.S.S. 1 on the classification test but
there was no statistically significant difference between the scores obtained by boys and
girls in J.S.S. III and form V. In characteristic test carried out, no statistically significant
difference existed between the scores of boys and girls in all levels. The researcher then
concluded that the significant difference observed in boys and girls in J.S.S. 1 could have
happened by chance. She also remarks that it was not sex that affected the students’
performance but their attitude to work and level of intelligence.
Ibitoye (1998) conducted a survey study on performance evaluation of
Agricultural Science Education in some selected secondary schools in Kwara State. The
researcher selected two hundred and ten (210) students and twenty two (22) Agricultural
Science teachers randomly from five local government areas in Kwara State. He used a
14-items questionnaire administered to agricultural science teachers and 10-items
questionnaire to the students. The determination of the students’ achievements was based
on the West African School Certificate (WASC) examinations’ results of the selected
schools in agricultural science. He used means, percentage and ANOVA statistical
procedures in analyzing the data collected. The result of the research showed that there
was no significant difference in the single sex (boys), single sex (girls) and co-educational
schools.
Jimoh (1992) carried out a research work on the influence of teacher, school
variables and gender on students’ achievements in chemistry in Nigerian Secondary
Schools. He used one hundred and ninety (190) final year chemistry students and forty-
four (44) chemistry teachers randomly selected from twenty-four (24) Secondary Schools
in five (5) local government areas of Kwara State. He used a 19-item questionnaire
administered to the chemistry teachers while 30-items Chemistry Achievement Test
85
(CAT) were given to the sampled students. The statistical procedures used were mean,
frequency, chi-square and t-test in analyzing the data collected, the result revealed that:
i. Laboratory facilities, teachers’ qualification, school location, teaching
experience had significant influence on students’ level of Achievement.
ii. Nature of the school and gender had no appreciable influence on student’s
level of achievement in chemistry.
Adebayo (1997) carried out a research work on “gender, environment and co-
education as factors of performance in the raven’s standard progression matrices”. He
used a non-verbal figures test of reasoning called the raven’s standard progressive
matrices. The test was administered to a total of four hundred and eighty (480) students
comprising of two hundred and forty (240) boys and two hundred and thirty six (236)
girls all of Mean age of 14.5 years. They were selected from eight (8) secondary schools
in Lagos State, Nigeria. The schools were single sex and co-educational and were also
located both in rural and urban areas. The results obtained were analyzed with respect to
gender environment and type of school. The findings showed that:
i. The boys performed significantly better than the girls.
ii. Students from Urban areas had high mean scores than those from rural areas
although the difference was not statistically significant.
iii. Students from single-sex schools had higher mean scores than those from
mixed schools with the difference being statistically significant. The result in
Nigeria is comparable to the one from Britain. This is because geographical
location and environment do not have effects on raven’s standard progression
matrices test.
Awoniyi (2000) carried out a study to investigate the relationship of gender to
academic achievements. Data were collected on six courses offered at college of
86
Education Technical, Lafiagi using 1997/98 NCE III students. Proportional stratified
systematic sampling techniques were used and the data collected were analyzed using
mean score statistical method. The result revealed that there was a significant difference
between the academic performances of male and female students. Balogun (2000) carried
out a research work to determine whether gender has positive effects on performance in
the productive and receptive skill among the secretariat students. He used proportionate
satisfied random sampling method to select a total of sixty-two (62) students comprising
forty-nine (49) female and thirteen male of first year secretariat students of Auchi
Polytechnics, Auchi, University of Ibadan Modified Needs Analysis Questionnaire
(UIMNAQ) was used to collect relevant data. Mean and standard deviation were used to
analyze research question while the t-test statistics was used to test the level of
significance. The result revealed that gender does not have positive effect on the
performance of the skills.
Mohammed (2000) in his study titled “assessment of female students’
performances in selected science courses” carried out a pilot study using selected female
students offering Statistics and Science Laboratory studies. In his research, he compared
the performance of both sexes in the courses. Statistical chart like multiple – bar chart
was used for the presentation while test of significance of correlation, regression and time
series were used. The result shows that there was a significant difference between male
and female performance. In continued concern for influence of gender on students’
performance, Okeke (2001) observed that in Nigeria and many other countries, women
are grossly underrepresented in the scientific and technological fields. Odunusi (2001)
observed that from 1993 to 1997, the enrolment rate of boys and girls increased in primary
schools with the increase rates for boys and girls being 10% and 80% respectively.
However, at the post primary school level, there was a sharp drop in enrolment for both
87
boys and girls from 1992 to 1994 and the drop was sharper for females than for males.
This trend continues up to university level especially for science subjects.
In trying to find explanations for low participation of women in science, Okeke
(2001) attributed the trend to the following factors: biological factors, environmental
inputs, such as childrearing practices, societal expectations, and instructional strategies.
To add to this fact, Erinosho (1998), pointed out that girls usually start with positive
attitude and enthusiasm towards the sciences, but their interest diminishes as they proceed
in the programme. This occurrence led many researchers to examine the possible factors
that deter girls’ interest in science. Erinosho went further to state that girls do not
experience science activities and skills in the classroom to the extent boys do. Oakes
(1990) remarked that girls are treated differently from boys by teachers in their
instructional strategies and expectations. Teachers are harder on boys than on girls and
so boys learn better and faster. Also another factor is the use of sex–biased text- books
that girls read, with more examples and illustrations focused on males in science careers
and females on stereo typed roles with the use of generic nouns or pronouns. This is
commonly seen in books illustrating engineers and technicians with “male pictures and
using the pronoun “He” and a clerk or typist with a picture of a female and using the
pronoun “She”. These, brain – wash the girls, making them believe that science related
courses are not for them. Odunusi (2001) observed that the role models provided are
more of male science teachers and professionals, than females. They observed that the
males receive more attention from teachers and dominate classroom activities more than
the females and most importantly, there is every inequalities occurring inside and outside
the classroom. These include denying girls’ access to some subjects and also subtle
differences in treatment which may also have cultural undertone or backing.
88
Balogun (1994) proposed three models as theoretical frameworks for the observed
sex differences viz genetic deficit, cultural deficit and bicultural models. According to
him, the genetic deficits centred on the biological components of the females as the
causative factors. However, despite these biological components, and the accompanying
physiological changes, various research findings have revealed that females are not
deficient in abilities in science (Ibitoye 1998). However, since girls generally under-
estimate their ability and have less confidence in their competence in science the need
arises for appropriate modifications of the cultural and environmental factors to rectify
this anomaly. Other researchers have also supported this assertion and established that
lacks of interest in physical sciences among girls are more of the product of social and
psychological factors than inherited abilities (Erinosho 1998). Hence the science teachers
need to adopt some psychological techniques and appropriate motivational strategies to
assist the females to get over their shyness and sensitivity in order to boost their
ego/image in responding adequately to science activities.
The cultural deficit model has to do with the societal structures and practices, the
pattern of domination (dominance) and subordination (submission) between males and
females in our societies and how these limit the ability of the females to achieve scientific
culture thus leading to unequal participation in science. The need for career counseling,
for both female students and their parents or guardians is further made clear in the
bicultural model which suggests the effect of traditional stereotyped roles and
expectations on female choice of careers. All these constraints and misconceptions need
to be removed and corrected respectively in a learning situation in order to improve on
female participation and achievement in science, technology and mathematics.
89
2.4 Theoretical framework on Instructional Media in teaching and
Learning Process.
Learning is a construct which is not directly observable but only inferred from the
behavior or activities of the learner. Learning can be defined as a relatively permanent
change in behavior that results from experience in the environment and is manifested in
performance (Mallum and Haggai 2000). Therefore, many psychologists have formulated
theories meant to explain the processes of learning. Learning theory is a tested model that
explains the process of learning in animals and human beings. These theories may be
broadly divided into two among others, namely:
Cognitive/Gestalt theories of learning
Behaviorism/S-R theories of learning
The proposition for the use of media in instructional process took its root from
Cognitive/Gestalt theory of learning (Adewoyin 1991). The theory postulates that
learning comes as a result of insight and perceptual organization or re-organization.
Perception is the process by which an individual gains awareness and understanding of
the events or objects in his environment. The theory thus explained that better and clearer
perception and insight occur in the teaching and learning of any task when all the senses-
the eye, the nose the mouth and the nerve endings are involved. The Gestalts thus
reiterated that-
Perception is the foundation of learning; it precedes communication which is the
key to learning.
The clearer the perception of an object, topic or concept, the better it can be
understood and remembered.
Clear perception facilitates learning while misinterpretation impedes learning.
90
Where it is desirable to substitute for firsthand experience via the use of media, it
is important that their substitute represent reality (three dimensional) from a
perception point of view.
All these notions are summarized by a general principle which the Gestalts called
“pragnanz” (Nwachukwu 1989). The word connotes meaningful, completeness, relative
simplicity and good pattern. It implies that this principle will characterize any teaching-
learning process which is enriched with instructional media materials.
The use of media in instruction also has some bearing from behaviorism theories.
Behaviorism refers to stimulus – Response learning theories (S- R theories). These
theories are also called connectionist theories, Associationist theories or the theories of
contiguity. All the theories explain an association or a connection between the stimulus
(S) and the response (R). A stimulus refers to anything that appeals to or excites the sense
organs – eye, nose, tongue, skin and ear. Therefore stimulus refers to all sights, smell,
sound or any other influence on our senses from the environment. Response is the
individual’s reaction to the stimulus. In this study, the models and videotape serve as the
stimulus and the student’s reaction to them is the response.
A Russian Psychologist, lvan Pavlov, (1849-1936) a Behaviourist put forward the
theory of classical conditioning as explanation of how learning takes place. The major
contribution of the theory is that the external environment is important in learning.
Therefore, the theory emphasized on the provision of a stimulating environment in
schools for efficient learning. Secondly, the theory also pointed out that practice and
exercise are essential in learning since they strengthen the S-R bond. Invariably, the
interaction of the students with the instructional media will strengthen the bond. Another
behaviourist, Thorndike (1874-1949) agreed with this and stated that all learning is the
formation of bonds or connections between stimulus and response (SR), and this depends
91
on factors which operate in the organism. He experimented with cats in a puzzle box and
afterwards came up with three laws of learning:
(1) The law of effect; this is the maintaining or strengthening of the S-R bond as a result
of satisfaction. According to Thorndike, in classroom teaching, the law of effect can be
applied by making classroom experiences satisfying, pleasant, meaningful and
understandable to students and providing learning materials to the learner so that
meaningfulness and understanding can be enhanced. In the present study, by using
models it will make the Biology concepts real meaningful understandable and exciting.
This gives the learner satisfaction at end of the lesson.
(2)The Law of Exercise; this law means practice or rehearsal. It is the law of use and
discuss. When the S-R bond has been made, the connection becomes stronger when it is
more frequently used, but weakened when the S-R bond is not used over a period of time.
Thorndike added that in classroom learning, the law of exercise can be applied by giving
students more opportunities to use what they have learnt. In the present study, the models
and video DVD will always be available for students to practice with even after the
lesson. By re-playing the DVD often the learners master the concept and it gives them
opportunity to re- hearse on their own. When they do, that learning becomes permanent
thereby giving them the opportunity to apply what they learnt in school in real life
(Practice makes perfect).
(3) The law of Readiness; readiness refers to the preparedness of the child to learn a task.
The readiness comes with age and the nature of learning task. Thorndike said that the S-
R bond is established faster when the maturational and motivational level of the learner
are adequate. According to Thorndike, the law of readiness can be applied in the
classroom if teachers can promote readiness by giving students stimulating or motivating
92
experiences that enhances readiness. Models and video tape stand to serve these purposes
as portrayed by Thorndike’s laws.
A close look at the nature of instructional media and the roles they play in teaching
learning process reveal that the media stand to satisfy the demands of behaviorism and
Gestalt’s theories of learning for efficient learning outcome. The psychological
implication of the above views of both Gestalt and behaviorism theories is that science
subjects especially biology cannot be properly taught without the use of appropriate
instructional materials to facilitate better understanding of scientific concepts and
underlying principle and theories. The uses of instructional media function to enable
students acquire knowledge and skills that they could apply to their social and cognitive
problems (Nwachukwu 1989).
Mazur (1990) remarked that to achieve the above stated conditions, learning has to
be enjoyable so that students remember and share what they have learnt. He added that
enjoyable learning happens when the learning environment offers rich and stimulating
experiences. The present study on the improvisation and effects of instructional models
and video instructional package focuses on the learner and how learning can be made
easier, more meaningful and much more permanent. Myriads of researches into theory of
learning have proved that any instructional process which evokes the involvement of as
many human organs as possible tends to facilitate or ease learning.
93
2.5 Empirical Framework on Instructional Media in teaching and
Learning Process.
Several researchers (Adebimpe, 1997; Inyang, 1997; Ezeudu, 2000; Ogunleye
2000; and Olagunju, 2000) had suggested many local materials that could be used in
instructional process. Olagunju (2000) made a list of local materials that could be used in
the teaching of biology. In his words, scalar and functional models of different organs
and systems could be improvised using plasticine, moldable clay soil or paper mesh.
Chromosome DNA models could be improvised with maize grains glued with plasticine.
In ecological studies, an aquarium can be made from any moderate size wide-mouthed
glass containers.
Insect nets can be constructed from a circular stiff wire to which a mosquito
netting is attached at one end, and held by a small wooden pole, animal cages for keeping
a few living animals in the laboratory can be made from empty boxes or a stiff wire made
into a box. The conventional specimen bottle can be substituted with the cheaper, larger,
and wide mouthed bottle. Important animal skeletons and bones such as those of guinea
pigs or rabbits can be provided by local preparation by the teacher. Collections of
specimens such as worms from abattoirs, local hospitals or veterinary clinic can also serve
s improvisation where the original specimens are not available or are difficult to come
by.
Onygegbu (2001) conducted a study on the effect of electronic instructional media
for improved performance. He used 545 ss1 students from four schools. Results from the
mean, Scheffe test and analysis of covariance (ANCOVA) showed that the video tape
instruction was more effective than the convectional/ traditional instruction.
A similar study conducted by Obodozie (2002) on the effects of improvised
television on the learning of Social Studies among primary school pupils in Niger State
94
revealed that there was significant difference in the mean scores of pupils taught with an
improvised television (experimental group) and those taught without it(control group).
The study also showed significant difference in the mean scores of males and females in
the experimental group.
Agommuoh and Nzewi (2003) conducted a study on the effect of video tape
instruction on secondary school students’ achievement in physics. The sample was 398
ss1 students from 2 co- educational schools. Data generated were analyzed using Analysis
of covariance (ANCOVA). The result indicated that the achievement of students in
physics greatly improved with the use of video tape instruction. Also that students gender
had no significant effect in their achievement in physics.
Mohammed (2004) investigated the effect of improvised radio transmitter on the
learning of physical education among primary school pupils in Niger State. A pre test-
post test experimental design was adopted. The study sample was sixty (60) primary
school pupils across public schools assigned to control group and experimental group.
The experimented group was taught with improvised radio while the control group was
taught without it. The mean standard deviation and t-test statistics were used to test for
the significant difference between the mean scores at 0.05 levels. The result of the
analysis showed that there was significant difference in the physical education mean
achievement scores of primary school pupils taught with an improvised radio transmitter
and those taught without it. The study also revealed that there was significant difference
in mean scores of male and female primary school pupils in the experimental group.
Nwadibia (2005) investigated the effects of biological models on learning nervous
system in senior secondary schools in Minna, Niger State. A pretest posttest control group
design was adopted. The study used two hundred (200) students from four secondary
schools assigned to experimental and control groups. The hypotheses were tested with t-
95
test statistics, the result of the analyses showed that there was significant difference in the
posttest mean achievement of the experimental and control group at 0.05 levels. Also
there was no significant difference in the mean achievement of males and females taught
with biological models.
Olumba (2007) carried out a study on the effects of Audiotape and Videotape
instructional packages on the teaching of phonetics in senior secondary schools in Minna.
The study adopted a pretest posttest control group design and used sixty (60) students as
sample. One way ANOVA and t-test statistics were used to test the hypotheses at 0.05
levels. The results of the analysis showed that there was significant difference between
the performance of students taught with videotape and the students taught with lecture
method. Also the study revealed that there was no significant difference in the mean
scores of males and females taught with videotape.
2.6 Summary of Reviewed Literature
A lot of literatures have been reviewed in this study. The literature reviewed
provided the conceptual base for the study. It examined the concept of instructional
media, improvisation, Education Technology and biology concepts of circulation and
excretion. Ogunrati (1984), Akanbi (1993), Abimbade (1997), Adewoyin (1999), Gusen
(2001), Adeniran (2002), Hahm (2003), and others, gave explanation to the concept of
instructional media. Their various views imply that media are channels through which
messages, information, ideas and knowledge are conveyed. Media are tools or
instruments through which stimuli can be passed or obtained. In continuation, these
researchers described instructional media as a part of educational technology which is a
go-between, a carrier of messages from one person to the other in instructional process.
Adewoyin (1991), Obianwu and Azubike (1994), Essien (2001) and Adeniran (2002)
96
among others pointed out the importance, principles of selection, production and
utilization of instructional media.
Literature was also reviewed on various aspect of improvisation. Akinmoyewa
(1992), Akusobo (1997), Iwuozor (2000) and Wasagu (2000) just to mention a few all
gave various explanations to the concept of improvisation. However, the most widely
accepted definition of improvisation is that it is an act of using alternative materials
obtainable from the local environment or designed and constructed by the teacher with
the help of local personnel (carpenter, artist, and carver) to facilitate instruction.
Mohammed (1997), Akinrorohum (2000), Eyetsemitan (2004) all gave clarifications on
the rationale for improvisation while Boateng (1986), Yoloye (1989), Maduabum (1990)
and Akinsola (2000) pointed out the constraints on improvisation.
Empirically, a number of studies on improvisation and media used in instruction
were reviewed. Mohammed (2000) improvised and validated improvised radio
transmitter, Orisabiyi (2002) improvised human skin for biology instruction, Ibrahim
(2004) improvised aquarium tank. Okobi (1994) compared the effects of video tape and
slide tape instruction on students’ performance in social studies. Okoro and Etukudo
(2001) compared the effect of computer Aided instruction and Extrinsic Motivation
Traditional method on students’ performance in chemistry. On these empirical work
reviewed, none was found to dwell specifically on video DVD as in the present study.
The literature reviewed also provides the theoretical framework.
Behaviourism and Gestalt theories of learning were then found to be the
foundation upon which the use of instructional media in the classroom is built. The
behaviourists (Thorndike, Ivan Pavlov) pointed out that external environments as well as
motivating or stimulating experiences of the learner are essential for meaningful and
lasting learning. The Gestalts postulated that learning comes as a result of insight and
97
perceptual organization. They maintained that better and clearer perception and insight
occur in instructional process when as many sense organs as possible are involved. The
present work which employed Instructional media (models and video DVD) stands to fill
this gap. This is because the media materials will allow the involvement of as many sense
organs as possible thereby providing insight and perceptional re-organization needed for
meaningful and lasting learning.
The works reviewed on gender differences as they effect achievement of students
give diverse opinion. Obe (1989), Ibitoye (1996), Awoniyi (2000), Balogun (2000) and
others, found out that gender does not have any influence on academic achievement of
student. While Jimoh (1992), Adebayo (1997), Mohammed (2000) are of the view that
gender difference has influence on the academic achievement. Yet others indicated that
there is no significant difference in students’ performance. This shows that more work on
gender differences and academic achievement is still needed. Gender is a variable in this
study.
When the issue of ability group was reviewed, Aiyedun (1995) and Inyang and
Ekpeyong (2000) revealed that ability group influence students’ performance. A study by
Lagoke et al (1999) showed that low ability students gained slightly more than the higher
ability. This pointed out that the treatment given to the low ability group enhanced their
performance. However, Slavin (1986) cited in Hollifield (1987) revealed that ability
grouped assignment which placed students in one self-contained class on the basis of
ability level did not enhance students performance, but regrouping of students for reading
and mathematics which assigned students to heterogeneous classroom and later
regrouped according to achievement level improved performance.
Generally all the literature reviewed are relevant to this study in one way or the
other but none was found to dwell specifically on the same premise as the present study.
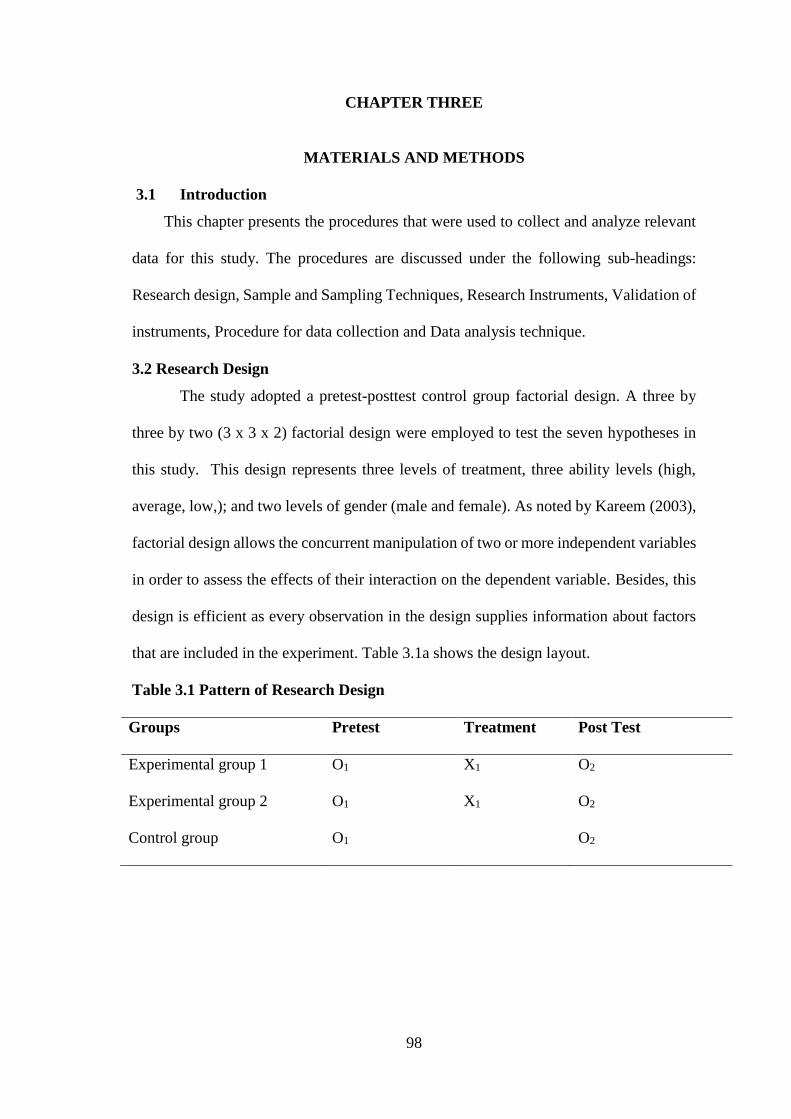
98
CHAPTER THREE
MATERIALS AND METHODS
3.1 Introduction
This chapter presents the procedures that were used to collect and analyze relevant
data for this study. The procedures are discussed under the following sub-headings:
Research design, Sample and Sampling Techniques, Research Instruments, Validation of
instruments, Procedure for data collection and Data analysis technique.
3.2 Research Design
The study adopted a pretest-posttest control group factorial design. A three by
three by two (3 x 3 x 2) factorial design were employed to test the seven hypotheses in
this study. This design represents three levels of treatment, three ability levels (high,
average, low,); and two levels of gender (male and female). As noted by Kareem (2003),
factorial design allows the concurrent manipulation of two or more independent variables
in order to assess the effects of their interaction on the dependent variable. Besides, this
design is efficient as every observation in the design supplies information about factors
that are included in the experiment. Table 3.1a shows the design layout.
Table 3.1 Pattern of Research Design
Groups Pretest Treatment Post Test
Experimental group 1 O1 X1 O2
Experimental group 2 O1 X1 O2
Control group O1 O2
99
Key:
O1 represents pretests observations on Structured Biology Achievement Test of
experimental groups 1, 2 and control group
O2 represents posttests observations on Structured Biology Achievement Test of
experimental groups 1, 2 and control group
X1 represents treatment for Experimental groups.
Table 3.1 shows that two experimental groups and one control group were
involved in the study. Subjects in the three groups were pretested before the treatment
started. After the treatment, experimental groups 1and 2 and control group were
posttested. The independent variables for this study are: instructional modes (3 levels),
ability (3 levels) and gender (2 levels). The dependent variable is academic achievement
on selected biology concepts. The moderating variables in this study, which are student
ability level and gender are expected to determine the levels at which the dependent
variables will be analysed.
3.3 Population of the Study
The population for the study were students from all the one hundred and fourty
six (146) co-educational and other senior secondary schools in Niger state. (see Appendix
C) The target population are eight thousand two hundred and fifty three (8253) senior
secondary two (SS2) students,the choice of SS2 students is based on these considerations:
(i) they must have acquired basic pre-requisite of biology concept at SS1
level,
(ii) the concepts to be treated in this study(blood circulation and
excretion in man) are stipulated to be treated in SS2 curriculum,
(iii) most of the school authorities do not allow their final year class
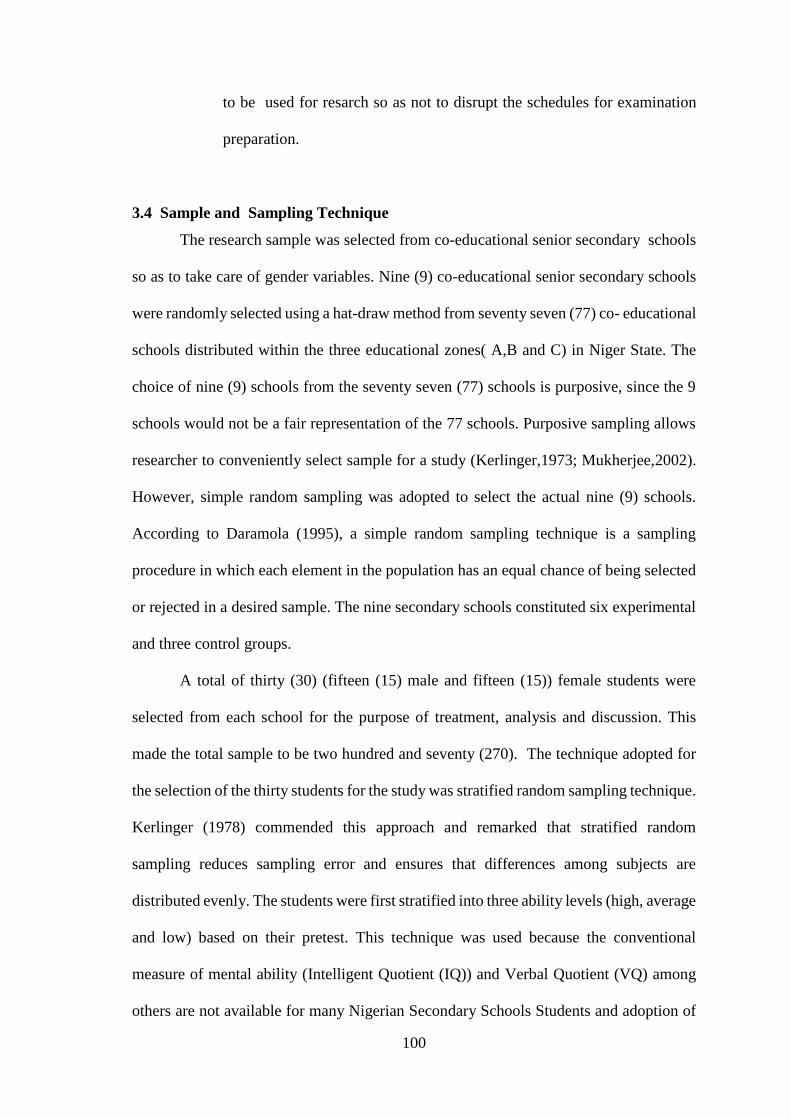
100
to be used for resarch so as not to disrupt the schedules for examination
preparation.
3.4 Sample and Sampling Technique
The research sample was selected from co-educational senior secondary schools
so as to take care of gender variables. Nine (9) co-educational senior secondary schools
were randomly selected using a hat-draw method from seventy seven (77) co- educational
schools distributed within the three educational zones( A,B and C) in Niger State. The
choice of nine (9) schools from the seventy seven (77) schools is purposive, since the 9
schools would not be a fair representation of the 77 schools. Purposive sampling allows
researcher to conveniently select sample for a study (Kerlinger,1973; Mukherjee,2002).
However, simple random sampling was adopted to select the actual nine (9) schools.
According to Daramola (1995), a simple random sampling technique is a sampling
procedure in which each element in the population has an equal chance of being selected
or rejected in a desired sample. The nine secondary schools constituted six experimental
and three control groups.
A total of thirty (30) (fifteen (15) male and fifteen (15)) female students were
selected from each school for the purpose of treatment, analysis and discussion. This
made the total sample to be two hundred and seventy (270). The technique adopted for
the selection of the thirty students for the study was stratified random sampling technique.
Kerlinger (1978) commended this approach and remarked that stratified random
sampling reduces sampling error and ensures that differences among subjects are
distributed evenly. The students were first stratified into three ability levels (high, average
and low) based on their pretest. This technique was used because the conventional
measure of mental ability (Intelligent Quotient (IQ)) and Verbal Quotient (VQ) among
others are not available for many Nigerian Secondary Schools Students and adoption of
101
foreign one may not be suitable for Nigerian subjects (Yusuf 1997). According to this
study, a high ability level student is one whose average score in the last terminal biology
examination falls within the upper 25%.The average ability level student is the one whose
average score falls within the middle 50%, while the low ability level falls within the
lower 25% (see table 3.2).
Table 3.2 Range of Scores forming Ability Levels
Within the strata, the students were further stratified along gender (male and female).From
each stratum, 10 students ( 5 male and 5 female ) were selected using the hat draw method in
which five papers were written “Yes” and others “No” separately for boys and girls. Those
who pick “Yes” were selected, while those who pick “No” were dropped. This gave a sample
size of 30 students (15 male and 15 female) from each school and a total sample size of two
hundred and seventy (270) students (135 males and 135 females).
3.5 Research Instruments
The following research instruments were constructed by the researcher and used to
gather data for the study. They include:
1. Treatment Instruments-
a) Developed models of the circulatory system, internal structure of the
heart, excretory system, and kidney nephron.
b) Video DVD instructional package and
S/N Range of Students’ Scores Ability levels
1. Scores within the upper 25% High ability level
2. Scores within the middle 50% Average ability level
3. Scores within the lower 25% Low ability level
102
2. Test Instrument- Structured Biology Achievement Test (SBAT)
1(a) Procedure for Design and Production of the developed models
The materials needed for the production of the models were obtained from the
immediate environment. They include: Madobia wood (timber) 122cm x 62cm, 75cm x
62cm and half inch ply wood (2sheets). The wood was obtained in timber market along
Bosso Road, Minna. Paint, bulb of different coloure, sand-paper, body filler, solignum,
cement, white wood glue, nail, wire, rope, battery, main circuit and others, were obtained
from Minna central market. Other materials needed were saw, scrapper, pliers, Chisel of
different shapes and sizes (Curved, chisel-shaped, Gorge Chisel and others).
Four different pieces of wood (Madobia and ply wood) were cut, each for a model.
That is, two pieces 122cm x 62cm for blood circulatory system and urinary tubule
respectively and two pieces 75cm x 62cm respectively for the structures of heart and
excretory system. These pieces of wood were planned to make the surfaces smooth for
designing / drawing, they were treated with solignum to prevent them from being eaten
by wood worm. The choice of Madobia wood was based on the fact that it is strong,
compact and highly resistant to heat or sunlight. In other words, it cannot bend, expand
or shrink when dry or subjected to harsh weather. On each of the pieces of wood which
have already been planed, the design or sketched outline of the features to be molded
were drawn and carved or molded afterwards (see Appendix D for (1a) The internal
structure of the heart, (2a) human blood circulatory system,(3a) Urinary system, and (4a)
Kidney tubule/nephron)
The internal structure of the heart consists of the following, pulmonary arteries and
veins, left and right auricle, left and right ventricle, septum, bicuspid valve and tricuspid
valve, anterior and posterior vena cava, while, human blood circulatory system consists
103
of the heart, pulmonary veins and arteries, carotid artery, jugular vein, sub- clavian artery
and vein, hepatic artery and vein, hepatic portal vein, mesenteric artery, renal arteries
and veins , gonadial arteries and veins , segmental and iliac arteries and veins, capillaries.
Urinary system consists of two kidneys, two ureters, bladder, urethra, renal artery and
renal vein. In addition; Kidney tubule/nephron consists of these features; Bowman’s
capsule, glomerulus’s, convoluted tubule, Henley’s loop, main collecting tubule, renal
capillaries, and renal veins. All the features were shown in the models.
The method used in the production of the structures were carving and molding.
Molding is the process by which materials (wood, metal, plastic) are shaped into three
dimensions that looks exactly like the prototype. The model can be scaled down, scaled
up, or same size as the original type depending on the set objectives, targeted audience
and cost implications. To model the structures, the design or sketch drawing of each of
the models were made on a planed wood and sawed to the shape of the drawing. The
features - heart structure and circulatory system were carved out using chisel of different
shapes and sizes, while excretory system and kidney nephron were molded using a
mixture of top bond, body filler and cement. Scrapper was used to scrape off neatly the
galloping of the chisel and to make room for sand-papering.
Each of the models was sand-papered with hard or rough sand-paper in order to
remove different marks on the work, and then smooth sand-paper was used for the final
smoothing of the surface. This was followed by modeling of the whole work with body
filler mixed with top bond. This was done so as to fashion out the correct shape and fill
up all the small holes to avoid any form of porosity in the process of final painting and to
further protect the wood from being eaten by wood worm.
104
Painting, illumination and Mounting the models
In each model, the features were painted with different colors. This is to arouse
and sustain the interest of the students and enable them differentiate the structures. To
further motivate the student and aid their understanding of the trend in blood circulation,
the structures of the heart and blood circulatory system were illuminated with different
colour bulbs (White, Blue, and Red). For the Illumination mechnism (see Appendix E).
The models produced were each mounted on a piece of ply wood with the aid of araldite
or super-glue to fasten it to the wood. Mounting is the process of displaying the finished
work to properly bring out its features. (See Appendix F for 1b, 2b, 3b, and 4b)
Labeling and Casing the models
The models were well annotated and a key made available beneath each model. They
were finally cased using aluminum frame and plastic glass. Casing is the process of putting the
finished work in a glass case. This enables the models stand conspicuously in the laboratory
without being covered with dust. It also lowers the risk of damage, enhances easy handling and
movement from one place to another (see Appendix G for 1c, 2c, 3c, and 4c).
1 (b) Procedure for developing the Video DVD Instructional Package
The DVD instructional package was developed and produced by the researcher based on
the concepts taught to the students in the study, namely blood circulation (structure of human
heart, blood circulation) and excretion (excretory system, excretory mechanism). See
Appendix H for the photograph of the disc. The DVD package contains the video recordings
of the produced models to suit narration on the concepts as detailed in the script write up
(Appendix I). An expert in the video recording did the recording and editing. The researcher
105
did the narration. The cost analyses for both models and video DVD package is shown in
Appendix J.
2. Development of the Structured Biology Achievement Test (SBAT)
The biology concepts used for this study were selected from the senior secondary two
scheme of work. The textbooks used were the Modern Biology for Secondary Schools, New
Biology for Senior Secondary Schools and past questions for senior school certificate
examination. These materials were used for the purpose of teaching and as a guide for the
instrument designed.
The Structured Biology Achievement Test (SBAT) was a 40-item multiple-choice
objective test with five options (A-E) as possible answers to each item. For each item only one
of the five options was the correct answer. The items were constructed to reflect the concepts
treated and in reference to the objective of the lessons on which instruction was based. The test
instrument had two sections - A and B, Section A elicited information on students’ class,
school, age and sex, while section B elicited information on the achievement of the students in
the chosen concepts. The students were required to answer all the questions by ticking the
correct option out of the five options (A-E) provided. On the scoring of the items, a score of
two and half was awarded for a correct answer and zero for wrong answer. Thus, the test
instrument was scored over one hundred (100).
3.6 Validation of Research Instruments
(a) The Models.
The developed models were made to pass through the following: the supervisors
of this work, two senior lecturers who are experts in the field of educational technology
in the Department of Science Education, Federal University of Technology (FUT),
Minna, two specialists in biology in the Department of biology, F.U.T. Minna, two
biology teachers, each from Hill Top Model School Minna and Day Secondary School
106
Minna. They were used for face and content validity. Specifically, their comments and
opinions were solicited as regards the suitability of the models for the concepts and level
of students for the study, clarity and appropriateness of the features of the model. Based
on their comments, modifications were made. The validations certified that the models
appealed to the content of biology concepts selected for the study and therefore valid.
(b). Video DVD Instructional Package.
The DVD instructional package was validated by experts in educational
technology, including the supervisor of this work and two senior staff from Audio Visual
Department of F.U.T. Minna. The experts critically examined and assessed the package
with reference to:
(i) the sharpness, clarity and suitability of the video recording for teaching the
selected biology concepts,
(ii) the audibility, clarity and appropriateness of the narration,
(iii) subject matter coverage, accuracy and presentation and
(iv) general criticisms and / or suggestions for the improvement of the package
The DVD package was edited based on the suggestions from the experts.
These instruments were then pilot tested.
3.7 Procedures for the Pilot Test
The pilot test was conducted to test the reliability of the test instrument and the
construct validity of the treatment instruments. It was also to test the efficacy of the
research design and the procedures for the main study so as to identify and correct
possible methodological flaws. The study involved three secondary schools randomly
selected through a hat draw method from the schools not chosen for the main study. The
school authorities were contacted to use their schools, and approval obtained. The
107
schools were randomly assigned to the two experimental groups and one control group
using the balloting system. Students in the first school were assigned to experimental
group one taught with the developed models, while their counterparts in the second school
were assigned to experimental group two taught with DVD instructional package.
Students in the third school however, were assigned to the control group to be taught with
lecture method.
Intact class approach was used for teaching of the concepts of circulation and
excretion, however only ninety (90) randomly selected Students (thirty (30) in each
school selected for the study) constitute the sample for the study. The study lasted seven
weeks. During the first week of study; pretest was administered to the students in the
three schools with the intention of knowing the entry behavior of the students. Instruction
commenced in all the groups after the pretest for four weeks. Double periods of eighty
minutes per week in each of the schools were utilized. The last two weeks out of the seven
weeks were used for revision and posttest administration. In all, students were exposed
to a total of five hours twenty minutes of instruction in each school. The construct validity
of the developed models and DVD package was ascertained by subjecting the data
collected to correlation analysis using SPSS statistical package. A correlation coefficient
of 0.71 was obtained from the analyses on both instruments. This value was high enough
for the instruments to be considered as having good construct validities.
3.8 Reliability of the Structured Biology Achievement Test (SBAT)
The data obtained from the pilot study were used to assess the reliability of the
test instrument (SBAT). It was also used for item analysis, that is to obtain the facility
and discrimination indices of the instrument. Reliability of a test is the consistency with
which the test measures what it is intended to measure. According to Odama (1982)
Indices of reliability give an indication of the extent to which a particular measurement
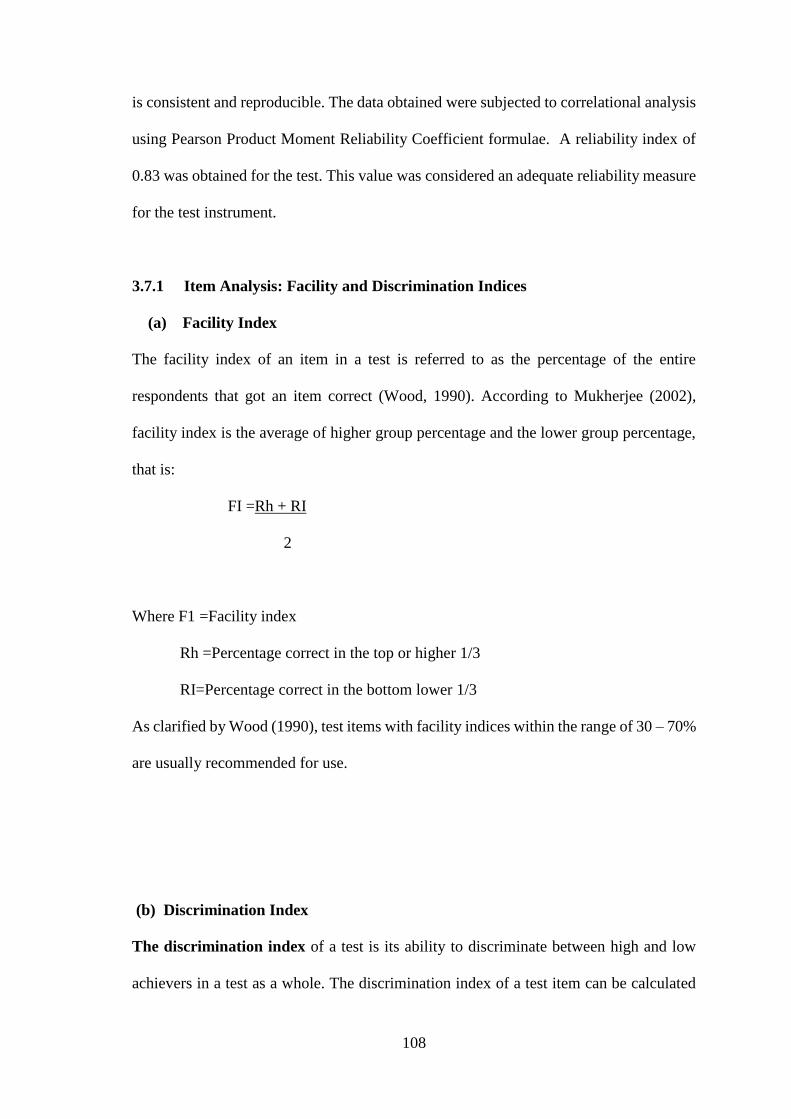
108
is consistent and reproducible. The data obtained were subjected to correlational analysis
using Pearson Product Moment Reliability Coefficient formulae. A reliability index of
0.83 was obtained for the test. This value was considered an adequate reliability measure
for the test instrument.
3.7.1 Item Analysis: Facility and Discrimination Indices
(a) Facility Index
The facility index of an item in a test is referred to as the percentage of the entire
respondents that got an item correct (Wood, 1990). According to Mukherjee (2002),
facility index is the average of higher group percentage and the lower group percentage,
that is:
FI =Rh + RI
2
Where F1 =Facility index
Rh =Percentage correct in the top or higher 1/3
RI=Percentage correct in the bottom lower 1/3
As clarified by Wood (1990), test items with facility indices within the range of 30 – 70%
are usually recommended for use.
(b) Discrimination Index
The discrimination index of a test is its ability to discriminate between high and low
achievers in a test as a whole. The discrimination index of a test item can be calculated
109
from the difference of the two percentages, one for the higher group, and the other for the
lower group. Discrimination index is given by the formula:
DI =RH - RI
Where DI - is the discrimination index,
Rh – Number among upper 25% who scored an item correctly.
Rl - Number among lower 25% who scored an item correctly.
As pointed out by Abdussalami (2008), discrimination indices ranging from
30 to 49% are described as moderately positive. Those from 59 to 70% are highly positive
while those between 30 percent and below are low positive values. Mukherjee (2002)
made it clear that the ideal range of facility and discrimination indices are taken to be
between 30 and 70%. The forty item questions were able to meet the criteria above and
thus selected. For the forty item questions (SBAT) and the marking scheme, See
Appendix K.
3.9 Method of Data Collection
Two weeks before the experiment the researcher visited the selected schools to
seek for official permission from the school authority. During these visits, the sample
frame was determined and teachers that acted as research assistant trained. The entire
study covered a period of seven (7) weeks. Intact class approach was adopted; however
only thirty (30) students from each secondary school sampled was used for analyses and
discussion. During the first week of experiment, pretest was given to all the groups before
treatment to determine the equivalence of the control and the experimental groups.
Instruction commenced in all the groups in the second week of the experiment. Two
experimental groups were taught with two different treatments. Experimental group 1
was taught with improvised models, experimental group two was taught with video
instructional package, while the third group, control group was taught with lecture
110
method alone. Appropriate lesson plans were developed for experimental 1, 2 and control
groups. (See appendix L).
For four (4) weeks, lessons on the content areas were presented to the students.
Double period of 80 minutes per week was utilized; this gives a total of five hours twenty
minutes per school. After a period of four weeks, there was one week of revision, and the
Structured Biology Achievement Test (SBAT) was administered to the three groups as
posttest. The interval between the administration of pretest and posttest was 5 weeks, in
line with Mukherjee’s (2002) suggestion that a minimum of 3 weeks should be allowed
between the time interval of pretest and posttest. The scores of the experimental and
control groups on pretest and protest were computed and used for data analysis. The
arrangement is summarized as follows:
1st-week: Pretest administration of SBAT
2nd – 5th week: Treatment- teaching the selected concepts to the experimental group 1
(models), the experimental group 2 (video DVD instructional package) and the control
group (lecture method).
6th –7th week: Revision and Posttest administration of (SBAT) to the three groups.
3.10 Method of Data Analysis
Analysis of variance (ANOVA) statistic was used to analyze the data. Where
certain factors were found to have significant effect on the achievement of biology
concepts, Scheffe’s post hoc Multiple Test was further computed. This is a posteriori test
to determine whether specific differences between means and their combinations are
significant. It does multiple comparisons using all possible pairs. Graphical
representation was also drawn to indicate the difference in the mean scores of the
experimental and control groups. A level of 0.05 probabilities was adopted for all

111
analyses and the criterion for significance. SPSS statistical package was used for the
analyses.
CHAPTER FOUR
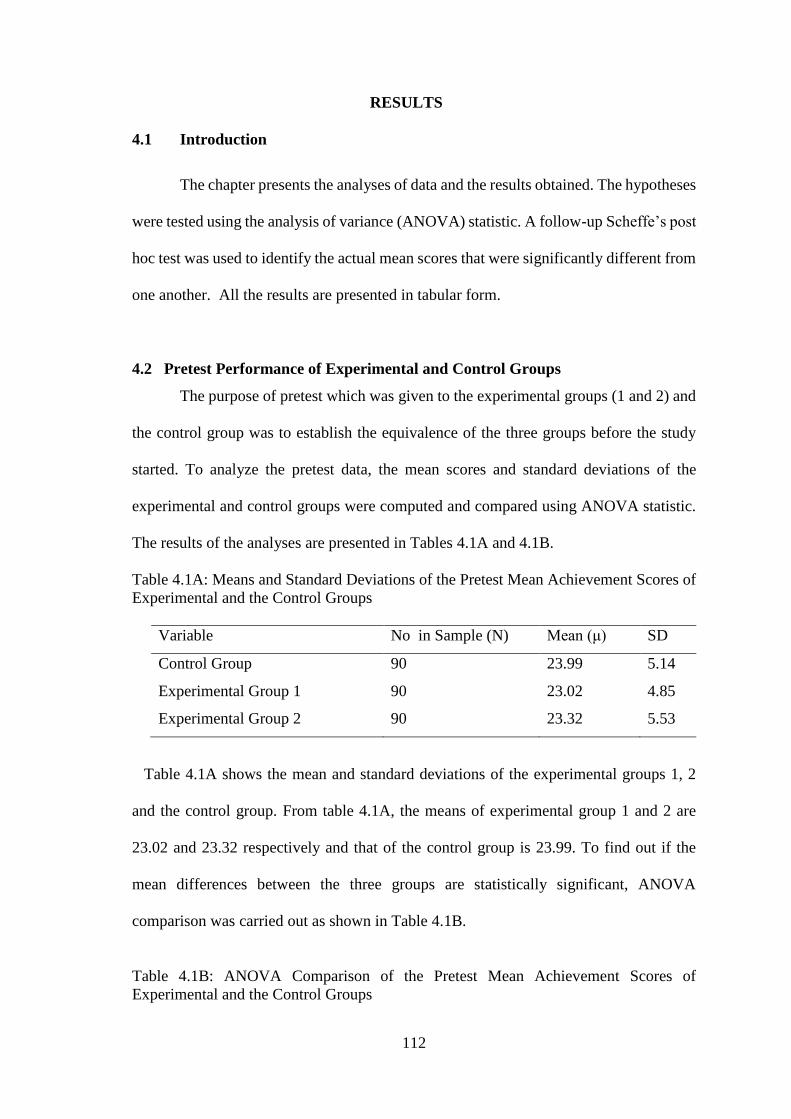
112
RESULTS
4.1 Introduction
The chapter presents the analyses of data and the results obtained. The hypotheses
were tested using the analysis of variance (ANOVA) statistic. A follow-up Scheffe’s post
hoc test was used to identify the actual mean scores that were significantly different from
one another. All the results are presented in tabular form.
4.2 Pretest Performance of Experimental and Control Groups
The purpose of pretest which was given to the experimental groups (1 and 2) and
the control group was to establish the equivalence of the three groups before the study
started. To analyze the pretest data, the mean scores and standard deviations of the
experimental and control groups were computed and compared using ANOVA statistic.
The results of the analyses are presented in Tables 4.1A and 4.1B.
Table 4.1A: Means and Standard Deviations of the Pretest Mean Achievement Scores of
Experimental and the Control Groups
Variable No in Sample (N) Mean (μ) SD
Control Group 90 23.99 5.14
Experimental Group 1 90 23.02 4.85
Experimental Group 2 90 23.32 5.53
Table 4.1A shows the mean and standard deviations of the experimental groups 1, 2
and the control group. From table 4.1A, the means of experimental group 1 and 2 are
23.02 and 23.32 respectively and that of the control group is 23.99. To find out if the
mean differences between the three groups are statistically significant, ANOVA
comparison was carried out as shown in Table 4.1B.
Table 4.1B: ANOVA Comparison of the Pretest Mean Achievement Scores of
Experimental and the Control Groups
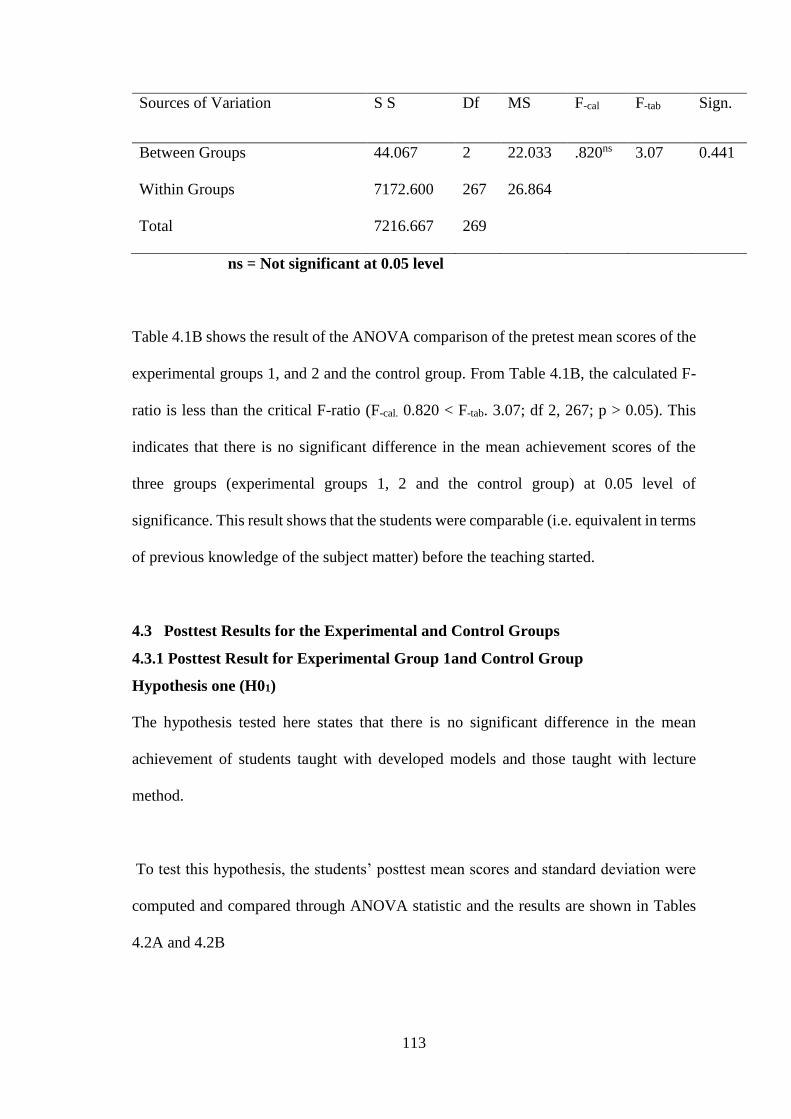
113
Sources of Variation S S Df MS F-cal F-tab Sign.
Between Groups 44.067 2 22.033 .820ns 3.07 0.441
Within Groups 7172.600 267 26.864
Total 7216.667 269
ns = Not significant at 0.05 level
Table 4.1B shows the result of the ANOVA comparison of the pretest mean scores of the
experimental groups 1, and 2 and the control group. From Table 4.1B, the calculated F-
ratio is less than the critical F-ratio (F-cal. 0.820 < F-tab. 3.07; df 2, 267; p > 0.05). This
indicates that there is no significant difference in the mean achievement scores of the
three groups (experimental groups 1, 2 and the control group) at 0.05 level of
significance. This result shows that the students were comparable (i.e. equivalent in terms
of previous knowledge of the subject matter) before the teaching started.
4.3 Posttest Results for the Experimental and Control Groups
4.3.1 Posttest Result for Experimental Group 1and Control Group
Hypothesis one (H01)
The hypothesis tested here states that there is no significant difference in the mean
achievement of students taught with developed models and those taught with lecture
method.
To test this hypothesis, the students’ posttest mean scores and standard deviation were
computed and compared through ANOVA statistic and the results are shown in Tables
4.2A and 4.2B
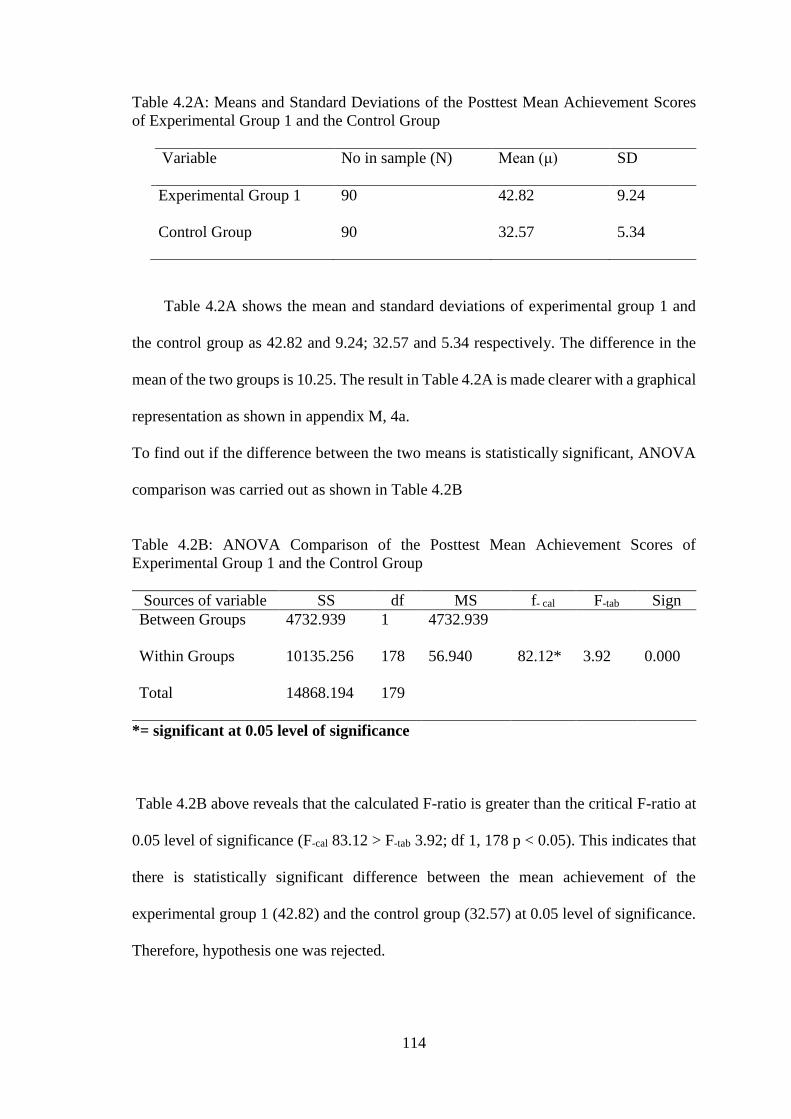
114
Table 4.2A: Means and Standard Deviations of the Posttest Mean Achievement Scores
of Experimental Group 1 and the Control Group
Variable No in sample (N) Mean (μ) SD
Experimental Group 1 90 42.82 9.24
Control Group 90 32.57 5.34
Table 4.2A shows the mean and standard deviations of experimental group 1 and
the control group as 42.82 and 9.24; 32.57 and 5.34 respectively. The difference in the
mean of the two groups is 10.25. The result in Table 4.2A is made clearer with a graphical
representation as shown in appendix M, 4a.
To find out if the difference between the two means is statistically significant, ANOVA
comparison was carried out as shown in Table 4.2B
Table 4.2B: ANOVA Comparison of the Posttest Mean Achievement Scores of
Experimental Group 1 and the Control Group
Sources of variable SS df MS f- cal F-tab Sign
Between Groups 4732.939 1 4732.939
82.12*
3.92
0.000 Within Groups 10135.256 178 56.940
Total 14868.194 179
*= significant at 0.05 level of significance
Table 4.2B above reveals that the calculated F-ratio is greater than the critical F-ratio at
0.05 level of significance (F-cal 83.12 > F-tab 3.92; df 1, 178 p < 0.05). This indicates that
there is statistically significant difference between the mean achievement of the
experimental group 1 (42.82) and the control group (32.57) at 0.05 level of significance.
Therefore, hypothesis one was rejected.
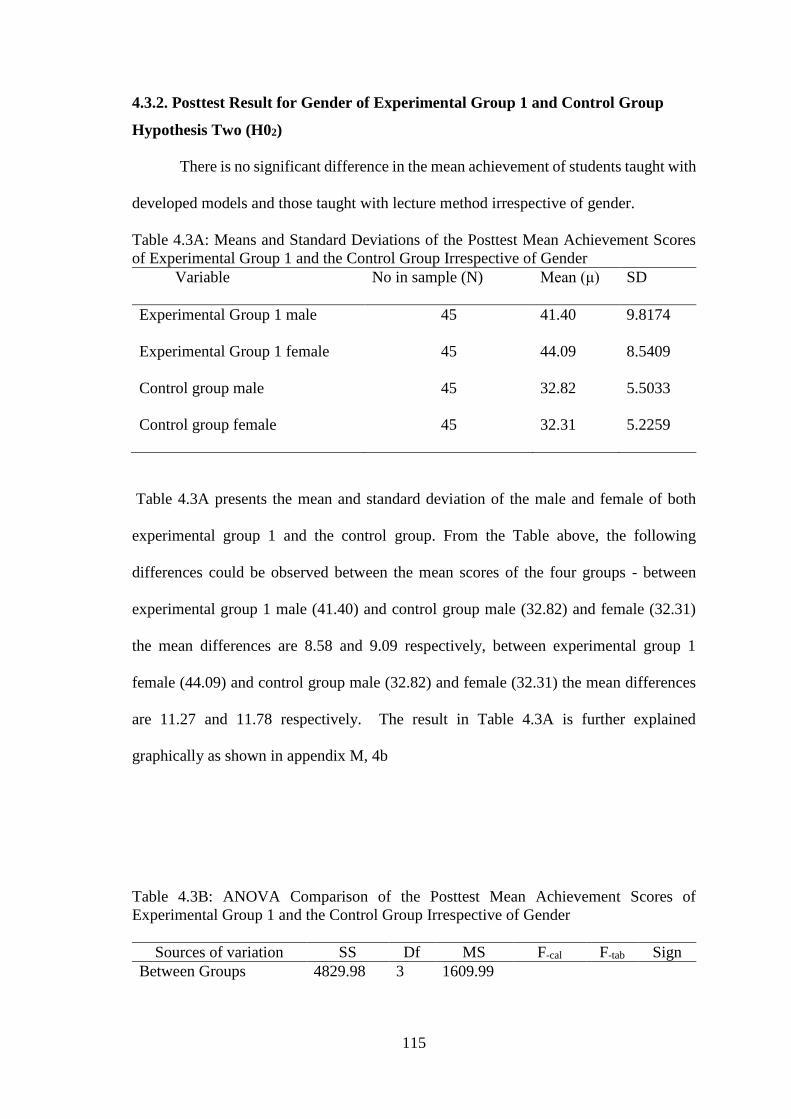
115
4.3.2. Posttest Result for Gender of Experimental Group 1 and Control Group
Hypothesis Two (H02)
There is no significant difference in the mean achievement of students taught with
developed models and those taught with lecture method irrespective of gender.
Table 4.3A: Means and Standard Deviations of the Posttest Mean Achievement Scores
of Experimental Group 1 and the Control Group Irrespective of Gender
Variable No in sample (N) Mean (μ) SD
Experimental Group 1 male 45 41.40 9.8174
Experimental Group 1 female 45 44.09 8.5409
Control group male 45 32.82 5.5033
Control group female 45 32.31 5.2259
Table 4.3A presents the mean and standard deviation of the male and female of both
experimental group 1 and the control group. From the Table above, the following
differences could be observed between the mean scores of the four groups - between
experimental group 1 male (41.40) and control group male (32.82) and female (32.31)
the mean differences are 8.58 and 9.09 respectively, between experimental group 1
female (44.09) and control group male (32.82) and female (32.31) the mean differences
are 11.27 and 11.78 respectively. The result in Table 4.3A is further explained
graphically as shown in appendix M, 4b
Table 4.3B: ANOVA Comparison of the Posttest Mean Achievement Scores of
Experimental Group 1 and the Control Group Irrespective of Gender
Sources of variation SS Df MS F-cal F-tab Sign
Between Groups 4829.98 3 1609.99
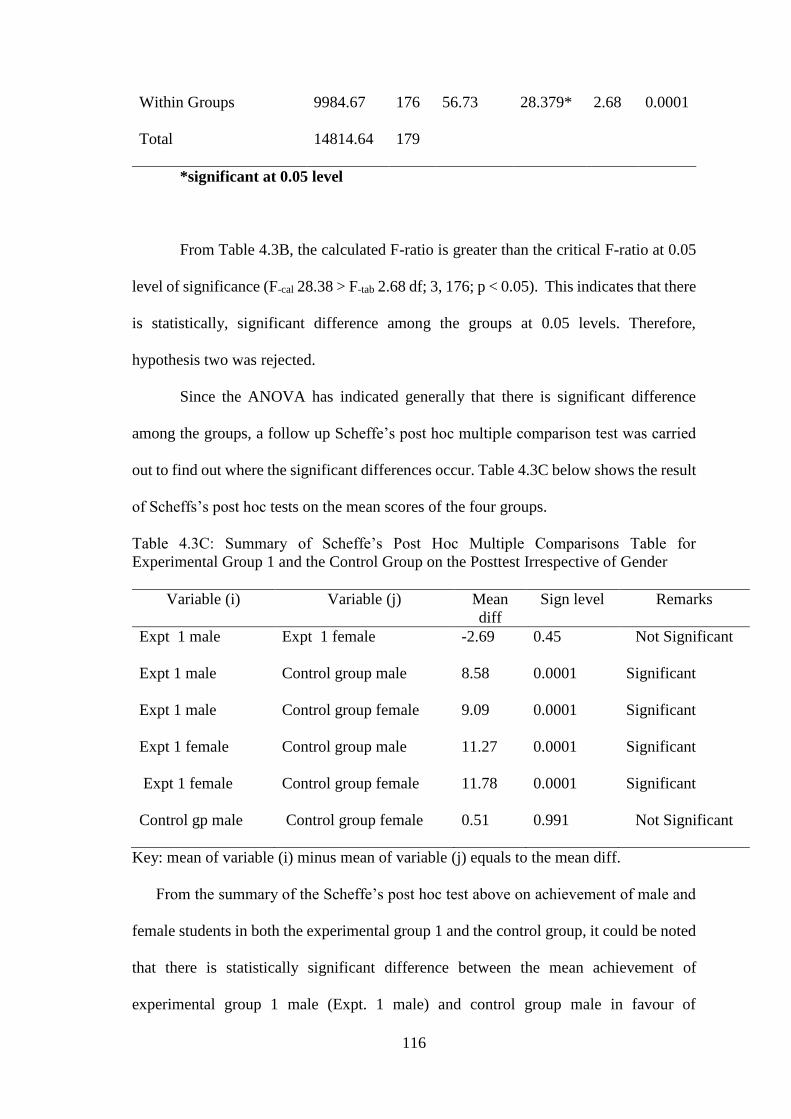
116
Within Groups 9984.67 176 56.73 28.379* 2.68 0.0001
Total 14814.64 179
*significant at 0.05 level
From Table 4.3B, the calculated F-ratio is greater than the critical F-ratio at 0.05
level of significance (F-cal 28.38 > F-tab 2.68 df; 3, 176; p < 0.05). This indicates that there
is statistically, significant difference among the groups at 0.05 levels. Therefore,
hypothesis two was rejected.
Since the ANOVA has indicated generally that there is significant difference
among the groups, a follow up Scheffe’s post hoc multiple comparison test was carried
out to find out where the significant differences occur. Table 4.3C below shows the result
of Scheffs’s post hoc tests on the mean scores of the four groups.
Table 4.3C: Summary of Scheffe’s Post Hoc Multiple Comparisons Table for
Experimental Group 1 and the Control Group on the Posttest Irrespective of Gender
Variable (i) Variable (j) Mean
diff
Sign level Remarks
Expt 1 male Expt 1 female -2.69 0.45 Not Significant
Expt 1 male Control group male 8.58 0.0001 Significant
Expt 1 male Control group female 9.09 0.0001 Significant
Expt 1 female Control group male 11.27 0.0001 Significant
Expt 1 female Control group female 11.78 0.0001 Significant
Control gp male Control group female 0.51 0.991 Not Significant
Key: mean of variable (i) minus mean of variable (j) equals to the mean diff.
From the summary of the Scheffe’s post hoc test above on achievement of male and
female students in both the experimental group 1 and the control group, it could be noted
that there is statistically significant difference between the mean achievement of
experimental group 1 male (Expt. 1 male) and control group male in favour of
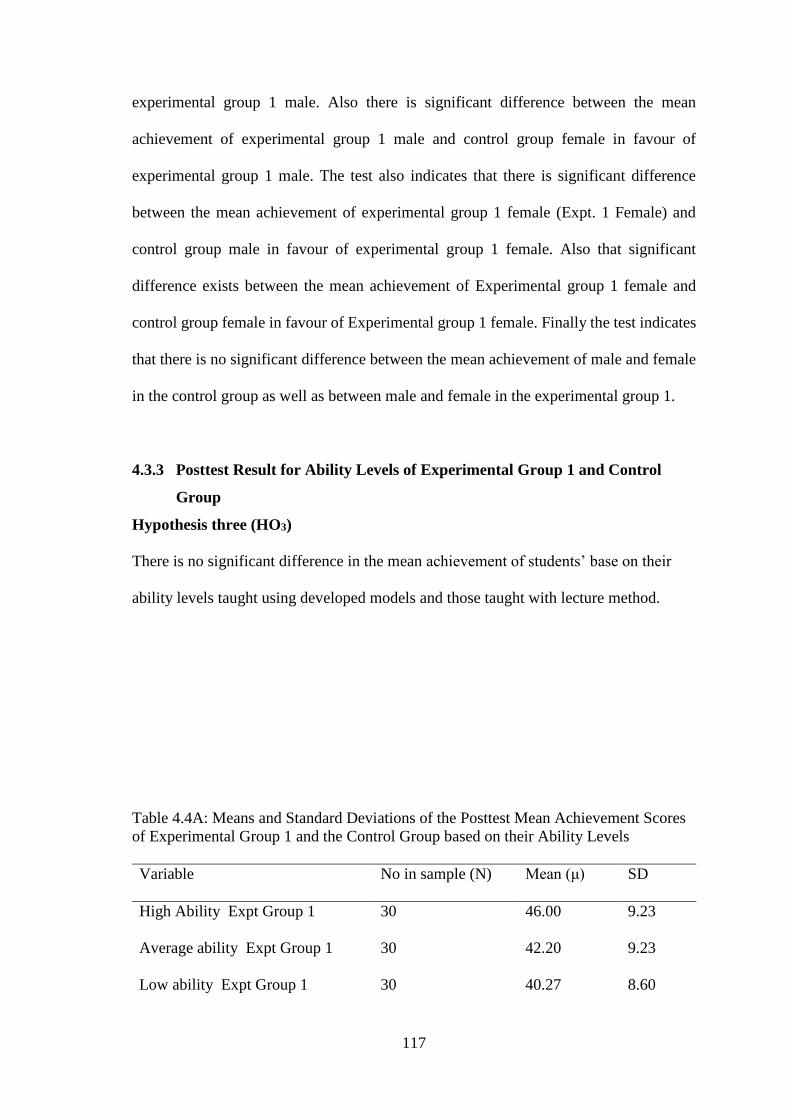
117
experimental group 1 male. Also there is significant difference between the mean
achievement of experimental group 1 male and control group female in favour of
experimental group 1 male. The test also indicates that there is significant difference
between the mean achievement of experimental group 1 female (Expt. 1 Female) and
control group male in favour of experimental group 1 female. Also that significant
difference exists between the mean achievement of Experimental group 1 female and
control group female in favour of Experimental group 1 female. Finally the test indicates
that there is no significant difference between the mean achievement of male and female
in the control group as well as between male and female in the experimental group 1.
4.3.3 Posttest Result for Ability Levels of Experimental Group 1 and Control
Group
Hypothesis three (HO3)
There is no significant difference in the mean achievement of students’ base on their
ability levels taught using developed models and those taught with lecture method.
Table 4.4A: Means and Standard Deviations of the Posttest Mean Achievement Scores
of Experimental Group 1 and the Control Group based on their Ability Levels
Variable No in sample (N) Mean (μ) SD
High Ability Expt Group 1 30 46.00 9.23
Average ability Expt Group 1 30 42.20 9.23
Low ability Expt Group 1 30 40.27 8.60
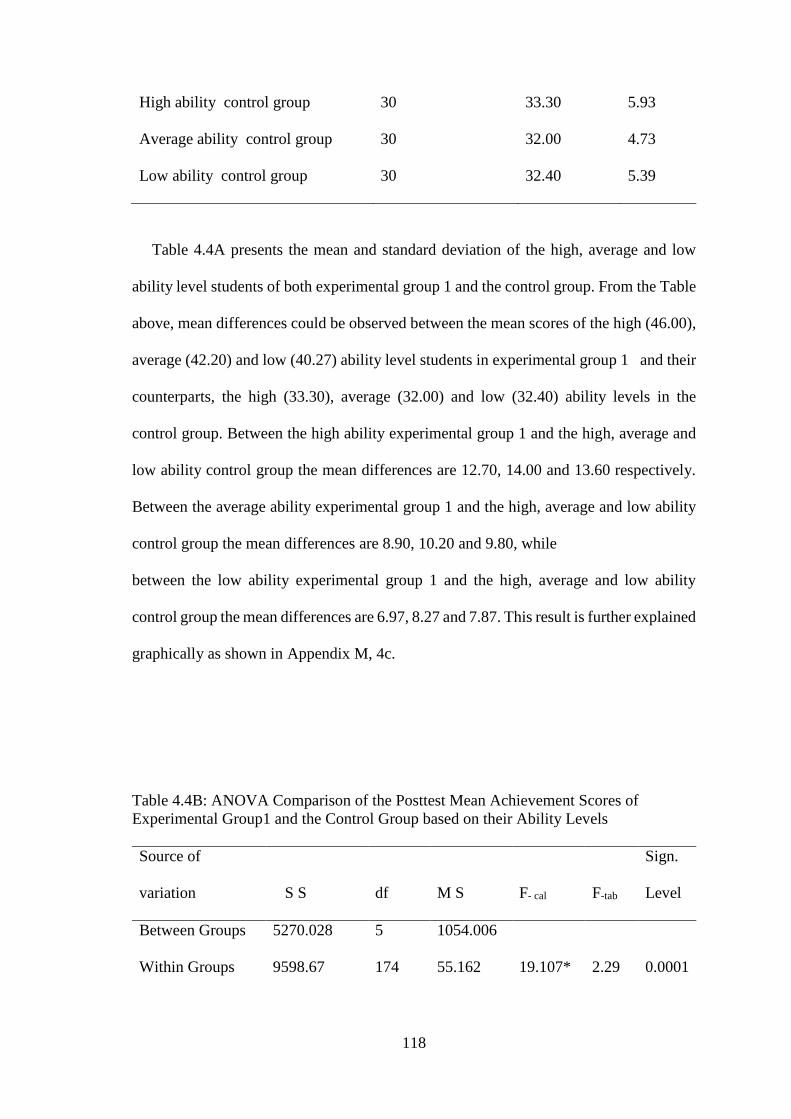
118
High ability control group 30 33.30 5.93
Average ability control group 30 32.00 4.73
Low ability control group 30 32.40 5.39
Table 4.4A presents the mean and standard deviation of the high, average and low
ability level students of both experimental group 1 and the control group. From the Table
above, mean differences could be observed between the mean scores of the high (46.00),
average (42.20) and low (40.27) ability level students in experimental group 1 and their
counterparts, the high (33.30), average (32.00) and low (32.40) ability levels in the
control group. Between the high ability experimental group 1 and the high, average and
low ability control group the mean differences are 12.70, 14.00 and 13.60 respectively.
Between the average ability experimental group 1 and the high, average and low ability
control group the mean differences are 8.90, 10.20 and 9.80, while
between the low ability experimental group 1 and the high, average and low ability
control group the mean differences are 6.97, 8.27 and 7.87. This result is further explained
graphically as shown in Appendix M, 4c.
Table 4.4B: ANOVA Comparison of the Posttest Mean Achievement Scores of
Experimental Group1 and the Control Group based on their Ability Levels
Source of
variation
S S
df
M S
F- cal
F-tab
Sign.
Level
Between Groups 5270.028 5 1054.006
19.107*
2.29
0.0001 Within Groups 9598.67 174 55.162
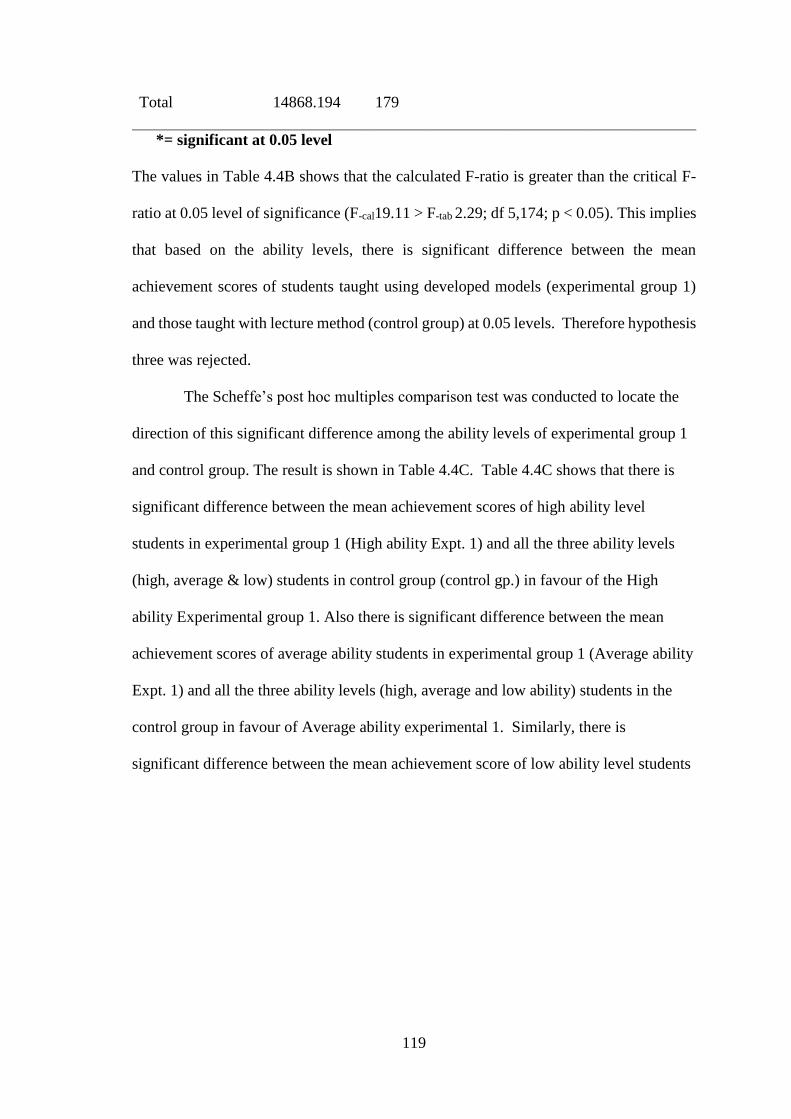
119
Total 14868.194 179
*= significant at 0.05 level
The values in Table 4.4B shows that the calculated F-ratio is greater than the critical F-
ratio at 0.05 level of significance (F-cal19.11 > F-tab 2.29; df 5,174; p < 0.05). This implies
that based on the ability levels, there is significant difference between the mean
achievement scores of students taught using developed models (experimental group 1)
and those taught with lecture method (control group) at 0.05 levels. Therefore hypothesis
three was rejected.
The Scheffe’s post hoc multiples comparison test was conducted to locate the
direction of this significant difference among the ability levels of experimental group 1
and control group. The result is shown in Table 4.4C. Table 4.4C shows that there is
significant difference between the mean achievement scores of high ability level
students in experimental group 1 (High ability Expt. 1) and all the three ability levels
(high, average & low) students in control group (control gp.) in favour of the High
ability Experimental group 1. Also there is significant difference between the mean
achievement scores of average ability students in experimental group 1 (Average ability
Expt. 1) and all the three ability levels (high, average and low ability) students in the
control group in favour of Average ability experimental 1. Similarly, there is
significant difference between the mean achievement score of low ability level students
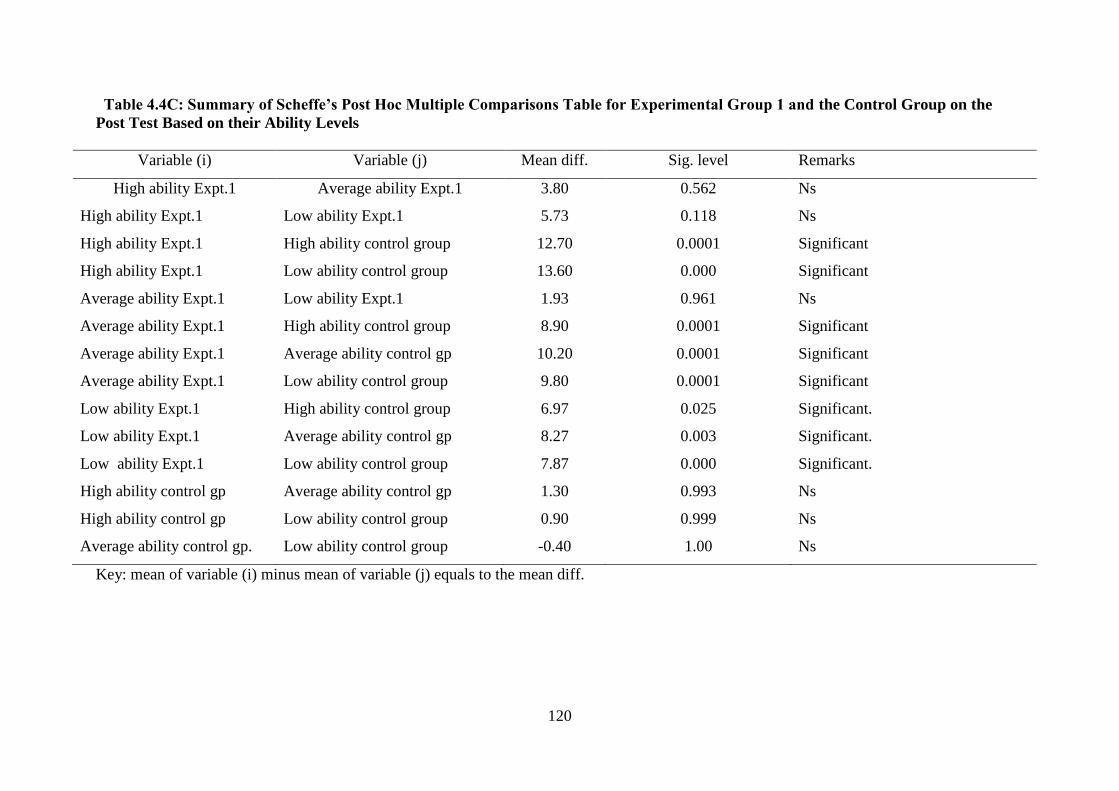
120
Table 4.4C: Summary of Scheffe’s Post Hoc Multiple Comparisons Table for Experimental Group 1 and the Control Group on the
Post Test Based on their Ability Levels
Variable (i) Variable (j) Mean diff. Sig. level Remarks
High ability Expt.1 Average ability Expt.1 3.80 0.562 Ns
High ability Expt.1 Low ability Expt.1 5.73 0.118 Ns
High ability Expt.1 High ability control group 12.70 0.0001 Significant
High ability Expt.1 Low ability control group 13.60 0.000 Significant
Average ability Expt.1 Low ability Expt.1 1.93 0.961 Ns
Average ability Expt.1 High ability control group 8.90 0.0001 Significant
Average ability Expt.1 Average ability control gp 10.20 0.0001 Significant
Average ability Expt.1 Low ability control group 9.80 0.0001 Significant
Low ability Expt.1 High ability control group 6.97 0.025 Significant.
Low ability Expt.1 Average ability control gp 8.27 0.003 Significant.
Low ability Expt.1 Low ability control group 7.87 0.000 Significant.
High ability control gp Average ability control gp 1.30 0.993 Ns
High ability control gp Low ability control group 0.90 0.999 Ns
Average ability control gp. Low ability control group -0.40 1.00 Ns
Key: mean of variable (i) minus mean of variable (j) equals to the mean diff.
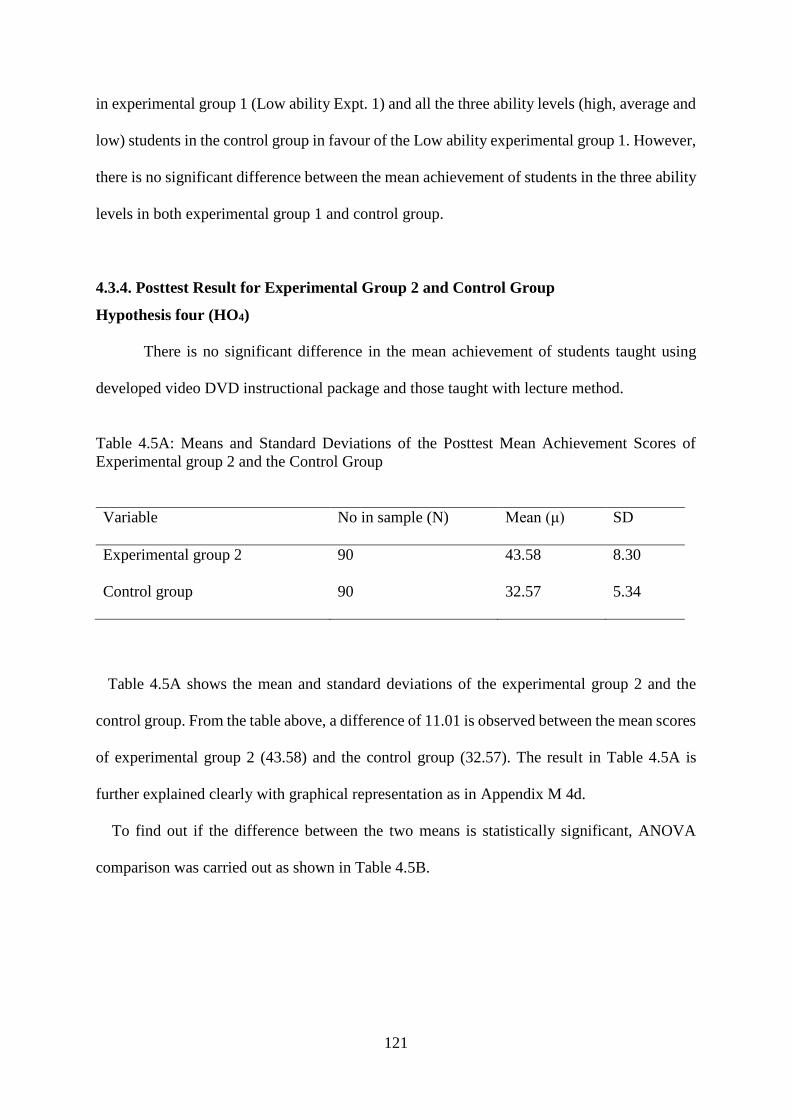
121
in experimental group 1 (Low ability Expt. 1) and all the three ability levels (high, average and
low) students in the control group in favour of the Low ability experimental group 1. However,
there is no significant difference between the mean achievement of students in the three ability
levels in both experimental group 1 and control group.
4.3.4. Posttest Result for Experimental Group 2 and Control Group
Hypothesis four (HO4)
There is no significant difference in the mean achievement of students taught using
developed video DVD instructional package and those taught with lecture method.
Table 4.5A: Means and Standard Deviations of the Posttest Mean Achievement Scores of
Experimental group 2 and the Control Group
Variable No in sample (N) Mean (μ) SD
Experimental group 2 90 43.58 8.30
Control group 90 32.57 5.34
Table 4.5A shows the mean and standard deviations of the experimental group 2 and the
control group. From the table above, a difference of 11.01 is observed between the mean scores
of experimental group 2 (43.58) and the control group (32.57). The result in Table 4.5A is
further explained clearly with graphical representation as in Appendix M 4d.
To find out if the difference between the two means is statistically significant, ANOVA
comparison was carried out as shown in Table 4.5B.
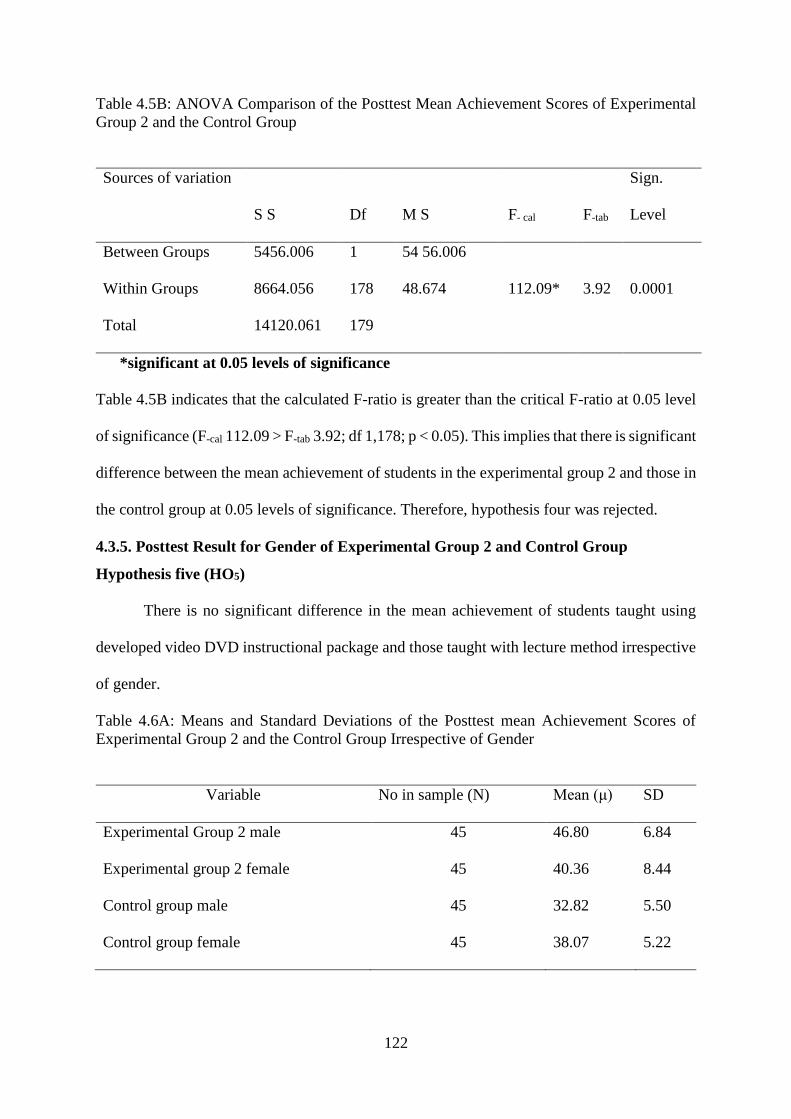
122
Table 4.5B: ANOVA Comparison of the Posttest Mean Achievement Scores of Experimental
Group 2 and the Control Group
Sources of variation
S S
Df
M S
F- cal
F-tab
Sign.
Level
Between Groups 5456.006 1 54 56.006
112.09*
3.92
0.0001 Within Groups 8664.056 178 48.674
Total 14120.061 179
*significant at 0.05 levels of significance
Table 4.5B indicates that the calculated F-ratio is greater than the critical F-ratio at 0.05 level
of significance (F-cal 112.09 > F-tab 3.92; df 1,178; p < 0.05). This implies that there is significant
difference between the mean achievement of students in the experimental group 2 and those in
the control group at 0.05 levels of significance. Therefore, hypothesis four was rejected.
4.3.5. Posttest Result for Gender of Experimental Group 2 and Control Group
Hypothesis five (HO5)
There is no significant difference in the mean achievement of students taught using
developed video DVD instructional package and those taught with lecture method irrespective
of gender.
Table 4.6A: Means and Standard Deviations of the Posttest mean Achievement Scores of
Experimental Group 2 and the Control Group Irrespective of Gender
Variable No in sample (N) Mean (μ) SD
Experimental Group 2 male 45 46.80 6.84
Experimental group 2 female 45 40.36 8.44
Control group male 45 32.82 5.50
Control group female 45 38.07 5.22
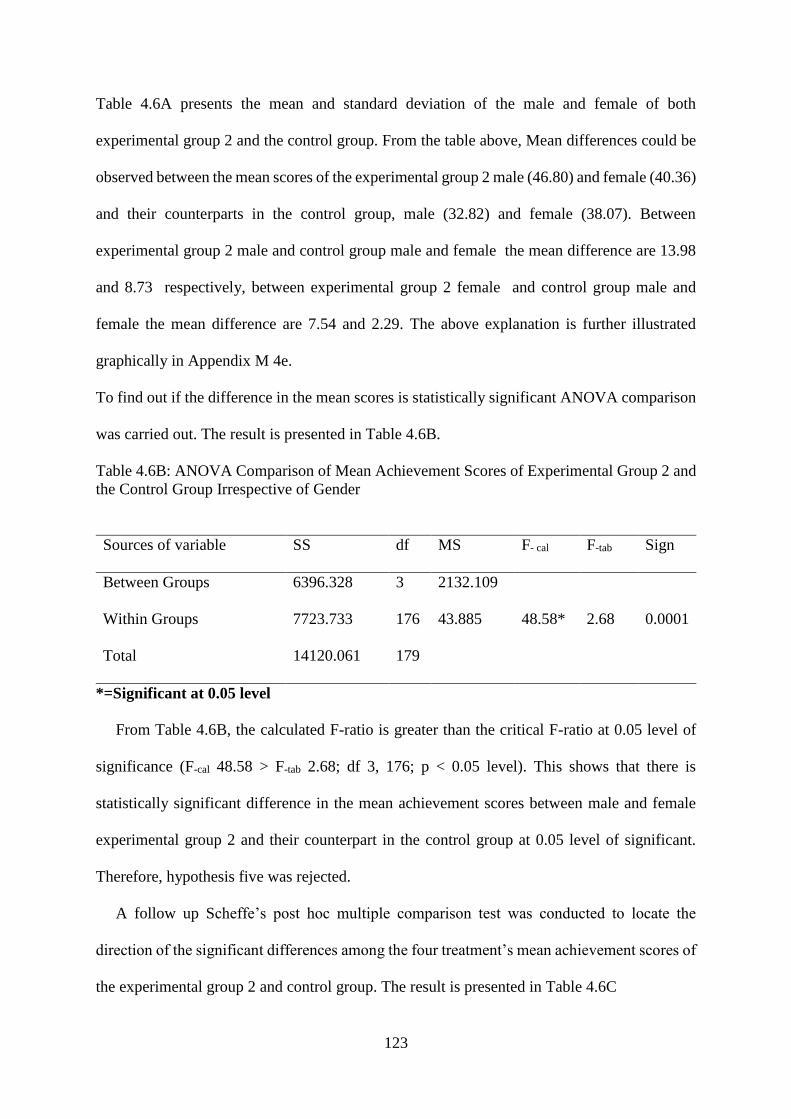
123
Table 4.6A presents the mean and standard deviation of the male and female of both
experimental group 2 and the control group. From the table above, Mean differences could be
observed between the mean scores of the experimental group 2 male (46.80) and female (40.36)
and their counterparts in the control group, male (32.82) and female (38.07). Between
experimental group 2 male and control group male and female the mean difference are 13.98
and 8.73 respectively, between experimental group 2 female and control group male and
female the mean difference are 7.54 and 2.29. The above explanation is further illustrated
graphically in Appendix M 4e.
To find out if the difference in the mean scores is statistically significant ANOVA comparison
was carried out. The result is presented in Table 4.6B.
Table 4.6B: ANOVA Comparison of Mean Achievement Scores of Experimental Group 2 and
the Control Group Irrespective of Gender
Sources of variable SS df MS F- cal F-tab Sign
Between Groups 6396.328 3 2132.109
48.58*
2.68
0.0001 Within Groups 7723.733 176 43.885
Total 14120.061 179
*=Significant at 0.05 level
From Table 4.6B, the calculated F-ratio is greater than the critical F-ratio at 0.05 level of
significance (F-cal 48.58 > F-tab 2.68; df 3, 176; p < 0.05 level). This shows that there is
statistically significant difference in the mean achievement scores between male and female
experimental group 2 and their counterpart in the control group at 0.05 level of significant.
Therefore, hypothesis five was rejected.
A follow up Scheffe’s post hoc multiple comparison test was conducted to locate the
direction of the significant differences among the four treatment’s mean achievement scores of
the experimental group 2 and control group. The result is presented in Table 4.6C
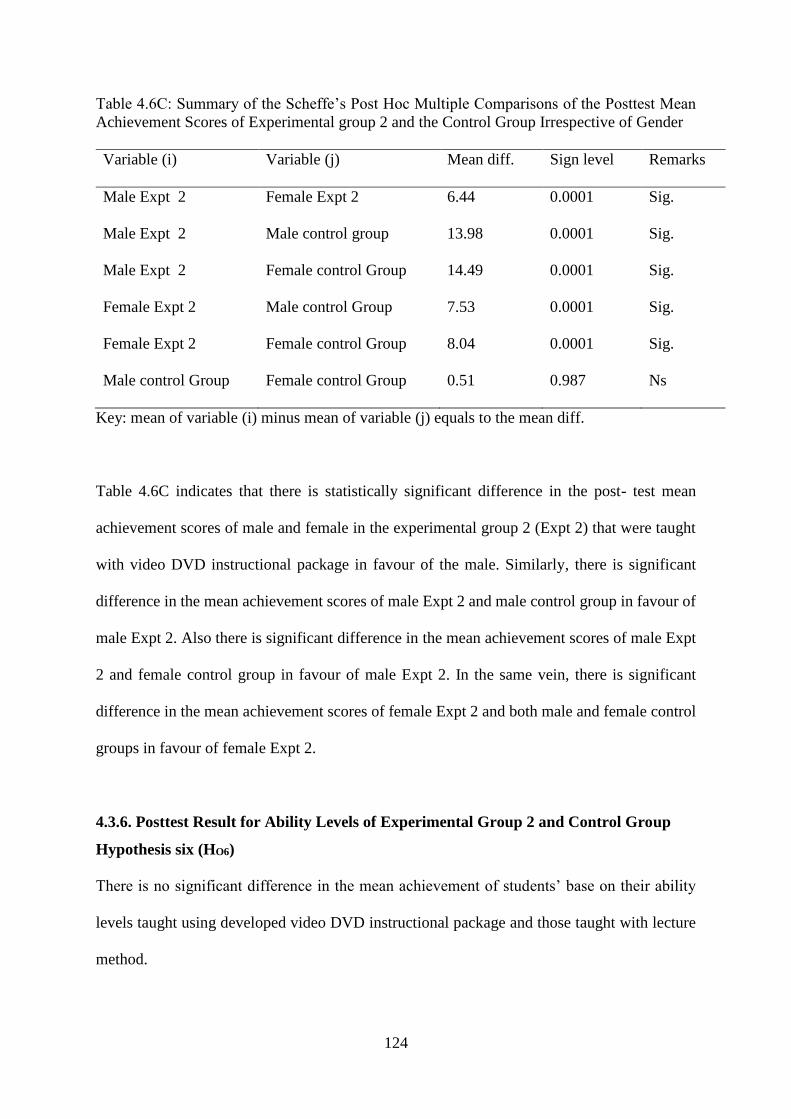
124
Table 4.6C: Summary of the Scheffe’s Post Hoc Multiple Comparisons of the Posttest Mean
Achievement Scores of Experimental group 2 and the Control Group Irrespective of Gender
Variable (i) Variable (j) Mean diff. Sign level Remarks
Male Expt 2 Female Expt 2 6.44 0.0001 Sig.
Male Expt 2 Male control group 13.98 0.0001 Sig.
Male Expt 2 Female control Group 14.49 0.0001 Sig.
Female Expt 2 Male control Group 7.53 0.0001 Sig.
Female Expt 2 Female control Group 8.04 0.0001 Sig.
Male control Group Female control Group 0.51 0.987 Ns
Key: mean of variable (i) minus mean of variable (j) equals to the mean diff.
Table 4.6C indicates that there is statistically significant difference in the post- test mean
achievement scores of male and female in the experimental group 2 (Expt 2) that were taught
with video DVD instructional package in favour of the male. Similarly, there is significant
difference in the mean achievement scores of male Expt 2 and male control group in favour of
male Expt 2. Also there is significant difference in the mean achievement scores of male Expt
2 and female control group in favour of male Expt 2. In the same vein, there is significant
difference in the mean achievement scores of female Expt 2 and both male and female control
groups in favour of female Expt 2.
4.3.6. Posttest Result for Ability Levels of Experimental Group 2 and Control Group
Hypothesis six (HO6)
There is no significant difference in the mean achievement of students’ base on their ability
levels taught using developed video DVD instructional package and those taught with lecture
method.
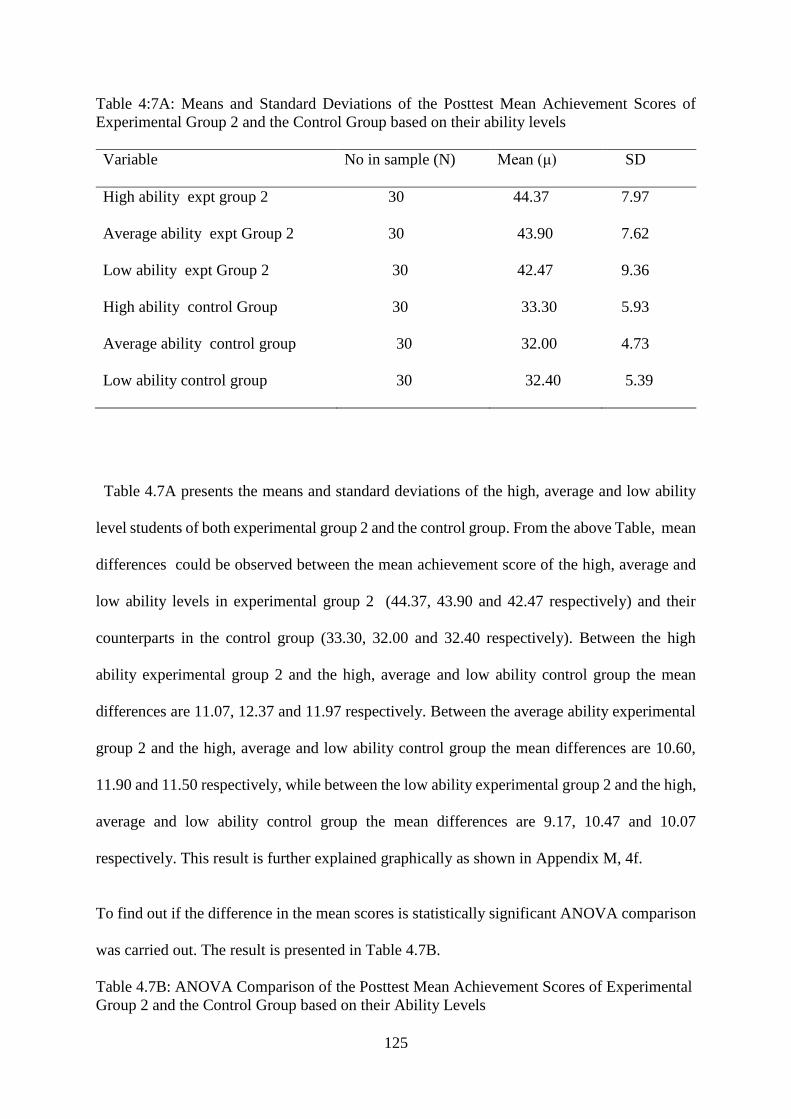
125
Table 4:7A: Means and Standard Deviations of the Posttest Mean Achievement Scores of
Experimental Group 2 and the Control Group based on their ability levels
Variable No in sample (N) Mean (μ) SD
High ability expt group 2 30 44.37 7.97
Average ability expt Group 2 30 43.90 7.62
Low ability expt Group 2 30 42.47 9.36
High ability control Group 30 33.30 5.93
Average ability control group 30 32.00 4.73
Low ability control group 30 32.40 5.39
Table 4.7A presents the means and standard deviations of the high, average and low ability
level students of both experimental group 2 and the control group. From the above Table, mean
differences could be observed between the mean achievement score of the high, average and
low ability levels in experimental group 2 (44.37, 43.90 and 42.47 respectively) and their
counterparts in the control group (33.30, 32.00 and 32.40 respectively). Between the high
ability experimental group 2 and the high, average and low ability control group the mean
differences are 11.07, 12.37 and 11.97 respectively. Between the average ability experimental
group 2 and the high, average and low ability control group the mean differences are 10.60,
11.90 and 11.50 respectively, while between the low ability experimental group 2 and the high,
average and low ability control group the mean differences are 9.17, 10.47 and 10.07
respectively. This result is further explained graphically as shown in Appendix M, 4f.
To find out if the difference in the mean scores is statistically significant ANOVA comparison
was carried out. The result is presented in Table 4.7B.
Table 4.7B: ANOVA Comparison of the Posttest Mean Achievement Scores of Experimental
Group 2 and the Control Group based on their Ability Levels
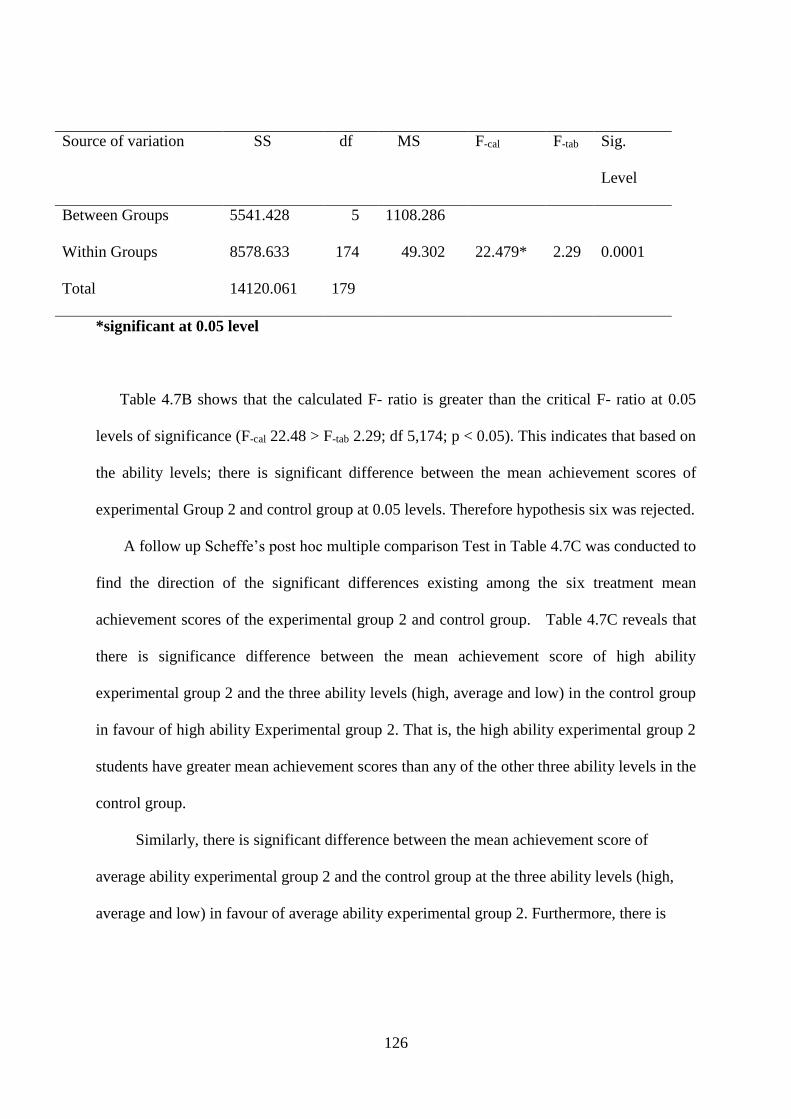
126
Source of variation SS df MS F-cal
F-tab Sig.
Level
Between Groups 5541.428 5 1108.286
22.479*
2.29
0.0001 Within Groups 8578.633 174 49.302
Total 14120.061 179
*significant at 0.05 level
Table 4.7B shows that the calculated F- ratio is greater than the critical F- ratio at 0.05
levels of significance (F-cal 22.48 > F-tab 2.29; df 5,174; p < 0.05). This indicates that based on
the ability levels; there is significant difference between the mean achievement scores of
experimental Group 2 and control group at 0.05 levels. Therefore hypothesis six was rejected.
A follow up Scheffe’s post hoc multiple comparison Test in Table 4.7C was conducted to
find the direction of the significant differences existing among the six treatment mean
achievement scores of the experimental group 2 and control group. Table 4.7C reveals that
there is significance difference between the mean achievement score of high ability
experimental group 2 and the three ability levels (high, average and low) in the control group
in favour of high ability Experimental group 2. That is, the high ability experimental group 2
students have greater mean achievement scores than any of the other three ability levels in the
control group.
Similarly, there is significant difference between the mean achievement score of
average ability experimental group 2 and the control group at the three ability levels (high,
average and low) in favour of average ability experimental group 2. Furthermore, there is
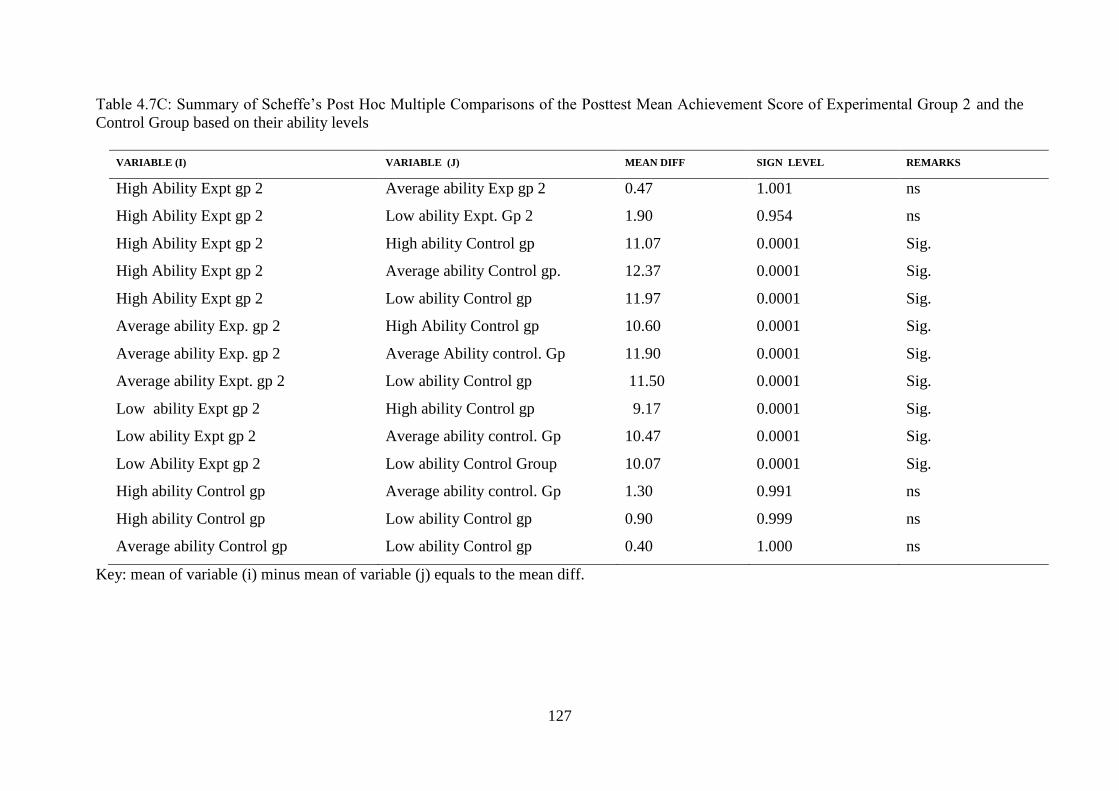
127
Table 4.7C: Summary of Scheffe’s Post Hoc Multiple Comparisons of the Posttest Mean Achievement Score of Experimental Group 2 and the
Control Group based on their ability levels
VARIABLE (I) VARIABLE (J) MEAN DIFF SIGN LEVEL REMARKS
High Ability Expt gp 2 Average ability Exp gp 2 0.47 1.001 ns
High Ability Expt gp 2 Low ability Expt. Gp 2 1.90 0.954 ns
High Ability Expt gp 2 High ability Control gp 11.07 0.0001 Sig.
High Ability Expt gp 2 Average ability Control gp. 12.37 0.0001 Sig.
High Ability Expt gp 2 Low ability Control gp 11.97 0.0001 Sig.
Average ability Exp. gp 2 High Ability Control gp 10.60 0.0001 Sig.
Average ability Exp. gp 2 Average Ability control. Gp 11.90 0.0001 Sig.
Average ability Expt. gp 2 Low ability Control gp 11.50 0.0001 Sig.
Low ability Expt gp 2 High ability Control gp 9.17 0.0001 Sig.
Low ability Expt gp 2 Average ability control. Gp 10.47 0.0001 Sig.
Low Ability Expt gp 2 Low ability Control Group 10.07 0.0001 Sig.
High ability Control gp Average ability control. Gp 1.30 0.991 ns
High ability Control gp Low ability Control gp 0.90 0.999 ns
Average ability Control gp Low ability Control gp 0.40 1.000 ns
Key: mean of variable (i) minus mean of variable (j) equals to the mean diff.
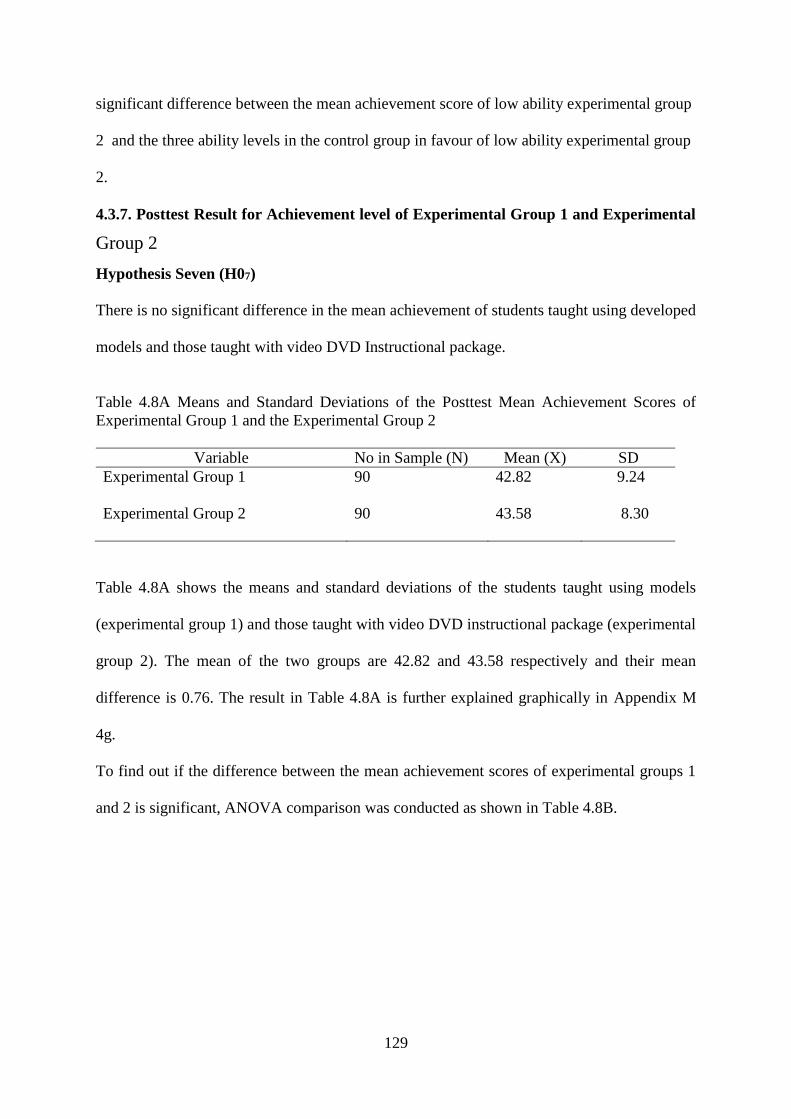
129
significant difference between the mean achievement score of low ability experimental group
2 and the three ability levels in the control group in favour of low ability experimental group
2.
4.3.7. Posttest Result for Achievement level of Experimental Group 1 and Experimental
Group 2
Hypothesis Seven (H07)
There is no significant difference in the mean achievement of students taught using developed
models and those taught with video DVD Instructional package.
Table 4.8A Means and Standard Deviations of the Posttest Mean Achievement Scores of
Experimental Group 1 and the Experimental Group 2
Variable No in Sample (N) Mean (X) SD
Experimental Group 1 90 42.82 9.24
Experimental Group 2 90 43.58 8.30
Table 4.8A shows the means and standard deviations of the students taught using models
(experimental group 1) and those taught with video DVD instructional package (experimental
group 2). The mean of the two groups are 42.82 and 43.58 respectively and their mean
difference is 0.76. The result in Table 4.8A is further explained graphically in Appendix M
4g.
To find out if the difference between the mean achievement scores of experimental groups 1
and 2 is significant, ANOVA comparison was conducted as shown in Table 4.8B.
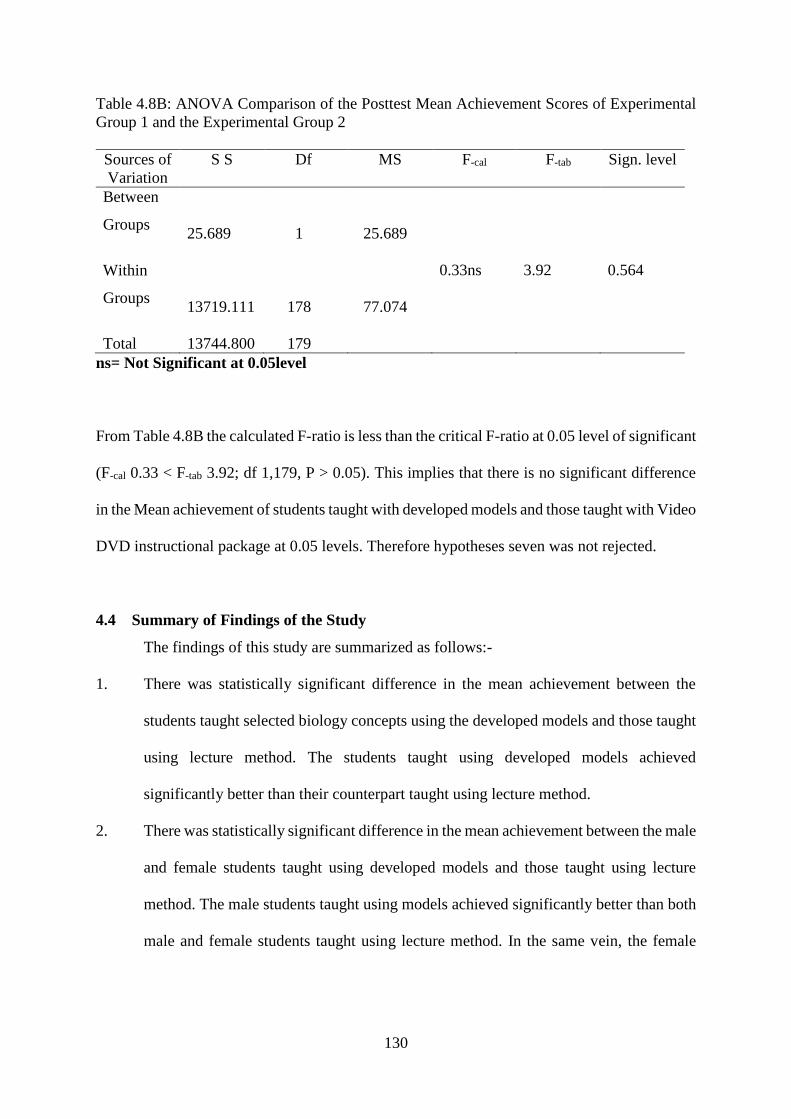
130
Table 4.8B: ANOVA Comparison of the Posttest Mean Achievement Scores of Experimental
Group 1 and the Experimental Group 2
Sources of
Variation
S S Df MS F-cal F-tab Sign. level
Between
Groups
25.689
1
25.689
Within
Groups
13719.111
178
77.074
0.33ns 3.92 0.564
Total 13744.800 179
ns= Not Significant at 0.05level
From Table 4.8B the calculated F-ratio is less than the critical F-ratio at 0.05 level of significant
(F-cal 0.33 < F-tab 3.92; df 1,179, P > 0.05). This implies that there is no significant difference
in the Mean achievement of students taught with developed models and those taught with Video
DVD instructional package at 0.05 levels. Therefore hypotheses seven was not rejected.
4.4 Summary of Findings of the Study
The findings of this study are summarized as follows:-
1. There was statistically significant difference in the mean achievement between the
students taught selected biology concepts using the developed models and those taught
using lecture method. The students taught using developed models achieved
significantly better than their counterpart taught using lecture method.
2. There was statistically significant difference in the mean achievement between the male
and female students taught using developed models and those taught using lecture
method. The male students taught using models achieved significantly better than both
male and female students taught using lecture method. In the same vein, the female
131
students taught using developed models achieved sufficiently better than their male and
female counterparts taught using lecture method.
3. There was statistically significant difference between the mean achievement of students
taught using developed models and those taught with lecture method based on their
ability levels. High, average and low ability level students taught using developed
models achieved significantly better than their counterparts taught with lecture method.
4. There was statistically significant difference in the mean achievement between the
students taught the selected biology concepts using developed video DVD instructional
package and those taught with lecture method. The students taught using Video DVD
package achieved significantly better than their counterpart taught using lecture
method.
5. There was statistically significant difference in the mean achievement between the male
and female students taught using video DVD instructional package and their
counterpart taught with lecture method. Male students taught using video DVD
instructional package achieved significantly better than both male and female taught
using lecture. Also the female students taught using video DVD instructional package
achieved significantly better than both the female and male students taught with lecture
method.
6. There was statistically significant difference between the mean achievement of students
taught using developed video DVD instructional package and those taught with lecture
method based on their ability levels. Students in the three categories of ability levels
taught using video DVD package achieved significantly better than all the students in
the three ability levels taught with lecture method.

132
7. There was statistically no significant difference in the mean achievement between the
students taught the selected biology concepts using developed models and those taught
using developed video DVD instructional package.
133
CHAPTER FIVE
DISCUSSION, CONCLUSION AND RECOMMENDATION
5.1 Introduction
The purpose of this study was to investigate the effects of improvised instructional
media on secondary school students’ achievement in biology concepts in Niger State. This
chapter presents discussions, conclusion, recommendations and suggestions for further study.
5.2 Discussion of Results
In this section, the discussion of the results obtained from the data analysis is presented.
The discussion is based on the research questions and the corresponding hypotheses. The result
of the data analyzed showed that the experimental group 1 students taught with developed
models with mean achievement of (42.82) achieved higher than the control group taught with
lecture method with mean achievement of (32.57). This implies that there was a difference in
the mean achievement of students taught using developed models and those taught with lecture
method. This fact is manifested in table 4.2A and is relevant to research question 1. The
outcome of testing the corresponding hypothesis 1 as presented in Table 4.2B further revealed
that the difference between the mean achievements of the experimental group 1 and the control
group was statistically significant. Thus hypothesis 1 was rejected. This means that the
developed models have an enhancing effect on the teaching and learning of biology than lecture
method.
The significant achievement of the students taught with the developed models over
those taught with lecture method could be explained by the fact that Learning through visual
resources is the key to acquisition of knowledge. When a student is instructed verbally there is
the tendency to forget. Knowledge that is visualized aids remembrance. Media materials
134
(Models) have the potentials to evoke the involvement of as many sense organs as
possible in the teaching and learning process. This stimulates the learners to receive and process
all the necessary information thereby enhancing achievement. Also the use of the models
introduces variety into the learning process and enables the teacher to convey meaningful
information to the learners. Variety is the spice of life. Seeing and doing the same thing over
and over again may lead to boredom. This can be true of teaching and learning, the interest of
students in learning may diminish resulting in low achievement as in the case of the control
group if instruction is only by “chalking and talking”. The students’ interest is stimulated,
aroused and sustained for meaningful learning to take place when teaching is enriched with
instructional materials such as models.
This result agrees with the previous findings of Umeoduagu (2000) Obodozie (2002),
and Mohammed (2004). They found that the use of models in teaching enhanced students’
academic achievement in Science and non science subjects. Kareem (2003) asserted that all
teaching and learning is greatly improved by the use of visual media because they can make
the learning experience memorable. He added that when models are intelligently used, they
promote the most effective kind of learning in adults as well as children. It can therefore be
emphatically said here that the use of improvised models enhanced the teaching and learning
of biology in secondary schools resulting in higher achievement by the learners.
The findings on the effects of developed models on students’ mean achievement
irrespective of gender as sought by research question two indicated that male and
female students taught with developed models had higher mean achievements (41.40 and 44.04
respectively) than their counterparts taught with lecture method (32.82 and 32.31
respectively), see Table 4.3A. This implies that there was a difference between the mean
achievements of students taught using developed models and those taught with lecture method
irrespective of gender. The result of testing hypothesis two as contained in ANOVA Table
135
4.3B proved that there was significant difference between the mean achievements of students
taught using developed models and those taught with lecture method irrespective of gender.
Hypothesis two was therefore rejected. Scheffe’s post hoc multiple comparison tests in table
4.3C made it clear that the male students taught using developed models achieved significantly
higher than both the male and female students taught with lecture method. Also the female
students taught using developed models achieved significantly higher than both male and
female students taught with lecture methods. It could be noted also from the Scheffe’s test that
although the male and female students taught using developed models have different mean
achievements, the difference was statistically not significant. These findings indicated that the
developed models have an enhancing effect on the teaching and learning of biology concepts
of circulation and execration and were gender friendly.
The enhancing effects of the developed models on the mean achievement of experimental
group 1 students over the control group irrespective of gender could be explained from
psychological point of view. According to the Gestalt psychologists, perception is the
foundation of learning irrespective of gender, age or race. Thus learning comes as a result of
insight and perceptual organization. In the teaching and learning of any concept, better and
clearer perception and insight occur when the instructional process is enriched with
instructional media. This implies that the clearer the perception of an object, topic or concept,
the better it can be understood and remembered by both sexes. An assessment of the nature and
the roles the developed models played in teaching and learning of the selected biology concepts
reveals that the models stand to satisfy the demands of Gestalt’s theories of learning for
enhanced learning outcome. The models provided the insight and better perception of the
concepts taught irrespective of gender. The psychological implications of the above view is
that science subjects especially biology cannot be properly taught without the use of
instructional media.
136
The findings of the study agreed with the earlier findings of Essien (2001),
Obodozie (2002), and Abdullahi (2003). They opined that models promote the learners
perception, understanding, transfer and retention of learnt materials in male and female better
than conventional method. However the finding is in disparity with the findings of Mohammed
(2004) who came out with the findings that there was significant difference in the performance
of male and female students taught physical Education with improvised radio (Model).
The findings on the effects of developed models on students’ mean achievement based on
their ability level as sought by research question three indicated that high, average and low
ability students taught with developed models (experimental group 1) had higher mean
achievements (46.00, 42.20 and 40.27) respectively than their counterparts taught with lecture
method (control group) with mean achievement (33.30, 32.00 and 32.40) respectively. See
Table 4.4A. Based on their ability level, this implies that there was a difference in the mean
achievements of students taught using developed models and those taught with lecture method.
The result of testing hypothesis three as contained in ANOVA Table 4.4B proved that there
was significant difference between the mean achievements of three ability level students in the
experimental and control groups. Hypothesis three was therefore rejected. Scheffe’s post hoc
multiple comparison tests in table 4.4c revealed further that each of the three ability-level
students (high, average and low) taught with the developed models achieved significantly
higher than the high, average and low ability students taught with lecture method. The Scheffe
post hoc tests also indicates that there was no significant difference in the mean achievement
of high, average and low ability students taught with developed models.
From these results, it could be deduced that the developed models enhanced the
academic achievement of students more than the lecture method irrespective of the ability
levels. This finding could be explained based on the view of the Gestalt psychologists that
meaningfulness; completeness, relative simplicity and good pattern usually characterize any
137
teaching and learning process which is enriched with instructional media materials. Thus the
use of the developed models provided a favourable learning atmosphere for the learners
irrespective of ability levels. The models are effective owing to their ability to bridge the gap
in understanding of concepts and the consequent disparity in achievement of students in high,
average and low ability levels. These findings are in line with the earlier findings of Okobi
(1994) and Lagoke et al (1999). They maintained that inclusion of improved strategy for
teaching biology was helpful to all ability levels of students than lecture method. However, the
finding of this study is in disagreement with the findings of Aiyedun (1995), Inyang and
Ekpeyong (2000). They found significant difference in the mean posttest scores among the
students of different ability levels.
The result of data analysis with reference to research question 4 as shown in Table 4.5A
indicated that the students taught using developed video DVD instructional package
(experimental group 2) with mean achievement of (43.58) achieved higher than those taught
with lecture method (control group) with mean achievement of (32.57). This implies that there
was a difference in the mean achievement of experimental group 2 students and the control
group. The outcome of testing the corresponding hypothesis 4 as presented in ANOVA
comparison Table 4.5B further revealed that the difference between the mean achievements of
the experimental group 2 and the control group was statistically significant. Thus hypothesis 2
was rejected. From this result, it could be inferred that video DVD instructional package has
an enhancing effect on the teaching and learning of biology than lecture method.
The significant achievement of the students taught with the developed video DVD
instructional package over those taught with lecture method could be explained by the fact that
experimental group 2 participated in the lesson by making use of their senses. They listened to
the teacher’s voice as she spoke with them; they used their eyes to watch the video and they
touched the video materials by way of participation in the lesson. In this way, video instruction
138
stimulates thinking, summarizes, demonstrates and concretizes knowledge that could otherwise
only be talked about in abstract terms, thereby culminating in enhanced academic
achievements. The significant difference supports the fact that learning through audiovisuals
such as video DVD used in this study is a vital key to assimilation of knowledge. When
instructions are heard and visualized, they seek to arouse interest, clarify concepts, modify
attitude and possess the capacity to enhance quality learning. Finally the knowledge is easily
registered in the individual memory bank.
The above result is in agreement with previous findings of Ajayi and Salami (1999),
Ayagu (2000), Nneji (2000), Amamize (2001) and Adekunle (2005). They found that the use
of video package in teaching and learning makes learning interesting and motivating to
students.
The findings on the effects of developed video DVD instructional package on the mean
achievement of students taught with developed video DVD instructional package and those
taught with lecture method irrespective of gender as sought by research question 5 indicated
that male and female students taught with developed video DVD instructional package
(experimental group 2) had higher mean achievements (46.80 and 40.36 respectively) than their
counterparts taught with lecture method (control group) (32.82 and 38.07 respectively) see
Table 4.6A. This implies that there was a difference in their mean achievements. The result of
testing the corresponding hypothesis 5 as contained in ANOVA Table 4.6B proved that there
was significant difference between the mean achievements of male and female students in
experimental group 2 and their counterparts in the control group. Hypothesis 5 was therefore
rejected. Scheffe’s post hoc multiple comparison tests in table 4.6C made it clear that the male
students taught using developed video DVD instructional package achieved significantly
higher than both the male and female students taught with lecture method. Also the female
139
students taught using developed models achieved significantly higher than both male and
female students taught with lecture methods.
From these results, it could be inferred that using instructional video DVD package has
an enhancing effect on the teaching and learning of the selected biology concepts irrespective
of gender. This point is made clear from the fact that video DVD instructional packages have
the potentials to concretize learning through a playback mechanism. It could be played,
rewound, fast-forwarded and replayed by the learner for discussions and questions on difficult
concepts. Also where audiovisual medium like video DVD package is used, learning
environment is highly stimulating and the students motivated to take a greater interest in
learning. This applies to students of all sexes and accounts for why male and female
experimental group 2 students achieved significantly higher than their counterparts in the
control group.
The result also revealed that male experimental group 2 students achieved significantly
higher than their female counterpart. These observations could be explained from the fact that
male students have the natural inclination to watch several programs (football, films and others)
with understanding and interest on the television than the females. These tendencies might have
equipped them with the ability to concentrate, follow trend and understand the scripts with
ease. While the female counterpart will need to go through the scripts several times in order to
meet up with their male counterpart. This implies that it was not sex that affected the students
achievement but their attitude to the use of electronics.
The findings above support the findings of Nneji (2000) and Amamize (2001). They
clarified that video instruction serves as a spring board for further learning and that the
flexibility of video package makes it an effective learning tool. The result of this study is also
in agreement with the previous research findings of Mohammed (2000), Awoniyi (2000),
Mohammed (2004) and Olumba (2007). They came out with the finding that the use of
140
electronic media enhanced the performance of male students’ more than females. They found
that gender does not have positive affect on the performance of students.
The findings on the effects of developed video DVD instructional package on
students’ mean achievement based on their ability level as sought by research question 6
indicated that high, average and low ability students taught with developed video DVD
instructional package (experimental group 2) had higher mean achievements (44.37, 42.20 and
40.27 respectively) than their counterparts taught with lecture method (control group) with
mean achievements (33.30, 32.00 and 32.40 respectively) see Table 4.7A. This implies that
there was a difference between the mean achievements of the three ability level students in the
experimental group 2 and their counterparts in the control group. The result of testing
corresponding hypothesis 6 as contained in ANOVA Table 4.7B indicated that there was
significant difference between the mean achievements of students based on their ability levels
taught with video DVD instructional package and those taught with lecture method. Hypothesis
6 was therefore rejected. Scheffe’s post hoc multiple comparison tests in table 4.7C revealed
further that each of the three ability levels students (high, average and low) taught with the
developed video DVD instructional package achieved significantly higher than their
counterparts taught with lecture method. Scheffe’s test also indicates that there was no
significant difference in the mean achievement of high, average and low ability students taught
with developed video DVD instructional package.
The enhancing effects of video DVD package on students’ achievement could be
explained from the fact that optimum performance in the teaching and learning of any task
would occur only when instructional media such as video package is employed in teaching.
The use of this media would have motivated, stimulated, captured the interest of the students
irrespective of ability levels and spurred curiosity and eagerness among them to learn and
remember what is learnt. This culminated in enhanced performance.
141
The above result is in agreement with pervious findings of Ajayi and Salami (1999),
Nneji (2000) and Adekunle (2005). They found that the use of video package in teaching
science subjects enhanced students’ academic achievement irrespective of ability levels. They
also affirmed that video package is effective owning to its ability to captivate and hold
attention.
The result of data analysis with reference to research question 7 as shown in Table
4.8A indicated that the students taught using developed models (experimental group 1) with
mean achievement of (42.82) achieved slightly lower than those taught with developed video
DVD instructional package (experimental group 2) with mean achievement of (43.58). The
outcome of testing the corresponding hypothesis 7 as presented in ANOVA comparison Table
4.8B revealed that the difference between the mean achievements of experimental group 1 and
experimental group 2 was statistically not significant. Thus hypothesis 7 was not rejected.
Thus far, it seems logical to infer that both the developed models and video DV
instructional package were equally effective in enhancing the teaching and learning of the
selected biology concepts. The effectiveness of these media materials lies on the fact that
instructional media reduce abstractions in the class lesson, reduce boredom among students
and teachers, and restructure the learning environment. In addition, they make learning
interesting and motivating to students, thereby promoting students’ participation in the lesson.
Most instructional media evoke the involvement of as many sense organs as possible which
stimulate students to receive and process all the necessary information for the development of
cognitive, affective and psychomotor skills.
The findings of the study confirmed the stand of Adewoyin (1991), Ayogu (2000),
Umeoduagu (2000) and Amamize (2001). They pointed out that instructional media (models,
video package and others) as an integral part of the instructional process enhance the delivery
of educational information very quickly, widely and effectively. They added that instructional
142
media enables the teacher to process instruction, enhance its presentation, supervision and
management. These and many other views may account for why the developed model and
video DVD instructional package both enhanced academic achievement of students equally.
5.3 Contributions to Knowledge
This study has contributed to knowledge in the following ways:-
1. The successful improvisation and use of the models and video DVD instructional
package is a major contribution of this study to knowledge. Most teachers in
secondary schools still teach without instructional media whenever there is lack or
absence of instructional media. The result of this study will go a long way in
reawakening the consciousness of such teachers to the fact that they could
successfully improvise needed instructional media for improved achievement.
2. The instructional media, that is, models and video DVD instructional package
improvised and used by the researcher in this study could be used by any biology
teacher or student anywhere to teach or learn biology concepts of circulation and
excretion.
3. The study has contributed to the existing scholarly literature and provided additional
knowledge and information on how to produce models and video DVD instructional
package. Any teacher, anywhere can follow the trend in these productions and
produce other relevant instructional media.
4. The models and video DVD instructional package improvised and used have
contributed in addressing the problematic issues of gender and ability levels’ effects
on students' academic. They bridged the gap in the achievement of students in
respect of ability levels completely and gender partially.
143
5.4 Implications of the Findings to Science and Technology Education
The results of this study revealed that the use of models and video DVD package to teach
biology concepts of circulation and excretion had not only enhanced students’ achievement but
also bridged the gender and ability gap among them.
1. This implies that the use of instructional media should be encouraged in the science
classroom for biology instruction specifically and other science subjects in general.
To achieve this, efforts should be geared towards equipping teachers with necessary
improvisation skills so that they could design instructional materials using local
materials or resources from the local environment to facilitate instruction whenever
there is a lack or shortage. In the absence of this, the problem of poor performance
will continue to pervade the educational system.
2 Either models or video DVD package can be used by the teachers since both of
them are equally effective in enhancing academic achievement of students
irrespective of gender and ability levels. This implies that disparity in gender and
ability levels is minimized with instructional media.
3 The low performance of the control group is an indication that if nothing is done to
improve the teaching and learning process in schools the poor performance which is a
national problem will remain and continue to be part of the system.
5.5 Limitation of the Study
The limitation to this study includes:
1 Many schools in the rural area are not connected by the Power Holding Company of
Nigeria (PHCN) and so the use of alternate current for the video DVD was not possible.
This implied that generator was carried from one school to another and distractions
from the noise of generator during the research experiment may have had effects on the
144
motivation and interest of the students and consequently the research results to some
negligible extent.
5.6 Conclusion
Based on the findings of this research, the following conclusions are drawn.
1. The use of improvised models and video DVD package had great positive impact
on students’ academic achievement irrespective of gender and ability levels. Thus
the use of instructional media should be seen as a ‘sine qua non’ in the teaching and
learning of science particularly Biology subject in schools.
2. Improvised biological models and video DVD package have been put to test and
proved to be effective. Consequently, it is concluded that all the stake holders in
education should embrace the act of improvisation of instructional media in Nigeria
schools as a way forward towards solving the problems of inadequate or lack of
instructional materials in schools.
3. The use of lecture method in teaching should be greatly minimized in the teaching
and learning process especially in the sciences. This is because the students’
achievement scores when taught with lecture method were very low as compared
to that of others taught with media materials.
5.7 Recommendation
The following are the recommendations made based on the findings of this study.
1. The use of improvised instructional media should be encouraged in the absence of
imported prototypes. It is recommended that mass improvisation of instructional
media be embarked upon by the Government and private enterprises. Teachers also
at their own level should not fail to improvise as much as they could. This is because

145
the economics of education is generally economics of scarcity. Therefore, no matter
how generous and rich the government might be, they are generally not in position
to provide the schools with all the instructional media they need.
2. A Library of video package in different subject areas should be kept in schools so
that both teachers and students can borrow them for use as and when needed to do
their work.
3. Qualified teachers who are already in the field and are not knowledgeable in the act
of production and use of various instructional media should be re-trained through
seminars, workshops, conferences and in-service programmes. The teachers who
are still on training in various teacher training institutions should be exposed to
educational technology courses to equip them with skills needed to face the
challenges of inadequate or lack of instructional media prevalent in Nigerian
schools.
4. Improvised models or video packages should be used by teachers in biology
instruction since both of them are equally effective in enhancing academic
achievement of students irrespective of gender and ability levels.
5. The school management should in collaboration with Parent-Teachers
Associations of their school endeavour to provide (since there is no other choice)
an alternate power supply, which is the generator. This is necessitated by the
epileptic nature of the PHCN and to provide enabling environment for the smooth
use of electronic media in the teaching and learning process.
6 The use of lecture method alone in teaching biology should completely be
minimized and if possible discouraged in schools.
146
5.8 Suggestions for further Research
1. This study should be replicated in other states or locations to find out if the same or
similar results could be obtained for better generalization of findings.
2. The sample of this study was taken from only government owned schools. Similar
studies may compare private schools to find out if the result will be the same
irrespective of school type.
3. Researchers in educational media and related fields should conduct similar studies
in the primary and tertiary levels of education using other concepts in biology.
4. Research could be conducted using models with animation and sound application
software in order to develop a new method of instructional delivery for effective
teaching of biology subject in schools.
147
REFERENCES
Abdullahi, M.H. (2003). Factors affecting the use of instructional materials in
Technical Schools in Niger State. An unpublished M.Tech. Education Thesis
Of Federal University of Technology (F U T) Minna.
Abdullahi, N .Y. (2001). Introduction to Educational Technology: A Handbook.
Minna: College of Education Publication.
Abdussalami, A. S. (2008). Research Methods in Education. Ibadan: Stirling-Horden
Publishers (Nig ) Ltd.
Abilu, R. A. (2005). Factors Militating against Students with Visual Impairment
Participation and Success in Science Education. Unpublished M.Ed Thesis.
University of Ibadan.
Abimbade A. (1997). Principles and Practice of Educational Technology. Ibadan:
International Publishers.
Adebayo, O. A. (1997). Gender Environment and Co-education as factor of
Performance in the Ravens standard progression matrices. Gombe Technical
Education Journal (GOTEJ). 1(1),12-15.
Adebimpe, A. O. (1997). Improvisation of Science Teaching Resources. In A. O.
Olarewaju, (Ed.) 43rd STAN Proceedings of Ajumojobia Memorial
Conference, 51 – 66.
Adebiyi, T.U. (1998). Construction of Models of Monocot and Dycot stem for
Biology Instruction in Secondary Schools. B.Tech Education project. F.U.T.
Minna.
Adebute, E. O. (1991). The Effects of the use of Videotape Recorder on Students’
Performance in Selected Skills in Technical Education. An unpublished PhD
Thesis, Faculty of Education University of Ilorin, Ilorin
Adekola, Y.A. (1997). The role of improvisation as a means of improving
Teacher Education and Technology Education in Nigeria 40th Anniversary
Conference Proceeding of STAN, Kana. 153-154.
Adekunle, O. (2005). Information and Communication Media in Education and
Health sciences. Lagos: Divine Media and Communications.
Adelakun, S. A .(2003). Issues in Science Education for the Visually Impaired. In
W. O. Fatokun, O. A., Adebimpe, OK Omoniyi, T. Ajoblene (Eds). Science
and Technology in Special Education. Oyo: Tobistic Printing and Publishing
Ventures.
Adelu, A.F. (1984). Communication Technology for Education in Nigeria:
Problems and Prospect. A Seminar presented on march, 15 at the Osun State
College of Education, Ilesha, in March.
148
Adeniran, A.A. (2002). New Trend in Access to Information Communication
Technology. Its implication to the Content of Africa. STAN Proceedings
and inaugural conference of CASTME Africa. 89-94.
Adewoyin, J. A. (1991). Introduction to Educational Technology. Lagos: Jon – lad
Publishers Ltd.
Adewunmi, J.A. (1992). Key to success in Nigeria Public Examinations. Ilorin:
All Publishers.
AECT (1999). Educational Technology: A glossary of terms, Washington D.C.
Agommuoh P. C. and Nzewi U. M. (2003). Effects of Videotape Instruction on
Secondary School students Achievement in Physics. Journal of STAN. 38
(1&2), 88-93.
Aguele, L.J. (2000). Improvisation and effective teaching of Mathematics in a
recessing economy. 40th anniversary conference proceedings of STAN.
Kano. 231-233.
Agun, I. and Imogie I. (1988). Educational Technology. An overview. In I.Agun
and Imogie (Eds). Fundamentals of Educational Technology. Ibadan. Y
Books. 13.
Aiyedun, J. O. (1995). Influence of Academic Ability of Students on Achievement in
Secondary school Mathematics. Ilorin journal of Education. 1(5), 93-102.
Ajayi, D. O. (1998). Community Science: Implication for Science Teachers.
STAN 39th Annual Conference Proceeding. 110-115.
Ajayi-D. Y. and Talabi, J. K. (1985). Effects of Videotape Recording on micro
Teaching Training Technique for Education Students. Journal of Educational
Television. 2(3), 207-210.
Ajelabi, J.T. (2000). Production and Utilization of Educational media. Lagos:
Raytel Communication.
Akanbi, K. (1988). “Systems Approach in Educational Technology” Proceedings of
National Symposium on Problems and Prospects of Educational Technology
In Nigeria. H. E. B. Nigeria Ltd. 60-68.
Akanbi, K. (1993). Educational Technology in Teaching Practice. In K. Akanbi,
B. Adekomi and L. Adeyanju (Eds.). Educational Technology in
Methodology of Teaching Humanities. Ondo: Ife Oluwa Press. (14-31).
Akinmoyewa, J.O. (1992). Improvisation and the effective teaching of
Technology. A paper presented at the 6th Annual Conference of
Technology writers Association of Nigeria at Ibadan.
149
Akinmoyewa, J.O. and Delu, A.F. (1994). Instructional Technology for Teachers.
Ilesha: Olayode Press.
Akinrorohum, O.F. (2000). Assessing the Use of Improvisation in Introductory
Technology Teaching At Junior Secondary Schools in Ekiti State. 41st
Annual Conference Proceeding of STAN. 399-401.
Akinsola, A.T. (2000). An Investigation into the Science Teachers self conceived
ability to improvise materials for the teaching of primary science. Ilorin
Journal of Science Education. 2 (1), 8-12.
Akudolu, L. R. (2002). Information and Communication Technology (ICT) Centered
Education: A necessity for national development. Nigeria Journal of
Computer Literacy (NJCL). 3(1), 12-15.
Amamize, B.N. (2001). Nigeria Education Review. Journal of the School of
Education, Adeniran Ogunsanya College of Education. 6(1), 197-199.
Ameh, C. O. and Gunstone, H. (1996). The understanding of selected concepts among
Nigerian secondary school science Teachers. Journal of STAN. 27(2), 30-36.
Araromi, M. A. (1998). Effects of Visual Imagery Instruction on Achieving in
Language with Particular Reference to French in Nigeria. Nigeria
Journal of Curriculum Studies. 74(21), 110-115.
Awoniyi, A.S. (2000). Sex difference in an academic performance. Nigeria
Journal of Gender and Development. 1(82), 18.
Ayogu, Z.U. (2000). Enriching Science, Technology and Mathematics Education:
The Role of New Media. Journal of Science Teachers Association of
Nigeria. 10(5), 18-20.
Balogun, F. (2000). Gender and Performance in Productive and Receptive skills of
first year secretarial students at Auchi Polytechnic, Auchi Edo State. Nigeria
journal of Gender and Development. 1(1&2), 78-80.
Balogun ,T.A. (1980). Educational Technology and Behavior Change. In
Ogunranti, A. (Ed). Problems and prospect of Educational Technology in
Nigeria. Ibadan: Heinemann Educational Books Nigeria Ltd.
Balogun, T.A. (1994). Gender Issues in the teaching of Science, Technology and
Mathematics. In S. Y. Erinosho (Ed). Perspective on Women in Science and
Technology in Nigeria. Ibadan: Sam Bookman Education and Communication
Services.
Bassey, M. P. (2002). Availability of resources for the Teaching of Science
Subject in Public Secondary School. A Case Study of some selected
Secondary School in Alimosho Local Government Area of Lagos State.
150
Unpublished M.Ed Project. University of Lagos.
Best, J. W. and Kahn, J. V. (1992). Research in Education. New Jessy: Prentice
Hall International Inc.
Boateng, B.L. (1986). Low organized Games. Zaria: PHE Department ABU.
Chapin, J.R. and Messiele, R.G. (1992). Elementary Social Studies: A practical
guide. New York; Longman Publishers.
Clark, R.F. (1983). Considering Research on learning from media. Review of
Educational Research. 53(4), 445-459.
Cobb, T.C. (1997). Cognitive Efficiency: Towards the Revised Theory of Media.
Educational Technology, Research and Development. 45(4), 117-120.
Dada, S. A. (1984). The National Education Technology Center, Kaduna and the
Development of Educational Technology in Nigeria.Nigeria Audiovisual
Journal. 1 (3) 208-222.
Danjuma, I. M, Abdullahi, A. L, and Gero, M. S. (1997). A Study of some Factors
Affecting Chemistry Teachers’ Attitude towards Improvisation in Chemistry
Teaching. 40th anniversary conference proceeding of STAN 164-168.
Daramola, S. O. (1995). Statistics in Research. In S. A Jimoh (Ed.), Research
Methodology in Education: An Interdisplinary Approach. Ilorin: Library and
Publication Committee.
Dareng, M.K and Timku, L. (1997). Improvisation in Mathematics. Proceedings of
Ajumogobia Memorial Conference of STAN 234-237.
Debes, J. (1978). Cultural Symbolism, visual literacy and intellectual equality.
Educational Media International (Emi) 1, 3-4.
Davies, I. (1978). Prologue: Educational Technology. Architypes, Paradigms and
Models. In Herley, J. & Davies, I. (Eds.) Contributions to an Educational
Technology. London, Kogan Press.
Dike, H. I. (1999). A book of Educational Technology. Port Harcourt: Cap 11 C.
Publishers.
Dopemu, Y.A. (1988). Production of instructional Media. In I. Agun, and I. Imogu
(Eds.) Fundamentals of Educational Technology. Ibadan; Y-Books Press.
Encyclopedia of Education (1969). Macmillan and Free Press. 9, 230-235
Erinosho, S.Y. (1998). Gender discrimination in Science Education in Nigeria:
which way forward. Proceeding of Seminar supported by FAWE Nairobi,
Kenya. November, 10th.
151
Essien, E. (2001). Dynamics of International Technology and Management. A
paper presented at NAEMT 23rd Annual Conference Proceeding 125-128.
Ewusie, A. (1980). Biology for O’ level and Senior Certificate. Lagos: Africa
University Press.
Eyetsemitan P.E. (2004). Improvisation in the teaching of primary science. 41st
Annual Conference Proceedings of STAN. 342-344.
Ezekannaya, G. N. and Ikeagu, C. N. (2004). Constraints on STM Research
Effectiveness in Nigeria.Proceedings of the 45th Annual Conference
Of STAN. 85-88.
Ezeudu, F. O. (2000). The use of Local Material in the Teaching of Chemistry.
41st Annual Conference Proceeding of STAN. 163 – 165.
Federal Republic of Nigeria (2004). National Policy on Education (4th Edition).
Lagos: NERDC Press.
Foin, W. (2001). The Effect of Class size on Student’s Academic Achievement in
Secondary School Mathematics. International Journal of research in
Science Education. 1(1), 31 – 34.
Fajola, O.O. (1992). Improvisation of material for Science Education in Nigerian
Schools. A paper presented at the workshop on improvisation at Science
equipment center, Lagos. November, 8th.
Franzer, B.J. Okebukola, P.A, and Jegede, O.J. (1992). Assessment of the learning
environment of Nigerian Science Laboratory Classes. Journal of Science
Teachers’ Association of Nigeria. 27(2), 98-101.
FreeHealth Encyclopedia (2007). Excretory System. Retrieved June 16th, 2009, from
http://www.doe.k12.ms.us/biology/anatomy/urinary.html
Gana, E.N. (2006). The use of instructional videotape in the learning of some
geographical concepts (Map Reading) in Senior Secondary Schools in
Minna. Unpublished M. Tech Education Thesis, Federal University of
Technoligy, Minna.
Gbodi, E.B. (1998). The Relative Effectiveness of three levels of Visual
Mnenaonics on SSS students’ achievement and attitude in practical
Geography. An unpublished PhD thesis, Faculty of Education
University of Ibadan, Ibadan.
Guilford, T. P. (1967). The nature of Human Intelligence. New York; McGraw Hill.
Gusen, J. (2001). The information and Educational Technology in Nigeria. A
Challenge for the Classroom Teacher. Paper Presented at the Maiden
National Conference of College of Education Academic Staff Union,
Federal College of Education, Pankshin. June, 11th.
152
Hahm, M. (2003). Media Skills of School Librarian to the New Subject
Information and Media in Schools and the Implications to all Librarians.
Instrument as a Positive Reference Service 64th IFCA General Conference.
Hoban, C.F. (1965). From theory to Policy decision. Audio Visual
Communication. Review. 13 (2), 50-54.
Hollifield, J. (1987). Ability grouping in Elementary schools. Eric Digest. (073)
http://ericae. Net/edo/ED 2905542.htm. Retrieved, 2/17/2004.
Hornby, A.S. and Cowie, A.P (Eds) (1985). Oxford Advanced Learner’s
Dictionary of current English, London: Oxford Press.
Ibe, E. (2004). Effects of Guided- Inquiry and Demonstration on Science Process
Skills Acquisition among Biology Secondary school Students. Unpublished
M. ED. Thesis University of Nigeria, Nsukka.
Ibitoye, S.J. (1998). Gender Differences and Achievement in Secondary School
Agricultural Science in Kwara State. The Nigeria Teacher Today. 6 (1), 52-56.
Ibrahim, M. (2004). The Design and construction of Aquarium Tank for teaching
of Biology in Secondary Schools B.Tech Education project. F.U.T. Minna.
Inyang, N.E.U (1997). Local Materials in Science, Technology and Mathematics
(STM) Teaching. Identification and Utilization. 40th Annual Conference
Proceeding of STAN 163-165.
Inyang, N.E.U. and Ekpeyong, H.E. (2000). Influence of ability and gender
grouping in Senior Secondary School Chemistry Student’s achievement on
the concept of redox reaction. Journal of STAN. 35 (1&2), 30-40.
Iwuozor, C. (2000). Enriching Science Education through improvisation. 41st
Annual Conference Proceeding of STAN, 45.
Jimoh, A.T. (1992). Influence of Teachers and School variables on students’ level
of Achievement in O-level chemistry. An Unpublished M.ED thesis;
University of Ilorin. Nigeria
Kareem, L. O. (2003). Effects of audio – graphic self instructional packages on
Senior secondary school students’ performance in biology in Ilorin,
Nigeria. Unpublished Ph.D Thesis, Faculty of Educatin, University of Ilorin,
Ilorin.
Kerlinger, F. N. (1973). Foundations of Behavioural Research. London: Rinchart
And Winston.
Kutigi, A. U. (2006). Relative effectiveness of Audio tape and computer
Instructional package on the teaching of oral English at Senior Schools in
153
Minna. Unpublished M.Tech Education Thesis. Federal University of
Technology, Minna.
Lagoke, B. A. ,Oyebanmiji, P. K. and Jegede, O. I. (1999). The efficacy of enriching
Biology teaching with analogy on the performance of students of different
achievements level. The Nigeria Today. 7(1), 39-40
Lumsdaine, A.A. (1964). Educational Technology; programmed learning and
instructional Science. In Hilgard (Ed.). Theories of learning and instruction
(20-24), Chicago; National Society for the study of Education.
Madu, B. C. (2004). Effects of a constructivist- Based Instructional Model on
Students’ Conceptual change and Retention in Physics. Unpublished
Ph.D Dissertation, Faculty of Education, University of Nigeria. Nsukka.
Maduabum, M.A. (1983). Declining in structive students’ enrolment in basic
science in our institution of higher learning: problem and prospects.
Annual April publication by the Science Education Students, UNN.
Maduabum, M.A. (1989). Teaching Integrated Science effectively. Onitsha. Space
Matric Publishers.
Maduabum, M. A. (1990). Effective Science teaching through the use of local
Materials: A way out. A Paper Presented at the International Symposium
on improvisation held at ABU Zaria 1990.
Maduabum, M.A. (1996). Improvisation and sourcing of Local materials for
effective STM Teaching and Evaluation in contemporary Nigeria. Onitsha:
Kmensuo Educational Publishers.
Mallum, J.O. and Haggai, M.P. (2000). Educational Psychology: Classroom
Practice. Jos: Deka Publications.
Manrique, F. (1998). The Effects of Display Type and Spatial Ability on Performance
Duying a Virtual Reality Simulation. http:// handle.dtic.mil/100.2/ADA348364.
Martins, O. O. and Oyebanji, P. K. (2000). The Effects of Inquiry and Lecture Method
On the Cognitive Achievement of integrated Science Students. Journal of STAN.
35(1&2), 31-35.
Mazur, J.E. (1990). Learning and Behaviour. London: Meuthen Publishers.
Mohammed, D.M (1991). Improvisation as a veritable Tool for Achieving
integrated Science goal Azara Journal of Education. 1 (1), 20-27.
Mohammed, N. (1997). Improvement: A Resort in Teaching Science in a
Depressed Economy. 40th Annual Conference Proceedings of STAN
Kano. 70 – 73.
Mohammed, S.A. (2000). Assessment of Female Students’ performance in selected
154
Science courses. A case study of Federal Polytechnics Bida. Nigeria Journal
of Gender and Development. 1 (1&2), 61-64.
Mohammed, H. A. (2004). Development and Use of An Improvised Radio for
Teaching and Learning of Physical Education in Primary School in Minna,
Niger State. Unpublished M.Tech. Thesis, Federal University of Technology,
Minna.
Momoh, G. D. (1997). Individualised Instruction in Industrial Education. Journal of
Applied Science and Education. 1 (1), 10-14.
Momoh, G. D. (1997). Technology of Education: An Aid for the Communication
Needs of the Handicapped persons. Journal of Applied Science and Education.
1 (1), 22-26.
Momoh, G. D. (2004). Improvisation of Teaching Materials. A paper presented at a
Seminar organized for the Teaching Staff of the Federal Science and
Technical Shiroro held in Kuta in November.
Mukherjee, A. (2002). Educational Psychology for Teachers, students and Parents,
Benin City: K. P. Basu Publishing Co.
Nateinyin, I. (1995). Diagnosis of Students’ Weakness in Biology. Unpublished
M.Ed Project University of Ibadan, Ibadan, Oyo State.
National Teachers’ Institute (NTI), (1990). Educational Cycle 3, Module 10-12.
Kaduna: Al-Rissiah printing and publishing Co Nigeria Ltd.
Nneji, L. (2000). Videos film as a Science tool, Junior Integrated Science panel.
1 (19), 134-145.
Nsofor, C.C. (1991). A study of prior knowledge and New Knowledge of SS II
Biology Students in Relation to inheritance. Unpublished M.ED Theses
University of Jos, Jos Nigeria.
Nsofor, C. C. (2001). Cultural Impediments on Women in Science, Technology
and Mathematics Education. 42nd Annual Conference Proceeding of STAN
Ilorin. 154-160.
Nsofor,C. C. (2007). Assessing the Effects of Designed Instructional Media on
Students’ performance in science (Biology). Journal of Science, Education and
Technology. 1(1), 105-111.
Nwachukwu, V.C. (1989). Theories of learning. In G.C. Unachukwu, (Ed.)
Educational Psychology: theory and practice. Owerri: Totan Publishers Ltd.
Nwadibia, J. I. (2005). The Effects of Biological Models on the Teaching and
Learning of Nervous System in Secondary Schools in Minna, Niger State.
Unpublished M.Tech Thesis of Federal University of Technology Minna.
155
Nwaizugbe, P. N. (1991). The impact of a practical Based Improvisation Course on
Expressed Difficulties faced by Science Teachers. Journal of STAN. 27(1),
89-93.
Nwankoby, F.U. (1988). Product, Design and Development of Local Educational
Mateirals: problems. Ibadan: Heinemann Education Books.
Nwosu, E.C. (2000). Resource Utilization in Science Education (Chemistry)
classroom. Implication for teachers. 41st Annual Conference proceedings of
STAN. 166-168.
Oakes, J. (1990). Opportunities, Achievement and Choice: Women and Minority
Students in science and Mathematics. In B. Cazden, (ED.) Review of
Research in Education. Washington DC: American Education Research
ssociation Publication.
Oakley, A. (1993). Sex Gender and Society. London: Red Wood Books Ltd.
Obaba, I. A. (2003). The Design and Construction of Hibiscus Flower Model for
Biology Instruction in senior secondary schools. B.Tech Education project
F. U. T. Minna.
Obe, C.O. (1989). A study of Nigerian Secondary School Students’ conception of
living things. Unpublished M.Ed Thesis University of Ilorin.
Obianwu, C.A. and Azubike, N (1994). Educational Technology Media:
Characteristics and Utilization: Abba: Nuel Centi Nigeria Publishers.
Obodozie, G. N. (2002). Development and Use of an Improvised Television For
Teaching and Learning of Social Studies in Primary Schools in Minna, Niger
State. M. Tech. Thesis, Federal University of Technology Minna.
Odama, J. S. (1982). Glossary of Statistical Terms and Formulae. Benin City: Koda
Publishers Ltd.
Odunusi, J.O. (2001). Women in STM education – an alternative strategy. 42nd
STAN annual conference proceeding. 72-75.
Ogunmilade, C.A. (1984). Media in Educational. Ile Ife: University of Ife Press.
Ogunmilade, C.A. (1993). Media in Education. Ile-ife: Obafemi Awolowo
University Press.
Ogunranti, A. (1982). Educational Technology ACE Publication Series; Ibadan:
Heinemann Publishers.
Ogunranti, A. (1984). Educational Technology. Ibadan: Heinemann Publishers.
Ojiaku, F. C. (2003). The Effects of Combining Advance Organizer, video
package and lecture method on students achievement in integrated science
156
in Oshodi Local Government Area of Lagos State. M.Tech Education Thesis,
F. U. T. .Minna
Okafor, E.N. (2000). Educational Technology theory, a practice for tertiary
institution. Awka: Educational Research and Publishers.
Okeke, C. (1998). Gender issues in teaching and learning in Higher Education. A
paper presented at the National workshop on teaching and learning in
Higher Education. University of Ibadan.
Okeke, E.A.C. (2001). Women in STM Education in Nigeria. Key note address
at 42nd STAN Annual Conference at Ilorin.
Okeke, J.N. (1997). Evaluating the use of instructional Technologies and their
implications for Adult Literacy programme. A paper presented at the 10th
National Convention of Nigeria Association for Educational Media and
Technology. University of Ibadan, Ibadan.
Okobi, P. (1994). Effects of Audio Taped Environment Segment in Teaching the
Structure of English on Students’ Performance. The Nigeria Teacher
Today. 3(1), 90 – 96.
Okoro, C.A. and Etukudo, U.E. (2001). Computer assisted instruction versus
extrinsic motivation based traditional method; its effects on female gender
performance in chemistry. 42nd STAN Annual Conference proceeding.
98-103
Okwo, F. A., Amaka, C. ,Okoye, B. N., Ugwu and Onyeka, J. O. (2008). Effects of
Three modes of Diagram Presentation on the performance of students in
Animal Excretion. Journal of STAN. 43(1&2), 87-94.
Olagunju, A.M. (1998). Improvisation of resources for effective communication
In elementary science education. 4th National Annual Conference of National
Association of Curriculum Theorist. Owerri. 112-118.
Olagunju, A.M. (2000). An Investigation into Teachers attitude towards and
extent of improvisation of resources for effective teaching of biology. 41st
Annual conference. Proceedings of STAN. 120-125.
Olumba, R. N. (2007). Effects of Audiotape and Videotape Instructional Package on
the teaching and learning of Phonetics in Senior Secondary schools in Minna.
M. Tech. Thesis of Federal University of Technology Minna.
Olusola, S. (1982). Telescope: some notes on 20 years of television in Africa. Ibadan:
Ariya Production.
Onasanya, S. A. (2004). Selection and Utilization of Instructional Media for effective
157
Practice teaching. Institute Journal of Studies in Education (IJSE). 2(1),
127-133
Onasanya, S. A. and Adegbija, M. V. (2007). Practical Hand book on Instuctional
Media. Ilorin: Graphcom Publishers.
Onyebunwa, S.E. (1999). Educational Technology; An instruction. Owerri: Cape
Publishers International Ltd.
Onyegegbu, N. (2001). Use of Electronic Instructional Media for improved
Understanding of Disease Control and Health promotion in rural
Nigeria. Journal of STAN. 36(1&2), 81-86.
Orisabiyi, O.O. (2002). The design and construction of a model of Human skin for
teaching biology in Secondary Schools B.Tech Education Project F.U.T Minna.
Osisioma, I. (2005). Active Learning Strategies for the senior classroom (workshop).
Proceeding of the 46th Annual Conference of STAN, 74-79.
Otegbayo, C.O. (2005). Effect of Audiotape and film package on the Teaching
and learning of phonetics in Junior Secondary Schools in Niger State. An
M.Tech Education Thesis. Federal University of Technology Minna.
Owolabi, T. (2000). A Diagnosis of simple faults resulting in malfunctioning of
physics laboratory apparatus. 41st STAN Annual Conference Proceeding.
334-338.
Oyekan, S.O. (1993). Diagnosis of Student’s weakness. A conceptual Framework
remediation of under-achievement in Science. Journal of STAN. 28 (1&2),
59-69.
Oyekan, S.O. (1999). Social, Economic and Political Dimensions of Schooling. In
Ipaye, B. (Ed.) Research on schooling in Nigeria. Lagos: Chayabi Printers
and Publishers.
Rahman, L. (2002). Strengthening Information Archeology infrastruction in
Bangladesh. Paper presented at STAN 43rd Annual Conference, Abuja,
Abuja.
Richman, V. (2001). The Gale Encyclopedia of Science (2nd Edition). Gale group.
Farmington Hills.
Salawu, A. and Taiwo (2001). Essentials of Educational Technology. Oyo; Kay
Blessing Ventures.
Soyibo, K. (1993). An investigation into the use of improvisation in Biology
Teaching in some Lagos Secondary School. Journal of STAN. 22 (1), 120-
128.
158
Tauheed, M. D. (2002). The Design and construction of kidney nephron model for
Teaching Biology in Secondary Schools. B.Tech Education project F. U. T.
Minna.
Thomas, M. (2004). An Investigation into the availability of Biology Instructional
materials at the secondary schools in Niger State B.Tech Education project
F.U.T. Minna
TutorVista (2008). Circulation. Retrieved June 16th2009, from http: www.
Tutorvista. com
Umeoduagu, J.N. (2000). Resource utilization for effective Teaching of Science,
Technology and Mathematics in the New Millennium. STAN Conference
Proceeding. 38-41.
Wasagu, M.A. (2000). Improvisation as a good source of enriching science
lesson. In N.G. Akale, (Ed) STAN 41st Annual Conference Proceeding.
54- 57
Watson, F.G. (1991). Science Curriculum in Schools. Delighton, L.C (Ed).
Encyclopedia of Education 14 (1),38-43.
.
West African Examination Council (2007).Annual Report.
West African Examination Council (2008).Annual Report.
West African Examination Council (2009).Annual Report.
Wood, R. (1990). An introduction to philosophy of education. London:
Cambridge University Press.
Yoloye, E.A. (1989). Resources for Science, Mathematics and Technical
Education in Nigeria Secondary Schools. A National Survey.
Yusuf, M.O. (1997). Effects of videotape and slide tape instruction on
student’s
performance in Social Studies in some Junior Secondary Schools.
Unpublished doctorate thesis, Faculty of Education University of Ilorin,
Ilorin.
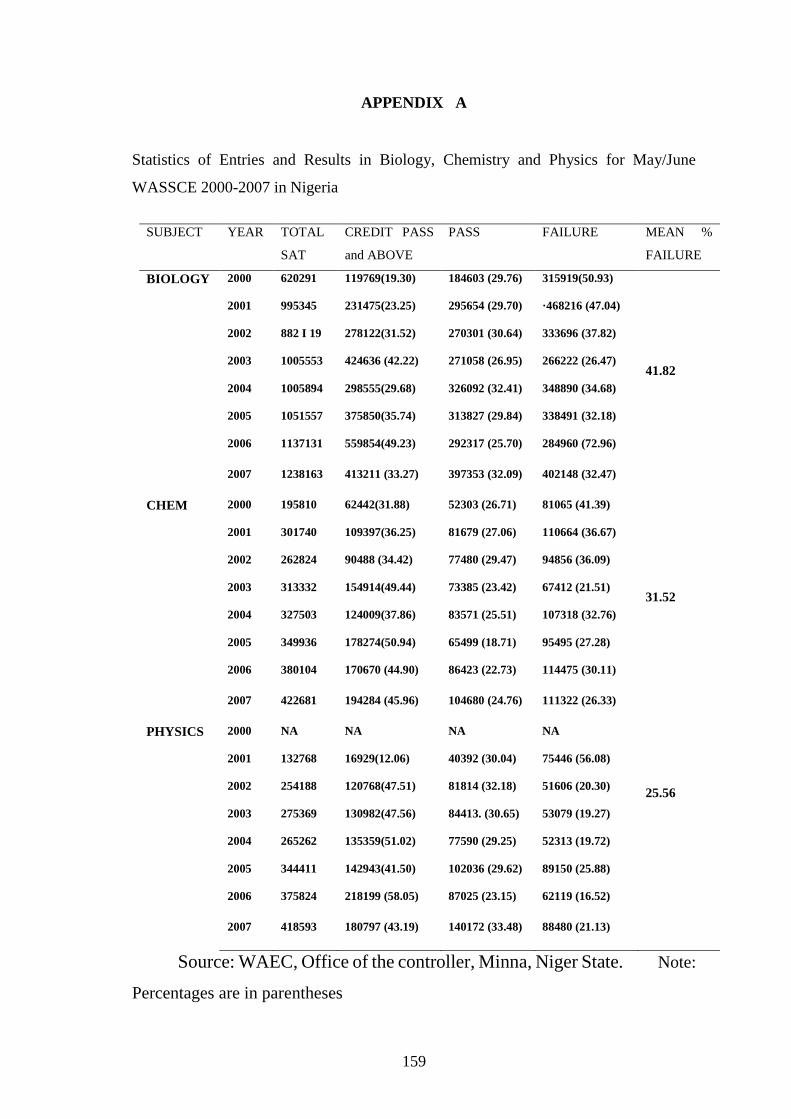
159
APPENDIX A
Statistics of Entries and Results in Biology, Chemistry and Physics for May/June
WASSCE 2000-2007 in Nigeria
SUBJECT YEAR TOTAL
SAT
CREDIT PASS
and ABOVE
PASS FAILURE MEAN %
FAILURE
BIOLOGY
2000 620291 119769(19.30) 184603 (29.76) 315919(50.93)
41.82
2001 995345 231475(23.25) 295654 (29.70) ·468216 (47.04)
2002 882 I 19 278122(31.52) 270301 (30.64) 333696 (37.82)
2003 1005553 424636 (42.22) 271058 (26.95) 266222 (26.47)
2004 1005894 298555(29.68) 326092 (32.41) 348890 (34.68)
2005 1051557 375850(35.74) 313827 (29.84) 338491 (32.18)
2006 1137131 559854(49.23) 292317 (25.70) 284960 (72.96)
2007 1238163 413211 (33.27) 397353 (32.09) 402148 (32.47)
CHEM
2000 195810 62442(31.88) 52303 (26.71) 81065 (41.39)
31.52
2001 301740 109397(36.25) 81679 (27.06) 110664 (36.67)
2002 262824 90488 (34.42) 77480 (29.47) 94856 (36.09)
2003 313332 154914(49.44) 73385 (23.42) 67412 (21.51)
2004 327503 124009(37.86) 83571 (25.51) 107318 (32.76)
2005 349936 178274(50.94) 65499 (18.71) 95495 (27.28)
2006 380104 170670 (44.90) 86423 (22.73) 114475 (30.11)
2007 422681 194284 (45.96) 104680 (24.76) 111322 (26.33)
PHYSICS
2000 NA NA NA NA
25.56
2001 132768 16929(12.06) 40392 (30.04) 75446 (56.08)
2002 254188 120768(47.51) 81814 (32.18) 51606 (20.30)
2003 275369 130982(47.56) 84413. (30.65) 53079 (19.27)
2004 265262 135359(51.02) 77590 (29.25) 52313 (19.72)
2005 344411 142943(41.50) 102036 (29.62) 89150 (25.88)
2006 375824 218199 (58.05) 87025 (23.15) 62119 (16.52)
2007 418593 180797 (43.19) 140172 (33.48) 88480 (21.13)
Source: WAEC, Office of the controller, Minna, Niger State. Note:
Percentages are in parentheses
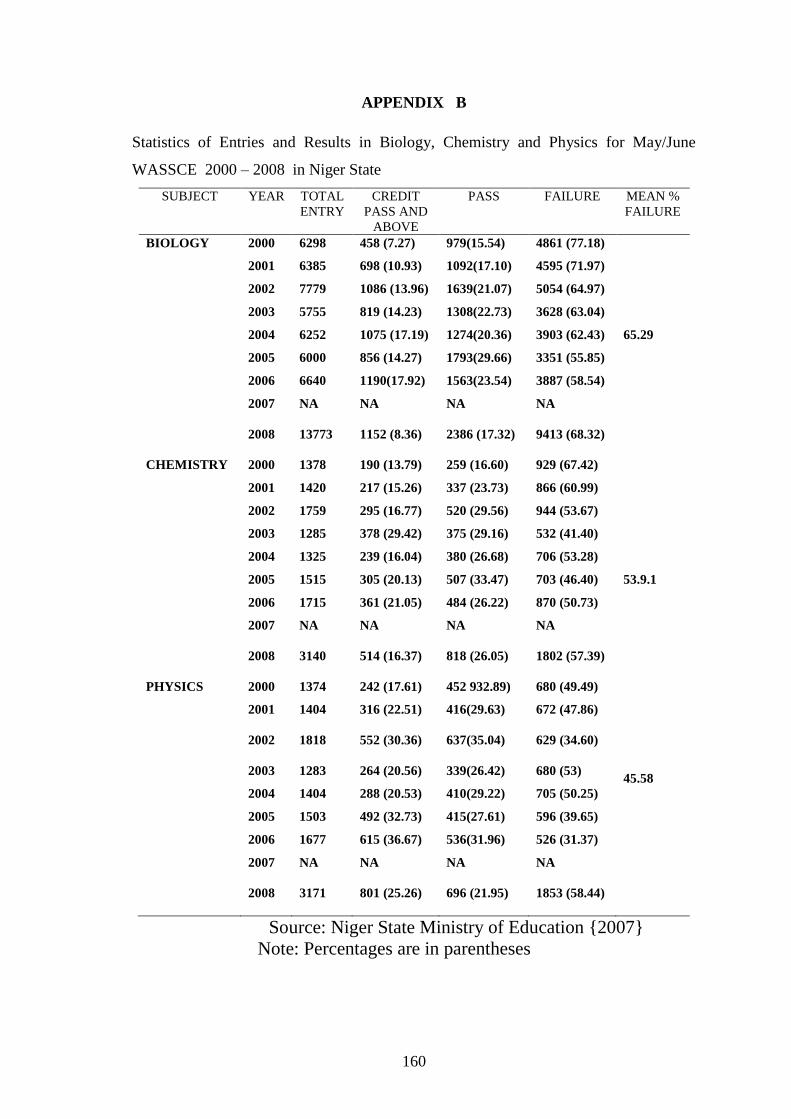
160
APPENDIX B
Statistics of Entries and Results in Biology, Chemistry and Physics for May/June
WASSCE 2000 – 2008 in Niger State
SUBJECT YEAR TOTAL
ENTRY
CREDIT
PASS AND
ABOVE
PASS FAILURE MEAN %
FAILURE
BIOLOGY
2000 6298 458 (7.27) 979(15.54) 4861 (77.18)
65.29
2001 6385 698 (10.93) 1092(17.10) 4595 (71.97)
2002 7779 1086 (13.96) 1639(21.07) 5054 (64.97)
2003 5755 819 (14.23) 1308(22.73) 3628 (63.04)
2004 6252 1075 (17.19) 1274(20.36) 3903 (62.43)
2005 6000 856 (14.27) 1793(29.66) 3351 (55.85)
2006 6640 1190(17.92) 1563(23.54) 3887 (58.54)
2007 NA NA NA NA
2008 13773 1152 (8.36) 2386 (17.32) 9413 (68.32)
CHEMISTRY
2000 1378 190 (13.79) 259 (16.60) 929 (67.42)
2001 1420 217 (15.26) 337 (23.73) 866 (60.99)
53.9.1
2002 1759 295 (16.77) 520 (29.56) 944 (53.67)
2003 1285 378 (29.42) 375 (29.16) 532 (41.40)
2004 1325 239 (16.04) 380 (26.68) 706 (53.28)
2005 1515 305 (20.13) 507 (33.47) 703 (46.40)
2006 1715 361 (21.05) 484 (26.22) 870 (50.73)
2007 NA NA NA NA
2008 3140 514 (16.37) 818 (26.05) 1802 (57.39)
PHYSICS
2000 1374 242 (17.61) 452 932.89) 680 (49.49)
45.58
2001 1404 316 (22.51) 416(29.63) 672 (47.86)
2002 1818 552 (30.36) 637(35.04) 629 (34.60)
2003 1283 264 (20.56) 339(26.42) 680 (53)
2004 1404 288 (20.53) 410(29.22) 705 (50.25)
2005 1503 492 (32.73) 415(27.61) 596 (39.65)
2006 1677 615 (36.67) 536(31.96) 526 (31.37)
2007 NA NA NA NA
2008 3171 801 (25.26) 696 (21.95) 1853 (58.44)
Source: Niger State Ministry of Education {2007}
Note: Percentages are in parentheses
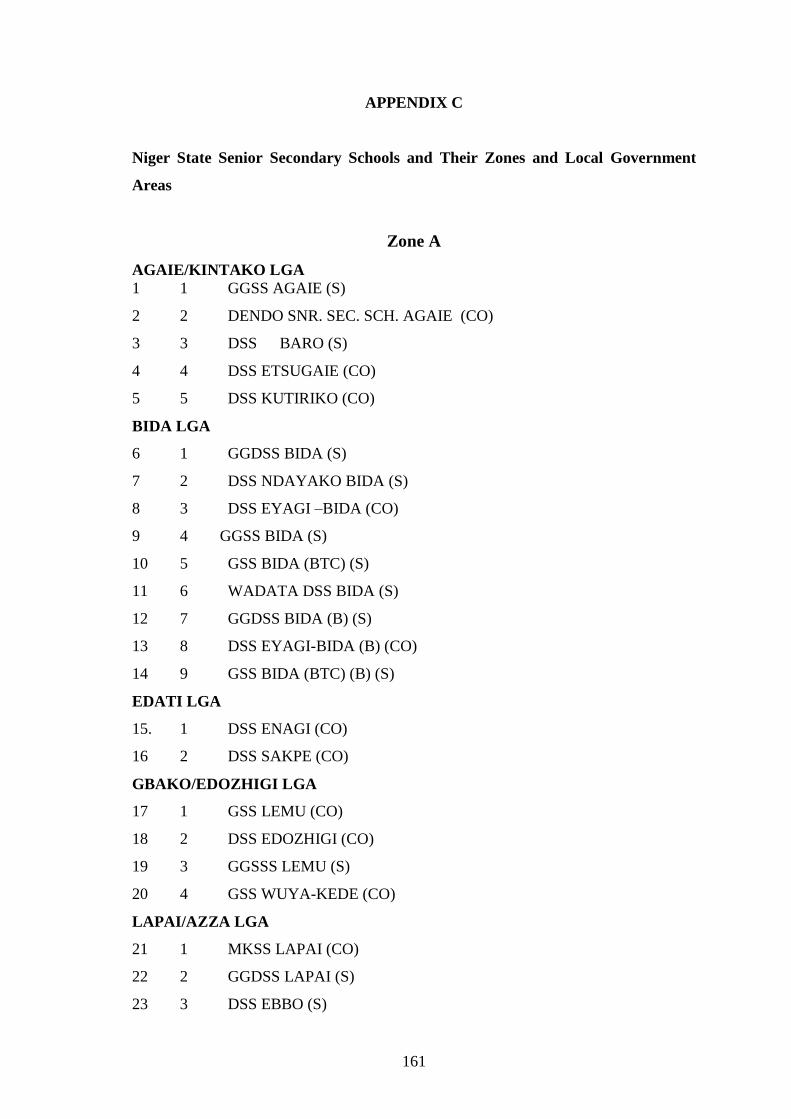
161
APPENDIX C
Niger State Senior Secondary Schools and Their Zones and Local Government
Areas
Zone A
AGAIE/KINTAKO LGA
1 1 GGSS AGAIE (S)
2 2 DENDO SNR. SEC. SCH. AGAIE (CO)
3 3 DSS BARO (S)
4 4 DSS ETSUGAIE (CO)
5 5 DSS KUTIRIKO (CO)
BIDA LGA
6 1 GGDSS BIDA (S)
7 2 DSS NDAYAKO BIDA (S)
8 3 DSS EYAGI –BIDA (CO)
9 4 GGSS BIDA (S)
10 5 GSS BIDA (BTC) (S)
11 6 WADATA DSS BIDA (S)
12 7 GGDSS BIDA (B) (S)
13 8 DSS EYAGI-BIDA (B) (CO)
14 9 GSS BIDA (BTC) (B) (S)
EDATI LGA
15. 1 DSS ENAGI (CO)
16 2 DSS SAKPE (CO)
GBAKO/EDOZHIGI LGA
17 1 GSS LEMU (CO)
18 2 DSS EDOZHIGI (CO)
19 3 GGSSS LEMU (S)
20 4 GSS WUYA-KEDE (CO)
LAPAI/AZZA LGA
21 1 MKSS LAPAI (CO)
22 2 GGDSS LAPAI (S)
23 3 DSS EBBO (S)
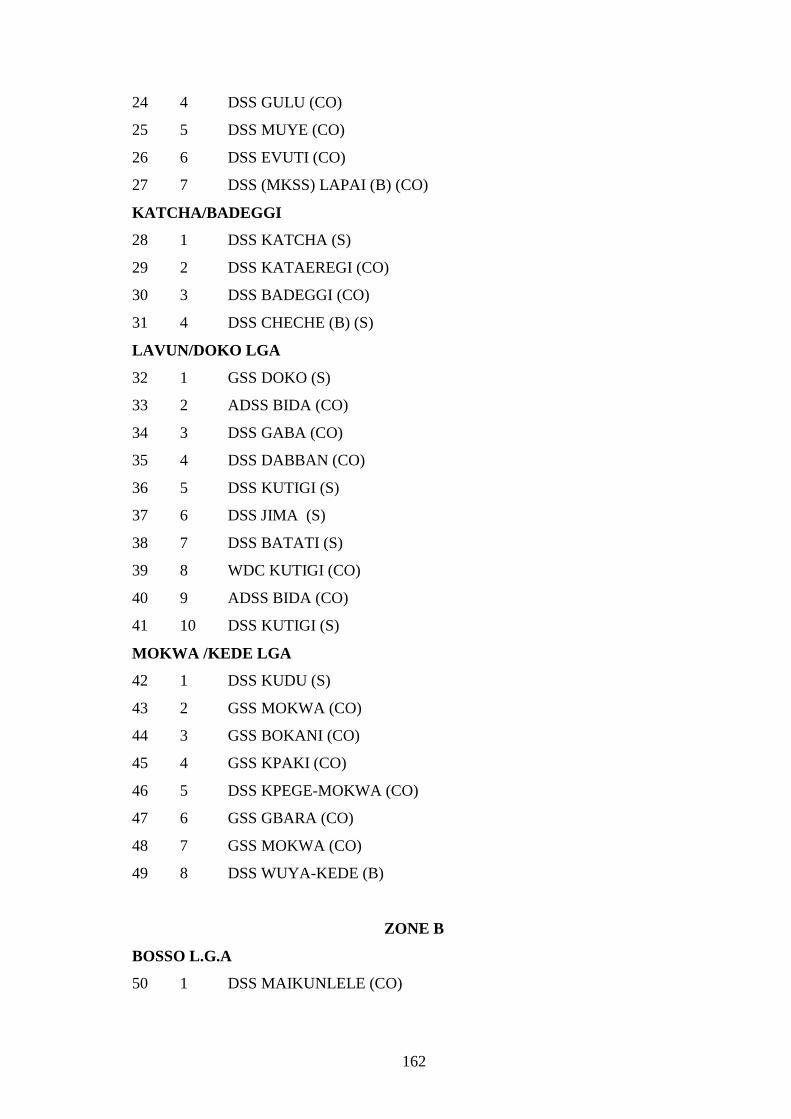
162
24 4 DSS GULU (CO)
25 5 DSS MUYE (CO)
26 6 DSS EVUTI (CO)
27 7 DSS (MKSS) LAPAI (B) (CO)
KATCHA/BADEGGI
28 1 DSS KATCHA (S)
29 2 DSS KATAEREGI (CO)
30 3 DSS BADEGGI (CO)
31 4 DSS CHECHE (B) (S)
LAVUN/DOKO LGA
32 1 GSS DOKO (S)
33 2 ADSS BIDA (CO)
34 3 DSS GABA (CO)
35 4 DSS DABBAN (CO)
36 5 DSS KUTIGI (S)
37 6 DSS JIMA (S)
38 7 DSS BATATI (S)
39 8 WDC KUTIGI (CO)
40 9 ADSS BIDA (CO)
41 10 DSS KUTIGI (S)
MOKWA /KEDE LGA
42 1 DSS KUDU (S)
43 2 GSS MOKWA (CO)
44 3 GSS BOKANI (CO)
45 4 GSS KPAKI (CO)
46 5 DSS KPEGE-MOKWA (CO)
47 6 GSS GBARA (CO)
48 7 GSS MOKWA (CO)
49 8 DSS WUYA-KEDE (B)
ZONE B
BOSSO L.G.A
50 1 DSS MAIKUNLELE (CO)
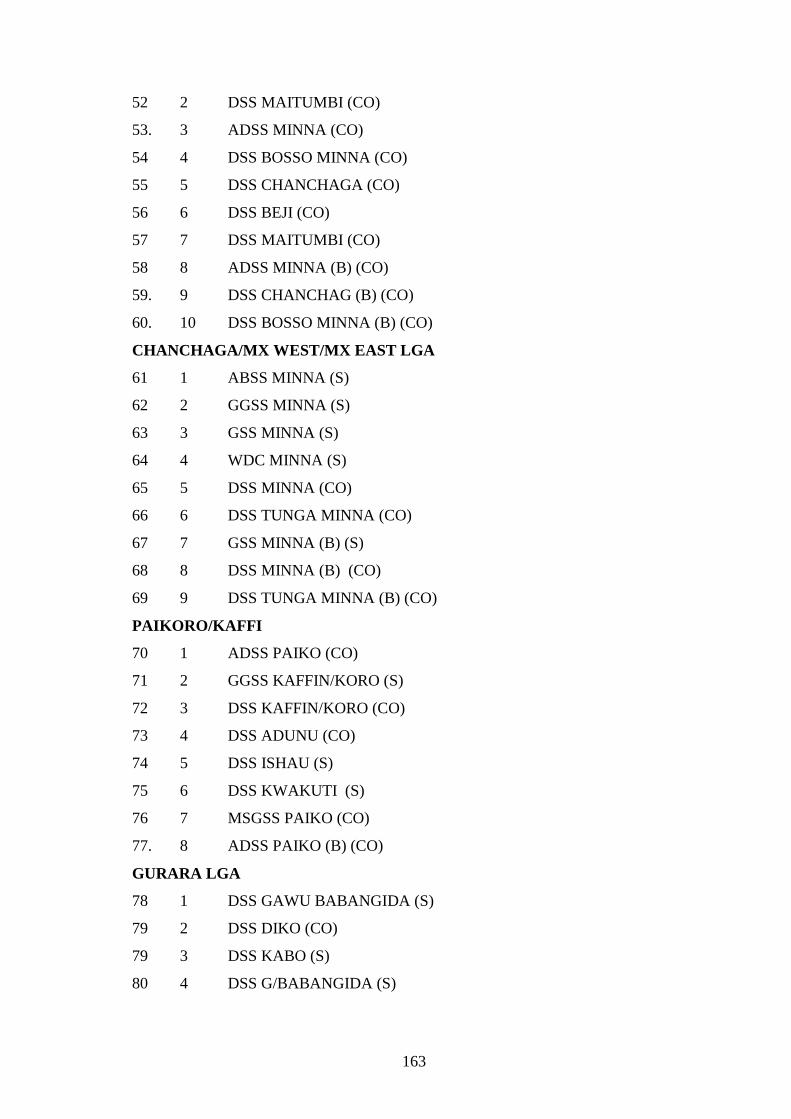
163
52 2 DSS MAITUMBI (CO)
53. 3 ADSS MINNA (CO)
54 4 DSS BOSSO MINNA (CO)
55 5 DSS CHANCHAGA (CO)
56 6 DSS BEJI (CO)
57 7 DSS MAITUMBI (CO)
58 8 ADSS MINNA (B) (CO)
59. 9 DSS CHANCHAG (B) (CO)
60. 10 DSS BOSSO MINNA (B) (CO)
CHANCHAGA/MX WEST/MX EAST LGA
61 1 ABSS MINNA (S)
62 2 GGSS MINNA (S)
63 3 GSS MINNA (S)
64 4 WDC MINNA (S)
65 5 DSS MINNA (CO)
66 6 DSS TUNGA MINNA (CO)
67 7 GSS MINNA (B) (S)
68 8 DSS MINNA (B) (CO)
69 9 DSS TUNGA MINNA (B) (CO)
PAIKORO/KAFFI
70 1 ADSS PAIKO (CO)
71 2 GGSS KAFFIN/KORO (S)
72 3 DSS KAFFIN/KORO (CO)
73 4 DSS ADUNU (CO)
74 5 DSS ISHAU (S)
75 6 DSS KWAKUTI (S)
76 7 MSGSS PAIKO (CO)
77. 8 ADSS PAIKO (B) (CO)
GURARA LGA
78 1 DSS GAWU BABANGIDA (S)
79 2 DSS DIKO (CO)
79 3 DSS KABO (S)
80 4 DSS G/BABANGIDA (S)
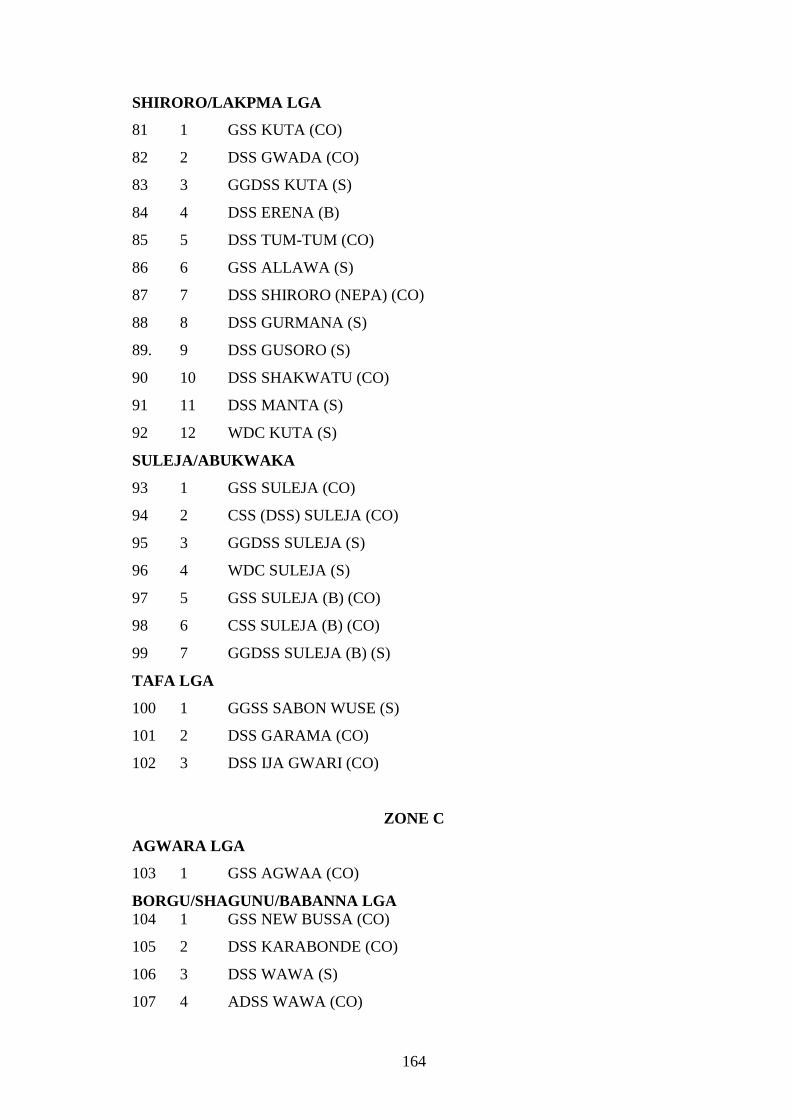
164
SHIRORO/LAKPMA LGA
81 1 GSS KUTA (CO)
82 2 DSS GWADA (CO)
83 3 GGDSS KUTA (S)
84 4 DSS ERENA (B)
85 5 DSS TUM-TUM (CO)
86 6 GSS ALLAWA (S)
87 7 DSS SHIRORO (NEPA) (CO)
88 8 DSS GURMANA (S)
89. 9 DSS GUSORO (S)
90 10 DSS SHAKWATU (CO)
91 11 DSS MANTA (S)
92 12 WDC KUTA (S)
SULEJA/ABUKWAKA
93 1 GSS SULEJA (CO)
94 2 CSS (DSS) SULEJA (CO)
95 3 GGDSS SULEJA (S)
96 4 WDC SULEJA (S)
97 5 GSS SULEJA (B) (CO)
98 6 CSS SULEJA (B) (CO)
99 7 GGDSS SULEJA (B) (S)
TAFA LGA
100 1 GGSS SABON WUSE (S)
101 2 DSS GARAMA (CO)
102 3 DSS IJA GWARI (CO)
ZONE C
AGWARA LGA
103 1 GSS AGWAA (CO)
BORGU/SHAGUNU/BABANNA LGA
104 1 GSS NEW BUSSA (CO)
105 2 DSS KARABONDE (CO)
106 3 DSS WAWA (S)
107 4 ADSS WAWA (CO)
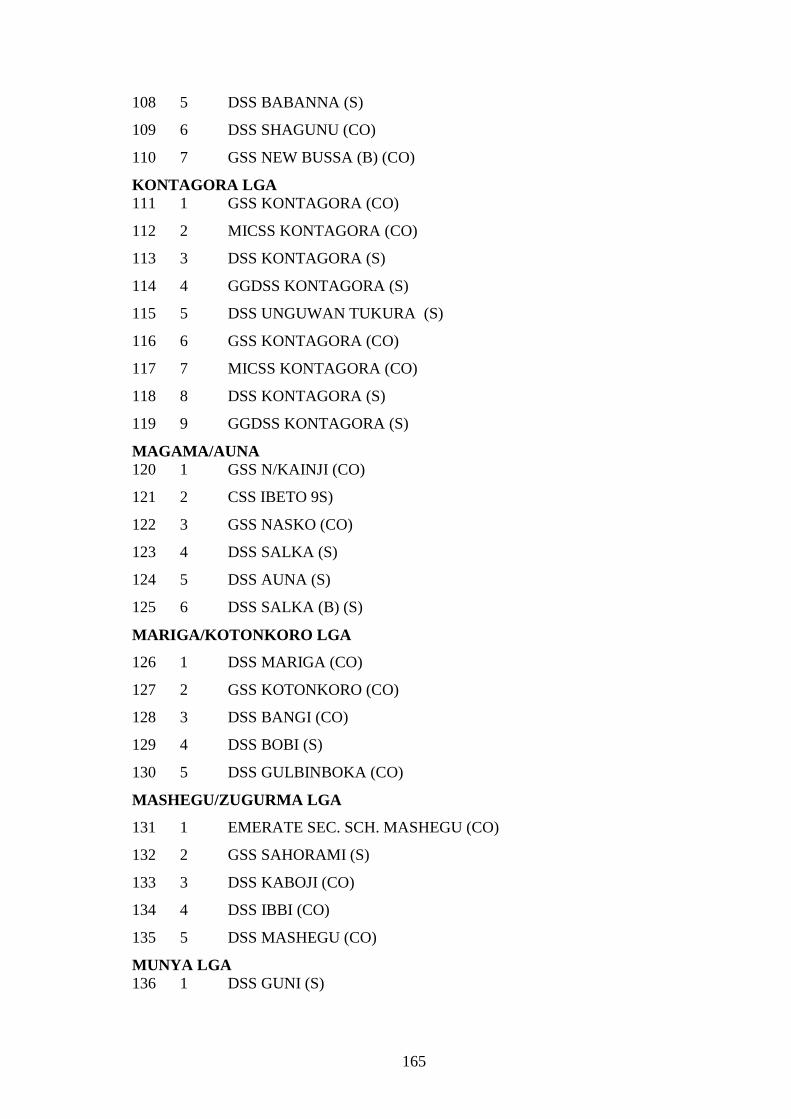
165
108 5 DSS BABANNA (S)
109 6 DSS SHAGUNU (CO)
110 7 GSS NEW BUSSA (B) (CO)
KONTAGORA LGA
111 1 GSS KONTAGORA (CO)
112 2 MICSS KONTAGORA (CO)
113 3 DSS KONTAGORA (S)
114 4 GGDSS KONTAGORA (S)
115 5 DSS UNGUWAN TUKURA (S)
116 6 GSS KONTAGORA (CO)
117 7 MICSS KONTAGORA (CO)
118 8 DSS KONTAGORA (S)
119 9 GGDSS KONTAGORA (S)
MAGAMA/AUNA
120 1 GSS N/KAINJI (CO)
121 2 CSS IBETO 9S)
122 3 GSS NASKO (CO)
123 4 DSS SALKA (S)
124 5 DSS AUNA (S)
125 6 DSS SALKA (B) (S)
MARIGA/KOTONKORO LGA
126 1 DSS MARIGA (CO)
127 2 GSS KOTONKORO (CO)
128 3 DSS BANGI (CO)
129 4 DSS BOBI (S)
130 5 DSS GULBINBOKA (CO)
MASHEGU/ZUGURMA LGA
131 1 EMERATE SEC. SCH. MASHEGU (CO)
132 2 GSS SAHORAMI (S)
133 3 DSS KABOJI (CO)
134 4 DSS IBBI (CO)
135 5 DSS MASHEGU (CO)
MUNYA LGA
136 1 DSS GUNI (S)

166
137 2 DSS SARKIN PAWA (CO)
RAFI/KUSHERIKI LGA
138 1 AASS KAGARA (CO)
139 2 GSS TEGINA (CO)
140 3 GSS PANDOGARI (CO)
RIJAU/DARANGI LGA
141 1 DSS DUKKU (S)
142 2 GSS RIJAU (CO)
143 3 GGSS TUNGA MAGAJIYA (S)
WUSHISHI LGA
144 1 GSS WUSHISHI (S)
145 2 DSS ZUNGERU (CO)
146 3 GSS WUSHISHI (B) (S)
Selected Schools, Zones and Local Government Area (L.G. A)
S/N School Zone L. G. A
1 Day Secondary school Gaba A Lavun/Diko
2 Government Secondary school Mokwa A Mokwa/Kede
3 Day Secondary School Enagi A Edati
4 Day Secondary Maikunkele B Bosso
5 Day Secondary school Tunga Minna B Chanchaga
6 ADSS Paiko B Paikoro/kaffi
7 Day Secondary School Sarkin Pawa C Munya
8 Government Secondary School Agwara C Agwara
9 Government Secondary School Nasko C Magama/Auna

167
APPENDIX D
Sketched Models of (1a) The Internal Structure of the Heart, (2a) Human Blood
Circulatory System, (3a) Excretory System, and (4a) Kidney Tubule/Nephron.
1a: The Internal Structure of the Heart
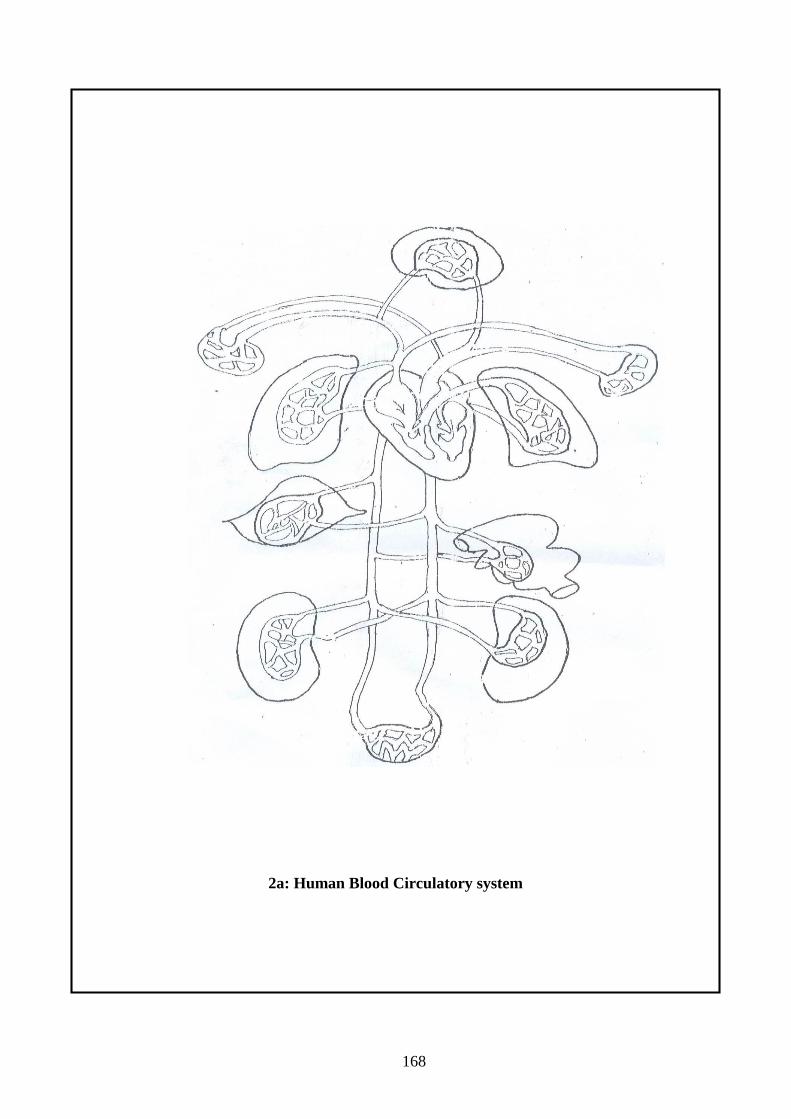
168
2a: Human Blood Circulatory system
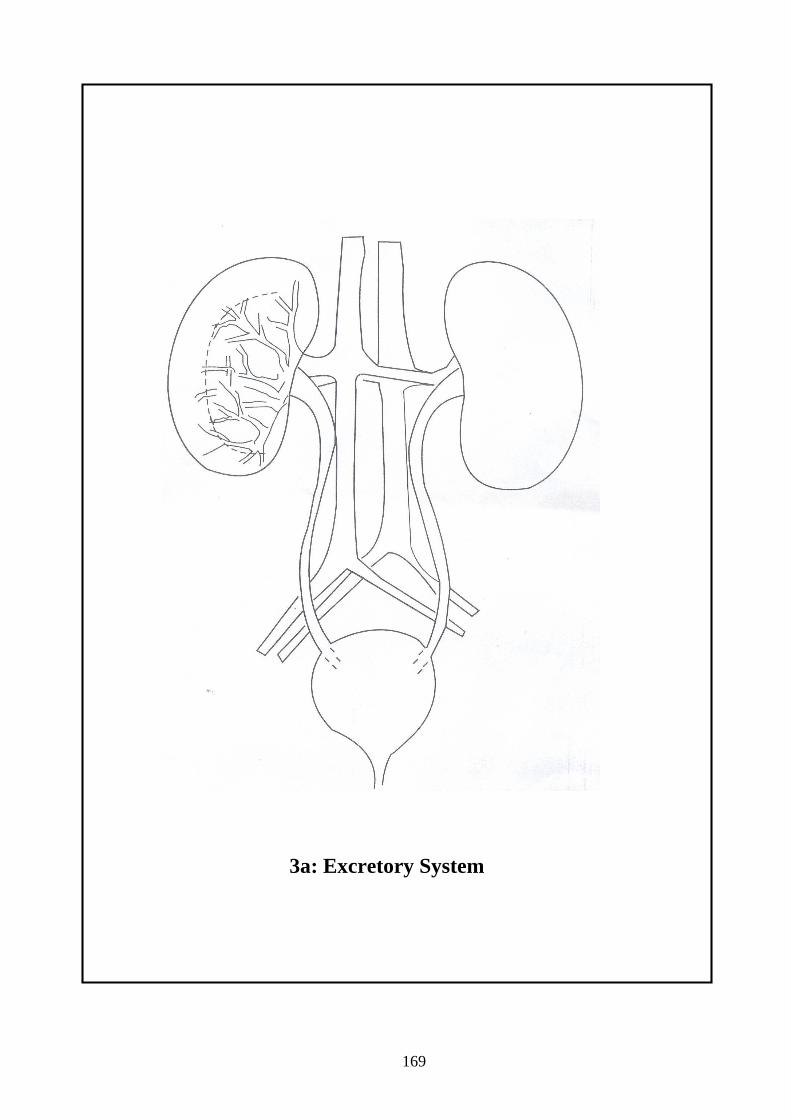
169
3a: Excretory System
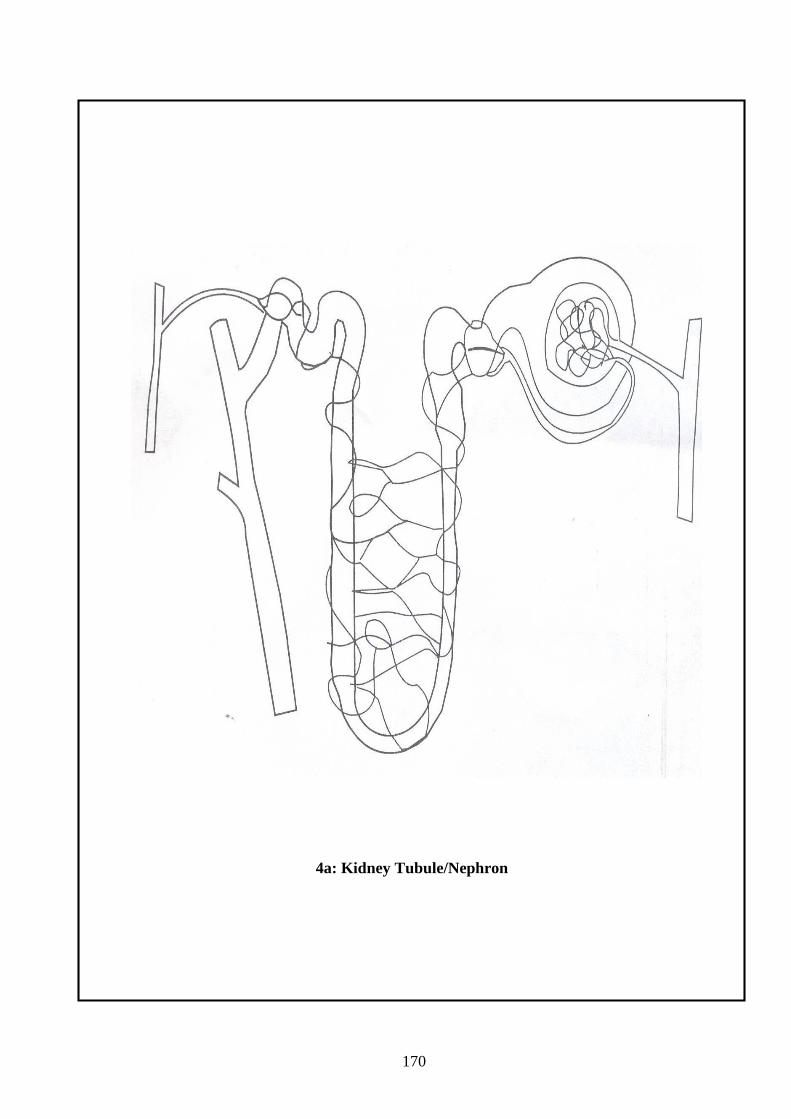
170
4a: Kidney Tubule/Nephron
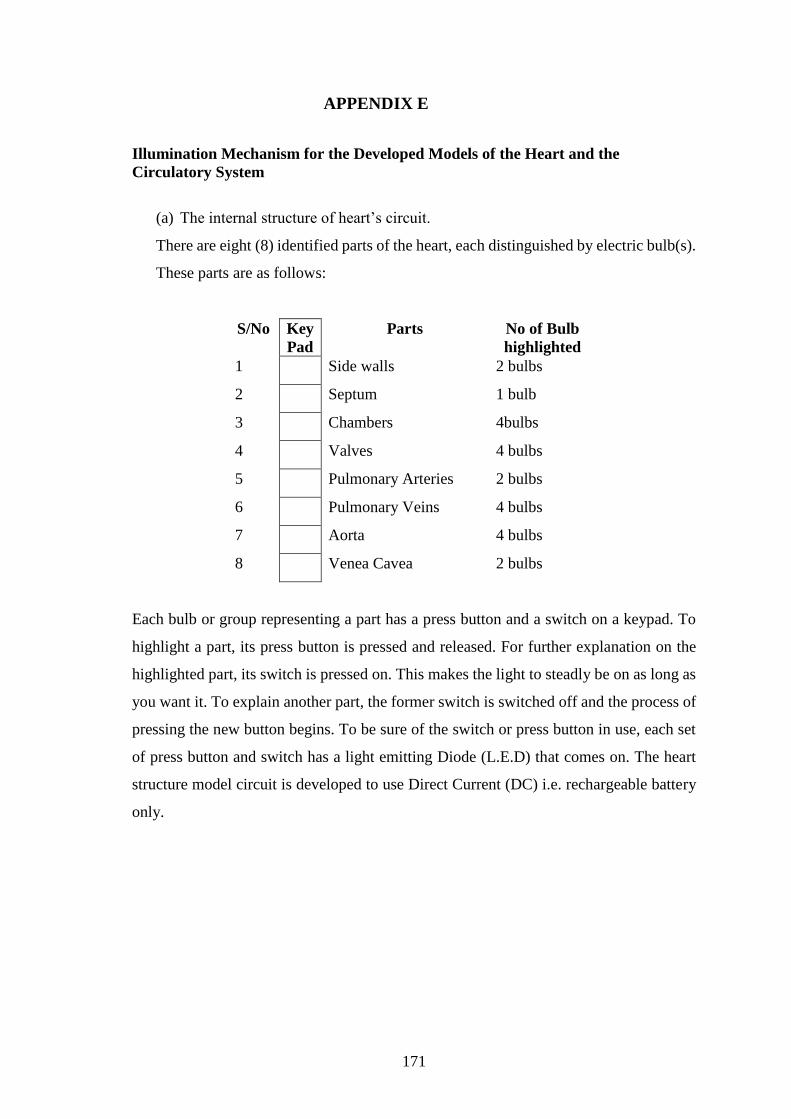
171
APPENDIX E
Illumination Mechanism for the Developed Models of the Heart and the
Circulatory System
(a) The internal structure of heart’s circuit.
There are eight (8) identified parts of the heart, each distinguished by electric bulb(s).
These parts are as follows:
S/No Key
Pad
Parts No of Bulb
highlighted
1 Side walls 2 bulbs
2 Septum 1 bulb
3 Chambers 4bulbs
4 Valves 4 bulbs
5 Pulmonary Arteries 2 bulbs
6 Pulmonary Veins 4 bulbs
7 Aorta 4 bulbs
8 Venea Cavea 2 bulbs
Each bulb or group representing a part has a press button and a switch on a keypad. To
highlight a part, its press button is pressed and released. For further explanation on the
highlighted part, its switch is pressed on. This makes the light to steadly be on as long as
you want it. To explain another part, the former switch is switched off and the process of
pressing the new button begins. To be sure of the switch or press button in use, each set
of press button and switch has a light emitting Diode (L.E.D) that comes on. The heart
structure model circuit is developed to use Direct Current (DC) i.e. rechargeable battery
only.
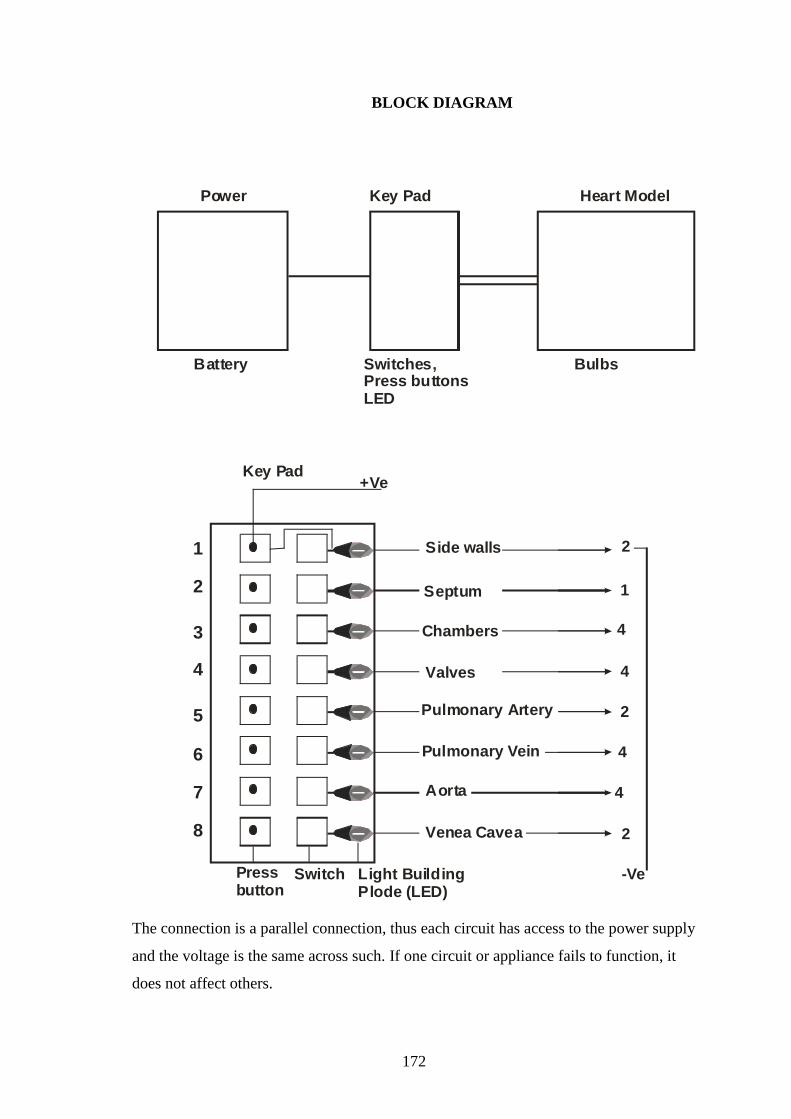
172
Power
Battery
Key Pad
Switches,Press buttonsLED
Heart Model
Bulbs
1
2
3
4
5
6
7
8
Key Pad +Ve
Side walls 2
1
4
4
2
4
4
2
Septum
Chambers
Valves
Pulmonary Artery
Pulmonary Vein
Aorta
Venea Cavea
Pressbutton
Switch Light BuildingPlode (LED)
-Ve
BLOCK DIAGRAM
The connection is a parallel connection, thus each circuit has access to the power supply
and the voltage is the same across such. If one circuit or appliance fails to function, it
does not affect others.

173
C1 POWERCircuit
Switch S S S S S S S S
C2 C3 C4 C5 C6 C7 C8
The keypad has a long cable and a control switch. This enables the teacher to freely
move about.
(b). The Circulatory System Circuit
From the main circuilt, which has parallel connection, signals are generated to
switch on the bulbs in sequence. There are two sources of power (1) Battery (2) Means
via transformer. Thert are switches for any choice to be made.
The pulse generator is IC 555 called Multi-vibrator. The distributor is IC 4017
called decade counter. IC 4017 works like the distributor in a car, it can send signals to a
maximum of 10 outlets. It can be programmed to send too less and recycle or halt. For
this project, it is to recycle.
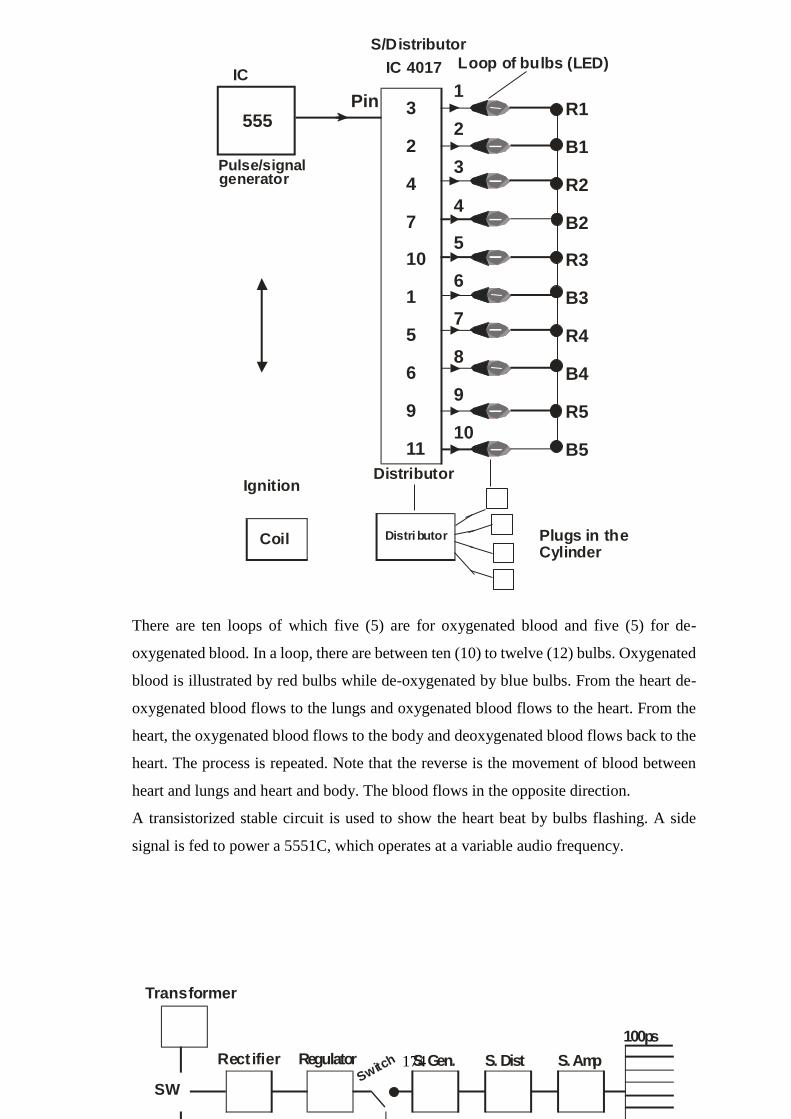
174
3
2
4
7
10
1
5
6
9
11
1
2
3
4
5
6
7
8
9
10
R1
B1
R2
B2
R3
B3
R4
B4
R5
B5
555Pin
Pulse/signalgenerator
ICIC 4017
S/Distributor
Loop of bulbs (LED)
Distributor
Plugs in the Cylinder
Distributor
Ignition
Coil
There are ten loops of which five (5) are for oxygenated blood and five (5) for de-
oxygenated blood. In a loop, there are between ten (10) to twelve (12) bulbs. Oxygenated
blood is illustrated by red bulbs while de-oxygenated by blue bulbs. From the heart de-
oxygenated blood flows to the lungs and oxygenated blood flows to the heart. From the
heart, the oxygenated blood flows to the body and deoxygenated blood flows back to the
heart. The process is repeated. Note that the reverse is the movement of blood between
heart and lungs and heart and body. The blood flows in the opposite direction.
A transistorized stable circuit is used to show the heart beat by bulbs flashing. A side
signal is fed to power a 5551C, which operates at a variable audio frequency.
Transformer
SW
Battery
Rectifier Regulator
Astable (Red) Light
BlueAST
IC555
Speaker
Sound
S. Gen., S. Dist S. Amp
100ps
Switch

175
The circulatory system is illuminated to use Direct current (DC) and alternate current
(AC). Therefore in the absent of AC, user can switch to DC (rechargeable battery).
Researcher Developed Models Of (1b) The Structure Of The Heart (2b) Human
Blood Circulatory System (3b) Excretory System (4b) Kidney Tubule/Nephron
APPENDIX F
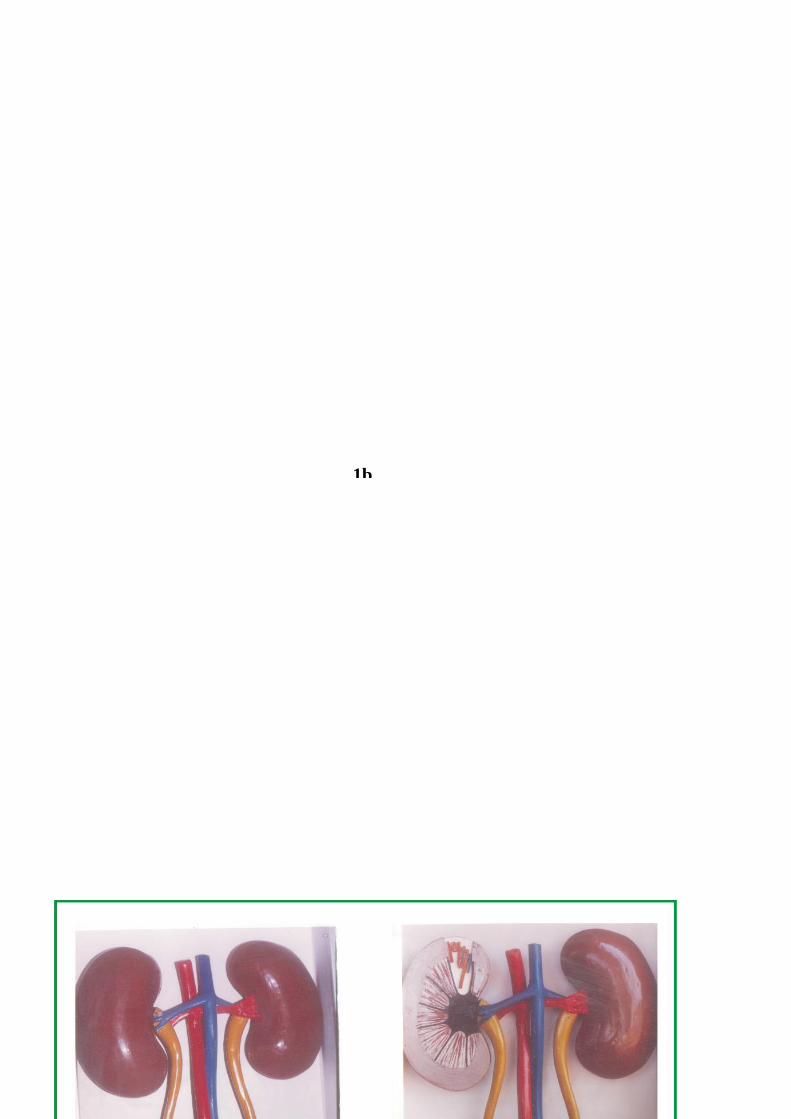
176
1b
2b

177
APPENDIX F
APPENDIX G
APPENDIX
G
THE INTERNAL STRUCTURE OF THE HEART
The Casing of the Developed Models of (1c) the Structure of the Heart (2c) Human Blood Circulatory System (3c)
Excretory System (4c) Kidney Tubule/Nephron
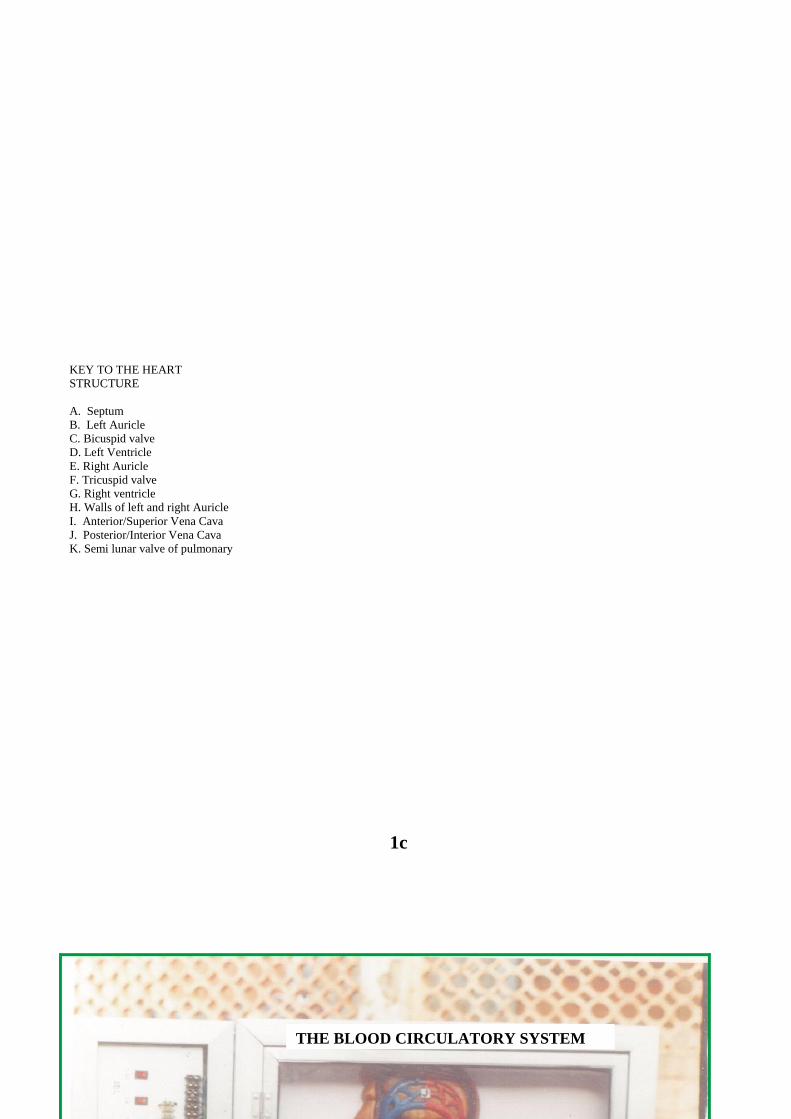
178
THE BLOOD CIRCULATORY SYSTEM
1c
KEY TO THE HEART
STRUCTURE
A. Septum
B. Left Auricle
C. Bicuspid valve
D. Left Ventricle
E. Right Auricle
F. Tricuspid valve
G. Right ventricle
H. Walls of left and right Auricle
I. Anterior/Superior Vena Cava
J. Posterior/Interior Vena Cava
K. Semi lunar valve of pulmonary
Artery
L. Pulmonary Artery
M. Pulmonary Vein
N. Semi lunar valve of Aorta
O. Aorta

179
THE EXCRETORY SYSTEM

180
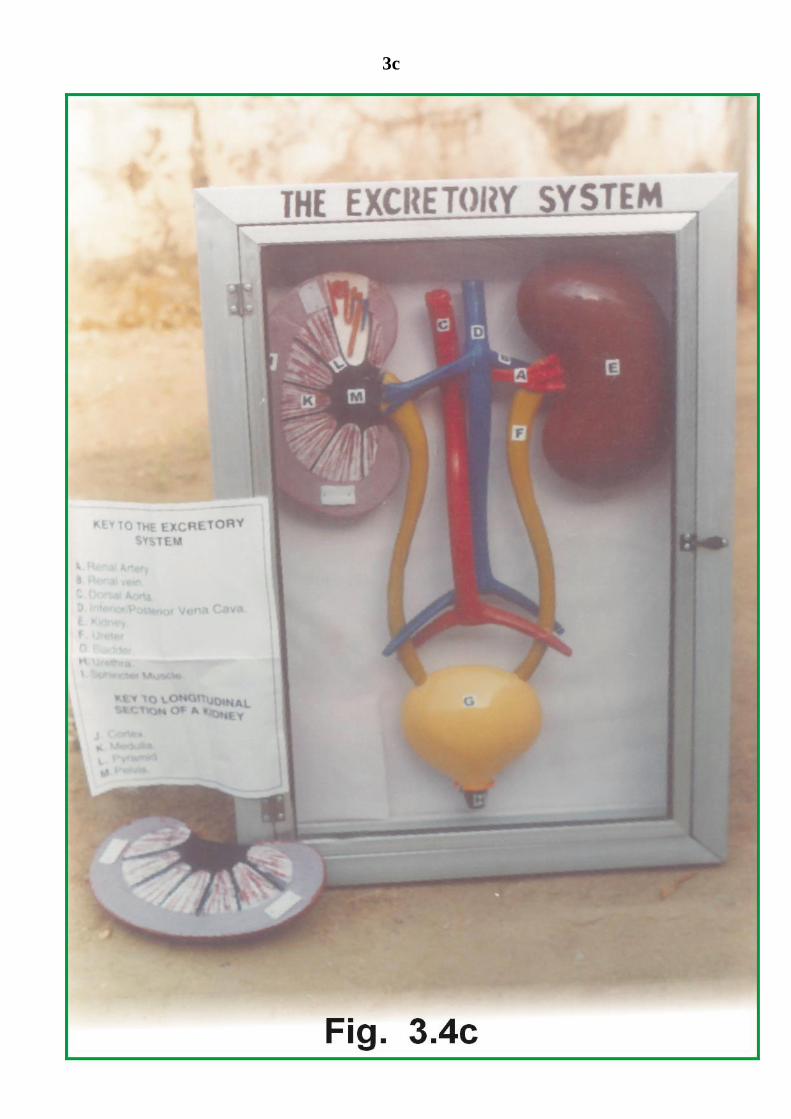
181
3c 3c
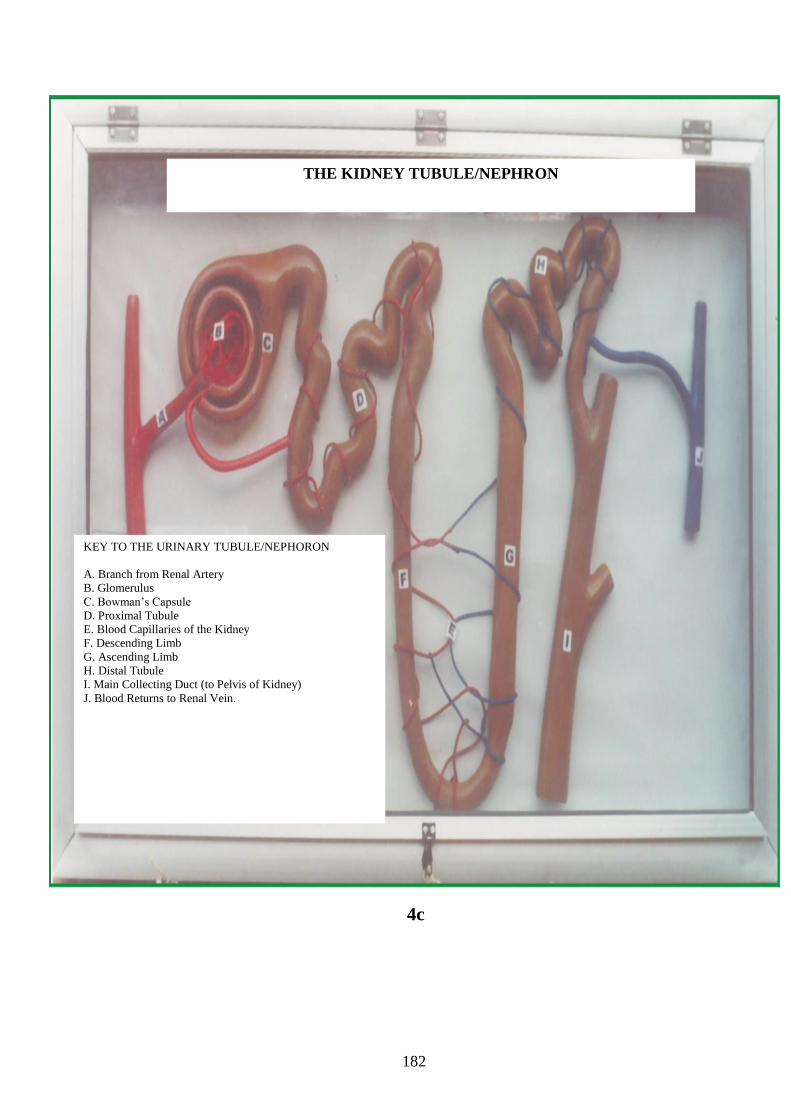
182
THE LONGITUDINAL SECTION OF A
KIDNEY
KEY TO LONGITUDINAL
SECTION OF A KIDNEY
J. Cortex
K. Medulla
L. Pyramid
M. Pelvis
THE KIDNEY TUBULE/NEPHRON
KEY TO THE URINARY TUBULE/NEPHORON
A. Branch from Renal Artery
B. Glomerulus
C. Bowman’s Capsule
D. Proximal Tubule
E. Blood Capillaries of the Kidney
F. Descending Limb
G. Ascending Limb
H. Distal Tubule
I. Main Collecting Duct (to Pelvis of Kidney)
J. Blood Returns to Renal Vein.
4c
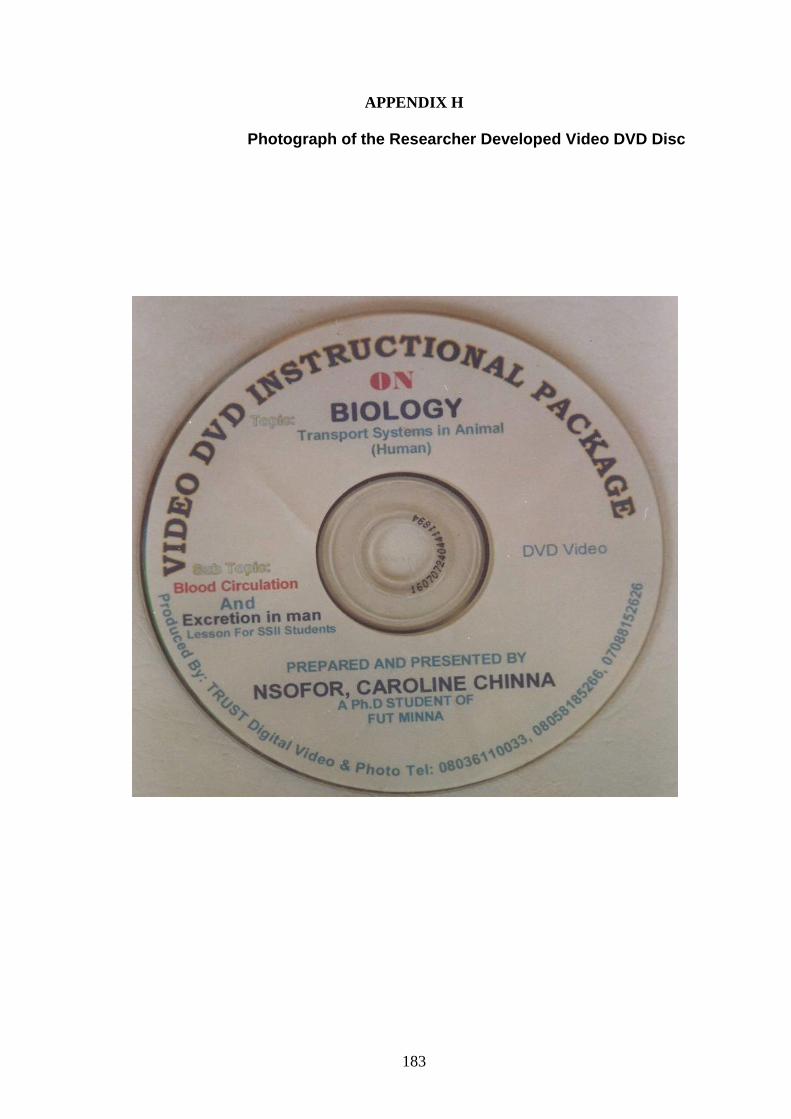
183
APPENDIX H
Photograph of the Researcher Developed Video DVD Disc
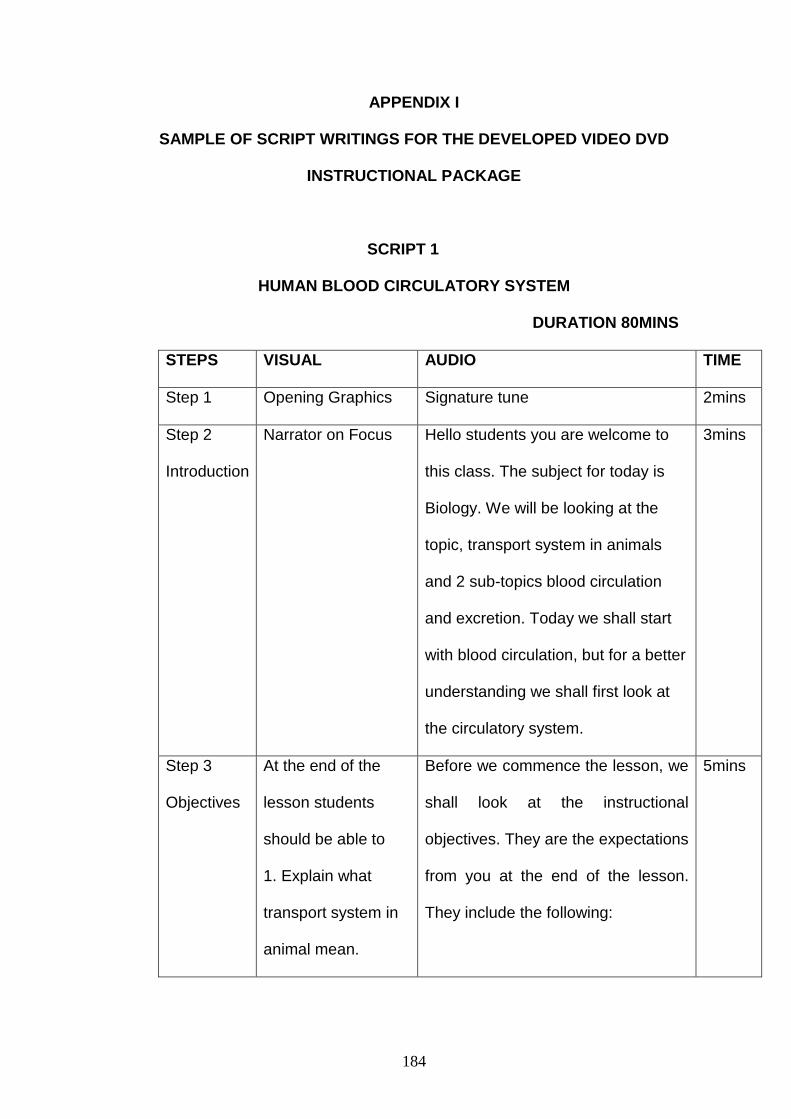
184
APPENDIX I
SAMPLE OF SCRIPT WRITINGS FOR THE DEVELOPED VIDEO DVD
INSTRUCTIONAL PACKAGE
SCRIPT 1
HUMAN BLOOD CIRCULATORY SYSTEM
DURATION 80MINS
STEPS VISUAL AUDIO TIME
Step 1 Opening Graphics Signature tune 2mins
Step 2
Introduction
Narrator on Focus Hello students you are welcome to
this class. The subject for today is
Biology. We will be looking at the
topic, transport system in animals
and 2 sub-topics blood circulation
and excretion. Today we shall start
with blood circulation, but for a better
understanding we shall first look at
the circulatory system.
3mins
Step 3
Objectives
At the end of the
lesson students
should be able to
1. Explain what
transport system in
animal mean.
Before we commence the lesson, we
shall look at the instructional
objectives. They are the expectations
from you at the end of the lesson.
They include the following:
5mins
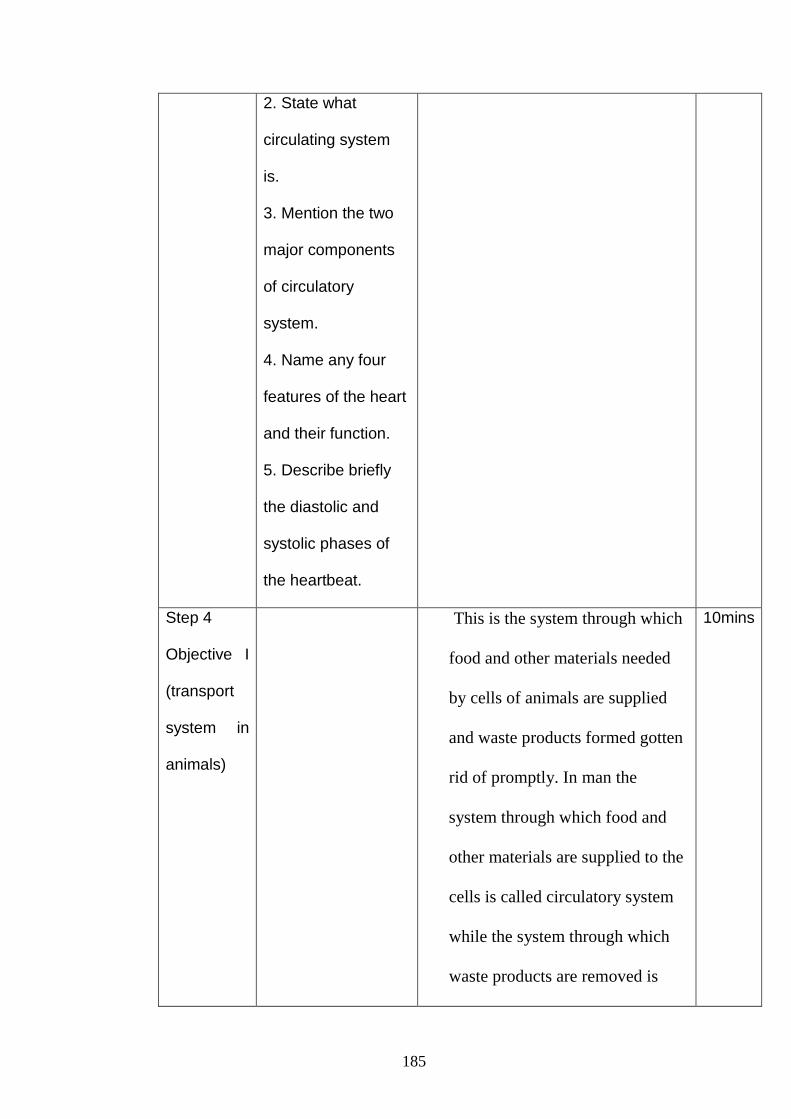
185
2. State what
circulating system
is.
3. Mention the two
major components
of circulatory
system.
4. Name any four
features of the heart
and their function.
5. Describe briefly
the diastolic and
systolic phases of
the heartbeat.
Step 4
Objective I
(transport
system in
animals)
This is the system through which
food and other materials needed
by cells of animals are supplied
and waste products formed gotten
rid of promptly. In man the
system through which food and
other materials are supplied to the
cells is called circulatory system
while the system through which
waste products are removed is
10mins
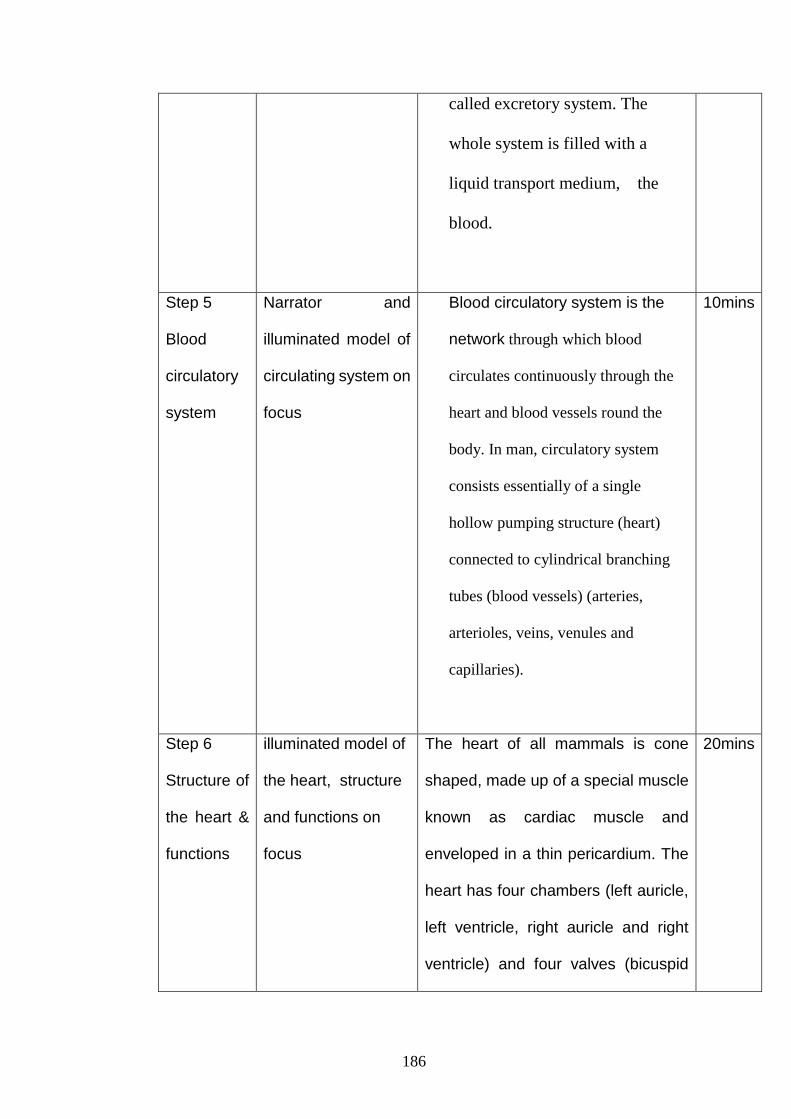
186
called excretory system. The
whole system is filled with a
liquid transport medium, the
blood.
Step 5
Blood
circulatory
system
Narrator and
illuminated model of
circulating system on
focus
Blood circulatory system is the
network through which blood
circulates continuously through the
heart and blood vessels round the
body. In man, circulatory system
consists essentially of a single
hollow pumping structure (heart)
connected to cylindrical branching
tubes (blood vessels) (arteries,
arterioles, veins, venules and
capillaries).
10mins
Step 6
Structure of
the heart &
functions
illuminated model of
the heart, structure
and functions on
focus
The heart of all mammals is cone
shaped, made up of a special muscle
known as cardiac muscle and
enveloped in a thin pericardium. The
heart has four chambers (left auricle,
left ventricle, right auricle and right
ventricle) and four valves (bicuspid
20mins
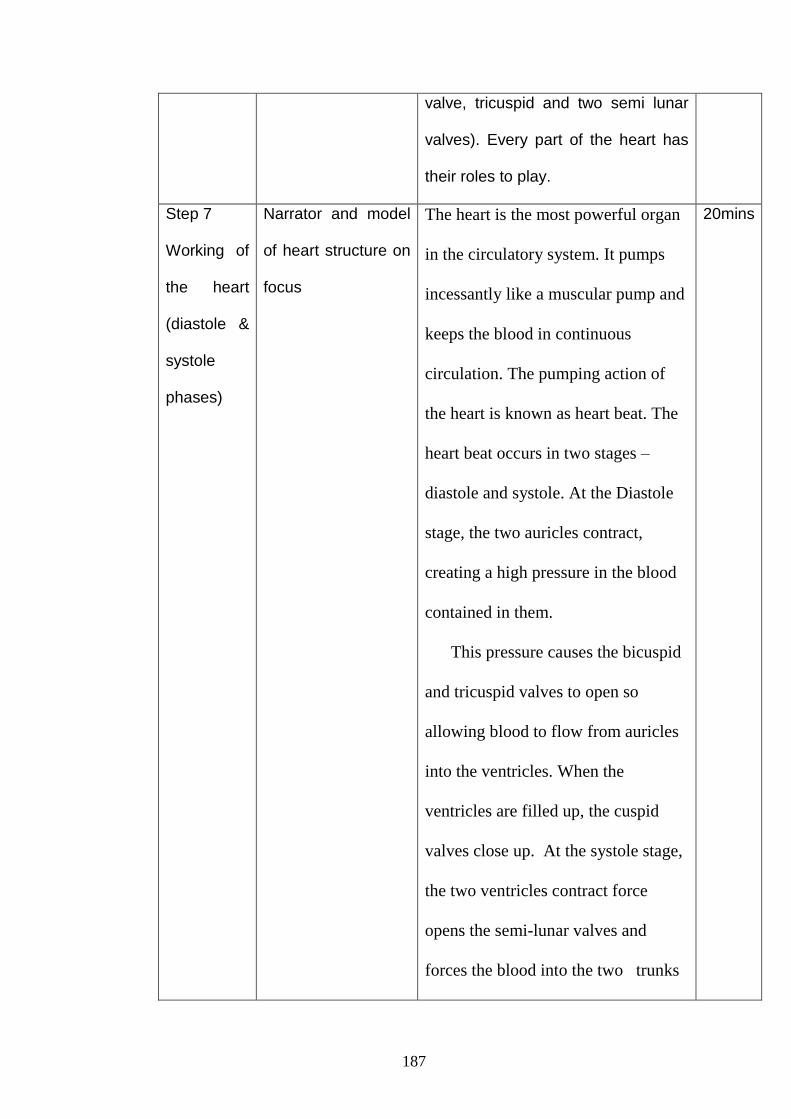
187
valve, tricuspid and two semi lunar
valves). Every part of the heart has
their roles to play.
Step 7
Working of
the heart
(diastole &
systole
phases)
Narrator and model
of heart structure on
focus
The heart is the most powerful organ
in the circulatory system. It pumps
incessantly like a muscular pump and
keeps the blood in continuous
circulation. The pumping action of
the heart is known as heart beat. The
heart beat occurs in two stages –
diastole and systole. At the Diastole
stage, the two auricles contract,
creating a high pressure in the blood
contained in them.
This pressure causes the bicuspid
and tricuspid valves to open so
allowing blood to flow from auricles
into the ventricles. When the
ventricles are filled up, the cuspid
valves close up. At the systole stage,
the two ventricles contract force
opens the semi-lunar valves and
forces the blood into the two trunks
20mins
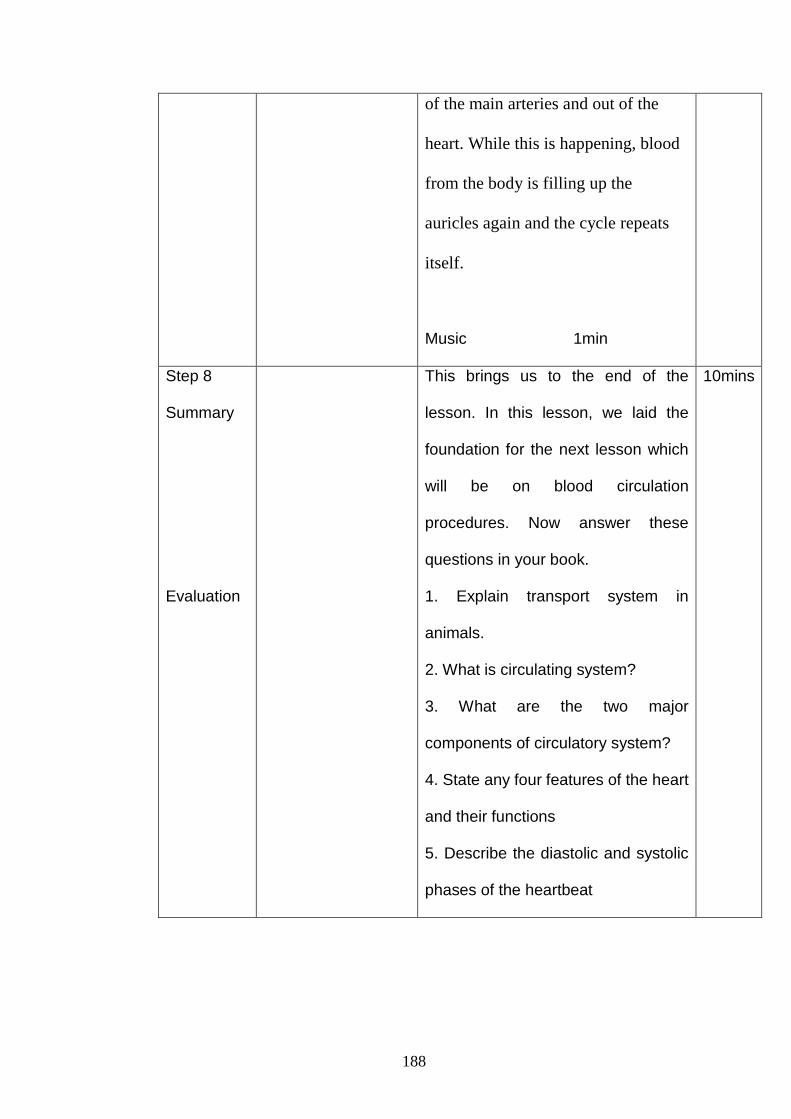
188
of the main arteries and out of the
heart. While this is happening, blood
from the body is filling up the
auricles again and the cycle repeats
itself.
Music 1min
Step 8
Summary
Evaluation
This brings us to the end of the
lesson. In this lesson, we laid the
foundation for the next lesson which
will be on blood circulation
procedures. Now answer these
questions in your book.
1. Explain transport system in
animals.
2. What is circulating system?
3. What are the two major
components of circulatory system?
4. State any four features of the heart
and their functions
5. Describe the diastolic and systolic
phases of the heartbeat
10mins
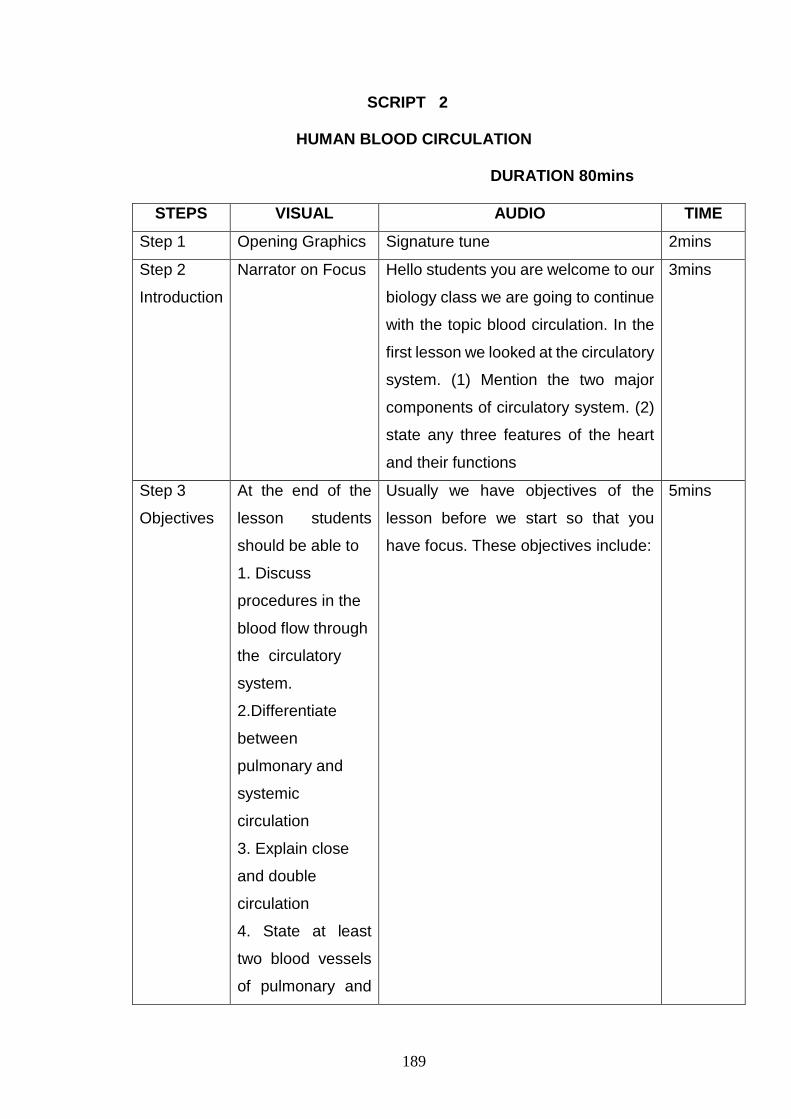
189
SCRIPT 2
HUMAN BLOOD CIRCULATION
DURATION 80mins
STEPS VISUAL AUDIO TIME
Step 1 Opening Graphics Signature tune 2mins
Step 2
Introduction
Narrator on Focus Hello students you are welcome to our
biology class we are going to continue
with the topic blood circulation. In the
first lesson we looked at the circulatory
system. (1) Mention the two major
components of circulatory system. (2)
state any three features of the heart
and their functions
3mins
Step 3
Objectives
At the end of the
lesson students
should be able to
1. Discuss
procedures in the
blood flow through
the circulatory
system.
2.Differentiate
between
pulmonary and
systemic
circulation
3. Explain close
and double
circulation
4. State at least
two blood vessels
of pulmonary and
Usually we have objectives of the
lesson before we start so that you
have focus. These objectives include:
5mins
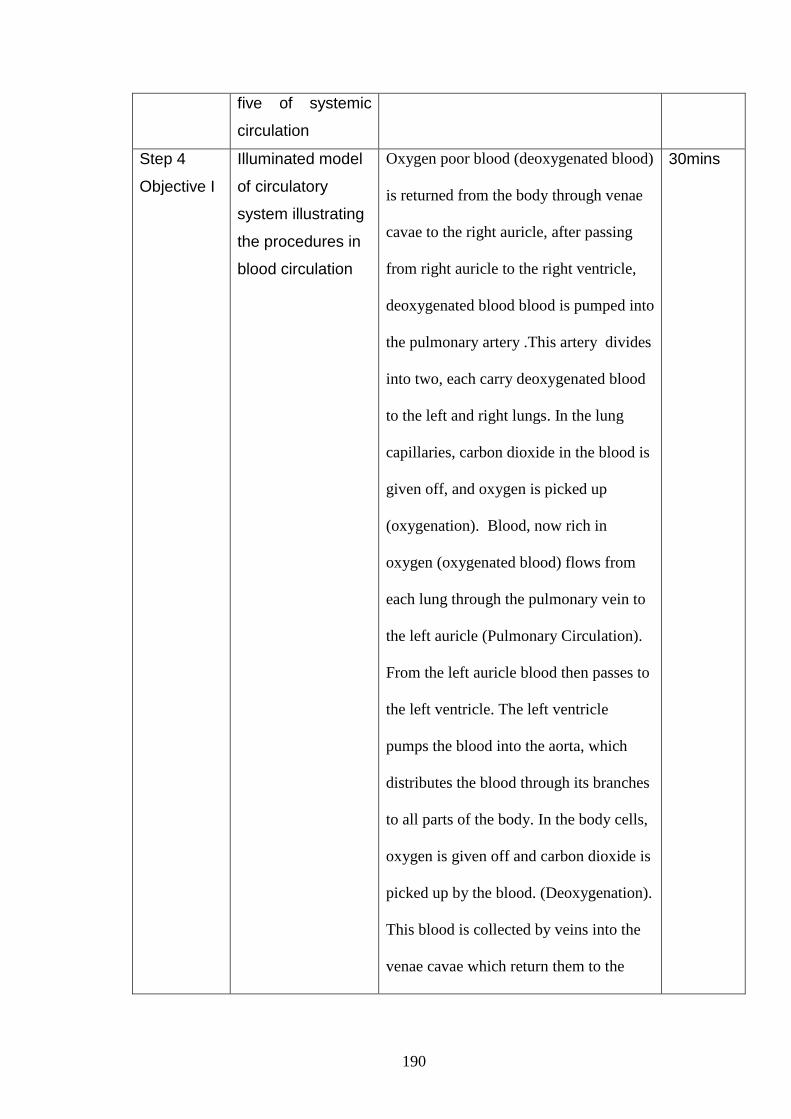
190
five of systemic
circulation
Step 4
Objective I
Illuminated model
of circulatory
system illustrating
the procedures in
blood circulation
Oxygen poor blood (deoxygenated blood)
is returned from the body through venae
cavae to the right auricle, after passing
from right auricle to the right ventricle,
deoxygenated blood blood is pumped into
the pulmonary artery .This artery divides
into two, each carry deoxygenated blood
to the left and right lungs. In the lung
capillaries, carbon dioxide in the blood is
given off, and oxygen is picked up
(oxygenation). Blood, now rich in
oxygen (oxygenated blood) flows from
each lung through the pulmonary vein to
the left auricle (Pulmonary Circulation).
From the left auricle blood then passes to
the left ventricle. The left ventricle
pumps the blood into the aorta, which
distributes the blood through its branches
to all parts of the body. In the body cells,
oxygen is given off and carbon dioxide is
picked up by the blood. (Deoxygenation).
This blood is collected by veins into the
venae cavae which return them to the
30mins
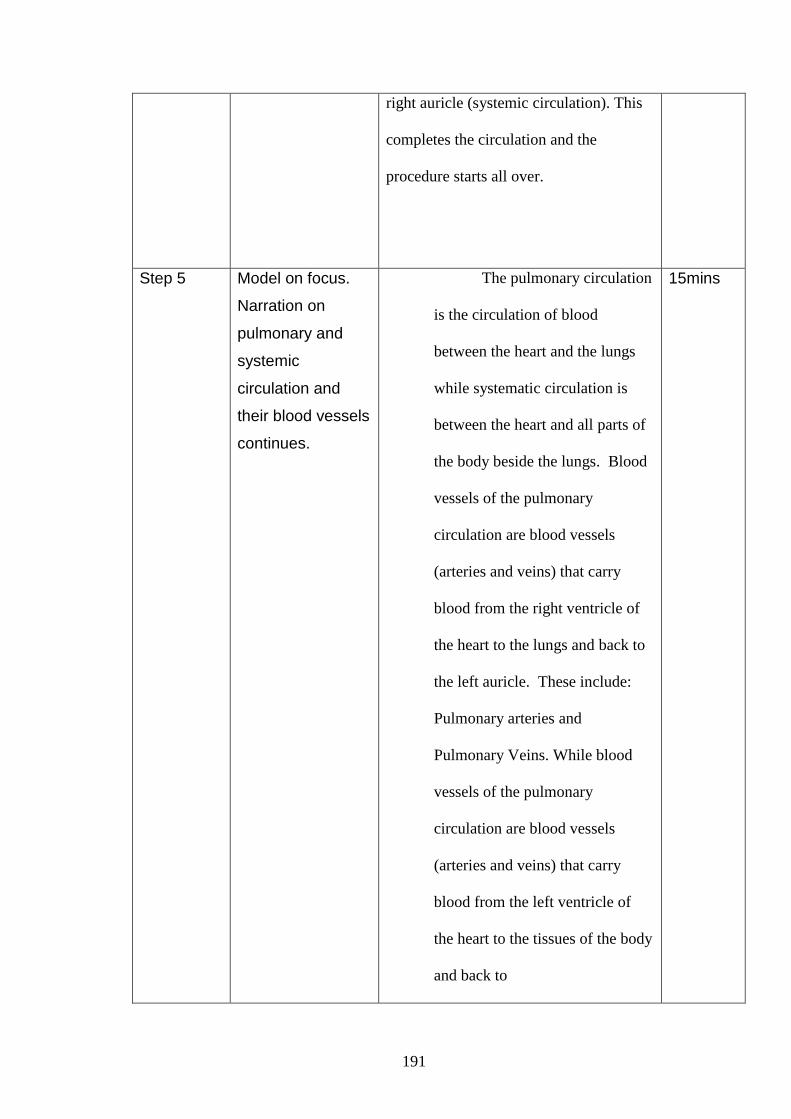
191
right auricle (systemic circulation). This
completes the circulation and the
procedure starts all over.
Step 5
Model on focus.
Narration on
pulmonary and
systemic
circulation and
their blood vessels
continues.
The pulmonary circulation
is the circulation of blood
between the heart and the lungs
while systematic circulation is
between the heart and all parts of
the body beside the lungs. Blood
vessels of the pulmonary
circulation are blood vessels
(arteries and veins) that carry
blood from the right ventricle of
the heart to the lungs and back to
the left auricle. These include:
Pulmonary arteries and
Pulmonary Veins. While blood
vessels of the pulmonary
circulation are blood vessels
(arteries and veins) that carry
blood from the left ventricle of
the heart to the tissues of the body
and back to
15mins
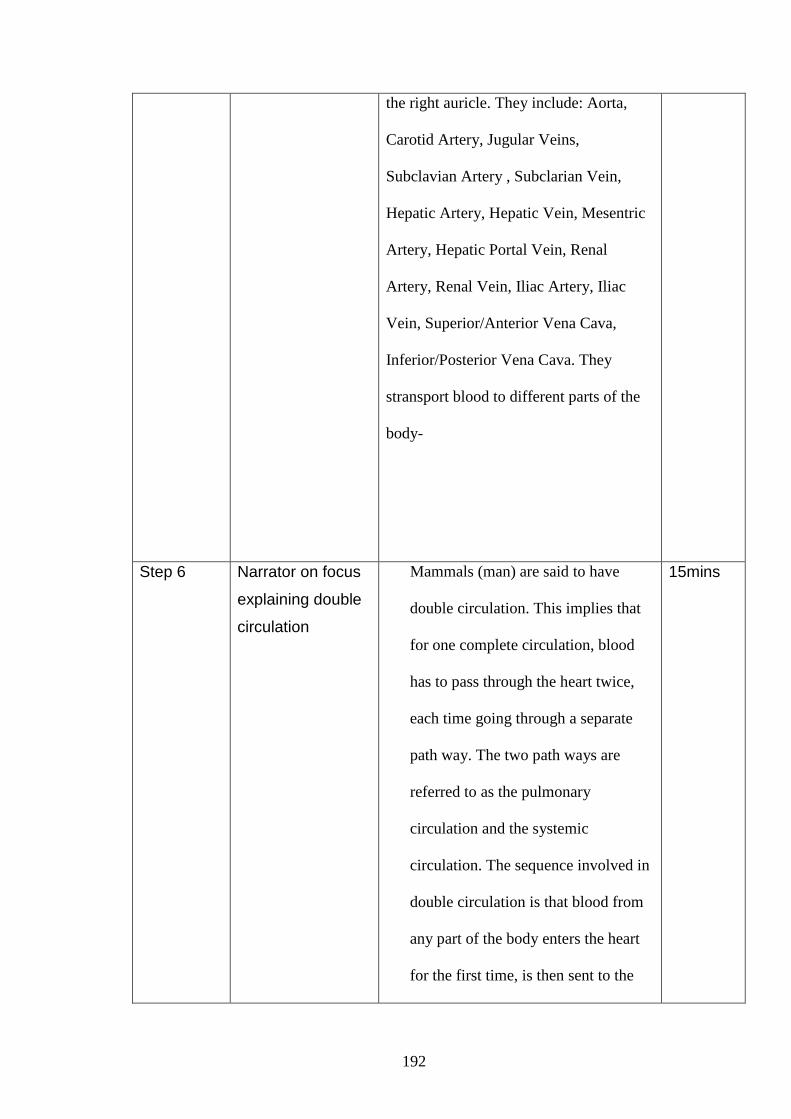
192
the right auricle. They include: Aorta,
Carotid Artery, Jugular Veins,
Subclavian Artery , Subclarian Vein,
Hepatic Artery, Hepatic Vein, Mesentric
Artery, Hepatic Portal Vein, Renal
Artery, Renal Vein, Iliac Artery, Iliac
Vein, Superior/Anterior Vena Cava,
Inferior/Posterior Vena Cava. They
stransport blood to different parts of the
body-
Step 6
Narrator on focus
explaining double
circulation
Mammals (man) are said to have
double circulation. This implies that
for one complete circulation, blood
has to pass through the heart twice,
each time going through a separate
path way. The two path ways are
referred to as the pulmonary
circulation and the systemic
circulation. The sequence involved in
double circulation is that blood from
any part of the body enters the heart
for the first time, is then sent to the
15mins
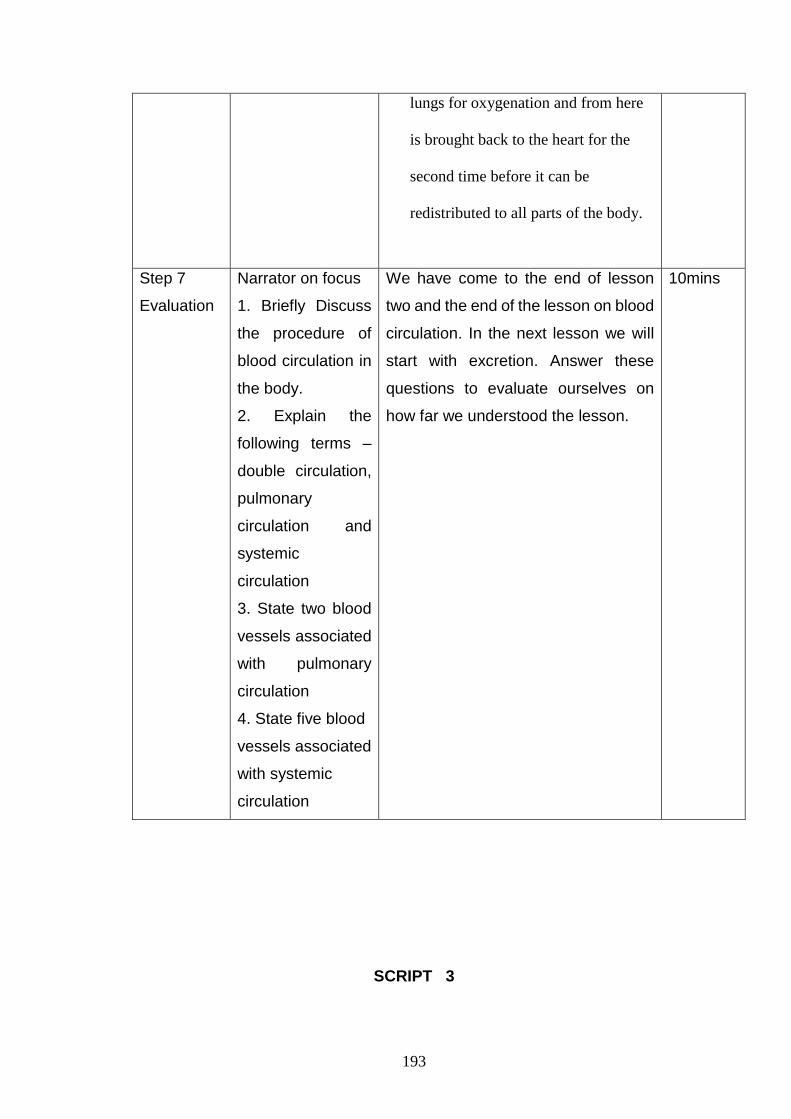
193
lungs for oxygenation and from here
is brought back to the heart for the
second time before it can be
redistributed to all parts of the body.
Step 7
Evaluation
Narrator on focus
1. Briefly Discuss
the procedure of
blood circulation in
the body.
2. Explain the
following terms –
double circulation,
pulmonary
circulation and
systemic
circulation
3. State two blood
vessels associated
with pulmonary
circulation
4. State five blood
vessels associated
with systemic
circulation
We have come to the end of lesson
two and the end of the lesson on blood
circulation. In the next lesson we will
start with excretion. Answer these
questions to evaluate ourselves on
how far we understood the lesson.
10mins
SCRIPT 3
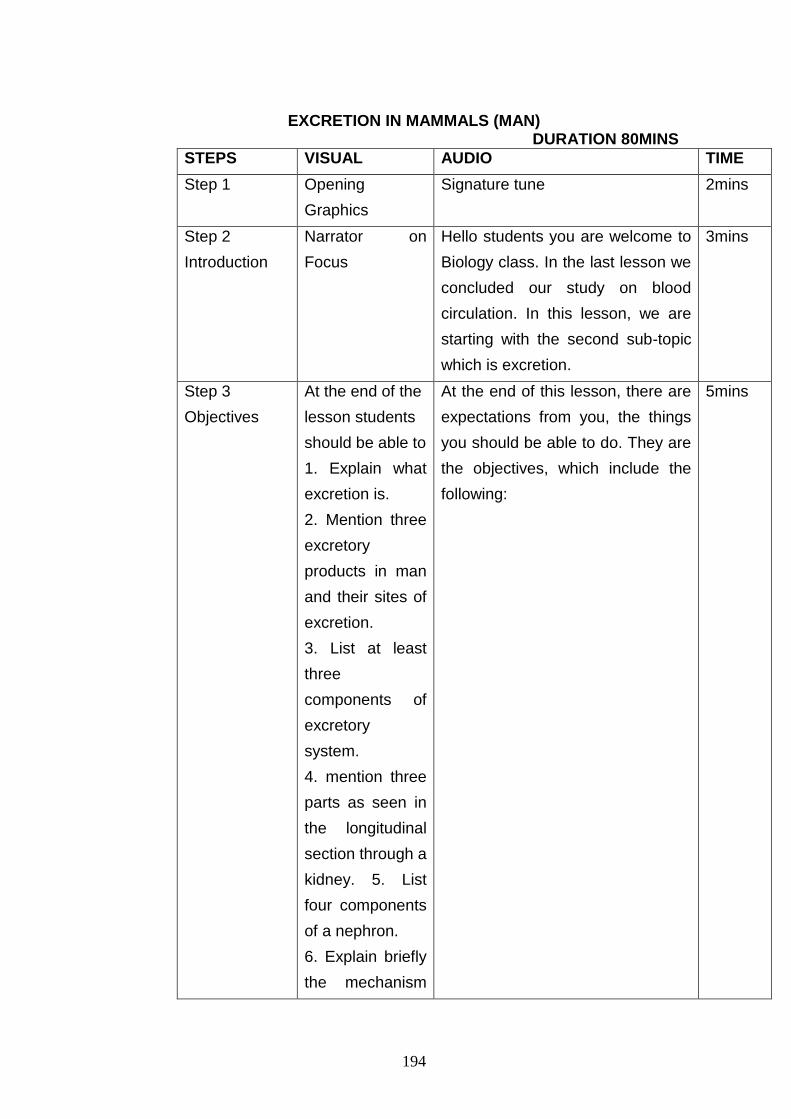
194
EXCRETION IN MAMMALS (MAN)
DURATION 80MINS
STEPS VISUAL AUDIO TIME
Step 1 Opening
Graphics
Signature tune 2mins
Step 2
Introduction
Narrator on
Focus
Hello students you are welcome to
Biology class. In the last lesson we
concluded our study on blood
circulation. In this lesson, we are
starting with the second sub-topic
which is excretion.
3mins
Step 3
Objectives
At the end of the
lesson students
should be able to
1. Explain what
excretion is.
2. Mention three
excretory
products in man
and their sites of
excretion.
3. List at least
three
components of
excretory
system.
4. mention three
parts as seen in
the longitudinal
section through a
kidney. 5. List
four components
of a nephron.
6. Explain briefly
the mechanism
At the end of this lesson, there are
expectations from you, the things
you should be able to do. They are
the objectives, which include the
following:
5mins
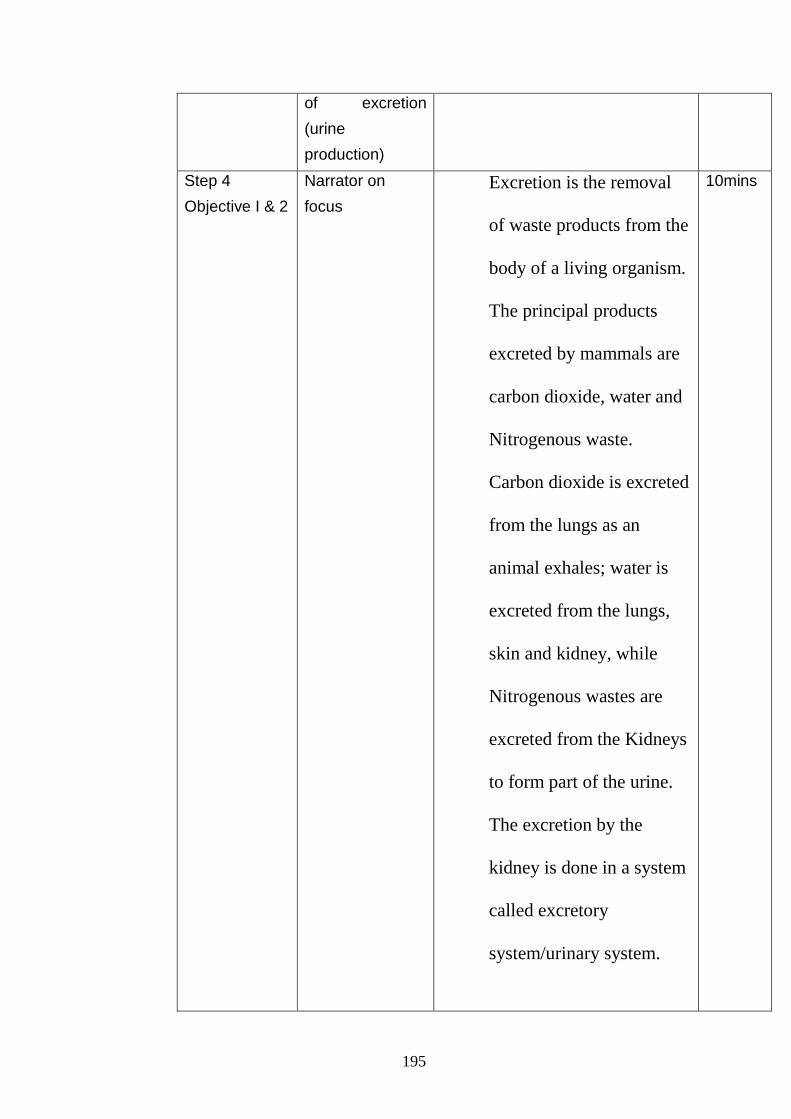
195
of excretion
(urine
production)
Step 4
Objective I & 2
Narrator on
focus
Excretion is the removal
of waste products from the
body of a living organism.
The principal products
excreted by mammals are
carbon dioxide, water and
Nitrogenous waste.
Carbon dioxide is excreted
from the lungs as an
animal exhales; water is
excreted from the lungs,
skin and kidney, while
Nitrogenous wastes are
excreted from the Kidneys
to form part of the urine.
The excretion by the
kidney is done in a system
called excretory
system/urinary system.
10mins
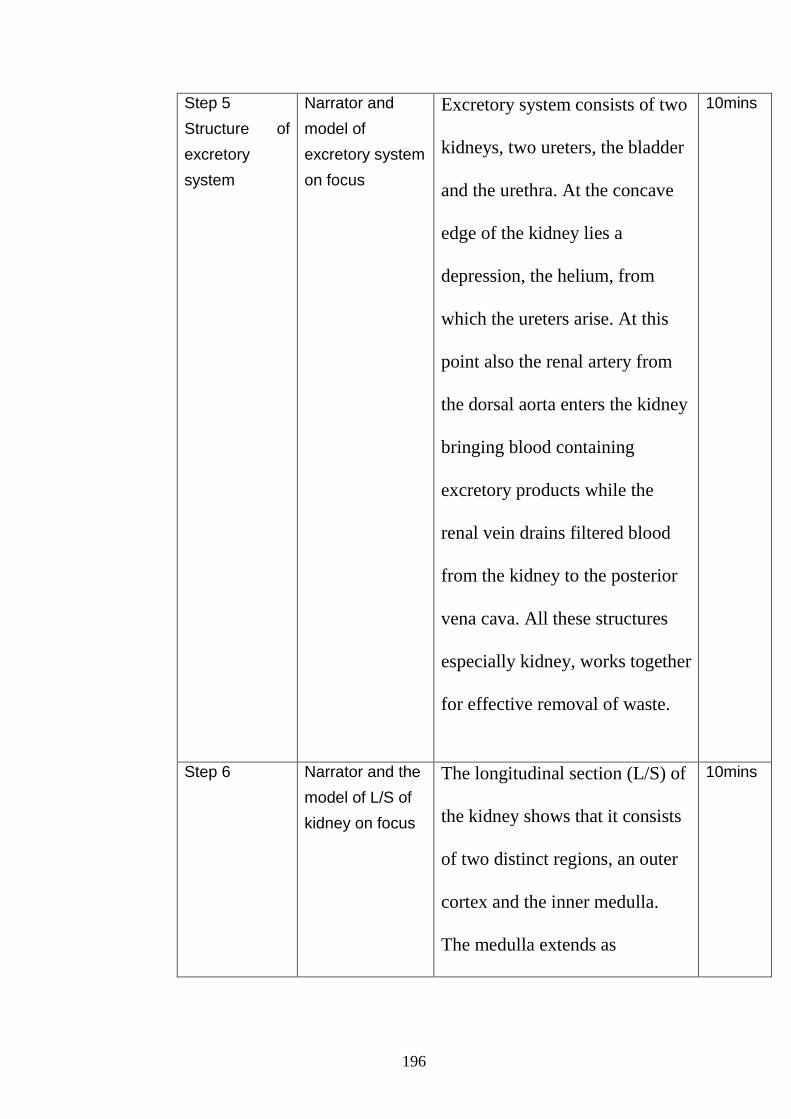
196
Step 5
Structure of
excretory
system
Narrator and
model of
excretory system
on focus
Excretory system consists of two
kidneys, two ureters, the bladder
and the urethra. At the concave
edge of the kidney lies a
depression, the helium, from
which the ureters arise. At this
point also the renal artery from
the dorsal aorta enters the kidney
bringing blood containing
excretory products while the
renal vein drains filtered blood
from the kidney to the posterior
vena cava. All these structures
especially kidney, works together
for effective removal of waste.
10mins
Step 6
Narrator and the
model of L/S of
kidney on focus
The longitudinal section (L/S) of
the kidney shows that it consists
of two distinct regions, an outer
cortex and the inner medulla.
The medulla extends as
10mins
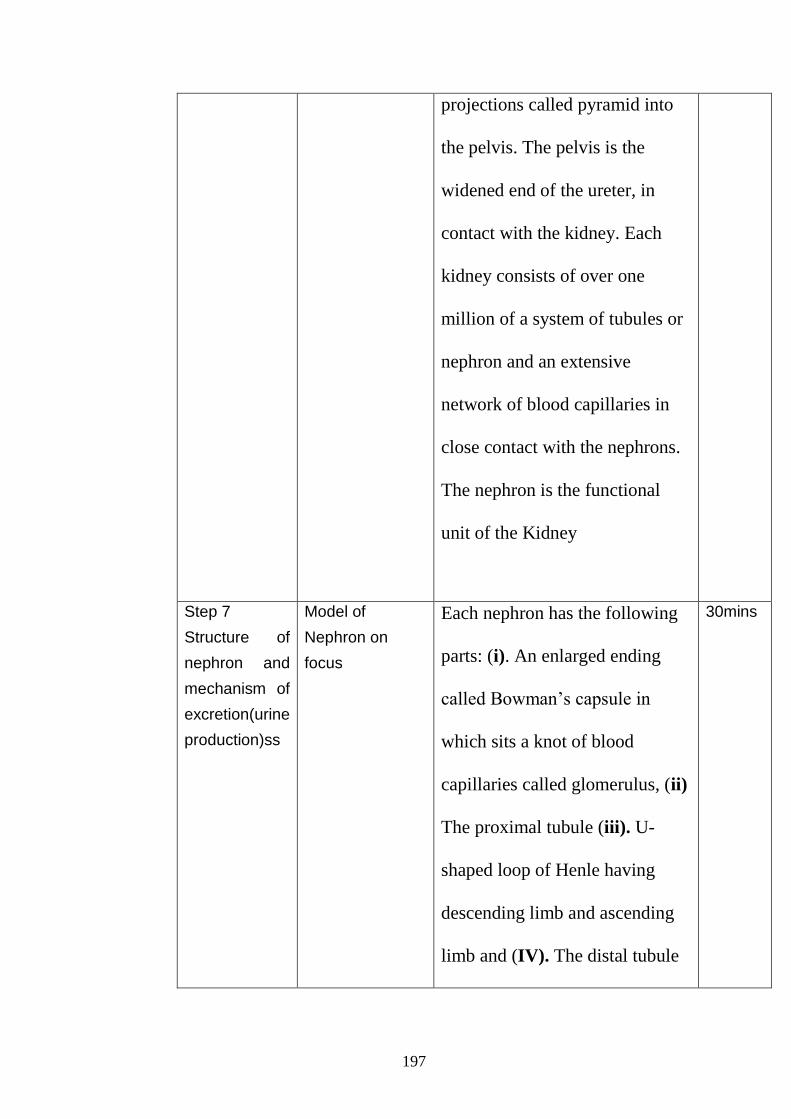
197
projections called pyramid into
the pelvis. The pelvis is the
widened end of the ureter, in
contact with the kidney. Each
kidney consists of over one
million of a system of tubules or
nephron and an extensive
network of blood capillaries in
close contact with the nephrons.
The nephron is the functional
unit of the Kidney
Step 7
Structure of
nephron and
mechanism of
excretion(urine
production)ss
Model of
Nephron on
focus
Each nephron has the following
parts: (i). An enlarged ending
called Bowman’s capsule in
which sits a knot of blood
capillaries called glomerulus, (ii)
The proximal tubule (iii). U-
shaped loop of Henle having
descending limb and ascending
limb and (IV). The distal tubule
30mins
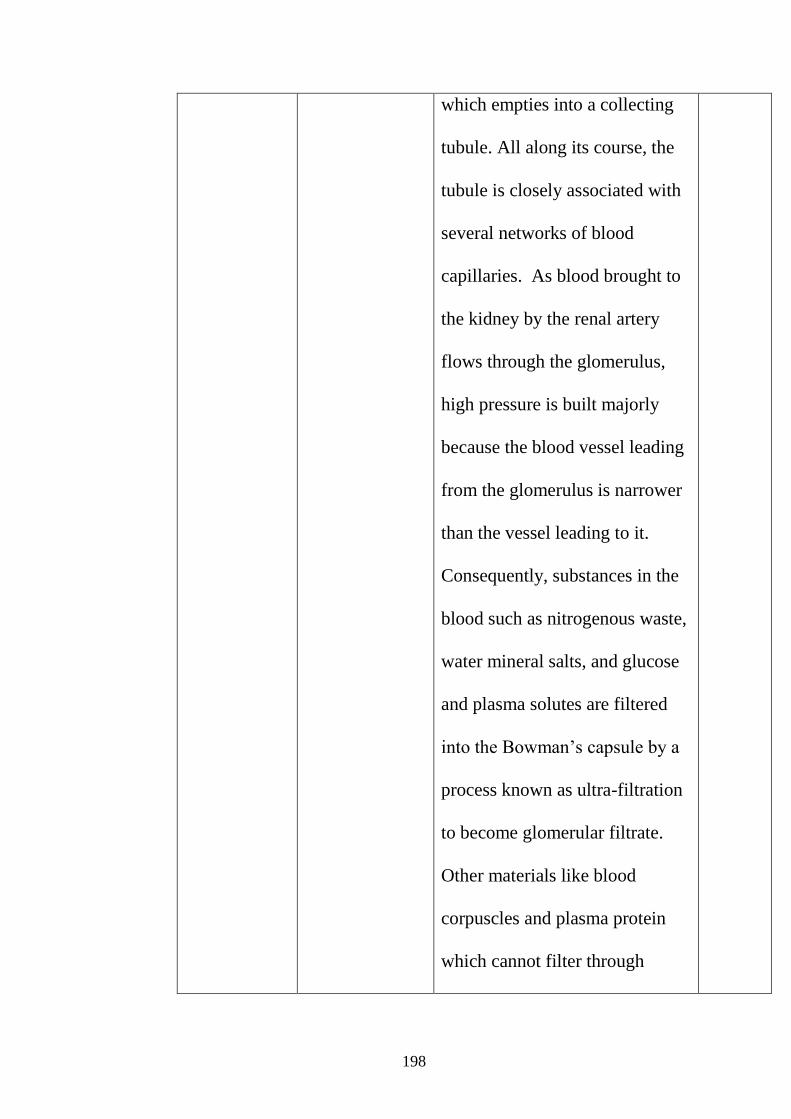
198
which empties into a collecting
tubule. All along its course, the
tubule is closely associated with
several networks of blood
capillaries. As blood brought to
the kidney by the renal artery
flows through the glomerulus,
high pressure is built majorly
because the blood vessel leading
from the glomerulus is narrower
than the vessel leading to it.
Consequently, substances in the
blood such as nitrogenous waste,
water mineral salts, and glucose
and plasma solutes are filtered
into the Bowman’s capsule by a
process known as ultra-filtration
to become glomerular filtrate.
Other materials like blood
corpuscles and plasma protein
which cannot filter through
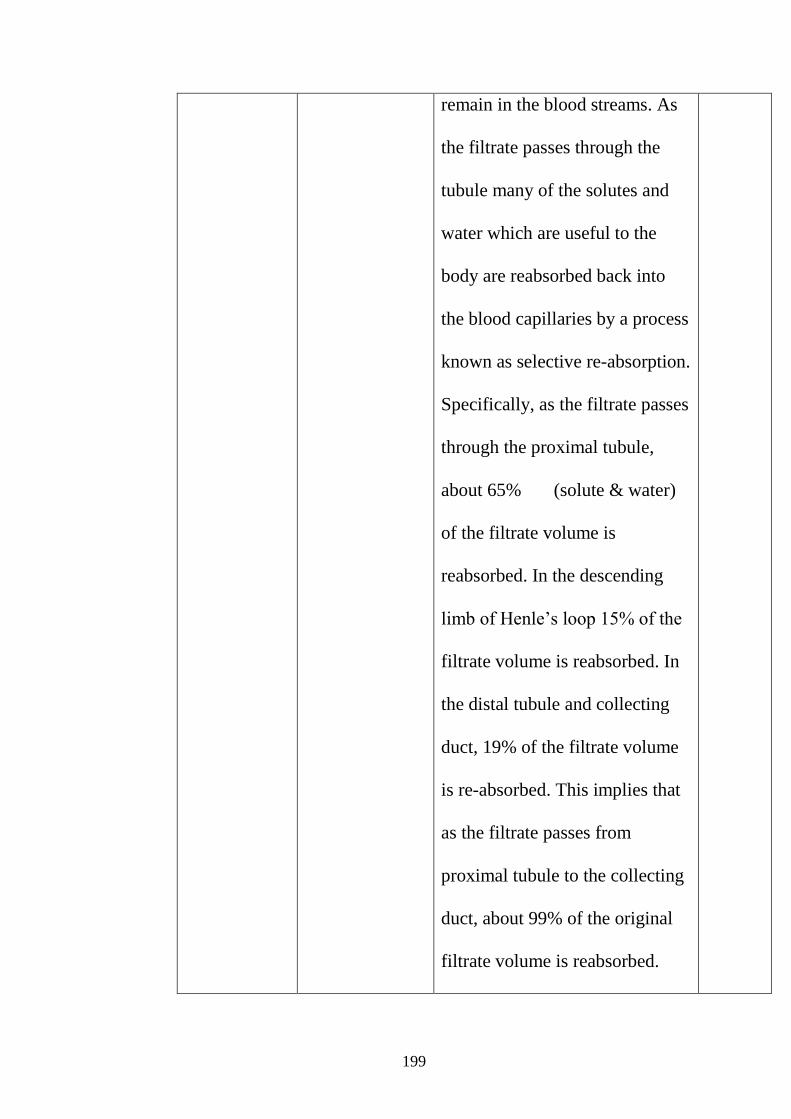
199
remain in the blood streams. As
the filtrate passes through the
tubule many of the solutes and
water which are useful to the
body are reabsorbed back into
the blood capillaries by a process
known as selective re-absorption.
Specifically, as the filtrate passes
through the proximal tubule,
about 65% (solute & water)
of the filtrate volume is
reabsorbed. In the descending
limb of Henle’s loop 15% of the
filtrate volume is reabsorbed. In
the distal tubule and collecting
duct, 19% of the filtrate volume
is re-absorbed. This implies that
as the filtrate passes from
proximal tubule to the collecting
duct, about 99% of the original
filtrate volume is reabsorbed.

200
These materials flow through the
renal veins to enter the general
circulation. Only 1% of the
original filtrate volume remains
as urine. Urine is mostly water
and contains organic waste
products such as urea, uric acid
and creatinine as well as excess
ions. The urine so formed
trickles down the ureter and
collects in the bladder which
stretches to accommodate it.
When the bladder is full, the
urethral sphincter relaxes
allowing the urine to pass out of
the body through the urethra.
Step 8
Evaluation
Narrator and model on focus 1. What is Excretion? 2. Mention three excretory products in the body and state their site of removal. 3. State any three
This has brought us to the end of
the lesson on excretion. At the
beginning of the lesson we had
objective. At the end of this lesson
we shall evaluate ourselves through
these questions.
10mins
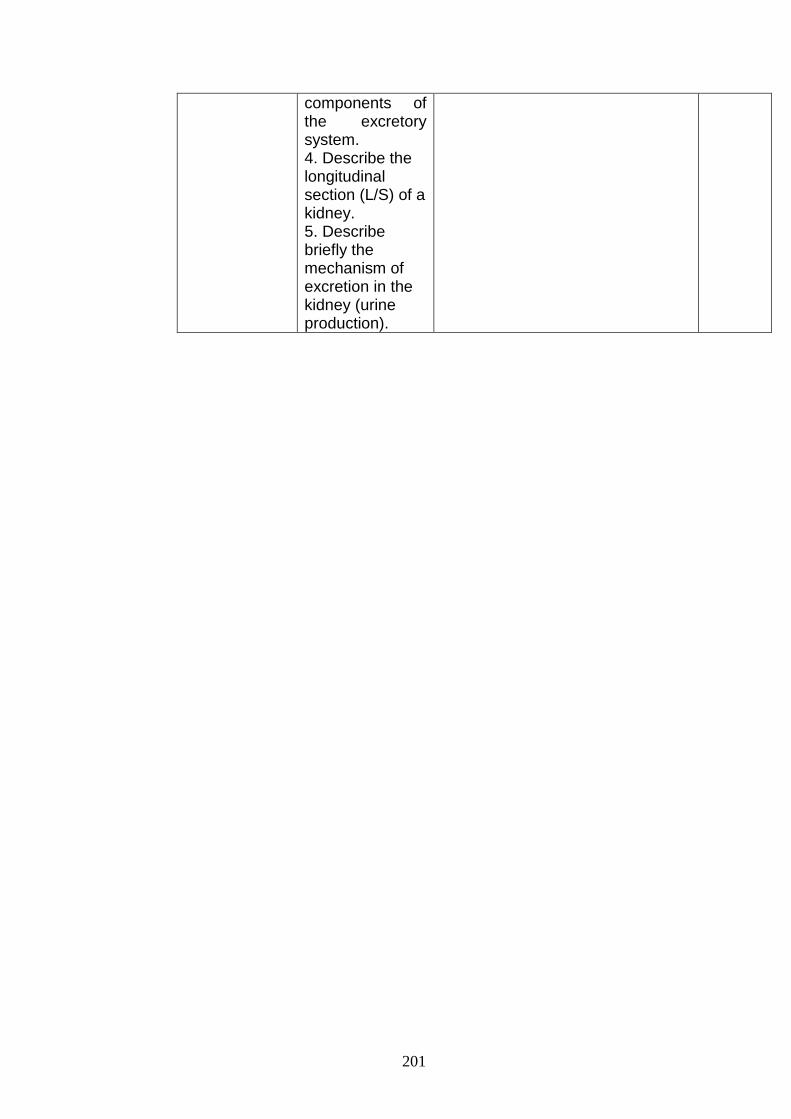
201
components of the excretory system. 4. Describe the longitudinal section (L/S) of a kidney. 5. Describe briefly the mechanism of excretion in the kidney (urine production).
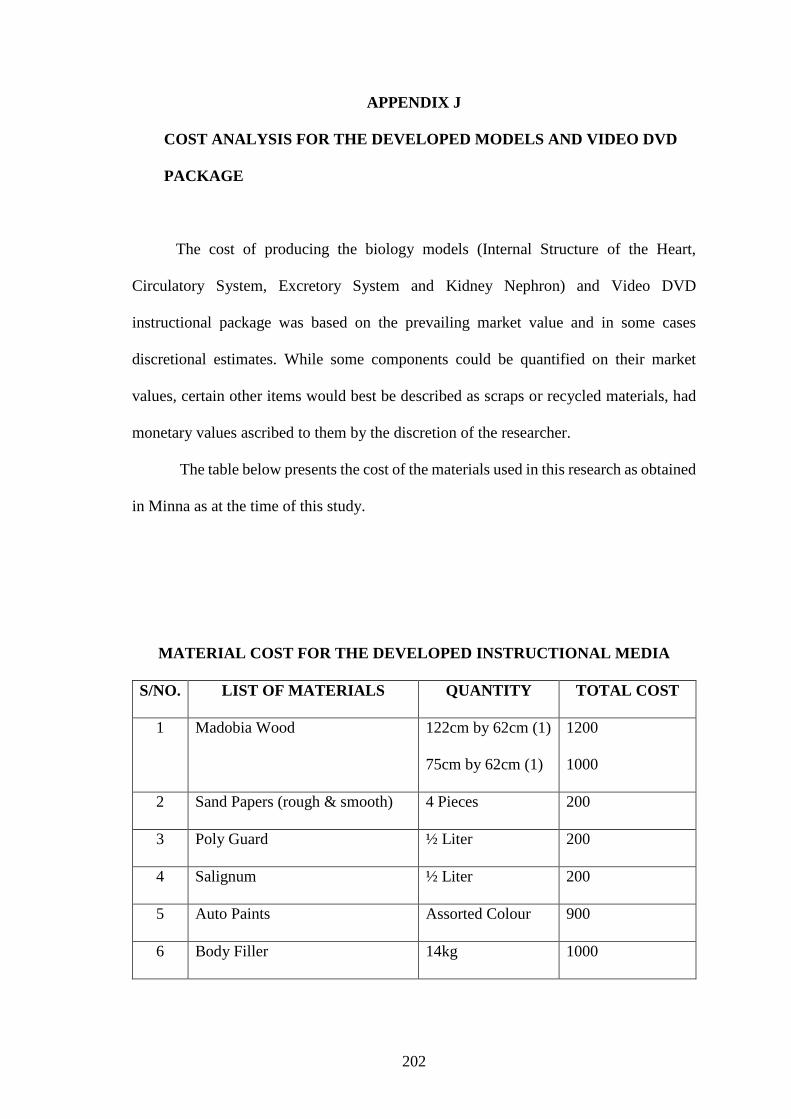
202
APPENDIX J
COST ANALYSIS FOR THE DEVELOPED MODELS AND VIDEO DVD
PACKAGE
The cost of producing the biology models (Internal Structure of the Heart,
Circulatory System, Excretory System and Kidney Nephron) and Video DVD
instructional package was based on the prevailing market value and in some cases
discretional estimates. While some components could be quantified on their market
values, certain other items would best be described as scraps or recycled materials, had
monetary values ascribed to them by the discretion of the researcher.
The table below presents the cost of the materials used in this research as obtained
in Minna as at the time of this study.
MATERIAL COST FOR THE DEVELOPED INSTRUCTIONAL MEDIA
S/NO. LIST OF MATERIALS QUANTITY TOTAL COST
1 Madobia Wood 122cm by 62cm (1)
75cm by 62cm (1)
1200
1000
2 Sand Papers (rough & smooth) 4 Pieces 200
3 Poly Guard ½ Liter 200
4 Salignum ½ Liter 200
5 Auto Paints Assorted Colour 900
6 Body Filler 14kg 1000
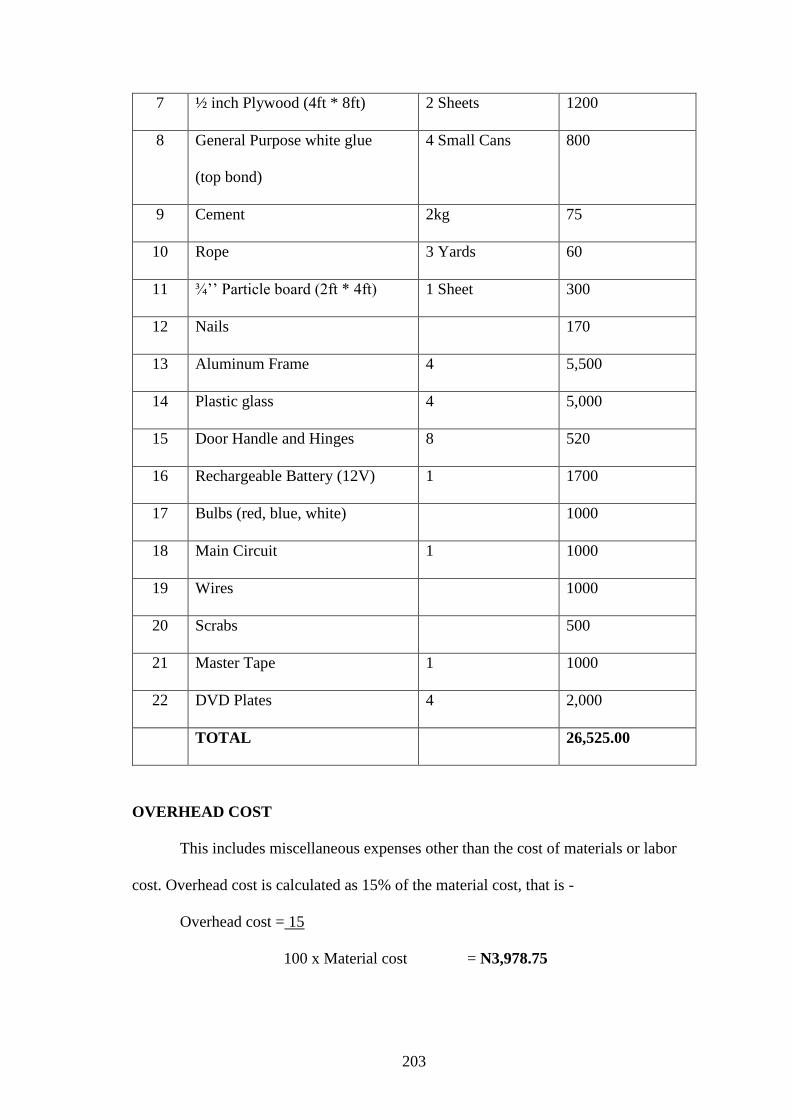
203
7 ½ inch Plywood (4ft * 8ft) 2 Sheets 1200
8 General Purpose white glue
(top bond)
4 Small Cans 800
9 Cement 2kg 75
10 Rope 3 Yards 60
11 ¾’’ Particle board (2ft * 4ft) 1 Sheet 300
12 Nails 170
13 Aluminum Frame 4 5,500
14 Plastic glass 4 5,000
15 Door Handle and Hinges 8 520
16 Rechargeable Battery (12V) 1 1700
17 Bulbs (red, blue, white) 1000
18 Main Circuit 1 1000
19 Wires 1000
20 Scrabs 500
21 Master Tape 1 1000
22 DVD Plates 4 2,000
TOTAL 26,525.00
OVERHEAD COST
This includes miscellaneous expenses other than the cost of materials or labor
cost. Overhead cost is calculated as 15% of the material cost, that is -
Overhead cost = 15
100 x Material cost = N3,978.75
204
LABOUR COST
This includes the expenses incurred from consultations, use of facilities and the
work done. Labour cost is calculated as 30% of the material cost, that is-
Labour Cost = 30
100 x Material Cost =N7,957.50
The total cost (T) is given by
T = M + O + L
Where M = Material Cost.
O = Overhead Cost.
L = Labour Cost.
Therefore T = 26,525.00 + N3,978.75 + N7,957.50= N38,461.25
The total cost of developing the models and Video (DVD) instructional package is Thirty
Eight thousand four hundred and sixty one naira twenty five kobo only (N38,461.25)
Comparing the cost of these locally developed instructional media with the imported
prototype shows that it is cost effective and affordable.

205
APPENDIX K
STRUCTURED BIOLOGY ACHIEVEMENT TEST (SBAT) AND THE
MARKING SCHEME
Dear Students, these questions are designed to carry out academic research on the
Evaluation of the Effects of Improvised Instructional Media on Niger State Secondary
School Student’s achievement in selected Biology concepts. All information provided
remains confidential, so we solicit for your co-operation towards the success of the
research.
STRUCTURED BIOLOGY ACHIEVEMENT TEST (SBAT)
SECTION A
PERSONAL DATA
INSTRUCTIONS
(a) Respond by filling or ticking the appropriate answer to the questions.
1 Name of the student
2. Name of the School:
3. Class:
4. Gender: Male female
4. Age: 10-15 1 16-20 21-25
SECTION B
MUITIPLE CHOICE OBJECTIVE TEST ITEMS (SBAT)
INSTRUCTIONS:
a. Please, read the questions carefully, each question is followed by five options
lettered A-E. Find out the correct option and circle it with pencil on the question paper.

206
b. Give only one answer to each item/question.
c. Erase any incorrect answers properly before choosing another option.
d. you are free to ask question for clearance in respect of any item on which you
need further explanations.
e. Answer all the questions
f. Time allowed is 40 minutes
1. The wall of the heart is made up of a thick muscle known as:-
A. Cardial Muscle.
B. Cardiac Muscle
C. Cardium Muscle
D. Carditis Muscle
E. Carditinum Muscle.
2. The left side of the heart forces blood to flow to all other tissues of the body
and back to the right side of the heart through vessels. This circulation is known
as:-
A. Capillaric circulation.
B. Systemic circulation
C. Pulmonary circulation
D. Veinary circulation.
E. Arternary circulation
3. The bicuspid valve is located between the
A. left auricle and left ventricle
B. aorta and left auricle
C. superior vena cava and inferior vana cava
D. right auricle and superior vana cava

207
E. right auricle and right ventricle.
4. The pulmonary artery carries
A. oxygenated blood from the lungs to the right auricle
B. oxygenated blood from the right ventricle to the lungs
C. oxygenated blood from the left ventricle to the right auricle
D. deoxygenated blood from the left ventricle to the lungs
E. deoxygenated blood from the right ventricle to the lungs
5. Which of the following blood vessels carry oxygenated blood into the heart?
A. Pulmonary artery
B. Aorta
C. Pulmonary vein
D. Anterior vena cava
E. Posterior vena cava
6. Which of these blood vessels transport blood from the small intestine to the
liver?
A. Hepatic portal vein
B. Renal artery
C. Aorta
D. Subclavian artery
E. Anterior vena cava
7. The heart is divided into the right and left halves by the
A. Tricuspid valve
B. Bicuspid valve
C. Septum
D. Semilunar valve
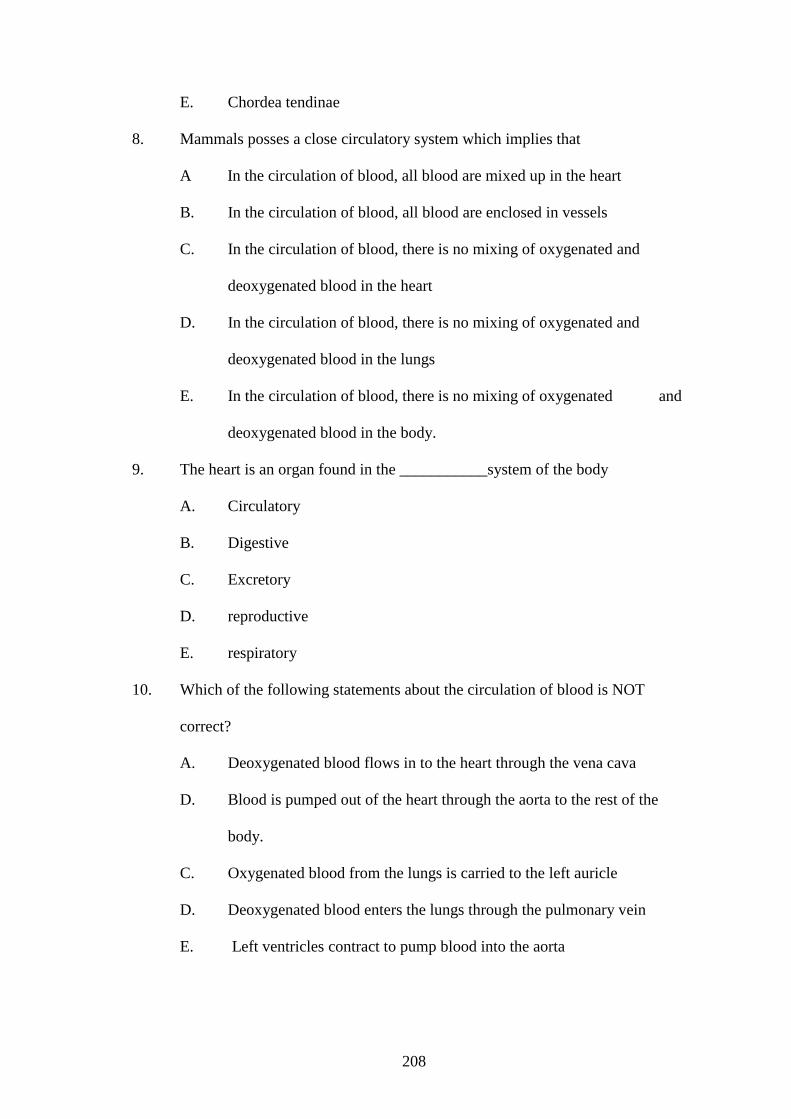
208
E. Chordea tendinae
8. Mammals posses a close circulatory system which implies that
A In the circulation of blood, all blood are mixed up in the heart
B. In the circulation of blood, all blood are enclosed in vessels
C. In the circulation of blood, there is no mixing of oxygenated and
deoxygenated blood in the heart
D. In the circulation of blood, there is no mixing of oxygenated and
deoxygenated blood in the lungs
E. In the circulation of blood, there is no mixing of oxygenated and
deoxygenated blood in the body.
9. The heart is an organ found in the ___________system of the body
A. Circulatory
B. Digestive
C. Excretory
D. reproductive
E. respiratory
10. Which of the following statements about the circulation of blood is NOT
correct?
A. Deoxygenated blood flows in to the heart through the vena cava
D. Blood is pumped out of the heart through the aorta to the rest of the
body.
C. Oxygenated blood from the lungs is carried to the left auricle
D. Deoxygenated blood enters the lungs through the pulmonary vein
E. Left ventricles contract to pump blood into the aorta

209
11. Two anterior venae cavae and posterior vena cava carry deoxygenated blood
froms all parts of the body except____________to the heart.
A. head
B. lungs
C. limbs
D. intestine
E. liver
The figure below is a longitudinal section of mammalian heart. Use it to answer
question 12-22
12. Which of the labelled structures stand for bicuspid valve?
A. V
B. ii
C. vi
D. i
E. iv
13 Which of the labelled structures carry oxygenated blood into the heart?
A. III
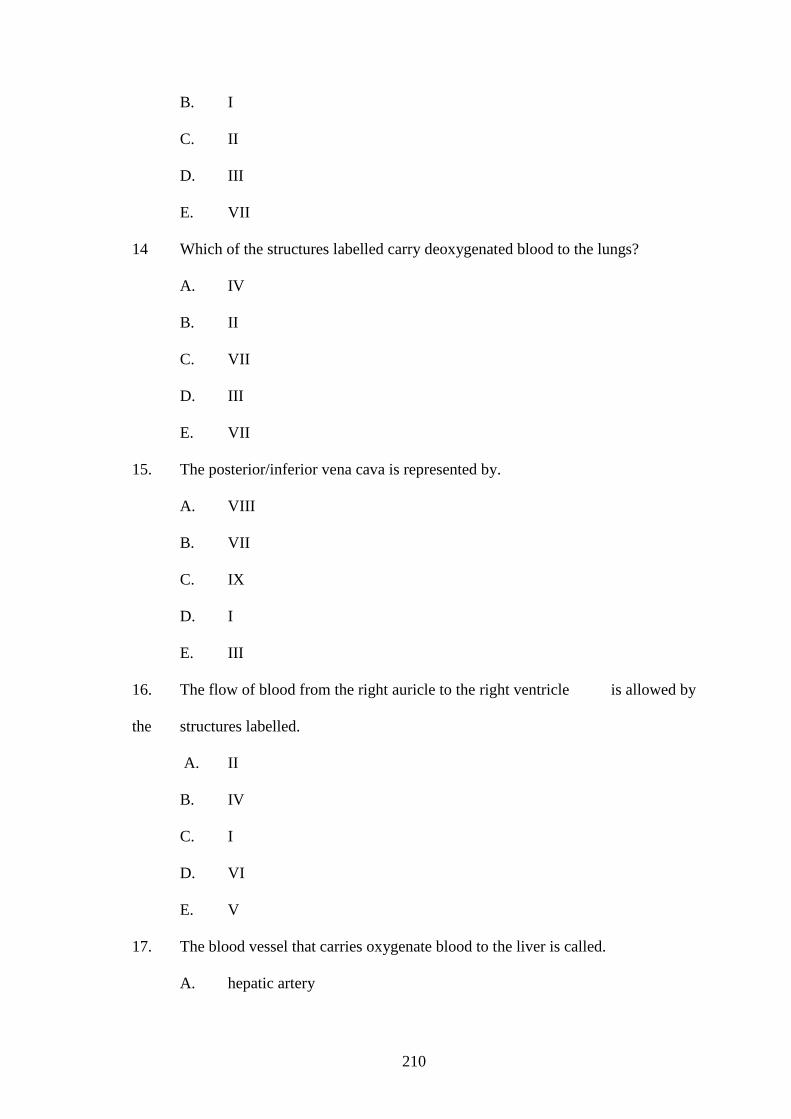
210
B. I
C. II
D. III
E. VII
14 Which of the structures labelled carry deoxygenated blood to the lungs?
A. IV
B. II
C. VII
D. III
E. VII
15. The posterior/inferior vena cava is represented by.
A. VIII
B. VII
C. IX
D. I
E. III
16. The flow of blood from the right auricle to the right ventricle is allowed by
the structures labelled.
A. II
B. IV
C. I
D. VI
E. V
17. The blood vessel that carries oxygenate blood to the liver is called.
A. hepatic artery
211
B. renal artery
C. iliac artery
D. iliac Veins
E. hepatic vein
18. Jugular veins carry deoxygenated blood away from ___________________part
of the body
A. Intestine
B. Head
C. Genital organs
D. Liver
E. Stomach
19. Filtered/ deoxygenated blood from the Kidney is carried back to the circulatory
system through the
A. hepatic portal vein
B. renal artery
C. renal vein
D. pulmonary vein
E. vena cava
The figure below is a cross section of the human kidney; use it to answers question 20-
22
212
20. In which of the following labelled structures will the glomerulus be found?
A. I
B. II
C. III
D. IV
E. VI
21. Which of the following labeled structures represent the pelvis?
A. I
B. IV
C. V
D. VI
E. II
22. Which of the following labeled structures represent the ureter?
A. II
B. III
C. IV
D. V1
E. V
23. The functional unit of the kidney is called
A. nephron
B. cortex
213
C. medulla
D. pelvis
E. ureter
24. The following parts of a nephron (urinary tubule) are found in the cortex of the
kidney except
A. Bowman’s capsule
B. Glomerulus,
C. The proximal tubule
D. Loop of Henle
E. Distal tubule.
25. The urinary system consists of
A. Two kidneys, two ureters, the urinary bladder and the urethra.
B. Two kidneys, a ureter, two urinary bladders and the urethra
C. A kidney, two ureters, two urinary bladders and the urethra
D. Two kidneys, a ureter, urinary bladder and the urethra
E. A kidney, a ureter, renal vein, pelvis
26. The cup-shaped part of the Bowman’s capsule contains the
A. nephridium
B. glomerulus
C. Ioop of Henle
D. nephron
E. Convoluted tubule
27. The outer edge of the kidney is convex while the inner edge is concave, at the
concave edge of the kidney lies a depression called
A. capsule

214
B. ureter
C. renal artery
D. hilum
E. renal vein
28. The blood vessels in the cavity of the Bowman’s capsule are collectively
known as:-
A. renal vein
B. renal arteries
C. glomerulus
D. renal capillaries
E. vena cava
29. Ultra filtration in the kidney takes place in the
A. Bowman’s capsule
B. Loop of Henle
C. pelvis
D. renal vein
E. pyramid
30. The kidney is connected to the urinary bladder by the
A. urethra
B. pelvic
C. renal artery
D. renal vein
E. ureter
31. All vertebrates have
A. A kidney
215
B. A pair of kidney
C. Two pairs of kidney
D. Three pairs of kidney
E. Four pairs of kidney.
32. The mechanism by which useful materials in the glomerular filtrate are taken
back into the blood is known as
A. filtration
B. selective reabsorption
C. heterolysis
D. osmosis
E. dialysis
33. Pulmonary circulation is the circulation
A. between the heart and the lungs
B. between the heart and the head
C. between the lungs and the head.
D. between the lungs and the liver
E. between pulmonary artery and the lungs
34. The kidney in mammals is located at
A. chest cavity and attached to the dorsal wall
B. cauvdal cavity and attached to the dorsal wall
C. abdominal cavity and attached to the dorsal wall
D. hip cavity and attached to the ventral wall
E. clavian cavity and attached to the dorsal wall.
35. Mammals are said to display a pattern of double circulation. This implies that
216
A. for one complete circulation, blood has to pass through the heart twice,
each time going through the same pathway.
b. for one complete circulation, blood has to pass through the heart twice,
each time going through a separate pathways.
C. for one complete circulation, blood has to pass through the heart many
times through separate pathways.
D. for one complete circulation blood has to pass through the heart once
through the same pathway.
E. for one complete circulation, blood has to pass through the heart once
through separate pathways.
36. During ultra filtration, these materials are filtered into Bowman’s capsule
EXCEPT
A. Water
B. Urea
C. Plasma protein
D. Mineral salts
E. Sugar
37. The following are adaptations of the mammalian heart to its functions EXCEPT.
A. It is divided unto four chambers
B. The chambers are separated by valves
C. Its walls are thick and muscular
D. The auricles have thin wall while ventricles have thicker walls.
E. The heart is dark colour and oval in shape.
38. The heart of an adult human at rest beats about__________ time’s per-minute
A. 50-70

217
B. 70-75
C. 75-80
D. 80-95
E. 35-50
39. Which of the following statements is NOT true of the systole phase of heart
beat?
A. The ventricles contract
B. The Ventricles force blood along aorta and pulmonary artery.
C. The auricles relax
D. The auricles contract
E. The auricles begin to fill up with blood
40. In an average man, the urge to urinate usually arises when about
________cm3 of urine have collected in the bladder
A. 100-200
B. 200-300
C. 50-100
D. 300-400
E. 100-150
MARKING SCHEME FOR SBAT
1. B
2. B
3. A
4. E
5. C
6. A
7. C
8. C

218
9. A
10. D
11. B
12. E
13. A
14. B
15. A
16. E
17. B
18. B
19. C
20. A
21. C
22. D
23. A
24. D
25. A
26. B
27. D
28. C
29. A
30. E
31. B
32. B
33. A
34. C
35. B
36. C
37. E
38. B
39. D
40. B
219
APPENDIX L
SAMPLE LESSON PLANS FOR EXPERIMENTAL AND CONTROL GROUPS
LESSON ONE FOR EXPERIMENTAL GROUP 1
Subject: Biology
Topic: Transport system
Sub- Topic: Blood Circulation
Class: SS II
Time: 80 Minutes (Double period)
Average age of students: 15years.
Behavioral Objectives: At the end of the lesson, the students should be able to;
1 Explain what transport system is.
2 Explain human blood circulation and circulatory system.
3 Mention the components of circulatory system.
4 Differentiate between open and close circulation.
5 Briefly describe the internal structure of the heart.
6 Differentiate between systolic and diastolic phases of heartbeat.
Instructional Materials: Developed models (heart structure and circulatory System)
Previous Knowledge: The students have learnt about blood groups. They also know that
they have blood and heart in their body. Specific questions that can reveal what the
students know and arouse their interest will be asked thus:-
(i) Hold the centre portion of your chest and explain what you feel
(ii) al portion of your chest and explain what you feel
(iii) Hold your wrist tightly and explain your observations.
(iv) Mention the types of blood corpuscles.

220
Introduction: An overview of what to be learnt in terms of knowledge and skills
objective of the lesson will be given.
Presentation
Step I: Transport system in animals is to be discussed and explained. Thus,
transport system in animals is the system through which food and energy needed
by cells of animals are supplied and waste products formed in the cells are
gotten rid of promptly. In man, transport system consists essentially of a single
hollow pumping structure (heart) connected to cylindrical branching tubes
(blood vessels) making up a system called circulatory system. The whole system
is filled with a liquid transport medium, the blood.
Step II: The concepts of blood circulation and circulatory system and blood
vessels are to be discussed and explained. Thus, blood is the medium for
transporting materials in complex organisms like man. It is the fluid, red in
colour due to presence of oxy-haemoglobin in the red blood cells. The blood
moves/circulates materials continuously round the body of animals. The
continuous movement of blood round the body is called blood circulation and
the system through which this movement occurs is called circulatory system.
This system thus, is the network through which blood circulates continuously
through the heart and blood vessels (arteries, arterioles, veins, venules and
capillaries). Arteries and Arterioles transport blood away from the heart to the
different parts of the body. While veins and venules transport blood from the
body back to the heart. Capillaries connect arterioles and the venules within the
body parts. The components of circulatory system thus are the heart and the
blood vessels. The model of circulatory system will be presented with emphasis
on the heart and blood vessels as the two major components. Names of various

221
parts of the circulatory system and their functions will be made clear from the
model.
Step III: The teacher explains open and close circulatory systems as follows-
Close circulatory system is the system where the blood vessels branch many
times into smaller units but eventually join up with other vessels connected to
the heart. In this system, blood is always confined within the cavities and never
in direct contact with cells of the body. In open circulatory system, the blood
vessels lead out of the heart and end in blood spaces within the blood cavity.
Here the blood comes into direct contact with the cells after which it is returned
to the heart.
Step IV: Using the illuminated model of the heart, the structure of the heart as the engine
house (pumping action) in the circulatory system will be discussed. The parts of the heart
and their functions will be explained with emphasis on the model as follows:
(a) Cardiac muscles – enables the heart to go on pumping
continuously.
(b) Septum – divides the heart into a right and left half with no
connection between the two.
(c) Left auricle and left ventricle – contain blood with oxygen
(oxygenated blood).
(d) Right auricle and right ventricle – contain blood without oxygen
(deoxygenated blood).
(e) Bicuspid valve – ensures that blood flows in one direction from
left auricle to left ventricle.
(f) Tricuspid valve – ensures that blood flows in one direction from
right auricle to right ventricle.
222
(g) Semi-lunar valves – ensures that blood flows in one direction from
left ventricle to aorta and from right ventricle to pulmonary artery.
(h) Aorta – Carries oxygenated blood to all parts of the body except
the lungs.
(i) Vena cava (posterior and interior) – return deoxygenated blood to
the heart from all parts of body except the lungs.
(j) Pulmonary artery – carries deoxygenated blood from the heart to
the lungs
(k) Pulmonary vein-returns oxygenated blood from the lungs to the
heart.
With the aid of the models, the students learn by identifying,
naming and stating the functions of the heart and the blood vessels.
This exercise continues until mastery is shown.
Step V: Using the model, the pumping action of the heart (diastolic and systolic phase)
will be explained
The teacher entertains questions from the students and clarifies areas of difficulty if any.
Evaluation: The teacher asks the students the following questions.
1. Explain transport system in animals
2. Differentiate between blood circulation and circulatory system.
3. Mention the two major components of the circulatory system.
4. Briefly describe the structure of human heart.
5. Describe systolic phase of heartbeat
223
Conclusion: The teacher summarizes the lesson with emphasis on identified areas
of difficulty.
LESSON TWO FOR EXPERIMENTAL GROUP 1
Subject: Biology
Topic: Blood Circulation
Class: SS II
Time: 80 MINUTES (Double period)
Average age of students: 15years.
Behavioral Objectives: At the end of the lesson, the students should be able to;
1 Explain blood circulation.
2 Discuss the procedure in the blood flow through circulatory system.
3 Explain double circulation and differentiate between pulmonary and
systemic circulation.
4 Explain the concept “closed circulation”.
5 State two blood vessels of pulmonary circulation, five bloods
Vessels of systemic circulation and their areas of operation structional
Materials: Developed models (heart structure and circulatory system) and
lecture method
Previous Knowledge: The students have learnt about circulatory system. They
also have learnt the structure and functioning of the heart. Specific questions
that can reveal what the students know will be asked thus:-
1 Mention the components of circulatory system.

224
2 Mention the names of the four chambers of the heart.
Introduction: An overview of what to be learnt in terms of knowledge and skills
objective of the lesson will be given.
Presentation
Step I: The concept of blood circulation and blood vessels will be clarified. The
continuous movement of blood round the body is called blood circulation.
The illuminated model of circulatory system will be used to explain the
procedure in the blood flow through the circulatory system.
Step II: The teacher explains the processes of close, open, double, systemic and
pulmonary circulations. Close circulation implies that there is no mixing of
oxygenated and deoxygenated blood in the heart. Oxygenated blood is confined
to the left side of the heart while deoxygenated blood is confined to the right
side. Double circulation implies that for one complete circulation, blood has to
pass through the heart twice, each time going through a separate path way. The
two path ways are referred to as the pulmonary circulation and the systemic
circulation. The sequence involved in double circulation is that blood from any
part of the body enters the heart for the first time, is then sent to the lungs for
oxygenation and from here is brought back to the heart for the second time
before it can be redistributed to all parts of the body. The pulmonary circulation
is between the heart and the lungs while systematic circulation is between the
heart and all parts of the body beside the lungs.
Step III: With the aid of the models, the teacher emphasizes on the blood vessels
of the systemic and pulmonary circulation and their areas of operation.
Thus:
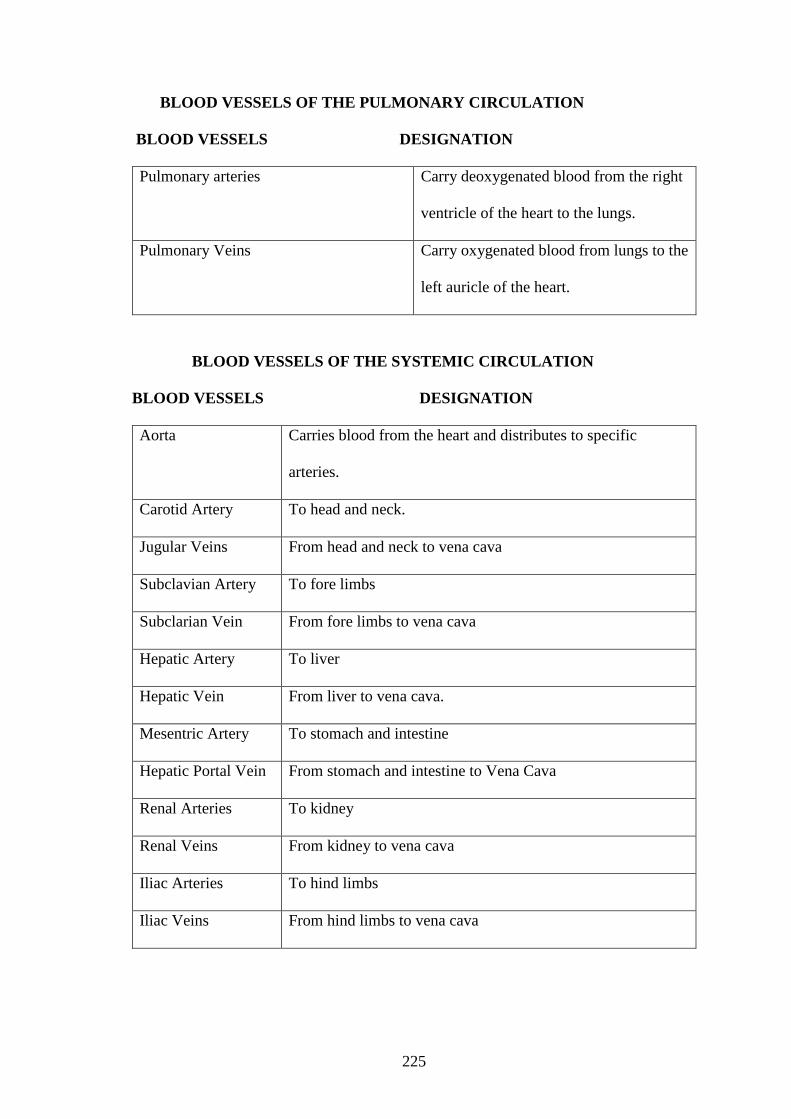
225
BLOOD VESSELS OF THE PULMONARY CIRCULATION
BLOOD VESSELS DESIGNATION
Pulmonary arteries Carry deoxygenated blood from the right
ventricle of the heart to the lungs.
Pulmonary Veins Carry oxygenated blood from lungs to the
left auricle of the heart.
BLOOD VESSELS OF THE SYSTEMIC CIRCULATION
BLOOD VESSELS DESIGNATION
Aorta Carries blood from the heart and distributes to specific
arteries.
Carotid Artery To head and neck.
Jugular Veins From head and neck to vena cava
Subclavian Artery To fore limbs
Subclarian Vein From fore limbs to vena cava
Hepatic Artery To liver
Hepatic Vein From liver to vena cava.
Mesentric Artery To stomach and intestine
Hepatic Portal Vein From stomach and intestine to Vena Cava
Renal Arteries To kidney
Renal Veins From kidney to vena cava
Iliac Arteries To hind limbs
Iliac Veins From hind limbs to vena cava
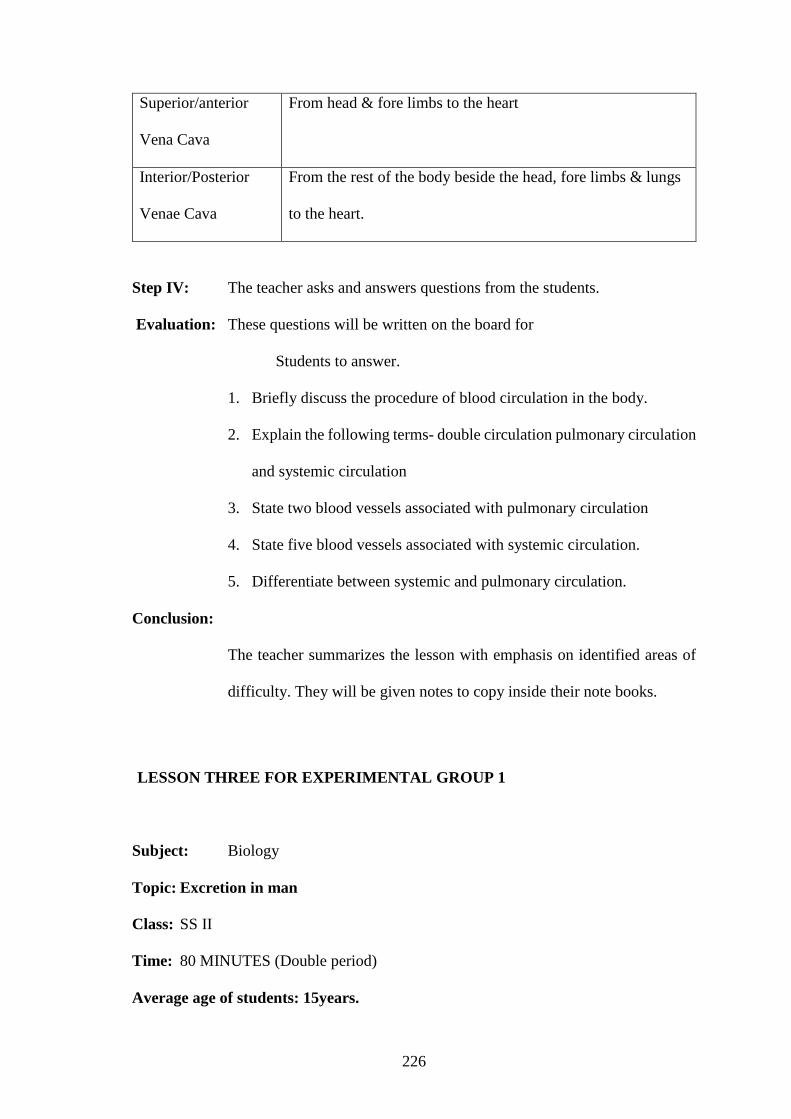
226
Superior/anterior
Vena Cava
From head & fore limbs to the heart
Interior/Posterior
Venae Cava
From the rest of the body beside the head, fore limbs & lungs
to the heart.
Step IV: The teacher asks and answers questions from the students.
Evaluation: These questions will be written on the board for
Students to answer.
1. Briefly discuss the procedure of blood circulation in the body.
2. Explain the following terms- double circulation pulmonary circulation
and systemic circulation
3. State two blood vessels associated with pulmonary circulation
4. State five blood vessels associated with systemic circulation.
5. Differentiate between systemic and pulmonary circulation.
Conclusion:
The teacher summarizes the lesson with emphasis on identified areas of
difficulty. They will be given notes to copy inside their note books.
LESSON THREE FOR EXPERIMENTAL GROUP 1
Subject: Biology
Topic: Excretion in man
Class: SS II
Time: 80 MINUTES (Double period)
Average age of students: 15years.
227
Behavioral Objectives: At the end of the lesson, the students should be able to;
1 Explain what excretion is.
2 Mention three excretory products in man and site of excretion.
3 List the components of excretory system.
4 Mention the parts as seen in longitudinal section through a
kidney.
5 List the components of a nephron.
2 Explain the mechanism of excretion by the kidney (Urine Production).
Instructional Materials:. Developed models (Excretory system and kidney nephron)
and lecture method.
Previous Knowledge: The students have learnt about circulation of blood. They also
have learnt the structure and functioning of the heart. Specific questions that can reveal
what the students know will be asked thus:-
1 Differentiate between systemic and pulmonary circulation.
2 State two blood vessels associated with pulmonary
Circulation
3 State five blood vessels associated with systemic.
Circulation
Introduction: An overview of what to be learnt in terms of knowledge and skills
objective of the lesson will be given.
Presentation
Step I: The concept of excretion, excretory products and their site of
removal are to be discussed and explained. Excretion is the removal of waste
products from the body of a living organism. The principal products excreted by
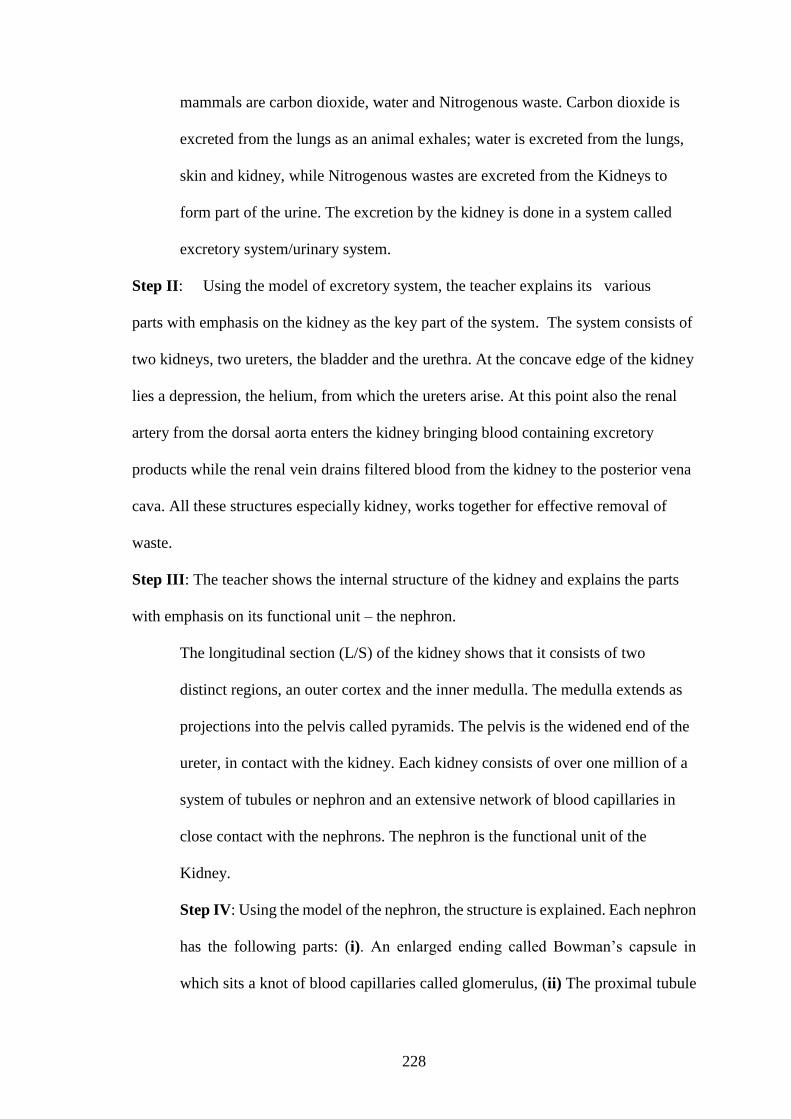
228
mammals are carbon dioxide, water and Nitrogenous waste. Carbon dioxide is
excreted from the lungs as an animal exhales; water is excreted from the lungs,
skin and kidney, while Nitrogenous wastes are excreted from the Kidneys to
form part of the urine. The excretion by the kidney is done in a system called
excretory system/urinary system.
Step II: Using the model of excretory system, the teacher explains its various
parts with emphasis on the kidney as the key part of the system. The system consists of
two kidneys, two ureters, the bladder and the urethra. At the concave edge of the kidney
lies a depression, the helium, from which the ureters arise. At this point also the renal
artery from the dorsal aorta enters the kidney bringing blood containing excretory
products while the renal vein drains filtered blood from the kidney to the posterior vena
cava. All these structures especially kidney, works together for effective removal of
waste.
Step III: The teacher shows the internal structure of the kidney and explains the parts
with emphasis on its functional unit – the nephron.
The longitudinal section (L/S) of the kidney shows that it consists of two
distinct regions, an outer cortex and the inner medulla. The medulla extends as
projections into the pelvis called pyramids. The pelvis is the widened end of the
ureter, in contact with the kidney. Each kidney consists of over one million of a
system of tubules or nephron and an extensive network of blood capillaries in
close contact with the nephrons. The nephron is the functional unit of the
Kidney.
Step IV: Using the model of the nephron, the structure is explained. Each nephron
has the following parts: (i). An enlarged ending called Bowman’s capsule in
which sits a knot of blood capillaries called glomerulus, (ii) The proximal tubule

229
(iii). U-shaped loop of Henle having descending limb and ascending limb and
(IV). The distal tubule which empties into a collecting tubule. All along its course,
the tubule is closely associated with several networks of blood capillaries.
Step v: With reference to the structure of the nephron the mechanism of excretion
will be discussed as follows: As blood brought to the kidney by the renal artery
flows through the glomerulus, high pressure is built majorly because the blood
vessel leading from the glomerulus is narrower than the vessel leading to it.
Consequently, substances in the blood such as nitrogenous waste, water mineral
salts, and glucose and plasma solutes are filtered into the Bowman’s capsule by a
process known as ultra-filtration to become glomerular filtrate. Other materials
like blood corpuscles and plasma protein which cannot filter through remain in
the blood streams. As the filtrate passes through the tubule many of the solutes
and water which are useful to the body are reabsorbed back into the blood
capillaries by a process known as selective re-absorption.
Specifically, as the filtrate passes through the proximal tubule, about 65%
(solute & water) of the filtrate volume is reabsorbed. In the descending limb of
Henle’s loop 15% of the filtrate volume is reabsorbed. In the distal tubule and
collecting duct, 19% of the filtrate volume is re-absorbed. This implies that as the
filtrate passes from proximal tubule to the collecting duct, about 99% of the
original filtrate volume is reabsorbed. These materials flow through the renal
veins to enter the general circulation.
Only 1% of the original filtrate volume remains as urine. Urine is mostly
water and contains organic waste products such as urea, uric acid and creatinine
as well as excess ions. The urine so formed trickles down the ureter and collects
in the bladder which stretches to accommodate it. When the bladder is full, the
230
urethral sphincter relaxes allowing the urine to pass out of the body through the
urethra.
Evaluation: The teacher answers questions from students and in turn asks them the
following questions.
1. What is excretion?
2. Mention three excretory products in the body and state their site of
removal
3. State any three components of excretory system.
4. Briefly describe the structure of the kidney as seen in its L/S.
Conclusion: The teacher summaries the lesson with emphasis on identified
areas of difficulties.
LESSON ONE FOR EXPERIMENTAL GROUP 2
Subject: Biology
Topic: Transport system
Sub- Topic: Blood Circulation
Class: SS II
Time: 80 Minutes (Double period)
Average age of students: 15years.
Behavioral Objectives: At the end of the lesson, the students should be able to;
1 Explain what transport system is.
2 Explain human blood circulation and circulatory system.
231
3 Mention the components of circulatory system.
4 Differentiate between open and close circulation.
5 Briefly describe the internal structure of the heart.
7 Differentiate between systolic and diastolic phases of heartbeat.
Instructional Materials: Video DVD instructional package
Previous Knowledge: The students have learnt about blood groups. They also know that
they have blood and heart in their body.
Introduction: An overview of what to be learnt in terms of knowledge and skills
objective of the lesson will be given. The lesson is introduced in a way as to arouse the
interest of the students.
Presentation
Step I: The video DVD instructional package will display the narrations on
transport systems in animals as it is linked to human blood circulation and
excretion and as it is different from other means of transport. The teacher views
the instructional package along with the students as the narration goes on in this
way- transport system in animals is the system through which food and energy
needed by cells of animals are supplied and waste products formed in the cells
are gotten rid of promptly. In man, transport system consists essentially of a
single hollow pumping structure (heart) connected to cylindrical branching
tubes (blood vessels) making up a system called circulatory system. The whole
system is filled with a liquid transport medium, the blood.
Step II: It will be made clear to the viewers (students) that the lesson will mostly be
focused on circulatory system for a better understanding of blood
circulation in the next lesson. The package continues with narrations on
the concepts of blood, blood circulation, circulatory system and blood
232
vessels. This procedure is to make students see the link between them,
thus, blood is the medium for transporting materials in complex organisms
like man while blood circulation is the continuous movement of blood in
the circulatory system round the body. Circulatory system thus, is the
network through which blood circulates needed materials continuously to
the different parts of the body. The components of circulatory system are
the heart and the blood vessels (arteries, arterioles, veins, venules and
capillaries). Differences between arteries, veins, close and open
circulation will be pointed out.
Step III. The model of illuminated circulatory system will be displayed on the screen
with the narration emphasizing on the heart and blood vessels. Names of
various parts of the circulatory system and their functions will be made
clear from the model. The teacher pauses and rewinds the tape at intervals
to allow for clarification and mastery on the parts of the student and for
emphasis if any by the teacher.
Step IV: With the model of the illuminated heart on the screen,the narration on the
structures of the heart and their functions will continue like this;- The heart
of all mammals is cone shaped, made up of special muscles known as
cardiac muscles and enveloped in a thin pericardium. Using the illumination
procedure, the structure is explained as follows-
The heart is divided into two halves (right and left half) by a central wall
called septum. Each half has two chambers, upper chambers, the auricles and
lower chambers, the ventricles. This gives rise to four chambers known as the
left auricle, the left ventricle, the right auricle and right ventricle. Between the
left auricle and left ventricle is a valve known as bicuspid valve and between

233
right auricle and right ventricle is the tricuspid valve. From left ventricle
originates the aorta and from right ventricle originates pulmonary artery. On the
inner walls of the aorta and pulmonary artery are the semi lunar valves. Entering
the left auricle are the pulmonary veins and entering the right auricle are the
venea cavea. The functions of the features in the heart will be clarified.
(a) Cardiac muscles – enables the heart to go on pumping
continuously.
(b) Septum – divides the heart into a right and left half with no
connection between the two.
(c) Left auricle and left ventricle – contain blood with oxygen
(oxygenated blood).
(d) Right auricle and right ventricle – contain blood without oxygen
(deoxygenated blood).
(e) Bicuspid valve – ensures that blood flows in one direction from
left auricle to left ventricle.
(f) Tricuspid valve – ensures that blood flows in one direction from
right auricle to right ventricle.
(g) Semi-lunar valves – ensures that blood flows in one direction from
left ventricle to aorta and from right ventricle to pulmonary artery.
(h) Aorta – Carries oxygenated blood to all parts of the body except
the lungs.
(i) Vena cava (posterior and interior) – return deoxygenated blood to
the heart from all parts of body except the lungs.
(j) Pulmonary artery – carries deoxygenated blood from the heart to
the lungs
234
(k) Pulmonary vein-returns oxygenated blood from the lungs to the
heart.
Step V: The narration on the functioning of the heart (diastolic and systolic phases)
continues thus - At the Diastole stage, the two auricles contract, creating a high
pressure in the blood contained in them. This pressure causes the bicuspid and tricuspid
valves to open so allowing blood to flow from auricles into the ventricles. Thus,
deoxygenated blood enters the right ventricle and oxygenated blood enters the left
ventricle. When the ventricles are filled up, the cuspid valves close up.
At the systole stage, the two ventricles contract, force open the Semi-lunar valves
and the blood flows into the two trunks of the main arteries (pulmonary artery and the
aorta). While this is happening, blood from the body is filling up the auricles again. The
first stage (diastole) of the next heart beat then follows after a short lapse of time and
the cycle repeats itself
Evaluation: The teacher entertains questions from the students and clarifies areas of
difficulty by pausing, rewinding, and fast forward the DVD package for the student’s
mastering of the lesson and for further clarifications by the teacher.
These questions will be displayed on the screen for students to answer.
1 Explain transport system in animals
2 Differentiate between blood circulation and circulatory system.
3 Mention any five components of the circulatory system.
4 Briefly describe the structure of human heart.
5 Describe systolic phase of heartbeat
6 State the names of any three arteries and corresponding veins that enter
and leave any three named parts of the body.
7 Differentiate between systemic and pulmonary circulation.

235
Conclusion: The teacher clarifies any identified difficulties in the DVD
instructional package.
LESSON TWO FOR EXPERIMENTAL GROUP 2
Subject: Biology
Topic: Blood Circulation
Class: SS II
Time: 80 MINUTES (Double period)
Average age of students: 15years.
Behavioral Objectives: At the end of the lesson, the students should be able to;
1 Explain what blood circulation is.
2 Discuss the procedure in the blood flow through circulatory system.
3 Explain double circulation and differentiate between pulmonary and
systemic circulation.
4 Explain the concept “closed circulation”.
5 State two blood vessels of pulmonary circulation, five blood
Vessels of systemic circulation and their areas of operation
Instructional Materials: Video DVD instructional package
Previous Knowledge: The students have learnt about circulatory system. They also have
learnt the structure and functioning of the heart. Specific questions that can reveal what
the students know will be asked thus:-
1 Mention the components of circulatory system.
2 Mention the names of the four chambers of the heart.
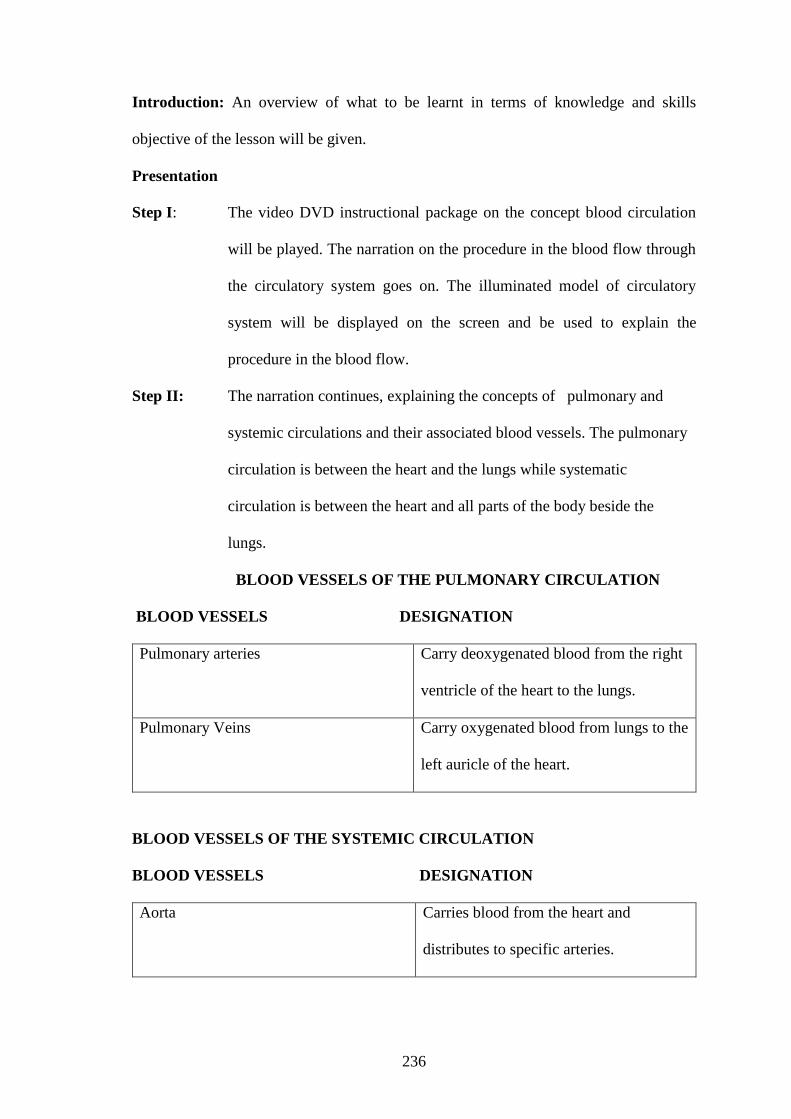
236
Introduction: An overview of what to be learnt in terms of knowledge and skills
objective of the lesson will be given.
Presentation
Step I: The video DVD instructional package on the concept blood circulation
will be played. The narration on the procedure in the blood flow through
the circulatory system goes on. The illuminated model of circulatory
system will be displayed on the screen and be used to explain the
procedure in the blood flow.
Step II: The narration continues, explaining the concepts of pulmonary and
systemic circulations and their associated blood vessels. The pulmonary
circulation is between the heart and the lungs while systematic
circulation is between the heart and all parts of the body beside the
lungs.
BLOOD VESSELS OF THE PULMONARY CIRCULATION
BLOOD VESSELS DESIGNATION
Pulmonary arteries Carry deoxygenated blood from the right
ventricle of the heart to the lungs.
Pulmonary Veins Carry oxygenated blood from lungs to the
left auricle of the heart.
BLOOD VESSELS OF THE SYSTEMIC CIRCULATION
BLOOD VESSELS DESIGNATION
Aorta Carries blood from the heart and
distributes to specific arteries.
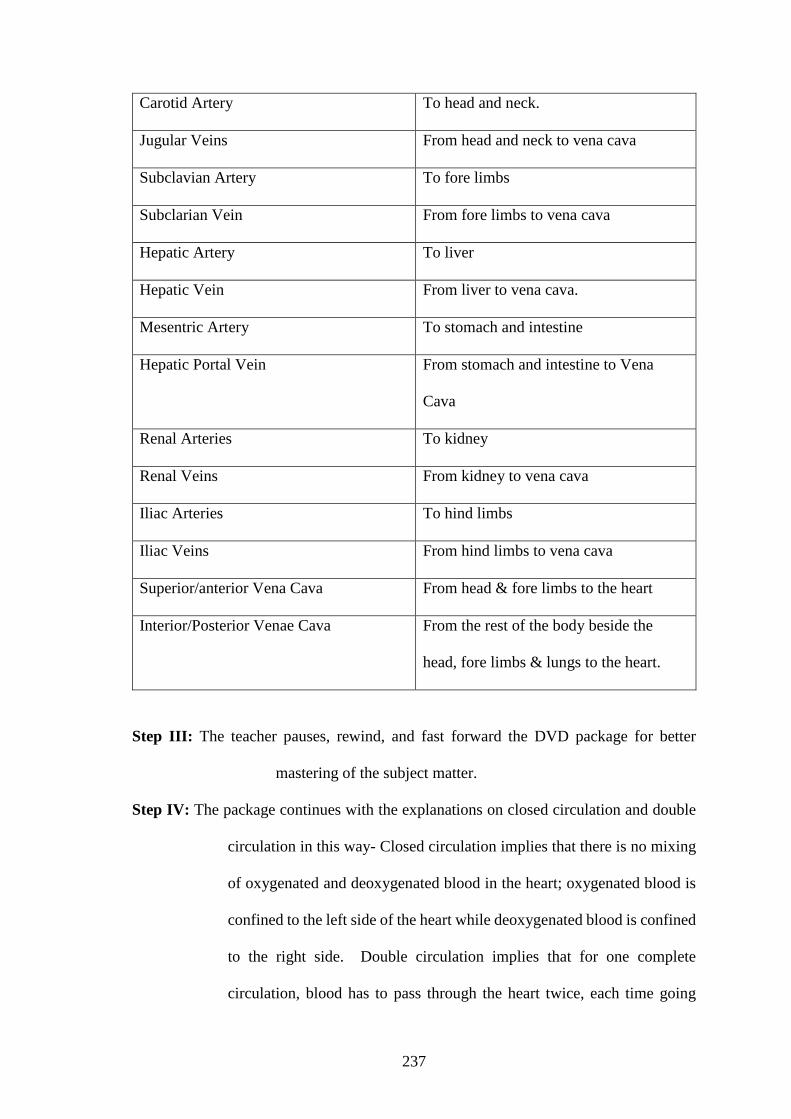
237
Carotid Artery To head and neck.
Jugular Veins From head and neck to vena cava
Subclavian Artery To fore limbs
Subclarian Vein From fore limbs to vena cava
Hepatic Artery To liver
Hepatic Vein From liver to vena cava.
Mesentric Artery To stomach and intestine
Hepatic Portal Vein From stomach and intestine to Vena
Cava
Renal Arteries To kidney
Renal Veins From kidney to vena cava
Iliac Arteries To hind limbs
Iliac Veins From hind limbs to vena cava
Superior/anterior Vena Cava From head & fore limbs to the heart
Interior/Posterior Venae Cava From the rest of the body beside the
head, fore limbs & lungs to the heart.
Step III: The teacher pauses, rewind, and fast forward the DVD package for better
mastering of the subject matter.
Step IV: The package continues with the explanations on closed circulation and double
circulation in this way- Closed circulation implies that there is no mixing
of oxygenated and deoxygenated blood in the heart; oxygenated blood is
confined to the left side of the heart while deoxygenated blood is confined
to the right side. Double circulation implies that for one complete
circulation, blood has to pass through the heart twice, each time going
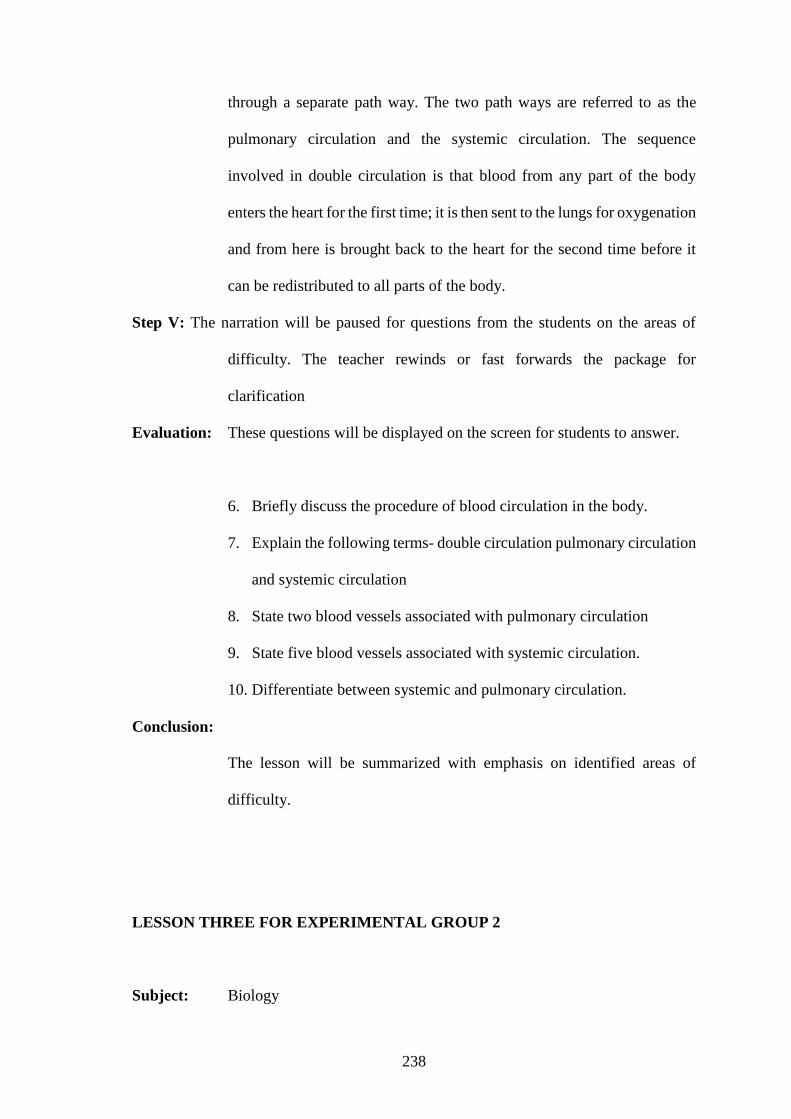
238
through a separate path way. The two path ways are referred to as the
pulmonary circulation and the systemic circulation. The sequence
involved in double circulation is that blood from any part of the body
enters the heart for the first time; it is then sent to the lungs for oxygenation
and from here is brought back to the heart for the second time before it
can be redistributed to all parts of the body.
Step V: The narration will be paused for questions from the students on the areas of
difficulty. The teacher rewinds or fast forwards the package for
clarification
Evaluation: These questions will be displayed on the screen for students to answer.
6. Briefly discuss the procedure of blood circulation in the body.
7. Explain the following terms- double circulation pulmonary circulation
and systemic circulation
8. State two blood vessels associated with pulmonary circulation
9. State five blood vessels associated with systemic circulation.
10. Differentiate between systemic and pulmonary circulation.
Conclusion:
The lesson will be summarized with emphasis on identified areas of
difficulty.
LESSON THREE FOR EXPERIMENTAL GROUP 2
Subject: Biology
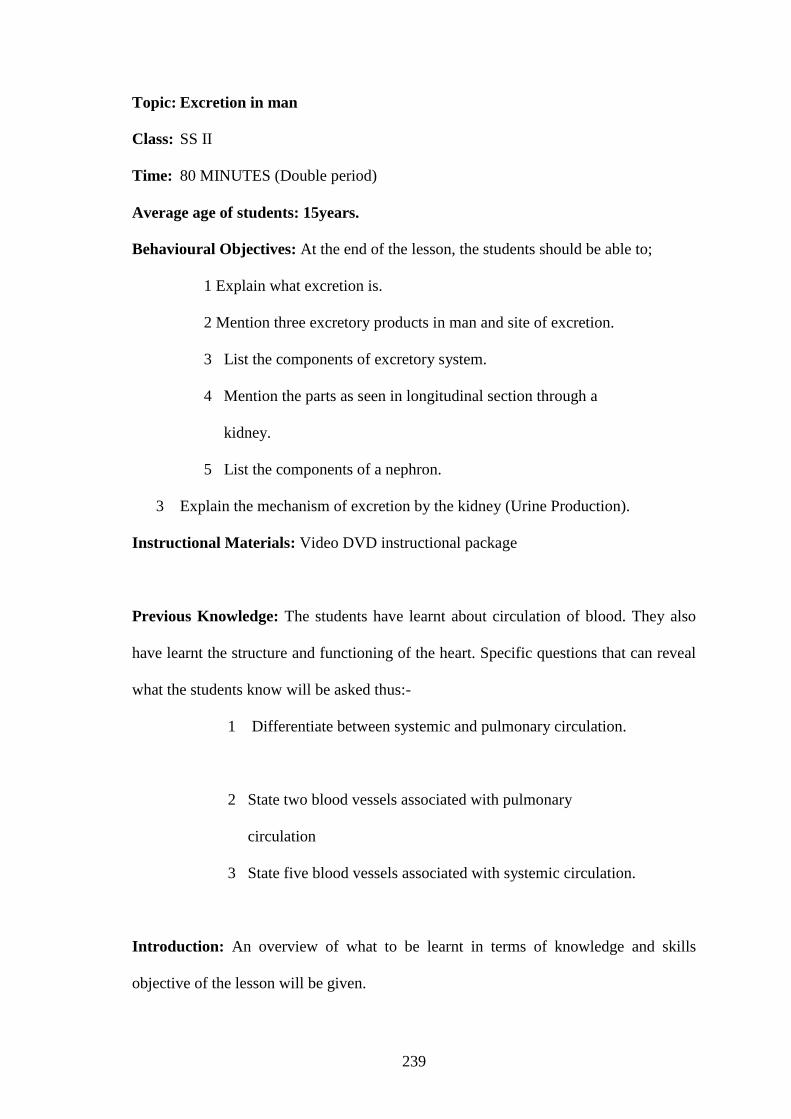
239
Topic: Excretion in man
Class: SS II
Time: 80 MINUTES (Double period)
Average age of students: 15years.
Behavioural Objectives: At the end of the lesson, the students should be able to;
1 Explain what excretion is.
2 Mention three excretory products in man and site of excretion.
3 List the components of excretory system.
4 Mention the parts as seen in longitudinal section through a
kidney.
5 List the components of a nephron.
3 Explain the mechanism of excretion by the kidney (Urine Production).
Instructional Materials: Video DVD instructional package
Previous Knowledge: The students have learnt about circulation of blood. They also
have learnt the structure and functioning of the heart. Specific questions that can reveal
what the students know will be asked thus:-
1 Differentiate between systemic and pulmonary circulation.
2 State two blood vessels associated with pulmonary
circulation
3 State five blood vessels associated with systemic circulation.
Introduction: An overview of what to be learnt in terms of knowledge and skills
objective of the lesson will be given.
240
Presentation
Step I: The video DVD instructional narration on excretion, excretory products and
their sites of removal will be on this way; excretion is the removal of waste products
from the body of a living organism. The principal products excreted by mammals are
carbon dioxide, water and Nitrogenous waste. Carbon dioxide is excreted from the
lungs as an animal exhales; water is excreted from the lungs, skin and kidney, while
Nitrogenous wastes are excreted from the Kidneys to form part of the urine. The
excretion by the kidney is done in a system called excretory system/urinary system.
Step II: Displaying the model of excretory system on the screen, the narration on its
various parts will continue with emphasis on the kidney as the key part of the system.
The system consists of two kidneys, two ureters, the bladder and the urethra. At the
concave edge of the kidney lies a depression, the helium, from which the ureters arise.
At this point also the renal artery from the dorsal aorta enters the kidney bringing blood
containing excretory products while the renal vein drains filtered blood from the kidney
to the posterior vena cava. All these structures especially kidney, works together for
effective removal of waste.
Step III: The narration continues on the explanations of the internal structure of the
kidney with emphasis on its functional unit – the nephron. Thus - The longitudinal
section (L/S) of the kidney shows that it consists of two distinct regions, an outer cortex
and the inner medulla. The medulla extends as projections into the pelvis called
pyramids. The pelvis is the widened end of the ureter, in contact with the kidney. Each
kidney consists of over one million of a system of tubules or nephron and an extensive
network of blood capillaries in close contact with the nephrons. The nephron is the
functional unit of the Kidney. The model of the nephron, will be displayed as the
241
narration on its structure continues thus: Each nephron has the following parts: (i). An
enlarged ending called Bowman’s capsule in which sits a knot of blood capillaries
called glomerulus, (ii) The proximal tubule (iii). U-shaped loop of Henle having
descending limb and ascending limb and (IV). The distal tubule which empties into a
collecting tubule leading to the pelvis. All along its course, the tubule is closely
associated with several networks of blood capillaries.
Step IV : With reference to the structure of the nephron, narration on the mechanism of
excretion will follow in this way - as blood brought to the kidney by the renal artery
flows through the glomerulus, high pressure is built majorly because the blood vessel
leading from the glomerulus is narrower than the vessel leading to it. Consequently,
substances in the blood such as nitrogenous waste, water mineral salts, and glucose and
plasma solutes are filtered into the Bowman’s capsule by a process known as ultra-
filtration to become glomerular filtrate. Other materials like blood corpuscles and
plasma protein which cannot filter through remain in the blood streams. As the filtrate
passes through the tubule many of the solutes and water which are useful to the body
are reabsorbed back into the blood capillaries by a process known as selective re-
absorption.
Specifically, as the filtrate passes through the proximal tubule, about 65%
(solute & water) of the filtrate volume is reabsorbed. In the descending limb of Henle’s
loop 15% of the filtrate volume is reabsorbed. In the distal tubule and collecting duct,
19% of the filtrate volume is re-absorbed. This implies that as the filtrate passes from
proximal tubule to the collecting duct, about 99% of the original filtrate volume is
reabsorbed. These materials flow through the renal veins to enter the general
circulation.
242
Only 1% of the original filtrate volume remains as urine. Urine is mostly water and
contains organic waste products such as urea, uric acid and creatinine as well as excess
ions. The urine so formed trickles down the ureter and collects in the bladder which
stretches to accommodate it. When the bladder is full, the urethral sphincter relaxes
allowing the urine to pass out of the body through the urethra.
Evaluation: Questions will be entertained from the students and then the following
questions will be displayed on the screen for students to answer.
5. What is excretion?
6. Mention three excretory products in the body and state their site of
removal
7. State any three components of excretory system.
8. Briefly describe the structure of the kidney as seen in its L/S.
Conclusion: The teacher rewinds, fast forward, and pauses as required by the
students.
LESSON ONE FOR CONTROL GROUP
243
Subject: Biology
Topic: Transport system
Sub- Topic: Blood Circulation
Class: SS II
Time: 80 Minutes (Double period)
Average age of students: 15years.
Behavioral Objectives: At the end of the lesson, the students should be able to;
1 Explain what transport system is.
2 Explain human blood circulation and circulatory system.
3 Mention the components of circulatory system.
4 Differentiate between open and close circulation.
5 Briefly describe the internal structure of the heart.
8 Differentiate between systolic and diastolic phases of heartbeat.
Instructional Materials: Modern Biology, Introduction to Biology and lecture method.
Previous Knowledge: The students have learnt about blood groups. They also know that
they have blood and heart in their body. Specific questions that can reveal what the
students know and arouse their interest will be asked thus:-
(v) Hold the central portion of your chest and explain what you feel
(vi) Hold your wrist tightly and explain your observations.
(vii) Mention the types of blood corpuscles.
Introduction: An overview of what to be learnt in terms of knowledge and skills
objective of the lesson will be given.
Presentation

244
Step I: Transport system in animals is to be discussed and explained. Thus,
transport system in animals is the system through which food and energy needed
by cells of animals are supplied and waste products formed in the cells are
gotten rid of promptly. In man, transport system consists essentially of a single
hollow pumping structure (heart) connected to cylindrical branching tubes
(blood vessels) making up a system called circulatory system. The whole system
is filled with a liquid transport medium, the blood.
Step II: The concepts of blood, blood circulation, circulatory system and blood
vessels are to be explained. Thus, blood is the medium for transporting materials
in complex organisms like man. It is the fluid, red in colour due to presence of
oxy-haemoglobin in the red blood cells. The blood moves/circulates materials
continuously round the body of animals. The continuous movement of blood
round the body is called blood circulation and the system through which this
movement occurs is called circulatory system. This system thus, is the network
through which blood circulates continuously through the heart and blood vessels
(arteries, arterioles, veins, venules and capillaries). Arteries and Arterioles
transport blood away from the heart to the different parts of the body. While
veins and venules transport blood from the body back to the heart. Capillaries
connect arterioles and the venules within the body parts. The components of
circulatory system thus are the heart and the blood vessels. The model of
circulatory system will be presented with emphasis on the heart and blood
vessels as the two major components. Names of various parts of the circulatory
system and their functions will be made clear from the model.

245
Step III: The teacher explains open and close circulatory systems as follows-
Close circulatory system is the system where the blood vessels branch many
times into smaller units but eventually join up with other vessels connected to
the heart. In this system, blood is always confined within the cavities and never
in direct contact with cells of the body. In open circulatory system, the blood
vessels lead out of the heart and end in blood spaces within the blood cavity.
Here the blood comes into direct contact with the cells after which it is returned
to the heart.
Step IV: Using diagram of the heart, the structure of the heart as the engine house
(pumping action) in the circulatory system will be discussed. The parts of the heart and
their functions will be explained with emphasis on the model as follows:
(l) Cardiac muscles – enables the heart to go on pumping
continuously.
(m) Septum – divides the heart into a right and left half with no
connection between the two.
(n) Left auricle and left ventricle – contain blood with oxygen
(oxygenated blood).
(o) Right auricle and right ventricle – contain blood without oxygen
(deoxygenated blood).
(p) Bicuspid valve – ensures that blood flows in one direction from
left auricle to left ventricle.
(q) Tricuspid valve – ensures that blood flows in one direction from
right auricle to right ventricle.

246
(r) Semi-lunar valves – ensures that blood flows in one direction from
left ventricle to aorta and from right ventricle to pulmonary artery.
(s) Aorta – Carries oxygenated blood to all parts of the body except
the lungs.
(t) Vena cava (posterior and interior) – return deoxygenated blood to
the heart from all parts of body except the lungs.
(u) Pulmonary artery – carries deoxygenated blood from the heart to
the lungs
(v) Pulmonary vein-returns oxygenated blood from the lungs to the
heart.
With the aid of the models, the students learn by identifying,
naming and stating the functions of the heart and the blood vessels.
This exercise continues until mastery is shown.
Step V: Using the diagram, the pumping action of the heart (diastolic and systolic phase)
will be explained
The teacher entertains questions from the students and clarifies areas of difficulty if any.
Evaluation: The teacher asks the students the following questions.
6. Explain transport system in animals
7. Differentiate between blood circulation and circulatory system.
8. Mention the two major components of the circulatory system.
9. Briefly describe the structure of human heart.
10. Describe systolic phase of heartbeat
247
Conclusion: The teacher summarizes the lesson with emphasis on identified areas of
difficulty.
LESSON TWO FOR CONTROL GROUP
Subject: Biology
Topic: Blood Circulation
Class: SS II
Time: 80 MINUTES (Double period)
Average age of students: 15years.
Behavioural Objectives: At the end of the lesson, the students should be able to;
1 Explain what blood circulation is.
2 Discuss the procedure in the blood flow through circulatory system.
3 Explain double circulation and differentiate between pulmonary and
systemic circulation.
4 Explain the concept “closed circulation”.
5 State two blood vessels of pulmonary circulation, five blood
Vessels of systemic circulation and their areas of operation
Instructional Materials: Modern Biology, introduction to biology and lecture method.
Previous Knowledge: The students have learnt about blood groups. They also know that
they have blood and heart in their body. Specific questions that can reveal what the
students know will be asked thus:-

248
1. Mention the components of circulatory system.
2 Mention the names of the four chambers of the heart.
Introduction: An overview of what to be learnt in terms of knowledge and skills
objective of the lesson will be given.
Presentation
Step I: The concept of blood circulation and blood vessels will be clarified. The
continuous movement of blood round the body is called blood circulation.
The diagram of circulatory system will be used to explain the procedure
in the blood flow through the circulatory system.
Step II: The teacher explains the processes of close, open, double, systemic and
pulmonary circulations. Close circulation implies that there is no mixing of
oxygenated and deoxygenated blood in the heart. Oxygenated blood is confined
to the left side of the heart while deoxygenated blood is confined to the right
side. Double circulation implies that for one complete circulation, blood has to
pass through the heart twice, each time going through a separate path way. The
two path ways are referred to as the pulmonary circulation and the systemic
circulation. The sequence involved in double circulation is that blood from any
part of the body enters the heart for the first time, is then sent to the lungs for
oxygenation and from here is brought back to the heart for the second time
before it can be redistributed to all parts of the body. The pulmonary circulation
is between the heart and the lungs while systematic circulation is between the
heart and all parts of the body beside the lungs.
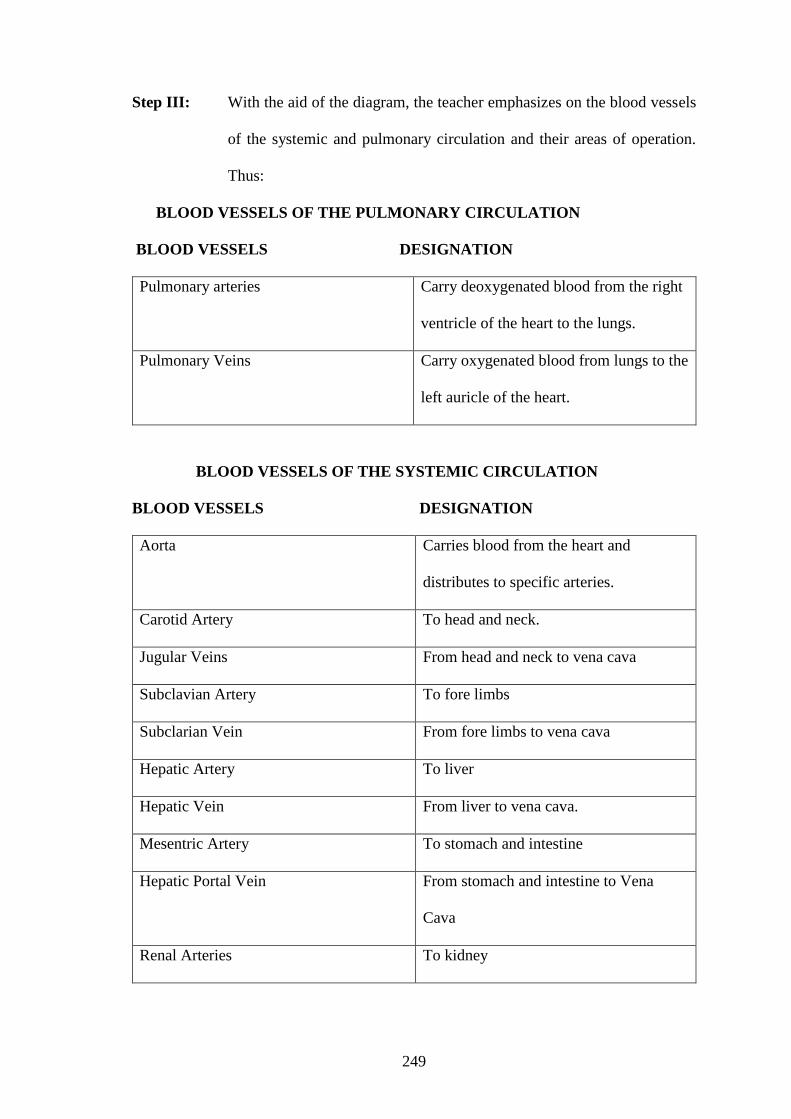
249
Step III: With the aid of the diagram, the teacher emphasizes on the blood vessels
of the systemic and pulmonary circulation and their areas of operation.
Thus:
BLOOD VESSELS OF THE PULMONARY CIRCULATION
BLOOD VESSELS DESIGNATION
Pulmonary arteries Carry deoxygenated blood from the right
ventricle of the heart to the lungs.
Pulmonary Veins Carry oxygenated blood from lungs to the
left auricle of the heart.
BLOOD VESSELS OF THE SYSTEMIC CIRCULATION
BLOOD VESSELS DESIGNATION
Aorta Carries blood from the heart and
distributes to specific arteries.
Carotid Artery To head and neck.
Jugular Veins From head and neck to vena cava
Subclavian Artery To fore limbs
Subclarian Vein From fore limbs to vena cava
Hepatic Artery To liver
Hepatic Vein From liver to vena cava.
Mesentric Artery To stomach and intestine
Hepatic Portal Vein From stomach and intestine to Vena
Cava
Renal Arteries To kidney
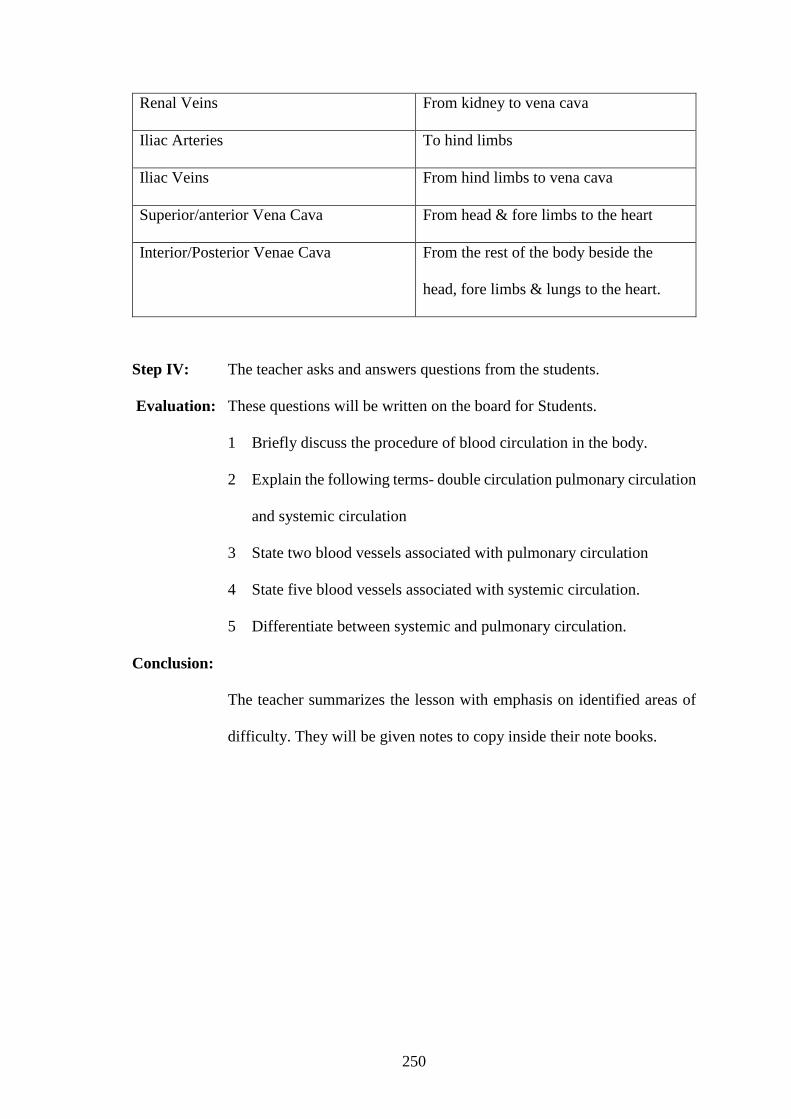
250
Renal Veins From kidney to vena cava
Iliac Arteries To hind limbs
Iliac Veins From hind limbs to vena cava
Superior/anterior Vena Cava From head & fore limbs to the heart
Interior/Posterior Venae Cava From the rest of the body beside the
head, fore limbs & lungs to the heart.
Step IV: The teacher asks and answers questions from the students.
Evaluation: These questions will be written on the board for Students.
1 Briefly discuss the procedure of blood circulation in the body.
2 Explain the following terms- double circulation pulmonary circulation
and systemic circulation
3 State two blood vessels associated with pulmonary circulation
4 State five blood vessels associated with systemic circulation.
5 Differentiate between systemic and pulmonary circulation.
Conclusion:
The teacher summarizes the lesson with emphasis on identified areas of
difficulty. They will be given notes to copy inside their note books.

251
LESSON THREE FOR CONTROL GROUP
Subject: Biology
Topic: Excretion in man
Class: SS II
Time: 80 MINUTES (Double period)
Average age of students: 15years.
Behavioral Objectives: At the end of the lesson, the students should be able to;
1 Explain what excretion is.
2 Mention three excretory products in man and site of excretion from the
body.
3 List the components of excretory system.
4 Mention the parts as seen in longitudinal section through a kidney.
5 List the components of a nephron.
6 Explain the mechanism of excretion by the kidney (Urine
Production).
Instructional Materials:. Developed models (Excretory system and kidney nephron)
and lecture method.
Previous Knowledge: The students have learnt about circulation of blood. They also
have learnt the structure and functioning of the heart. Specific questions that can reveal
what the students know will be asked thus:-
8 Differentiate between systemic and pulmonary circulation.
2 State two blood vessels associated with pulmonary
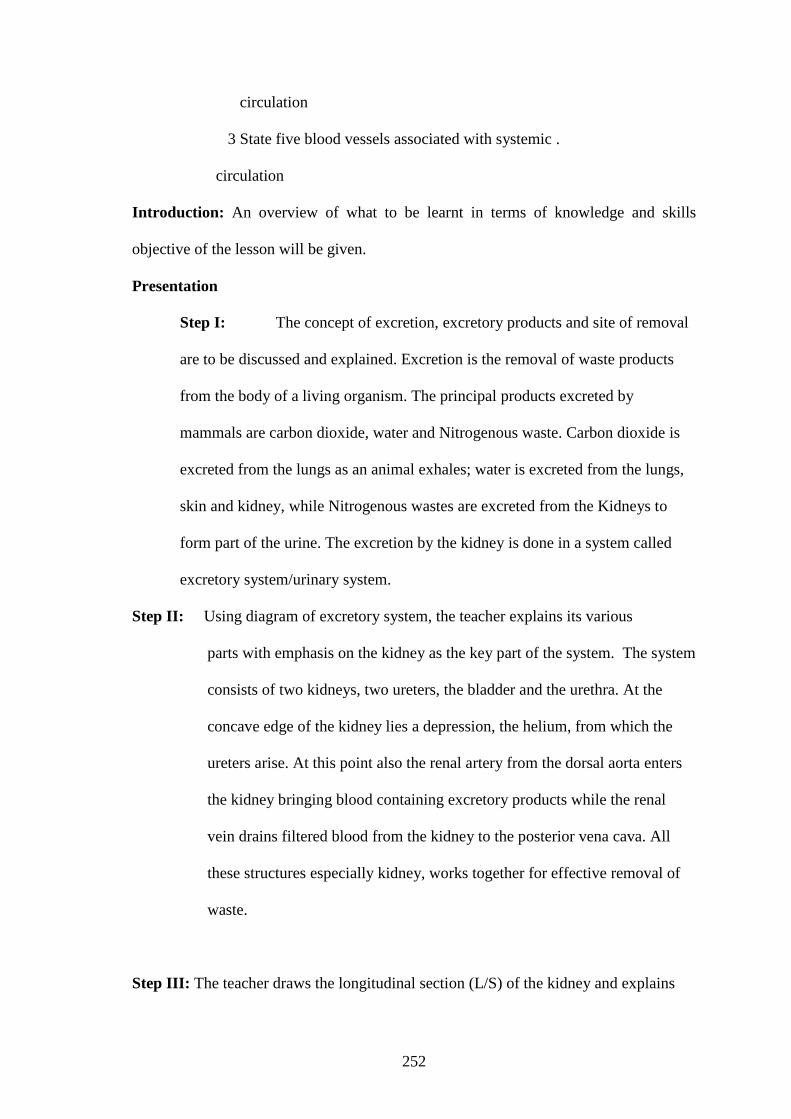
252
circulation
3 State five blood vessels associated with systemic .
circulation
Introduction: An overview of what to be learnt in terms of knowledge and skills
objective of the lesson will be given.
Presentation
Step I: The concept of excretion, excretory products and site of removal
are to be discussed and explained. Excretion is the removal of waste products
from the body of a living organism. The principal products excreted by
mammals are carbon dioxide, water and Nitrogenous waste. Carbon dioxide is
excreted from the lungs as an animal exhales; water is excreted from the lungs,
skin and kidney, while Nitrogenous wastes are excreted from the Kidneys to
form part of the urine. The excretion by the kidney is done in a system called
excretory system/urinary system.
Step II: Using diagram of excretory system, the teacher explains its various
parts with emphasis on the kidney as the key part of the system. The system
consists of two kidneys, two ureters, the bladder and the urethra. At the
concave edge of the kidney lies a depression, the helium, from which the
ureters arise. At this point also the renal artery from the dorsal aorta enters
the kidney bringing blood containing excretory products while the renal
vein drains filtered blood from the kidney to the posterior vena cava. All
these structures especially kidney, works together for effective removal of
waste.
Step III: The teacher draws the longitudinal section (L/S) of the kidney and explains
253
the parts with emphasis on its functional unit – the nephron. The (L/S) of the
kidney shows that it consists of two distinct regions, an outer cortex and the
inner medulla. The medulla extends as projections into the pelvis called
pyramids. The pelvis is the widened end of the ureter, in contact with the
kidney. Each kidney consists of over one million of a system of tubules or
nephron and an extensive network of blood capillaries in close contact with the
nephrons. The nephron is the functional unit of the Kidney.
Step 1v : Using the diagram of the nephron, the structure is explained. Each
nephron has the following parts: (i). An enlarged ending called Bowman’s
capsule in which sits a knot of blood capillaries called glomerulus, (ii) The
proximal tubule (iii). U-shaped loop of Henle having descending limb and
ascending limb and (IV). The distal tubule which empties into a collecting
tubule leading to the pelvis. All along its course, the tubule is closely associated
with several networks of blood capillaries.
Step v: With reference to the structure of the nephron the mechanism of
excretion will be discussed as follows: As blood brought to the kidney by the
renal artery flows through the glomerulus, high pressure is built majorly because
the blood vessel leading from the glomerulus is narrower than the vessel leading
to it. Consequently, substances in the blood such as nitrogenous waste, water
mineral salts, and glucose and plasma solutes are filtered into the Bowman’s
capsule by a process known as ultra-filtration to become glomerular filtrate.
Other materials like blood corpuscles and plasma protein which cannot filter
through remain in the blood streams. As the filtrate passes through the tubule
many of the solutes and water which are useful to the body are reabsorbed back
into the blood capillaries by a process known as selective re-absorption.
254
Specifically, as the filtrate passes through the proximal tubule, about 65%
(solute & water) of the filtrate volume is reabsorbed. In the descending limb of
Henle’s loop 15% of the filtrate volume is reabsorbed. In the distal tubule and
collecting duct, 19% of the filtrate volume is re-absorbed. This implies that as
the filtrate passes from proximal tubule to the collecting duct, about 99% of the
original filtrate volume is reabsorbed. These materials flow through the renal
veins to enter the general circulation.
Only 1% of the original filtrate volume remains as urine. Urine is mostly water and
contains organic waste products such as urea, uric acid and creatinine as well as excess
ions. The urine so formed trickles down the ureter and collects in the bladder which
stretches to accommodate it. When the bladder is full, the urethral sphincter relaxes
allowing the urine to pass out of the body through the urethra.
Evaluation: The teacher answers questions from students and in turn asks them the
following questions.
1 What is excretion?
2 Mention three excretory products in the body and state their site of
removal
3 State any three components of excretory system.
4 Briefly describe the structure of the kidney as seen in its L/S.
Conclusion: The teacher summaries the lesson with emphasis on identified
areas of difficulties.
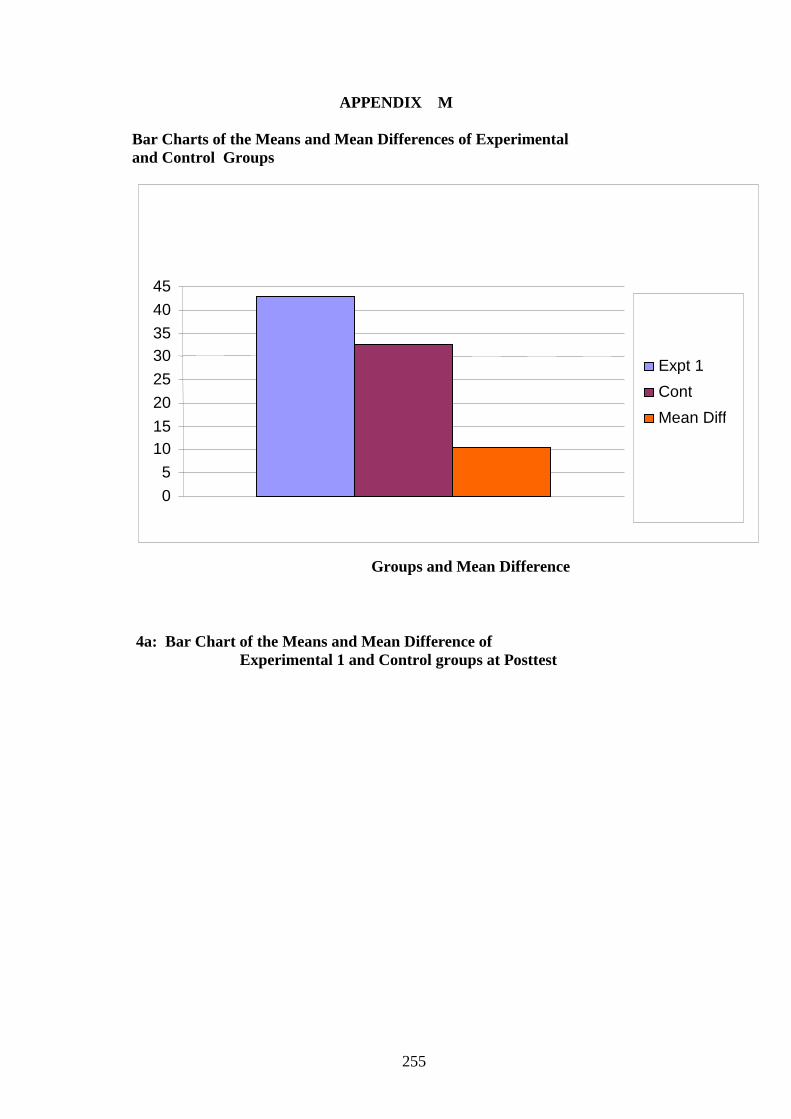
255
APPENDIX M
Bar Charts of the Means and Mean Differences of Experimental
and Control Groups
4a: Bar Chart of the Means and Mean Difference of
Experimental 1 and Control groups at Posttest
0
5
10
15
20
25
30
35
40
45
Expt 1
Cont
Mean Diff
Groups and Mean Difference
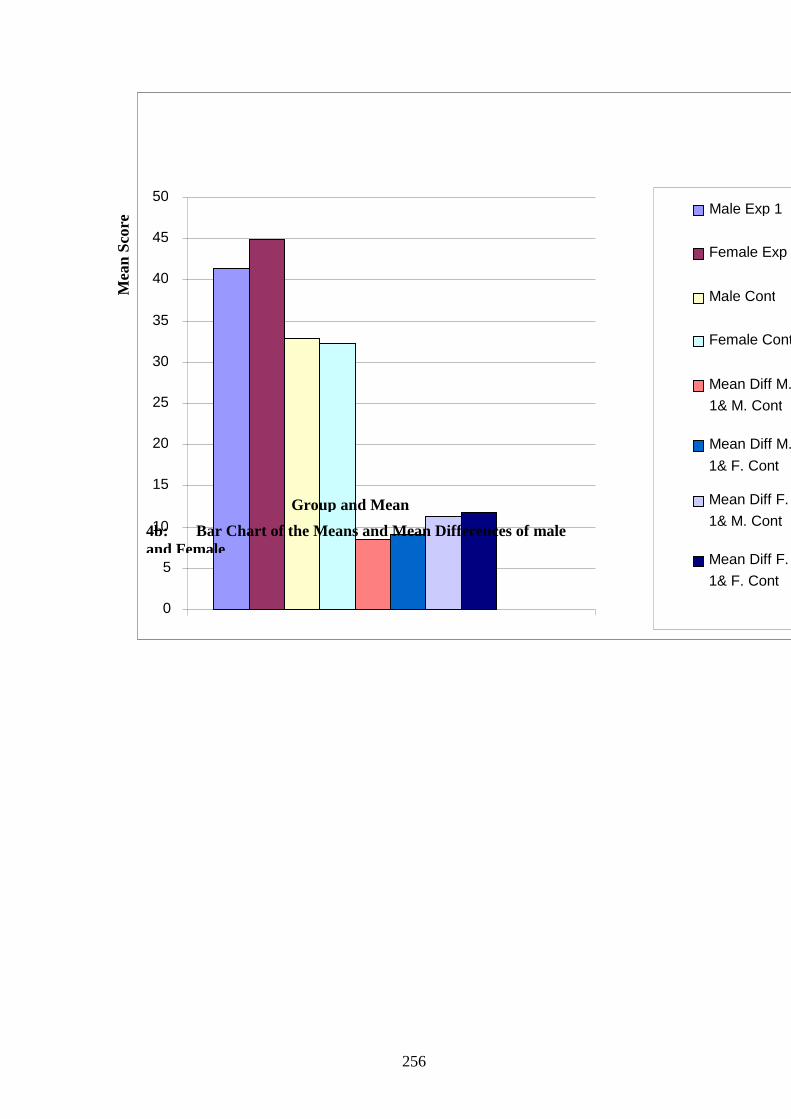
256
0
5
10
15
20
25
30
35
40
45
50 Male Exp 1
Female Exp 1
Male Cont
Female Cont
Mean Diff M. Exp
1& M. Cont
Mean Diff M. Exp
1& F. Cont
Mean Diff F. Exp
1& M. Cont
Mean Diff F. Exp
1& F. Cont
Mea
n S
core
Group and Mean
Difference 4b: Bar Chart of the Means and Mean Differences of male
and Female
Experimental 1 and Control Groups at Posttest
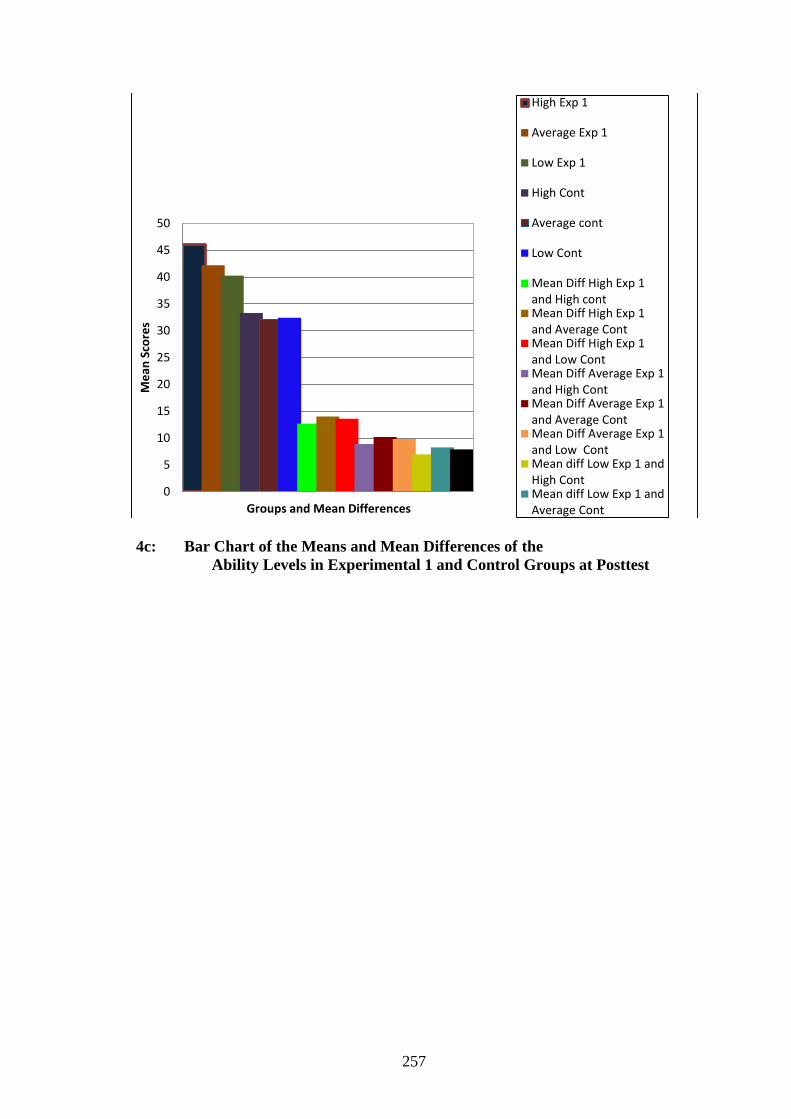
257
4c: Bar Chart of the Means and Mean Differences of the
Ability Levels in Experimental 1 and Control Groups at Posttest
0
5
10
15
20
25
30
35
40
45
50
Me
an S
core
s
Groups and Mean Differences
High Exp 1
Average Exp 1
Low Exp 1
High Cont
Average cont
Low Cont
Mean Diff High Exp 1and High contMean Diff High Exp 1and Average ContMean Diff High Exp 1and Low ContMean Diff Average Exp 1and High ContMean Diff Average Exp 1and Average ContMean Diff Average Exp 1and Low ContMean diff Low Exp 1 andHigh ContMean diff Low Exp 1 andAverage Cont
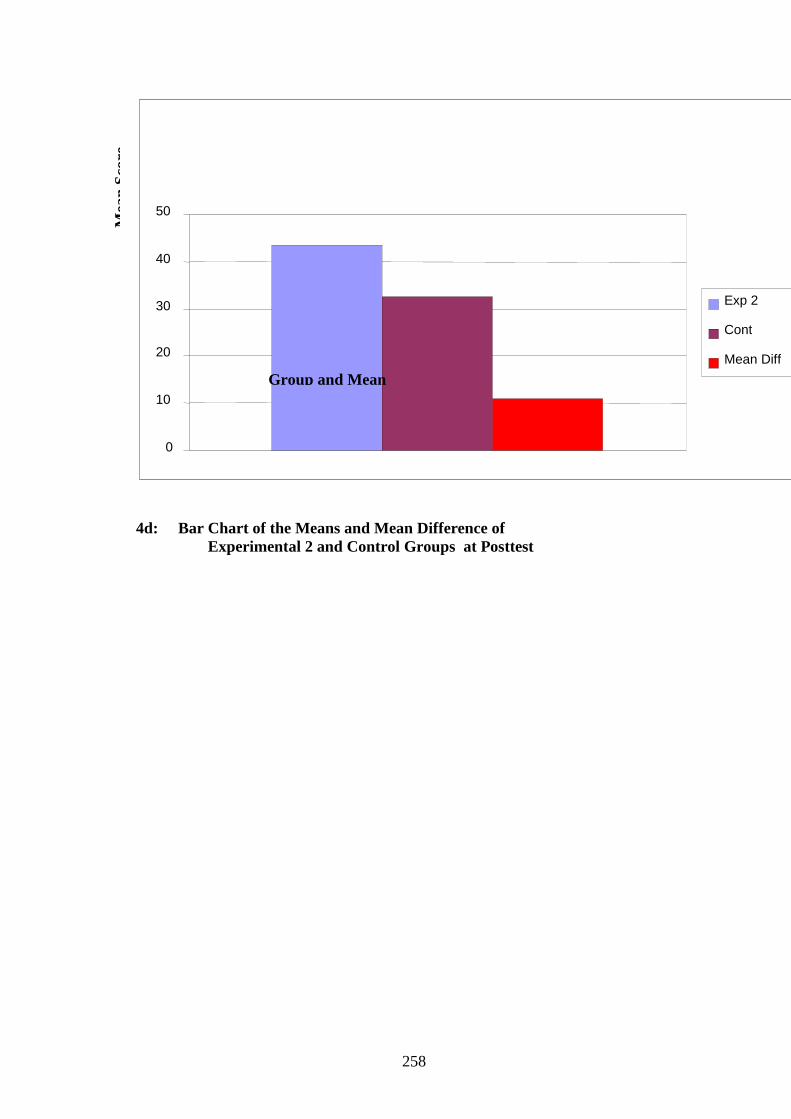
258
4d: Bar Chart of the Means and Mean Difference of
Experimental 2 and Control Groups at Posttest
0
10
20
30
40
50
Exp 2
Cont
Mean Diff
Group and Mean
Difference
Mea
n S
core
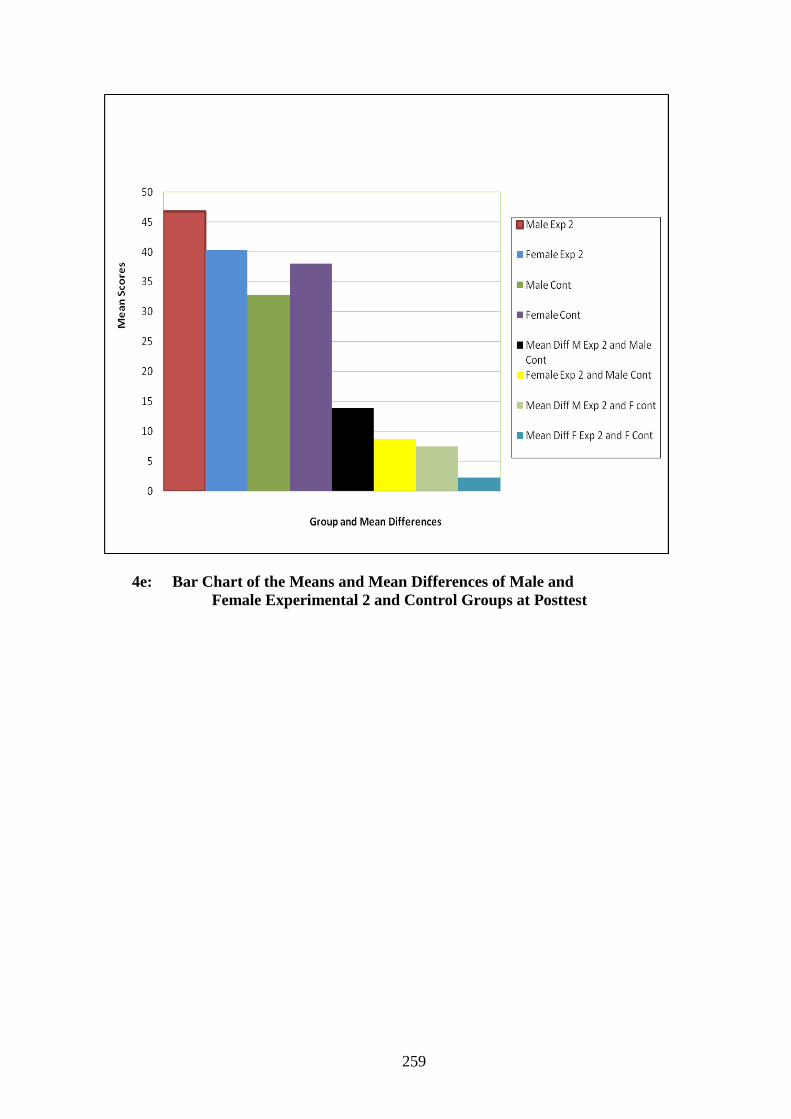
259
4e: Bar Chart of the Means and Mean Differences of Male and
Female Experimental 2 and Control Groups at Posttest
ty Level Experimental 2 and Control Groups at Posttest
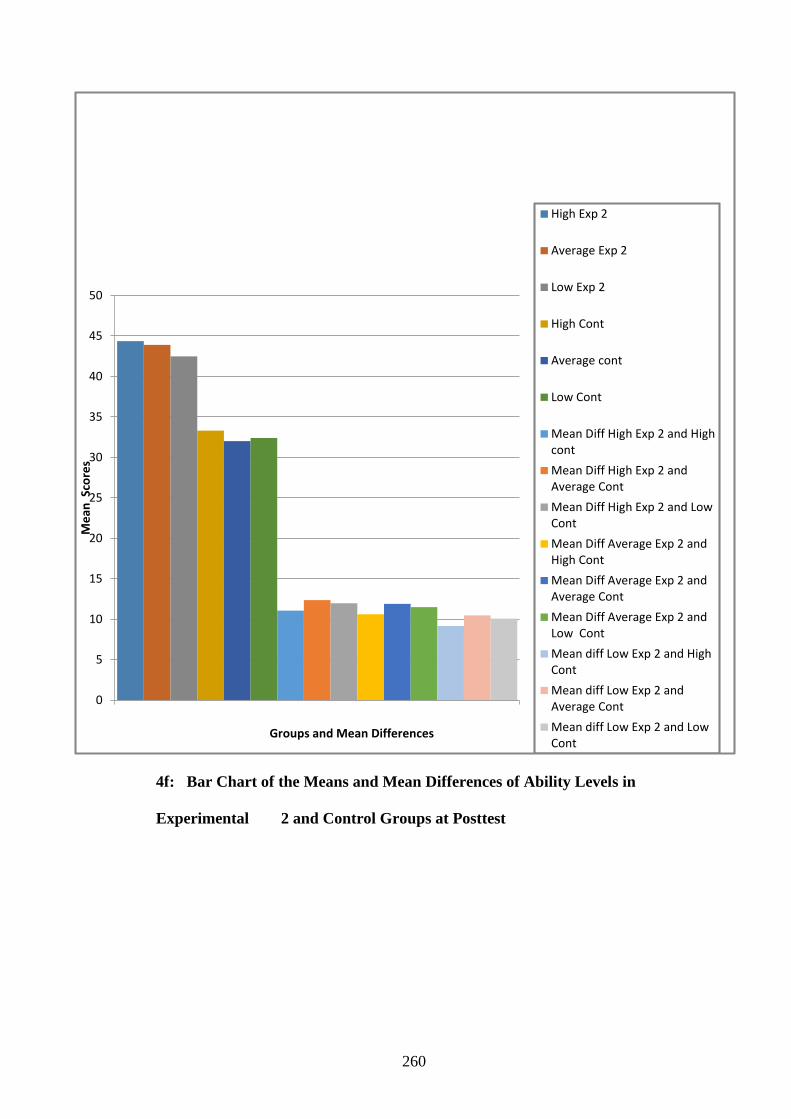
260
4f: Bar Chart of the Means and Mean Differences of Ability Levels in
Experimental 2 and Control Groups at Posttest
0
5
10
15
20
25
30
35
40
45
50
Me
an S
core
s
Groups and Mean Differences
High Exp 2
Average Exp 2
Low Exp 2
High Cont
Average cont
Low Cont
Mean Diff High Exp 2 and Highcont
Mean Diff High Exp 2 andAverage Cont
Mean Diff High Exp 2 and LowCont
Mean Diff Average Exp 2 andHigh Cont
Mean Diff Average Exp 2 andAverage Cont
Mean Diff Average Exp 2 andLow Cont
Mean diff Low Exp 2 and HighCont
Mean diff Low Exp 2 andAverage Cont
Mean diff Low Exp 2 and LowCont
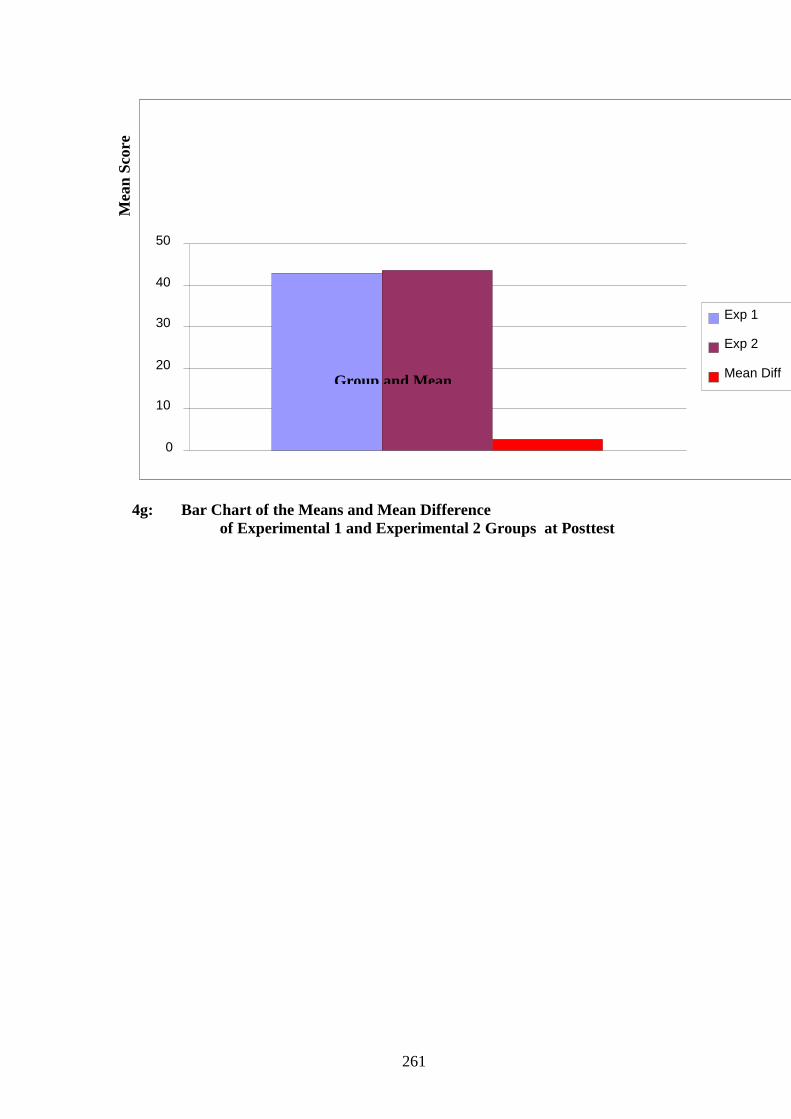
261
4g: Bar Chart of the Means and Mean Difference
of Experimental 1 and Experimental 2 Groups at Posttest
0
10
20
30
40
50
Exp 1
Exp 2
Mean Diff Group and Mean
Difference
Mea
n S
core
Recommended


