Ž .Lithos 48 1999 237–262
Erosion of lithospheric mantle beneath the East African Riftsystem: geochemical evidence from the Kivu volcanic province
Tanya Furman a,), David Graham b
a Department of Geosciences, The PennsylÕania State UniÕersity, UniÕersity Park, PA 16802, USAb College of Oceanic and Atmospheric Sciences, Oregon State UniÕersity, CorÕallis, OR 97331, USA
Received 20 April 1998; received in revised form 9 February 1999; accepted 10 February 1999
Abstract
This study presents new major and trace element and Sr–Nd isotopic results for a suite of Miocene–Recent mafic lavasfrom the Kivu volcanic province in the western branch of the East African Rift. These lavas exhibit a very wide range inchemical and isotopic characteristics, due to a lithospheric mantle source region that is heterogeneous on a small scale,probably -1 km. The chemical and isotopic variations are mostly geographically controlled: lavas from Tshibinda volcano,
87 86 Ž .which lies on a rift border fault on the northwestern margin of the province, have higher values of Srr Sr, LarSm ,nŽ . 87 86 Ž .BarNb, and ZrrHf than the majority of Kivu Bukavu samples. The range of Srr Sr at Tshibinda 0.70511–0.70514
overlaps some compositions found in the neighboring Virunga province, while Bukavu group lavas include the lowest87 86 Ž . Ž .Srr Sr 0.70314 and highest ´ q7.6 yet measured in western rift lavas. The Tshibinda compositions trend towards aNd
convergence for Sr–Nd–Pb isotopic values among western rift lavas. Among Kivu lavas, variations in 143Ndr144NdŽ .correlate with those for certain incompatible trace element ratios e.g., ThrNb, ZrrHf, LarNb, BarRb , with Tshibinda
samples defining one compositional extreme. There are covariations of isotopic and trace element ratios in mafic lavas of theEast African Rift system that vary systematically with geographic location. The lavas represent a magmatic sampling of
Ž .variations in the underlying continental lithospheric mantle, and it appears that a common lithospheric mantle CLM sourceis present beneath much of the East African Rift system. This source contains minor amphibole and phlogopite, probably dueto widespread metasomatic events between 500 and 1000 Ma. Lava suites which do not show a strong component of theCLM source, and for which the chemical constraints also suggest the shallowest magma formation depths, are the Bukavugroup lavas from Kivu and basanites from Huri Hills, Kenya. The inferred extent of lithospheric erosion therefore appears tobe significant only beneath these two areas, which is generally consistent with lithospheric thickness variations estimatedfrom gravity and seismic studies. q 1999 Elsevier Science B.V. All rights reserved.
Keywords: East African Rift system; Kivu volcanic province; Lithospheric mantle; Basalt geochemistry; Continental rifting
1. Introduction
Ž .The subcontinental lithospheric mantle SCLMcomprises the basal part of the Earth’s outer rigidmechanical boundary layer, and may also represent a
) Corresponding author
chemical andror thermal boundary layer in the shal-Ž .lowest mantle Harry and Leeman, 1995 . The SCLM
can contain old portions of mantle with distinctivetrace element and isotope characteristics, due to pro-longed isolation from underlying asthenospheric con-
Ž .vection McDonough, 1990 . It is thought to haveoriginated and evolved as a residue of ancient partial
0024-4937r99r$ - see front matter q 1999 Elsevier Science B.V. All rights reserved.Ž .PII: S0024-4937 99 00031-6
( )T. Furman, D. GrahamrLithos 48 1999 237–262238
melting followed by the polybaric crystallization ofŽsilicate melts and hydrous fluids Hawkesworth et
.al., 1990 . Direct evidence on its composition comesfrom mantle xenoliths entrained in continental lavas.The small size and limited spatial distribution ofxenoliths, however, may not provide an accuraterepresentation of regional variations in the composi-tion of the SCLM. Continental volcanic rocks, par-ticularly silica-undersaturated mafic lavas, may beespecially useful for this purpose. Such lavas areoften taken to represent partial melts of the SCLM,formed either above a thermal anomaly such as amantle plume, or during tectonic extension and asso-ciated continental rifting.
In this study, we investigate the geochemistry ofMiocene to Recent mafic lavas from the Kivu vol-canic province, located in the western branch of theEast African Rift, in order to document changes inmelt composition associated with lithospheric thin-ning above a hypothesized mantle plume. We inter-pret the extreme heterogeneity in isotopic and in-compatible trace element abundance ratios found inKivu lavas to be indicative of dramatic changes inmantle source composition following the onset ofvolcanism near 12 Ma. By comparing the traceelement and isotopic results from Kivu with earlierstudies from throughout the eastern and western riftbranches, we find evidence for a common litho-
Ž .spheric mantle CLM source that has been sampledby lavas over an area of approximately 106 km2. Themineralogy of this common source includes minoramphibole and phlogopite, and may be similar incomposition to the oceanic lithospheric mantle de-
Ž .scribed by Class and Goldstein 1997 . In the EastAfrican Rift system, variations in the inferred rela-
Žtive abundances of hydrous phases amphibole and.phlogopite in the mantle source are also related to
Sr and Nd isotopic differences, consistent with amultistage metasomatic history for the continentallithospheric mantle in this region.
2. Background
2.1. Geodynamic setting of the East African Riftsystem
Ž .The East African Rift system Fig. 1 traversestwo regions of topographic uplift, the Ethiopian and
Kenyan domes, separated by a zone of NW–SEŽ .trending extension Anza graben . A second NW–SE
trending rift that includes Lakes Tanganyika, Rukwaand Malawi defines the southern extent of the Kenyandome. Between these borders, the rift system com-prises two branches, separated by the ;1300 km-wide East African plateau.
The Kenyan dome is believed to overlie an up-welling plume head that has begun to flatten beneath
Žthe continental lithosphere White and McKenzie,.1989; Griffiths and Campbell, 1991 . Detailed geo-
physical work both along the rift axes and across theEast African plateau has helped reveal some of thedynamics of plume encroachment. Recent profilesŽ .summarized in Simiyu and Keller, 1997 indicate a
Ž .broad 1200 " 100 km wide negative gravityanomaly associated with the Kenya dome that ex-tends westward to Lakes Edward and Kivu andsoutheastward into Tanzania. The regional gravity
Ž .study of Ebinger et al. 1989 found that topographicwavelengths )1000 km are overcompensated acrossthe Kenyan dome, suggesting that surface featuresare maintained by dynamic uplift from the uppermantle. Taken together, these observations suggestthat a hot mantle plume is centered beneath thenorthern part of the Tanzanian craton and LakeVictoria, and model calculations are consistent with
Ža plume head diameter of 600 km Simiyu and.Keller, 1997 .
Superposed on the gravity signature of the plateauare narrow, steep-sided negative anomalies that de-fine the boundary between Proterozoic orogenic beltsand the Archean Tanzanian craton and that are coin-
Žcident with the rift valleys themselves Simiyu and. ŽKeller, 1997 . Detailed gravity studies Upcott et al.,
.1996; Simiyu and Keller, 1997 suggest that theunderlying mantle plume has two arms with diame-ters -250 km that penetrate the lithosphere toshallow levels beneath the eastern and western riftbranches. The gravity anomaly associated with theeastern rift is shallowest beneath north central Kenya
Žand deepens rapidly to the north and south Simiyu.and Keller, 1997 . In the western rift, the geophysi-
cal data suggest that the greatest extent of litho-spheric thinning has occurred just south of the Kivuvolcanic province. Experimental investigations of
Ž .plume dynamics Griffiths and Campbell, 1991 alsosuggest that the narrow, arcuate western rift may
( )T. Furman, D. GrahamrLithos 48 1999 237–262 239
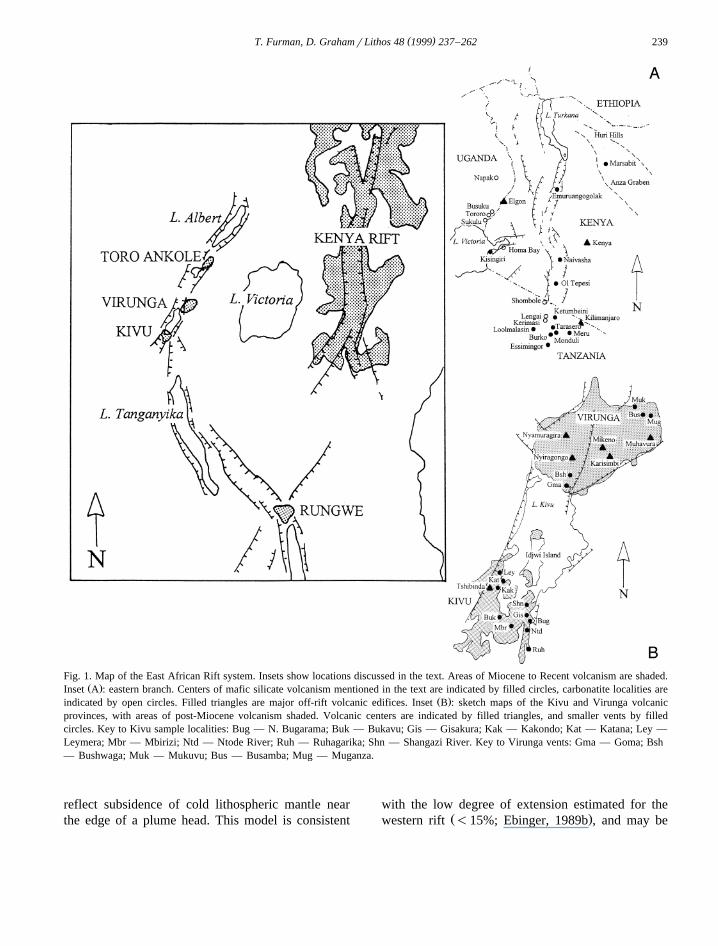
Fig. 1. Map of the East African Rift system. Insets show locations discussed in the text. Areas of Miocene to Recent volcanism are shaded.Ž .Inset A : eastern branch. Centers of mafic silicate volcanism mentioned in the text are indicated by filled circles, carbonatite localities are
Ž .indicated by open circles. Filled triangles are major off-rift volcanic edifices. Inset B : sketch maps of the Kivu and Virunga volcanicprovinces, with areas of post-Miocene volcanism shaded. Volcanic centers are indicated by filled triangles, and smaller vents by filledcircles. Key to Kivu sample localities: Bug — N. Bugarama; Buk — Bukavu; Gis — Gisakura; Kak — Kakondo; Kat — Katana; Ley —Leymera; Mbr — Mbirizi; Ntd — Ntode River; Ruh — Ruhagarika; Shn — Shangazi River. Key to Virunga vents: Gma — Goma; Bsh— Bushwaga; Muk — Mukuvu; Bus — Busamba; Mug — Muganza.
reflect subsidence of cold lithospheric mantle nearthe edge of a plume head. This model is consistent
with the low degree of extension estimated for theŽ .western rift -15%; Ebinger, 1989b , and may be
( )T. Furman, D. GrahamrLithos 48 1999 237–262240
appropriate for parts of the eastern rift as well. Underthis scenario, the post-Miocene alkalic volcanism
throughout the East African Rift system is primarilycaused by melting of lithospheric mantle.
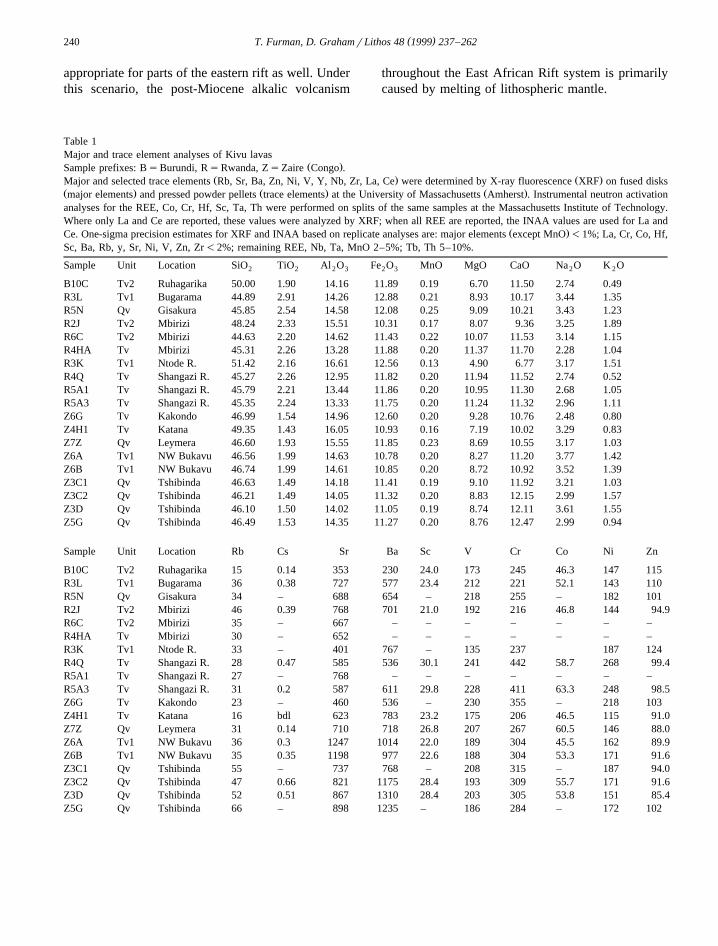
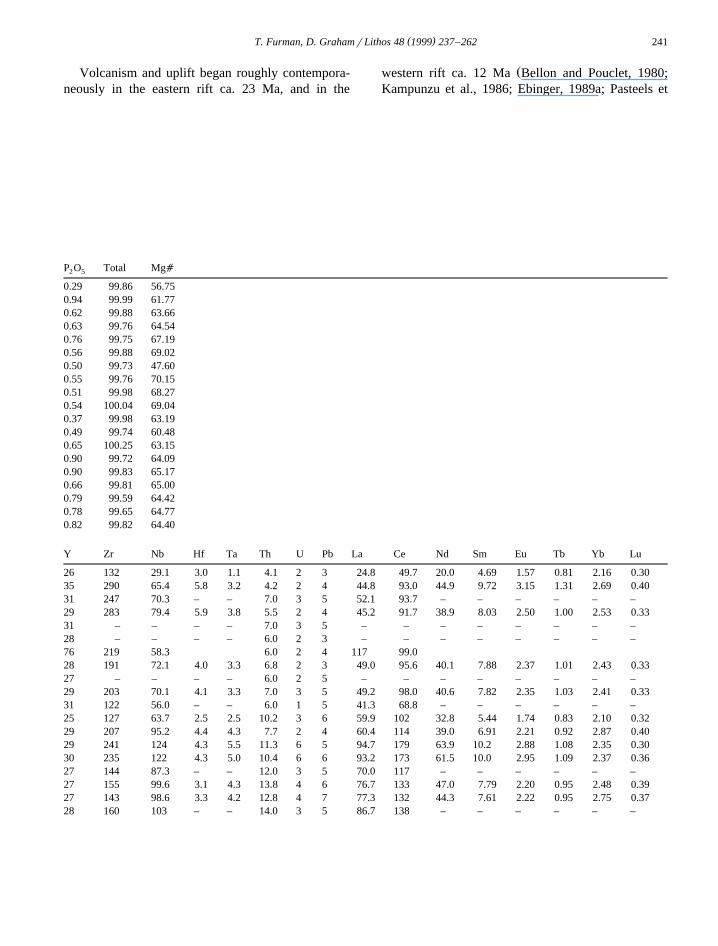
Table 1Major and trace element analyses of Kivu lavas
Ž .Sample prefixes: BsBurundi, RsRwanda, ZsZaire Congo .Ž . Ž .Major and selected trace elements Rb, Sr, Ba, Zn, Ni, V, Y, Nb, Zr, La, Ce were determined by X-ray fluorescence XRF on fused disks
Ž . Ž . Ž .major elements and pressed powder pellets trace elements at the University of Massachusetts Amherst . Instrumental neutron activationanalyses for the REE, Co, Cr, Hf, Sc, Ta, Th were performed on splits of the same samples at the Massachusetts Institute of Technology.Where only La and Ce are reported, these values were analyzed by XRF; when all REE are reported, the INAA values are used for La and
Ž .Ce. One-sigma precision estimates for XRF and INAA based on replicate analyses are: major elements except MnO -1%; La, Cr, Co, Hf,Sc, Ba, Rb, y, Sr, Ni, V, Zn, Zr-2%; remaining REE, Nb, Ta, MnO 2–5%; Tb, Th 5–10%.
Sample Unit Location SiO TiO Al O Fe O MnO MgO CaO Na O K O2 2 2 3 2 3 2 2
B10C Tv2 Ruhagarika 50.00 1.90 14.16 11.89 0.19 6.70 11.50 2.74 0.49R3L Tv1 Bugarama 44.89 2.91 14.26 12.88 0.21 8.93 10.17 3.44 1.35R5N Qv Gisakura 45.85 2.54 14.58 12.08 0.25 9.09 10.21 3.43 1.23R2J Tv2 Mbirizi 48.24 2.33 15.51 10.31 0.17 8.07 9.36 3.25 1.89R6C Tv2 Mbirizi 44.63 2.20 14.62 11.43 0.22 10.07 11.53 3.14 1.15R4HA Tv Mbirizi 45.31 2.26 13.28 11.88 0.20 11.37 11.70 2.28 1.04R3K Tv1 Ntode R. 51.42 2.16 16.61 12.56 0.13 4.90 6.77 3.17 1.51R4Q Tv Shangazi R. 45.27 2.26 12.95 11.82 0.20 11.94 11.52 2.74 0.52R5A1 Tv Shangazi R. 45.79 2.21 13.44 11.86 0.20 10.95 11.30 2.68 1.05R5A3 Tv Shangazi R. 45.35 2.24 13.33 11.75 0.20 11.24 11.32 2.96 1.11Z6G Tv Kakondo 46.99 1.54 14.96 12.60 0.20 9.28 10.76 2.48 0.80Z4H1 Tv Katana 49.35 1.43 16.05 10.93 0.16 7.19 10.02 3.29 0.83Z7Z Qv Leymera 46.60 1.93 15.55 11.85 0.23 8.69 10.55 3.17 1.03Z6A Tv1 NW Bukavu 46.56 1.99 14.63 10.78 0.20 8.27 11.20 3.77 1.42Z6B Tv1 NW Bukavu 46.74 1.99 14.61 10.85 0.20 8.72 10.92 3.52 1.39Z3C1 Qv Tshibinda 46.63 1.49 14.18 11.41 0.19 9.10 11.92 3.21 1.03Z3C2 Qv Tshibinda 46.21 1.49 14.05 11.32 0.20 8.83 12.15 2.99 1.57Z3D Qv Tshibinda 46.10 1.50 14.02 11.05 0.19 8.74 12.11 3.61 1.55Z5G Qv Tshibinda 46.49 1.53 14.35 11.27 0.20 8.76 12.47 2.99 0.94
Sample Unit Location Rb Cs Sr Ba Sc V Cr Co Ni Zn
B10C Tv2 Ruhagarika 15 0.14 353 230 24.0 173 245 46.3 147 115R3L Tv1 Bugarama 36 0.38 727 577 23.4 212 221 52.1 143 110R5N Qv Gisakura 34 – 688 654 – 218 255 – 182 101R2J Tv2 Mbirizi 46 0.39 768 701 21.0 192 216 46.8 144 94.9R6C Tv2 Mbirizi 35 – 667 – – – – – – –R4HA Tv Mbirizi 30 – 652 – – – – – – –R3K Tv1 Ntode R. 33 – 401 767 – 135 237 187 124R4Q Tv Shangazi R. 28 0.47 585 536 30.1 241 442 58.7 268 99.4R5A1 Tv Shangazi R. 27 – 768 – – – – – – –R5A3 Tv Shangazi R. 31 0.2 587 611 29.8 228 411 63.3 248 98.5Z6G Tv Kakondo 23 – 460 536 – 230 355 – 218 103Z4H1 Tv Katana 16 bdl 623 783 23.2 175 206 46.5 115 91.0Z7Z Qv Leymera 31 0.14 710 718 26.8 207 267 60.5 146 88.0Z6A Tv1 NW Bukavu 36 0.3 1247 1014 22.0 189 304 45.5 162 89.9Z6B Tv1 NW Bukavu 35 0.35 1198 977 22.6 188 304 53.3 171 91.6Z3C1 Qv Tshibinda 55 – 737 768 – 208 315 – 187 94.0Z3C2 Qv Tshibinda 47 0.66 821 1175 28.4 193 309 55.7 171 91.6Z3D Qv Tshibinda 52 0.51 867 1310 28.4 203 305 53.8 151 85.4Z5G Qv Tshibinda 66 – 898 1235 – 186 284 – 172 102
( )T. Furman, D. GrahamrLithos 48 1999 237–262 241
Volcanism and uplift began roughly contempora-neously in the eastern rift ca. 23 Ma, and in the
Žwestern rift ca. 12 Ma Bellon and Pouclet, 1980;Kampunzu et al., 1986; Ebinger, 1989a; Pasteels et
P O Total Mga2 5
0.29 99.86 56.750.94 99.99 61.770.62 99.88 63.660.63 99.76 64.540.76 99.75 67.190.56 99.88 69.020.50 99.73 47.600.55 99.76 70.150.51 99.98 68.270.54 100.04 69.040.37 99.98 63.190.49 99.74 60.480.65 100.25 63.150.90 99.72 64.090.90 99.83 65.170.66 99.81 65.000.79 99.59 64.420.78 99.65 64.770.82 99.82 64.40
Y Zr Nb Hf Ta Th U Pb La Ce Nd Sm Eu Tb Yb Lu
26 132 29.1 3.0 1.1 4.1 2 3 24.8 49.7 20.0 4.69 1.57 0.81 2.16 0.3035 290 65.4 5.8 3.2 4.2 2 4 44.8 93.0 44.9 9.72 3.15 1.31 2.69 0.4031 247 70.3 – – 7.0 3 5 52.1 93.7 – – – – – –29 283 79.4 5.9 3.8 5.5 2 4 45.2 91.7 38.9 8.03 2.50 1.00 2.53 0.3331 – – – – 7.0 3 5 – – – – – – – –28 – – – – 6.0 2 3 – – – – – – – –76 219 58.3 6.0 2 4 117 99.028 191 72.1 4.0 3.3 6.8 2 3 49.0 95.6 40.1 7.88 2.37 1.01 2.43 0.3327 – – – – 6.0 2 5 – – – – – – – –29 203 70.1 4.1 3.3 7.0 3 5 49.2 98.0 40.6 7.82 2.35 1.03 2.41 0.3331 122 56.0 – – 6.0 1 5 41.3 68.8 – – – – – –25 127 63.7 2.5 2.5 10.2 3 6 59.9 102 32.8 5.44 1.74 0.83 2.10 0.3229 207 95.2 4.4 4.3 7.7 2 4 60.4 114 39.0 6.91 2.21 0.92 2.87 0.4029 241 124 4.3 5.5 11.3 6 5 94.7 179 63.9 10.2 2.88 1.08 2.35 0.3030 235 122 4.3 5.0 10.4 6 6 93.2 173 61.5 10.0 2.95 1.09 2.37 0.3627 144 87.3 – – 12.0 3 5 70.0 117 – – – – – –27 155 99.6 3.1 4.3 13.8 4 6 76.7 133 47.0 7.79 2.20 0.95 2.48 0.3927 143 98.6 3.3 4.2 12.8 4 7 77.3 132 44.3 7.61 2.22 0.95 2.75 0.3728 160 103 – – 14.0 3 5 86.7 138 – – – – – –
( )T. Furman, D. GrahamrLithos 48 1999 237–262242
.al., 1989 . Mid-Miocene to Recent volcanic activityhas occurred along the entire length of the easternrift, but is restricted to four intrabasinal accommoda-
Žtion zones in the western rift Ebinger, 1989a,b; Fig..1 . The diversity of mafic volcanic rocks erupted
along the eastern and western branches of the riftŽsystem has been well-documented e.g., Holmes and
Harwood, 1937; Holmes, 1940, 1950; Bell and Pow-ell, 1969; Bell and Doyle, 1971; Mitchell and Bell,1976; Baker et al., 1977; De Mulder et al., 1986;Auchapt et al., 1987; Davies and Lloyd, 1989;Marcelot et al., 1989; Lloyd et al., 1991; Rogers etal., 1992, 1998; Class et al., 1994; Furman and
.Graham, 1994; Furman, 1995; Paslick et al., 1995 ,and can be used to investigate the interaction be-tween magmas derived from asthenospheric andlithospheric sources beneath this region of the Africanplate.
2.2. The KiÕu Õolcanic proÕince
The Kivu volcanic province is located in thewestern branch of the East African Rift, along theborders of Rwanda, Burundi and eastern ZaireŽ .Congo . It includes two discrete volcanic fields:Bukavu, which covers an area roughly 35=35 km2
near Lake Kivu, and Mwenga-Kamituga, located 80km to the southwest. Samples from this study comefrom Bukavu and include four lavas from Tshibinda
Ž .volcano Fig. 1 . The Kivu area comprises threesedimentary basins defined by border faults, and itsvolcanism is intimately linked to faulting during
Ž .basin formation Ebinger, 1989a .Three cycles of volcanic activity have been recog-
Žnized at Bukavu Kampunzu et al., 1986; Ebinger,.1989a; Pasteels et al., 1989 , each of which is domi-
nated by fissure eruptions of mafic lavas. EarliestŽ .activity unit Tv1 occurred prior to rifting, between
roughly 10 and 7.5 Ma and is limited to the EastKivu basin and the southern part of Idjwi Island.Mafic lavas from this period include olivine- andquartz-normative tholeiites. Second-stage volcanismŽ .unit Tv2 , which likely corresponds to the start ofrift formation, occurred between ;7.5 and 4 Ma inboth the East and West Kivu basins. Lavas eruptedalong the rift boundary faults during this episodeinclude sodic alkali basalts and basanites in additionto minor volumes of trachytes and phonolites. The
Ž .third stage of volcanic activity Qv includes tholei-itic and alkalic basalts erupted primarily along theWest Kivu border fault system. Tshibinda volcano isone of the most recently active volcanic centerslocated on this fault. The West Kivu border fault hasserved as the master fault for crustal extension dur-ing the Quaternary, and forms a structural link be-
Žtween the Kivu and Virunga provinces Ebinger,.1989a .
Samples for this study are mafic lavas from eachŽ .eruptive cycle Table 1 . Samples from Tshibinda
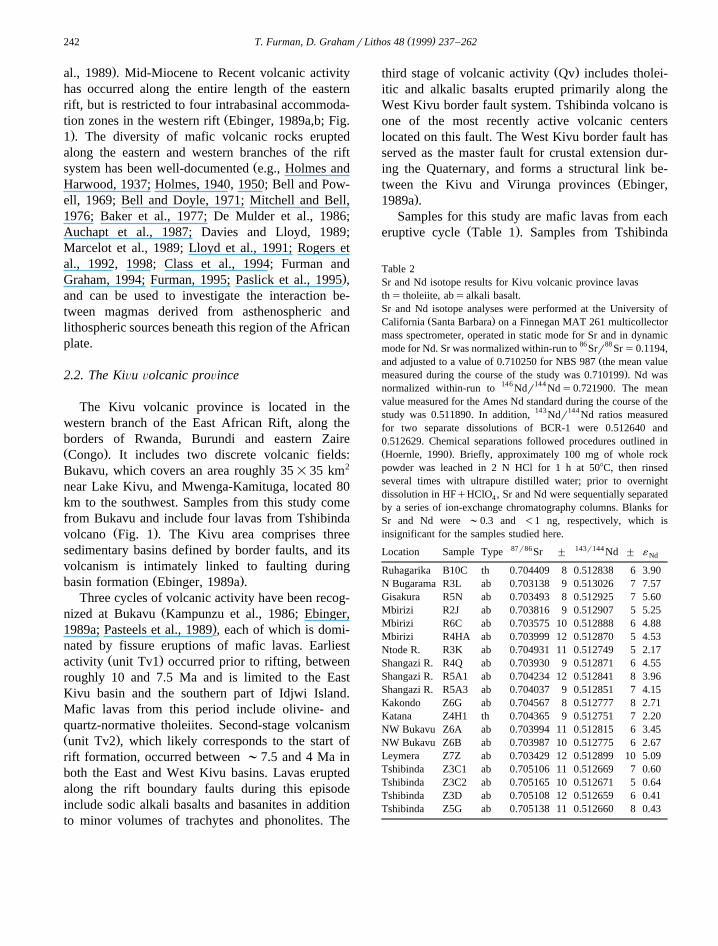
Table 2Sr and Nd isotope results for Kivu volcanic province lavasths tholeiite, absalkali basalt.Sr and Nd isotope analyses were performed at the University of
Ž .California Santa Barbara on a Finnegan MAT 261 multicollectormass spectrometer, operated in static mode for Sr and in dynamicmode for Nd. Sr was normalized within-run to 86 Srr88 Srs0.1194,
Žand adjusted to a value of 0.710250 for NBS 987 the mean value.measured during the course of the study was 0.710199 . Nd was
normalized within-run to 146 Ndr144 Nds0.721900. The meanvalue measured for the Ames Nd standard during the course of thestudy was 0.511890. In addition, 143Ndr144 Nd ratios measuredfor two separate dissolutions of BCR-1 were 0.512640 and0.512629. Chemical separations followed procedures outlined inŽ .Hoernle, 1990 . Briefly, approximately 100 mg of whole rockpowder was leached in 2 N HCl for 1 h at 508C, then rinsedseveral times with ultrapure distilled water; prior to overnightdissolution in HFqHClO , Sr and Nd were sequentially separated4
by a series of ion-exchange chromatography columns. Blanks forSr and Nd were ;0.3 and -1 ng, respectively, which isinsignificant for the samples studied here.
87r86 143r144Location Sample Type Sr " Nd " ´ Nd
Ruhagarika B10C th 0.704409 8 0.512838 6 3.90N Bugarama R3L ab 0.703138 9 0.513026 7 7.57Gisakura R5N ab 0.703493 8 0.512925 7 5.60Mbirizi R2J ab 0.703816 9 0.512907 5 5.25Mbirizi R6C ab 0.703575 10 0.512888 6 4.88Mbirizi R4HA ab 0.703999 12 0.512870 5 4.53Ntode R. R3K ab 0.704931 11 0.512749 5 2.17Shangazi R. R4Q ab 0.703930 9 0.512871 6 4.55Shangazi R. R5A1 ab 0.704234 12 0.512841 8 3.96Shangazi R. R5A3 ab 0.704037 9 0.512851 7 4.15Kakondo Z6G ab 0.704567 8 0.512777 8 2.71Katana Z4H1 th 0.704365 9 0.512751 7 2.20NW Bukavu Z6A ab 0.703994 11 0.512815 6 3.45NW Bukavu Z6B ab 0.703987 10 0.512775 6 2.67Leymera Z7Z ab 0.703429 12 0.512899 10 5.09Tshibinda Z3C1 ab 0.705106 11 0.512669 7 0.60Tshibinda Z3C2 ab 0.705165 10 0.512671 5 0.64Tshibinda Z3D ab 0.705108 12 0.512659 6 0.41Tshibinda Z5G ab 0.705138 11 0.512660 8 0.43
( )T. Furman, D. GrahamrLithos 48 1999 237–262 243
Ž .volcano and Idjwi Island Marcelot et al., 1989 areconsidered together as the ‘‘Tshibinda group’’, whileremaining lavas are termed the ‘‘Bukavu group’’.All lavas contain phenocrysts of olivine and clinopy-roxene, with plagioclase feldspar phenocrysts re-
Ž .stricted to evolved mafic lavas Appendix A . TheŽ .samples were collected by C.J. Ebinger Leeds, UK
and were analyzed for major and trace elementsŽ . ŽTable 1 as well as Sr and Nd isotope ratios Table.2 .
2.3. Results
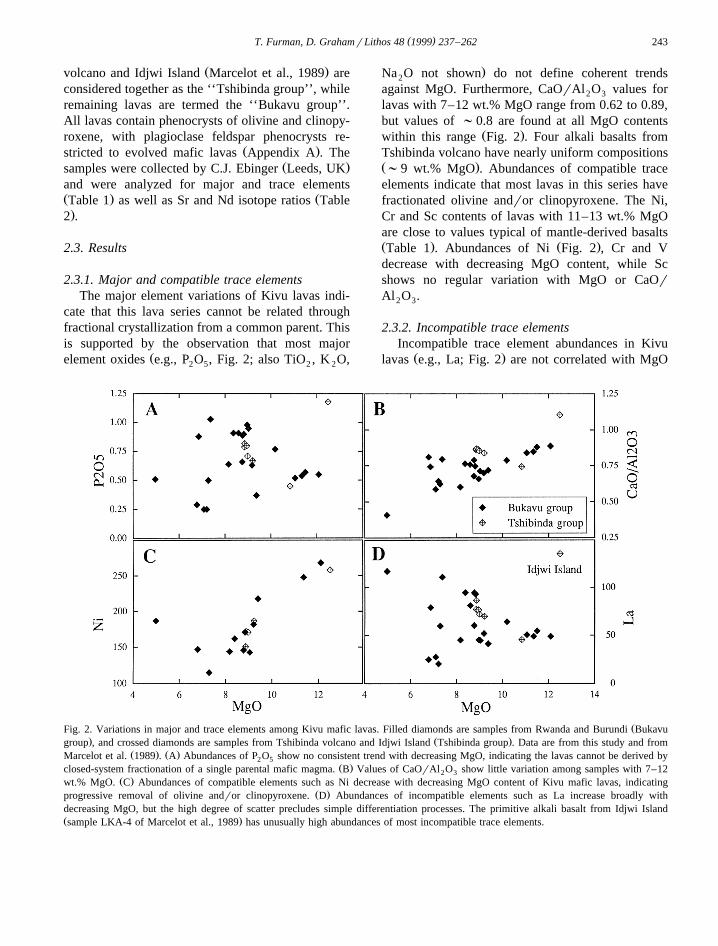
2.3.1. Major and compatible trace elementsThe major element variations of Kivu lavas indi-
cate that this lava series cannot be related throughfractional crystallization from a common parent. Thisis supported by the observation that most major
Želement oxides e.g., P O , Fig. 2; also TiO , K O,2 5 2 2
.Na O not shown do not define coherent trends2
against MgO. Furthermore, CaOrAl O values for2 3
lavas with 7–12 wt.% MgO range from 0.62 to 0.89,but values of ;0.8 are found at all MgO contents
Ž .within this range Fig. 2 . Four alkali basalts fromTshibinda volcano have nearly uniform compositionsŽ .;9 wt.% MgO . Abundances of compatible traceelements indicate that most lavas in this series havefractionated olivine andror clinopyroxene. The Ni,Cr and Sc contents of lavas with 11–13 wt.% MgOare close to values typical of mantle-derived basaltsŽ . Ž .Table 1 . Abundances of Ni Fig. 2 , Cr and Vdecrease with decreasing MgO content, while Scshows no regular variation with MgO or CaOrAl O .2 3
2.3.2. Incompatible trace elementsIncompatible trace element abundances in Kivu
Ž .lavas e.g., La; Fig. 2 are not correlated with MgO
ŽFig. 2. Variations in major and trace elements among Kivu mafic lavas. Filled diamonds are samples from Rwanda and Burundi Bukavu. Ž .group , and crossed diamonds are samples from Tshibinda volcano and Idjwi Island Tshibinda group . Data are from this study and from
Ž . Ž .Marcelot et al. 1989 . A Abundances of P O show no consistent trend with decreasing MgO, indicating the lavas cannot be derived by2 5Ž .closed-system fractionation of a single parental mafic magma. B Values of CaOrAl O show little variation among samples with 7–122 3
Ž .wt.% MgO. C Abundances of compatible elements such as Ni decrease with decreasing MgO content of Kivu mafic lavas, indicatingŽ .progressive removal of olivine andror clinopyroxene. D Abundances of incompatible elements such as La increase broadly with
decreasing MgO, but the high degree of scatter precludes simple differentiation processes. The primitive alkali basalt from Idjwi IslandŽ .sample LKA-4 of Marcelot et al., 1989 has unusually high abundances of most incompatible trace elements.
( )T. Furman, D. GrahamrLithos 48 1999 237–262244
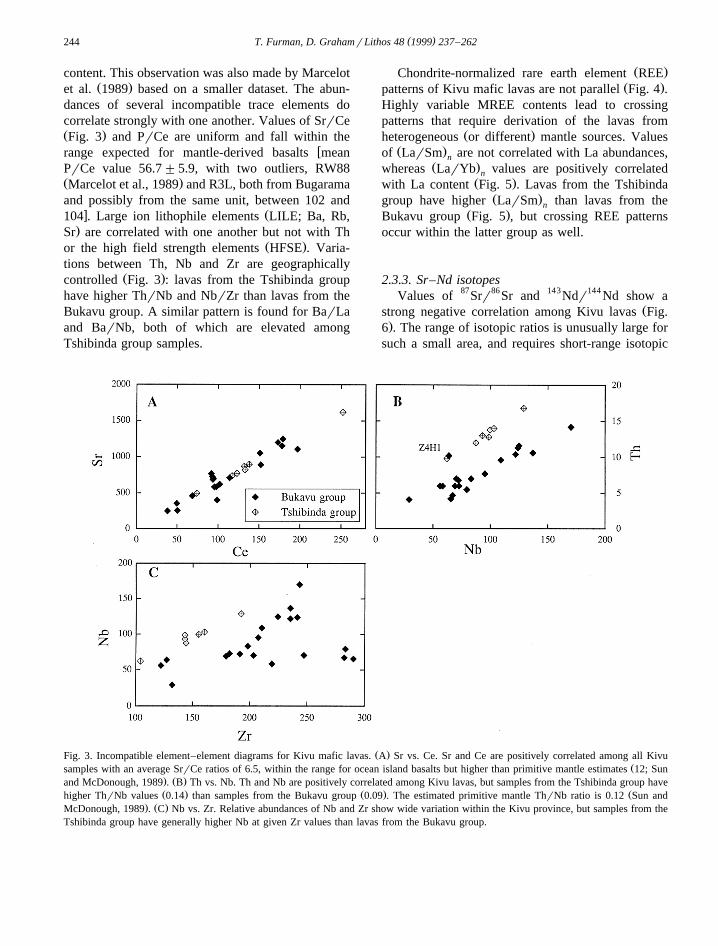
content. This observation was also made by MarcelotŽ .et al. 1989 based on a smaller dataset. The abun-
dances of several incompatible trace elements docorrelate strongly with one another. Values of SrrCeŽ .Fig. 3 and PrCe are uniform and fall within the
wrange expected for mantle-derived basalts meanPrCe value 56.7"5.9, with two outliers, RW88Ž .Marcelot et al., 1989 and R3L, both from Bugaramaand possibly from the same unit, between 102 and
x Ž104 . Large ion lithophile elements LILE; Ba, Rb,.Sr are correlated with one another but not with Th
Ž .or the high field strength elements HFSE . Varia-tions between Th, Nb and Zr are geographically
Ž .controlled Fig. 3 : lavas from the Tshibinda grouphave higher ThrNb and NbrZr than lavas from theBukavu group. A similar pattern is found for BarLaand BarNb, both of which are elevated amongTshibinda group samples.
Ž .Chondrite-normalized rare earth element REEŽ .patterns of Kivu mafic lavas are not parallel Fig. 4 .
Highly variable MREE contents lead to crossingpatterns that require derivation of the lavas from
Ž .heterogeneous or different mantle sources. ValuesŽ .of LarSm are not correlated with La abundances,n
Ž .whereas LarYb values are positively correlatednŽ .with La content Fig. 5 . Lavas from the Tshibinda
Ž .group have higher LarSm than lavas from thenŽ .Bukavu group Fig. 5 , but crossing REE patterns
occur within the latter group as well.
2.3.3. Sr–Nd isotopesValues of 87Srr86Sr and 143Ndr144 Nd show a
Žstrong negative correlation among Kivu lavas Fig..6 . The range of isotopic ratios is unusually large for
such a small area, and requires short-range isotopic
Ž .Fig. 3. Incompatible element–element diagrams for Kivu mafic lavas. A Sr vs. Ce. Sr and Ce are positively correlated among all KivuŽsamples with an average SrrCe ratios of 6.5, within the range for ocean island basalts but higher than primitive mantle estimates 12; Sun
. Ž .and McDonough, 1989 . B Th vs. Nb. Th and Nb are positively correlated among Kivu lavas, but samples from the Tshibinda group haveŽ . Ž . Žhigher ThrNb values 0.14 than samples from the Bukavu group 0.09 . The estimated primitive mantle ThrNb ratio is 0.12 Sun and
. Ž .McDonough, 1989 . C Nb vs. Zr. Relative abundances of Nb and Zr show wide variation within the Kivu province, but samples from theTshibinda group have generally higher Nb at given Zr values than lavas from the Bukavu group.
( )T. Furman, D. GrahamrLithos 48 1999 237–262 245
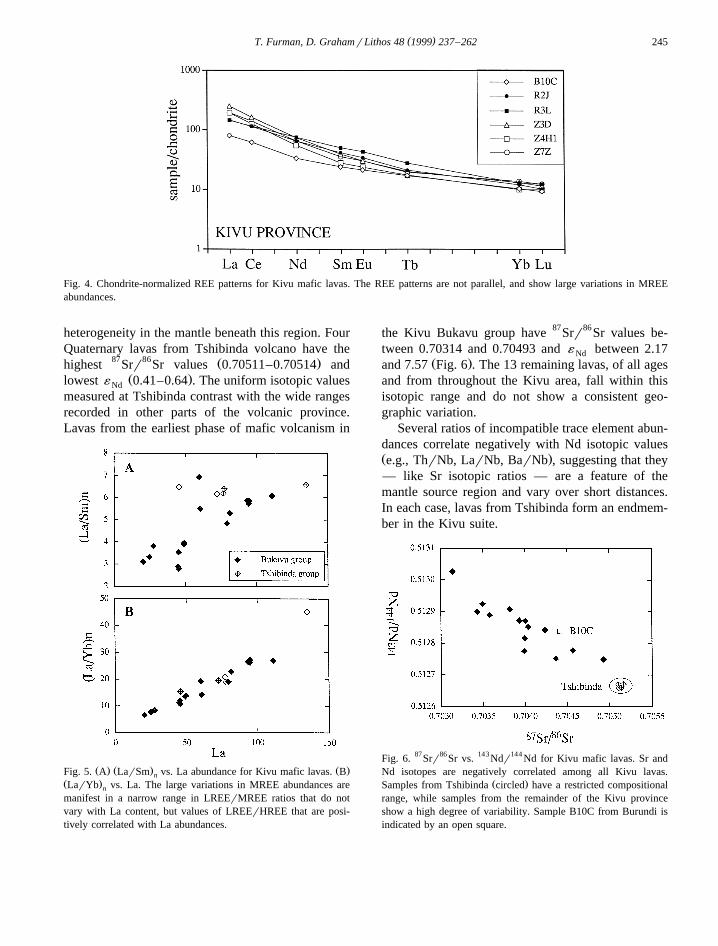
Fig. 4. Chondrite-normalized REE patterns for Kivu mafic lavas. The REE patterns are not parallel, and show large variations in MREEabundances.
heterogeneity in the mantle beneath this region. FourQuaternary lavas from Tshibinda volcano have the
87 86 Ž .highest Srr Sr values 0.70511–0.70514 andŽ .lowest ´ 0.41–0.64 . The uniform isotopic valuesNd
measured at Tshibinda contrast with the wide rangesrecorded in other parts of the volcanic province.Lavas from the earliest phase of mafic volcanism in
Ž . Ž . Ž .Fig. 5. A LarSm vs. La abundance for Kivu mafic lavas. BnŽ .LarYb vs. La. The large variations in MREE abundances aren
manifest in a narrow range in LREErMREE ratios that do notvary with La content, but values of LREErHREE that are posi-tively correlated with La abundances.
the Kivu Bukavu group have 87Srr86Sr values be-tween 0.70314 and 0.70493 and ´ between 2.17Nd
Ž .and 7.57 Fig. 6 . The 13 remaining lavas, of all agesand from throughout the Kivu area, fall within thisisotopic range and do not show a consistent geo-graphic variation.
Several ratios of incompatible trace element abun-dances correlate negatively with Nd isotopic valuesŽ .e.g., ThrNb, LarNb, BarNb , suggesting that they— like Sr isotopic ratios — are a feature of themantle source region and vary over short distances.In each case, lavas from Tshibinda form an endmem-ber in the Kivu suite.
Fig. 6. 87Srr86 Sr vs. 143Ndr144 Nd for Kivu mafic lavas. Sr andNd isotopes are negatively correlated among all Kivu lavas.
Ž .Samples from Tshibinda circled have a restricted compositionalrange, while samples from the remainder of the Kivu provinceshow a high degree of variability. Sample B10C from Burundi isindicated by an open square.
( )T. Furman, D. GrahamrLithos 48 1999 237–262246
3. Discussion
3.1. Major element characteristics of mafic rift laÕas
The eastern and western branches of the rift sys-tem are characterized by differences in the timing,volume and chemical composition of erupted lavas.In the eastern rift, volcanism began at roughly 23 Maand the total erupted volume is estimated at 220,000
3 Ž .km Williams, 1972 . The Kenya rift volcanicserupted nearly continuously from Early Miocene to
Ž .Holocene time Baker et al., 1971 . In general, theKenya basalts are weakly undersaturated with re-spect to silica. Erupted compositions considered inthis study include tholeiites, ferrobasalts and alkalibasalts from Ol Tepesi and Naivasha in central KenyaŽ .Baker et al., 1977; Davies and Macdonald, 1987 ,and alkali basalts and basanites from Huri Hills in
Ž .northern Kenya Class et al., 1994 . Lavas fromŽ .northern Tanzania Paslick et al., 1995 are domi-
nated by mildly alkalic compositions and includesamples from several volcanic vents that date from)8 Ma to Recent.
Volcanism in the western rift began at roughly 12Ma and has produced at most 100,000 km3 of lavaŽ .Kampunzu and Mohr, 1991 . Eruptions have been
Ž .restricted to four volcanic provinces Fig. 1 locatedin heavily faulted intrabasinal accommodation zonesŽ .e.g., Ebinger, 1989a,b . Mafic lavas from the west-ern rift are undersaturated with respect to silica,although the nature and degree of alkali enrichmentvary greatly both within and between volcanicprovinces. Toro Ankole is dominated by ultrapotas-sic lavas and other highly alkaline compositions,
Žincluding pyroclastic carbonatites e.g., Holmes andHarwood, 1937; Lloyd and Bailey, 1975; Lloyd et
.al., 1991 . The Virunga lavas are mildly to highlyundersaturated, with compositions ranging from al-
Ž .kali basalts to K-rich ultrapotassic basanitesŽHolmes and Harwood, 1937; De Mulder et al.,1986; Marcelot et al., 1989; Rogers et al., 1992,
.1998 . Kivu province lavas are similar to eastern riftcompositions, including alkali basalts and the only
Žtholeiitic lavas sampled in the western rift Kampunzuet al., 1986; Auchapt et al., 1987; Marcelot et al.,
.1989 . To the south, Rungwe lavas include alkalibasalts, basanites, nephelinites, as well as the only
trachy-phonolitic central volcanoes in the westernŽ .rift Harkin, 1960; Furman, 1995 . In the following
discussion, we consider lavas from each of thesevolcanic provinces.
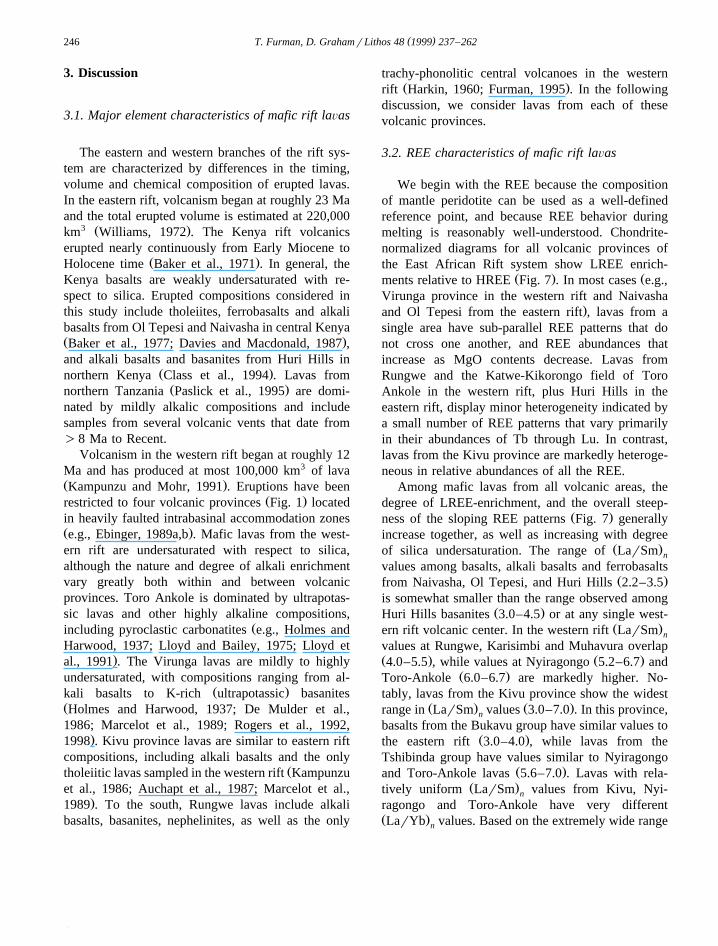
3.2. REE characteristics of mafic rift laÕas
We begin with the REE because the compositionof mantle peridotite can be used as a well-definedreference point, and because REE behavior duringmelting is reasonably well-understood. Chondrite-normalized diagrams for all volcanic provinces ofthe East African Rift system show LREE enrich-
Ž . Žments relative to HREE Fig. 7 . In most cases e.g.,Virunga province in the western rift and Naivasha
.and Ol Tepesi from the eastern rift , lavas from asingle area have sub-parallel REE patterns that donot cross one another, and REE abundances thatincrease as MgO contents decrease. Lavas fromRungwe and the Katwe-Kikorongo field of ToroAnkole in the western rift, plus Huri Hills in theeastern rift, display minor heterogeneity indicated bya small number of REE patterns that vary primarilyin their abundances of Tb through Lu. In contrast,lavas from the Kivu province are markedly heteroge-neous in relative abundances of all the REE.
Among mafic lavas from all volcanic areas, thedegree of LREE-enrichment, and the overall steep-
Ž .ness of the sloping REE patterns Fig. 7 generallyincrease together, as well as increasing with degree
Ž .of silica undersaturation. The range of LarSm n
values among basalts, alkali basalts and ferrobasaltsŽ .from Naivasha, Ol Tepesi, and Huri Hills 2.2–3.5
is somewhat smaller than the range observed amongŽ .Huri Hills basanites 3.0–4.5 or at any single west-
Ž .ern rift volcanic center. In the western rift LarSm n
values at Rungwe, Karisimbi and Muhavura overlapŽ . Ž .4.0–5.5 , while values at Nyiragongo 5.2–6.7 and
Ž .Toro-Ankole 6.0–6.7 are markedly higher. No-tably, lavas from the Kivu province show the widest
Ž . Ž .range in LarSm values 3.0–7.0 . In this province,n
basalts from the Bukavu group have similar values toŽ .the eastern rift 3.0–4.0 , while lavas from the
Tshibinda group have values similar to NyiragongoŽ .and Toro-Ankole lavas 5.6–7.0 . Lavas with rela-
Ž .tively uniform LarSm values from Kivu, Nyi-n
ragongo and Toro-Ankole have very differentŽ .LarYb values. Based on the extremely wide rangen
( )T. Furman, D. GrahamrLithos 48 1999 237–262 247
Ž .Fig. 7. Chondrite-normalized abundances of REE values of Boynton, 1983 . Datasets were chosen on the basis of internal consistency whenŽ .possible data from same analytical facilities , and therefore do not include all available published data. Sources of data: Huri Hills — Class
Ž . Ž . Ž . Ž .et al. 1994 ; Naivasha — Davies and Macdonald 1987 ; Ol Tepesi — Baker et al. 1977 ; N. Tanzania — Paslick et al. 1995 ; MuhavuraŽ . Ž . Ž . Ž .— Rogers et al. 1998 ; Karisimbi — Rogers et al. 1992 ; Rungwe — Furman 1995 ; Nyiragongo — Marcelot et al. 1989 , Furman
Ž . Ž . Ž .unpublished data ; Toro Ankole — Furman unpublished data . a Eastern rift lavas. Ranges shown enclose the variation among maficŽ .lavas from Ol Tepesi, Naivasha and Huri Hills. b Western rift I. The field for Karisimbi encompasses all primitive K-basanites. Two
Ž .samples from Toro Ankole and one mafic lava from Nyamuragira were selected to indicate representative patterns in these areas. cWestern rift II. Fields for Muhavura, Nyiragongo and Rungwe indicate the range of mafic lavas from each area.
( )T. Furman, D. GrahamrLithos 48 1999 237–262248
Ž .in REE patterns, Mitchell and Bell 1976 concludedthat the Toro-Ankole lavas, especially the ultra-al-kaline ugandites, mafurites and katungites, could notbe derived by a single-stage melting process frommantle peridotite, but require at least one earlierevent of source enrichment.
3.3. Incompatible trace and minor element Õaria-tions
Incompatible trace elements may give useful in-sight into the interaction between magmas derived
from asthenospheric and lithospheric sources. In par-ticular, they can indicate the type of mantle involvedŽ .e.g., HIMU , the existence or extent of contamina-tion by crust, the nature and degree of metasomaticenrichment events, and the source mineralogy whenelements diagnostic of key phases such as apatite,zircon, or phlogopite are considered.
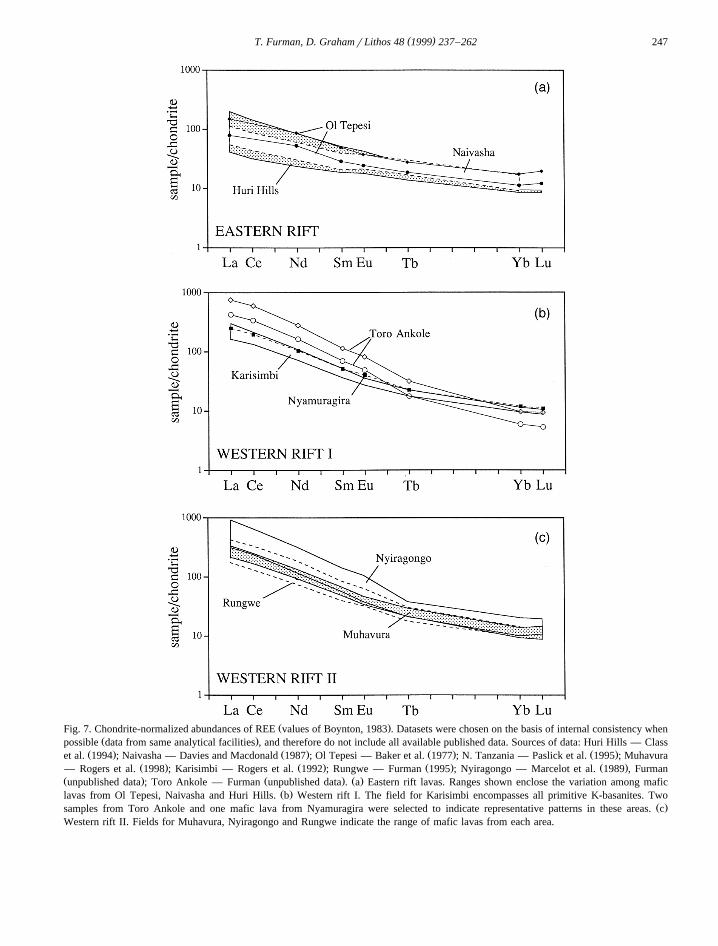
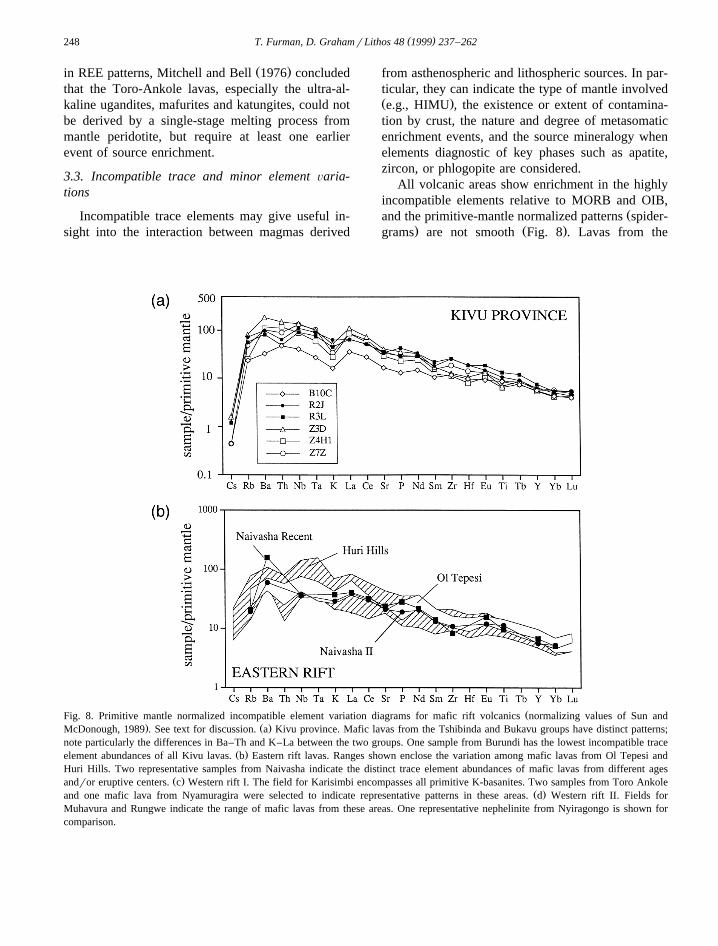
All volcanic areas show enrichment in the highlyincompatible elements relative to MORB and OIB,
Žand the primitive-mantle normalized patterns spider-. Ž .grams are not smooth Fig. 8 . Lavas from the
ŽFig. 8. Primitive mantle normalized incompatible element variation diagrams for mafic rift volcanics normalizing values of Sun and. Ž .McDonough, 1989 . See text for discussion. a Kivu province. Mafic lavas from the Tshibinda and Bukavu groups have distinct patterns;
note particularly the differences in Ba–Th and K–La between the two groups. One sample from Burundi has the lowest incompatible traceŽ .element abundances of all Kivu lavas. b Eastern rift lavas. Ranges shown enclose the variation among mafic lavas from Ol Tepesi and
Huri Hills. Two representative samples from Naivasha indicate the distinct trace element abundances of mafic lavas from different agesŽ .andror eruptive centers. c Western rift I. The field for Karisimbi encompasses all primitive K-basanites. Two samples from Toro Ankole
Ž .and one mafic lava from Nyamuragira were selected to indicate representative patterns in these areas. d Western rift II. Fields forMuhavura and Rungwe indicate the range of mafic lavas from these areas. One representative nephelinite from Nyiragongo is shown forcomparison.
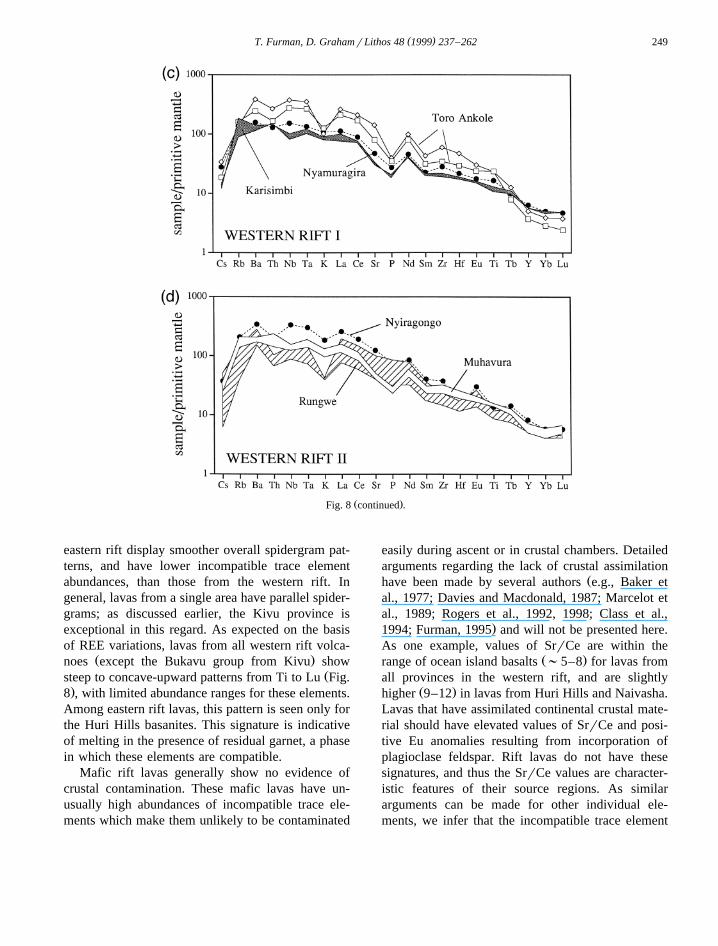
( )T. Furman, D. GrahamrLithos 48 1999 237–262 249
Ž .Fig. 8 continued .
eastern rift display smoother overall spidergram pat-terns, and have lower incompatible trace elementabundances, than those from the western rift. Ingeneral, lavas from a single area have parallel spider-grams; as discussed earlier, the Kivu province isexceptional in this regard. As expected on the basisof REE variations, lavas from all western rift volca-
Ž .noes except the Bukavu group from Kivu showŽsteep to concave-upward patterns from Ti to Lu Fig.
.8 , with limited abundance ranges for these elements.Among eastern rift lavas, this pattern is seen only forthe Huri Hills basanites. This signature is indicativeof melting in the presence of residual garnet, a phasein which these elements are compatible.
Mafic rift lavas generally show no evidence ofcrustal contamination. These mafic lavas have un-usually high abundances of incompatible trace ele-ments which make them unlikely to be contaminated
easily during ascent or in crustal chambers. Detailedarguments regarding the lack of crustal assimilation
Žhave been made by several authors e.g., Baker etal., 1977; Davies and Macdonald, 1987; Marcelot etal., 1989; Rogers et al., 1992, 1998; Class et al.,
.1994; Furman, 1995 and will not be presented here.As one example, values of SrrCe are within the
Ž .range of ocean island basalts ;5–8 for lavas fromall provinces in the western rift, and are slightly
Ž .higher 9–12 in lavas from Huri Hills and Naivasha.Lavas that have assimilated continental crustal mate-rial should have elevated values of SrrCe and posi-tive Eu anomalies resulting from incorporation ofplagioclase feldspar. Rift lavas do not have thesesignatures, and thus the SrrCe values are character-istic features of their source regions. As similararguments can be made for other individual ele-ments, we infer that the incompatible trace element
( )T. Furman, D. GrahamrLithos 48 1999 237–262250
features of mafic rift lavas have not been affected bycrustal assimilation and can be used to fingerprintthe source region.
3.3.1. Regional patterns of incompatible trace ele-ment enrichment
There are key similarities throughout the rift sys-tem in the covariations of certain incompatible ele-ments such as K, Ba, Rb, Th, Nb and La. Consistentgeographic patterns of anomalous enrichment anddepletion suggest that regional mineralogical hetero-geneities in the underlying lithospheric mantle con-trol the distribution of these anomalies in the eruptedlavas.
The most obvious feature of the spidergrams isthe large negative potassium anomalies in lavas from
Ž .Kivu Bukavu group , Rungwe and Toro Ankole inthe western rift, and from Naivasha in the eastern riftŽ .Fig. 8 . The degree of relative K depletion does notcorrelate with the level of incompatible trace element
Ž .abundances cf. Rungwe and Muhavura; Fig. 8 orŽwith potassium content of the lavas cf. Toro Ankole
.and Muhavura; Fig. 8 . Relative potassium depletionŽ .is, however, correlated with Ba enrichment Fig. 8 .
Ba enrichment is reflected in BarRb values higherŽthan the primitive mantle estimate of ;11 Sun and
.McDonough, 1989 in samples from the Kivu Bukavugroup, Toro Ankole, Rungwe, Nyamuragira, Nyi-ragongo and all eastern rift localities. Individuallavas from Rungwe, Naivasha, Ol Tepesi and HuriHills have BarRb values ranging from ;18 to over100. Note that the Tshibinda group alkali basalts andultrapotassic lavas from Karisimbi and Muhavura donot show Ba enrichment or K depletion.
Covariation between Nb and Th illustrates thesame regional pattern in trace element enrichment.Samples from the Kivu Tshibinda group, Karisimbi,and Muhavura have NbrTh values close to the
Žestimated primitive mantle value of ;8 Sun and.McDonough, 1989 . In contrast, samples from the
Kivu Bukavu group, Rungwe, Toro Ankole, Ol Te-pesi and Huri Hills have NbrTh values ;12, andindicate a higher compatibility for Th in the mantlesource beneath these areas.
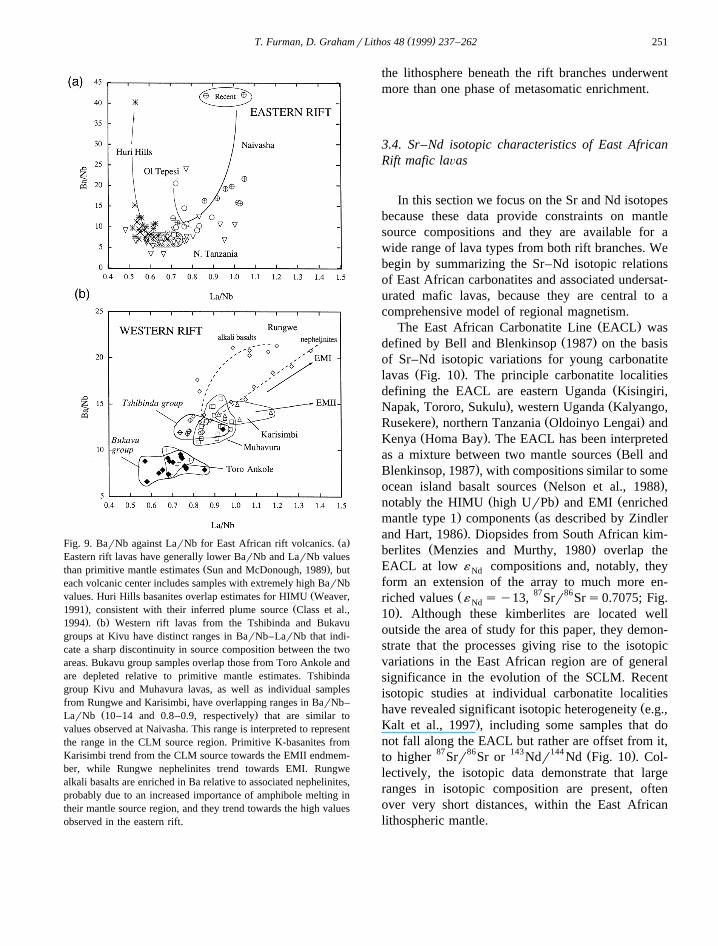
Patterns of variation in BarNb–LarNb also sug-gest involvement of several source regions with dis-tinct enrichment histories. Samples from the Kivu
Bukavu group and Toro Ankole have BarNb ratiosŽsimilar to primitive mantle estimates ;10; Sun and
.McDonough, 1989 but LarNb ratios between 0.6Žand 0.9, lower than primitive mantle values ;0.96;
.Fig. 9 . In contrast, mafic lavas from the KivuTshibinda group and Muhavura have LarNb ratiossimilar to primitive mantle but have higher BarNb
Ž .ratios 12–14 . Huri Hills basanites have BarNb–LarNb ratios that overlap the field of HIMU mantle
Žinferred from ocean island basalt Weaver, 1991;.Fig. 9 . Rungwe nephelinites and Karisimbi K-
basanites have large ranges in BarNb and LarNb,and form trends suggesting involvement of an en-
Ž .riched mantle EMII component, while alkali basaltsfrom Rungwe and Naivasha are relatively enrichedin Ba and trend towards EMI mantle. Alkali basaltsfrom Huri Hills and Ol Tepesi are also enriched inBa, and show increasing BarNb ratios at constant
Ž .LarNb Fig. 9 . These variations are characteristicof enriched mantle reservoirs identified for OIB, butwe suggest that they are present within the continen-tal lithosphere as well.
3.3.2. EÕidence for carbonatite metasomatismA diagnostic feature of metasomatized mantle is
Žan increase in ZrrHf value Dupuy et al., 1992;.Rudnick et al., 1993 , with values ranging between
;45 and 100. All rift samples have higher ZrrHfŽvalues than the primitive mantle ;36; Sun and
.McDonough, 1989 : average ZrrHf values for ToroAnkole, Muhavura, Karisimbi and the eastern riftprovinces range from 41–45. The elevated ZrrHfŽ .and overall high trace element abundances suggestthat small-volume metasomatic fluids have enrichedthe source regions for every province. Lavas fromthe Kivu Tshibinda group, Rungwe and Nyiragongohave the highest ZrrHf values, with individual sam-ples from these provinces between 60–83. Thesesame regions show enrichment in REE relative to
Ž .HFSE e.g., EurTi; Fig. 8 . Both of these signa-tures are characteristic of carbonatite metasomatismŽ .Dupuy et al., 1992; Rudnick et al., 1993 andsuggest that the source areas for these mafic lavaswere infiltrated by carbonate-rich magma. The geo-graphic distribution of this source signature differsfrom that just described on the basis of other incom-patible trace elements, and suggests that portions of
( )T. Furman, D. GrahamrLithos 48 1999 237–262 251
Ž .Fig. 9. BarNb against LarNb for East African rift volcanics. aEastern rift lavas have generally lower BarNb and LarNb values
Ž .than primitive mantle estimates Sun and McDonough, 1989 , buteach volcanic center includes samples with extremely high BarNb
Žvalues. Huri Hills basanites overlap estimates for HIMU Weaver,. Ž1991 , consistent with their inferred plume source Class et al.,. Ž .1994 . b Western rift lavas from the Tshibinda and Bukavu
groups at Kivu have distinct ranges in BarNb–LarNb that indi-cate a sharp discontinuity in source composition between the twoareas. Bukavu group samples overlap those from Toro Ankole andare depleted relative to primitive mantle estimates. Tshibindagroup Kivu and Muhavura lavas, as well as individual samplesfrom Rungwe and Karisimbi, have overlapping ranges in BarNb–
Ž .LarNb 10–14 and 0.8–0.9, respectively that are similar tovalues observed at Naivasha. This range is interpreted to representthe range in the CLM source region. Primitive K-basanites fromKarisimbi trend from the CLM source towards the EMII endmem-ber, while Rungwe nephelinites trend towards EMI. Rungwealkali basalts are enriched in Ba relative to associated nephelinites,probably due to an increased importance of amphibole melting intheir mantle source region, and they trend towards the high valuesobserved in the eastern rift.
the lithosphere beneath the rift branches underwentmore than one phase of metasomatic enrichment.
3.4. Sr–Nd isotopic characteristics of East AfricanRift mafic laÕas
In this section we focus on the Sr and Nd isotopesbecause these data provide constraints on mantlesource compositions and they are available for awide range of lava types from both rift branches. Webegin by summarizing the Sr–Nd isotopic relationsof East African carbonatites and associated undersat-urated mafic lavas, because they are central to acomprehensive model of regional magnetism.
Ž .The East African Carbonatite Line EACL wasŽ .defined by Bell and Blenkinsop 1987 on the basis
of Sr–Nd isotopic variations for young carbonatiteŽ .lavas Fig. 10 . The principle carbonatite localities
Ždefining the EACL are eastern Uganda Kisingiri,. ŽNapak, Tororo, Sukulu , western Uganda Kalyango,
. Ž .Rusekere , northern Tanzania Oldoinyo Lengai andŽ .Kenya Homa Bay . The EACL has been interpreted
Žas a mixture between two mantle sources Bell and.Blenkinsop, 1987 , with compositions similar to some
Ž .ocean island basalt sources Nelson et al., 1988 ,Ž . Žnotably the HIMU high UrPb and EMI enriched
. Žmantle type 1 components as described by Zindler.and Hart, 1986 . Diopsides from South African kim-
Ž .berlites Menzies and Murthy, 1980 overlap theEACL at low ´ compositions and, notably, theyNd
form an extension of the array to much more en-Ž 87 86riched values ´ sy13, Srr Srs0.7075; Fig.Nd
.10 . Although these kimberlites are located welloutside the area of study for this paper, they demon-strate that the processes giving rise to the isotopicvariations in the East African region are of generalsignificance in the evolution of the SCLM. Recentisotopic studies at individual carbonatite localities
Žhave revealed significant isotopic heterogeneity e.g.,.Kalt et al., 1997 , including some samples that do
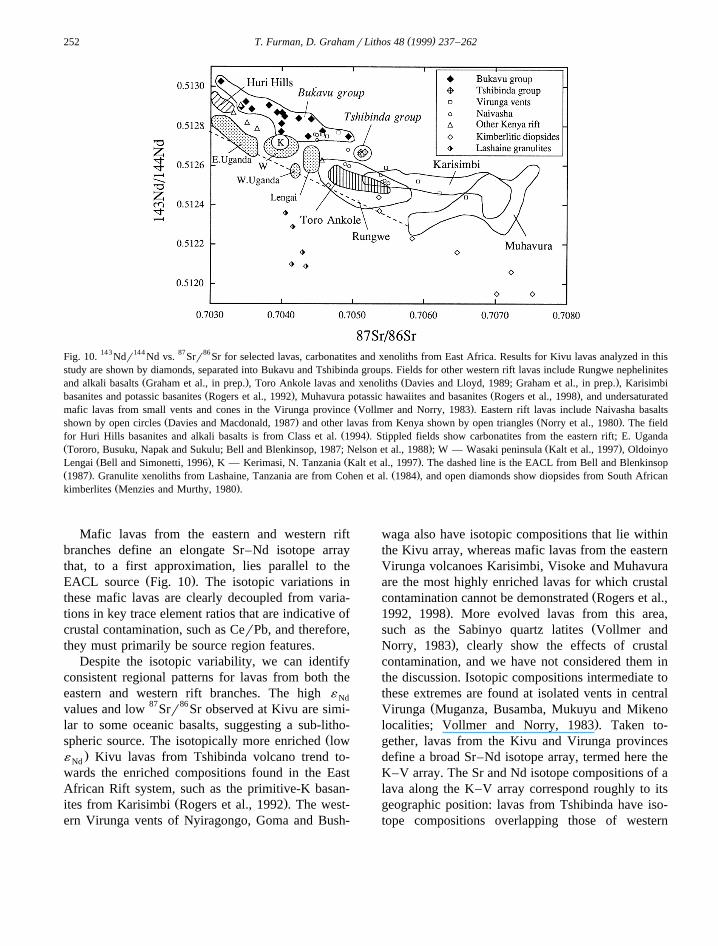
not fall along the EACL but rather are offset from it,87 86 143 144 Ž .to higher Srr Sr or Ndr Nd Fig. 10 . Col-
lectively, the isotopic data demonstrate that largeranges in isotopic composition are present, oftenover very short distances, within the East Africanlithospheric mantle.
( )T. Furman, D. GrahamrLithos 48 1999 237–262252
Fig. 10. 143Ndr144 Nd vs. 87Srr86 Sr for selected lavas, carbonatites and xenoliths from East Africa. Results for Kivu lavas analyzed in thisstudy are shown by diamonds, separated into Bukavu and Tshibinda groups. Fields for other western rift lavas include Rungwe nephelinites
Ž . Ž .and alkali basalts Graham et al., in prep. , Toro Ankole lavas and xenoliths Davies and Lloyd, 1989; Graham et al., in prep. , KarisimbiŽ . Ž .basanites and potassic basanites Rogers et al., 1992 , Muhavura potassic hawaiites and basanites Rogers et al., 1998 , and undersaturated
Ž .mafic lavas from small vents and cones in the Virunga province Vollmer and Norry, 1983 . Eastern rift lavas include Naivasha basaltsŽ . Ž .shown by open circles Davies and Macdonald, 1987 and other lavas from Kenya shown by open triangles Norry et al., 1980 . The field
Ž .for Huri Hills basanites and alkali basalts is from Class et al. 1994 . Stippled fields show carbonatites from the eastern rift; E. UgandaŽ . Ž .Tororo, Busuku, Napak and Sukulu; Bell and Blenkinsop, 1987; Nelson et al., 1988 ; W — Wasaki peninsula Kalt et al., 1997 , Oldoinyo
Ž . Ž .Lengai Bell and Simonetti, 1996 , K — Kerimasi, N. Tanzania Kalt et al., 1997 . The dashed line is the EACL from Bell and BlenkinsopŽ . Ž .1987 . Granulite xenoliths from Lashaine, Tanzania are from Cohen et al. 1984 , and open diamonds show diopsides from South African
Ž .kimberlites Menzies and Murthy, 1980 .
Mafic lavas from the eastern and western riftbranches define an elongate Sr–Nd isotope arraythat, to a first approximation, lies parallel to the
Ž .EACL source Fig. 10 . The isotopic variations inthese mafic lavas are clearly decoupled from varia-tions in key trace element ratios that are indicative ofcrustal contamination, such as CerPb, and therefore,they must primarily be source region features.
Despite the isotopic variability, we can identifyconsistent regional patterns for lavas from both theeastern and western rift branches. The high ´ Nd
values and low 87Srr86Sr observed at Kivu are simi-lar to some oceanic basalts, suggesting a sub-litho-
Žspheric source. The isotopically more enriched low.´ Kivu lavas from Tshibinda volcano trend to-Nd
wards the enriched compositions found in the EastAfrican Rift system, such as the primitive-K basan-
Ž .ites from Karisimbi Rogers et al., 1992 . The west-ern Virunga vents of Nyiragongo, Goma and Bush-
waga also have isotopic compositions that lie withinthe Kivu array, whereas mafic lavas from the easternVirunga volcanoes Karisimbi, Visoke and Muhavuraare the most highly enriched lavas for which crustal
Žcontamination cannot be demonstrated Rogers et al.,.1992, 1998 . More evolved lavas from this area,
Žsuch as the Sabinyo quartz latites Vollmer and.Norry, 1983 , clearly show the effects of crustal
contamination, and we have not considered them inthe discussion. Isotopic compositions intermediate tothese extremes are found at isolated vents in central
ŽVirunga Muganza, Busamba, Mukuyu and Mikeno.localities; Vollmer and Norry, 1983 . Taken to-
gether, lavas from the Kivu and Virunga provincesdefine a broad Sr–Nd isotope array, termed here theK–V array. The Sr and Nd isotope compositions of alava along the K–V array correspond roughly to itsgeographic position: lavas from Tshibinda have iso-tope compositions overlapping those of western
( )T. Furman, D. GrahamrLithos 48 1999 237–262 253
Virunga, whereas lavas from the Bukavu group havelower 87Srr86Sr and those from eastern Virunga
87 86 Ž .have higher Srr Sr Fig. 10 .Sr and Nd isotopic analyses for mafic lavas from
Rungwe, and lavas and xenoliths from the Toro-ŽAnkole province Davies and Lloyd, 1989; Graham
.et al., in preparation define smaller clusters locatedbetween the EACL and the K–V array. Rungwenephelinites and basanites show a near-horizontalNd–Sr trend very much like lavas from Toro-Ankole,while Rungwe alkali basalts lie close to the EACL,but are displaced slightly towards the K–V array.While the isotopic data for both the Toro-Ankole andRungwe suites clearly show that their source regionsare heterogeneous, the range of variation is muchsmaller than that observed in the Kivu and Virungaprovinces, and it does not correspond in any simpleway to geographic location.
Lavas from the eastern branch of the rift have Srand Nd isotope compositions that overlap both theK–V array and the range of Rungwe and Toro-Ankole lavas. Lavas from Huri Hills show lower87Srr86Sr for a given 143Ndr144 Nd as compared tothe Kivu province, and lie near the most depletedŽ . Ž .high ´ part of the K–V array Fig. 10 . AmongNd
the Naivasha suite, the oldest Pleistocene lavas plotalong the K–V array with compositions similar to
ŽNyiragongo and its adjacent vents Davies and Mac-. Ždonald, 1987 . Later Pleistocene basalts Naivasha II
. 87 86in Fig. 10 plot among the highest Srr Sr samplesfrom Rungwe and Toro Ankole, while RecentNaivasha basalts have isotopic values that fall be-tween the other two age groups. Mafic lavas from
Ž .northern Tanzania Paslick et al., 1995 show a rangein Sr–Nd isotopes similar to that observed at
Ž .Naivasha Fig. 10 . Notably, two lavas from Es-Ž .simingor span the entire range ´ s2.4 to y4.9 ,Nd
again indicating a source region that is heteroge-neous on a short length scale.
3.5. Isotope and trace element characteristics oflithospheric mantle sources
The extreme Sr–Nd isotopic variability of EastAfrican Rift lavas requires melting of heterogeneousmantle sources dominantly located in the continental
Žlithospheric mantle e.g., Vollmer and Norry, 1983;.Rogers et al., 1992, 1998; Williams and Gill, 1992 .
Despite this isotopic variability, western rift lavasshow a convergence in Sr,Nd,Pb isotopes nearvalues of 87Srr86Sr ;0.7050, 143Ndr144 Nd ;
Ž . 206 204 Ž0.51264 ´ ;0 and Pbr Pb ;19.0 GrahamNd.et al., 1995 . The isotopic convergence is defined by
a relatively small range of common values found atall western rift and some eastern rift volcanoes. Thefull range in values for individual provinces extendsaway from this convergence to distinct compositionscharacteristic of each area. We observe this conver-gence among selected lavas from Kivu and RungweŽdata from this study and Graham et al., in prepara-
. Žtion , Toro Ankole Davies and Lloyd, 1989; Gra-.ham et al., in preparation , Karisimbi and Muhavura
Ž . ŽRogers et al., 1992, 1998 , Naivasha Davies and. ŽMacdonald, 1987 and northern Tanzania Paslick et
.al., 1995 . Each volcanic province examined, exceptHuri Hills, has some samples with 87Srr86Sr ;
143 144 Ž . Ž0.7050 and Ndr Nd ;0.51264 ´ ;0 Fig.Nd.10 . Mafic lavas from Rungwe and Toro Ankole
show a restricted range and lie near the convergencein Sr and Nd isotopes, extending slightly towards theEACL. In contrast, other volcanic areas that displaya large isotopic range, including Kivu, Karisimbi,Muhavura, Naivasha and northern Tanzania, definedistinct trends in Sr–Nd isotopes that radiate awayfrom the convergence in isotope composition ratherthan straddling it. This pattern suggests to us that aCLM source having isotope compositions near thisconvergence is available beneath each of these vol-canic areas. The CLM source may, however, be
Ž .intimately mixed laterally or vertically with othersource materials having different isotope composi-tions, and these may be distinct for each volcanicarea.
Within each volcanic area, many incompatibletrace element ratios vary as a function of lava type
Žandror Sr–Nd isotopic composition Marcelot et al.,1989; Rogers et al., 1992, 1998; Class et al., 1994;
.Furman, 1995 . Thus, the trace element variationsfor individual areas typically reflect small-scale in-termingling of distinct sources or their derivativemelts. Considering the eastern and western riftdatasets together, there are certain incompatible traceelement ratios, such as LarNb and BarNb, whichoverlap among several sample suites, and which alsoshow characteristics consistent with a CLM sourceidentified from Sr–Nd isotopes. Variations in LarNb,
( )T. Furman, D. GrahamrLithos 48 1999 237–262254
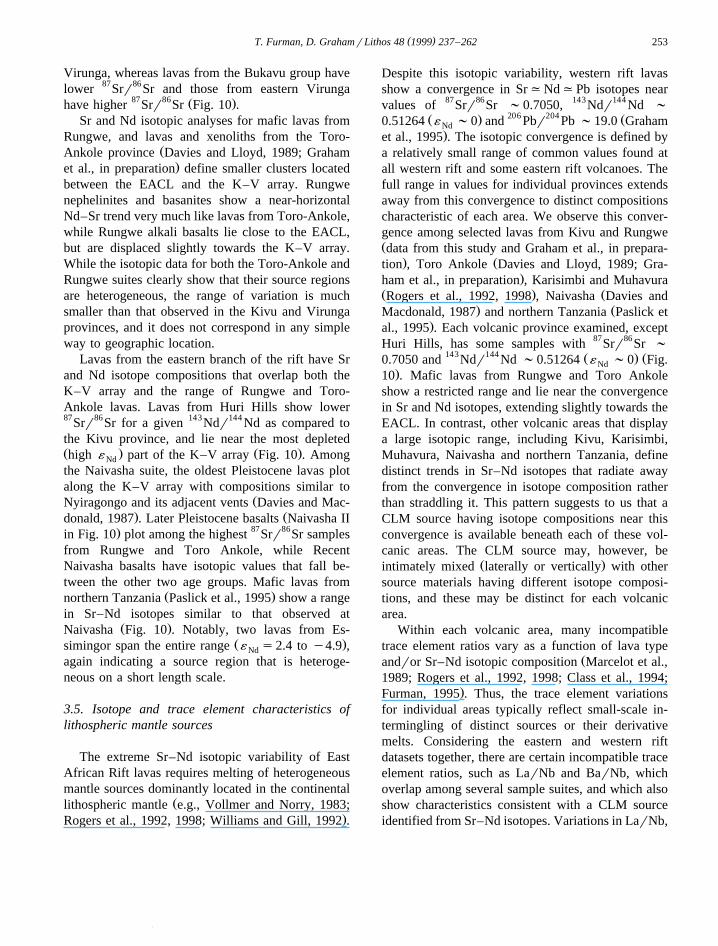
Fig. 11. Relationships between 143Ndr144 Nd and incompatibletrace element ratios. These variations allow a characterization ofthe CLM source. Lavas from the Tshibinda group at Kivu,Muhavura, Karisimbi, Rungwe, Toro Ankole and Naivasha definetrends that converge at a narrow range of values. See text for full
Ž . 143 144 Ž . 143 144discussion. A LarNb– Ndr Nd. B BarNb– Ndr Nd
143 144 Ž .BarNb and NbrTh against Ndr Nd Fig. 11reveal a small field of overlapping values among
Ž .samples from Kivu Tshibinda , Karisimbi,Muhavura, Rungwe, Toro Ankole and Naivasha.Trends for each volcanic province have differentslopes and orientations, but they converge at a com-mon area. Like the Sr–Nd–Pb isotope systematics
Ž .described by Graham et al. 1995 , overlap does notoccur at a single value but rather requires a smallrange and, by inference, some degree of isotopic andtrace element heterogeneity in the CLM source.
3.6. Mineralogy of the lithospheric mantle source
An accurate knowledge of the source mineralogyfor lithospheric melts can place important constraints
on the thermal structure of the subcontinental mantle.In the case of the African Rift system, variations inthe depth of melting along and across the rift axesmay be used to infer the degree of asthenosphericupwelling and hence, the three-dimensional shape ofthe plume head. A general picture of the shape of theplume is available from detailed geophysical studiesŽ .e.g., Simiyu and Keller, 1997 , but the presence ofmineralogical barometers such as garnet, amphiboleand phlogopite in the source region for mafic riftlavas offers an increase in resolution of the shallowlithospheric structure, and ultimately, it can provideestimates of the rate of lithospheric erosion or thin-ning. We note that the low estimates of crustal
Žextension across, in particular, the western rift -.15%, Ebinger, 1989b , favor a model of lithospheric
erosion rather than one of extensional thinning. Inthis section, we outline the inferred source mineral-ogy along both rift branches, identifying features ofthe CLM source as well as those of other parts of thelithospheric mantle that contribute to African riftvolcanism.
Several lines of evidence suggest that garnet ispresent in the source regions of most western rift
Ž .mafic lavas. The high LarYb values and thenŽ .concave-upward spidergrams Fig. 8 of lavas from
the Kivu Tshibinda group, Rungwe, Toro Ankole,Karisimbi, Muhavura and Nyiragongo indicate thatthe HREE are more compatible than LREE andMREE in the source residue. This feature is alsopresent in some, but not all, of the Bukavu group
Ž .lavas from Kivu. Furman 1995 used a REE inver-sion model to infer that melting at Rungwe occurs
Žwithin the spinel–garnet transition zone ;60–80. Ž .km . REE abundances and LarYb values atn
Muhavura that are similar to those at Rungwe ledŽ .Rogers et al. 1998 to infer a comparable melting
depth beneath eastern Virunga. In eastern rift lavas,the geochemical evidence for residual garnet in the
Ž .mantle source is more equivocal, as high LarYb n
values are found only in Huri Hills basanites. HREEabundances in lava suites from Ol Tepesi andNaivasha are markedly more variable than thosefrom the western rift volcanoes. Spinel- and garnet-bearing lherzolite xenoliths found at Marsabit innorthern Kenya and the Chyulu volcanic field in
Ž .southern Kenya Henjes-Kunst and Altherr, 1992suggest that melting occurs at or below the depth

( )T. Furman, D. GrahamrLithos 48 1999 237–262 255
where garnet becomes stable in these areas. Thesesites are both located east of the main rift and mayrecord different melting processes than those beneaththe rift axis.
Relative abundances of the alkali and alkalineearth elements can be used to assess the presence ofamphibole andror phlogopite in the mantle sourceregion. These phases are important because they canattest to the metasomatic enrichment history of thesource region, as well as helping to constrain thedepth of melting. Both Rb and Ba are compatible in
Ž .phlogopite LaTourette et al., 1995 , while Rb, Srand Ba are moderately compatible in amphiboleŽ .Adam et al., 1993; LaTourette et al., 1995 . Melts inequilibrium with phlogopite are expected to havesignificantly higher RbrSr and lower BarRb valuesthan those formed from amphibole-bearing sources.Conversely, melts of an amphibole-bearing sourcemay have extremely high Ba contents and BarRbvalues.
Several lines of evidence suggest that ultrapotas-sic lavas from Toro Ankole, Karisimbi and Muhavuraformed through melting of a phlogopite-bearinglithospheric mantle source. These lavas have high
Ž . Ž . ŽRbrSr )0.10 and low BarRb values -20 Fig..12 . They also incorporate micaceous xenoliths
ŽHolmes and Harwood, 1937; Lloyd and Bailey,.1975; Davies and Lloyd, 1989; Lloyd et al., 1991
Ž .andror phlogopite xenocrysts Rogers et al., 1998 .Experimental stability estimates for phlogopite-bearing assemblages suggest melt formation at pres-sures near 30–35 kbar, or depths of 90–100 kmŽOlafsson and Eggler, 1983; Wallace and Green,
.1988; Lloyd et al., 1991; Sato et al., 1997 .In contrast, lavas from many volcanic areas have
Ž .low K OrNa O -0.75 and low RbrSr values2 2Ž .-0.06, Fig. 12 , consistent with melting of anamphibole-bearing source. Tshibinda group lavasfrom Kivu have higher RbrSr values than Bukavugroup lavas with similar BarRb values, suggestingthat a small amount of phlogopite may have beenpresent in the source prior to the onset of meltingbeneath this area. It is also significant that low-MgOmafic lavas from Muhavura, Karisimbi and ToroAnkole have BarRb–RbrSr values that overlapthose of the Tshibinda group.
We suggest that the CLM source is a spinel–garnetlherzolite containing small amounts of amphibole
andror phlogopite and perhaps other minor, metaso-Ž .matic phases. Dawson and Smith 1988, 1992 de-
scribe xenoliths from northern Tanzania that containboth amphibole and phlogopite, and suggest that theyresult from metasomatic infiltration by ultra-alkalinekatungite lava. These observations suggest awidespread enrichment event beneath both the east-ern and western rift branches, although a commontiming remains to be demonstrated. A small numberof alkali basalts from Huri Hills, Naivasha, Ol Te-pesi, Rungwe and northern Tanzania have high
Ž .BarRb values )50, Fig. 12 that suggest meltingŽ .of amphibole-bearing phlogopite-free lherzolite. In
all cases, these samples appear to be contemporane-ous with lavas derived from the CLM source. On alocal scale, it is difficult to distinguish differences inthe history of metasomatic enrichment from differ-ences in phase stability structure of the underlyinglithospheric mantle. We therefore suggest that theeruption of lavas closely spaced in time, but derivedfrom mantle regions having very different sourcemineralogy, is most simply explained by melt gener-ation over a range of depths beneath each volcanicprovince.
The minor phase mineralogy of the CLM sourceis difficult to constrain and, indeed, may vary on a
Ž .very short spatial scale Furman, 1995 . In this study,values of NbrTh correlate negatively with RbrSrŽ . ŽFig. 12 and hence, positively with BarRb not
.shown . This relationship is apparent both within andbetween suites of lavas, and suggests that the NbrThsystematics of erupted melts may also be controlledby the source mineralogy. We suggest two interpreta-tions that are consistent with the observed regionaltrends, and that may help further constrain the CLMsource mineralogy. First, because Nb is more com-
Žpatible in amphibole than in phlogopite LaTourette.et al., 1995; Ionov et al., 1997 , the progressive
removal of phlogopite from amphiboleqphlogopitecould produce the observed variations. Second, oxideminerals that form during alkali-rich metasomatismmay control Nb abundances throughout the melting
Ž .process Ionov et al., 1999 . Additional work onxenolith suites may prove essential to resolving thisquestion.
Ž .Class and Goldstein 1997 have discussed evi-dence for the presence of amphibole and phlogopitein the mantle sources for some ocean island basalts,

( )T. Furman, D. GrahamrLithos 48 1999 237–262256
Ž .Fig. 12. Variations in incompatible trace element ratios that may constrain source mineralogy. A RbrSr vs. BarRb. The mineralogy of theCLM source is inferred to include minor amounts of both amphibole and phlogopite. The field indicated that CLM was drawn to enclose
Ž .samples identified to have been derived from the CLM source on the basis of isotopic and trace element relationships see text . High RbrSrŽ .and BarRb values of all rift samples relative to primitive mantle estimates PM; Sun and McDonough, 1989 appear to require a widespread
Ž .enrichment metasomatic event. Extremely high RbrSr values at Toro Ankole, Muhavura and Karisimbi indicate a greater importance ofphlogopite melting in the lithospheric mantle source, whereas high BarRb among eastern rift lavas and Rungwe alkali basalts indicatephlogopite-absent melting of amphibole lherzolite. The amphibole-rich source likely results from carbonatite metasomatism in some cases,
Ž .whereas abundant phlogopite suggests a relatively higher H OrCO ratio in the metasomatic agent. B RbrSr vs. NbrTh. High RbrSr2 2Ž .values indicative of phlogopite in the source region are correlated with low NbrTh values. This relationship is consistent with progressive
melting of phlogopite from a phlogopiteqamphibole lithospheric source, and also with the presence of oxide mineral phases that retain Nbduring melting. Both scenarios are consistent with the proposed origin of the CLM source region; see text for discussion.
( )T. Furman, D. GrahamrLithos 48 1999 237–262 257
and suggest that metasomatism of the oceanic litho-sphere by small volume silicate melts plays an im-portant role in ocean island magmatism. In theAfrican western rift, model ages for the differentisotope systems suggest metasomatic events beneathNyiragongo at ;490 Ma near the close of the
ŽPan-African Vollmer and Norry, 1983; Vollmer et.al., 1985 , and between ;750 and 1000 Ma during
Žthe Kibaran orogeny Rogers et al., 1992; Graham et.al., in preparation for the CLM source. The corre-
spondence of model ages with known orogenic eventsis consistent with a lithospheric mantle source for thetrace and minor element inventory of most western
Ž .rift volcanics Rogers et al., 1992 . Relics of mucholder events, perhaps dating to Archean, may also be
Žpreserved in their Pb isotope compositions Rogers.et al., 1992; Graham et al., in preparation , but
modeling of those multi-stage histories is more un-certain. The pattern of REErHFSE enrichment ob-served at Rungwe, Nyiragongo, Toro Ankole and the
Ž .Tshibinda sector of Kivu Fig. 7 is indicative ofcarbonatite metasomatism, but the effects appear tobe geographically restricted and may be unrelated toformation of the amphibole- and phlogopite-bearingCLM source. It is worth noting that lavas from twoof the areas affected by carbonatite metasomatism,Rungwe and Toro Ankole, have Sr–Nd isotope com-positions that trend from the CLM source towardsthe EACL.
3.7. Inferred Õariations in lithosphere thickness anderosion
Our observations suggest that the CLM source isavailable beneath the entire African Rift system, anarea of roughly 1,000,000 km2. The evidence foramphibole, phlogopite, spinel and garnet in this man-tle source suggests that the most prevalent depth oflithospheric melting is roughly 65–80 km. Ultra-potassic lavas from eastern Virunga and Toro Ankolerequire melting at depths greater than ;80 km,whereas alkali basalts from Rungwe, Huri Hills andNaivasha indicate melting at depths shallower than;65 km. In addition, other lithospheric mantlesources identified by the range of isotopes andtrace elements for individual volcanic areas suggest
variations in lithospheric thickness over short dis-tances.
At Huri Hills, and in the Tshibinda and Bukavusectors of the Kivu province, lavas show trendstowards isotope compositions resembling those for
Žsome ocean island basalts HIMU-like, in the termi-.nology of Zindler and Hart, 1986 . This observation
suggests that there may be a significant sub-litho-spheric contribution in these two areas, and that thelithospheric mantle may contribute little, if any, meltto local magmatism. This Kivu mantle source clearly
Žhas all the trace element and isotopic Sr, Nd, Pb and.He characteristics found at HIMU oceanic islands
Žsuch as St. Helena Weaver, 1991; Graham et al.,.1992, 1995 . Based on geochemical arguments alone,
the origin of the Kivu lavas is equivocal. They mayrepresent magmas derived by melting of metasoma-
Žtized subcontinental lithosphere e.g., McKenzie and.O’Nions, 1995 . Alternatively, they may have a
deeper, mantle plume origin. The presence of aplume in the region is consistent with the geophysi-cal arguments for the uplift of the East African
Ž .Plateau e.g., Griffiths and Campbell, 1991 . Thewide range in isotope and trace element composi-tions in the Kivu volcanic province, from HIMUtype to CLM source values, appears consistent withstrong interaction of upwelling plume material withthe lithosphere beneath this area. This implies activelithospheric erosion, but confined to a relativelysmall area in the western rift.
Our inferred lithospheric thickness variationsbased on geochemical arguments are generally con-sistent with evidence from gravity surveys and seis-mic profiles carried out throughout the rift systemŽe.g., KRISP Working Group, 1987, 1991; Simiyu
.and Keller, 1997 . In the eastern rift, the lithosphereis thinnest beneath the Huri Hills region: seismicprofiles and gravity models indicate a crustal thick-ness of ;20 km and in some areas do not require
Žthe presence of any lithospheric mantle e.g., Hen-.drie et al., 1994; Simiyu and Keller, 1997 . The
mantle velocity structure inferred from seismic re-Žfraction and wide-angle reflection experiments e.g.,
.KRISP Working Group, 1987, 1991 suggest that theonset of melting occurs at a depth of ;65 km. Thisconclusion is compatible with the range of erupted
Ž .mafic lavas, which include both plume-like HIMUcompositions and lithospheric melts, as well as the
( )T. Furman, D. GrahamrLithos 48 1999 237–262258
inferred presence of garnet in the mantle sourceŽ .Class et al., 1994 . Both crust and lithosphere thickenaway from Huri Hills: garnet- and spinel-lherzolitexenoliths suggest crustal and lithospheric thicknessesof 30 and 45 km, respectively, east of the rift at
Ž .Marsabit Henjes-Kunst and Altherr, 1992 . Xenolithequilibration temperatures and pressures suggest thatthe crust thickens to a maximum depth of 42 km anda lithosphere which is ;73 km thick in southernKenya; the lithospheric thickness increases to ;100
Žkm in northern Tanzania Henjes-Kunst and Altherr,.1992; Dawson, 1994 . Lavas from Naivasha that
sample the CLM source therefore occur in an areawith crustal thickness between 30 and 42 km, andlithospheric thickness between 45 and 73 km, i.e., atdepths of 75–115 km.
In the western rift, our interpretations generallyagree with those based on geophysical investigations,although they differ slightly in detail. Geochemicalconsiderations would indicate that the lithosphere isthickest beneath Toro Ankole and the eastern Virungaprovince. Away from there, the lithosphere thinsrapidly westward towards Kivu and gradually south-
Ž .ward towards Rungwe. Simiyu and Keller 1997infer a mantle gravity anomaly at a depth of ;60km beneath the western rift axis, centered betweenthe Virunga and Toro Ankole provinces. In theirmodel, the depth to the mantle anomaly decreases to
Ž .50 km at 38S latitude south of the Kivu province ,and increases rapidly to the north, where the anomalycannot be recognized at 38N latitude. This impliesthat any actively upwelling asthenosphere is mostlikely to be present beneath the northern portions of
Ž .Lake Tanganyika and beneath the southern Bukavusector of the Kivu province. We suggest that else-where along the western rift, the asthenosphere hasnot been able to ascend to sufficiently shallow depthsfor melting, because tectonic extension and litho-spheric erosion are both very limited. This is sup-ported by the observation that many of the lavaserupted in Quaternary time carry a record of meltingof a phlogopite-bearing clinopyroxenite source. Ourpreferred explanation, based on the geochemical andgeophysical observations, is that lithospheric erosionŽ .i.e., to depths shallower than ;60–80 km appearsto be restricted in the western rift to the southernportions of the Kivu volcanic province and the north-ern portions of Lake Tanganyika.
4. Summary
Mafic lavas from the Kivu volcanic provincedisplay a wide range in incompatible trace element
Ž .abundances e.g., crossing REE patterns and Sr–Ndisotope ratios. All Kivu lavas have elevated incom-patible trace element contents relative to MORB andthe estimated primitive mantle, requiring that thesource region has been enriched by one or moremetasomatic events. Samples from Tshibinda vol-cano, which lies on a major rift border fault at thenorthwestern margin of the province, have geochem-ical features that are distinct from the majority of
Ž .Kivu Bukavu lavas. Tshibinda lavas have, for ex-87 86 Ž .ample, the highest values of Srr Sr, LarSm ,n
BarNb, and ZrrHf observed among Kivu samples.Sr–Nd isotopic values at Tshibinda trend towardsenriched compositions found in the neighboringVirunga province, while Bukavu group lavas includethe lowest 87Srr86Sr and highest ´ measured inNd
western rift lavas.The Tshibinda lavas are geochemically distinct
within the Kivu province, but their Sr–Nd isotopiccompositions and certain incompatible trace element
Ž .ratios e.g., LarNb, BarNb, RbrSr trend towardsvalues that are common to several rift volcanic
Ž .provinces. Graham et al. 1995 demonstrated thatselected lavas from the Kivu, Virunga, Toro Ankoleand Rungwe volcanic provinces have Sr–Nd–Pbisotopic compositions that converge upon a narrowrange of values, and inferred the existence of a CLMsource region. There are consistent trace elementcharacteristics of the CLM source as well, and theyhelp to constrain its mineralogy. This source materialappears to be present beneath both the eastern andwestern rift branches.
The CLM source contains small amounts of bothamphibole and phlogopite, as indicated by the geo-chemistry of mafic lavas and supported by the min-eralogy of mantle xenoliths found in northern Tanza-
Ž .nia Dawson and Smith, 1988, 1992 . This modalmineralogy requires at least one metasomatic enrich-
Ž .ment event, which Dawson and Smith 1988 at-tribute to ultra-alkaline katungite. Models of REE
Žabundances in mafic rift lavas Latin et al., 1993;.Furman, 1995 and lherzolite xenoliths from Kenya
suggest that melting dominantly occurs near theŽ .spinel–garnet transition ;60–80 km , where both
( )T. Furman, D. GrahamrLithos 48 1999 237–262 259
phlogopite and amphibole are likely to be stable inthe continental lithosphere. Based on experimental
Ž .studies e.g., Lloyd et al., 1991 , some ultrapotassiclavas from Toro Ankole and the Virunga provinceare derived by melting of a more phlogopite-richsource, and therefore probably originate from some-
Žwhat greater depths than the CLM source cf. Olafs-.son and Eggler, 1983 .
The geochemical evidence allows estimates ofvariations in lithospheric thickness along the easternand western rift branches, and these variations aregenerally consistent with those inferred from geo-physical evidence. In the eastern rift, it is significantthat the CLM signature is not observed in maficlavas from Huri Hills, Kenya, where geophysical
Žstudies e.g., Hendrie et al., 1994; Simiyu and Keller,.1997 do not require any lithospheric mantle to be
present between the crust and upwelling astheno-sphere. Both the crust and lithosphere thicken south-ward, and in the Naivasha region, their combined
Žthickness may be as much as 75–115 km Henjes-.Kunst and Altherr, 1992; Simiyu and Keller, 1997 .
In the western rift, the lithosphere is thickest beneatheastern Virunga and Toro Ankole, and thinnest near
the Bukavu sector of the Kivu province. These ob-servations suggest that the Kivu province is above aregion of active lithospheric erosion, where interac-tion between upwelling asthenosphere and metasom-atized lithosphere produces the very wide range inisotopic and trace elemental signatures of the eruptedlavas.
Acknowledgements
Funding for this research comes from the EarthŽSciences Division of NSF grants 9508112 to T.F.,
.9304156 and 9614508 to D.G. . We are grateful toC. Ebinger for providing samples, to M. Rhodes andM. Chapman for patient assistance in obtaining XRFanalyses, and to F. Frey and P. Ila for their generos-ity in providing INAA. D.G. thanks George Tiltonfor graciously providing access to the clean lab andmass spectrometer at UCSB. T.F. thanks A. Up-church for her careful work in helping prepare themaps. Thoughtful comments from W. McDonough,N. Rogers and an anonymous reviewer helped im-prove the final manuscript.
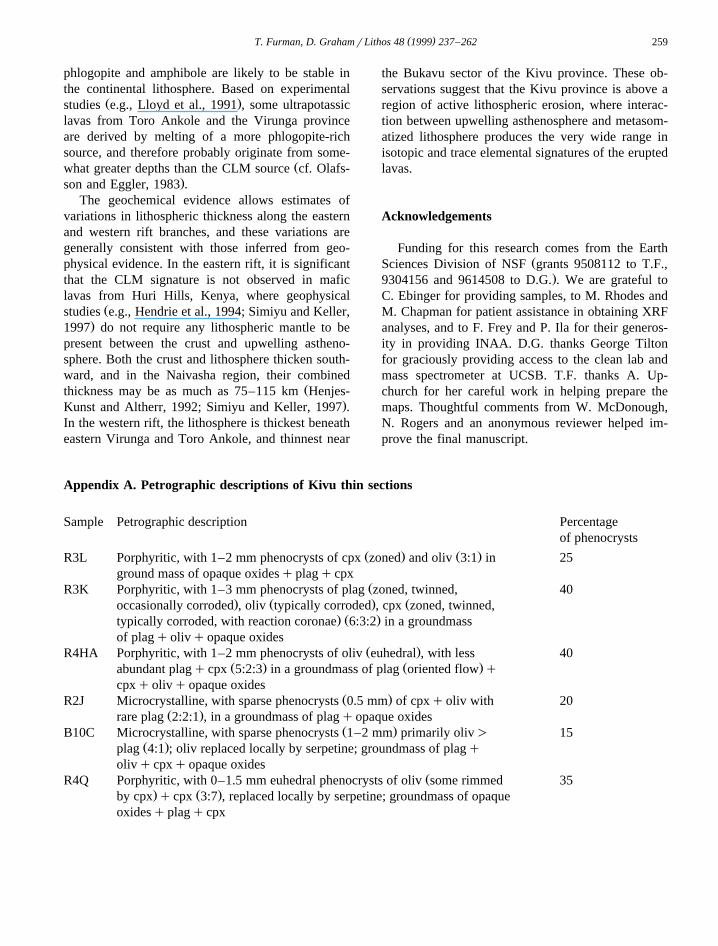
Appendix A. Petrographic descriptions of Kivu thin sections
Sample Petrographic description Percentageof phenocrysts
Ž . Ž .R3L Porphyritic, with 1–2 mm phenocrysts of cpx zoned and oliv 3:1 in 25ground mass of opaque oxidesqplagqcpx
ŽR3K Porphyritic, with 1–3 mm phenocrysts of plag zoned, twinned, 40. Ž . Žoccasionally corroded , oliv typically corroded , cpx zoned, twinned,
. Ž .typically corroded, with reaction coronae 6:3:2 in a groundmassof plagqolivqopaque oxides
Ž .R4HA Porphyritic, with 1–2 mm phenocrysts of oliv euhedral , with less 40Ž . Ž .abundant plagqcpx 5:2:3 in a groundmass of plag oriented flow q
cpxqolivqopaque oxidesŽ .R2J Microcrystalline, with sparse phenocrysts 0.5 mm of cpxqoliv with 20
Ž .rare plag 2:2:1 , in a groundmass of plagqopaque oxidesŽ .B10C Microcrystalline, with sparse phenocrysts 1–2 mm primarily oliv) 15
Ž .plag 4:1 ; oliv replaced locally by serpetine; groundmass of plagqolivqcpxqopaque oxides
ŽR4Q Porphyritic, with 0–1.5 mm euhedral phenocrysts of oliv some rimmed 35. Ž .by cpx qcpx 3:7 , replaced locally by serpetine; groundmass of opaque
oxidesqplagqcpx
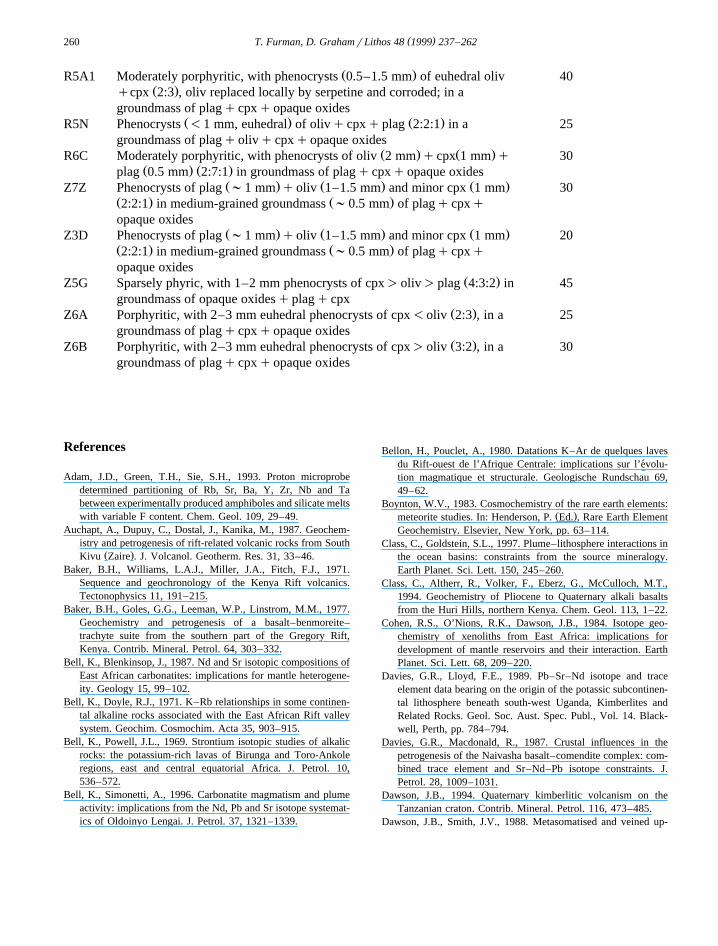
( )T. Furman, D. GrahamrLithos 48 1999 237–262260
Ž .R5A1 Moderately porphyritic, with phenocrysts 0.5–1.5 mm of euhedral oliv 40Ž .qcpx 2:3 , oliv replaced locally by serpetine and corroded; in a
groundmass of plagqcpxqopaque oxidesŽ . Ž .R5N Phenocrysts -1 mm, euhedral of olivqcpxqplag 2:2:1 in a 25
groundmass of plagqolivqcpxqopaque oxidesŽ . Ž .R6C Moderately porphyritic, with phenocrysts of oliv 2 mm qcpx 1 mm q 30
Ž . Ž .plag 0.5 mm 2:7:1 in groundmass of plagqcpxqopaque oxidesŽ . Ž . Ž .Z7Z Phenocrysts of plag ;1 mm qoliv 1–1.5 mm and minor cpx 1 mm 30
Ž . Ž .2:2:1 in medium-grained groundmass ;0.5 mm of plagqcpxqopaque oxides
Ž . Ž . Ž .Z3D Phenocrysts of plag ;1 mm qoliv 1–1.5 mm and minor cpx 1 mm 20Ž . Ž .2:2:1 in medium-grained groundmass ;0.5 mm of plagqcpxqopaque oxides
Ž .Z5G Sparsely phyric, with 1–2 mm phenocrysts of cpx)oliv)plag 4:3:2 in 45groundmass of opaque oxidesqplagqcpx
Ž .Z6A Porphyritic, with 2–3 mm euhedral phenocrysts of cpx-oliv 2:3 , in a 25groundmass of plagqcpxqopaque oxides
Ž .Z6B Porphyritic, with 2–3 mm euhedral phenocrysts of cpx)oliv 3:2 , in a 30groundmass of plagqcpxqopaque oxides
References
Adam, J.D., Green, T.H., Sie, S.H., 1993. Proton microprobedetermined partitioning of Rb, Sr, Ba, Y, Zr, Nb and Tabetween experimentally produced amphiboles and silicate meltswith variable F content. Chem. Geol. 109, 29–49.
Auchapt, A., Dupuy, C., Dostal, J., Kanika, M., 1987. Geochem-istry and petrogenesis of rift-related volcanic rocks from South
Ž .Kivu Zaire . J. Volcanol. Geotherm. Res. 31, 33–46.Baker, B.H., Williams, L.A.J., Miller, J.A., Fitch, F.J., 1971.
Sequence and geochronology of the Kenya Rift volcanics.Tectonophysics 11, 191–215.
Baker, B.H., Goles, G.G., Leeman, W.P., Linstrom, M.M., 1977.Geochemistry and petrogenesis of a basalt–benmoreite–trachyte suite from the southern part of the Gregory Rift,Kenya. Contrib. Mineral. Petrol. 64, 303–332.
Bell, K., Blenkinsop, J., 1987. Nd and Sr isotopic compositions ofEast African carbonatites: implications for mantle heterogene-ity. Geology 15, 99–102.
Bell, K., Doyle, R.J., 1971. K–Rb relationships in some continen-tal alkaline rocks associated with the East African Rift valleysystem. Geochim. Cosmochim. Acta 35, 903–915.
Bell, K., Powell, J.L., 1969. Strontium isotopic studies of alkalicrocks: the potassium-rich lavas of Birunga and Toro-Ankoleregions, east and central equatorial Africa. J. Petrol. 10,536–572.
Bell, K., Simonetti, A., 1996. Carbonatite magmatism and plumeactivity: implications from the Nd, Pb and Sr isotope systemat-ics of Oldoinyo Lengai. J. Petrol. 37, 1321–1339.
Bellon, H., Pouclet, A., 1980. Datations K–Ar de quelques lavesdu Rift-ouest de l’Afrique Centrale: implications sur l’evolu-´tion magmatique et structurale. Geologische Rundschau 69,49–62.
Boynton, W.V., 1983. Cosmochemistry of the rare earth elements:Ž .meteorite studies. In: Henderson, P. Ed. , Rare Earth Element
Geochemistry. Elsevier, New York, pp. 63–114.Class, C., Goldstein, S.L., 1997. Plume–lithosphere interactions in
the ocean basins: constraints from the source mineralogy.Earth Planet. Sci. Lett. 150, 245–260.
Class, C., Altherr, R., Volker, F., Eberz, G., McCulloch, M.T.,1994. Geochemistry of Pliocene to Quaternary alkali basaltsfrom the Huri Hills, northern Kenya. Chem. Geol. 113, 1–22.
Cohen, R.S., O’Nions, R.K., Dawson, J.B., 1984. Isotope geo-chemistry of xenoliths from East Africa: implications fordevelopment of mantle reservoirs and their interaction. EarthPlanet. Sci. Lett. 68, 209–220.
Davies, G.R., Lloyd, F.E., 1989. Pb–Sr–Nd isotope and traceelement data bearing on the origin of the potassic subcontinen-tal lithosphere beneath south-west Uganda, Kimberlites andRelated Rocks. Geol. Soc. Aust. Spec. Publ., Vol. 14. Black-well, Perth, pp. 784–794.
Davies, G.R., Macdonald, R., 1987. Crustal influences in thepetrogenesis of the Naivasha basalt–comendite complex: com-bined trace element and Sr–Nd–Pb isotope constraints. J.Petrol. 28, 1009–1031.
Dawson, J.B., 1994. Quaternary kimberlitic volcanism on theTanzanian craton. Contrib. Mineral. Petrol. 116, 473–485.
Dawson, J.B., Smith, J.V., 1988. Metasomatised and veined up-

( )T. Furman, D. GrahamrLithos 48 1999 237–262 261
per-mantle xenoliths from Pello Hill, Tanzania: evidence foranomalously light mantle beneath the Tanzanian sector of theEast African Rift valley. Contrib. Mineral. Petrol. 100, 510–527.
Dawson, J.B., Smith, J.V., 1992. Olivine–mica pyroxenite xeno-liths from northern Tanzania: metasomatic products of upper-mantle peridotite. J. Volcanol. Geotherm. Res. 50, 131–142.
De Mulder, M., Hertogen, J., Deutsch, S., Andre, L., 1986. The´role of crustal contamination in the potassic suite of the
Ž .Karisimbi volcano Virunga African Rift Valley . Chem. Geol.57, 117–136.
Dupuy, C., Liotard, J.M., Dostal, J., 1992. ZrrHf fractionation inintraplate basaltic rocks: carbonate metasomatism in the man-tle source. Geochim. Cosmochim. Acta 56, 2417–2424.
Ebinger, C.J., 1989a. Geometric and kinematic development ofborder faults and accommodation zones, Kivu–Rusizi Rift,Africa. Tectonics 8, 117–133.
Ebinger, C.J., 1989b. Tectonic development of the western branchof the East African Rift system. Geol. Soc. Am. Bull. 101,885–903.
Ebinger, C.J., Bechtel, T.D., Forsyth, D.W., Bowin, C.O., 1989.Effective elastic plate thickness beneath the East African andAfar Plateaus and dynamic compensation of the uplifts. J.Geophys. Res. 94, 2883–2901.
Furman, T., 1995. Melting of metasomatized subcontinental litho-sphere: undersaturated mafic lavas from Rungwe, Tanzania.Contrib. Mineral. Petrol. 122, 97–115.
Furman, T., Graham, D., 1994. Chemical and isotopic variationsin volcanic rocks from the Rungwe Province: constraints onthe development and scales of source heterogeneity beneaththe African Western Rift. Mineral. Mag. 58A, 297–298, V.M.Goldschmidt Conference.
Graham, D.W., Humphris, S.E., Jenkins, W.J., Kurz, M.D., 1992.Helium isotope geochemistry of some volcanic rocks fromSaint Helena. Earth Planet. Sci. Lett. 110, 121–131.
Graham, D.W., Furman, T.H., Ebinger, C.J., Rogers, N.W., Lup-ton, J.E., 1995. Helium, lead, strontium and neodymium iso-tope variations in mafic volcanic rocks from the westernbranch of the East African Rift system. EOS 76, F686.
Graham, D.W., Furman, T.H., Ebinger, C.J., Rogers, N.W., Lup-ton, J.E., in preparation. Isotope variations in mafic volcanicrocks from the western branch of the East African Rift system:probes of the subcontinental lithospheric mantle.
Griffiths, R.W., Campbell, I.H., 1991. Interaction of mantle plumeheads with the Earth’s surface and onset of small-scale con-vection. J. Geophys. Res. 96, 18295–18310.
Harkin, D.A., 1960. The Rungwe volcanics at the northern end ofLake Nyasa. Geol. Survey Tanganyika Mem. II.
Harry, D.L., Leeman, W.P., 1995. Partial melting of melt-meta-somatized subcontinental mantle and the magma source poten-tial of the lower lithosphere. J. Geophys. Res. 100, 10255–10269.
Hawkesworth, C.J., Kempton, P.D., Rogers, N.W., Ellam, R.M.,van Calsteren, P.W., 1990. Continental mantle lithosphere, andshallow level enrichment processes in the Earth’s mantle.Earth Planet. Sci. Lett. 96, 256–268.
Hendrie, D.B., Kusznir, N.J., Morley, C.K., Ebinger, C.J., 1994.
Cenozoic extension in northern Kenya: a quantitative model ofrift basin development in the Turkana region. Tectonophysics236, 409–438.
Henjes-Kunst, F., Altherr, R., 1992. Metamorphic petrology ofxenoliths from Kenya and northern Tanzania and implicationsfor geotherms and lithospheric structures. J. Petrol. 33, 1125–1156.
Hoernle, K., 1990. The major element, trace element and Sr–Nd–Ž .Pb isotopic evolution of Gran Canaria Canary Islands magma
sources over the past 15 Myr: inferences on the geochemicaland structural evolution of the mantle. PhD dissertation, UCSB,140 pp.
Holmes, A., 1940. Basaltic lavas of South Kivu, Belgian Congo.Geol. Mag. 77, 89–101.
Holmes, A., 1950. Petrogenesis of katungite and its associates.Am. Mineral. 35, 772–792.
Holmes, A., Harwood, H.F., 1937. The petrology of the volcanicarea of Bufumbira. Mem. Geol. Surv. Uganda 3, 1–300, PartII.
Ionov, D.A., Griffin, W.L., O’Reilly, S.Y., 1997. Volatile-bearingminerals and lithophile trace elements in the upper mantle.Chem. Geol. 141, 153–184.
Ionov, D.A., Gregoire, M., Prikhod’ko, V.S., 1999. Feldspar–Ti-´oxide metasomatism in off-cratonic continental and oceanicupper mantle. Earth Planet. Sci. Lett. 165, 37–44.
Kalt, A., Hegner, E., Satir, M., 1997. Nd, Sr and Pb isotopicevidence for diverse lithospheric mantle sources of East AfricanRift carbonatites. Tectonophysics 278, 31–45.
Kampunzu, A.B., Mohr, P., 1991. Magmatic evolution and petro-genesis in the East African Rift system. In: Kampunzu, A.B.,
Ž .Lubala, R.T. Eds. , Magmatism in Extensional StructuralSettings: the Phanerozoic African Plate. Springer, Berlin, pp.85–136.
Kampunzu, A.B., Caron, J.-P., Lubala, R.T., 1986. The EastAfrican Rift, magma genesis and athenolithospheric dynamics.Episodes 9, 211–216.
KRISP Working Group, 1987. Structure of the Kenya rift fromseismic refraction. Nature 325, 239–242.
KRISP Working Group, 1991. Large-scale variation in litho-spheric structure along and across the Kenya rift. Nature 354,223–227.
Latin, D., Norry, M.J., Tarzey, R.J.E., 1993. Magmatism in theGregory Rift, East Africa: evidence for melt generation by aplume. J. Petrol. 34, 1007–1027.
LaTourette, T., Hervig, R.L., Holloway, J.R., 1995. Trace elementpartitioning between amphibole, phlogopite, and basanite melt.Earth Planet. Sci. Lett. 135, 13–30.
Lloyd, F.E., Bailey, D.K., 1975. Light element metasomatism ofthe continental mantle: the evidence and the consequences.Phys. Chem. Earth 9, 389–416.
Lloyd, F.E., Huntingdon, A.T., Davies, G.R., Nixon, P.H., 1991.Phanerozoic volcanism of southwest Uganda: a case for re-gional K and LILE enrichment of the lithosphere beneath adomed and rifted continental plate. In: Kampunzu, A.B.,
Ž .Lubala, R.T. Eds. , Magmatism in Extensional StructuralSettings: the Phanerozoic African Plate. Springer, Berlin, pp.23–72.
( )T. Furman, D. GrahamrLithos 48 1999 237–262262
Marcelot, G., Dupuy, C., Dostal, J., Rancon, J.P., Pouclet, A.,1989. Geochemistry of mafic volcanic rocks from the Lake
Ž .Kivu Zaire and Rwanda section of the western branch of theAfrican Rift. J. Volcanol. Geotherm. Res. 39, 73–88.
McDonough, W.F., 1990. Constraints on the composition of thecontinental lithospheric mantle. Earth Planet. Sci. Lett. 101,1–18.
McKenzie, D., O’Nions, R.K., 1995. The source regions of oceanisland basalts. J. Petrol. 36, 133–159.
Menzies, M.A., Murthy, V.R., 1980. Enriched mantle: Nd and Srisotopes in diopsides from kimberlite nodules. Nature 283,634–636.
Mitchell, R.H., Bell, K., 1976. Rare earth element geochemistryof potassic lavas from the Birunga and Toro-Ankole regions ofUganda, Africa. Contrib. Mineral. Petrol. 58, 293.
Nelson, D.R., Chivas, A.R., Chappell, B.W., McCulloch, M.T.,1988. Geochemical and isotopic systematics in carbonatitesand implications for the evolution of ocean–island sources.Geochim. Cosmochim. Acta 52, 1–17.
Norry, M.J., Truckle, P.H., Lippard, S.J., Hawkesworth, C.J.,Weaver, S.D., Marriner, G.F., 1980. Isotopic and trace ele-ment evidence from lavas, bearing on mantle heterogeneitybeneath Kenya. Philos. Trans. R. Soc. London, Ser. A 297,259–271.
Olafsson, M., Eggler, D.H., 1983. Phase relations of amphibole,amphibole-carbonate and phlogopite-carbonate peridotite:petrologic constraints on the asthenosphere. Earth Planet. Sci.Lett. 64, 305–315.
Paslick, C., Halliday, A., James, D., Dawson, J.B., 1995. Enrich-ment of the continental lithosphere by OIB melts: isotopicevidence from the volcanic province of northern Tanzania.Earth Planet. Sci. Lett. 130, 109–126.
Pasteels, P., Villeneuve, M., De Paepe, P., Klerkx, J., 1989.Timing of the volcanism of the southern Kivu province:implications for the evolution of the western branch of theEast African Rift system. Earth Planet. Sci. Lett. 94, 353–363.
Rogers, N.W., De Mulder, M., Hawkesworth, C.J., 1992. Anenriched mantle source for potassic basanites: evidence fromKarisimbi volcano, Virunga volcanic province, Rwanda. Con-trib. Mineral. Petrol. 111, 543–556.
Rogers, N.W., James, D., Kelley, S.P., DeMulder, M., 1998. Thegeneration of potassic lavas from the eastern Virunga province,
Ž .Rwanda. J. Petrol. in press .
Rudnick, R.L., McDonough, W.F., Chappell, B.W., 1993. Car-bonatite metasomatism in the northern Tanzanian mantle: pet-rographic and geochemical characteristics. Earth Planet. Sci.Lett. 114, 463–475.
Sato, K., Katsura, T., Ito, E., 1997. Phase relations of naturalphlogopite with and without enstatite up to 8 GPa: implica-tions for mantle metasomatism. Earth Planet. Sci. Lett. 146,511–526.
Simiyu, S.M., Keller, G.R., 1997. An integrated analysis oflithospheric structure across the East African plateau based ongravity anomalies and recent seismic studies. Tectonophysics278, 291–313.
Sun, S.-S., McDonough, W.F., 1989. Chemical and isotopic sys-tematics of oceanic basalts: implications for mantle composi-
Ž .tion and processes. In: Saunders, A.D., Norry, M.J. Eds. ,Magmatism in the Ocean Basins. Geol. Soc. Lond., pp. 313–345.
Upcott, N.M., Mukasa, R.K., Ebinger, C.J., Karner, G.D., 1996.Along-axis segmentation and isostasy in the Western rift, EastAfrica. J. Geophys. Res. 101, 3247–3268.
Vollmer, R., Norry, M.J., 1983. Unusual isotopic variations inNyiragongo nephelinites. Nature 301, 141–143.
Vollmer, R., Nixon, P.H., Condliffe, E., 1985. Petrology andgeochemistry of a U and Th enriched nephelinite from Mt.Nyiragongo, Zaire: its bearing on ancient mantle metasoma-tism. Bull. Geol. Soc. Finland 57, 37–46.
Wallace, M.E., Green, D.H., 1988. An experimental determinationof primary carbonatite composition. Nature 335, 343–345.
Weaver, B.L., 1991. The origin of ocean island basalt endmembercompositions: trace element and isotopic constraints. EarthPlanet. Sci. Lett. 104, 381–397.
White, R.S., McKenzie, D., 1989. Magmatism at rift zones: thegeneration of volcanic continental margins and flood basalts.J. Geophys. Res. 94, 7685–7729.
Williams, L.A.J., 1972. The Kenya Rift volcanics: a note onvolumes and chemical composition. Tectonophysics 15, 83–96.
Williams, R.W., Gill, J.B., 1992. Th isotope and U-series disequi-Ž .libria in some alkali basalts. Geophys. Res. Lett. 19 2 ,
139–142.Zindler, A., Hart, S.R., 1986. Chemical geodynamics. Ann. Rev.
Earth Planet. Sci. 14, 493–571.
Recommended


