Evaluation of toxicological risk of foodstuffs contaminated with heavymetals in Swat, Pakistan
Kifayatullah Khan a,b,c, Hizbullah Khan a, Yonglong Lu b,n, Ihsan Ihsanullah d, Javed Nawab a,Sardar Khan a, Noor S. Shah e, Isha Shamshad a, Afsheen Maryam a
a Department of Environmental Sciences, University of Peshawar, Peshawar 25120, Pakistanb State Key Laboratory of Urban and Regional Ecology, Research Centre for Eco-environmental Sciences (RCEES),Chinese Academy of Sciences (CAS), 18 Shuangqing Road, Beijing 100085, Chinac Department of Environmental Sciences, University of Swat, Swat 19130, Pakistand Nuclear Institute for Food and Agriculture (NIFA), Tarnab, Peshawar, Pakistane Institute of Chemical Sciences, University of Swat, Swat 19130, Pakistan
a r t i c l e i n f o
Article history:Received 15 February 2014Received in revised form14 May 2014Accepted 15 May 2014
Keywords:BioaccumulationFoodstuffsHealth risksHeavy metalsIngestionPakistan
a b s t r a c t
This study aimed to assess the concentrations of heavy metals such as cadmium (Cd), chromium (Cr),copper (Cu), manganese (Mn), nickel (Ni), lead (Pb) and zinc (Zn) in the available foodstuffs (crops, milkand water), their bioaccumulation in human body and potential human health risks in Swat valley,northern Pakistan. Heavy metal concentrations in foodstuffs and human blood (adults (18-above) andchildren (1–12 years)) were analyzed using atomic absorption spectrometer. The results revealed highlevel of Mn in foodstuffs followed by Cr4Cu4Zn4Ni4Cd4Pb, which significantly increased thelevels of heavy metals in the adult's blood as compared to that of children in the order of Cr4Zn4Mn4Ni4Pb4Cu4Cd. Principal component analysis showed that selected foodstuffs were thepossible sources of metal contamination in human blood, while correlation analysis revealed that theconcentrations of Cr, Cu, Mn, Ni, Pb and Zn in foodstuffs significantly correlated with that in humanblood. Moreover, risk assessments for individual metals via foodstuffs were found within safe limits,except for Cd (HQ41); Whereas, for aggregate multiple metals the risk was calculated as 3.97Eþ00(HI41), in which water and milk were perceived as the greater contributors (81 percent) to HI; whilefruits, grains and vegetables contributed 5 percent each, and pulses 4 percent.
& 2014 Elsevier Inc. All rights reserved.
1. Introduction
Pollution of heavy metals such as Cd, Cr, Cu, Mn, Ni, Pb and Znin foodstuffs including food crops, milk and water is one of thedetrimental health issues in the world due to their non-biodegradable and persistent nature (Sekomo et al., 2011; Aliand Malik, 2011; Donaldson et al., 2010). The dietary intake ofmetals through contaminated foodstuffs is the main route ofexposure to heavy metals for human beings, which can causeserious health hazards (Amin et al., 2013; Rahman et al., 2014).Usually, human beings are exposed to metals at trace levels eithervoluntarily through supplementation or involuntarily throughintake of contaminated foodstuffs (Farid et al., 2004). Through
food ingestion nutrients and trace metals are assimilated intoblood which acts as a transport medium to and from the tissues;and provides rapid and reliable information about the heavy metalmetabolism in living body (Pasha et al., 2010). The level of metalsin blood depends on the bio-accessibility rate and is considered asan index of biologically active metals in the body reflecting theenvironmental exposure of a population (Jan et al., 2011).
Heavy metals i.e. Cd, Cr, Ni and Pb are very toxic contaminants,their excessive bioaccumulation can cause profound biochemicalchanges inside living bodies and produce both chronic and acutehealth consequences, including kidney dysfunction, polycythemia,bone fracture, respiratory illness, memory deterioration, asthma,heart problems and various kind of cancers (Fischer et al., 2003;Kavcar et al., 2009; Khan et al., 2010; Mijal and Holzman, 2010;Zhao et al., 2012; Er et al., 2013).
Whereas, metals i.e. Cu, Mn and Zn are essentially required forbody growth and functions, they may be harmful above certainlevels (Huang et al., 2008; Amin et al., 2013; Hu et al., 2013;Rahman et al., 2014). Cu is a redox-active metal and can cyclebetween its oxidized cupric (Cu2þ) and reduced cuprous (Cuþ)
Contents lists available at ScienceDirect
journal homepage: www.elsevier.com/locate/ecoenv
Ecotoxicology and Environmental Safety
http://dx.doi.org/10.1016/j.ecoenv.2014.05.0140147-6513/& 2014 Elsevier Inc. All rights reserved.
Abbreviations: ANOVA, analysis of variance; CAS, Chinese Academy of Sciences;CDI, chronic daily intake; HI, hazard index; HQ, hazard quotient; PCA, principlecomponent analysis; RfD, oral reference dose; TWAS, The World Academy ofSciences
n Corresponding author. Fax: þ86 10 62918177.E-mail address: [email protected] (Y. Lu).
Ecotoxicology and Environmental Safety 108 (2014) 224–232

forms. Its excessive intracellular accumulation can induce growthproliferation, cancer and neurological diseases, while its defi-ciency can lead to normocytic, hypochromic anemia, leukopeniaand neutropenia (Pasha et al., 2010). Similarly, Mn is essentially
required as a co-factor for arginase enzyme in liver, pyruvatecarboxylase enzyme in gluconeogenesis and astrocyte and gluta-mine enzymes in brain, but over exposure to Mn can causepermanent neurodegenerative damage (Bocca et al., 2011). While,
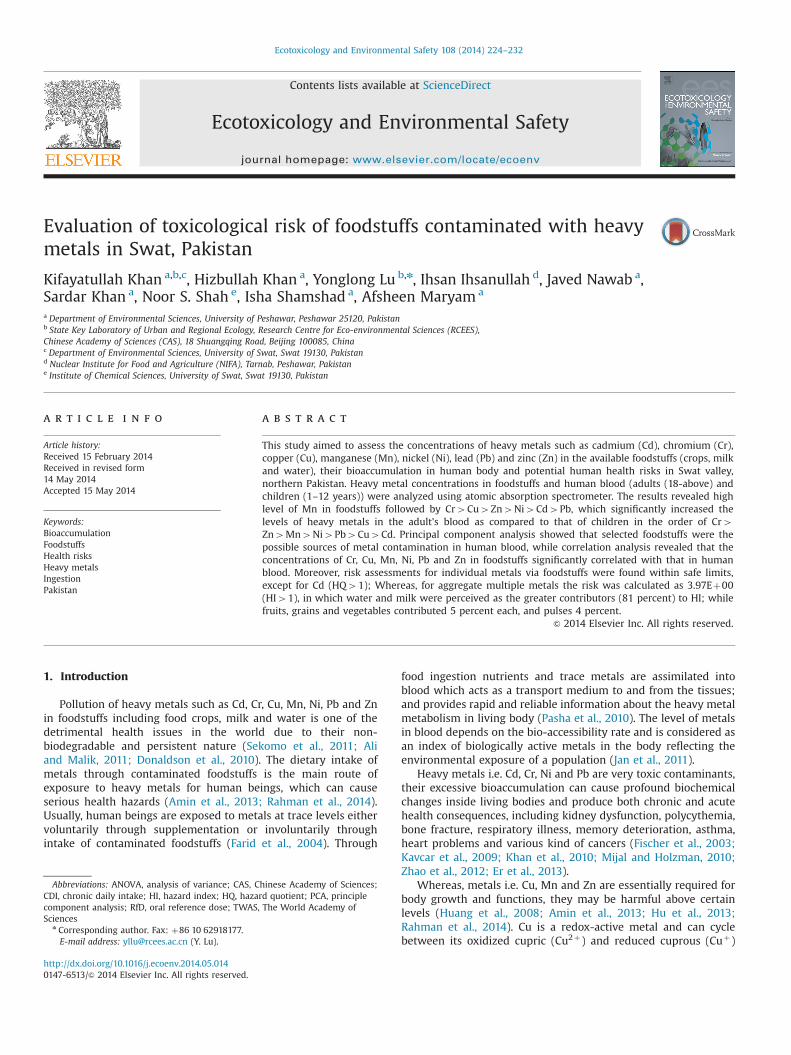
Fig. 1. Location map of the study area showing the sampling sites and different land-use classification in Swat valley, northern, Pakistan.
K. Khan et al. / Ecotoxicology and Environmental Safety 108 (2014) 224–232 225
sufficient amount of Zn is essentially required in the production ofmore than 300 different enzymes. However, its excessive exposurecan cause a sideroblasticanemia, while its deficiency can producegrowth retardation, anorexia, delayed sexual maturation, mentalretardation and immune dysfunction (Muhammad et al., 2011).
Therefore, to protect the public health and to ensure timelywarning for possible accumulations, it is necessary to extend ourknowledge about the heavy metal bioaccumulation in human bloodvia foodstuff consumption and their relation with environmentalexposure. In the study area, heavy metal contaminations in drinkingwater (surface and groundwater) and agricultural crops such asfruits (apple, pear, persimmon and walnut), grains (maize, wheatand rice) and vegetables (pumpkin, potato, tomato, broad bean,bitter gourd, ladyfinger and onion) were assessed in our previousarticles (Khan et al., 2013a, 2013b). To explore further the multiplehuman exposures to heavy metals and combined impacts, thispaper aims to determine the overall contaminations of heavymetals in available foodstuffs (e.g., fruits, grains, pulses, vegetables,milk and water), their bioaccumulation in human blood and poten-tial human health risks in Swat valley, northern Pakistan.
2. Materials and methods
2.1. Study area
Swat valley (Fig. 1) is one of the largest valleys in Hindu Kush mountain system,north-west Pakistan, located between 341340 to 351550 north latitude and 711100 to721500 east longitude with an altitude ranging from 733 m in the south toapproximately 5740 m in the north (Rahman and Khan, 2011; Qasim et al., 2011).The overall weather of the region is affected by almost all the climatic factors suchas latitude, altitude and rain bearing winds i.e. cyclone and monsoon winds.Agriculture is the dominant profession because of high fertile soil which is suitablefor growth of wheat and maize as major crops along with different fruits, grains,pulses and vegetables. Cattles such as buffalos and cows are generally raised asdairy animals for fresh milk and other dairy products, while River Swat, naturalsprings and wells are used as a source of water for domestic and agriculturalpurposes (Khan et al., 2013a).
2.2. Sampling and pre-treatment
All the samples were collected in the year 2010–2011 at five different locationsin the study area along the downstream of Swat River. Locally harvested food cropssuch as fruits (apple, pear, persimmon and walnut), grains (maize, wheat and rice),pulses (chick pea, pigeon pea, white lentil, kidney bean and mung bean) andvegetables (pumpkin, potato, tomato, broad bean, bitter gourd, ladyfinger andonion) and water samples were collected in the study area and pre-treated in thelaboratory as introduced in our previous papers (Khan et al., 2013a, 2013b).
Fresh milk samples (buffalo/cow) were collected in 100 ml clean acid-washedpolyethylene plastic bottles in the near local dairy farms of the five locations and storedat 4 1C prior to digestion for metals analysis. Whereas, human blood samples werecollected under the local ethical committee approval from the same locations of thestudy area at the same time when the foodstuffs were collected. Before taking samplesthe respondents were divided into two age groups i.e. adults (18 years and above) andchildren (1–12 years); and were asked to complete a structured questionnaire contain-ing socio-demographic conditions such as health status, medication, occupation,smoking habits, alcohol consumption and other lifestyles. Then the required bloodsamples were taken in clean polypropylene EDTA containing tubes by vein puncturingusing disposable syringes and transported to the laboratory under ice-cold conditions.
2.3. Extraction/digestion
Food crops were digested through wet digestion method as introduced in ourprevious work (Khan et al., 2013a). Whereas, milk samples were digested accordingto Singh et al. (2010) method. Briefly, a known volume of milk sample (25 ml) wastaken in beaker and heated gently without boiling to reduce the water content.After cooling the required samples were digested in 10 ml of HNO3 and 5 ml ofHClO4 until a transparent solution was obtained. Moreover, the blood samples wereextracted using Jan et al. (2011) method. Briefly, 3 ml of blood sample was put intoa conical flask and then 15 ml of HClO4 and HNO3 in the ratio of 1:4 were added.They were kept overnight and then heated on hot plate at different standardtemperatures until a transparent solution was obtained. After cooling the acquiredextracts were filtered through Whatman no. 42 filter papers and diluted up to100 ml volume using highly purified de-ionized water.
2.4. Heavy metal determination
Analytical grade chemicals (Merck Darmstadt, Germany) were purchased forsample preparation and analysis. Standard solutions of selected metals wereprepared by diluting their corresponding 1000 mg/L certified standard solutions(Fluka Kamica, Busch Switzerland). The blank reagents and standard referencematerials (Fluka Kamica, Busch Switzerland) were used to verify the accuracy andprecision of digestion procedure and subsequent analyses The concentrations of Cd,Cr, Cu, Mn, Ni, Pb, and Zn in the filtrate of digested samples were estimated usinggraphite furnace atomic absorption spectrometer (GFAAS AAS-700 Perkin Elmer,USA). The instrument was calibrated using standard solution of respective heavymetals manually prepared from their stock solutions. The instrumental detectionlimits of Cd, Cr, Cu, Mn, Ni, Pb and Zn were 0.0008, 0.0030, 0.0015, 0.0015, 0.0060,0.0150 and 0.0015 mg/L, respectively (Table S1, Supplementary material).
2.5. Quality control
The blank reagents and standard reference materials such as Batch 1701-3, BCR no.150 and Fluka Kamica, Busch Switzerland for human blood, milk and foodstuffs,respectively, were used to verify the accuracy and precision of the digestion procedureand subsequent analyses. Whereas in view of data quality assurance, each sample batchwas analyzed in a triplicate under standard opt-ionizing conditions within theconfidence limit of 95 percent. The validity of the method was further ascertained bycross method checks, spiked recovery and replicate analysis.
2.6. Risk assessment
Health risk evaluation indicators such as hazard quotient (HQ) and hazardindex (HI) for individual and multiple heavy metals were calculated to assess thepotential chronic risks in the study area.
2.6.1. Health risk of individual metalThe potential chronic risk for individual metals is expressed as hazard quotient
(HQ) and it was calculated using Eq. (1) (Huang et al., 2008; Kavcar et al., 2009;Khan et al., 2013).
HQ ¼ CDI=RfD ð1Þ
where RfD represents the oral reference dose of Cd, Cr, Cu, Mn, Ni, Pb and Zn, as5.0E�04, 1.5, 3.7E�02, 1.4E�01, 2.0E�02, 3.6E�02 and 3.0E�01 mg/kg-day,respectively (Shah et al., 2012; Khan et al., 2013b). While, CDI (mg/kg-day)represents the average chronic daily intake of metal via foodstuffs consumption,it was calculated using Eq. (2) (Muhammad et al., 2011; Khan et al., 2013a, 2013b).
CDI¼ C � DI=BW ð2Þ
where C, DI and BW represent the heavy metal concentrations in foodstuffs (forfood crop mg/kg; for water and milk mg/L), average daily intake of foodstuffs andaverage body weight, respectively. The average daily intake rate of foodstuffs(water, milk and food crop) was assumed to be 2 L/day of water (US EPA, 2011),0.45 L/day of milk (questioner based), 0.345 kg/day of crop for adult (Khan et al.,2008); and 1 L/day of water (US EPA, 2011), 0.75 L/day of milk (questioner based),0.232 kg/day of crop for child (Khan et al., 2008). The conversion factor (0.085) wasused to convert wet weight of food crops i.e. (fruits, grains and vegetables) to dryweight (Khan et al., 2013a), whereas the average adult and children body weightswere assumed to be 73 and 32.7 kg, respectively (Jan et al., 2010; Khan et al.,2013a).
2.6.2. Health risk of multiple metalsThe total potential chronic risk for multiple metals is expressed as hazard index
(HI) and it was calculated using Eq. (3) (Huang et al., 2008; Cao et al., 2010;Bermudez et al., 2011).
HI¼HQCdþHQCrþ⋯þHQn ð3Þ
where HI is the aggregate hazard index and HQCd, HQCr and HQn are the calculatedHQs of Cd, Cr … n metal, respectively. An index more than one is presumed to beunsafe for human health (US EPA, 2005; Khan et al., 2013a).
2.7. Statistical analysis
The descriptive statistics i.e. graphics, means, ranges and standard deviationsfor selected parameters were calculated using Microsoft Excel version 2010; whilethe statistical univariate and multivariate analysis i.e. one-way analysis of variance(one-way ANOVA), correlation analysis and principle component analysis (PCA)were executed using Statistical Package for the Social Sciences version 17.
K. Khan et al. / Ecotoxicology and Environmental Safety 108 (2014) 224–232226

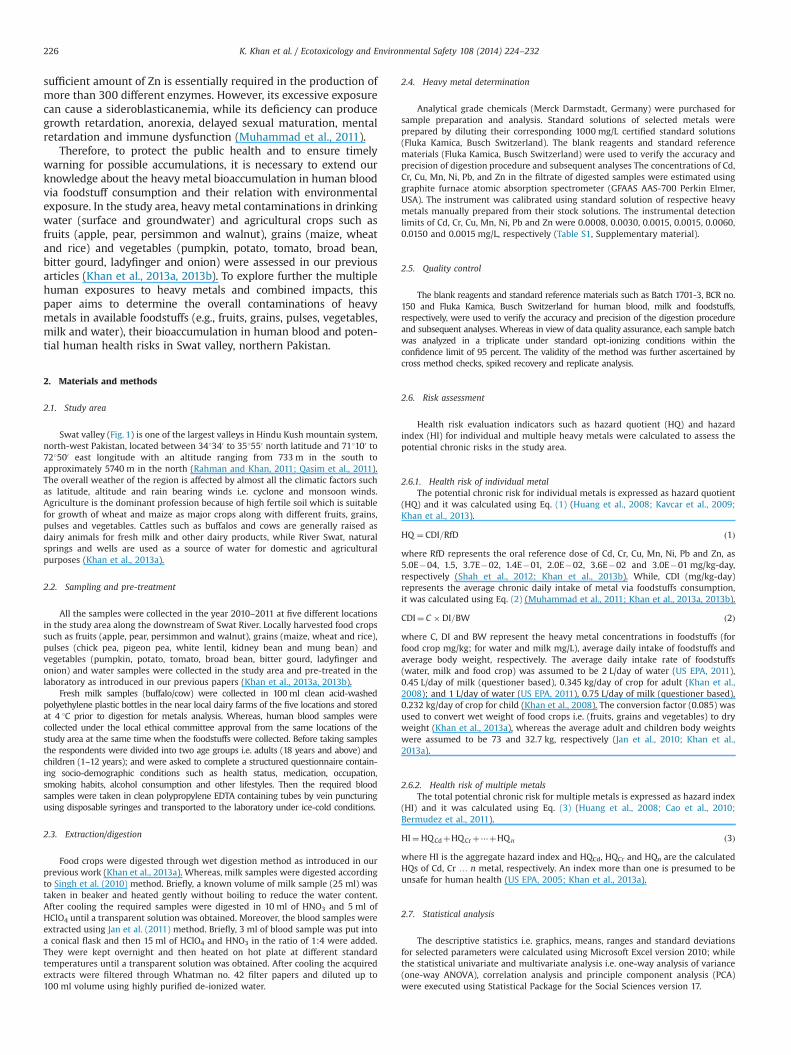
Fig. 2. Heavy metals concentrations (mg/kg) in different foodstuffs (n¼185) collected from the study area. The detailed data regarding heavy metals in agricultural crops(i.e., vegetables, fruits, grains) and water were given in our previous papers (Khan et al., 2013a, 2013b), respectively. F-Fruits, G-Grains, P-Pulses, V-Vegetables,M-Milk, W-Water, and nn-PZ0.01.
K. Khan et al. / Ecotoxicology and Environmental Safety 108 (2014) 224–232 227

3. Results and discussion
3.1. Levels of heavy metals in foodstuffs
The mean concentrations of Cd, Cr, Cu, Mn, Ni, Pb and Zn infoodstuffs collected in the study area were classified in terms of fruits,grains, pulses, vegetables, milk and water, and depicted in Fig. 2.
Statistically, heavy metal concentrations in foodstuffs were sig-nificantly varied (pr0.05). Moreover, Post hoc (Tukey test) demon-strated that, Cr, Cu, Mn, Ni and Zn concentrations in selectedfoodstuffs were significantly (pr0.01) varied; while Cd and Pbshowed no significant variation (p40.05) as shown in Fig. 2. Thisvariation in metal concentrations particularly in fruits, grains, pulsesand vegetables from the study area may be credited to the differ-ences in their morphology and physiology for uptake, exclusion,uptake/bioaccumulation and retention of heavy metals (Singh et al.,2010). The highest heavy metal concentration was noticed for Mnfollowed by Cr4Cu4Zn4Ni4Cd4Pb. Among these metals theconcentrations of Cd, Cr, Ni and Pb were observed considerablyhigher than their safe limits as given in our previous studies (Khan etal., 2013a, 2013b). Besides, the concentrations of Mn in grains andpulses, Cr in water and milk, and Ni in grains and fruits weredetected several folds higher than the rest of selected metals (Fig. 2).
The mean concentrations of Cd, Cr, Cu, Mn, Ni, Pb and Zn inselected foodstuffs ranged from 0.012 to 0.098, 0.028 to 0.455,0.009 to 0.328, 0.104 to 0.596, 0.053 to 0.275, 0.021 to 0.068 and0.022 to 0.235 mg/kg, respectively, in the region (Fig. 2). Thehighest Cd mean concentration was observed in grain samples;while the lowest in water. This high concentration of Cd is due tohigh bioaccumulation of Cd in crops, which was also reported byFytianos et al. (2001) and Chary et al. (2008). Similarly, Cr meanconcentration was observed very high in water samples, comparedwith the results of the studies conducted by Muhammad et al.(2011) and Shah et al. (2012) in this country, which could beinfluenced by the geology as well as agricultural and industrialemissions in the area (Khan et al., 2013b). Cu and Mn areessentially required for body growth and functions, its meanvariation in foodstuffs are given in Fig. 2. Ni concentration wasrecorded high in the grain samples, which was also reported byHuang et al. (2008) in Kunshan, China. Pb high level was noticed inmilk samples; while its lower level in vegetables as portrayed inFig. 2. The high concentration of Pb in the cattle's milk could beattributed to direct ingestion of fodder particularly water contain-ing high levels of Pb in the area. Moreover, buffalo milk was foundto have high concentrations of metals as compared to cow's milk
which may be attributed to high fat content in buffalo's milk,which helps in metal retention due to the formation of bioactive(lipophilic) complexes (Jan et al., 2011). Zn concentrations infoodstuffs were also shown variation across the region; however,its highest mean concentration (0.235 mg/kg) was noticed inpulses; while the lowest (0.022 mg/kg) in water (Fig. 2).
Moreover, the detailed information on concentrations of selectedheavy metals in different fruit, grain and vegetable species weregiven in our previous work (Khan et al., 2013a); and watercontamination was specified by Khan et al. (2013b). The detailedstatistics of heavy metals in pulses and milk samples are given inTables 1 and S2 (Supplementary material) respectively.
3.2. Bioaccumulation of heavy metals in human blood
The basic statistical parameters of selected heavy metal con-centrations in the human blood samples collected from fivelocations (Madyan, Fatehpur, Khwazakhela, Charbagh and Min-gora) are summarized in Table 2. Statistically, a huge variation inthe minimum, maximum and mean heavy metal concentrationswas observed in the blood samples collected from five locations ofthe study area. The bioaccumulation of metals in blood of bothadults and children were significantly varied (pr0.01); whereas,Cr bioaccumulation was recorded relatively very high as comparedto that of Cd, Cu, Mn, Ni, Pb and Zn as illustrated in Fig. S1(Supplementary material).
According to Post hoc (Tukey test), Cd bioaccumulation inadult's blood showed significant variation (pr0.01) with Cr, Mn,Ni and Zn; while in children's blood it was significantly varied(pr0.01) with Cr, Mn and Zn (Fig. S1, Supplementary material).Similarly, Cu bioaccumulation in adult's blood showed significantvariation (pr0.01) with Cr, Cu and Zn; while in children's blood itwas significantly varied (pr0.01) with Cr and Zn only (Fig. S1,Supplementary material). Mn showed significant variation (pr0.01) with Cd, Cr, Cu and Zn in adults blood; while in children'sblood it was significantly varied (pr0.01) with Cd, Cr, Pb and Zn.Ni bioaccumulation in adults showed significant variation(pr0.01) with Cd, Cr and Zn; while in children's blood it wassignificantly varied (pr0.01) with Cr and Zn (Fig. S1, Supplemen-tary material). Pb bioaccumulation in adults showed significantvariation (pr0.01) with Cr and Zn; while in children's blood itwas significantly varied (pr0.01) with Cr, Mn and Zn (Fig. S1,Supplementary material). Whereas, Cr and Zn bioaccumulation inboth adults and children were significantly varied (pr0.01) withthe rest of selected metals (Fig. S1, Supplementary material).
Table 1Heavy metals concentrations (mg/kg) in foodstuffs (n¼55) collected from the study area.
Foodstuffs Statistics Cd Cr Cu Mn Ni Pb Zn
Pulses (n¼25)Cicer arietinum (chick pea) Range 0.009–0.116 0.044–0.142 0.328–0.378 0.757–0.980 0.042–0.091 BDL 0.211–0.304
Mean 0.06970.052 0.09070.038 0.34770.019 0.89470.083 0.06270.024 0.25070.043
Cajanus cajan (pigeon pea) Range 0.010–0.114 0.055–0.136 0.305–0.335 0.413–0.758 0.005–0.092 BDL 0.169–0.239Mean 0.06970.052 0.09670.034 0.31970.014 0.53970.164 0.04570.038 0.21670.029
Vigna mungo (white lentil) Range 0.015–0.116 0.063–0.143 0.308–0.371 0.421–0.615 0.016–0.093 BDL 0.231–0.304Mean 0.07270.052 0.10570.030 0.32970.026 0.54670.075 0.05070.030 0.26670.032
Phaseolu svulgaris (kidney bean) Range 0.011–0.127 0.066–0.151 0.330–0.355 0.458–0.724 0.038–0.053 0.058–0.093 0.183–0.260Mean 0.07970.053 0.10670.033 0.34270.013 0.60370.108 0.04670.006 0.07770.018 0.21070.031
Vigna radiate (mung bean) Range 0.006–0.126 0.066–0.147 0.020–0.435 0.314–0.460 0.021–0.512 0.002–0.077 0.178–0.314Mean 0.07170.058 0.11070.032 0.30370.164 0.40070.056 0.14370.208 0.04070.053 0.23370.051
Milk (n¼30)Fresh milk (buffalos/cows) Range 0.014–0.031 0.190–0.303 0.001–0.589 0.130–0.267 0.006–0.200 0.003–0.303 0.112–0.389
Mean 0.02070.004 0.25170.032 0.16470.177 0.17470.043 0.05370.045 0.06870.063 0.22270.068
n, number of samples; 7 , standard deviation; BDL, below detection limits.
K. Khan et al. / Ecotoxicology and Environmental Safety 108 (2014) 224–232228

Moreover, heavy metal bioaccumulation in the blood sampleswere found in the decreasing order of Cr4Zn4Mn4Ni4Pb4Cu4Cd which was detected multi-fold higher than those reportedby Jan et al. (2011) in Peshawar and Lower Dir in Pakistan,indicating large intake of metals through contaminated foodsconsumption, which clearly specifies the contribution of theselected food crops, milk and water on the metal composition ofthe human blood.
The mean bioaccumulations of Cd in the adults blood were0.01770.004, 0.01770.003, 0.01670.003, 0.01570.004 and0.01970.003 mg/L, while in the children blood they were 0.01670.004, 0.01570.004, 0.01570.004, 0.01570.004 and 0.01770.003 mg/L, in the five locations, namely Madyan, Fatehpur,Khwazakhela, Charbagh and Mingora, respectively (Table 2). Thehighest Cd bioaccumulation (0.022 mg/L) was recorded in theadult's blood at Mingora, which could be influenced by highingestion of grains and vegetables in the area; however, its lowestbioaccumulation (0.011 mg/L) was detected in the adult's blood atMadyan and children blood at Fatehpur and Charbagh areas,respectively. Similarly, the mean Cr bioaccumulations in the adultsblood were 0.64370.010, 0.64970.005, 0.66670.003, 0.67570.003 and 0.68570.001 mg/L; while in the children blood they were0.63970.012, 0.65170.004, 0.65570.005, 0.67470.004 and0.68070.003 mg/L, in the same five locations, respectively (Table 2).The highest Cr bioaccumulation (0.686 mg/L) was recorded in theadult's blood at Mingora; while the lowest (0.624 mg/L) in thechildren blood at Madyan area. This high bioaccumulation of Cr inthe blood may be due to high assimilation of water in the body. Cuand Mn bioaccumulations also show variation across the area and aregiven in Table 2. The mean Ni bioaccumulations in the adult's bloodsamples were 0.07170.024, 0.06470.017, 0.12170.052, 0.21870.047 and 0.23370.093 mg/L, while in the children's blood samples
they were 0.04370.017, 0.07070.032, 0.10970.056, 0.15370.042and 0.17270.143 mg/L, in the same five locations, respectively(Table 2). The highest Ni bioaccumulation (0.386 mg/L) was detectedin the children blood at Mingora; while the lowest (0.026 mg/L) atMadyan area. This high bioaccumulation of Ni in the dweller'sblood will be credited to high consumption of food crops parti-cularly grains and fruits in the area. Whereas, Pb bioaccumulationsin the adults blood samples were 0.02570.019, 0.03470.001,0.10270.004, 0.05270.029 and 0.07270.056 mg/L; while in chil-dren blood its bioaccumulations were 0.01570.013, 0.06270.020,0.02670.021, 0.05670.025 and 0.00570.004 mg/L, in the samefive locations, respectively (Table 2). Its highest bioaccumulation(0.107 mg/L) was detected in the adults; while lowest (0.002 mg/L)in the children blood at Mingora. This high Pb bioaccumulationcould be influenced by high intake rate of milk in children. Whereas,Zn is an essential trace metal, its distributions in the inhabitantsblood are given in Table 2.
It is obvious from the above results and the data presented inTable 2 and Fig. S1 (Supplementary material) that bioaccumula-tions of heavy metals in human blood were not uniform for bothadults and children in the five locations. It is very likely due tohigh level of heavy metals variation in food chains (i.e., food crops,milk and water ingestion) which are the major pathways forexposure and sources of metals bioaccumulation in the adult'sblood as compared to that of children.
3.3. Heavy metal sources and their correlation with human blood
To find out the major sources of heavy metal contamination forhuman blood, PCA (Varimax Kaiser Normalization) with threefactors was applied for both adults and children blood samples
Table 2Heavy metals bioaccumulations (mg/L) in human blood (n¼200) collected from the study area.
Parameters Sampling sites
Metal Individual Statistics Madyan (n¼40) Fatehpur (n¼40) Khwazakhela (n¼40) Charbagh (n¼40) Mingora (n¼40)
Cd Adults Range 0.011–0.020 0.014–0.020 0.013–0.020 0.010–0.018 0.014–0.022(n¼20) Mean 0.01770.004 0.01770.003 0.01670.003 0.01570.004 0.01970.003Children Range 0.012–0.021 0.011–0.020 0.012–0.021 0.011–0.019 0.014–0.020(n¼20) Mean 0.01670.004 0.01570.004 0.01570.004 0.01570.004 0.01770.003
Cr Adults Range 0.629–0.651 0.644–0.654 0.662–0.670 0.673–0.679 0.683–0.686(n¼20) Mean 0.64370.010 0.64970.005 0.66670.003 0.67570.003 0.68570.001Children Range 0.624–0.651 0.647–0.655 0.648–0.659 0.671–0.680 0.678–0.684(n¼20) Mean 0.63970.012 0.65170.004 0.65570.005 0.67470.004 0.68070.003
Cu Adults Range 0.052–0.061 0.046–0.057 0.055–0.072 0.017–0.065 0.005–0.015(n¼20) Mean 0.05670.004 0.05070.005 0.06470.008 0.05070.022 0.01070.005Children Range 0.053–0.062 0.049–0.062 0.054–0.057 0.060–0.063 0.006–0.379(n¼20) Mean 0.05770.004 0.05570.006 0.05670.001 0.06270.001 0.10270.185
Mn Adults Range 0.159–0.162 0.155–0.167 0.163–0.171 0.158–0.165 0.147–0.173(n¼20) Mean 0.16170.001 0.16270.005 0.16770.003 0.16270.003 0.15770.011Children Range 0.152–0.158 0.152–0.164 0.162–0.173 0.158–0.165 0.147–0.244(n¼20) Mean 0.15570.003 0.15770.006 0.16670.005 0.16170.003 0.17770.046
Ni Adults Range 0.040–0.094 0.050–0.089 0.075–0.179 0.180–0.286 0.113–0.311(n¼20) Mean 0.07170.024 0.06470.017 0.12170.052 0.21870.047 0.23370.093Children Range 0.026–0.068 0.045–0.114 0.054–0.165 0.104–0.199 0.099–0.386(n¼20) Mean 0.04370.017 0.07070.032 0.10970.056 0.15370.042 0.17270.143
Pb Adults Range 0.006–0.044 0.033–0.035 0.099–0.105 0.020–0.075 0.007–0.107(n¼20) Mean 0.02570.019 0.03470.001 0.10270.004 0.05270.029 0.07270.056Children Range 0.006–0.034 0.048–0.092 0.009–0.054 0.036–0.090 0.002–0.009(n¼20) Mean 0.01570.013 0.06270.020 0.02670.021 0.05670.025 0.00570.004
Zn Adults Range 0.527–0.807 0.122–0.354 0.122–0.200 0.209–0.968 0.294–0.364(n¼20) Mean 0.67170.134 0.24870.121 0.15570.033 0.44470.355 0.33970.031Children Range 0.602–0.848 0.171–0.829 0.179–0.612 0.213–0.354 0.114–0.966(n¼20) Mean 0.71170.124 0.39770.303 0.33970.189 0.23070.066 0.42670.403
n, number of samples; 7 , standard deviation.
K. Khan et al. / Ecotoxicology and Environmental Safety 108 (2014) 224–232 229

Table 3Hazard quotient (HQ) and hazard index (HI) values of heavy metals through different foodstuffs (n¼185) consumption in the study area. HQ and HI for fruits, grains,vegetables and water are based on the data given in our previous papers (Khan et al., 2013a, 2013b).
Foodstuffs Individual Statistics Cd Cr Cu Mn Ni Pb Zn HI
Fruits (n¼20) Adults HQ 6.60E�02 3.60E�05 1.50E�03 8.40E�04 3.50E�03 1.80E�04 1.10E�04 7.22E�02Children HQ 9.90E�02 5.40E�05 2.30E�03 1.30E�03 5.20E�03 2.70E�04 1.60E�04 1.08E�01
Grains (n¼20) Adults HQ 7.90E�02 3.00E�06 2.20E�03 1.60E�03 5.50E�03 2.10E�04 2.80E�04 8.88E�02Children HQ 1.20E�01 4.00E�06 3.30E�03 2.30E�03 8.30E�03 3.10E�04 4.20E�04 1.35E�01
Pulses (n¼25) Adults HQ 5.80E�02 2.70E�05 3.60E�03 1.70E�03 1.40E�03 2.20E�04 3.10E�04 6.53E�02Children HQ 8.70E�02 4.10E�05 5.30E�03 2.60E�03 2.10E�03 3.30E�04 4.70E�04 9.78E�02
Vegetables (n¼35) Adults HQ 7.30E�02 4.30E�05 4.90E�04 3.00E�04 1.40E�03 3.40E�05 9.20E�05 7.54E�02Children HQ 1.10E�01 6.50E�05 7.40E�04 4.50E�04 2.20E�03 5.10E�05 1.40E�04 1.14E�01
Fresh milk (n¼30) Adults HQ 2.50E�01 1.00E�03 2.70E�02 7.70E�03 1.60E�02 8.90E�03 4.60E�03 3.15E�01Children HQ 9.30E�01 3.80E�03 1.00E�01 2.90E�02 6.10E�02 3.30E�02 1.70E�02 1.17Eþ00
Water (n¼55) Adults HQ 6.70E�01 8.30E�03 6.80E�03 2.70E�02 8.60E�02 1.80E�02 2.00E�03 8.18E�01Children HQ 7.40E�01 9.30E�03 7.60E�03 3.00E�02 9.60E�02 2.00E�02 2.20E�03 9.05E�01
Foodstuffs Population HQ 3.28Eþ00 2.27E�02 1.61E�01 1.05E�01 2.89E�01 8.15E�02 2.78E�02 3.97Eþ00
n, number of samples; HI, hazard index (aggregate risks for multiple heavy metals).
Fig. 3. Total metals hazard quotient (HQ) and hazard index (HI) values via foodstuffs consumption: (a) HQs contributions of heavy metals and (b) HI's contributions ofdifferent foodstuffs.
K. Khan et al. / Ecotoxicology and Environmental Safety 108 (2014) 224–232230

separately. The results revealed 81.8 percent of the total cumulativevariance for three factors in the adult's blood, in which Factor-1contributed 33.7 percent to the total variance with a high loadingon Cr (r¼0.899), Ni (r¼0.896) and Pb (r¼0.400) as shown in TableS3 (Supplementary material). Cr bioaccumulation in adults bloodcould be resulted from the high ingestion of water, Ni could be fromthe consumption of food crops particularly grains, fruits, vegetablesand pulses, while Pb levels could be influenced by consumption offruits and dairy product (milk). Factor-2 contributed 26.4 percentwith a high loading on Mn (r¼0.828), Cd (r¼0.779) and Pb(r¼0.501) as shown in Table S3 (Supplementary material). Mnand Cd bioaccumulation could be affected by ingestion of pulses,grains and vegetables, while Pb levels could be influenced by intakeof dairy product (milk). Factor-3 contributed 21.8 percent with ahigh loading on Zn (r¼0.971) and Cu (r¼0.205) as shown in TableS3 (Supplementary material). Both Mn and Cu level in the adult'sblood could be affected by consumption of grains, pulses and milk.
Similarly, for children the total cumulative variance for threefactors was 71.4 percent, in which Factor-1 contributed 29.3percent to the total variance with a high loading on Cr (r¼0.920), Ni (r¼0.847) and Cd (r¼220) as shown in Table S4(Supplementary material). Cd and Ni bioaccumulation could beresulted from consumption of grains, fruits, vegetables and pulses,while Cr levels could be influenced by high intake rate of waterand milk.
Factor-2 contributed 23.2 percent with a high loading onMn (r¼0.838) and Cu (r¼0.448) and Cd (r¼0.298), as shown inTable S4 (Supplementary material). Mn, Cu and Cd bioaccumula-tion could be affected by ingestion of food crops particularly pulsesand grains.
Factor-3 contributed 18.9 percent with a high loading on Pb(r¼0.797), Cu (r¼0.425) as shown in Table S4 (Supplementarymaterial). Cu bioaccumulation could be influenced by consumptionof pulses and grains, while Pb levels could be affected by high intakerate of water and milk in the children food.
The results of Factor-1, Factor-2 and Factor-3 in both adults andchildren blood suggest that selected food crops, milk and waterwere the possible heavy metals contributors to human blood.
The PCA assumptions were further strengthened by Pearsoncorrelation analysis, which provides valuable information aboutthe heavy metal bioaccumulation and their respective pathways.The 2-tailed significance correlation results showed that heavymetals correlation between human blood (adults and children)and foodstuffs (i.e., crops, milk and water) were significantlystrong, particularly for Cr, Cu, Mn, Ni, Pb and Zn as shown inTables S5 and S6 (Supplementary material).
Briefly, for adults the blood Cr concentrations exhibited astrong significant positive correlation (r¼0.985) with Cr in pulses,(r¼0.972) with Cr in milk and (r¼0.952) with Cr in water; and anegative correlation (r¼�0.903) with Cr in fruits (Table S5,Supplementary material). Similarly, Cu contents in adults bloodshowed a significant positive correlation with the contents of Cu inpulses (r¼0.882). The blood Ni contents in adults showed a strongsignificant negative correlation (r¼�0.981) with the contents ofNi in grains (Table S5, Supplementary material).
Whereas, for children the Cr levels in blood also showed astrong significant positive correlation (r¼0.987) with Cr in pulses,(r¼0.965) with Cr in milk and (r¼0.905) with Cr in water; and anegative correlation (r¼�0.933) with Cr in fruits (Table S6,Supplementary material). Mn contents in children blood exhibiteda positive correlation with the contents of Mn in water (r¼0.898)(Table S6, Supplementary material). Similarly, strong significantnegative correlations (r¼�0.966) and (r¼�0.931) were identi-fied between the blood Ni concentrations in children and Niconcentrations in grains and milk, respectively (Table S6, Supple-mentary material). The blood Pb concentrations in children also
showed a strong significant negative correlation with Pb in milk(r¼�0.970). Whereas, Zn contents in the children blood exhibiteda strong significant positive correlations (r¼0.984) and (r¼0.892)with the contents of Zn in water and fruits, respectively (Table S6,Supplementary material).
The positive correlation between heavy metal concentrationsof human blood and foodstuffs suggest that the metals in humanblood were transferred efficiently from the foodstuffs throughingestion, while negative correlation may be due to multipleinteractions among heavy metals for bioaccumulation in thehuman blood.
3.4. Risk assessments
The accumulation of metals in the food crops, milk and watercould have a direct impact on the health of local inhabitants.Therefore, the CDI, HQ and HI of metals via foodstuffs could be aconcern to the local residents. The results revealed considerablyhigh CDI through water and milk consumption for childrenfollowed by adults. Although all the CDI values were within safelimits, the highest value (1.4E�02 mg/kg-day) was recorded forchildren via Cr ingestion in water; whereas the lowest (1.0E�06 mg/kg-day) for adults via Pb ingestion in pulses.
Moreover, the potential chronic risks for individual and multi-ple heavy metals ingestion via foodstuffs are summarized inTable 3. The potential chronic risks or HQs of Cd, Cr, Cu, Mn, Ni,Pb and Zn for adults ranged from 5.8E�02 to 6.7E�01, 3.0E�06 to8.3E�03, 4.9E�04 to 2.7E�02, 3.0E�04 to 2.7E�02, 1.4E�03 to8.6E�02, 3.4E�05 to 1.8E�02 and 9.2E�05 to 4.6E�03, respec-tively; while those for children ranged from 8.7E�02 to 9.3E�01,4.0E�06 to 9.3E�03, 7.4E�04 to 1.0E�01, 4.5E�04 to 3.0E�02,2.1E�03 to 9.6E�02, 5.1E�05 to 3.3E�02 and 1.4E�04 to 1.7E�02, respectively (Table 3). All the calculated HQs of individualheavy metals were less than 1, suggesting that intake of a singlemetal through ingestion of food crops, milk and water did notpose a significant potential health hazard (Table 3). However, theaggregate HQs of every individual metals via different foodstuffsconsumption were found in the decreasing order of Cd4Ni4-Cu4Mn4Pb4Zn4Cr. The highest HQ (3.28Eþ00) was recordedthrough Cd intake, while the lowest (2.27E�02) through Cr(Fig. 3(a)). The high HQs could be influenced by the higherproportion of milk and water in the diet, which consequentlyincreased the health risk indexes for both adults and children.
Further, the HI of seven heavy metals via foodstuffs was alsocalculated to assess the overall potential chronic effects posed byseven metals together (Table 3). The total HI of seven metals viafood crops, milk and water ingestion was calculated as 3.97Eþ00,HI41, suggesting a potential health risk in the area. Water andmilk were found to be the major contributors (81 percent), toHI; while fruits contribute 5 percent, grains 5 percent, pulses4 percent and vegetables 5 percent, respectively (Fig. 3(b)).
4. Conclusions
It was concluded that heavy metal contaminations in thefoodstuffs (food crops, milk and water) and human blood weredecreasing in the order of Mn4Cr4Cu4Zn4Ni4Cd4Pb andCr4Zn4Mn4Ni4Pb4Cu4Cd, respectively. The concentra-tions of Cd, Cr, Ni and Pb in the foodstuffs were detectedsignificantly higher than their safe limits, which considerablyincreased the levels of heavy metals in the adult's blood ascompared to that of children. Further, principal component ana-lysis demonstrated that food crops, milk and water were thepossible sources of contamination/bioaccumulation in humanblood, while correlation analysis revealed that the heavy metals
K. Khan et al. / Ecotoxicology and Environmental Safety 108 (2014) 224–232 231

concentrations in foodstuffs and blood were significantly corre-lated, particularly for Cr, Cu, Mn, Ni, Pb and Zn, indicating thatthese food chains (i.e., food crops, milk and water ingestion) maybe the major pathways for exposure and sources of metalsbioaccumulation in human blood. Moreover, risk assessments forindividual metals were within safe limits, except for Cd, showinghigh level of HQ (HQZ3.28Eþ00). Whereas, the aggregate HI formultiple heavy metals via foodstuffs was calculated as 3.97Eþ00(HI41), which may pose a potential health risk for the consumers.Water and milk were considered as the major contributors (81percent) to HI; while fruits contributed 5 percent, grains 5 percent,pulses 4 percent and vegetables 5 percent, respectively. Therefore,based on our findings we strongly advise the environmental pro-tection authority to monitor the heavy metal concentrations infoodstuffs and increase awareness among the population regard-ing potential health risks for various exposures to heavy metals.
Acknowledgments
This study was supported by the Key Project of the ChineseAcademy of Sciences under Grant no. KZZD-EW-TZ-12. The financialassistance for this research work was provided by the ChineseAcademy of Sciences (CAS), China and The World Academy ofSciences (TWAS), Italy under FR number 3240255020, in the formof one year Postgraduate Fellowship to the first author.
Appendix A. Supplementary information
Supplementary data associated with this article can be found inthe online version at http://dx.doi.org/10.1016/j.ecoenv.2014.05.014.
References
Ali, S.M., Malik, R.N., 2011. Spatial distribution of metals in top soils of IslamabadCity, Pakistan. Environ. Monit. Assess. 172, 1–16.
Amin, N., Husain, A., Lamaze, S., Begum, S., 2013. Accumulation of heavy metals inedible parts of vegetables irrigated with waste water and their daily intake toadults and children, district Mardan, Pakistan. Food Chem. 136, 1515–1523.
Bermudez, G.M., Jasan, R., Plá, R., Pignata, M.L., 2011. Heavy metal and traceelement concentrations in wheat grains: assessment of potential non-carcinogenic health hazard through their consumption. J. Hazard. Mater. 193,264–271.
Bocca, B., Madeddu, R., Asara, Y., Tolu, P., Marchal, J.A., Forte, G., 2011. Assessment ofreference ranges for blood Cu, Mn, Se and Zn in a selected Italian population.J. Trace Elem. Med. Biol. 25, 19–26.
Cao, H., Chen, J., Zhang, J., Zhang, H., Qiao, L., Men, Y., 2010. Heavy metals in rice andgarden vegetables and their potential health risks to inhabitants in the vicinityof an industrial zone in Jiangsu, China. J. Environ. Sci. (China) 22, 1792–1799.
Chary, N.S., Kamala, C.T., Suman Raj, D.S., 2008. Assessing risk of heavy metals fromconsuming food grown on sewage irrigated soils and food chain transfer.Ecotoxicol. Environ. Saf. 69, 513–524.
Donaldson, S.G., Van Potsdam, J., Tikhonov, C., Feeley, M., Armstrong, B., Ayotte, P.,Boucher, O., Bowers, W., Chan, L., Dallaire, F., Dallaire, R., Dewailly, É., Edwards, J.,Egeland, G.M., Fontaine, J., Furgal, C., Leech, T., Loring, E., Muckle, G., Nancarrow, T.,Pereg, D., Plusquellec, P., Potyrala, M., Receveur, O., Shearer, R.G., 2010. Environ-mental contaminants and human health in the Canadian Arctic. Sci. Total Environ.408, 5165–5234.
Er, C., Senkal, B.F., Yaman, M., 2013. Determination of lead in milk and yoghurtsamples by solid phase extraction using a novel aminothioazole-polymericresin. Food Chem. 137, 55–61.
Farid, S.M., Enani, M.A., Wajid, S.A., 2004. Determination of trace elements in cow'smilk in Saudi Arabia. J. King Abdulaziz Univ.: Eng. Sci. 15, 131–140.
Fischer, A.B., Georgieva, R., Nikolova, V., Halkova, J., Bainova, A., Hristeva, V., Penkov, D.,Alandjiisk, D., 2003. Health risk for children from lead and cadmium near a non-ferrous smelter in Bulgaria. Int. J. Hyg. Environ. Health 206, 25–38.
Fytianos, K., Katsianis, G., Triantafyllou, P., Zachariadis, G., 2001. Accumulation ofheavy metals in vegetables grown in an industrial area in relation to soil. Bull.Environ. Contam. Toxicol. 67, 423–430.
Hu, W., Huang, B., Chen, W., Zhao, Y., Jiao, W., 2013. Accumulation and health risk ofheavy metals in a plot-scale vegetable production system in a peri-urbanvegetable farm near Nanjing, China. Ecotoxicol. Environ. Saf. 98, 303–309.
Huang, M., Zhou, S., Sun, B., Zhao, Q., 2008. Heavy metals in wheat grain:assessment of potential health risk for inhabitants in Kunshan, China. Sci. TotalEnviron. 405, 54–61.
Jan, F.A., Ishaq, M., Khan, S., Ihsanullah, I., Ahmad, I., Shakirullah, M., 2010. Acomparative study of human health risks via consumption of food crops grownon wastewater irrigated soil (Peshawar) and relatively clean water irrigated soil(lower Dir). J. Hazard. Mater. 179, 612–621.
Jan, F.A., Ishaq, M., Khan, S., Shakirullah, M., Asim, S.M., Ahmad, I., Mabiid, F., 2011.Bioaccumulation of metals in human blood in industrially contaminated area.J. Environ. Sci. (China) 23, 2069–2077.
Kavcar, P., Sofuoglu, A., Sofuoglu, S.C., 2009. A health risk assessment for exposureto trace metals via drinking water ingestion pathway. Int. J. Hyg. Environ.Health 212, 216–227.
Khan, K., Lu, Y., Khan, H., Ishtiaq, M., Khan, S., Waqas, M., Wei, L., Wang, T., 2013a.Heavy metals in agricultural soils and crops and their health risks in SwatDistrict, northern Pakistan. Food Chem. Toxicol. 58, 449–458.
Khan, K., Lu, Y., Khan, H., Zakir, S., Ihsanullah, Khan, S., Khan, A.A., Wei, L., Wang, T.,2013b. Health risks associated with heavy metals in the drinking water of Swat,northern Pakistan. J. Environ. Sci. (China) 25 (10), 1–10.
Khan, M.U., Malik, R.N., Muhammad, S., 2013. Human health risk from heavy metalvia food crops consumption with wastewater irrigation practices in Pakistan.Chemosphere 93, 2230–2238.
Khan, S., Cao, Q., Zheng, Y.M., Huang, Y.Z., Zhu, Y.G., 2008. Health risks of heavymetals in contaminated soils and food crops irrigated with wastewater inBeijing China. Environ. Pollut. 152, 686–692.
Khan, S., Rehman, S., Khan, A.Z., Khan, A., Shah, M.T., 2010. Soil and vegetablesenrichment with heavy metals from geological sources in Gilgit, northernPakistan. Ecotoxicol. Environ. Saf. 73, 1820–1827.
Mijal, R.S., Holzman, C.B., 2010. Blood cadmium levels in women of child bearingage vary by race/ethnicity. Environ. Res. 110, 505–512.
Muhammad, S., Shah, M.T., Khan, S., 2011. Health risk assessment of heavy metalsand their source apportionment in drinking water of Kohistan region, northernPakistan. Microchem. J. 98, 334–343.
Pasha, Q., Malik, S.A., Shaheen, N., Shah, M.H., 2010. Investigation of trace metals inthe blood plasma and scalp hair of gastrointestinal cancer patients in compar-ison with controls. Clin. Chim. Acta 411, 531–539.
Qasim, M., Hubacek, K., Termansen, M., Khan, A., 2011. Spatial and temporaldynamics of land use pattern in District Swat, Hindu Kush Himalayan regionof Pakistan. Appl. Geogr. 31, 820–828.
Rahman, A.U., Khan, A.N., 2011. Analysis of flood causes and associated socio-economic damages in the Hindu Kush region. Nat. Hazards 59, 1239–1260.
Rahman, M.A., Rahman, M.M., Reichman, S.M., Lim, R.P., Naidu, R., 2014. Heavymetals in Australian grown and imported rice and vegetables on sale inAustralia: health hazard. Ecotoxicol. Environ. Saf. 100, 53–60.
Sekomo, C.B., Nkurang, E., Rousseau, D.P., Lens, P.N., 2011. Fate of heavy metals in anurban natural wetland: the Nyabugogo Swamp (Rwanda). Water Air Soil Pollut.214, 321–333.
Shah, M.T., Ara, J., Muhammad, S., Khan, S., Tariq, S., 2012. Health risk assessmentvia surface water and sub-surface water consumption in the mafic andultramafic terrain, Mohmand agency, northern Pakistan. J. Geochem. Explor.118, 60–67.
Singh, A., Sharma, R.K., Agrawal, M., Marshall, F.M., 2010. Health risk assessment ofheavy metals via dietary intake of foodstuffs from the wastewater irrigated siteof a dry tropical area of India. Food Chem. Toxicol. 48, 611–619.
US EPA, 2005. Guidelines for Carcinogen Risk Assessment. Risk Assessment Forum.United States Environmental Protection Agency, Washington, DC (EPA/630/P-03/001F).
US EPA, 2011. Exposure Factors Handbook. United States Environmental ProtectionAgency, Washington, DC (EPA/600/R-09/052F).
Zhao, H., Xia, B., Fan, C., Zhao, P., Shen, S., 2012. Human health risk from soil heavymetal contamination under different land uses near Dabaoshan Mine, SouthernChina. Sci. Total Environ. 417–418, 45–54.
K. Khan et al. / Ecotoxicology and Environmental Safety 108 (2014) 224–232232
Recommended


