
Exploring the Emotional Intelligence Construct:
A Cross-Cultural Investigation
Gina Ekermans
Doctor of Philosophy
Brain Sciences Institute
Faculty of Life and Social Sciences
Swinburne University of Technology
June 2009

ii
TABLE OF CONTENTS
DECLARATION…………………………………………………………………………..vii
ACKNOWLEDGEMENTS……………………………………………………………….viii
ABSTRACT………………………………………………………………………………...ix
LIST OF TABLES……………………………………………………………………….....xi
LIST OF FIGURES…………………………………………………………………….. xviii
Chapter 1: Introduction 1
1.1 Overview 1
1.2 Structure of the dissertation 4
Chapter 2: Emotional Intelligence and Cross-cultural psychology 7
2.1 Overview 7
2.2 Emotional Intelligence (EI) 7
2.2.1 The state of the field 7
2.2.2 On the conceptual coherence of EI 10
2.2.3 Self-report EI inventories: a review of cross-cultural applications 12
Twenty-item Toronto Alexithymia Scale-III (TAS-20) 12
Bar-On Emotional Quotient Inventory (EQ-i) 16
Trait Meta-Mood Scale (TMMS) 18
Trait Emotional Intelligence Questionniare (TEIQue) 19
Schutte Self-Report Inventory (SSRI) 21
Wong and Law Emotional Intelligence Scale (WLEIS) 24
Closing Remarks 25
2.2.4 Moving forward with EI 25
2.3 Cross-cultural psychology and assessment 27
2.3.1 General introduction 27
2.3.2 Culture 30

iii
2.4 Bias and equivalence: a cross-cultural perspective 36
2.4.1 Introduction 36
2.4.2 Construct bias 37
2.4.3 Method bias 39
2.4.4 Item bias and Differential Item Functioning (DIF) 42
2.5 Conclusion 45
Chapter 3: Emotional Intelligence across cultures: theoretical and methodological
considerations 46
3.1 Overview 46
3.2 A brief review of the current state of cross-cultural EI research 47
3.3 Culture and emotion research: implications for EI 52
3.3.1 Emotional regulation in cultures 54
Individualism / Collectivism 55
Display rules 56
Uncertainty Avoidance 57
Power Distance 58
3.3.2 Emotional expression 59
Individualism / Collectivism 60
3.3.3 Emotional recognition (judgment) in self and others 61
Individualism / Collectivism 62
3.4 Cross-cultural EI research: methodological issues 63
3.4.1 Convergence of two approaches 63
3.4.2 Reframing of bias and equivalence 65
3.4.3 Applying measurement invariance in cross-cultural EI research 66
3.5 Conclusion 68
Chapter 4: Cultural bias investigation of the SUEIT over various cross-national
samples 70
4.1 Introduction 70
4.2 Research questions and hypotheses 70

iv
4.3 Data analytic strategies 85
4.3.1 Validity extension and generalisation 85
4.3.2 Tests of MI: Omnibus, Configural, and Metric tests of invariance 85
4.3.3 Investigating method bias 88
4.3.4 Investigating Differential Item Functioning (DIF) 90
4.4 Method 91
4.4.1 Measure: Swinburne University Emotional Intelligence Test (SUEIT,
Palmer & Stough, 2001) 91
4.4.2 The SUEIT measurement models 93
4.4.3 Sampling procedure and data collection 94
4.4.4 Participants 96
Australian sample 96
New Zealand sample 97
United States of America (USA) sample 97
Sri Lanka sample 98
Italian sample 98
South African samples 99
4.4.5 Data analytic procedure 100
Structural Equation Modeling (SEM) fit indices 100
Parameter estimation, variable type and item parcels 102
Missing values: imputation by matching 106
Matching the samples 107
4.5 Results 108
4.5.1 Results: validity extension (loose replication) 108
4.5.1.1 Australian results 109
4.5.1.2 New Zealand results 112
4.5.1.3 USA results 115
4.5.1.4 Italian results 117
4.5.1.5 Sri Lanka results 120
4.5.1.6 South African White results 122
4.5.1.7 South African non-White results 125

v
4.5.2 Results: Validity generalisation 128
4.5.3 Discussion: validity extension and generalisation results 128
4.5.4 Results: cross-cultural validation (testing MI) 132
4.5.5 Discussion: cross-cultural validation 137
Construct bias 137
4.5.6 Results: method bias 139
Response styles: ERS and ARS indices 139
Verbal ability / bilingualism of respondents (item keying effects) 141
4.5.7 Discussion: method bias 147
Response styles: ERS and ARS indices 147
Verbal ability / bilingualism of respondents (item keying effects) 153
4.5.8 Results: Differential Item Functioning 155
4.5.8.1 Results: 2-way ANOVA DIF 156
4.5.8.2 Discussion: 2-way ANOVA DIF results 160
4.5.8.3 Results: Multiple-Group Mean and Covariance Structure Analyses
(MACS) DIF 161
Australia and New Zealand 164
Australia and USA 165
Australia and Italy 167
Australia and South Africa White 169
Australia and South Africa Non-White 171
Australia and Sri Lanka 174
4.5.8.4 Discussion: MACS DIF results 176
4.5.9 Results: Latent mean differences in EI 179
4.5.10 Discussion: Latent mean differences in EI 184
4.6 General discussion 186
4.7 Limitations and suggestions for future research 193
4.8 Conclusion 197

vi
Chapter 5: Final discussion and conclusions 199
5.1 Introduction 199
5.2 Theoretical and practical implications 201
5.3 Future research 207
5.4 Conclusion 211
REFERENCES 212
Appendix 1 261
Appendix 2 263
Appendix 3 277
Appendix 4 284

vii
DECLARATION
I declare that this thesis does not incorporate any material previously submitted for a degree
in an University, College or Advances Education, or other educational institution; and that
to the best of my knowledge and belief it does not contain any material previously
published or written by another person except where due reference is made in the text.
Gina Ekermans
17 June, 2009

viii
ACKNOWLEDGEMENTS
This PhD dissertation is a testimony of the goodness of God, Jesus Christ and the Holy
Spirit in my life. He has been faithful at every step of the way. “But there is a spirit in a
man, and the breath of the Almighty gives him understanding” (Job 32:8).
I would like to sincerely thank Prof Con Stough for constant support, encouragement and
guidance throughout this project. Special thanks also to Prof Don Saklofske for coming
onboard and providing valuable support and inputs along the way.
I would like to thank Prof Callie Theron for introducing me to Psychometrics at
undergraduate level (a very thorough introduction!). His unique passion for the subject
grabbed my attention and inspired me to delve deeper into the subject. Many thanks to
Callie for allowing me to always walk into his office (without an appointment) and discuss
SEM / LISREL questions and issues (for hours!). I would also like to thank Prof Ype
Poortinga for reading earlier versions of the draft and providing unique feedback on the
cross-cultural aspects thereof. This made me look at my work from a different angle.
I would also like to thank Con and Dr Ben Palmer for making large portions of the data
used in this dissertation, available to me. Thank you to Luke Downey, Peter Walker, and
Vilfredo De Pascalis for helping to gather data.
Thank you to fellow PhD students at the Brain Sciences Institute for fun times and support
during the completion of this project! Lastly, to all my friends, colleagues (special thanks to
Ronel du Preez) and family, thank you for your continued support and encouragement
(special thanks to Ronel van Rooyen, Erika Luyckx and Johann Görgens)!
Thank you to the Oppenheimer Trust and the National Research Foundation South Africa
for funding to pursue this project.

ix
ABSTRACT
Test transportability is a prevalent issue in psychological measurement. Oakland (2004)
report that foreign developed tests are used, in most countries, more frequently than
nationally developed tests. The main aim of this research was to differentiate cultural bias
from true construct variance in a self-report measure of Emotional Intelligence (EI) in the
workplace (the Swinburne University Emotional Intelligence Test, SUEIT; Palmer &
Stough, 2001). Such investigations are necessary as tests of EI are increasingly being used
extensively around the world. For example, the Twenty-item Toronto Alexithymia Scale-III
(TAS-20) (Parker, Taylor & Bagby, 2003) has been translated into 18 languages. The Bar-
On Emotional Quotient Inventory (EQ-i, Bar-On, 1997) has 22 language translations and
normative data is available in more than 15 countries (Bar-On, 2000).
This investigation focused on the generalisability and transportability of the SUEIT, a
prominent self-report monocentered (i.e. instrument from a single, Western cultural
background; Van de Vijver & Leung, 2001) EI measure to two Western (USA, New
Zealand) and four non-Western countries (Italy, South Africa White and Non-White, Sri
Lanka). It could be argued that the Western cultural origin of the test (i.e. Australia)
contains descriptions of EI as defined within Australian culture. Cultural dimension
differences (Hofstede, 1980, 2001) could introduce cultural bias into Western EI measures
on various levels, when applied in non-Western environments. On a broad conceptual level
the central research question this study aimed to investigate can be formulated as follows:
to what extent do Hofstede (1980, 2001) cultural dimensions systematically influence the
cross-cultural transportability of a self-report EI measure?
Measurement invariance (configural and metric invariance; VandenBerg & Lance, 2000),
method bias (national differences in response styles, i.e. extreme response styles and
acquiescence; Van Herk, Poortinga, & Verhallen, 2004; as well as negatively keyed method
factors) and the differential item functioning (uniform and non-uniform DIF were
investigated with a series of Mean and Covariance Structures Analyses models run in
LISREL 8.8; Chan, 2000) of the SUEIT over the various samples, were investigated. It

x
was argued that the amount of cultural bias would increase as the Cultural Distance (CD,
the extent to which cultures are similar or different; Shenkar, 2001) (Kogut & Singh, 1988)
between a given cultural group (e.g. Sri Lanka) and Australia increase. That is, the more a
particular culture is dissimilar to Australian culture (origin of the SUEIT) the more
pronounced the influence of culture will be on the transportability of the instrument. In
addition, latent mean differences (derived from partially constrained SEM models) in the
different SUEIT EI subscales were also investigated.
Overall the results of the construct, method and item bias investigations suggested that the
transportability of the instrument is not severely affected when used in other Western
cultures. Almost no significant latent mean differences on the various EI facets were
evident between Western cultural groups (i.e. New Zealand and USA compared to
Australia). Evidence of cultural bias, when the instrument was applied to respondents from
non-Western cultures, was found. In addition, notable significant latent mean differences
between Australia and the non-Western cultural groups, on various EI facets, emerged. The
results suggest that it may be necessary to adapt the SUEIT for future cross-cultural use.
The practical implications of the results within the workplace, as well as limitations of the
study and recommendations for future research were discussed.
xi
LIST OF TABLES
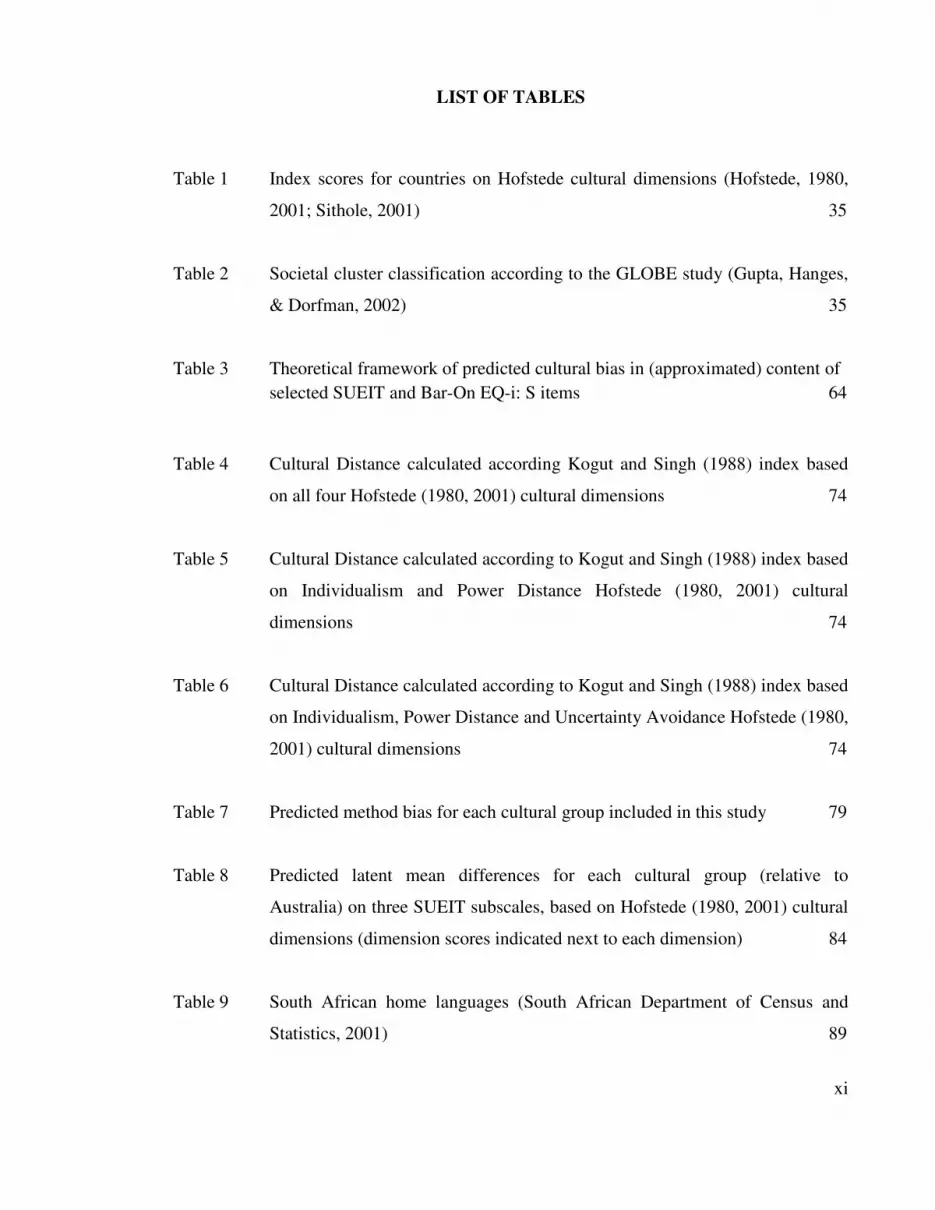
Table 1 Index scores for countries on Hofstede cultural dimensions (Hofstede, 1980,
2001; Sithole, 2001) 35
Table 2 Societal cluster classification according to the GLOBE study (Gupta, Hanges,
& Dorfman, 2002) 35
Table 3 Theoretical framework of predicted cultural bias in (approximated) content of
selected SUEIT and Bar-On EQ-i: S items 64
Table 4 Cultural Distance calculated according Kogut and Singh (1988) index based
on all four Hofstede (1980, 2001) cultural dimensions 74
Table 5 Cultural Distance calculated according to Kogut and Singh (1988) index based
on Individualism and Power Distance Hofstede (1980, 2001) cultural
dimensions 74
Table 6 Cultural Distance calculated according to Kogut and Singh (1988) index based
on Individualism, Power Distance and Uncertainty Avoidance Hofstede (1980,
2001) cultural dimensions 74
Table 7 Predicted method bias for each cultural group included in this study 79
Table 8 Predicted latent mean differences for each cultural group (relative to
Australia) on three SUEIT subscales, based on Hofstede (1980, 2001) cultural
dimensions (dimension scores indicated next to each dimension) 84
Table 9 South African home languages (South African Department of Census and
Statistics, 2001) 89

xii
Table 10 MACS procedure to test for DIF (Chan, 2000) 91
Table 11 Four different SUEIT factor structures (measurement models) 94
Table 12 Industry representation per sample 97
Table 13 Subscale internal reliabilities, means and standard deviations for Australian
split samples for models M2 and M2a 109
Table 14 Goodness-of-fit statistics results of the single-group SUEIT CFAs for
Australia A (n=1604) and Australia B (n=1605) samples 110
Table 15 Summary of RML completely standardised parameter estimates for model
M2a for Australia A and B 111
Table 16 Subscale internal reliabilities, means and standard deviations for New Zealand
(n=234) models M2 and M2a 112
Table 17 Goodness-of-fit statistics results of the single-group SUEIT CFAs for New-
Zealand (n=234) 113
Table 18 Summary of RML completely standardised parameter estimates for model
M2a for New Zealand 114
Table 19 Subscale internal reliabilities, means and standard deviations for USA (n=287)
models M2 and M2a 115
Table 20 Goodness-of-fit statistics results of the single SUEIT CFAs for USA (n=287)
115

xiii
Table 21 Summary of RML completely standardised parameter estimates for model
M2a for USA 116
Table 22 Subscale internal reliabilities, means and standard deviations for Italian
(n=320) models M2 and M2a 118
Table 23 Goodness-of-fit statistics results of the single-group SUEIT CFAs for Italian
sample (n=320) 118
Table 24 Summary of RML completely standardised parameter estimates for model
M2a for Italy 119
Table 25 Subscale internal reliabilities, means and standard deviations for Sri Lanka
sample (n=587) models M2 and M2a 120
Table 26 Goodness-of-fit statistics results of the single group SUEIT CFAs for Sri
Lanka sample (n=587) 121
Table 27 Summary of RML completely standardised parameter estimates for model
M2a for Sri Lanka 122
Table 28 Subscale internal reliabilities, means and standard deviations for South
African White sample (n=290) models M2 and M2a 123
Table 29 South African White (n=290) goodness-of-fit statistics results for the single-
group SUEIT CFAs 123
Table 30 Summary of RML completely standardised parameter estimates for model
M2a for the SA White sample 124

xiv
Table 31 Subscale internal reliabilities, means and standard deviations for South
African Non-White sample (n=337) for models M2 and M2a 126
Table 32 South African Non-White (n=337) goodness-of-fit statistics results of the
single group SUEIT CFAs 126
Table 33 Summary of RML completely standardised parameter estimates for model
M2a for SA Non-White sample 127
Table 34 Values for absolute fit indices over all countries for the four measurement
models 129
Table 35 Results of the Australian (n=234) and New Zealand (n=234) cross-national
configural and omnibus invariance analyses 134
Table 36 Results of the Australian (n=287) and USA (n=287) cross-national configural,
omnibus and metric invariance analysis 134
Table 37 Results of the Australian (n=320) and Italian (n=320) cross-national
configural, omnibus and metric invariance analyses 135
Table 38 Results of the Australian (n=290) and South African White (n=290) cross-
national configural, omnibus and metric invariance analyses 138
Table 39 Results of the Australian (n=337) and South African Non-White (n=337)
cross-national configural, omnibus and metric invariance analyses 136
Table 40 Results of the Australian (n=587) and Sri Lanka (n=587) cross-national
configural, omnibus and metric invariance analyses 136
Table 41 Acquiescence index 140

xv
Table 42 Extreme Response Index 140
Table 43 CFA results for models M2a and M2b in Australian, Sri Lanka (Sinhala) and
South African samples 142
Table 44 Summary of RML completely standardised parameter estimates for model
M2b for the SA White sample 143
Table 45 Summary of RML completely standardised parameter estimates for model
M2b for the SA Non-White sample 144
Table 46 Summary of RML completely standardised parameter estimates for model
M2b for the Australian A sample 145
Table 47 Summary of RML completely standardised parameter estimates for model
M2b for the Sri Lanka (Sinhala) sample 146
Table 48 Pearson correlations between Hofstede dimensions (IND, PD) and ARS and
ERS indices over all the samples 149
Table 49 Uniform and non-uniform bias effects for SUEIT (M2a) items 1-32 for New
Zealand, USA and SA White data 157
Table 50 Uniform and non-uniform bias effects for SUEIT (M2a) items 33-64 for New
Zealand, USA and SA White data 158
Table 51 Uniform and non-uniform bias effects for SUEIT (M2a) items 1-32 for Italian,
Sri Lanka and SA Non - White data 159

xvi
Table 52 Uniform and non-uniform bias effects for SUEIT (M2a) items 33-64 for
Italian, Sri Lanka and SA Non - White data 160
Table 53 MACS DIF results: Australia (n=234) and New Zealand (n=234) 164
Table 54 MACS DIF results: Australia (n=287) and USA (n=287) 166
Table 55 MACS DIF results: Australia (n=320) and Italy (n=320) for EE 167
Table 56 MACS DIF results: Australia (n=320) and Italy (n=320) for UEX, EMO and
EC 168
Table 57 MACS DIF results: Australia (n=290) and SA White (n=290) for EE 169
Table 58 MACS DIF results: Australia (n=290) and SA White (n=290) for UEX,
EMS 170
Table 59 MACS DIF results: Australia (n=290) and SA White (n=290) for EMO,
EC 171
Table 60 MACS DIF results: Australia (n=337) and SA Non-White (n=337) EE,
UEX 172
Table 61 MACS DIF results: Australia (n=337) and SA Non-White (n=337)
EMS, EMO 173
Table 62 MACS DIF results: Australia (n=587) and Sri Lanka (n=587) for EMS,
EC 174
Table 63 MACS DIF results: Australia (n=587) and Sri Lanka (n=587) for EE,
UEX 175

xvii
Table 64 Standardised mean difference (d statistic) for affected SUEIT subscales over
various cultural groups 178
Table 65 EI Latent mean difference 180

xviii
LIST OF FIGURES
Figure 1 SUEIT 7 factor model (M2) (Stough, personal communication, 2007) 95

1
CHAPTER 1:
Introduction
1.1 Overview
Societies continue to become more culturally diversified. In part this is due to the
globalisation of world trade and increase in migrant labour groups. In addition,
multinational corporations are gaining increased influence. The international workforce
continue to become more heterogeneous and the workplace more multicultural. These
changes influence the behavioral sciences which is becoming more cross-culturally
orientated (Fontaine, 2005). Researchers and practitioners of Industrial / Organisational
(I/O) psychology should be cognisant of cultural diversity and its implications in the
workplace. One such implication is that cross-cultural psychological assessment continues
to increase (Casillas & Robbins, 2005; Van de Vijver, 2002). Test transportability is a
prevalent issue in psychological measurement.
The main aim of this research is to differentiate cultural bias from true construct variance in
a self-report measure of Emotional Intelligence (EI) in the workplace (the Swinburne
University Emotional Intelligence Test, SUEIT; Palmer & Stough, 2001). Such
investigations are necessary as tests of EI are increasingly being used extensively around
the world. For example, the Twenty-item Toronto Alexithymia Scale-III (TAS-20) (Parker,
Taylor & Bagby, 2003) has been translated into 18 languages. Spanish, French and
Portuguese translations of the English Trait Meta-Mood scale (TMMS; Salovey, Mayer,
Goldman, Turvey, & Palfai, 1995) exist (Fernandez-Berrocal, Extremera, & Ramos, 2004;
Queirós, Fernández-Berrocal, Extremera, Carral, Queirós, 2005). The Bar-On Emotional
Quotient Inventory (EQ-i, Bar-On, 1997) has been translated into 22 languages and
normative data is available in more than 15 countries (Bar-On, 2000).
Oakland (2004) report that foreign developed tests are used, in most countries, more
frequently than nationally developed tests. This implies that the comparability of
psychological measurements across different cultural groups should be investigated. More
specifically, tests of bias and equivalence should routinely be conducted as bias and

2
equivalence investigations have theoretical and practical (applied) relevance. Bias refers to
a range of factors that introduce disturbances into cross-cultural assessment. The
measurement implications of bias in terms of the comparability of scores over cultures, is
termed equivalence (Van de Vijver & Leung, 1997).
Various levels of theoretical and practical implications related to bias and equivalence in
cross-cultural measurement can be distinguished. This dissertation will focus specifically
on the implications of cross-cultural psychological measurement in the workplace. Firstly,
evidence of configural invariance (Vandenberg & Lance, 2000) / structural equivalence (i.e.
obtaining equal factor structures in various cultural groups; Van de Vijver & Leung, 1997)
indicates theoretical similarity (over different groups) in the psychological constructs
underlying the measurement. An absence of structural equivalence points towards bias at
the construct level. In practice this could mean that a given psychological construct differs
across cultural groups (Fontaine, 2005; Van de Vijver & Tanzer, 2004).
Secondly, when anomalies at the item level exist, item bias is detected (Fontaine, 2005).
Differential Item Functioning (DIF) could point towards differences in the psychological
meaning of items over cultures or inapplicability of item content in a specific culture. Two
types of item bias with different practical relevance exist. Non-uniform item bias (i.e.
differences in item discrimination) has implications at the metric invariance / equivalence
level. The practical implication of evidence of this type of bias is that latent variables are
not measured on the same metric scales across different groups. Hence, workplace
decisions (e.g. personnel selection) based on relative differences between groups on the
latent trait may not be meaningful, except where group specific norms are used to avoid
adverse impact (i.e. similar selection ratios for majority and minority groups). Uniform bias
(i.e. differences in item difficulty) exists when the regression of the observed item scores on
the latent variable differs across groups in terms of the item intercept. If assumptions of
scalar equivalence remain untested, the impact is minimal on within cultural group
decisions. This is because all scores will be affected in the same direction. However,
between group differences may be erroneously interpreted in the absence of scalar
invariance evidence (Cheung & Rensvold, 2002; Steenkamp & Baumgartner, 1998;

3
Vandenberg & Lance, 2000). Group differences may be due to measurement bias and not
real underlying differences (Van de Vijver & Tanzer, 2004). In the absence of such
equivalence investigations, the truth about group differences on the latent trait and
subsequent practical implications of group membership in the workplace is simply not
known.
Thirdly, the possibility of the presence of method bias in cross-cultural assessment test
results should also routinely be inspected. For example, national differences in response
styles (i.e. Extreme response styles; that is the tendency to use the extreme ends of a rating
scale; Cheung & Rensvold, 2000; Van Herk, Poortinga, & Verhallen, 2004; or
acquiescence, the tendency to agree with questions, regardless of question content;
Johnson, Kulesa, Cho, & Shavitt, 2005) and verbal proficiency of respondents (Church,
2001, Owen, 1991; Poortinga & Van de Vijver, 1987) may influence test results. If left
unevaluated, it may be misconstrued as substantive differences in the latent construct (Van
de Vijver & Tanzer, 2004). By demonstrating that a measure is free of culturally driven
response styles or other sources of method bias, alternative explanations for observed cross-
cultural differences may be eliminated. This may strengthen inferences that are drawn from
such data in the workplace.
The construct of EI has continued to receive extensive attention in the scientific and
practitioner literature (e.g. Bar-On, 2000; Roberts, Zeidner, & Matthews, 2001; Mayer,
Salovey, & Caruso, 1997, 2004). Generally, EI is defined as the competence to identify and
express emotions, understand emotions, assimilate emotions in thought, as well as
reflectively regulate both positive and negative emotions in the self and others (Matthews,
Zeidner & Roberts, 2002, Salovey & Mayer, 1990). For the purpose of this dissertation EI
in the workplace is defined as, “the capacity to effectively perceive, express and understand
and manage emotions in a professional and effective manner at work” (Palmer & Stough,
2001, p. 1).
This investigation focuses on the generalisability and transportability of the SUEIT, a
prominent self-report monocentered (i.e. instrument from a single, Western cultural
4
background; Van de Vijver & Leung, 2001) EI measure. The instrument is being used
extensively around the world. It could be argued that the Western cultural origin of the test
(i.e. Australia) contains descriptions of EI as defined within Australian culture. It is
proposed that the increasingly multicultural global work environment mostly advocate
value systems inherent to the Western industrialised world system (e.g. high Individualism
and low Power Distance; Hofstede, 1980, 2001). However, respondents being assessed
within these environments are increasingly coming from different cultural backgrounds
with known differentiation in cultural value dimensions (e.g. Individualism, Power
Distance; Hofstede, 1980, 2001).
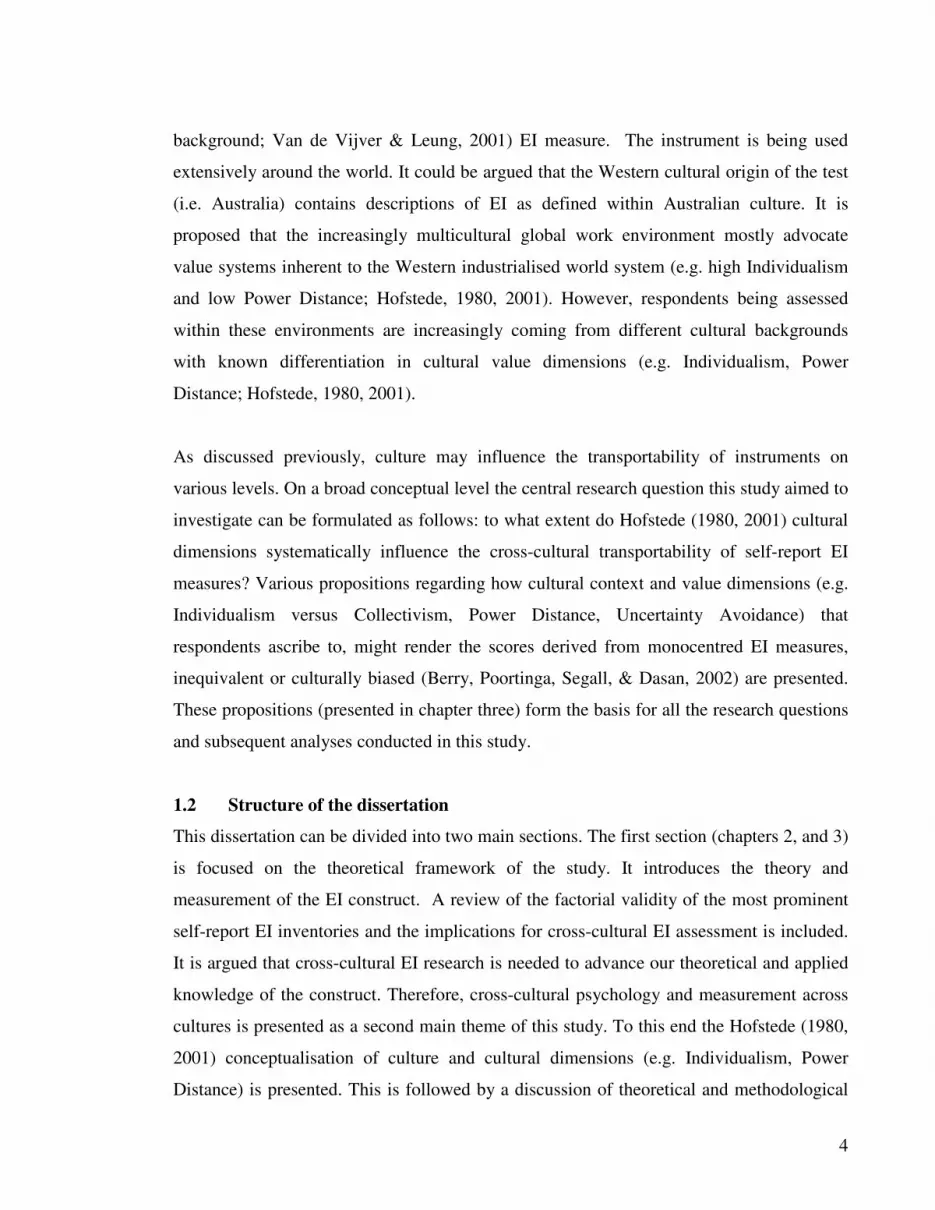
As discussed previously, culture may influence the transportability of instruments on
various levels. On a broad conceptual level the central research question this study aimed to
investigate can be formulated as follows: to what extent do Hofstede (1980, 2001) cultural
dimensions systematically influence the cross-cultural transportability of self-report EI
measures? Various propositions regarding how cultural context and value dimensions (e.g.
Individualism versus Collectivism, Power Distance, Uncertainty Avoidance) that
respondents ascribe to, might render the scores derived from monocentred EI measures,
inequivalent or culturally biased (Berry, Poortinga, Segall, & Dasan, 2002) are presented.
These propositions (presented in chapter three) form the basis for all the research questions
and subsequent analyses conducted in this study.
1.2 Structure of the dissertation
This dissertation can be divided into two main sections. The first section (chapters 2, and 3)
is focused on the theoretical framework of the study. It introduces the theory and
measurement of the EI construct. A review of the factorial validity of the most prominent
self-report EI inventories and the implications for cross-cultural EI assessment is included.
It is argued that cross-cultural EI research is needed to advance our theoretical and applied
knowledge of the construct. Therefore, cross-cultural psychology and measurement across
cultures is presented as a second main theme of this study. To this end the Hofstede (1980,
2001) conceptualisation of culture and cultural dimensions (e.g. Individualism, Power
Distance) is presented. This is followed by a discussion of theoretical and methodological

5
considerations that pertain to the study of EI across cultures (chapter 3). More specifically,
a review of key aspects of three decades of emotions and culture research is presented,
whilst implications for EI conceptualisation and operationalisation within the framework of
different cultures is discussed. The discussion focuses on emotional regulation, expression
and recognition as key aspects of EI. It aims to propose how different cultures may differ
on these aspects of EI. It is argued that such differences may be a result of the fact that
cultures (with different cultural value dimensions) differentially define appropriate and
adaptive emotionally intelligent behaviours. Hence, cultural dimension differences could
introduce cultural bias into Western cross-cultural EI measures on various levels, when
applied in non-Western environments. Specific items are predicted to be susceptible to
cultural bias based on the item content which, for example, taps some aspect of
Individualism or Power Distance values (cultural dimensions upon which most nationalities
differ). In addition, the presence of cultural bias (construct, method or item bias) could
influence the metric and structural equivalence of the given instruments, when measures are
transported from one culture (Western) to another (non-Western).
The second section of this dissertation presents the empirical results (chapter 4) and general
discussion (chapter 5) of this study. The results of the cultural bias investigation of the
SUEIT when applied in various cross-national samples (Australia, New Zealand, USA,
South Africa White and Non-White, Italy and Sri Lanka) are presented in chapter 4. More
specifically, measurement invariance (structural and metric equivalence), method bias and
the DIF of the SUEIT were investigated. It was argued that the amount of cultural bias
would increase as the Cultural Distance (CD, the extent to which cultures are similar or
different; Shenkar, 2001) (Kogut & Singh, 1988) between a given cultural group (e.g. Italy)
and Australia increase. Hence, the transportability of the instrument will adversely be
affected as the CD increases. That is, the more a particular culture is dissimilar to
Australian culture (origin of the SUEIT) the more pronounced the influence of culture will
be on the transportability of the instrument. In addition, latent mean differences in the
different SUEIT EI subscales were also investigated. The practical implications of the
results within the workplace were discussed.

6
Chapter 5 provides a general discussion of the results. Overall the results of the construct,
method and item bias investigations suggested that the transportability of the instrument is
not severely affected when used in other Western cultures. Almost no significant latent
mean differences on the various EI facets were evident between Western cultural groups
(i.e. New Zealand and USA compared to Australia). Evidence of cultural bias, when the
instrument was applied to respondents from non-Western cultures, was found. In addition,
notable significant latent mean differences between Australia and the non-Western cultural
groups, on various EI facets, emerged. The results suggest that it may be necessary to adapt
the SUEIT for future cross-cultural use. Limitations of the study and recommendations for
future research are discussed.

7
CHAPTER 2:
Emotional Intelligence and Cross-Cultural Psychology
2.1 Overview
This chapter presents the theoretical framework for this study. Consistent with the title, two
main themes are addressed. First, the theory and measurement of the EI construct is
introduced. A review of six prominent self-report EI inventories’ use in different cultures /
ethnic groups is outlined. Weaknesses and strengths of such applications are highlighted.
Implications for future use of EI inventories over different cultures are discussed. Next,
cross-cultural psychology, as well as bias and equivalence as cross-cultural assessment
issues, are discussed. The Hofstede (1980, 2001) conceptualisation and measurement of
dimensions of culture is described. The discussion then focuses on bias and equivalence as
central themes in cross-cultural measurement.
2.2 Emotional Intelligence
2.2.1 The state of the field
Interest in emotions has enjoyed resurgence across a wide range of sub disciplines within
psychology, neuroscience and the health sciences in the last two decades. Various
publications in the form of article special issues (e.g., Diener, 1999; Larsen, 2000) and
books (e.g. Ashkanasy, Hartel, & Zerbe, 2000; Lord, Klimoski, & Kanfer, 2002)
demonstrate the relevance of gaining an increased understanding of emotions in workplace
behavior. The utility of emotions (Fredrickson, 2003; Bagozzi, 2003) in positive
organisational psychology (Luthans, 2002; Luthans & Jensen, 2001), as well as anecdotal
and empirical evidence indicating that emotions are related to work behavior, performance
and attitudes (Arvey, Renz, & Watson, 1998; Weis & Cropanzano, 1996) underscores the
relevance of substantial advances in understanding the structure and role of emotions in the
workplace and human behavior in general. Next to motivation, cognition, and perception,
emotions are viewed as one of the basic functions of the human psyche, and with the
relatively recent advent of the construct of Emotional Intelligence (EI), emotions are
rapidly permeating the domain of work and organisational psychology.

8
Due to the original popular-press publications (Goleman, 1995; 1998), more recent
comprehensive research texts (e.g. Bar-On & Parker, 2000; Emmerling, Shanwal, &
Mandal, 2008; Matthews, Zeidner & Roberts, 2002; Stough, Saklofske, & Parker, 2009),
mainstream media exposure (e.g. “The EQ factor”, TIME magazine, 1995) and a notable
rapid increase in academic research, Emotional Intelligence (EI) has been described as,
“…a key construct in modern-day psychological research, appearing as one of the most
widely discussed aspects of intelligence in the current literature” (Matthews et al., 2002,
p.xv). Several academic journals have, in the last few years, markedly increased
publications on the topic of EI. For example, an EI keyword search revealed 78 articles
published from 1998 to 2008 in Personality and Individual Differences alone, a leading
resource for differential psychologists. A whole issue (volume 15, issue 3) of Psychological
Inquiry (that specialises in commentary), published in 2004, was devoted to EI. Similarly,
the editors of Emotion published 9 EI articles in one 2001 issue (volume 1, issue 3),
consolidating writings on some of the constructs’ most prominent researchers (e.g. Mayer,
Salovey, Caruso & Sitarenios, 2001) well known skeptics (Zeidner, Matthews, & Roberts,
2001) as well as leading scholars in emotion and intelligence. In reviewing the literature on
the construct it is evident that it has captured the interest of scholars and practitioners alike,
often spurring extreme viewpoints in the debate over EI (Brody, 2004; Mayer et al., 2004;
Matthew, Roberts, & Zeidner, 2004). Mostly, these debates continue to be focused on the
conceptualisation and operationalisation of the construct, as is evident from continued peer
reviewed publications addressing these themes (e.g. Ciarrochi, Chan, & Caputi, 2000;
Davies, Stankov, & Roberts, 1998; Petrides & Furnham, 2000; Van Rooy, Viswesvaran &
Pluta, 2005; Zeidner et al., 2001).
Since 1990 when Mayer, DiPaolo and Salovey (1990) reported on the first scale measuring
an aspect of EI in a scientific journal (Salovey & Mayer, 1990; Mayer & Salovey, 1997),
some rather unnerving unscientific claims, mostly regarding the breadth and promise of EI,
have been proposed (Goleman 1995, 1998). For example, Goleman (1998, p.31) has stated
that, “…EI accounts for over 85% of outstanding performance in top leaders” whilst
equating EI with “zeal and persistence” (Goleman, 1995, p. 285). According to Antonakis
(2004, p. 171), “…claims about the apparent necessity of EI for leadership or organisational
9
performance are unsubstantiated, exaggerated, misrepresented, or simply false”. After
reviewing systematic research on the Mayer-Salovey-Carosu Emotional Intelligence Test
(MSCEIT) (Mayer et al., 2004), one the most prominent EI measures, Brody (2004, p.237)
remains doubtful of its predictive validity and states that, “there is not a single study
reported that indicated that EI has non-trivial incremental validity for a socially important
outcome variable after controlling for intelligence and personality…too many of the studies
are not published in peer-reviewed journals”. Others have questioned the concept of EI
itself, labeling it as an “elusive concept” (Davies et al., 1998, p.989) whilst some seemed to
have progressed in their views from, “EI appears to be more myth than science” (Matthews
et al., 2002, p.547) to “…because scientific research is just beginning, EI could indeed
mature into a construct that is theoretically meaningful, empirically important, and
practically useful” (Matthews et al., 2004, p.179). What is clearly apparent, however, is the
continued request for systematic scientific research on the EI construct (e.g. Mayer, Caruso,
& Salovey, 2000; Zeidner, Matthews, & Roberts, 2004; Barret & Gross, 2001) and that
such research should be vigorously conducted. Moreover, EI is increasingly being
connected with several cutting-edge areas of psychological science, including neuroscience
(Bar-On, Tranel, Denburg, & Bechara,
2003; Freudenthaler, Fink, & Neubauer, 2005;
Gawryluk & McGlone, 2007; Kemp, Cooper, Hermens, Gordon, Bryant, & Williams,
2005). Research on the construct continues to gain momentum with evidence from various
studies displaying an association of EI with psychosomatic and physical health (e.g.
Schutte, Malouff, Thorsteinsson, Bhullar & Rooke, 2006; Saklofske, Austin, Galloway, &
Davidson, 2007), life satisfaction (Extremera & Fernández-Berrocal, 2005; Gignac, 2006),
work performance (Van Rooy & Viswesvaran, 2004), stressor appraisal and task
performance (Lyons & Schneider, 2005), team (e.g. Jordan, Ashkanasy, Hartel, & Hooper;
2005) and academic performance (e.g. Parker, Creque, Barnhart, Harris, Majeski, Wood,
Bond, & Hogan, 2004; Austin, Evans, Goldwater, & Potter; 2005). In a recent
comprehensive critical review on the claimed role of EI in the occupational environment
(Zeidner et al., 2004) the authors concluded that future research may well demonstrate that
EI facets assess important individual differences not currently included in conventional
ability and interests assessments. This renders EI “highly influential…and important” in

10
occupational settings, a construct that may even hold the promise of a predictor with
reduced adverse impact (Zeidner et al., 2004, p.394).
2.2.2 On the conceptual coherence of EI
EI broadly refers to the competence to identify and express emotions, understand emotions,
assimilate emotions in thought, as well as reflectively regulate both positive and negative
emotions in the self and others (Matthews et al., 2002; Salovey & Mayer, 1990) so as to
promote emotional and intellectual growth (Mayer & Salovey, 1997). Various authors note
that a long history of theoretical and empirical work precedes the domain of emotional and
social competence (Bar-On, 2000; Mayer & Salovey, 1997; Parker, 2000). The work of
Thorndike (1920) on what he termed as the concept of ‘social intelligence’ and Gardner’s
(1983) concepts of interpersonal (the ability to understand other individuals’ emotions and
intentions) and intrapersonal (the ability to know one’s own emotions) intelligence, is
mostly regarded as providing the basis for the conceptualisation of EI.
EI is in a stage of active development as a construct (Ashkanasy, Hårtel, & Daus, 2002).
As a young construct (Cherniss, Extein, Goleman, & Weissberg, 2006) it clearly carries a
distinctive trait of maturing paradigms (i.e. an object for further articulation and
specification under new and more stringent conditions; Kuhn, 1962): the emergence and
differentiation of specific theories. This has been evident since the first formal formulation
of EI theory by Peter Salovey and John Mayer in 1990 (Salovey & Mayer, 1990) to be
followed by the work of Goleman (1995, 1998), Bar-On (1988, 2000), and Palmer and
Stough (2001). After more than a century of research, however, Matthews et al., (2004,
p.180) recently stated that, “…literature suggests there is no clear consensual definition of
EI, and the multitude of qualities covered by the concept appears, at times, overwhelming”.
Conversely, it has been suggested that it is perhaps too early to insist on an agreed upon
definition (Gohm, 2004), differing definitions tend to be complementary rather than
contradictory (Ciarrochi et al., 2000) which could be beneficial for the field (Gohm, 2004),
and similar trends with other psychological constructs, e.g. intelligence have been observed
(Matthews et al., 2004). Most often the existence of varying conceptualisations (or theories)
of a construct, by which research in EI is distinctly characterised, might be perplexing and
11
viewed as a lack of clarity regarding the exact nature of the construct. However, the
scientific research endeavour is directed to the articulation of those phenomena and theories
that the paradigm supplies (Khun, 1962). Hence, the natural evolutionary process which
embodies the ongoing development of constructs is considered to encompass the differing
definitions thereof and changes in the way social scientists view them. This process
comprises manifestations of the self-correcting nature of science in which the researcher
becomes actively involved in order to contribute to the maturation of the paradigm that is
being studied. Such articulation is seen in the current debates in the EI domain that reflect
vigorous efforts of researchers to clarify, explain and demonstrate the full notion, purpose
and nature of EI.
Based on the different theoretical and operational developments, EI can typically be
organised into one of two complementary types: ability models or trait models (Petrides &
Furnham, 2001). Trait models (e.g. Bar-On’s model, 1997) describe EI as a constellation of
emotion-related self-perceptions and dispositions. Ability models (e.g. Salovey & Mayer,
1990; Mayer & Salovey, 1997) view EI as a set of cognitive-emotional abilities.
The two types of models (or conceptual frameworks) are best reflected by the two
paramount approaches to the assessment of EI: performance based versus self-report
measures. The Mayer-Salovey-Caruso Emotional Intelligence Test (MSCEIT V.2, Mayer,
Salovey, & Caruso, 2002), preceded by the MSCEIT Research Version 1.1 (Mayer, Caruso,
& Salovey, 2000) and the Multi-Factor Emotional Intelligence Scale (MEIS, Mayer,
Caruso, & Salovey, 1999) is the only set of performance based measures available. Mayer
et al. (2004) hold that a growing body of research supports its validity. However,
inconsistency in factor analytic research is apparent. For example, Gignac (2005) and
Roberts, Schulze, O’Brien, MacCann, Reid, and Maul (2006) report varying support for the
three plausible models (one, two and four factors) suggested by Mayer et al., (2003). In
addition, some question the use of consensual scoring to measure cognitive ability (Brody,
2004; Roberts et al., 2001). The reliability of the current version (MSCEIT V.2) and its
predecessor, the MEIS, has also been under scrutiny (e.g. Ciarrochi et al., 2000; Matthews
et al., 2002; Roberts et al., 2001).

12
Trait models employ self-report or observer ratings to assess EI. This dissertation aims to
investigate various aspects of the transportability and cross-cultural applicability of a self-
report measure of EI (i.e. the SUEIT; Palmer & Stough, 2001). Hence a review on the six
most popular self-report EI inventories follows. The factorial validity (i.e. evidence of
agreement and confirmatory analyses of conceptual measurement models of EI) is a key
area of evidence that is needed before claims regarding the utility of the assessment and
development of the EI construct can be substantiated (Keele & Bell, 2008). Available
empirical research regarding the factorial validity of these well-known self-report EI
inventories will be discussed. Often these measures are translated and used in other cultural
groups. Consequently, a comprehensive overview of the current extent of the practice of
cross-cultural EI research and assessment, related to a selection of well known self-report
inventories1, is included.
2.2.3 Self-report EI inventories: a review of cross-cultural applications
Twenty-item Toronto Alexithymia Scale-III (TAS-20)
A well-known conceptually related (inverse) construct to EI is Alexithymia (Parker, Taylor,
& Bagby, 2001; Schutte et al., 1998) which literally means, “without words for emotions”
(Bagby, Parker, & Taylor, 1994; Bagby, Taylor, & Parker, 1994). The Twenty-item
Toronto Alexithymia Scale-III (TAS-20) is a 20-item self report scale that measures three
dimensions, (a) difficulty identifying feelings, DIF (e.g. “When I am upset, I don’t know if
I am sad, frightened or angry”), (b) difficulty describing feelings, DDF (e.g. “I find it hard
to describe how I feel to other people”) (c) externally orientated thinking, EOT (e.g. “I
prefer talking to people about their daily activities rather than their feelings”) (Parker et al.,
2003). The three factor structure, which corresponds to the theoretical construct of
alexithymia, has been replicated in various samples (Bagby et al, 1994; Parker, Bagby,
Taylor, Endler, Schmitz, 1993; Loas, Corcos, Stephan, Pellet, Bizouard, Venisse, Perez-
Diaz, Guelfi, Flament & Jeammet, 2001; Parker et al., 2003). Others provide evidence for a
two factor structure (Erni, Lötscher, & Modestin, 1997) although the application of
1 This review included the six most prominent EI inventories in order to assess the general current stance of
cross-cultural EI research in a wider variety of self-report inventories. At the time of the review, no cross-
cultural research on the SUEIT existed.

13
principle components analysis to explore multiple solutions in these studies, have been
criticised (Parker et al., 2003).
The TAS-20 is a widely used measure. Translations into 18 different languages, with
evidence of cross-language equivalence with the original English version, as well as CFA
data from 19 different countries exist (Taylor, Bagby, & Parker, 2003). Hence, Taylor et
al., (2003) conducted a review on the reliability and factorial validity of the instrument in
the available languages and cultures. The authors propose that, “the replication of the three
factor model in other cultures and languages would provide support for regarding
alexithymia as a universal trait” (Taylor et al., 2003, p.278) as some have argued in favour
of the culture bound nature of alexithymia (Loiselle & Cossette 2001; Prince, 1987)
reflecting the Western health care professional’s emphasis on introspection and
psychological mindedness. The review provides partially incomplete fit indices (i.e. χ2/df
ratio, GFI, AGFI, RMSR, RMSEA, & TLI) for single-group CFA results obtained for 17
different language translations of the instrument. The results for the Turkish and Chinese
studies were omitted from the review. The authors state that, “no meaningful factor
structures emerged” (Taylor et al, 2003, p. 278) as well as that, “insufficient information
pertaining to adequacy of translations, samples and data collection methods hampered
inclusion of this data into the review”.
The practice of fitting single group CFA measurement models of a translated version of a
scale (e.g. French version of TAS-20) is used to evaluate whether the scale measures the
construct (alexithymia) at a structural equivalence level in relation to the country (and
culture) where the original version of the scale was developed (e.g. Canada) (Taylor et al.,
2003). According to Diamantopoulos and Siguaw (2000) this practice is a ‘validity
extension’ procedure, a special case of model cross-validation where a single model is
fitted to a validation sample drawn from a different population than the original population.
This “loose replication strategy” (Bentler, 1980) is functional in that it provides, “…a
mechanism for evaluating and replicating solutions in terms of parameters estimates and
goodness of fit…” but has been criticised as not being a true cross-validation, “…since the
analysis of the validation sample (e.g. TAS-20 French or Greek samples, Taylor et al.,

14
2003) in no way depends on results from the analysis of the calibration sample” (i.e.
original English sample, Bagby et al., 1994; Bagby et al., 1994) (MacCallum, Roznowski,
Mar, & Reith, 1994, p.13). In addition, Diamantopoulos and Siguaw (2000) argue that often
no distinction is made between “validity extension” and “validity generalisation” (the latter
refers to the process of identifying the model from a set of competing alternatives that
replicated best across different populations). They underscore the importance of this
distinction by pointing out that, “…a model can replicate well in a different population but
another model may replicate even better, in such a case, the latter model would be
considered superior than the first in terms of validity generalisation potential”
(Diamantopoulos & Siguaw, 2000, p.140). For example, in a recent CFA study of the TAS-
20 (Gignac, Palmer, & Stough, 2007) the authors report evidence for five substantive
factors – DIF, DDF, two EOT factors, a “global” alexithymia factor, as well as a negatively
keyed item method factor.
This could have two implications for further cross-cultural research which informs on the
potential transportability of the instrument to different cultures. Firstly, one could argue that
only when competing factor structures (e.g. five factor, Gignac et al, 2007; or two factor,
e.g. Erni et al, 2007) have been subjected to validity generalisation procedures (in
conjunction with the three factor model), could more confident claims of “universality” of
the three factor structure of the alexythemia construct be warranted. For example, the
absence of evidence in support of the three factor structure of alexithymia in the Turkish
and Chinese samples might be due to the fact that the construct does not translate to these
cultural contexts. This may point to the presence of construct bias2 when the TAS-20 is
transported to these cultural groups. Secondly, one could further argue for the application
of “tight” or “moderate” replication strategies by using multi-group CFA (configural,
metric, scalar invariance, Vandenberg & Lance, 2000). These procedures allow models to
be fitted to several samples simultaneously and enable the specification of invariance
constraints (Diamantopoulos & Siguaw, 2000). As Steenkamp and Baumgartner (1998)
2 Construct bias occurs when a psychological construct only applies in a specific cultural context. It can refer
to the absence of evidence for a comparable pattern of relationships with other constructs across cultural
groups. It can also refer to construct under representation by a given instrument in one cultural group
compared to another. That is, large differences in behavioural repertoire are associated with the construct.
Hence, identical indicators cannot be used meaningfully across cultural groups (Fontaine, 2008).

15
points out, cross-national differences in scale means might be due to actual true differences
between countries on the underlying construct or due to systematic biases in the way people
from different countries respond to certain items. Hence, the absence of measurement
invariance (MI) evidence impact on various levels of inferences that can be drawn from
empirical data from various cultures. For example, should the goal of the research be to
explore the basic meaning and structure of a construct cross-nationally, with the aim of
establishing whether the construct can be conceptualised in the same way across countries
(e.g. Taylor review), then the minimum requirement of configural invariance should be met
(Steenkamp & Baumgartner, 1998). In the Taylor et al., (2003, p.282) review the authors
conclude that,
“the finding of equivalent factor structures for the TAS-20 across many different cultural groups
supports that cross-cultural validity of the alexithymia construct, but should not imply that mean scores from
similar samples are comparable….although differences in mean TAS-20 scores might reflect cultural
differences in the meanings given to certain TAS-20 items, the findings also suggest that some ethnic and
cultural groups may be more alexithymic than others….the replication of the three-factor model of the TAS-
20 in highly diverse cultures supports the use of the scale in cross-cultural research. It also casts considerable
doubt on the view that alexithymia is a culture-bound construct, and suggests that alexithymia may be
universal trait that transcends cultural differences.”
Two points of concern should be addressed here. Although the authors rightly point out that
mean scores are not comparable (in an absence of MI evidence, as the case in this study),
conclusions that “some cultural groups might be more alexithymic than others” could be
erroneous as such a conclusion is based on the interpretation of latent mean scores over
groups. For example, in another study Parker, Saklofske, Shaughnessy, Huang, Wood, and
Eastabrook,(2005) report results from a TAS-20 study on two North American aboriginal
adult samples (n=123 and n=102). Single group CFA data is reported and the authors
proceed to calculate significant mean differences (ANOVA) between a large non-aboriginal
(n=1910) and aboriginal sample (n=123). No significant differences between the groups
were found. However, the absence of MI evidence may render the interpretation of this
result ambiguous. The meaning of the latent mean scores may not be comparable over these
two groups, if the lack of equivalence evidence is taken seriously.

16
Secondly, the absence of configural and metric invariance evidence most certainly cast a
doubt on the use of the scale in the context of cross-cultural research. “The cross-cultural
psychology literature suggests that the metric equivalence (invariance) and the relationships
among constructs in a model must be established before any conclusions regarding the
generalisability of a theory can be made cross-culturally” (Darvasula et al., 1993, p. 626).
Perhaps more rigorous cross-cultural research on the alexithymia construct is needed before
such strong assertions about the cross-cultural universality of the trait – and theory
underlying the construct - are justified. To this end, systematic construct, method and item
bias studies should be pursued. A better understanding of the cultural nature of alexithymia
may help elucidate the cultural specificity of the construct as well as its relationship with EI
(and the possible cultural universality / specificity thereof).
Bar-On Emotional Quotient Inventory (EQ-i)
The EQ-i (Bar-On, 1997) is described as a self-report measure of emotionally and socially
competent behavior (Bar-On, 2000). According to Bar-On, Brown, Kirkcaldy and Thomé
(2000, p. 1108), “…the Bar-On model appears to be the most comprehensive and inclusive
conceptualisation of non-cognitive intelligence” probably well evidenced by the fact that
the instrument has been translated into 22 languages with normative data available in more
than 15 countries (Bar-On, 2000) and has been noted by some as one of the most widely
used EI measures (Van Rooy & Viswesvaran, 2004). The EQ-i renders a total EQ score and
five composite scale scores (intrapersonal EQ, interpersonal EQ, stress management EQ,
adaptability EQ and general mood EQ) comprising of fifteen subscale scores. The
instrument has various different versions (e.g. Youth version, EQ-1:YV, Multirater
instrument, EQ-360).
Published versions of the EQ-i are available in Spanish, French (Canadian), Dutch, Danish,
Swedish, Norwegian, Finnish, and Hebrew (Bar-On, 1997). At the time of the publication
of the technical manual of the EQ-i, research versions were available in Arabic, Chinese,
Czech, German, Korean, and Russian. Several others were being developed (e.g. Afrikaans,
Latvian, Estonian, Iranian and Portuguese) (Bar-On, 1997). Despite being widely used in
Western and non-Western cultures, peer-reviewed research validating the factorial structure

17
(structural equivalence) of the EQ-i is lacking. Before 2003 no such studies were published
apart from research by the author himself (Palmer, Monacha, Gignac, & Stough, 2003;
Wong & Law, 2002). A Lebanese adaptation and validation study of the youth four factor
version (Bar-On EQ-i: YV; Bar-On & Parker, 2000), reported a higher order two factor- 8
subscale structure for the original version (Hassan & Sader, 2005) whilst another study
reported an adequate fit of the four factor structure in an aboriginal youth sample in Canada
(Parker et al., 2005).
No cross-cultural or ethnic group differences are reported for the EQ-i in the technical
manual, although the North American normative sample (n=3831) were comprised of 5
different cultural groups (i.e. White, 79%; Asian, 8.1%; Black, 7.1%; Hispanic/Latino, 2.8,
Native American/Aboriginal, 0.7%; Other, 2.3%). A retrospective method bias evaluation
is reported. Relatively low inter-correlations between the 15 subscales and the Positive
Impression (“faking good”) scale (an overall average of 0.19) is interpreted as indicative
that, “the general degree of social desirability response bias for the EQ-i as a whole is
relatively low” (Bar-On, 1997, p.85). Similarly, Dawda and Hart (2000), in a study on the
reliability and validity of the EQ-i, claimed that EI scores were not unduly affected by
response styles or biases. However, some evidence for response style effects is reported for
the normative sample results of the EQ-i: S (Bar-On, 2002). In an investigation of ethnic
differences, a series of 2-way ANOVAs (ethnic group by gender) revealed no main or
interaction effects3 for ethnic group and gender for any of the 5 subscales, or the total EQ
scale. The sample ethnicity included Caucasian/White (n=225, random sample from the
bigger normative sample), Black/African (n=205), Asian (n=220), and Hispanic (n=86)
respondents. However, a main effect was found for ethnic group on the Positive Impression
scale. Black respondents scored significantly higher than their Hispanic or Caucasian
counterparts (Bar-On, 2002), perhaps suggesting the presence of cultural differences in
response styles (i.e. method bias) in the data. Whilst this response style may be a culturally
driven source of method bias, when the test is transported to another culture, another source
of method bias should also be considered. For example, Grubb and McDaniel (2007)
3 It should be noted that no equivalence / invariance evidence was provided, and hence the same limitations as
mentioned earlier, in the interpretation of these findings may apply.

18
propose that EQ-i: S test scores can relatively easily be faked (i.e. in terms of social
desirability). They report that scores can be faked up to 0.83 SDs by respondents (a sample
of USA undergraduate business students) if instructed to do so. This underscores the
importance of method bias investigations (for the EQ-i: S and other EI inventories),
especially within the context of cross-cultural assessment.
Bar-On’s work has been met with some skepticism by EI scholars. For example, concerns
about the potential of the EQ-i to clearly map out individual differences in emotional and
social competencies which is purported to, “aid in the more in-depth psychodiagnostic
assessment process” (Bar-On, 1997, p.152) was raised after the results of the study by
Palmer et al., (2003) failed to replicate the dimensional factor structure of the instrument.
Other authors emphasise that Bar-On’s research have not been published in available peer-
reviewed scientific journals (Hedlund & Sternberg, 2000).
Trait Meta-Mood scale (TMMS)
The TMMS had its origin in research by Salovey, Mayer, Caruso, Goldman, Turvey, and
Palfai (1995). The instrument was developed to measure more stable individual differences
in the qualities of the reflective mood experience. It is based on the early cognitive / ability
model of EI of Mayer and colleagues and was constructed after Mayer and Salovey started
to voice their discontent with the broadening of the EI framework (inclusion of non-
intellective components). The TMMS measures individuals’ perceived ability to manage
and regulate emotions in an effective manner, as opposed to their actual EI level or capacity
(Mayer, Salovey, & Caruso, 2000) and hence is considered a proxy for perceived EI
(Salovey, Stroud, Woolery, & Epel, 2002). The 30-item inventory includes three sub-
scales. The Attention subscale (13 items) indexes perceived ability to attend to moods and
emotions, the Clarity subscale (11 items) which indexes perceived ability to understand and
discriminate between different moods and emotions, and the Mood Repair subscale (6
items) which indexes perceived ability to maintain positive and repair negative moods and
emotions. Spanish, French and Portuguese translations of the scale exist. Two peer-
reviewed articles related to these translated inventories are available (Fernandez-Berrocal et
al., 2004; Queirós et al., 2005). The original three factor structure was replicated through

19
the use of principle components analysis with varimax rotation in the modified Spanish
short version (Fernandez-Berrocal et al., 2004). Up to 2003, the dimensional structure of
the TMMS has only been investigated by the authors of the test (i.e. Salovey et al., 1995).
An Australian study confirmed the original three factor structure of the inventory, although
support for a four factor structure was also found (Palmer, Gignac, Bates, & Stough, 2003).
The means of the Clarity and Repair subscales in the Australian sample (i.e. general
population sample, mean age of 39) differed significantly from the original American
psychology student sample (reported in Salovey et al., 1995). The authors of the Australian
study conclude that, “…this finding highlights potential differences in the way sub-
populations respond to the TMMS and the need to establish sub-population and cross-
cultural norms for the scale” (Palmer et al., 2003, p. 56).
Trait Emotional Intelligence Questionnaire (TEIQue)
Another recently published EI inventory is the TEIQue (Petrides & Furnham, 2003). The
test provides an operationalisation of Petrides’s (2001) model of EI. The model was
developed in the United Kingdom by content analysing prominent models of EI and similar
constructs in the literature. The sampling domain of trait EI (also referred to as trait
emotional self-efficacy; Petrides, Pita, & Kokkinaki, 2007a; Petrides, Pérez-González,
Furnham, 2007b) comprises personality facets that are specifically related to affect. The
153 item inventory assesses a 15 facet, four factor dispositional conceptualisation of EI.
The 15 subscales include adaptability, self-motivation (both not belonging to any particular
factor), self-esteem, trait happiness, trait optimism (all well-being factor), emotion
regulation, stress management, impulsiveness (low), (all self-control factor), emotion
perception, emotion expression assertiveness, relationship skills, empathy, (all emotionality
factor), social competence, emotion management (others), assertiveness (all sociability
factor) (Mikolajczak, Luminet, Leroy, & Roy, 2007). The inventory was developed to,
“…cover the sampling domain of the construct comprehensively” (Petrides & Furnham,
2003). Conceptually, it would seem that this model maps closely on the Bar-On EQ-i (Bar-
On, 1997), as the content of at least 10 of the 15 TEIQue subscales can be related to various
Bar-On subscales. Petrides et al., (2007) argue that the Bar-On model (Bar-On, 1997) that
underpins the EQ-i is “conceptually flawed” as some salient aspects of the trait EI domain

20
are omitted and hence include an “emotion mastery” scale in their studies with the EQ-i.
The measure boasts more recent rigorous peer-reviewed empirical evidence of criterion and
incremental validity for the trait EI conceptualisation (Petrides et al. 2007a, Petrides et al.,
2007b) than the Bar-On EQ-i. A cross-cultural arm of the TEIQue research programme is
briefly mentioned by Petrides et al., (2007). Three peer-reviewed publications that report
results based on French (Mikolajczak, Luminet, Leroy, & Roy 2007), Greek (Petrides et al.,
2007b) and Spanish (Petrides et al., 2007a) translations of the inventory, exists. For the
Spanish adaptation, experts rated the 15 subscales’ content validity (relevance of subscales
to construct), as well as the “clarity and comprehensibility” of the items to ensure full
linguistic equivalence of the English and Spanish versions (Petrides et al., 2007a). In this
study, unfortunately, the factorial validity of the Spanish version is not reported, as the
analyses to determine the predictive incremental validity of trait EI over basic mood
dimensions in a clinical context, utilised only the trait EI global score (Petrides et al.,
2007a). The original British four factor structure (Petrides, 2001) was replicated in a
French-speaking Belgium sample (n=740) with a principle axis factor analysis. No CFA
results are reported, but other established recognised procedures to test the congruence of
factor structures at three levels (between Belgian and British data sets) were conducted. The
results supported the factorial invariance over the two samples and suggest “…a high level
of compatibility between the United Kingdom scoring key and Belgium factor solutions”
(Mikolajczak et al., 2007). Petrides et al., (2007b) also report evidence for the discriminant
validity of trait EI, as measured by the TEIQue, from the Giant Three and Big Five
personality dimensions in a Greek sample. In the two joint Principle Axes Factor analyses
reported, it should be noted that the oblique trait EI factor was defined by only 11 (with
Eysenck Personality Questionnaire, EPQ) and 8 (with the Traits Personality Questionnaire)
of the original 15 TEIQue scales. The results are noted as a replication of results from
British and New Zealand samples (Petrides et al., 2007b), although the latter appears to not
be published. In their study, Mikolajczak et al., (2007, p. 350) conclude that,
“…a very similar structure of affect-related personality traits can be found in French and English (as
well as in Spanish, New Zealand, and Greek; see previous text). Although there may be cultural differences
between these countries with respect to the way a trait is expressed, such cultural differences do not seem to
affect the structure of traits in the individual…it is the first EI test / questionnaire to show stability across
studies and languages”

21
Two remarks are warranted here. A consolidated publication of the factorial invariance of
the various datasets utilised in the above mentioned studies, may strengthen the
generalisability of this trait EI theory over the various language groups, substantially.
Secondly, the use of CFA invariance procedures, mentioned previously, may add very
useful additional evidence, to validate the cross-cultural validity of the theory.
Schutte Self-Report Inventory (SSRI)
The SSRI is a 33 item self-report EI inventory (Schutte, Malouff, Hall, Haggerty, Cooper,
Golden, & Dornheim, 1998). This “leading brief EI scale” (Chapman & Hayslip, 2005, p.
155) was developed by utilising the original Salovey and Mayer (1990) model and has been
used in a number of studies (e.g. Petrides & Furnham, 2000; Ciarrochi et al., 2001).
Criticism is mostly directed at the uni- versus multi-dimensionality factor structure debate,
and unbalanced use of negatively worded items in the scale (Petrides & Furnham, 2000;
Saklofske, Austin, & Minski, 2003). The latter has been addressed in a study by Austin,
Saklofske, Huang and McKenney (2004, p.556) as it could, “…potentially lead to a
confounding of EI score with acquiescent responding” which is an important issue in cross-
cultural assessment. Acquiescence, a type of differential response style, is a known source
of bias in cross-cultural assessment (Sekeran, 1983; Hofstede, 1980, 2001). The results
indicated that the modified 41-item scale (20 forward-keyed and 21 reverse-keyed items)
obtained internal reliability (overall EI) similar to that reported for the 33-item version
(with only three reverse-keyed items). The authors conclude that there are no strong
advantages of using the modified version, rather than the original general scale (Austin et
al., 2004). The findings of this study, however, add another caveat to the rather extensive
ongoing debate regarding the factor structure of the inventory. Originally Schutte et al.
(1998) proposed the SSRI to be a unidimensional EI measure. A Principle Component
Analysis on the original pool of 62 items extracted four components which they rotated
orthogonally (n=346, combined student and general population sample). Only items with
loadings greater than 0.40 on the first component were retained. This 33 item version was
published in the public domain (Schutte et al., 1998). The one-factor solution contained
scale items that represented three categories: appraisal and expression of emotion in the self
and others, regulation of emotion in the self and others and utilisation of emotions in

22
solving problems (Shutte et al., 1998). Petrides and Furnham (2000) investigated the
Schutte et al., (1998) uni-dimensionality inference (n=260, university student sample).
They could not replicate the one factor solution through CFA and presented evidence for a
four-factor structure (maximum likelihood, orthogonally rotated) which has been replicated
by Saklofske et al., (2003) and has been used in other studies (Ciarrochi et al., 2001;
Ciarrochi, Dean, & Anderson, 2002). However, the more recent Austin et al. (2004) study
report a three factor structure for both the original and modified version of the scale (PCA
with Oblimin rotation, n=500, student sample). The three factors labeled (Optimism/Mood
Regulation, Utilisation of Emotions and Appraisal of Emotions) corresponded with the
Petrides and Furnham (2000) and Saklofske et al., (2003) four factor results, although the
Social Skills factor did not emerge in this study. Recently, Gignac, Palmer, Manocha, and
Stough (2005) theoretically proposed that due to the fact that the SSRI was originally
developed based on the Mayer and Salovey (1990) model, a six factor structure (see Gignac
et al., 2005 for discussion) is a more, “plausible model of the dimensions within the
inventory in comparison to the four-factor model” (Gignac et al., 2005, p.1032). A first-
order acquiescence factor was also modeled, and five of the original items were not
included in the analysis as they could not be classified into any of the six hypothesised
dimensions. The results of the nested CFA modeling procedure did not provide support for
the six factor model (independent Emotional Expression and Emotional Regulation of
Others factor loadings were not significant). These two factors were then removed. The
modified first order, four factor and acquiescence model was practically significantly better
fitting than the Saklofske et al., (2003) four-factor model (Gignac et al., 2005).
Recently, a study of the psychometric properties of a Farsi language (Iran) translated
version of the 41-item SSRI scale (FEIS, Besharat, 2007) reported a slightly higher overall
EI reliability coefficient (α=0.89) than was obtained in the Austin et al. (2004) study
(α=0.85). In addition, a similar three factor structure to the Austin et al. (2004) results, is
reported (Principle Components Factor analysis, oblique rotation, n=442, student sample).
Negative correlations between the FEIS-41 and TAS-20 total scores (r = -0.57, p < 0.001)
as well as TAS-20 and FEIS factor scores, provided additional support for the relationship
between these constructs reported elsewhere (e.g. Parker et al., 2001, Schutte et al., 1998).

23
Moreover, significant positive and negative correlations between the FEIS total score and
Psychological Well-being (r = 0.79) and Psychological Distress (r = -0.37), respectively,
were reported. This was interpreted as support for the convergent validity of the FEIS and
EI in general.
Other translations of the original SSRI scale (Schutte et al., 1998) include a Greek modified
24 item version (Dimitriades, 2007) which measures a unidimensional EI construct (n=330,
general workplace sample). Carmeli and Josman (2006) utilised the SSRI scale to examine
the relationship between EI, task performance and organisational citizenship behaviours
(n=165, general workplace sample) in an Israeli sample. The English scale was translated
into Hebrew with a process of back translation (Carmeli, personal communication, 2008)
although this was not formally documented in the publication of the study. The total scale
reliability was acceptable (α=0.83). Zeidner, Shani-Zinovich, Matthews and Roberts (2005)
have also used a Hebrew version of the SSRI in a study of gifted versus non-gifted high
school students in Israel. They report satisfactory full score reliability (α=0.88 for gifted
and α=0.83 for non-gifted adolescents). No investigation to verify the factor structure of the
instrument in these two studies was reported. Lastly, Chan (2004) used the SSRI in a study
among Chinese school teachers. The scale was not translated into Chinese. A four-factor
structure (Exploratory Factor Analyses, Varimax rotation, n=158) is reported. The factors
include: empathetic sensitivity, positive self-regulation of emotions, positive utilisation of
emotions, and emotional awareness and appraisal. Conceptually they do not directly map
unto the Saklofske et al. (2003) results.
These studies suggest that the SSRI is being used in Western and non-Western cultural
settings. This is probably due to its availability in the public domain, as well as its
conceptual congruence with the Mayer and Salovey (1990) model. Although Petrides and
Furnham (2000) urged researchers to factor analyse the scale before using it, Chapman and
Hayslip (2005) note that some researchers have refrained from doing so, “in the interest of
retaining some coherence in the EI literature” (p. 156). For now, it would seem that the
factorial validity of this scale might stay a point of contention. The absence of consistent

24
structural equivalence evidence (in mainly Western samples) reviewed here, cast doubt on
whether this condition would be plausible in non-Western settings.
In addition, Van Rooy, Viswesvaran, and Alonso (2004) suggest that the SSRI is
susceptible to social desirability response sets (i.e. easily fakable). They found that the
measure was similar in fakability to a personality measure also used in their study. This,
together with the Gignac et al., (2005) results (evidence for first-order acquiescence factor),
may suggest that method bias could influence the transportability of the instrument, more
often than expected. Such effects may be amplified within the context of cross-cultural
assessment (as culture could drive response sets). Researchers and practitioners should be
cognisant of such effects and associated implications.
Wong and Law Emotional Intelligence Scale (WLEIS)
The WLEIS was developed in Hong Kong by Wong and Law (2002). The EI content
domain was surveyed by asking undergraduate students (n=120) to generate items for the
four Mayer and Salovey (1997) EI dimensions (self emotional appraisal, other’s emotional
appraisal, regulation of emotion, and use of emotion) that would describe a person with
high EI. The results were a 36-item preliminary measure (9 per dimension). Results from an
EFA (ML with Varimax rotation, n=189) revealed eight factors. However, “…the first four
factors with the largest eigenvalues basically represented the four hypothesised EI
dimensions” (Wong & Law, 2002, p.253) and hence the four factor structure (with only the
strongest loaded items, i.e. a 16-item version of the test) was subjected to another EFA, as
well as a cross-validation on another two student samples (sample 1, n=72; sample 2,
n=146). The indices provide relatively good evidence for the validity extension of the
measure in the two samples (sample 1: SRMR=0.08, CFI = 0.95, TL=0.93; sample 2:
SRMR=0.07, CFI=0.91, TLI=0.89). Evidence for convergent validity with the TMMS and
a brief EQ-i (20 randomly selected items) was also presented. A recent replication study by
Wang (2007) in the Beijing and Shandong provinces in mainland China on the WLEIS
(n=1458, university students) found support for the four factor structure (RMSEA=0.045,
GFI=0.97, AGFI=0.96, CFI=0.97) of the scale. The author mentions that the cross-cultural
validity of the scale should be verified with future studies (Wang, 2007).

25
Closing remarks
From this section it is clear that little congruence exist in the statistical techniques used to
investigate the factorial validity (structural equivalence) of the different self-report EI
inventories over various cultural groups / nationalities. In addition, measurement practices
are not always uniformly applied (e.g. translating scales into mother tongue before applying
in another culture). An absence of bias and equivalence evidence, when cross-group
comparisons (e.g. over different cultural groups) are conducted, exist. Method bias and its
effects on scores seem to rarely be accounted for in research studies.
A large amount of work on measurement development and the refinement of EI exist (Daus
& Ashkanasky, 2003). However, it is somewhat disconcerting that 18 years after the
construct has been coined, Keele and Bell (2008, p. 498) still point towards the fact that,
“little progress can be made with regards to predicting real life criteria unless the tools of
measurement (referring to EI measures) actually measure the scales and factors they
propose to measure”. To move forward, it is proposed that CFA procedures are used in a
validity extension and generalisation context (Diamantopoulos & Siguaw, 2000). Single
and multi-group CFA evidence for different factor structures of self-report EI measures
(e.g. three and four factor structures of the SSRI, different factor structures of the EQ-i: S
and SUEIT) should be routinely reported. This will aid in establishing which structure (and
theory of EI) has the best validity generalisation potential. It may also inform on the
universality versus cultural specificity of the construct and the transportability potential of
measures from a Western to non-Western cultural context. In addition, researchers should
be cognisant of method artifacts that may distort the meaning of quantitative differences in
scores of EI measures across different groups (e.g. cultural groups). Such effects can be
modeled within a CFA framework. Disentangling cultural bias from true construct variance
in self-report EI measures may assist in a greater understanding of the nature and utility of
the construct.
2.2.4 Moving forward with EI
Gohm (2004) in her commentary on the target article of Matthews et al., (2004) in
Psychological Inquiry (Seven myths about emotional intelligence), note cross-cultural

26
work, especially in non-Western countries, as an obvious area for further investigation to
expand current understanding of EI. Zeidner et al., (2004) admonish that it might be, “…too
early to dismiss the possibility of the existence of multiple EIs underlying emotions and
their manifestations embedded within specific cultural contexts.” Zeidner et al., (2001) note
that the work of, for example, Scherer and Wallbott (1994) show that emotions have similar
personal meanings and lead to similar response tendencies in all cultures. From this they
concluded that, “…it is unclear whether there are similar universals of EI, in that much of
what constitutes appropriate behaviour during interpersonal reaction is culturally
determined” (Zeidner et al., 2001, p. 22).
The issue of the culture fairness of expert judgments in the ability based EI measures
should perhaps be under scrutiny. For example, Mayer, Salovey, Caruso and Sitarenios
(2001) report an r=0.98 between MSCEIT consensus and expert scores. However, if the
‘experts’ in this study constituted a sample of predominant white Western men, perhaps
their views, first and foremost, is a primary reflection of cultural consensus, rather than
their specific expertise (Zeidner et al., 2004)? Zeidner et al., (2001) have proposed that the
MEIS and MSCEIT assess a kind of ‘cultural conformity’, i.e. holding beliefs about
emotion that are congruent with cultural norms. Interestingly, Roberts et al., (2001) report
no differences between ethnic groups when consensual scoring was employed (MEIS,
Mayer, Caruso & Salovey, 2000), but when expert scoring was used, White Americans
outperformed minority American groups on many of the subscales. Greenfield (1997)
argues that ability tests (like the MSCEIT for EI or Intelligence tests) presuppose a
particular cultural framework (perhaps more so than competency, trait based tests). Within
the cultural psychology perspective, that she advocates, culture implies agreement in social
convention. This requirement of universal foundational conventions must be understood
and shared by participants (when tests are exported to different cultures). For example, the
transportability of cross-cultural tests hinges on universality in values and meaning of
particular responses to particular questions. If this requirement is not met, cross-cultural
validity is compromised (Greenfield, 1997). Hence, it may be plausible to argue that
investigations with established self-report measures of EI (those included in this study and
the review) hold a greater potential than ability based measures (e.g. MSCEIT) to assist us

27
in uncovering the cultural nature of the construct (given the challenges related to cross-
cultural assessment with ability based measures in general and the MSCEIT scoring
problems mentioned above). In addition, measurement accuracy (reliability, a necessary
condition before validity is investigated) is perhaps better established for self-report
measures of EI (see review) than for ability-based measures. Hence, cross-cultural studies
with self-report EI inventories should be pursued to advance cultural specific knowledge on
the construct. This was the aim of this study. Therefore, the following section will discuss
cross-cultural psychology and assessment as the theoretical framework for this research.
2.3 Cross-cultural psychology and assessment
2.3.1 General introduction
Cross-cultural psychology is a relatively young discipline (Jahoda & Krewer, 1997). It was
institutionalised in the 1960’s, however, by the mid nineties concerns were still being raised
about mainstream psychology being ‘culture blind’ (Lonner & Adamopoulos, 1997),
ignoring culture as a source of influence on human behaviour (Segall, Lonner, & Berry,
1998). In reviewing the literature related to the history of cross-cultural psychology, it is
clear that over several decades many conceptual and semantic ambiguities related to studies
of culture and individual differences have been noted (e.g. Jahoda & Krewer, 1997; Bolski,
1996; Berry et al., 2002) perhaps resulting in misunderstandings about the discipline and
reflecting in a reluctance in the adoption thereof (Segall et al., 1998). Stemming from the
fact that the discipline of cross-cultural psychology was initially birthed within psychology
with the main emphasis on its comparative / methodological nature (see Berry, 1980) an
appraisal of the shortcomings of this approach and hence implications for the name (Segall
et al., 1998), content and purpose thereof (Boski, 1996) was to be vigorously discussed in
years to come (e.g. Lonner, 1992; Poortinga & Van de Vijver, 1994). These debates
resulted in the introduction of the term ‘cultural psychology’ as a result of the critical
assessment of the discipline being named “cross-cultural psychology” (Greenfield, 1997;
Jahoda & Krewer, 1997). Cultural psychology and cross-cultural psychology has been
described by some as two overlapping and fuzzy perspectives (Greenfield, 1997). However,
most would agree that they differ mainly on the conceptions of culture-behaviour
relationships and the methods of inquiry they utilise (Lonner & Adamopoulos, 1997;
28
Poortinga, 1997). A brief description of the distinction between the two terms is presented
next. This is needed as the theoretical framework, and associated assumptions within which
the current research is being conducted, should be clarified.
Studies that employ a cultural-psychological approach examine a particular psychological
construct (e.g. personality) in a specific cultural context (Greenfield, 1997; Poortinga,
1997; Van de Vijver & Leung, 2001), whilst emphasising the constructive characteristic of
culture (Segall et al., 1998). Reiterating this view, Berry (1994, p. 120) state that, “the
hallmark of cultural psychology is the attempt to understand individual psychological
functioning in the cultural context in which it developed.” Hence, the essence of this
approach is focused on the identification of culture specific aspects (Greenfield, 1997;
Segall et al., 1998; Van de Vijver & Leung, 2001) in psychological theories, often using
unstructured or semi-structured means of data collection (Van de Vijver & Leung, 2001) of
which the replicability of findings are generally scrutinised and questioned (Poortinga,
1997).
According to Berry et al. (2002, p.3), “cross-cultural psychology is the study: of similarities
and differences in individual psychological functioning in various cultural and
ethnocultural groups; of the relationships between psychological variables and socio-
cultural, ecological and biological variables; and of ongoing changes in these variables.” In
essence, studies in cross-cultural psychology strive to uncover universality in the cultural
diversity of human behaviour (Greenfield, 1997; Lonner & Adamopoulos, 1997) by
assuming a ‘culture-general’ approach – deliberating attempting to accommodate theories
and findings pertaining to two or more cultures (Van de Vijver & Leung, 2001). Hence, the
methodological ideal in cross-cultural psychology is to transport a procedure established in
one culture, with known psychometric properties, to one or more cultures with the goal of
making a cross-cultural comparison (Berry et al., 2002). Embedded in this culture
comparative approach (Greenfield, 1997; Poortinga, 1997) is the tendency to often treat
culture as a set of independent or contextual variables (e.g. sociocultural variables)
affecting various aspects of individual behaviour (e.g. attitudes, observed behaviours)
(Greenfield, 1997; Lonner & Adamopoulos, 1997; Poortinga, 1997). The work of the cross-

29
cultural researcher is to seek evidence of such effects (Segall et al., 1998). The
methodology of the natural sciences is mirrored in these comparative studies, with the
preference for using standard instruments and a priori formulated hypotheses which is
being tested in an experimental or quasi-experimental fashion (Poortinga, 1997). However,
failure to execute a study without paying attention to the unique methodological (e.g.
ensuring that comparisons are based on equivalent data), conceptual (e.g. the rationale for
selection of cultures for the purpose of testing the limits of some theory) and logistical
challenges can leave the results seriously, even fatally flawed (Lonner & Adamopoulos,
1997).
Nonetheless, after a seemingly slow adoption of the discipline it would seem that
researchers are increasingly realising the need for, and utility of conducting cross-cultural
research. Currently the discipline is thriving, evidenced in a consistent increase of
publications dealing with cross-cultural issues (Van de Vijver, 2002). The main goals of
cross-cultural psychology entail (a) testing the generalisability of psychological theory by
‘transporting and testing’ it in other cultures, (b) interpreting failures to generalise theory in
terms of uncovering variations in behaviour, and (c) integrating the findings of both a and b
to develop and extend a more universal psychology (Berry et al, 2002). Poortinga (1997, p.
351) provides an insightful view on universality,
“…the comparative approach is rooted in the idea of universality of psychic functioning. More precise
similarity in human psychological functioning is presumed when universality is defined at the level of
explanatory concepts as they are found in psychological theories on cognition, personality, or social
interaction. The assumption is that any theoretically meaningful personality trait, cognitive ability, emotion,
or value dimension should have universal validity. A major part of cross-cultural studies is looking for such
evidence.”
Among the listed advantages of this approach, particularly applicable to this study, is the
reduction of ethnocentrism (Berry et al., 2002; Lonner & Adamopoulos, 1997), best
described as the sense of in-group preference and favoritism, displayed in a exaggerated
tendency to think the characteristics of one’s group or race superior to those of other groups
of races (Hofstede, 2001; Munroe & Munroe, 1997). Hence cross-cultural psychology
attempts to reduce the ethnocentrism of psychology by recognising the limitations of

30
current knowledge and seeking to extend the data and theory through inclusion of other
cultures (Berry et al., 2002). However, others have argued that ethnocentrism is inherent to
the very act of engaging in cross-cultural research (Hofstede, 2001), as it is present in the
data collection instruments, choice of research topics and formulation of theories (Berry et
al., 2002) all which draw on the researcher’s notions and ideas of behaviour, influenced by
its cultural antecedents. Linked to the idea of reducing ethnocentrism, is the second benefit
of cross-cultural research: that of using the accumulated research results in culture training
programs (Lonner & Adamopoulos, 1997). The utility of EI and its applications in the
workplace would best be maximised if results of cross-cultural EI studies are utilised to
provide ‘culturally tuned’ EI development interventions in the workplace. For example,
cross-cultural research results may help human resource professionals and organisational
development consultants to better interpret and understand the cultural framework of work
behaviors and develop more appropriate interventions to enhance organisational
functioning.
This research is conducted within the cross-cultural psychology framework. It addresses
various aspects of the generalisability of the EI construct and related methodological issues
(i.e. bias and equivalence) inherent to cross-cultural EI assessment. Cross-cultural
assessment is the domain that addresses all issues related to the application of
psychological instruments (and its characteristics like reliability, validity and equivalence)
involving at least two different cultural groups (e.g. the assessment of migrant groups in a
single country or the assessment of individuals from at least two countries; Van de Vijver,
2002). Test transportability is a prevalent issue in cross cultural assessment. Culture may
influence the transportability of instruments on various levels.
2.3.2 Culture
A central question of this investigation is whether culture, as defined and measured by the
Hofstede cultural dimensions (1980, 1983, 2001), systematically influence the cross-
cultural comparability (i.e. transportability) of psychological assessment instruments?
Hence, a brief overview of Hofstede’s work follows.

31
Hofstede (2001) defines culture as,
“…the collective programming of the mind that distinguishes the members of one group of category
of people from another (p.9)….the interactive aggregate of common characteristics that influence a human
group’s response to its environment. Culture determines the uniqueness of a human group in the same way
personality determines the uniqueness of an individual…” (p.10).
His work originated in the late nineteen sixties when data was collected (1968 and 1972) in
various subsidiaries (from 72 countries) of one large multinational business organisation,
IBM, producing over 116 000 questionnaires (Hofstede, 2001). Hofstede argues that
individuals carry ‘mental programs’ that contain a component of national culture, expressed
in values predominate among people from different countries. National cultures refer to
profound beliefs, values and practices that are shared by the vast majority of people
belonging to a certain nation (Van Oudenhoven, 2001). He introduced the concept of
‘dimensions of culture’, aspects of national culture that can be measured relative to other
national cultures (Hofstede, 1991). Initially, four independent dimensions of national
culture differences, each rooted in a basic problem with which societies have to cope, but
on which their answers vary, were identified (Hofstede, 1980). The dimensions include:
Power Distance, uncertainty avoidance, Individualism – Collectivism, Masculinity –
femininity (Hofstede, 1980, 1991, 2001). A fifth dimension, long term orientation, was
later identified through research conducted by Bond (Hofstede & Bond, 1988) with the
Chinese Values Survey (CVS) among students in 23 countries. The dimensions, on the
basis of which national culture can be characterised, are briefly described next (Hofstede
1991, 2001).
Power distance relates to the basic problem of human equality. It prescribes how societies
deal with inequality between people. High Power Distance societies hold a general belief
that there should be a well defined order in which everyone has a rightful place. Low Power
Distance is associated with the prevalent belief that all people should have equal rights and
the opportunity to change their position in society. In the workplace with a large Power
Distance situation, power is centralised as much as possible and superiors and subordinates
consider each other as existentially unequal. Salary systems show wide gaps and a high
32
prevalence of supervisory personnel, structured into tall hierarchies of reporting
relationships, is evident. Small Power Distance favours decentralisation.
Uncertainty avoidance refers to the degree to which people in a country prefer structured
over unstructured situations. It ranges from relatively flexible to extremely rigid.
Uncertainty is a subjective experience, a feeling. Such feelings are expressed through
nervous stress and in a need for predictability: a need for written and unwritten rules.
According to Hofstede (1991, p. 110), “extreme uncertainty creates intolerable anxiety”.
Feelings of uncertainty are acquired and learned and ways of coping with them belong to
the cultural heritage of societies. Cultures high in uncertainty avoidance deliberately avoid
ambiguous situations by looking for structure in their organisations, institutions and
relationships which translates into clearly interpretable and predictable events. High
uncertainty avoidance favours strict rules and principles of deviant behavior.
Individualism versus Collectivism is related to the integration of individuals into primary
groups. It refers to the degree to which individual decision–making and action are accepted
and encouraged by society. In individualistic societies ties between individuals are
generally loose. Collectivist societies are characterised by people being integrated into
strong, cohesive in-groups. These in-groups protect them in exchange for unquestioning
loyalty. Collectivism favours group rewards and family enterprises, while Individualism
favours easy job hopping and individual rewards (Hofstede, 1984). The United States
scored highest in Individualism, whilst West Africa, Latino and Asian countries are at the
lower end of the scale (Hofstede, 1980).
Masculinity versus femininity. Masculinity refers to the degree to which traditional male
values (i.e. assertiveness, performance, ambition, achievement and material possessions)
prevail over female values (such as quality of life, nurturing, and warm personal
relationships). “Masculinity favours competition and survival of the fittest, while
femininity favours solidarity and sympathy of the weak” (Hofstede, 1984, p.14).

33
Data from six countries were included in this research (i.e. Australia, New Zealand, United
States of America, Italy, South Africa and Sri Lanka). Table 1 lists the original cultural
dimension scores obtained in the Hofstede study (1980, 2001) for five of the six countries.
Sri Lanka was not originally included in the Hofstede study. Recently, the results of the
Global Leadership and Organisational Behaviour Effectiveness Research Program
(GLOBE) were published (House, Hanges, Javidan, Dorfman & Gupta, 2004). This study
measured 62 societies on nine core cultural dimensions (attributes of culture). The first six
dimensions (Uncertainty Avoidance, Power Distance, Institutional Collectivism, In-Group
Collectivism, Gender Egalitarianism, and Assertiveness) had their origin in the original
four Hofstede (1980) dimensions (House et al., 2004). The 62 societies were clustered
based on religious, linguistic and economic similarities between them (Gupta & Hanges,
2004). Table 2 provides an overview of the societal cluster classification results.
Unfortunately, Sri Lanka was also not included in this study. For the purposes of this study,
it is argued that Sri Lanka falls geographically within the Southern Asian cluster (see table
2). Hence, Hofstede index scores of the other countries within the Southern Asian cluster
(Malaysia, India, Philippines, and Indonesia) are listed and were used to calculate Sri
Lanka’s stance on the cultural dimensions4.
The original Hofstede South African index scores described South African national culture
as an Anglo, individualistic and masculine culture (Hofstede, 1980). However, Hofstede’s
study (1980) was conducted during the apartheid era. The Job Reservation Act precluded
Blacks, Asians and Coloureds from employment in the IBM corporation, at the time of the
survey. In addition, the White Afrikaner population was excluded from the study to avoid
translating the questionnaire. Hence, the original Hofstede findings reflected the narrow
White South African English speaking population’s culture (Sithole, 2001). Sithole (2001)
conducted a study to investigate an all inclusive South African national culture by
surveying Whites, Coloureds, Asians and Blacks in an attempt to present South Africa’s
multicultural background and its collective influence on its national culture. Hence, the
Sithole (2001) South African national culture dimensions is presented in table 1, as well as
separate index scores for different sub-cultural groups in South Africa. It is interesting to
4 The results of the calculation are presented in tables 4 – 6 (chapter four).

34
note that South Africa obtained a higher Individualism score in the Sithole (2001) study
than in the original Hofstede (1980, 2001) study. In addition, in the Sithole (2001) study
Blacks scored almost as high on Individualism as Whites. This is opposed to the general
view that Black culture embrace collectivistic values (Sithole & Hall, 2000). However,
Collectivism has traditionally been associated with economic deprivation. Hofstede (1997)
and others (Triandis, 1994) have argued that Individualism is thought to increase as the
discretionary capital that is available to people, increases. According to Triandis (1994), as
people become more affluent, they have more freedom to “do their own thing” and
therefore, “financial independence leads to social independence” (p. 165). It should be
noted that the sample (n=572) for the Sithole study (2001) comprised of operational
employees, supervisors, middle and upper management at Portnet (a South African
parastatal transport company). The criteria for inclusion in the study were at least a high
school diploma, technical or college education. In terms of South African literacy standards
(only 22.6% of the population has a standard 10 and/or higher education qualification;
Statistics South-Africa, 2007), it was a relatively educated sample. Thomas and Bendixen
(2000) conducted a study to explore the management implications of ethnicity in South
Africa. In a middle management sample (n=586), representing Whites, Blacks, Asians and
Coloureds, they reported an Individualism score of 81. The results of this study, as well as
the Sithole (2001) study may provide preliminary evidence for the social mobility theory
(Cutright, 1968) which posits that Individualism is associated with the development of a
middle class. Hence, the Individualism score might be a result of the development of a
“back middle” class due to post apartheid transformation and democratisation in new South
African society.

35
Cultural Dimensions
Country Power
Distance
Uncertainty
Avoidance
Individualism /
Collectivism
Masculinity /
Femininity
Australia 36 51 90 61
New Zealand 22 49 79 58
South Africa
English speaking Whites**
SA National dimensions***
Black (n=388)
Coloured (n=43)
White (102)
49
49
56
59
42
49
46
57
52
22
65
77
73
68
78
63
39
48
39
21
Italy 50 75 76 70
USA 40 46 91 62
Malaysia 104 36 26 50
India 77 40 48 56
Philippines 94 44 32 64
Indonesia 78 48 14 46
Societal Cluster Classifications
Anglo Cultures
England
Australia
South Africa1
Canada
New Zealand
Ireland
USA
Latin Europe
Israel
Italy
Portugal
Spain
France
Switzerland2
Nordic Europe
Finland
Sweden
Denmark
Germanic Europe
Austria
Switzerland
The Netherlands
Germany3
Germany4
Eastern Europe
Hungary
Russia
Kazakhstan
Albania
Poland
Greece
Slovenia
Georgia
Latin America
Costa Rica
Venezuela
Ecuador
Mexico
El Salvador
Colombia
Guatemala
Bolivia
Brazil
Argentina
Sub-Sahara Africa
Namibia
Zambia
Zimbabwe
South Africa5
Nigeria
Arab Cultures
Qatar
Morocco
Turkey
Egypt
Kuwait
Southern Asia
India
Indonesia
Philippines
Malaysia
Thailand
Iran
Confucian Asian
Taiwan
Singapore
Hong Kong
South Korea
China
Japan
The next section will introduce bias and equivalence from a cross-cultural assessment
perspective. It contains a prelude to the extended propositions (presented in chapter three)
on why equivalence of scores (at item and/or subscale level) derived from a given
monocentred measure (i.e. instruments from a single, Western cultural background) over
Table 1
Index scores* for countries on cultural dimensions (Hofstede, 1983, 2001; Sithole, 2001 )
NOTE: * Power Distance and Uncertainty Avoidance are differentiated in terms of high / low scores; Individualism /
Collectivism and Masculinity / Femininity are considered to be bi-polar scales, that is, higher scores denote
Individualism / Masculinity; lower scores indicate Collectivism / Femininity; Power Distance index range from 11 –
104; Uncertainty Avoidance index range from 8 – 112; Individualism / Collectivism index range from 6 – 91;
Masculinity / Femininity index range from 5 – 95; **Original Hofstede (1980) scores derived only for English Speaking
White South Africans; *** South African National Cultural Dimension index scores derived over four most pronounced
sub-cultural groups in SA (Sithole, 2001),
Table 2
Societal Cluster classification according to the GLOBE study (Gupta et al., 2002).
NOTE: 1=White sample; 2=French Speaking; 3=Former East, 4=Former West; 5=Black sample

36
two cultures (or nationalities), may not be meaningfully comparable. The aim is to provide
a theoretical framework for predicting cultural bias in exported EI measures, by considering
a given county’s national Hofstede culture dimensions (to which the instrument is exported)
and its implications for individual items contained in self-report EI measures.
2.4 Bias and equivalence: a cross-cultural perspective
2.4.1 Introduction
Bias refers to the presence of nuisance or systematic error in measurement (Van de Vijver
& Leung, 2001). In cross-cultural assessment these ‘disturbances’ (nuisance factors)
influence the comparability of scores across cultures (Van de Vijver, 2003). That is, the
measurement implications of bias for comparability are addressed in the concept of
equivalence. It relates to the scope for comparing the scores over different cultures.
Decisions on the absence or presence of equivalence are grounded in empirical evidence
(Van de Vijver, 2003). If bias is present the differences in scores of the indicators of a
particular construct do not correspond with differences in the underlying trait or ability
(Van de Vijver & Tanzer, 1997). Two forms of bias can be distinguished: internal and
external5. The former is focused on the relationships between observed scores and latent
trait variables whilst the latter is concerned with whether culture moderates the relationship
between predictor and criterion variables (Meiring, Van de Vijver, Rothmann, & Barrick,
2005).
Byrne and Watkins (2003) suggest that problems related to cross-cultural assessment and
the nonequivalence of measures employed for such purposes, are predominantly related to
bias and translation of such measures into diverse languages, even though innumerable
other reasons may exist. For example, some argue that the cultural context defines the
meaning of behaviour and associated reactions elicited with psychometric tests that might
render the scores they provide inequivalent or culturally biased (Berry et al., 2002). Van de
Vijver and Tanzer (1997) note that bias has to do with the characteristics of an instrument
in a (specific) cross-cultural comparison, not with its intrinsic properties. Hence, the
question as to whether an instrument is biased cannot be answered in general terms. Rather
5 The internal bias of the SUEIT was investigated in this research.

37
it should be addressed as to whether an instrument is biased in a specific comparison. The
possibility of the presence of bias raise questions about the comparability of scores across
cultural groups, implying that their psychological meaning might be culture or group
dependent (Van de Vijver, 2003).
Van de Vijver and Poortinga (1997) proposed a theoretical framework for bias. Within this
framework, a lack of equivalence is commonly attributed to a host of reasons, collectively
referred to as cultural bias (Berry et al., 2002). Cultural bias in cross-cultural research is
mostly related to three sources, i.e. the construct being studied, the methodological
procedure and the item content (Byrne & Watkins, 2003; Van de Vijver & Poortinga, 1997;
Van de Vijver & Tanzer, 1997). When cultural bias is uncovered, it should be interpreted as
systematic information about cross-cultural differences which should not be equated with
measurement error (Berry et al., 2002).
2.4.2. Construct bias
Construct bias is present when the effects of a biasing factor relate to the operationalisation
of a construct, hence the construct contains a degree of disparate meaningfulness when
measured over the different cultural groups (Berry et al., 2002; Byrne & Watkins, 2003). If
construct bias exists, the psychological construct is not identical across cultures (Van de
Vijver & Leung, 1997). For example, research has shown that the dimension ‘Interpersonal
Relatedness’ in the Chinese indigenous personality measure, the Cross-Cultural Personality
Assessment Inventory (CPAI-2), does not load on any of the Big Five personality factors in
the Western model (Cheung, Cheung, Wada & Zhang, 2003). Another example is
conceptions of intelligence in non-Western cultures which includes aspects of social
intelligence not typically included in traditional Western intelligence tests (Van de Vijver &
Tanzer, 2004).
Sources of construct bias could include, firstly, the differential appropriateness of item
content. This implies that the behaviours being tapped as indicators of a construct can be
differentially appropriate across cultural groups (Berry et al., 2002; Byrne & Watkins,
2003). For example, due to cultural display rules (rules about the appropriateness of

38
emotion expressions in specific situations; Ekman & Friesen, 1975) respondents from
Asian cultures (e.g. Japanese; Matsumoto, 1989) as opposed to Australians, might view low
Emotional Control6 as ‘inappropriate’ because the culture prescribes that strong emotion
should not be freely communicated in public or the workplace. This may have an influence
on the latent mean differences between these two cultural groups on the Emotional
Recognition and Expression7 and Emotional Control subscales of the SUEIT, with an
expectation of Asians scoring consistently lower on Emotional Expression and Control.
The item “I tend to explode with anger easily” (Impulse Control subscale; EQ-i, Bar-On,
1997) might be culturally bias as cultural display rules is known to regulate the intensity of
emotional expression (an example of differential appropriateness of item content). For
example, Japan emphasises the social hierarchy much more than the USA, therefore the
social norms dictate that it is inappropriate to show strong negative emotion to a high status
person. Japanese therefore ‘qualify’ their display of negative emotions (fear, anger &
sadness) by adding a slight smile to soften the impression (Matsumoto, Yoo, Hirayama, &
Petrova, 2005).
Second and thirdly, insufficient sampling of the relevant behaviours related to the construct
or incomplete overlap of definitions of the construct across cultures, could introduce bias
on the construct level (Berry et al., 2002). Consider, for example, the inclusion of a
‘happiness’ subscale into the EQ-i (Bar-On, 1997). In European – American culture, the
right to the pursuit of happiness (e.g., made explicit in American constitution) shapes the
view that happiness should be a defining personal characteristic central to the identity of
self. Therefore, expression of unhappiness signals failure (D’Andrade, 1984) and would
possibly be equated with less emotionally intelligent behaviour in this culture. In the Asian
cultural model of emotion, moderation in emotional experience and expression serves the
fundamental belief embedded in dominant religions (e.g., Buddhism) that there is a need to
a balance between positive and negative feelings, each moderating the extent of the other
(Leu, Mesquita, & Ellsworth, 2006). Here, the inclusion of a ‘happiness’ subscale
6 Emotional Control as a dimension of EI within the SUEIT model refers to how effectively strong emotional
states experienced at work (i.e. anger, stress, anxiety or frustration) are controlled (Palmer & Stough, 2001). 7 Emotional Recognition and Expression refers to the ability to identify your own feelings and emotional
states, as well as to express such inner feelings to others (Palmer & Stough, 2001).

39
constituting of items with item content that, for example, refers to being happy with your
life, finding pleasure in life and generally being cheerful (Bar-On, 1997, 2002), may
obscure the conceptualisation of EI in Asian cultures. That is, it could be argued that
happiness may not be a central dimension that defines emotionally intelligent behaviour
within the Asian cultural context.
2.4.3 Method bias
Method bias is present if the assessment procedure introduces unwanted intergroup
differences (Van de Vijver & Leung, 1997). In this case the biasing factor (i.e. the source of
bias) influence responses on most, or all items (Berry et al., 2002). Four common sources
of method bias include differential social desirability, differential response styles (e.g.
extremity scoring and acquiescence), differential stimulus familiarity and the lack of
comparability of samples (Berry et al., 2002; Byrne & Watkins, 2003).
Social desirability bias is a general concern in self report EI measurement8. Examples have
already been discussed in section 2.2.3 of this chapter. Hofstede (1980), however, has noted
that social desirability response bias may vary by culture, resulting in a cultural specific
response set9 (Byrne & Watkins, 2003; Middleton & Jones, 2000). For example, Middleton
and Jones (2000) have provided some evidence that a significant difference in social
desirability response bias between Western (n=341) and Eastern (n=104) undergraduate
students could be attributed to differences in the dominant cultural dimensions of the
subject’s country of origin.
Jackson and Messick (1958) coined the term ‘response style’. They wanted to emphasise
the idea that useful individual difference information may be conveyed through different
styles in questionnaire responding. This type of bias, a response tendency of an individual,
will be displayed consistently across time and situations10
. Extreme Response Styles (ERS)
is the tendency to use the extreme ends of a rating scale (Cheung & Rensvold, 2000; Van
8 It should be noted, however, that in a recent study with the SUEIT, no significant or substantial relationships
between self report EI and social desirability was reported (Downey, Godfrey, Hansen, & Stough, 2006). 9 Response set refers to tendencies in responses, separate from content (Cronbach, 1950).
10 For the purposes of this dissertation, the term ‘response style’ will be used.

40
Herk et al, 2004). Acquiescence Response Style (ARS) is also known as agreement bias,
i.e. a tendency to agree with questions, regardless of question content (Johnson et al.,
2005). Sekeran (1983), for example, have suggested the influence of a ‘courtesy bias’
(especially in Asian countries) leading individuals to distort responses to please
investigators. The uncovering of strong acquiescence bias (the tendency to give a positive
answer to any question) in the work of Hofstede (1980, 2001) provides more evidence.
Randall, Huo and Pawalk (1993) have presented propositions for how key value differences
between countries (based on Hofstede’s work, 1980, 2001) might exert an individual
influence on responses to self-report questionnaires, but no empirical data was included in
the paper to investigate the propositions.
Within cross-cultural psychology, ERS and ARS are generally viewed and studied as
products of cultural differences in response styles. For example, in Western cultures high
Individualism (Hofstede, 1980) has been associated with less ARS (Van Hemert; Van de
Vijver, Poortinga & Georgas, 2002) and has been shown to not be related to ERS (Johnson
et al., 2005). These types of method bias may be more pronounced in scores obtained from
non-Western societies characterised by Collectivism and high Power Distance (e.g.
Malaysia, India). For example, high Power Distance has been associated with more ERS
(Johnson et al., 2005) and more ARS (Van Hemert et al., 2002). Collectivism has also been
found to be positively related to ARS (Smith, 2004). Demonstrating that a measure is free
of ERS and ARS eliminates alternative explanations for observed cross-cultural
differences. Such response styles may lead to invalid inferences in cross-cultural research
(Van Herk et al., 2004) if left undetected.
Stimulus familiarity (‘testwiseness’; Van de Vijver, 2003) and sample bias (Berry et al.,
2002; Byrne & Watkins, 2003) are further sources of method bias. Stimulus familiarity
might lead to different response styles, due to unfamiliarity with the use of a Likert-type
scaling format11
, resulting in response bias (e.g. only selecting extreme ends of the scale)
11
As workplace samples was used in this research, it may be argued that the respondents would all have been
previously subjected to some form of psychometric assessment (and the Likert-type response scale) as part of
the recruitment process. Hence, it may be plausible to argue that stimulus familiarity may not have influenced
the results.

41
(Byrne & Watkins, 2003). Sample bias has the potential to introduce larger cultural
distance, leading to more alternative explanations for cross-cultural differences (Van de
Vijver, 2003). Hence the comparability of samples12
should be carefully considered on
factors other than the construct being studied (Byrne & Watkins, 2003).
Verbal ability or language proficiency (i.e. bilingualism) is a sample characteristic that has
frequently been mentioned as a potential source of bias in ability testing (Claassen,
Krynauw, Holtzhausen, & Wa Ga Mathe, 2001; Foxcroft, 1997; Owen, 1991). Similar
arguments may be applicable to the domain of personality measurement, as well as other
individual differences (e.g. EI). For example, Marsh (1986, 1996) has demonstrated a
negative relationship between the observation of a negatively keyed item factor and verbal
ability, suggesting that individuals with less verbal skill may have difficulty reading
negatively keyed items, accurately, particularly those items with double negatives. Loiselle
and Cossette (2001), in a cross-cultural validation study of the TAS-20, report that Peruvian
respondents had difficulties responding to negatively worded items. Others have proposed
that individuals who do not read test items accurately or who fail to understand the content
of a test item are more likely to respond incorrectly (Hinkle, 1994; Schuttelworth-Edwards,
Kemp, Rust, Muirhead, Hartman, & Radloff, 2004). Poortinga and Van der Vijver (1987)
suggested that when investigating cross-cultural differences it is of major importance to
measure, and consider the consequences of other contextual variables, such as mother
tongue, that may influence test scores. For example, Owen (1991) report language to be a
potential source of bias in the Junior Aptitude Test when administered to different
population groups in South Africa. In another South African qualitative study, Abrahams
and Mauer (1999) examined the impact of home language on the responses to the items of a
personality questionnaire, the 16PF. They concluded that the understanding of items and
concepts in English was problematic, especially for Black groups. Less language
proficiency in the test language (e.g. testing a bilingual person in a language other than
their mother tongue) may manifest itself in item keyed method effects. Gignac (2005) have
cautioned researchers to always consider the possibility of item keyed method effects when
12
All the samples in this study were matched on age and gender in an attempt to control for at least these two
sample characteristics, and their bias effects on the results.

42
conducting CFA analysis. Poor model fit may be a result of not modeling these method
factors, together with substantive factors.
2.4.4 Item bias and Differential Item Functioning (DIF)
In relation to item content, the effects of a biasing factor can manifest in a single or few
items, known as ‘item bias’ or ‘differential item functioning’ (DIF) (Berry et al., 2002).
Poor translation or inappropriate items for a specific context may cause item bias (Van de
Vijver & Leung, 1997). Item bias involves a lack of equivalence in a separate indicator or
item (Fontaine, 2008). Hence, if individuals from different cultural groups with an equal
ability / trait / attitude do not have the same probability of giving a correct answer, item
bias exists (Van de Vijver & Leung, 1997). If removing biased items eliminates group
differences on the scale, the groups may have differed because of DIF rather than from
inherent group differences in the construct.
Whether the researcher finds a lack of measurement equivalence on a substantial number of
items on a measure (i.e. pointing to a violation of the assumption that the same construct is
being assessed across the groups by the same measure), or if evidence of partial
equivalence is found to exist (i.e. only a few items are not found to be equivalent across
groups), three prominent matters related to item bias need to be addressed before true
meaningful between-group comparisons are admissible (Chan, 2000). Firstly, the
methodological issue of detecting the items that are functioning differentially across groups
should be considered (Chan, 2000), the type of bias investigation that has historically
received the most research attention (Van de Vijver & Leung, 1997). Item bias analyses
address the second and third issues, namely, understanding the reasons for the difference in
item functioning (e.g. relating items to variables that are irrelevant to the test construct) as
well as the practical implication of how to treat differentially functioning items (e.g.
remove the items from the scale) (Chan, 2000).
With item bias, recent improvements in the development of Item Response Theory (IRT)
models accounting for responses on polytomous ordered response formats (such as Likert-
type ratings scales), should be noted. The IRT model assumes that a similar response from

43
respondents, with a similar standing on the latent trait regardless of their cultural
background, is evoked by an unbiased item (Van de Vijver & Leung, 1997). Traditionally,
item responses are linked to latent traits by utilising a logistic curve, specified by three
parameters, i.e. difficulty, discrimination and guessing parameters, although the latter is
mostly excluded when the procedure is employed for attitudinal data (Van de Vijver &
Leung, 1997) as it evident in the work of Chan (2000).
The increased development and use of polytomous IRT models to detect DIF in terms of
item difficulty and discrimination, specifically in self-report measures that measure non-
cognitive ability latent trait variables, however, are not without limitations. For example,
large sample sizes (Van de Vijver & Leung, 1997; Van de Vijver, 2003) are required and
hence the consequent effects on chi-square test results (Reise et al., 1993) are unknown.
The absence of practical fit indices to reduce dependence on sample size, as well as the
absence of modification indices (Chan, 2000) are further limitations worth mentioning. A
recent significant contribution in this area by Chan (2000) demonstrated the use of the
Mean and Covariance Structures Analysis (MACS) model (Sörbom, 1974) to detect
uniform and non-uniform DIF (an improvement upon the application of the standard
confirmatory factor analysis model, with which uniform DIF could not be examined, Reise
et al., 1993), where the item intercept and factor loading corresponds to the item difficulty
and discrimination parameters, respectively. Uniform DIF is present when no interaction
between ability level and group membership is evidenced, hence only the item level
difficulty parameter differs across groups. Non-uniform DIF is evidenced when item
discrimination parameters differs across groups, implying that there is an interaction
between ability level and group membership (Chan, 2000).
By starting off with a priori notions (although limited) regarding whether uniform and non-
uniform DIF on the three subscales of the Kirton Adaption-Innovation Inventory (KAI,
Kirton, 1976) over gender groups and occupational groups would be found, Chan (2000)
illustrates the application of a series of MACS models, run in LISREL 8 (Jöreskog &
Sörbom, 1993), providing a systematic demonstration of the modeling procedure
implemented to do so. MACS analyses (Jöreskog & Sörbom, 1989), an extension of
44
standard structural equation modeling techniques, allows for the analyses of mean-level
information in addition to the typical variance-covariance information in SEM analyses
(Sörbom, 1982). Little (1997, p.54) provides a succinct, yet insightful overview of why
MACS analyses are ideally suited to establish construct comparability (a fundamental
concern in cross-cultural research) as well as uncover between-group differences. The
reasons include that such analyses allow,
“ for (a) simultaneous model fitting of an hypothesised factorial structure in two or more groups (i.e.,
the expected pattern of indicator-to-construct relations for both the intercepts and factor loadings), (b) tests of
the cross-groups equivalence of all reliable measurement parameters (i.e. again both intercepts and loadings),
(c) corrections for measurement error whereby estimates of the latent constructs’ means and covariance are
disattenuated (i.e. estimated as true and reliable values), and (d) strong tests of substantive hypotheses about
possible sociocultural influences on the constructs (e.g. nested-model comparisons in multiple-group
analyses).”
The results firstly confirmed the expectation that no DIF across gender groups would be
found (i.e. full measurement equivalence at item level). Empirical evidence for both non-
uniform and uniform DIF across occupational groups on the KAI subscales, consistent to
expectations, were found. However, in each KAI subscale, only a small number of items
(e.g. 1 of 7 in the Efficiency subscales) exhibited DIF, leaving the author to conclude that
there is partial measurement equivalence for each KAI subscale, which implies that direct
mean comparisons across the occupational groups might probably be meaningful (Chan,
2000).
The MACS DIF approach (Chan, 2000) was utilised in this study. In addition to detecting
item bias, this approach allowed for the comparison of latent mean differences on the
specific EI subscales when the DIF items were flagged and freed in the final partially
constrained model.
A theoretical analysis of the nature of items contained in two prominent EI measures (one
of which were empirically studied in this research) is presented in chapter three. For
example, incidental differences in appropriateness of the item content (due to differences in
national cultural value dimensions respondents subscribe to), emotion words that have

45
different meanings in different cultures, as well as differences in the prototypicality of
emotion words over different cultures, may produce item bias when EI measures are
transported from a Western to non-Western cultural context.
2.5 Conclusion
This chapter presented the theoretical framework for this study. It discussed the current
status of EI research, establishing that research efforts seem to be on the increase in spite of
criticism on the construct. The present extent of cross-cultural applications of six prominent
self-report EI inventories was outlined. The review aimed to clarify current challenges in
the cross-cultural application of self-report EI measures. It also argued that more stringent
factorial and measurement invariance studies are needed before confident claims in the
universality / cultural specificity of the EI construct (measured by different inventories),
and its associated utility in the workplace, can be made. Next, cross-cultural psychology
and measurement over cultures was discussed. The Hofstede (1980, 2001)
conceptualisation and measurement of dimensions of culture was described. Bias and
equivalence are central themes in cross-cultural measurement. The last section of this
chapter presented a theoretical framework for predicting cultural bias in exported EI
measures (from Western to non-Western environments) given a country’s national Hofstede
culture dimensions (to which the instrument is exported). It was argued that construct,
method and item bias investigations should be conducted on established self-report EI
inventories. Studies that aim to disentangle cultural bias from true construct variance in
self-report EI measures (of which this research on the SUIET is a starting point) may assist
in a greater understanding of the nature and utility of the construct.

46
CHAPTER 3
Emotional Intelligence across cultures: theoretical and methodological considerations
3.1 Overview
The focus of this chapter is a brief review on key aspects of three decades of research on
emotion (i.e. emotional regulation, expression and recognition) and culture. Implications
for EI conceptualisation and operationalisation within the framework of different cultures
are discussed. The discussion centers on proposed arguments regarding possible elements
of cultural bias contained in two Western self-report EI instruments (i.e. the EQ-i:S, Bar-
On, 2002; SUEIT; Palmer & Stough, 2001) should they be used in a non-Western context.
The SUEIT model (Palmer & Stough, 2001) broadly subscribes to the Mayer and Salovey
(1990, 1997) EI model. It defines EI in terms of five dimensions (i.e. Emotional
Recognition and Expression, Understanding Others Emotions, Emotions Direct Cognition,
Emotional Management and Emotional Control1). The broader Bar-On model (1997, 2002)
proposes that EI encapsulates emotional, social and personal competencies, skills and non-
cognitive capabilities that may arise from the effective use or regulation of emotions. This
model places emphasis on adaptation to environmental demands.
Although both the SUEIT and Bar-On models are self-report approaches to measuring EI,
they differ in terms of the scope of EI sub-dimensions they include (e.g. the Bar-On model
includes a wider variety of social intelligence elements). Hence, this discussion focuses on
both these instruments to allow for a wider and richer conceptual evaluation of EI item
content (and sub-dimensions)2. In addition, both these instruments are being used
extensively around the world. For example, it has been noted previously that the Bar-On
EQ-i (Bar-On, 1997) has been translated widely and normative data exist in more than 15
countries (Bar-On, 2000). On a practical level the discussion may be useful to I/O
Psychology researchers and practitioners in terms of creating an awareness of possible
elements of cultural bias in Western EI measures, when transporting such measures to non-
Western environments.
1 Refer to section 4.4.1 for a description of each SUEIT subscale (dimension).
2 The empirical cultural bias investigation presented in chapter 4, however, only focuses on the SUEIT.
47
It is argued that the Western cultural origin of both these tests contains descriptions of EI as
defined within those cultures (i.e. Australia for the SUEIT and Canada for the Bar-On EQ-i:
S). It is proposed that the increasingly multicultural global work environment mostly
advocate value systems inherent to the Western industrialised world system (high
Individualism and low Power Distance; Hofstede, 1980, 2001). However, respondents
being assessed within these environments are increasingly from different cultural
backgrounds with known differentiation in cultural value dimensions. Hence, cultural group
membership (and associated differences in cultural value systems of respondents) could
introduce bias into Western cross-cultural EI measures when these are applied cross-
culturally (e.g. non-Western contexts). Culture influences the transportability of
instruments on various levels (e.g. structural or metric equivalence). This has implications
for research and practical workplace decisions, based on such transported instrument’s
scores. Specific items in these inventories are predicted to be susceptible to cultural bias
based on the item content which, for example, taps some aspect of Individualism or Power
Distance (cultural dimension on which nations tend to differ). For the purpose of this
discussion, national culture is defined as the pattern of values, attitudes, and beliefs that
affect the behaviour of people from different countries (Hofstede, 2001) described in terms
of the Hofstede (2001) cultural dimensions3 (discussed in chapter 2). Methodological issues
related to cross-cultural EI research are also highlighted.
3.2 A brief review of the current state of cross-cultural EI research
One area of EI research that remains a relatively unchartered domain is that of cross-
cultural EI research. Cross-cultural research aims to develop and extend a more universal
psychology by investigating the generalisability of psychological theory in different
cultures (the practice of ‘transporting and testing’). Failures to establish generalisability
(when research methodology and measurement instruments are sound) may be interpreted
in terms of cultural variations in behavior (Berry et al., 2002). This has two implications for
future cross-cultural EI research. Firstly, when monocentered instruments are used in
3 Only three of the five cultural value dimensions are deemed relevant to this discussion. They include,
Individualism – Collectivism (i.e. the relationship of the individual to the group), Power Distance (i.e. status
differentials that exist within groups) and Uncertainty Avoidance (i.e. rituals concerning the future and
avoidance of anxiety) (Hofstede, 1980, 2001).

48
generalisability studies (e.g. from Western to non-Western cultures), they are more likely to
run into problems of bias (Van de Vijver & Leung, 2001). Therefore, testing of the
equivalence of scores across different groups should routinely be conducted (Van de Vijver
& Leung, 2001). This is a weakness of the limited cross-cultural EI studies conducted up to
this point. Secondly, when cultural bias (construct, item or method bias) is uncovered, ways
to minimise bias (i.e. method bias) in EI assessment should be considered, whilst evidence
of construct and item bias should be scrutinised to better uncover the cultural variability of
the construct. This knowledge could then be applied in reducing ethnocentrism (Berry et
al., 2002; Hofstede, 2001) in current EI instruments, as well as designing better ‘culturally
tuned’ EI development programmes (e.g. Herkenhoff, 2004).
Based on the Van de Vijver and Leung (1997, 2001) taxonomy4 of studies in cross-cultural
psychology, EI research in this domain has mostly yielded psychological differences and
generalisability studies, and the empirical evidence on ethnic differences have been noted
to be both, “…scant and contradictory” (Matthews et al., 2002, p. 71). This remains to be
true for research on both the prominent ability (the MEIS and MSCEIT; Mayer et al., 2000)
and the trait model (self-report) measures of EI (e.g. EQ-i, Bar-On, 1997; SSRI / EIS,
Schutte et al., 1998; SUEIT, Palmer & Stough, 2001).
For example, a recent psychological differences study with the trait based Emotional
Intelligence Scale (EIS, Schutte et al., 1998) surprisingly reported higher total EI scores for
minority ethnic groups (Blacks, Hispanics) leading the researchers to pose the question of
whether in fact, “…majority groups could sue using a claim of test bias” (Van Rooy,
Alonso & Viswesvaran, 2005, p. 694), as group difference in mean predictor scores could
4 The taxonomy entails a 2 × 2 classification of studies in (cross-)cultural psychology, based on two
dimensions (i.e. whether the purpose of the study is hypothesis-testing or exploratory, and whether or not
contextual variables were included). Four categories are distinguished. Hypothesis testing studies include
generalisability studies which explore whether research findings obtained in one group (e.g. Western group)
can be replicated in another group (e.g. non-Western group). No contextual elements are taken into account.
Equivalence is usually assessed. When contextual factors are accounted for in hypothesis testing studies, a
contextual theory / theory driven study is conducted. Studies that have an exploratory orientation are grouped
into psychological differences (no consideration of contextual factors) or ecological linkage / external
validation studies. The former applies an instrument in two cultural groups, without any particular theory
regarding the nature of cross-cultural differences to be expected. The latter, by including a set of contextual
variables in an exploratory manner, aims to provide evidence for specific interpretation of observed cross-
cultural differences (Van de Vijver & Leung, 1997, 2001).

49
be a likely cause of adverse impact. Rozelle, Pettijohn and Parker (2002) reported
significant differences between domestic (n=219) and international students (n=76) at an
American university, in terms of overall EQ scores and individual factors on the Emotional
Quotient test (Goleman, 1995). Acknowledging that the study assumes, and not explicitly
tests, for whether cultural test score bias could be the cause of the reported cultural
differences, they conclude that opportunities for success in business for the international
students might be limited by their EI.
Three published generalisability studies, to date, on the EI construct (self-report measures)
across diverse ethnic / cross national cultural groups exist. A study of the EQ-i: YV (Bar-
On & Parker, 2000) on Canadian Aboriginal versus non-Aboriginal youth was conducted
by Parker et al., (2005). This study is exemplary in acknowledging and theoretically
proposing how cultural factors might influence the operationalisation of the construct in the
two different cultural groups. The results of the Parker et al. (2005) study provided
preliminary support for equivalence of the EQ-i: YV (Bar-On & Parker, 2000) scores over
the two groups (results of a multi-group CFA, i.e. configural invariance5, is reported),
although not to the extent that the full measurement invariance6 (i.e. configural, metric and
scalar invariance) of the instrument is explicitly investigated. In addition, consistent group
differences over the groups on the total EI score and Interpersonal, Adaptability and Stress
Management subscales (Aboriginal students scored consistently lower) as well as post hoc
discussions on possible effects and causes of these differences were presented. Evidence,
albeit limited, to support the invariant operation of the EQ-i: YV, was presented in this
study (Parker et al., 2005).
Rahim, Psenicka, Polychroniou, Zhao, Yu, Chan, Dudana, Alves, Lee, Rahman, Ferdausy,
and Van Wyk (2002) investigated the relationship of self-awareness, self regulation,
5 Configural invariance (Vandenberg & Lance, 2000) is also known as the test of ‘factor structure
equivalence’ (Hair, Black, Babin, Anderson, & Tatham, 2006). Evidence for configural invariance points
towards a similar conceptualisation of a constructs in different groups (absence of construct bias), to the
extent of the data supporting the same number of factors and similar items associated with each factor
(Meredith, 1993). 6 A lack of measurement invariance evidence is known to compromise the unambiguous interpretation of
between group differences (Byrne & Watkins, 2003; Cheung & Rensvold, 2002; Vandenberg & Lance, 2000)
rendering cross-cultural comparisons on cultural mean differences to be misleading and ultimately, possibly
meaningless.

50
motivation, empathy and social skills (Emotional Quotient Index, EQI; Rahim et al., 2002)
of supervisors to subordinates’ strategies of managing conflict. Single group CFA results
for the EQI for the data from seven countries (USA, n=303; Bangladesh, n=152; Hong
Kong and Macao, n=79; Greece, n=132; Portugal, n=86; China, n=210; South Africa,
n=84) were reported, as well as a fully unconstrained multi-group CFA analysis (configural
invariance) for each of the countries with the USA as a reference sample. No theoretical
explanations for why culture might produce differences in the cross-national CFA results
were provided. No further tests of invariance were reported. The authors suggest that the
results supported a somewhat consistent cross-country pattern, although admitting that
there were differences in results, and that, “…it is not possible to determine whether these
differences came from the small and convenience samples or differences in cultures”
(Rahim et al., 2002, p.321). It should be noted that five of the seven county samples sizes
fell below the n=200 structural equation modeling sample size guideline (Hair et al., 2006),
with the smallest sample being 79, casting doubt on the generalisability of the results.
The only cross-cultural EI study that has explicitly tested for full instrument invariance on
two early measures of self-report EI (TMMS, Salovey et al., 1995; TAS-20; Bagby et al.,
1994) was conducted by Ghorbani, Davison, Bing, Watson, and Mack (2002). By
combining the factors of these measures into an input (attention to emotions), process
(clarity of emotions) and output (repair of emotions) information-processing system, they
conducted CFA and measurement invariance procedures to fit the data, obtained from
Iranian (n=231) and American (n=220) university students, to the model. Even though CFA
and measurement invariance procedures provided evidence for cross-cultural similarities in
the fit of the a priori higher-order factor structure, subsequent analyses revealed cross-
cultural dissimilarities in the actual processing of emotional information (interrelationships
among factors differed). This confirmed the notion that contrasts between Iranian and
American social life (individualistic versus collectivistic values; Hofstede, 2001) might
have implications for the processing of emotional information in these groups (Ghorbani et
al., 2002).

51
Preliminary research on EI ability measures have proven no better in unraveling cross-
cultural differences in EI. The criterion for correctness (‘right’ answers) on ability EI test
items (MEIS, Mayer et al., 2000; Mayer, Salovey, Caruso Emotional Intelligence Test,
MSCEIT; Mayer et al., 2001) are typically based on target, expert or consensus criteria.
Mayer et al., (2000) argue that the basis for claiming ‘right’ answers is grounded in
evolutionary and cultural foundations for the consistency of emotionally signaled
information. They cite the work of Darwin on the evolution of emotion (1872 / 1965) and
that of Ekman (1972) who have provided evidence for a strong universal emotional
‘language’ and facial expression of emotion among humans. In addition, they argue that
replications across literary sources and more recently, the Internet, of ideas or ‘cultural
memes’ are comparable to biological genes. Therefore, emotional ideas are disseminated
and reproduced as popular ideas according to the degree to which they are found useful and
functional within a given culture. They conclude that consensus criterion is the best single
means of determining a correct answer by stating that, “…if one subscribes to the idea that
emotional signals evolve, either biologically or culturally, then a wide, representative,
sample of observers is probably a good judge of correctness under at least some
circumstances” (Mayer et al., 2000, p.327). Based on this reasoning it could, therefore, be
argued that when consensual scoring is used in ability measures, the possible effects of
cultural bias in this type of EI measurement might be controlled. Could this be an
alternative explanation for results reported by Roberts et al., (2001), who report no
differences between ethnic groups when consensual scoring was employed (MEIS, Mayer
et al., 2000), but when expert scoring was used, White Americans outperformed minority
American groups on many of the subscales? It should, therefore, be asked whether ethnic
differences, when uncovered with expert scoring, could be interpreted as ‘real’ differences
between these groups, as it seems plausible to argue that cultural bias effects might be
masked by expert scoring. Therefore, should consensus scoring7 not always be used to
minimise any possibility of cultural bias in ability based EI measures?
7 According to Matthews et al., (2002), the test developers of the MEIS / MSCEIT are moving towards an
operational definition of ability based consensus scoring, inferring that a person is more intelligent if they are
closer to the population norm. They question the rationale for scoring an ability on this basis, arguing that, in
this context, it is misleading to describe EI as an ‘intelligence’.

52
The goal of the preceding section was to provide a brief and by no means exhaustive
overview of previous attempts to study the EI construct over different cultures. As is
evident, many theoretical and methodological challenges implicitly embedded in any
attempt to study EI and culture, face the researcher attempting to tread this unchartered
domain.
3.3 Culture and emotion research: implications for EI
An important question central to this discussion is whether the notion of an ‘ideal’ EI
profile is context dependent, in the sense that ‘appropriate’ or ‘effective’ emotional
behaviour, will in itself be dictated by the cultural origin of the measurement instrument
used? For example, the two EI instruments included in this discussion (i.e. SUEIT, EQ-i: S)
are classified as monocentered instruments (Van de Vijver & Leung, 2001). To what extent
do such instruments and the construct they purport to measure, truly reflect the construct
and all its facets in other cultures? Moreover, when imported measures are used, invariant
psychometric properties and higher levels of equivalence of the instruments should be
investigated. Where is the research evidence to support this? According to Hui and Triandis
(1985) cross-cultural equivalence can be conceived in terms of a universality-cultural
difference continuum and different levels of abstraction and concreteness. They argue that
when imported measures are used, researchers should enhance validity and establish
different levels of equivalence in order to surmount the goal of maximising both precision
and meaningfulness of comparison in cross-cultural research. This universality-cultural
difference continuum (to what extent constructs are considered universally applicable or
meaningful in specific cultural context), also known as the etic – emic (Berry, 1969)
debate, has permeated emotions research for three decades. Research on depression, anxiety
and personality have also not proved to be conclusive on whether imported instruments
capture human psychological phenomena that are invariant across cultures (Sue & Chang,
2003). For example, Leong, Okazaki and Tak (2003) reviewed the assessment of
depression and anxiety in Asia, and concluded that some imported measures (e.g. State-
Trait Anxiety Inventory, Chinese Beck Depression Inventory) miss capturing culture
specific elements (e.g. particular symptomatology in Chinese populations) of these
constructs. Cheung et al., (2003) identified the factor, Interpersonal Relatedness, in the

53
indigenous personality measure the Cross-Cultural Personality Assessment Inventory
(CPAI-2), developed for the Chinese population. This factor did not load on any of the Big
Five personality factors in Western models, whilst they also demonstrated that it was found
among Caucasian US students who completed the CPAI-2, suggesting that Western
measures may not have captured all meaningful important personality dimension (Sue &
Chang, 2003). Leung and Wong (2003), on the other hand, assert that broad personality
patterns are universal. The successful international use and adaptation of the Minnesota
Multiphasic Personality Inventory (MMPI-2) underscores this viewpoint (Butcher, Cheung,
& Lim, 2003).
For almost three decades, emotion research has been dominated by the disciplinary
preferences of researchers, leading to an oversimplification in the debate regarding the
cultural universality or relativism of emotional experience. More specifically, psychologists
and biologists have been inclined to overlook cultural differences, whilst anthropologists
emphasise them, overlooking similarities (Ellsworth, 1994). More recent theoretical
models, have attempted to account for both universality and cultural variation by focusing
on particular components of emotion and their similarities and differences across cultural
boundaries (Fiske, Kitayama, Markus, & Nisbett, 1998; Mesquita & Frijda, 1992; Scherer
& Wallbott, 1994). Matsumoto (1989), for example, has argued that even though emotions
are biologically programmed, learning control of expression and perception is highly
dependent on cultural factors. Kitayama and Markus (1994) published a volume of research
consolidating empirical research dedicated to the premise that emotions are socially and
culturally shaped and maintained. This happens, for example, through collective knowledge
that is represented in linguistic convention (e.g., the nature of the affective lexicon and
specific meanings of emotions terms; Wierzbicka, 1994, 1999). Therefore, it could be
argued that the traits or competencies measured by self-report EI measures (per EI
dimensions, e.g., emotional control, management) tap into this collective knowledge of the
culture within which the test was developed. In administering a self-report EI instrument,
the presence (or absence) of certain ‘traits’, competencies or behavioural tendencies that
would allow a person to respond in an emotionally intelligent way to the environment, and
cope with environmental pressures, whether that be in the workplace (performance, team

54
work, leadership, ability to cope with stress, burnout; e.g. Ogińska-Bulik, 2005; Slaski &
Cartwright, 2002; Van Rooy, & Viswesvaran, 2004) or life in general (life satisfaction,
psychological and physical health; e.g. Schutte et al., 2007) is measured within the
boundaries of the cultural origin of the test. If the potential to display appropriate
emotionally intelligent behaviours is context dependent, then it might be reasoned that the
context (socio-cultural context) should be considered when the behavioural manifestations
(through which EI is often measured) of EI is captured in the development of a self-report
instrument. For example, key cultural dimensions (Hofstede, 2001) such as Individualism
versus Collectivism, high or low Power Distance and Uncertainty Avoidance could be
significant influences in this process.
The following section provides a theoretical / conceptual discussion on how cultural group
membership might introduce cultural specificity into the development of self-report EI test
items. The discussion is guided by key findings of three decades of emotion and culture
research, specifically focused on emotional appraisal and regulation. It is proposed that
cultural difference in values could introduce bias into Western cross-cultural EI measures
where these measures are applied cross-culturally. Specific items are predicted to be
susceptible to cultural bias based on the item content. Table 3 provides an overview of the
proposed affected content of EQ-i: S and SUEIT items included in this discussion (the
content in the table is approximations of selected items from these two inventories, i.e. the
item content has been slightly modified from the original items).
3.3.1 Emotional regulation in cultures
Emotional regulation refers to the processes related to influencing emotions that are
experienced, situations under which a given emotion is experienced, and how and whether
an individual expresses a given emotion (Gross, 1999). It could be argued that the cultural
dimensions of Power Distance, Individualism / Collectivism and Uncertainty Avoidance
(Hofstede, 2001) may account for cultural specificity in emotional regulation abilities in
respondents from different cultures, attenuating beliefs held about the ‘correctness’ of such
behaviours. The concept of emotional regulation appears in the SUEIT (Palmer & Stough,

55
2001) in the Emotional Control and Management8 factors, as well as in the Intrapersonal,
Stress Management and General Mood subscales9 of the EQ-i: S (Bar-On, 2002). Consider,
for example, that in individualistic cultures the identity is defined by personal goals and
achievement and emotion norms encourage emotions signaling independence, authenticity
and assertiveness (Triandis, 1994). In turn, Collectivism stresses that behavior is a function
of norms and duties imposed by the collective, hence the self is defined by one’s
relatedness to a social group whilst the views, needs and goals of the collective are stressed
(Triandis, 1988, 1994). Here, emotion norms promote emotions that signal interdependence
and endorse harmonious relationships (e.g., sympathy), as opposed to prescribing
concealments of emotions that may impede relationships with others (e.g., anger, pride).
Apart from specific influences on emotional regulation discussed below, this cultural
dimension might also influence the differential appropriateness of items and other subscales
in the two inventories under discussion. It may be argued, for example, that items with
content which focuses on behaviours like generally assisting / helping others, independence
in decision making and whether one generally cares about other people (see table 3), might
introduce cultural bias into these measures as such item content taps into typical
collectivistic values (and their associated behavioural manifestations). This could threaten
the construct validity of these measures.
Individualism / Collectivism
According to Triandis and Gelfand (1998) conflict inducing behaviours are minimised in
collectivistic cultures (e.g., Malaysia, Indonesia, Philippines) whilst individualistic cultures
(e.g., Australia, Canada, USA) will be more tolerant of individual deviance. Therefore,
fewer constraints that govern a wide range of emotion expression experiences in and among
members will occur. In addition, Kitayama and Markus (1994) inquire whether it might be
that anger is a highly pervasive, central and natural emotion in Western countries because
8 Emotional Control refers to how effectively emotional states experienced at work, such as anger, stress,
anxiety and frustration, are controlled. Emotional Management refers to the ability to manage positive and
negative emotions within both oneself and others (Palmer & Stough, 2001). 9 The Intrapersonal subscale assesses the respondent’s level of inner self awareness. High scores indicate
individuals who, for example, are in touch with and able to express their feelings, as well as are independent,
strong and confident in conveying their ideas and beliefs. Stress Management refers to the ability to withstand
stress without losing control or ‘falling apart’. General Mood assesses the ability to enjoy life, be content,
positive, hopeful and optimistic (Bar-On, 2002).

56
of the emphasis on independence and the social norm of freely expressing internal
attributes, such as rights, goals or needs and because anger is most closely associated with
the blocking of these rights, goals and needs. Anger is therefore appropriate in situations
where personal goals or individual rights are threatened (Averill, 1982). In addition, anger
expression allows for restoring honour in this context (Cohen & Nisbett, 1994). In contrast,
Asian / Eastern countries stress interdependence among individuals (attending others’ needs
and goals) (Hofstede, 2001, Triandis, 1994) and therefore Kitayama and Markus (1994)
have asked whether it could be argued that anger is less common, natural and integrated
into the social life of individuals in non-Western cultures, or even that the two forms of
anger (in these two cultures) are distinct? This might have cultural bias implications for
items in EI assessment instruments (which measure Emotional Control) that contain the
word “anger”, e.g. “I find it easy to control my anger at work”.
Display rules
The linguistic implications of using a term like ‘anger’ in a self report instrument should
also be considered. For example, the standard English US translation for ‘anger’ in
Japanese is, ‘ikari’. It could be argued that if equivalent translation is assumed when this
term is included in self-report questionnaire items, these two references to ‘anger’ resemble
each other by sharing important elements such as autonomic arousal and the use of certain
face muscles. However, the exact set of participating components (e.g., instrumental
responses, inhibitory tendencies) related to ‘anger’ may vary widely across the two cultures
(Kitayama & Markus, 1994). The most prominent influence here is the use of display rules
in emotional regulation. Display rules serve as socially and culturally learned norms that
specify the appropriateness of displaying and expressing emotions and are known to be a
source of cultural variation in emotional phenomena (Ekman, 1972). According to Ekman
and Friesen (1975) display rules affect facial expressions of emotion in several ways. Facial
expressions of an emotion may be displayed without a corresponding feeling, it could mask
the presence of another inappropriate emotion, attenuate or enhance the apparent intensity
of a felt emotion, or even entirely mask or inhibit a felt emotion. Recently, Matsumoto et
al., (2005) found that when displaying fear, anger, or sadness, Japanese and Russian
respondents are inclined to soften the impression by adding a slight smile, indicating that

57
although they are distressed, ‘it isn’t really that bad’. Americans express their emotions
more visibly than do Japanese or Russian people. According to Matsumoto (1990, 1996)
moderate displays of anger are fairly common in the USA. The display of sadness or other
negative emotions are more appropriate towards friends and family, than acquaintances,
with the opposite being true in the Japanese culture. However, in Japan it is considered
appropriate to display anger towards subordinates, but any other display of anger is
considered crude and inappropriate (Matsumoto, 1996).
Moreover, Ellsworth (1994) asserts that it is not only a matter of the visible behaviour (e.g.,
behavioral manifestations of anger); cultures also seem to differ in their beliefs about the
appropriateness of even feeling certain emotions in certain contexts. For example, in
American culture, in most social contexts it is considered inappropriate for men to cry, and
also experience deep grief as strongly and frequently as women. Therefore, it could be
argued that each culture’s values about emotions and their expression may come to affect
the essential experience (and the expression and, ultimately, the definition) of that emotion
(Ellsworth, 1994).
Items like “I find it easy to control my anger at work”, “I overcome anger at work by
thinking through what’s causing it”, “At work I experience strong emotions that are hard to
control” and “I tend to explode with anger easily” are used to assess different components
of emotional regulation, in the EI measures under discussion. By including ‘anger’ as an
anchor and standard of cross-cultural comparison and generalisation in EI assessment, it
might be plausible to argue that an ethnocentric understanding of this emotion in emotional
regulation is enhanced and maintained. Furthermore, it might be plausible to argue that
respondents from countries with cultures with well defined display rules, might very
seldom ‘explode’ with anger. If these lines of reasoning are followed it should be noted that
items in this facet of EI measurement (emotional regulation) might be particularly
susceptible to cultural bias (which would influence the transportability of the instrument).
Uncertainty Avoidance
The Uncertainty Avoidance index refers to the degree a society is willing to accept and deal
with uncertainty (Hofstede, 2001). The essence of uncertainty is that it is a subjective

58
experience, and that extreme uncertainty creates intolerable anxiety (Hofstede, 2001).
Countries that score high on the Uncertainty Avoidance dimension (e.g., Italy; Hofstede,
2001) tend to be more expressive cultures. In such cultures it is socially acceptable to
express emotions, as anxiety is released through the showing of emotions through which
society has created outlets (Hofstede, 2001). In low Uncertainty Avoidance societies (e.g.
Malaysia, Hofstede, 2001) anxiety is released through passive relaxation, whilst such
cultures are characterised by lower expressiveness. The norm is wide social disapproval of
overly emotional or noisily behaviour. Items like, “I overcome anger at work by thinking
through what’s causing it”, “I find it easy to control my anger at work” and “At work I
experience strong emotions that are hard to control” therefore might contain cultural bias
when introduced into EI measures applied in different cultures.
Power Distance
Power Distance prescribes how societies deal with inequality between people (Hofstede,
2001). In high Power Distance societies (also termed a vertical society; Matsumoto, 1996),
for example Malaysia, the workplace relations between employer and employee are strictly
ruled and dependent on the decisions of the employer, power is centralised as much as
possible. Superiors and subordinates generally consider each other as existentially unequal
(Hofstede, 2001). Emotions and behaviours that advertise and reinforce status are
encouraged. In low Power Distance societies (horisontal societies; Matsumoto, 1996)
employers and employees work closely together, have equal status (even when education
levels differ) and democratic practices are applied. Here, general predictions about the
experience and expression, and hence regulation, of emotion is largely concerned with who
is expected to and allowed to express which emotions to whom. The notion that in high
Power Distance cultures dominant strong emotions (e.g., anger and pride) will be expressed
by superiors to subordinates (which will, in turn, express submissive emotions, e.g.
appreciation, shame), has been confirmed in two studies (Bochner & Hesketh, 1994;
Mondillon, Niedenthal, Brauer, Rohmann, Dalle, & Uchida, 2005). In Japan, for example,
it is appropriate for a high status person to express anger to subordinates, as this emotion
implies high status and a threat to hierarchy (Matsumoto, 1990), whilst the inverse is
known to be deeply offensive in Japanese culture (Matsumoto, 1996). A very clear

59
influence of display rules is noted in this culture, as felt emotions by group members /
subordinates (anger, sad, afraid) will be controlled to maintain group harmony. Once again,
items containing the word ‘anger’ (“I find it easy to control my anger at work” and “At
work I experience strong emotions that are hard to control”) may be susceptible to cultural
bias depending on which group the respondent belongs to. Items that refer to emotional
regulation directed at group members, rather than members from other groups that imply a
Power Distance effect, may have better face validity and not be so prone to cultural bias.
However, often 360 degree versions of EI tests, in which subordinates rate their leader’s EI,
are based on self report measures. An item like “The person I am rating finds it hard to
convey anxiety to colleagues” may be susceptible to bias as a leader in a high Power
Distance environment will most probably not convey anxiety to subordinates.
3.3.2 Emotional expression
Although convincing evidence for the universality of posed and spontaneous facial
emotional expression in early cross-cultural studies has been found (Ekman & Friesen,
1971; Ekman, 1972; Friesen, 1972), the concept of display rules (Ekman, 1972) and the
neuro-cultural theory of emotion proposed by Ekman and Friesen (1969) served in
acknowledging the presence of cultural variation in emotional expression. For example, a
study by Pittam, Gallois, Iwawaki, and Kroonenberg (1995) recently reported agreement
amongst Australian and Japanese respondents regarding the cultural differences in emotion
expressivity (i.e. perceived expressivity of people of difference cultural backgrounds).
More specifically, Japanese were consistently rated as less expressive than Australians by
all subjects (Pittam, Gallois, Iwawaki, & Kroonenberg, 1995), providing confirmation of
previous reported cultural and ethnic differences in intensity ratings of emotion expressions
(Matsumoto & Ekman, 1989, Matsumoto, 1993; Scherer, Wallbott, Matsumoto, Kudoh,
1988). Recent evidence suggests, furthermore, that these cultural and ethnic differences
also hold in Irish and Scandinavian American immigrant groups (Tsai & Chentsova-
Dutton, 2003) with Irish Americans consistently being more facially expressive (when
asked to relive target emotions like happiness, love and anger), than their Scandinavian
counterparts.

60
Emotional expression appears in the Bar-On (2002) EI model in the Intrapersonal
subscale10
. A typical item is: “It’s hard to express my intimate feelings”. In the SUEIT,
emotional expression appears in the compound Emotional Recognition and Expression11
factor. Typical items include: “When I’m anxious at work, I find it difficult to express this
to my colleagues”, “I can portray how I’m feeling to colleagues through my body
language”, “Colleagues know when I’m worried”, and “I find it hard to convey my anxiety
to colleagues”.
Individualism / Collectivism
A study of the appropriateness of displaying emotions in different social situations
(individualistic versus collectivistic cultures), characterised by in-group (i.e., close family
and friends) and out-group (i.e., in public, casual acquaintances) members, was conducted
by Matsumoto (1990). Japanese subjects rated the display of anger to out-groups as more
appropriate than Americans. Americans, on the other hand, rated the display of disgust and
sadness to in-groups as more appropriate. To Americans, the display of happiness in public
was more befitting than to the Japanese. In general, items in EI tests tapping emotional
expression, refer to ‘others’, ‘other people’ or ‘colleagues’ (e.g. “It is hard for me to share
my deep feelings with others”) with no indication as to the relationship between the
expressor and perceiver. This may obscure effective measurement of emotional expression,
as respondents are not allowed to indicate when it is more appropriate to display / express
certain emotions to ‘others’ or ‘colleagues’. For example, if there is sufficient trust between
colleagues, then colleagues may become friends, view each other as part of an in-group,
and the expression of negative emotions within the American individualistic culture to
‘colleagues’ should be appropriate. For example, an item like “I can tell others when I am
angry with them” may then indicate effective emotionally intelligent behavior, which
should facilitate stress relief and lessen burnout. If the same scenario in Japanese culture
exists, it would not be deemed appropriate to display anger to friends (i.e. colleagues, the
in-group), rendering this item problematic. Hence, it is recommended that items of
10
The Intrapersonal subscales measures emotional self-awareness, as well as the ability to express feelings
and communicate emotional needs to others (Bar-On, 2002). 11
Emotional Recognition and Expression refers to the ability to identify one’s own feelings and emotional
states, as well as the ability to express those inner feelings to others (Palmer & Stough, 2001).

61
emotional expression should differentiate between in-group and out-group members to
more efficiently determine whether a respondent will appropriately display emotions (given
the cultural context) and subsequent emotionally intelligent behaviours.
3.3.3 Emotion recognition (judgment) in self and others
Classic studies in literate and preliterate cultures (Ekman & Friesen, 1971; Ekman, 1972;
Izard, 1971) provided evidence for the universality of the recognition of ‘basic’ emotions
(i.e. anger, disgust, fear, happiness, sadness, surprise) in facial expressions, at above-chance
accuracy. Critics of these studies have questioned the lack of ecological validity of the
stimuli used (Mesquita & Frijda, 1992) whilst others have focused on methodological
issues (e.g., use of forced choice repose formats; Russel, 1994). Others have argued that
cultural differences in the data of these original studies were overlooked as the interest of
the researchers was in exploring agreement, not disagreement (Matsumoto & Assar, 1992)
and therefore the examination of cultural differences in the same data has received more
attention recently (e.g. Mesquita & Frijda, 1992; Russel, 1994). For example, Huang, Tang,
Helmeste, Shioiri, and Smoeya (2001) report results (Japanese and Caucasian Facial
Expressions of Emotion photo set, Matsumoto & Ekman, 1988) that suggest major cross-
cultural differences between American and Asian viewers in identifying emotions from
static facial expressions, particularly when the posed emotion had negative consequences.
In addition, evidence for the cultural universality (Scherer, Banse, & Wallbott, 2001) and
differences (Van Bezooijen, Otto, & Heenan, 1983) in the recognition of emotions in vocal
affect has been reported. A recent meta-analysis by Elfbein and Ambady (2002) provided
compelling evidence to support an interactionist interpretation of emotional recognition.
Although evidence was found for the universality of certain core components of emotion,
evidence of an in-group advantage (i.e. understanding emotions more accurately when they
are expressed by members of the same national, ethnic or regional group) that accounts for
the cultural variability in emotion recognition was also reported. The meta-analysis was
based on the results of 97 studies (182 samples). More importantly, the results also suggest
that the, “…match between the cultural background of the expresser and judge is
important…” (Elfbein & Ambady, 2002, p.229) which is consistent with the theory of
cultural learning of emotional behaviour. Moreover, the in-group advantage was also noted

62
in groups that share the same native language (e.g., when English-speaking groups like
Scottish, Irish and New Zealanders judged the emotional expressions of Americans)
(Elfbein & Ambady, 2002).
Emotional recognition is a core facet of EI. It appears in the revised and refined Mayer and
Salovey model (1997) as ‘branch one’ termed Perception of Emotion (i.e. the ability to
perceive emotions in oneself and others, as well as in objects, art, stories and the like). In
the Bar-On (2002) model it appears in the Intrapersonal as well as the Interpersonal12
subscales, whilst being contained in the Emotional Recognition and Expression, as well as
Emotional Understanding13
factors in the SUEIT (Palmer & Stough, 2001). Items that tap
into different elements of emotional recognition (verbal and non-verbal) and that may be
influenced by an in-group advantage between the expressor and perceiver include: “It is
hard to determine how a colleague is feeling from their body language alone”, “I can tell
how a colleague is feeling by the tone of their voice”, “I can determine when a colleague’s
emotional reactions are inappropriate”, and “Colleagues’ facial expressions reveal a lot to
me about the way they are feeling”. Once again, it is important that the item content
explicitly differentiate between in- and out-group members.
Individualism / Collectivism
As there is strong evidence to suggest cultural differences in emotional expression,
differences in interpreting emotional displays is likely to exist between cultures. Some have
suggested that due to an inward focus in individualistic cultures, individuals tend to project
their feelings onto others. In contrast, in collectivistic cultures the ability to be aware of the
impact of one’s emotions on others is emphasised (Cohen & Gunz, 2002). Moreover, when
estimating the intensity of facial expressions, Japanese tend to rate weak expressions as
constituting of stronger underlying emotions than when Americans rate the same facial
expression (Matsumoto, Consolacion, Yamada, Suzuki, Franklin, & Paul, 2002). In
12
The Interpersonal subscales assesses the extent to which an individual is able to establish cooperative,
constructive, and satisfying interpersonal relationship as well as the ability to understand and appreciate the
feelings of others (Bar-On, 2002). 13
The Understanding Emotions subscale measures the ability to identify and understand the emotions of
others and those that manifest in response to workplace environments (e.g. staff meetings) (Palmer & Stough,
2001).

63
addition, they rate both happiness and negative emotions of lesser intensity than their
American counterparts (Matsumoto & Ekman, 1989). These findings have been interpreted
in the light of the effect of display rules (Matsumoto et al., 2005). Americans may be more
prone to trusting the authenticity of the display, whilst the Japanese are inclined to infer
from a weak expression that even though a person feels a strong emotion, they partly
inhibited it.
A recent study by Masuda et al., (2005) on Japanese and American university students,
report that social context affects the perceived intensity of facial expression. The results
revealed that the perceived intensity of facial expressions (e.g. a central figure in a picture
displaying anger) judged by Japanese (collectivist culture), were more influenced by the
social context of emotions (e.g. others in a picture showed to the respondent, also displayed
anger), than the perceived intensity of expressions judged by individuals from
individualistic cultures.
Items such as, “Colleagues’ facial expressions reveal a lot to me about the way they are
feeling” and “I can determine when a colleague’s emotional reactions are inappropriate”
may be susceptible to bias due to the effect of display rules and values embedded in
collectivistic versus individualistic cultures, as evidenced by the aforementioned studies. In
addition, the item “I’m good at understanding the way other people feel” might be biased as
Japanese will rarely describe themselves as ‘above average’, no matter how skillful they
actually are (Kalat & Shiota, 2007).
3.4 Cross-cultural EI research: methodological issues
3.4.1 Convergence of two approaches
Different terminology for the two distinct approaches, i.e. etic – emic, cultural-specific –
cultural general and cultural – cross-cultural, in the research of emotion across cultures are
often used. The increasing emergence of the interactionist perspective permeating recent
theoretical models (Matsumoto, 1989; Russel, 1994; Scherer & Wallbott, 1994) that
account for universality and cultural variation in particular aspects of emotion, concur that
both these strategies/approaches are important for advancement in the field. Mirroring these
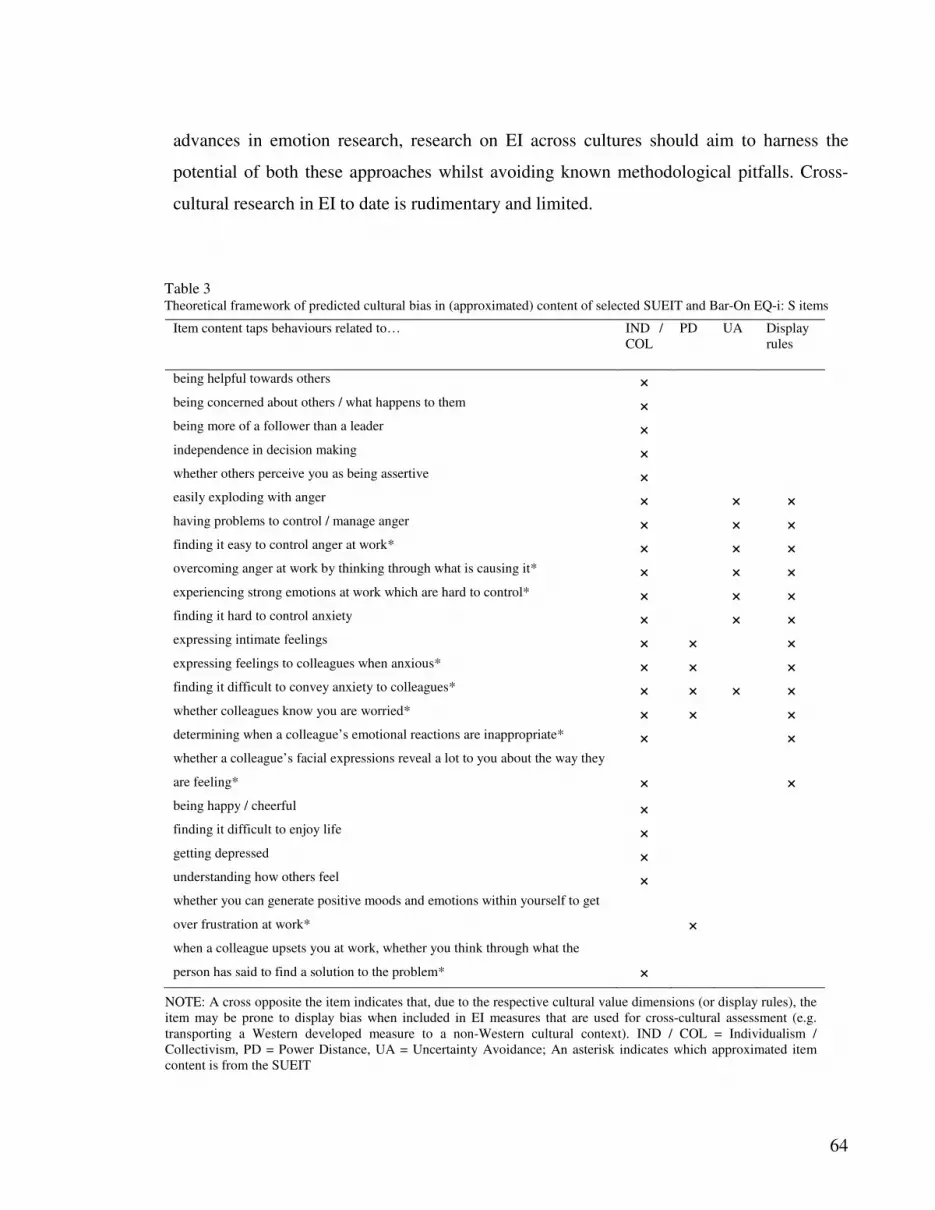
64
advances in emotion research, research on EI across cultures should aim to harness the
potential of both these approaches whilst avoiding known methodological pitfalls. Cross-
cultural research in EI to date is rudimentary and limited.
Item content taps behaviours related to… IND /
COL
PD UA Display
rules
being helpful towards others ×
being concerned about others / what happens to them ×
being more of a follower than a leader ×
independence in decision making ×
whether others perceive you as being assertive ×
easily exploding with anger ×
× ×
having problems to control / manage anger ×
× ×
finding it easy to control anger at work* ×
× ×
overcoming anger at work by thinking through what is causing it* ×
× ×
experiencing strong emotions at work which are hard to control* ×
× ×
finding it hard to control anxiety ×
× ×
expressing intimate feelings × ×
×
expressing feelings to colleagues when anxious* × ×
×
finding it difficult to convey anxiety to colleagues* × × × ×
whether colleagues know you are worried* × ×
×
determining when a colleague’s emotional reactions are inappropriate* ×
×
whether a colleague’s facial expressions reveal a lot to you about the way they
are feeling*
×
×
being happy / cheerful ×
finding it difficult to enjoy life ×
getting depressed ×
understanding how others feel ×
whether you can generate positive moods and emotions within yourself to get
over frustration at work*
×
when a colleague upsets you at work, whether you think through what the
person has said to find a solution to the problem*
×
Table 3 Theoretical framework of predicted cultural bias in (approximated) content of selected SUEIT and Bar-On EQ-i: S items
NOTE: A cross opposite the item indicates that, due to the respective cultural value dimensions (or display rules), the
item may be prone to display bias when included in EI measures that are used for cross-cultural assessment (e.g.
transporting a Western developed measure to a non-Western cultural context). IND / COL = Individualism /
Collectivism, PD = Power Distance, UA = Uncertainty Avoidance; An asterisk indicates which approximated item
content is from the SUEIT

65
Without such cross-cultural comparisons, psychological theory is confined to its own
cultural boundaries (Van de Vijver & Leung, 2001). In conducting cross-cultural EI
research, ethnocentrism in current EI theories (and associated measurement instruments)
may be reduced as the limitations of current theories are acknowledged, by seeking to
extend the data and theory through inclusion of other cultures (Berry et al., 2002). For
example, although scientific efforts addressing the matter of if and how EI can be
developed, is in infancy (e.g. Wong, Foo, Wang & Wong, 2007; Zeidner, Matthews,
Roberts, & McCann, 2003; Matthews, Roberts, & Zeidner, 2003) the utility of cross-
cultural knowledge to enhance our understanding in this EI domain, should not be
underestimated. If it is argued that more congruence (better fit) between personal and
cultural norms / beliefs enhance social interactions and adjustment (typical outcomes of
individuals with high EI) then a detailed understanding of how culture drives the norms of
emotionally intelligent behaviour (in a specific culture), is an essential basis for any
development intervention. This highlights the need for research studies on EI to be
conducted from within the cultural psychology framework. That is, where individual
behaviour (or psychology), and culture are viewed and studied as mutually constitutive
phenomena (Miller, 1997). Leung and Zhang (1995), for example, noted the need for
indigenous research and theorising, as well as research that integrates different cultural
perspectives as crucial to the establishment of more useful and universal psychological
theories.
3.4.2 Reframing bias and equivalence
Cross-cultural psychology holds the methodological ideal of transporting a procedure
established in one culture, with known psychometric properties, to one or more cultures
with the goal of making a cross-cultural comparison (Berry et al., 2002). The methodology
of the natural sciences is mirrored in these comparative studies, with the preference for
using standard instruments and a priori formulated hypotheses which is being tested in an
experimental or quasi-experimental fashion (Poortinga, 1997). However, the practice of
‘blindly exporting’ Western instruments to other cultures, without concern for the
appropriateness of the measures, could seriously impede theoretical advances (Cheung,
1996; Van de Vijver & Leung, 2001). In this chapter, various theoretical/conceptual

66
propositions that explore why current Western monocentered self report EI measures might
be susceptible to cultural bias, when exported to different cultures, have been suggested. As
discussed in chapter 2, bias (‘nuisance factors’) in data compromise the comparability
(equivalence) of scores across cultures (Van de Vijver, 2003). Traditionally, bias and
equivalence are treated, “… as dichotomous phenomena: data are biased or unbiased, and
our statistical analyses are geared at establishing which of the two possibilities applies”
(Van de Vijver & Leung, 2000, p. 47). However, this approach has impeded the
advancement of cross-cultural psychology. Future research should be aimed at the
quantification of bias and equivalence (Van de Vijver & Leung, 2000). In a similar vein,
Berry et al., (2002), for example, have noted that the uncovering of cultural bias should be
viewed as systematic information about cross-cultural differences, not to be equated with
measurement error.
The application of two strategies towards a more balanced treatment of bias and
equivalence is suggested (Van de Vijver & Leung, 2000). Firstly, suspected biasing factors
should be measured. For example, by including a social desirability measure together with
measures of the target construct in the design of a study, this type of bias may be confirmed
/ rejected. In addition, measuring contextual factors (i.e. including explanatory variables)
may assist in clarifying particular interpretations of cross-cultural differences. This
facilitates a movement away from post-hoc speculative unvalidated interpretations. A
second strategy is triangulation. Here bias is empirically scrutinised by explicitly applying a
monotrait-multimethod research design (Van de Vijver & Leung, 2000).
3.4.3 Applying measurement invariance in cross cultural EI research
In cross-cultural psychology, typical statistical techniques used to investigate structural
equivalence include Exploratory Factor Analysis, followed by target rotation and the
calculation of Tucker’s phi (Van de Vijver & Leung, 1997, Van de Vijver, 2003).
Obtaining evidence of structural equivalence allows the researcher to conclude that the
psychological constructs underlying the instrument, are identical (Van de Vijver & Leung,
1997). However, a less popular alternative is to utilise CFA, which allows for the testing of
a large set of hierarchically linked hypotheses of cross-cultural invariance (Van de Vijver &

67
Leung, 2001). More specifically, the use of multi-group CFA modeling (Jöreskog, 1971)
via Structural Equation Modeling (SEM) is especially functional and effective in
establishing cross-national measurement invariance (MI) (Steenkamp & Baumgartner,
1998). Here measurement equivalence (or invariance) is defined as the mathematical
equality of corresponding measurement parameters for a given factorially defined
construct, across two or more groups (Little, 1997).
More specifically, obtaining MI indicates that (Little, 1997, p.56):
“(1) the constructs under investigation are generalisable to each sociocultural context; (2) that the
least possible amount of sources of bias and error are present (e.g. cultural bias, translation errors); (3) it is
valid to assume that cultural influences have not impacted the construct’s underlying measurement features;
and (4) it is permissible to assess between-culture differences as mean-level, variance and covariance or
correlational effects.”
An increasing amount of researchers have applied measurement invariance procedures to
address aspects of the cross-cultural generalisability of psychological measures and their
associated models (e.g., Crockett, Shen, Randall, Russell, & Driscoll, 2005; Culhane,
Morera, & Watson, 2006; Riordan & Vandenberg, 1994) whilst others have focused on
conducting cross-group comparisons with ethnic groups or different nationalities (e.g.,
Darvasula, Andrews, Lyonski, & Netemeyer, 1993; Ghorbani et al., 2002) as the basis for
comparison, as opposed to gender or age (e.g., De Frias & Dixon, 2005; Gomez & Fisher,
2005).
With the recent resurgence of MI research, and increased application of the procedure, the
aim is often to uncover instrument invariance as a way to ensure that group differences on
the mean scores of a construct are meaningfully comparable. A different, and much less
frequent application of MI tests is applying it in a hypothesis testing context where a priori
conceptual and theoretical grounds (e.g., diversity in socio-cultural contexts) may be
identified as to why differences in psychological processes may exist (Vandenberg, 2002),
and using MI procedures to uncover such differences. For example, Cheung and Rensvold
(2002, p.252) recently argued that, “metric invariance…need not be seen merely as an
obstacle that must be surmounted before the equality of latent means can be assessed; rather
it should be seen as a source of potentially interesting and valuable information about how

68
different groups view the world…the same comment can be made with respect to any one
of the measurement invariance failures considered.” Therefore, in cross-cultural research
such an approach to MI testing requires that an absence of non-invariance should be
predicted a priori, based on the conceptual basis of differential cultural values (Chan,
2000), across the different groups that are being studied. This could be a powerful way to
explore the cultural specificity of a given psychological construct (e.g. EI), instead of
providing highly speculative, post hoc interpretations of why MI failed to hold over the
various groups under investigation.
In extending the use of MI tests as a hypothesis testing tool in the context of cross-cultural
research, the two studies that have attempted this (Cheung & Rensvold, 2000; Riordan &
Vandenberg, 1994) have been criticised for not operationalising the ‘trigger’ event - for
example, assuming that because a person belongs to a certain nationality, he or she
automatically prescribe to the national value system (e.g., US nationals prescribing to an
individualistic value system, Malaysian nationals prescribe to high Power Distance). As the
degree of prescription to these value systems was not directly operationalised the validity of
the results have been questioned (Vandenberg, 2002). However, it could be argued this is a
problem permeating almost all cross-cultural research. Recent empirical advances have
seen the development of individual level measures (Matsumoto, Weissman, Preston,
Brown, & Kupperbuscg, 1997; Triandis & Gelfand, 1998) and its related concept of
independent versus interdependent self-construals. However, individual level measures to
accurately measure the other dimensions of culture still need to be developed and should in
future be incorporated into studies as context variables to effectively unpack cross-cultural
comparisons (Matsumoto, 2004). Perhaps this limitation should be viewed through an
awareness that cross-cultural psychology, institutionalised in the 1960’s, is a relatively
‘young’ discipline (Jahoda & Krewer, 1997), with many methodological challenges still to
be resolved.
3.5 Conclusion
In this chapter current available cross-cultural EI research was reviewed. Weaknesses of
these studies were outlined. Attention was drawn to the need to examine cultural bias and
69
inequivalence in future culture-comparative EI studies. A review of key aspects of three
decades of emotions and culture research was presented. The possible influence of national
cultural value dimensions on EI operationalisation in a given culture (e.g. Western) was
outlined. The focus was on emotional regulation, expression and recognition as key aspects
of EI. Suggestions were made how cultures may differ on these aspects of EI. It was
argued that such differences may be a result of the fact that cultures differentially define
appropriate and adaptive emotionally intelligent behaviours. Hence, cultural differences in
values (e.g. Power Distance, Individualism) could introduce cultural bias into Western
cross-cultural EI measures when these are applied cross-culturally. Specific items were
predicted to be susceptible to cultural bias based on the item content which, for example,
taps some aspect of Individualism or Power Distance values. The presence of cultural bias
(construct, method or item bias) would express itself in the structural, metric or scalar
equivalence of the given instruments, when measures are transported from one culture (e.g.
Western) to another (e.g. non-Western). Hence, this chapter illustrated the need to
differentiate cultural bias from true construct variance when self-report measures of EI are
transported from one culture to another.
Chapter four will present empirical evidence of such an investigation that was conducted on
a self-report EI measure, the SUEIT (Palmer & Stough, 2001). Measurement invariance
procedures (SEM multi-group CFA analyses) were used to conduct the current
investigation. This dissertation illustrates how invariance research could be applied within a
cross-cultural research paradigm (as argued in section 3.4.3) to explicate cultural bias from
true construct variance, and better uncover the true nature of the EI construct over different
cultures.
70
CHAPTER 4
Cultural bias investigation of the SUEIT over various cross-national samples
4.1 Introduction
This dissertation investigated the generalisability and transportability of the SUEIT, a self-
report instrument for measuring EI (Palmer & Stough, 2001), to various samples
representing different national cultures. These national cultures have varying index scores
on the Hofstede (2001) cultural dimensions. Cultural bias could influence the
transportability of the instrument. The aim was to investigate various hypotheses regarding
construct, method and item bias over the different cross-national samples. In addition,
latent mean differences on the different dimensions of EI, across the cultural groups, were
also explored. The theoretical and practical implications of the results in the context of the
workplace are discussed.
4.2 Research questions and hypotheses
The central research question of this study can be formulated as follows: to what extent do
Hofstede (1980, 2001) cultural dimensions systematically influence the cross-cultural
transportability of self-report EI measures?
In chapter three it was argued that cultural context and value differences (e.g. Individualism
versus Collectivism, Power Distance, Uncertainty Avoidance) define the meaning of
behaviour in a given culture, and hence also associated reactions elicited with a given
psychometric test, that might render the scores derived thereof, inequivalent or culturally
biased (Berry et al., 2002).
Cultural distance (CD)1, a widely used construct in international business (e.g. foreign
investment expansion, entry mode choice), describes the extent to which cultures are
1 It should be noted that Shenkar (2001) has documented various problems related to the conceptual and
methodological properties of the cultural distance construct. For example, the assumptions of symmetry (in
distance), stability (over time), linearity (of impact on other variables) and causality have been discussed.
Problematic methodological properties include the assumption of corporate homogeneity (i.e. measures of
national culture implicitly assumes lack of corporate culture variance), the assumption of spatial homogeneity
(assuming uniformity within the national unit, whilst evidence suggests that intra-cultural variation explains

71
similar or different (Shenkar, 2001). Only three other studies have explicitly investigated
the effects of CD on psychometric test transportability. In 1986, Grubb and Ollendick
examined whether CD (i.e. sociocultural influences between major culture and subculture)
could account for group performance differences (Blacks and Whites) on IQ tests and
learning tasks. The results revealed that although both groups performed similar on the
learning tasks, differential performance was evident on the standardised IQ tests. The
authors proposed that this effect was due to the loading of cultural influences on the IQ
tests. In a subsequent analysis they demonstrated that, when cultural influences are
controlled for, differences in IQ performance were minimised.
More recently, Liu, Borg, and Spector (2004) and De Beuckelaer, Lievens and Swinnen
(2007) used Schwartz’s (1999) cultural theory to group countries in cultural regions and
test measurement equivalence (with multi-group CFA) of the data from the surveys within
and between these regions. Liu et al. (2004) reported high transportability of the German
Job Satisfaction Survey across countries with similar cultural and language backgrounds. In
addition they reported that in maximally dissimilar cultures (e.g. West Europe vs Far East)
a cultural distance effect on scale transportability was evident. The results from the De
Beuckelaer et al., (2007) study (over 25 countries), only partially supported Schwartz’s
theory. For example, evidence for scalar equivalence of the Global Organizational Survey
was only found in common English speaking regions. The results did not support the
hypothesis that more measurement equivalence would be evident among countries with
small cultural distances (i.e. groups in similar cultural regions), as opposed to those with
large cultural distance.
This research aimed at extending the limited work on the effect of CD on test
transportability by using the Hofstede (Hofstede, 1980, 2001) cultural dimensions
framework. In addition, this research is unique as it presents a CD ranking pattern in terms
of the dissimilarity between the host (e.g. Sri-Lanka) and home (e.g. Australian) countries
included in this study, to predict the effects on test transportability.
as much or more that inter-cultural variation), and the assumption of equivalence (not all cultural dimensions
are equally important in predicting outcome variables) (Shenkar, 2001).

72
Kogut and Singh operationalised CD by calculating a Euclidean distance in cultural value
dimensions between home and host countries (Kim & Gray, 2009). As is the norm, CD is
calculated in this study through an index (Kogut & Singh, 1988) from the Hofstede (1980,
2001) cultural dimensions. That is, a composite index was formed based on the deviation
along each of the four cultural dimensions (i.e. Power Distance, Uncertainty Avoidance,
Masculinity / Femininity, and Individualism / Collectivism) of each country (host country
where test is being used, e.g. Sri Lanka or South-Africa) from the Australian ranking (i.e.
home country where test was developed). Based on the Kogut and Singh (1988, p.422)
recommendation, “the deviations were corrected for differences in the variance of each
dimension, and then arithmetically averaged”. The index formula is as follows (Kogut &
Singh, 1988):
4
CDj = Σ {(Iij - Iia)2/Vi}/4,
i = j
where Iij stands for the index for the ith cultural dimension and jth country, Vi is the
variance of the index of the ith dimension, a indicates Australia, and CDj is cultural
difference of the jth country from Australia.
It is argued that CD will influence the transportability of the monocentered SUEIT. That is,
the more a particular culture is dissimilar to Australian culture (origin of the SUEIT) the
more pronounced the influence of culture will be on the transportability of the instrument –
and vice versa. Tables 4 - 6 present three calculations2 for CD from Australia, for the
cultures (countries) included in this study, based on the Hofstede dimensions (1980, 2001).
In addition, based on the CD results, a cultural distance ranking (CDR) pattern over all the
countries in terms of their cultural dissimilarity to Australia is provided. Two distinct
ranking patterns were identified. Pattern one (calculation based on all four Hofstede
dimensions) is presented in table 4. Pattern two (calculation based only on the Power
Distance and Individualism dimensions) is presented in table 5.
2 Due to the fact that no dimension scores were available for Sri Lanka (based on the original Hofstede study)
the Sri Lanka index scores were calculated by averaging the available scores of countries in the Southern Asia
cultural cluster (Malaysia, India, Philippines, Indonesia). Similarly, due to the fact that the SA non-White data
contained Coloured and African respondents, these dimension scores were calculated by averaging Black and
Coloured index scores obtained from the Sithole (2001) study.

73
Shenkar (2001) has noted that various studies have highlighted the fact that some cultural
dimensions might be more important than others, and that the aggregate CD measure may
provide false readings regarding meaningful cultural differences. For example, Kogut and
Singh (1988) themselves used Uncertainty Avoidance separately, in addition to the
aggregate CD index, in predicting choice of entry mode by foreign firms. Most of the
theoretical arguments, presented in chapter three, focused on the Individualism /
Collectivism, Power Distance and Uncertainty Avoidance dimensions. Hence, a separate
analysis for these three dimensions (in addition to all four cultural dimensions, table 4) was
conducted (table 6). The results revealed that the CDR pattern (1 = least dissimilar to
Australia, 6 = most dissimilar to Australia), was the same (i.e. pattern one) irrespective of
whether the three or four Hofstede dimensions were used. As expected, the smallest CD
was with the USA (CDR=1) and New Zealand (CDR=2), whilst the largest distance was
with Sri Lanka (CDR=6). The rankings of the other countries are less clear. SA White
(CDR=5) did not group with the other Anglo cultures. This may be due to the influence of
the extremely low Uncertainty Avoidance and Masculinity / Femininity scores in this
group. Conversely, SA non-White grouped with the Anglo cultures (CDR=3). This may be,
contrary to general beliefs, due to the fact that the Sithole (2001) study reported much
higher than expect Individualism scores for the African (Individualism / Collectivism = 73)
and Coloured (Individualism / Collectivism = 68) groups. This finding may be explained in
terms of social mobility theory (Cutright, 1968; Miller, 1960) which predicts that the
evolution of a Black middle class (due to the transformation of the SA society) may impact
the Black culture in moving from a collectivistic to individualistic cultural value
orientation.
However, another separate analysis was conducted for only Individualism / Collectivism
and Power Distance (table 5, CDR pattern two). This is because these two dimensions may
potentially be more important in the context of this study, in the light of the arguments put
forward in chapter three. The results revealed a different CDR pattern based on only these
two dimensions. A clear split between the strong individualistic / low Power Distance
Anglo cultures (USA: CDR = 1; New Zealand: CDR = 3; and SA White: CDR = 2) and
traditionally collectivistic / high Power Distance cultures (Sri Lanka: CDR = 6) and SA

Country
Cultural Dimension scores Difference squared / variance
CD
CDR PD UA IND / COL MAS / FEM PD UA IND / COL MAS / FEM
Australia 36 51 90 61 0 0 0 0 0 -
New Zealand 22 49 79 58 0.448 0.015 0.286 0.034 0.196 2
USA 40 46 91 62 0.036 0.099 0.002 0.003 0.035 1
Italy 50 75 76 70 0.448 2.301 0.464 0.310 0.881 4
SA White 42 22 78 21 0.082 3.360 0.341 6.134 2.479 5
SA non-White** 58 55 71 44 1.106 0.063 0.854 1.108 0.783 3
Sri Lanka* 88 42 30 54 6.182 0.323 8.525 0.187 3.804 6
Country
Cultural Dimension scores Difference squared / variance
CD
CDR PD IND / COL PD IND / COL
Australia 36 90 0 0 0 -
New Zealand 22 79 0.448 0.286 0.367 3
USA 40 91 0.036 0.002 0.019 1
Italy 50 76 0.448 0.464 0.456 4
SA White 42 78 0.082 0.341 0.211 2
SA non-White 58 71 1.106 0.854 0.980 5
Sri Lanka 88 30 6.182 8.525 7.353 6
Country
Cultural Dimension scores Difference squared / variance
CD CDR PD UA IND / COL PD UA IND / COL
Australia 36 51 90 0 0 0 0
New Zealand 22 49 79 0.448 0.015 0.286 0.250 2
USA 40 46 91 0.036 0.099 0.002 0.046 1
Italy 50 75 76 0.448 2.301 0.464 1.071 4
SA White 42 22 78 0.082 3.360 0.341 1.261 5
SA non-White 58 55 71 1.106 0.063 0.854 0.675 3
Sri Lanka 88 42 30 6.182 0.323 8.525 5.010 6
Table 4:
Cultural Distance calculated according to Kogut and Singh (1988) index based on all four Hofstede (1980, 2001) cultural dimensions (CDR pattern 1).
NOTE: PD = Power Distance; UA = Uncertainty Avoidance; IND / COL = Individualism / Collectivism; MAS / FEM = Masculinity / Femininity; CD = Cultural Distance; CDR =
Cultural Distance Ranking in terms of dissimilarity to Australia (1 = least, 6 = most);
Table 5:
Cultural Distance calculated according to Kogut and Singh (1988) index based on Individualism and Power Distance (Hofstede 1980, 2001) cultural dimensions (CDR pattern 2).
Table 6:
Cultural Distance calculated according to Kogut and Singh (1988) index based on Individualism, Power Distance and Uncertainty Avoidance (Hofstede
(1980, 2001) cultural dimensions (CDR pattern 1).
NOTE: PD = Power Distance; UA = Uncertainty Avoidance; IND / COL = Individualism / Collectivism; CD = Cultural Distance; CDR = Cultural
Distance Ranking in terms of dissimilarity to Australia (1 = least, 6 = most).
NOTE: PD = Power Distance; IND / COL = Individualism / Collectivism; CD = Cultural Distance; CDR = Cultural Distance Ranking
in terms of dissimilarity to Australia (1 = least, 6 = most).

75
non-White: CDR = 5) are supported by this result. Here it should be noted that even
though the SA non-White group has a relatively high Individualism score (71), it would
seem that traditional values in terms of Power Distance (e.g. respect for elders) still come
into play (second highest score on this dimension), even whilst there seems to be a move
towards Individualism in this group. For example, Sithole and Hall (2000) report that the
African culture of respect extends to business practices. That is, generally Africans extend
respect to those in authority (superiors), the elderly and visitors. “Africans avoid eye
contact with superiors as a sign of respect. They will give answers that they feel will please
strangers even when they are in complete disagreement” (Sithole, 2001, p. 20).
Three levels of bias have been introduced and discussed previously. These include:
construct, method and item bias (Van de Vijver & Leung, 1997). These three levels of bias
are related to three levels of equivalence (i.e. absence of bias).
More specifically: evidence for the presence of structural equivalence3 (i.e. a test measures
the same trait cross-culturally) indicates the absence of construct bias in the scores (Van
Herk et al., 2004). Item bias occurs when, “…one or a few items deviate from the
expectations about the response patterns in two cultural groups derived from other items in
the same instrument” (Van Herk et al., 2004, p.348) and is investigated with Item Response
Theory analyses. Chapter three contains the theoretical arguments related to specific items
in the SUEIT which could be susceptible to item bias based on the item content (table 3)4.
3 It should be noted that Cheung and Rensvold (2000) do not agree with this statement. According to them
(2000, p. 192), “…one type of noninvariance, known as construct bias (Van de Vijver & Poortinga, 1997)
cannot be detected statistically. Some constructs have wider scope in one culture that in another…a particular
set of items may be conceptually adequate for assessing a construct in one culture, inadequate in a second
culture, and yet display form invariance (structural equivalence) when compared using data from both
cultures.” Vandenberg (2002) alluded to a similar point in his article, Towards a further understanding of
measurement invariance methods and procedures, when he quoted personal communication with Rensvold on
this point. He admits, however, that in the absence of research evidence that have addressed this issue, it is not
know to what extent the “local nomological net” and strong presence of common method artifact as
characteristics of a given study, may influence the viability of MI testing procedures at this level. According
to Poortinga (personal communication, 2008) Cheung and Rensvold can be correct if only transported
measures are used. When measures of different societies are used, differences in representation almost
certainly should lead to differences in factor structures across cultures. 4 DIF may be ‘caused’ by numerous factors. These include cultural factors (e.g. ambiguities in interpretation,
low familiarity / appropriateness of item content, Van de Vijver & Tanzer, 2004) as well as other item
characteristics (e.g. item complexity or length, Budgell, Raju, & Quartetti, 1995). The framework of predicted
bias in specific SUEIT items is not an exhaustive list (presented throughout chapter three and in table 3). It

76
The MACS application (Chan, 2000) and 2-way analysis of variance (ANOVA) approach
proposed by Van de Vijver and Leung (1997) were used to uncover DIF in the SUEIT.
According to Van Herk et al., (2004) a lack of metric equivalence5 is likely due to method
bias. That is, the bias will affect most or all items to a similar extent, independent of the
construct studied. An example is an Acquiescence Response Style (ARS), which is also
known as agreement bias, i.e. a tendency to agree with questions, regardless of question
content (Johnson et al., 2005). Extreme Response Styles (ERS) is the tendency to use the
extreme ends of a rating scale (Cheung & Rensvold, 2000, Van Herk et al, 2000).
Demonstrating that a measure is free of ERS and ARS eliminates important alternative
explanations for observed cross-cultural differences. Finding between-group differences on
ERS or ARS needs, however, to be supported by the investigator’s understanding of the
research context6 (Cheung & Rensvold, 2000). According to Cheung and Rensvold (2000)
between group differences in ERS produce noninvariant factor loadings and intercepts that
can affect only a subset of items (nonuniform ERS) or all items (uniform ERS). ARS,
however, only influence intercepts. It can also be nonuniform and uniform. It is important
to note that testing for metric invariance can only uncover ERS. It cannot detect differences
in ARS. This is investigated by testing for intercept equality (scalar invariance).
Hamilton (1968) and Johnson, O’Rouke, Chavez, Sudman, Warnecke and Lacey (1997)
have provided some evidence to suggest that age and gender may be associated with
response artifacts (e.g. ERS). More recently, Johnson et al., (2005) reported significant age
and gender differences in ERS across 19 nations. In the current study, all the samples were
matched on age and gender. Hence, it could be argued that differences in ERS and ARS
could not be attributed to these two person-level background characteristics.
should be viewed as an illustration of examples of items that could be more prone to cultural bias. As the CD
with Australia increase (e.g. application of the SUEIT in Sri Lanka) more biased items should emerge. 5 Cheung and Rensvold (2000) note that Mullen (1995) refers to ARS as ‘scalar nonequivalence’. They hold
the view that cross-cultural ARS and ERS can be either nonuniform or uniform. Whereas Van Herk et al.
(2004) argue that a lack of metric invariance could be attributed to ARS or ERS or both (or even other forms
of method bias). Cheung and Rensvold (2000) hold a stricter view. According to them, lack of metric
invariance suggests differences in ERS. Lack of scalar invariance suggests differences in ARS. 6 This due to the fact that, “factorial noninvariance suggests but does not prove the existence of a between-
group difference in ERS” (Cheung & Rensvold, 2000, p. 199). The same is true for intercept noninvariance (it
suggests a between-group difference in ARS but cannot prove it).

77
Another form of method bias that could confound the MI results is the effect of
respondent’s verbal ability. For example, Marsh (1996) has demonstrated a negative
relationship between the observation of a negatively keyed item factor and verbal ability,
suggesting that individuals with less verbal skill may have difficulty reading negatively
keyed items, accurately, particularly those items with double negatives. Wong, Rindfleish,
and Burroughs (2003) have also identified cultural variability in the applicability of
reverse-worded Likert-type questions. They report such items to be problematic when
administered to East Asian, but not Western, populations. Gignac (2005) points out that the
vast majority of item level CFA analyses do not consider the possibility of item keyed
factors in the data. This might cause researchers to reject models due to unacceptable levels
of model fit, “despite the possibility that the only reason acceptable levels of model fit are
not achieved is simply because item keyed method factors were not modeled, in
conjunction with substantive factors” (Gignac, 2005, p. 165). Table 7 indicates in which
samples the influence of item keyed method effects will be investigated (positively and
negatively worded items). That is, samples in which respondents are bilingual and did not
complete the questionnaire in their mother tongue.
It should also be noted that, apart from ERS, ARS and the influence of verbal ability (i.e.
test language proficiencey) on the equivalence results, other forms of method bias (refer to
discussion in section 2.4.3) may also result in lack of metric invariance. That is, an absence
of ERS and ARS does not necessarily demonstrate absence of method bias, as these are not
the only forms of method bias. For the purposes of this study, however, it is proposed that
when a lack of metric invariance is found a first possible interpretation of this in terms of
method bias may be ERS or ARS (whichever is applicable) in samples where these
response styles are known to be a source of method bias (refer to table 7). This is because
method bias in this study may be viewed as a product of national (i.e. cultural) differences
in response styles. Hence, the measurement invariance results (metric invariance) will be
investigated further by calculating ERS and ARS indices for each of the samples per
subscale. The procedure and results are presented in section 4.5.6.

78
Australia, New Zealand, USA and the SA (White respondents) are categorised as Western
societies (GLOBE study, House et al., 2004). There is limited cultural variation between
these groups in terms of cultural dimensions (based on Power Distance and Individualism)
and hence the impact on the transportability of the instrument should be minimal. It is
hypothesised that construct, method and item bias would be low in these country results, as
opposed to countries / cultures more dissimilar to Australia. In addition, the presence of
method bias in these group results should be minimal as high Individualism (Hofstede,
1980) is associated with less ARS (Van Hemert et al., 2002) and not related to ERS
(Johnson et al., 2005). The only exception here may be the South African White data where
the influence of test completion in a second language may have resulted in method bias (see
table 7). However, even though limited cultural variation exists between these four
nationalities, the question of meaningful score comparability still needs to be addressed.
Hence, the configural and metric invariance of the SUEIT over these cross-national
samples was investigated.
Sri Lanka is a Southern Asian, non-Western society characterised by Collectivism and high
Power Distance. High Power Distance is associated with ERS (Johnson et al., 2005) and
more ARS7 (Van Hemert et al., 2002). Collectivism has also been found to be positively
related to ARS (Smith, 2004). All of the Sri Lankan respondents reported being bilingual,
having either Sinhala, Tamil or English as their first language. Hence, item keyed method
effects (as a source of method bias) may confound the measurement equivalence results.
This possible source of method bias will be investigated by modeling a measurement model
with positively and negatively keyed method effects as part of the SUEIT measurement
model.
All of the South African non-White respondents reported being bilingual. Method bias may
thus confound the MI results. Similar to the South African White and Sri Lanka analyses,
item keyed method effects will be investigated in this sample.
7 It should be noted that Johnson et al., (2005) found high Power Distance to be related to less ARS. This
finding was contrary to their expectations and hypothesis based on previous research findings reported here,
and in their study.

79
The possible effect of ERS, ARS and verbal ability on the cross-cultural comparisons
conducted in this study cannot be ignored. Table 7 provides an overview of the proposed
effect of ARS and ERS on the different cultures included in this study.
Culture Type of predicted method bias (based on previous research results)
ERS ARS Item keyed method effects
(Bilingual respondents)
SRI LANKA Yes (Sinhala, Tamil &
English)
Collectivistic n.a. Positively related (Smith,
2004)
High Power Distance Positively related
(Johnson et al, 2004)
Negatively related
(Johnson et al, 2004)
AUSTRALIA, USA, NEW
ZEALAND
No (English first
language)*
Individualistic Not related (Johnson et
al, 2004)
Negatively related
(Johnson et al., 2004)
-
Low Power Distance n.a. n.a.
ITALY No (answered
questionnaire in Italian)*
Individualistic Not related (Johnson et
al, 2004)
n.a. -
Moderate Power Distance n.a. n.a.
SA WHITE Yes (Afrikaans, English)
Individualistic Not related (Johnson et
al, 2004)
Negatively related
(Johnson et al., 2004)
Moderate Power Distance n.a. n.a.
SA NON-WHITE Yes (Afrikaans, Xhosa,
English)
Individualistic Not related (Johnson et
al, 2004)
Negatively related
(Johnson et al., 2004)
Moderate Power Distance n.a. n.a.
Based on previous research results, the influence of method bias in terms of ERS and ARS
should be the most pronounced in the Sri Lanka data. The presence of method bias due to
verbal ability may be most pronounced in the South African White, South African non-
White and Sri Lanka data. The opposing ARS influences in Sri Lanka (positively related to
Collectivism and negatively related to Power Distance) should, theoretically at least, cancel
each other out. In individualistic societies, ERS is not normally observed. Hence, only ARS
and negatively keyed item effect hypotheses regarding method bias will be proposed and
investigated.
Table 7:
Predicted method bias for each cultural group included in this study.
*NOTE: Respondents in these samples answered the SUEIT in their mother tongue

80
The following research questions and hypotheses are formulated:
Does construct bias influence the transportability of the SUEIT?
Hypothesis 1(a): The construct bias pattern of influence on the transportability of the
SUEIT will resemble CDR pattern 1 (described in tables 4 & 6).
Hypothesis 1(b): The construct bias pattern of influence on the transportability of the
SUEIT will resemble CDR pattern 2 (described in table 5).
Testing for configural invariance8 over the different sample groups allows for the
investigation of different degrees of structural equivalence9. It is proposed that better
configural invariance results will be obtained in cultures closer to Australian culture (e.g.
USA, New Zealand). Hence, the influence of construct bias on the transportability of the
SUEIT will be resembled in the fit indices obtained for each fully unconstrained multi-
group CFA analysis10
(e.g. Australia and USA, Australia and Sri Lanka) based on either of
the two proposed CDR patterns. That is, if only Power Distance and Individualism /
Collectivism are taken into account (table 5), the Australia and USA analyses will obtain
the best model fit, followed by the SA White, New Zealand, Italian, SA non-White, and Sri
Lanka multi-group results (pattern two), respectively. If all the Hofstede cultural
dimensions are taken into account (table 4), the multi-group fit results should resemble the
following pattern (from best to worse fit): USA, New Zealand, South Africa non-White,
Italy, South Africa White, and Sri Lanka (pattern one).
Does method bias influence the transportability of the SUEIT?
Hypothesis 2: Method bias (i.e. ERS) will have the most pronounced effect on the
transportability of the SUEIT when applied within the Sri Lankan sample.
8 The terms ‘configural invariance’ and ‘structural equivalence’ are used interchangeably in this study.
9 Structural equivalence was also investigated with the more traditional cross-cultural method of calculating
Tucker’s coefficient of agreement / Tucker’s Phi (Tucker, 1951). This coefficient has been developed to
indicate whether the pattern of factor loadings across items on a factor is the same across different groups.
According to Van de Vijver and Leung (1997) values below 0.90 point towards a lack of agreement, whilst
values higher that 0.95 are interpreted as evidence for the similarity of the factor matrices. Coefficients are
calculated separately for each subscale. In this study, a separate coefficient was calculated for each of the
SUEIT subscales for each of the separate countries, using Australia as the reference group. The results are
documented in appendix 4. Based on these analyses, no evidence of construct bias was evident. 10
This is the first step (i.e. testing for configural invariance) in die measurement invariance procedure
followed in this study (refer to section 4.3.2) for a more detailed discussion.

81
Hypothesis 3: Method bias (i.e. ERS) will not have an effect on the transportability of the
SUEIT when applied within the Australian, USA and New Zealand samples.
Hypothesis 4: Method bias (i.e. ARS) will have an effect on the transportability of the
SUEIT when applied within the Australian, USA and New Zealand samples.
Hypothesis 5: Method bias (i.e. ARS) will not have an effect on the transportability of the
SUEIT when applied within the Sri Lankan sample.
Hypothesis 6: Method bias (i.e. due to verbal ability / bilingualism of respondents) will
have the most pronounced effect on the transportability of the SUEIT when applied within
the Sri Lankan, South African White and non-White samples.
Systematic differences in response styles between countries may distort the validity of
cross-cultural comparisons. The investigation of hypotheses 2 – 6 would indicate the extent
to which method bias (i.e. due to verbal ability / bilingualism of respondents) may be
misconstrued as substantive differences in the latent construct (EI), when the SUEIT is used
for cross-cultural assessment. The results would also inform on the extent to which cultural
driven response styles (e.g. ARS or ERS) is a source of method bias in the current data.
Does item bias influence the transportability of the SUEIT?
Hypothesis 7: As the CD from Australia increases (i.e. CDR patterns 1 or 2), the higher the
probability that more biased items will emerge over the respective sample groups (e.g. least
number of biased items over the Australia and New Zealand / USA analyses, most with the
Australian and Sri Lanka analysis).
When subscale scores can be meaningfully compared11
across different cultures
(countries), do significant latent mean differences in emotional expression and regulation
as key aspects of emotionally intelligent behaviour exist over cultures (countries)? Are the
expected differences (i.e. significance and direction) congruent with theoretical arguments
in this regard?
The MACS DIF procedure (Chan, 2000) that was utilised to investigate item bias over the
various cultural groups (with Australia as the reference group) is described in section 4.3.4
11
That is, valid direct between groups comparisons are allowed.

82
(conducted with LISREL 8.8). For each series of analyses, the final outcome of the iterative
model fitting procedure was a partially constrained model for each of the multi-group
comparisons with Australia, in which the flagged item’s slopes and intercept equality
constraints were lifted (i.e. allowed to be freely estimated over the two groups). If at least
two item slopes and intercepts were found to be invariant (Hair et al., 2006) over the two
cultural groups, then partial metric and scalar invariance was assumed to exist. Hence,
latent mean differences for the given EI dimensions (subscale) could be estimated (based
on the partially constrained model with Australia as the reference group). This was done by
operationalising values for the means of the latent constructs (e.g. Emotional Expression,
Emotional Control). SEM programs like LISREL compare means only in a relative sense
(Hair et al., 2006). Hence, the vector of latent construct means (contained in the kappa
matrix) has to be fixed to zero in one group (Australia) to identify the model. The latent
mean is then freely estimated in the second group and the resulting value is interpreted as
how much higher or lower the latent construct mean is in the second group (e.g. New
Zealand, Italy) relative to the first group (Australia).
Theoretical arguments for expected latent mean differences on emotional regulation
(management and control) and expression is based on cultural value dimension differences
(for a summary, refer to table 8). For example, in individualistic cultures emotion norms
encourage emotions signaling independence, authenticity and assertiveness (Triandis,
1994). In turn, Collectivism stresses emotion norms that promote emotions that signal
interdependence and endorse harmonious relationships (e.g., sympathy), as opposed to
prescribing concealments of emotions that may impede relationships with others (e.g.,
anger, pride). Hence it may be argued that Sri Lanka as a collectivistic society will obtain
higher latent construct means on Emotional Management and Emotional Control and a
lower Emotional Expression latent construct mean, relative to Australia. On the other hand,
it is predicted that no significant differences in latent construct means will exist for similar
individualistic, low Power Distance societies like the USA and New Zealand, when latent
mean differences are estimated relative to Australia (individualistic society). Countries that
score high on the Uncertainty Avoidance dimension (e.g., Italy; Hofstede, 2001) tend to be
more expressive cultures. In such cultures it is socially acceptable to express emotions, as

83
anxiety is released through the showing of emotions through which society has created
outlets (Hofstede, 2001). It is, therefore, proposed that Italy will obtain a higher latent mean
on Emotional Expression and lower mean on Emotional Management and Emotional
Control, relative to Australia (lower / moderate Uncertainty Avoidance).
The following hypotheses12
regarding latent mean differences for three of the EI subscales
(Emotional Control, Emotional Management Self, and Emotional Expression) are
formulated:
Hypothesis 8: Sri Lanka as a Collectivistic, high Power Distance non-Western society will
obtain a significant higher latent mean score on Emotional Control than Australia, an
Individualistic, low Power Distance Western society.
Hypothesis 9: Sri Lanka as a Collectivistic, high Power Distance non-Western society will
obtain a significant higher latent mean score on Emotional Management Self than
Australia, an Individualistic, low Power Distance Western society.
Hypothesis 10: Sri Lanka as a Collectivistic, high Power Distance non-Western society will
obtain a significant lower latent mean score on Emotional Expression than Australia, an
Individualistic, low Power Distance Western society.
Hypothesis 11: Italy, as an Individualistic, high Uncertainty Avoidance society, will obtain
a significant lower latent mean score on Emotional Management Self than Australia, an
Individualistic, moderate Uncertainty Avoidance Western society.
Hypothesis 12: Italy, as an Individualistic, high Uncertainty Avoidance society, will obtain
a significant lower latent mean score on Emotional Control than Australia, an
Individualistic, moderate Uncertainty Avoidance Western society.
Hypothesis 13: Italy, as an Individualistic, high Uncertainty Avoidance society, will obtain
a significant higher latent mean score on Emotional Expression, than Australia, an
Individualistic, moderate Uncertainty Avoidance Western society.
12
These hypotheses are formulated based on the theoretical arguments presented here and in chapter three.
This is not an exhaustive list of possible influences. Rather, only the strongest arguments are presented here
(i.e. where there are high / low differences in cultural dimension scores). However, latent mean differences
will be estimated and discussed for all the separate subscales over all the different countries (with Australia as
the reference group). The relative simplicity of these arguments is acknowledged as it is possible that an
interaction effect between the different cultural dimensions could have an opposing effect in determining
what is deemed to be emotionally intelligent behaviour in a given culture. No hypotheses are formulated for
the SA non-White group due to the moderate standing on the Power Distance and uncertainty avoidance
dimensions.

84
Hypothesis 14: There will not be significant latent mean score differences on the Emotional
Management Self, Emotional Control and Emotional Expression subscales between the
USA and Australia, as similar Western societies.
Hypothesis 15: There will not be significant latent mean score differences on the Emotional
Management Self, Emotional Control and Emotional Expression subscales between New
Zealand and Australia, as similar Western societies.
Hypothesis 16: South Africa White, as an Individualistic, low Uncertainty Avoidance
society, will obtain a significant lower latent mean score on Emotional Expression, than
Australia, an Individualistic, moderate Uncertainty Avoidance Western society.
Hypothesis 17: South Africa White, as an Individualistic, low Uncertainty Avoidance
society, will obtain a significant higher latent mean score on Emotional Control, than
Australia, an Individualistic, moderate Uncertainty Avoidance Western society.
Hypothesis 18: South Africa White, as an Individualistic, low Uncertainty Avoidance
society, will obtain a significant higher latent mean score on Emotional Management Self,
than Australia, an Individualistic, moderate Uncertainty Avoidance Western society.
Cultural group Emotional Control Emotional
Management Self
Emotional
Expression
SRI LANKA**
Collectivistic (30) Higher Higher Lower
High Power Distance (88) Higher Higher Lower
Moderate Uncertainty Avoidance (42) - - -
USA
Individualistic (91) No sig. difference No sig. difference No sig. difference
Low Power Distance (40) No sig. difference No sig. difference No sig. difference
Moderate Uncertainty Avoidance (46) - - -
NEW ZEALAND
Individualistic (79) No sig. difference No sig. difference No sig. difference
Low Power Distance (22) No sig. difference No sig. difference No sig. difference
Moderate Uncertainty Avoidance (49) - - -
ITALY
Individualistic (76) No sig. difference No sig. difference No sig. difference
Moderate Power Distance (50) - - -
High Uncertainty Avoidance (75) Lower Lower Higher
SA WHITE
Individualistic (78) No sig. difference No sig. difference No sig. difference
Low Power Distance (42) No sig. difference No sig. difference No sig. difference
Low Uncertainty Avoidance (22) Higher Higher Lower
SA NON-WHITE
Individualistic (71) No sig. difference No sig. difference No sig. difference
Moderate Power Distance (58) - - -
Moderate Uncertainty Avoidance (55) - - -
Table 8
Predicted latent mean differences for each cultural group (relative to Australia*) on three SUEIT subscales,
based on Hofstede (1980, 2001) cultural dimensions (dimension scores indicated next to each dimension)
NOTE: *Dimension scores for Australia are Individualism (90), Power Distance (36), and Uncertainty Avoidance
(51). **The influence of display rules may also contribute to latent mean differences here (i.e. higher Emotional
Control, Emotional Management Self and lower Emotional Expression).

85
4.3 Data analytic strategies
4.3.1 Validity extension and generalisation
Validity generalisation refers to the process of identifying the best fitting baseline model
from a set of competing alternatives that replicated best across different populations
(Diamantopoulos & Siguaw, 2000). The validity generalisation procedure entails fitting
competing measurement models (e.g. five or seven factor structures) with a loose
replication strategy (validity extension) (Bentler, 1980). Hence a series of single group
CFA analyses to fit the original SUEIT five factor structure (Model 1, M1) (Palmer &
Stough, 2001), a seven factor (Model 2, M2), a modified five factor (Model 2a, M2a), as
well as a nine factor structure (Model 3, M3) (Gignac, 2005) on all the data included in this
study, was conducted (see table 11). The results of all the comparisons to identify the best
fitting baseline model (needed for the invariance analyses), are reported in sections 4.5.1
and 4.5.2.
4.3.2 Tests of MI: omnibus, configural, and metric tests of invariance
Once the best fitting baseline model has been identified (over all the groups) the next step
was to investigate the measurement invariance of the full instrument. The reason for these
analyses was twofold. First, the results would provide information on the level of
equivalence / invariance (i.e. configural, and/or metric) or lack thereof, over the various
countries (cultures) included in this study (with Australia as the reference group). A lack of
configural invariance would point towards construct bias. A lack of metric invariance could
point towards method bias. The practical implications of equivalence / invariance (or lack
thereof) will be discussed (i.e. the transportability of the instrument), in the light of the
current practice of using the measure in different cultures / countries. Secondly, the pattern
of invariance (or lack thereof) over all the countries (with Australia as the reference group)
will be interpreted in terms of the influence of CD on the transportability of the instrument.
For example, based on the CDR presented in tables 4 and 5, it is predicted that the USA
would obtain the highest level of equivalence and Sri Lanka the lowest.
The Vandenberg and Lance (2000) approach to MI was followed. First, the omnibus test for
the equality of variance-covariance matrices (Vandenberg & Lance, 2000), with the

86
condition that all parameter estimates are set to be equal across samples, is conducted. If
the null hypothesis (Σg = Σ
g’) of exact fit for the fully constrained model cannot be rejected,
MI is established. No further tests are necessary. If this is not the case a test of configural
invariance (“factor structure equivalence”, Hair et al., 2006; “weak factorial invariance”,
Horn & McArdle, 1992) is conducted next (fully unconstrained model). This model serves
as the baseline model for further analyses. That is, a series of nested models is compared
against it, using the chi-square difference test (Hair et al., 2006; Vandenberg & Lance,
2000). Establishing configural invariance provides evidence that the conceptualisation of
different constructs in different groups is the same (absence of construct bias), to the extent
of the data supporting the same number of factors and similar items associated with each
factor (Meredith, 1993). Configural invariance must be established in order for subsequent
tests to be meaningful (Byrne et al., 1989; Hair et al., 2006; Vandenberg, 2002). Failure to
establish configural invariance might point towards the level of abstraction of the measured
construct and more specifically to the fact that the perceptions of a particular construct
might be implicitly embedded in the cultural context of the respondents (Tayeb, 1994).
Moreover, it could also be argued that different groups attach disparate meanings to
different constructs; henceforth the manifest measures evoke different conceptual frames of
reference in each of the comparison groups (Riordan & Vandenberg, 1994; Vandenberg &
Lance, 2000).
After conducting the test of configural invariance, metric invariance13
is mostly advocated
as the next step (Byrne et al., 1989; Ghorbani et al., 2002; Hair et al., 2006; Steenkamp &
Baumgartner, 1998; Vandenberg & Lance, 2000). This test is effected by constraining the
factor loading of like items to be equal across groups (Steenkamp & Baumgartner, 1998;
Vandenberg & Lance, 2000). Some argue that full metric invariance is a rigorous test in
most contexts (Cheung & Rensvold, 2002; Hair et al., 2006; Horn, 1991).
13
Cheung and Rensvold (2002) distinguish between construct-level metric invariance [HΛ] and item-level
metric invariance [Hλ]. Construct-level metric invariance (i.e. the full metric invariance procedure conducted
in this study) exists when empirical evidence for the invariance of the overall strength of the relationship
between items and their underlying constructs over different groups, is obtained. Investigating item-level
metric invariance will uncover whether the strength of the relationship between each item and its underlying
construct is the same over the different groups. Here the authors indicate that a series of Hλ hypotheses can be
tested in order to detect the items causing overall noninvaraince (i.e. testing for partial invariance). To
investigate item-level metric invariance, the MACS DIF procedure of Chan (2000) was utilised (refer to
sections 4.4.4).

87
Hence, Byrne et al. (1989) proposed the approach of establishing partial invariance14
. For
the purposes of this study, however, full construct-level metric invariance (not partial
invariance) was investigated to provide insight into the practical implications of using the
SUEIT as a multidimensional EI measure in different cultural contexts.
Only if evidence of full (or at least partial) metric invariance is found, may scalar
invariance (full or partial) be investigated (Cheung & Rensvold, 2002; Steenkamp &
Baumgartner, 1998; Vandenberg & Lance, 2000). Scalar equivalence (also referred to as
“strong factorial invariance” by Meredith, 1993) exists when the intercept terms for each
measured variable are found to be invariant between different groups (Hair et al., 2006;
Vandenberg & Lance, 2000). It signifies that cross-national differences in the means of the
observed items may indeed be attributed to differences in the means of the underlying
construct(s) (Steenkamp & Baumgartner, 1998). Scalar invariance may only be investigated
if full metric invariance was found.
The following series of research questions will be investigated over all the countries, with
Australia as the reference group:
14
The reasoning underlying partial invariance is that for some, but not all manifest measures, invariance
restrictions may hold – hence the practice of relaxing invariance constraints where they do not hold, is
employed to control for partial measurement inequivalence. Hair et al. (2006, p. 823) specify that the level of
partial invariance needed to enable sufficient comparisons of relationships between groups, “… requires that
at least two loading estimates for each construct be equal between groups”. However, Vandenberg and Lance
(2000) recommend a rather conservative approach in executing partial invariance (e.g. relaxing constraints on
a strong theoretical basis as possible, only for a minority of indicators). Their relative modest endorsement of
this practice are well substantiated by evidence (cited in their review) that there seems to be a fair amount of
inconsistency in the application of statistical criteria for relaxing metric invariance constraints, leaving them
to conclude that the practice of invoking partial invariance constraints (up to the date of their review), “…has
been an exploratory, iterative, post hoc practice, and so it is subject to capitalisation on chance” (Vandenberg
& Lance, 2000, p. 37). Steenkamp and Baumgartner (1998) acknowledge that empirically driven model
respecification in the pursuit of testing for partial invariance should at all times be approached prudently.
They do propose that expected parameter changes (EPCs) and modification indices (MI) can be used in this
regard. They provide general guidelines for applying this technique. Critics of these practices (i.e.
investigating partial measurement invariance) argue that such models might not prove true invariance, even
suggesting that different inferences about group differences on latent means and variance may be generated
because of the different ways in which the model would be identified (e.g. Widaman & Reise, 1997).

88
Does the measurement model with the best generalisation potential display acceptable fit
on the data of the samples when fitted in a single multi-group confirmatory factor analysis
without any constraint on parameter equality (configural invariance)?
Does the measurement model with the best generalisation potential display acceptable fit
on the data of the samples when fitted in a single multi-group confirmatory factor analysis
with all freed parameters to be constrained equal (omnibus test – full measurement
invariance)?
Are the factor loadings of all the items invariant across the samples (full metric
invariance)?
Are the factor intercepts of all the items invariant across the samples (full scalar
invariance)?
4.3.3 Investigating method bias
To strengthen the finding that an absence of MI over the cultures may be attributed to
cultural differences between the groups studied, method bias (i.e. ERS and ARS response
styles, the effect of verbal ability on the structural equivalence results) will be investigated.
Two strategies will be followed here. First, ERS and ARS response indices will be
calculated to investigate response styles. Secondly, a series of CFAs with the purpose of
identifying possible method effects associated with item keying, will be conducted. If
evidence of method effects, i.e. method bias, is evident, the MI results, and conclusions
based on these results will be interpreted in light of these findings.
The SUEIT was translated into Italian (and back translated into English) before it was
administered to the Italian respondents. The instrument was administered in English (the
original language it was developed in) in all the other samples. However, as English might
be the second or third language of the majority of the respondents in the Sri Lanka and
South African datasets, the effect of method bias due to answering the questionnaire in a
second or third language, will be assessed over these groups.
South Africa has 11 national languages even though English is generally acknowledged as
the business language of the country (Sithole, 2001). Table 9 provides an overview of the

89
different languages and percentage of the population that converse in a given mother
tongue. The three languages mostly spoken in the Western Cape region (where the South
African data was collected) include Afrikaans, Xhosa and English. All of the respondents in
the South African samples (White and non-White) reported that they were bilingual. The
non-White respondents generally reported having Afrikaans or an African language as their
first language, with English as a second language. The White South African respondents
mostly have Afrikaans as a first language and English as a second language15
.
The three major languages spoken in Sri Lanka are Sinhala, Tamil and English. All of the
respondents in the Sri Lanka sample indicated that they were bilingual (i.e. they have either
Sinhala or Tamil as a first language and English as second language). However, when
asked to indicted which language they mostly converse in at work, 275 respondents
(46.5%) indicated that they mostly speak English, 188 respondents (31.8%) Sinhala, and 40
respondents (6.8%) indicated that they speak both languages (84 missing, 14.3%).
Language Total Population Percentage of Population
Afrikaans 5 811 547 14.4
English 3 457 467 8.6
IsiNdebele 586 961 1.5
IsiXhosa 7 196 118 17.9
IsiZulu 9 200 144 22.9
Sepedi 3 695 846 9.3
Sesotho 3 104 197 7.7
SiSwati 1 013 193 2.6
Setswana 3 301 774 8.3
Tshivenda 876 409 2.2
Other / Unspecified 1 866 844 4.6
Total 40 583 573 100.0
15
It should be noted that any self-report data regarding language in South Africa should be viewed with a
measure of caution. The language spoken by a particular subculture was often linked to the apartheid era
population group classification. Even within the post-apartheid context, for many ethnic groups the Afrikaans
language still bears the legacy of the apartheid regime (Wallis & Birt, 2003). For example, most Cape
Coloured individuals would converse mostly in Afrikaans, but when asked to report on their first language,
would indicate English. Due to this, it was decided to defer language group from the ethnic group information
(i.e. White South Africans is mostly Afrikaans speaking, and non-White respondents, i.e. Coloureds and
Africans mostly speak Afrikaans or an African language). In addition, the main rational underlying the
method bias analyses for language was that when a bilingual person answers a questionnaire in a second
language (only 8% of the South African population has English as a first language, refer to table 9) they may
have difficulty reading and understanding negatively keyed items, which could result in method bias and
influence test results.
Table 9
South African home languages (South African Department of Census and Statistics, 2001)

90
In order to investigate the effect of verbal ability / language proficiency on the structural
equivalence results, a model with negative and positively keyed method factors (M2b) was
fitted to the data of the countries with bilingual respondents (SA and Sri Lanka). The
procedure described in Van Herk et al., (2004) (refer to section 4.5.6) was used to compute
the ERS and ARS indices so as to investigate the prevalence of these response styles in the
different samples (cultural groups).
4.3.4 Investigating Differential Item Functioning (DIF)
As discussed in section 2.4.4, DIF refers to analyses that identify items for which members
of different subgroups with identical total test scores (or identical estimated true scores in
Item Response Theory, IRT, models) have a differing item performance. Two approaches
to investigate DIF were utilised. A similar pattern in the results was expected.
First, the 2-way analysis of variance (ANOVA) approach proposed by Van de Vijver and
Leung (1997) for detecting item bias was applied on all the items and datasets. This
approach is traditionally used in cross-cultural research. Second, a procedure for applying a
series of MACS models (Sörbom, 1974) was utilised to detect DIF. The procedure as
outlined by Chan (2000, pp. 180 - 182) is summarised in table 10.

91
4.4 Method
4.4.1 Measure: Swinburne University Emotional Intelligence Test (SUEIT, Palmer &
Stough, 2001)
A significant contribution to EI theory development was the development of a self-report
measure of EI for use in the workplace by researchers Palmer and Stough (2001). The
realisation that other models (e. g. Mayer et al., 2000; Bar-On, 1997, Goleman, 1998) of EI
share considerable overlap in both their theoretical content and structure led to the
execution of a factor analytic study to uncover the most definitive dimensions of the
construct. The authors included six of the most prevalent EI measures at the time, namely
Checking assumptions:
(1) Test assumption of uni-dimensionality of subscales by conducting a multiple-group CFA for each subscale,
allowing factor loadings and item intercepts to vary freely
(2) Conduct preliminary EFA and identify item with highest factor loading within each group (over all the groups)
Set of constraints imposed, includes:
(3) Identify reference indicator item and set loading to 1.0
(4) Set factor mean in first group fixed to 0 and allow factor mean in second group to always be freely estimated
(5) Always constrain reference indicator intercepts to be equal across both groups
(6) Always freely estimate the factor variance in all models in both groups
(7) Always freely estimate error variances in all models in both groups
Generic iterative model-fitting strategy:
(1) Fit fully constrained model (factor loadings, item intercepts constrained to be equal across groups)
(2) Flag items displaying DIF by examining size of MI (use chi-square tables to determine statistical significance of
MI value at a selected alpha value)
(3) Use Bonferonni correction to select alpha value at each step of iterative procedure
(4) Split sample and do validation procedure
Detecting non-uniform DIF (differential item discrimination across groups)
(1) Examine MI associated with factor loadings
(2) Identify largest significant MI value
(3) Remove between-group equality constraint on the flagged item’s factor loading
(4) Refit model whilst allowing flagged item to freely vary across groups
(5) Continue iterative procedure until largest MI associated with factor loading is no longer significant
Detecting uniform DIF (item difficulty parameter differs across groups)
(1) Examine MI associated with item intercepts
(2) Identify largest significant MI value
(3) Remove between group equality constraint on the flagged item’s intercept
(4) Refit model whilst allowing flagged item to freely vary across groups
(5) Continue iterative procedure until largest MI associated with item intercept is no longer significant
Confirm DIF of set of flagged items
(1) Estimate model with item parameters (i.e. factor loadings and factor intercepts) of flagged items freely
estimated, whilst fixing remaining item parameters to be equal across groups
(2) Compare with “fully constrained” model in which all item parameters (factor loadings and intercepts) were
constrained to be equal across groups
(3) Evaluate difference in model fit between two nested models (with a significant difference in model providing
support for the presence of DIF on the items that were flagged by the MI values in the iterative procedure).
Table 10
MACS procedure to test for DIF (Chan, 2000)
NOTE: Response on items using a polytomous ordered response format such as the Likert rating scales (used in the
SUEIT) are considered to be approximations of responses on a continuous line for the purposes of this procedure.

92
the MSCEIT (Mayer et al., 2000), the EQ-i (Bar-On, 1997), the TMMS (Salovey et al.,
1995), the TAS-20 (Bagby, Taylor & Parker, 1994), the scale by Schutte et al. (Schutte et
al., 1998) and the scale by Tett et al. (Tett et al., 1997). The result was an empirically-based
model of EI consisting of five factors (that account for 58% of the variance), (1) Emotional
Recognition and Expression (the ability to identify one’s own feelings and emotional states,
and the ability to express those inner feelings to others, sample item, “I can portray how I
am feeling to others through my body language”); (2) Understanding Others’ Emotions (the
ability to identify and understand the emotions of others and those that manifest in response
to workplace environments, staff meetings, artwork etc., sample item: “I can tell how
colleagues are feeling at work”); (3) Emotions Direct Cognition (the extent to which
emotions and emotional knowledge are incorporated in decision making and/or problem
solving, sample item: “My moods and emotions help me generate new ideas”); (4)
Emotional Management (the ability to manage positive and negative emotions within both
oneself and others, sample item: “I generate positive moods and emotions within myself to
get over being frustrated at work”); and (5) Emotional Control (how effectively emotional
states experienced at work, such as anger, stress, anxiety and frustration, are controlled,
sample item: “When I am anxious I can remain focused on what I am doing”).
Good internal consistency and test-retest reliability properties of the SUEIT have been
recorded in recent research (Gardner & Stough, 2002; Palmer, Gardner & Stough, 2003). In
terms of internal consistency, the SUEIT subscales have all been reported to have adequate
internal consistency, ranging from 0.70 for the Emotions Direct Cognition subscale to 0.91
for the Emotional Recognition and Expression subscale (Palmer et al., 2003). It has
furthermore been found that the SUEIT have high test-retest reliability over a one month
period with stability coefficients ranging from a low of 0.82 for the Emotional Recognition
and Expression subscale to a high of 0.92 for the Understanding Emotions subscale (Palmer
& Stough, 2001). Palmer et al., (2003) report a positive manifold of correlations between
the SUEIT subscales (average r = .32, p<.05), ranging from a low of r = 0.15 between the
Emotions Direct Cognition and Emotional Control subscales, to a high of r = 0.56 between
the Emotional Management and Emotional Control subscales. The authors conclude that

93
these correlations suggest that the sub-scales are distinct yet related facets, suggesting that
the SUEIT is measuring a unifactorial construct of EI.
4.4.2 The SUEIT measurement models
The measurement models that were tested consisted of the 64 measured variables (Xs), the
five (M1) (Palmer & Stough, 2001) / seven (M2) (Stough, personal communication, 2007) /
nine (M3) (Gignac, 2005) unmeasured latent factors (ξs), with single-headed arrows from
the ξs to Xs representing the proposed regression of the observed variable onto the latent
factors (λs). The latent factors were specified to be intercorrelated16
. Cross-loadings of
indicators across factors were not allowed in the model. In addition, one item with the
strongest loading on the respective scale (reference variable) was set to 1.0 to specify the
scale of each latent variable17
.
The exogenous 7 factor measurement model underlying the SUEIT (Stough, personal
communication, 2007) is graphically depicted in figure 1.
Based on the individual CFA results (for measurement models M1 – M3) reported below, a
modified five factor measurement model (M2a, the seven factor model without the EDC
and ER subscales18
) was proposed and tested as the model with the best validity
16
The theoretical reasoning for allowing this intercorrelation was threefold. First Emotional Management
Self, Emotional Management Others and Emotional Control reflect a common management of emotions facet
of EI. Secondly, Emotional Management Others and Understanding Emotions External both pertain to the
external. That is, the management and recognition / understanding of emotional information outside the self.
Lastly, it could be argued that Emotional Expression subsumes management and control. Hence, if the ability
to appropriately express emotions is lacking, then Emotional Management of self and others may be affected. 17
To establish which items should be used as reference variables, a series of Exploratory Factor Analyses
(Principle Axis Factoring) was conducted on every subscale per individual sample. The results were
compared so as to choose an item with a high loading over all the samples as a reference variable. 18
The decision to omit these subscales from the MI analyses was based on the consistent low reliabilities
obtained for the ER (see section 4.5.1) subscale due to the fact that it only retained two items after splitting
the original Emotional Recognition and Expression subscale (EREXP) into Emotional Recognition (ER) and
Emotional Expression (EE). For example the Cronbach Alpha values for this subscale ranged from 0.06 (SA
Non-White data) to 0.33 (SA White and Italy) to 0.60 in the USA sample. The EDC subscale was omitted due
the findings reported by Gignac (2005) which indicated that the items contained in this scale can conceptually
be separated into three categories. That is, “problem solving (4 items), idea generation (2 items), and decision
making (5 items), as well as a lone item pertaining to memory” (Gignac, 2005, p. 154). In addition, Gignac
(2005) reports evidence that the negatively and positively keyed items in the EDC subscale do not measure
exactly the same concept. In M2a Emotional Management Self refers to the ability to influence the emotions
within one’s self, i.e. being able to recover from an emotional set-back relatively quickly. Emotional
Management of Others is defined as the ability to influence the emotions of other individuals (Gignac, 2005).

94
generalisation potential, that is, the best fitting baseline model over all the countries. In
order to investigate method bias (due to verbal ability of the respondents), a model with
positive and negatively keyed method factors was also modelled with model M2a (referred
to as model M2b).
Original Five Factor
structure (Palmer & Stough,
2001) (M1)
Seven Factor structure
(Stough, personal
communication, 2007) (M2)
Modified Five
Factor structure
(M2a)
Nine Factor structure
without ‘g’ (Gignac, 2005,
p. 127) (M3)
1. Emotional Recognition
and Expression
1. Emotional Recognition 1. Emotional Recognition
2. Emotional Expression 1. Emotional
Expression
2. Personal Expression
3. Others Perception
2. Understanding Emotions
External
3. Understanding Emotions
External
2. Understanding
Emotions
External
4. Understanding Emotions
External
3. Emotions Direct
Cognition
4. Emotions Direct
Cognition
5. Emotions Direct
Cognition Positive
6. Emotions Direct
Cognition Negative
4. Emotional Management 5. Emotional Management
Self
3. Emotional
Management Self
7. Emotional Management
Self
8. Emotional Management
Others
4. Emotional
Management
Others
8. Emotional Management
Others
5. Emotional Control 7.Emotional Control 5. Emotional
Control
9. Emotional Control
4.4.3 Sampling procedure and data collection
Convenience sampling – as was utilised in this study - is most often employed in
generalisability studies in cross-cultural research due to availability and cost efficiency
(Van de Vijver & Leung, 1997, 2001). The use of this sampling procedure is known to lead
to an overrepresentation of affluent countries (Van de Vijver & Leung, 2001) as is the case
for this study. Only three of the six samples included in this study (i.e. South Africa White
and non-White, as well as Sri Lanka), was from less affluent countries. This is a limitation
of the research.
Table 11
Four different SUEIT factor structures (measurement models)

95
ER
ξ1
EE
ξ 2
UEX
ξ 3
EDC
ξ 4
EMS
ξ 5
X1
X2
X3
X4 - X10
X11
X12
X13 – X30
X31
X32
X33 - X13
X11
X44
X45 – X49
δ1 λ1,1
δ2 λ2,1
λ11,2
λ3,2
λ12,3
λ31,3
δ3
δ11
λ32,4
λ43,4
λ44,5
λ50,5
δ12
δ31
δ32
δ43
δ44
EMO
ξ 6
EC
ξ 7
-
-
-
-
-
-
X50
X51
X52 - X54
X55
X56
X56 – X63
X64
-
-
-
δ50
δ51
δ55
δ56
δ64
-
-
-
-
-
-
-
-
-
λ51,6
λ55,6
λ56,7
λ64,7
*
*
*
*
*
*
*
Figure 1
SUEIT seven factor model (M2) (Stough, personal communication, 2007)

96
All the data collection, with the exception of the Italian and part of the South African data,
was conducted through an online system over several years. Various co-workers in the
respective countries assisted with the setting up and running of projects. All the samples
were general workplace samples. A full description of the samples is provided in section
4.4.4.
4.4.4 Participants
Australian sample
The Australian database (n=3224) was provided by Genos Pty Ltd., a company that was
established in 2002, to commercialise the work of Dr Ben Palmer and Prof Con Stough on
the original Swinburne University Emotional Intelligence Test (Palmer & Stough, 2001).
The sample consisted of data from n=3224 adult participants, that completed the SUEIT
over a period of 4 years (2002 – 2005). The average age of the sample was 43.2 (SD=9.2).
Unfortunately, 51.4% of the sample did not report their age. Therefore, only the 1658 cases
where age was reported, was used when randomly matched samples for the invariance
analyses were drawn from the original Australian data. The sample consisted of 1473
females (45.7%) and 1692 males (52.5%). A total of 57 (1.8%) of participants did not
report their gender. A total of 1460 (45.3%) participants reported their educational
qualification obtained (54.7% missing). Three hundred and sixty three participants (11.3%)
reported having a post graduate qualification and 16% (516 participants) had obtained a
bachelors degree. Four hundred and fifty four participants (14.1%) reported having a post
secondary school certificate (diploma, certificate), and 3.9% (127 participants) had
completed a secondary school qualification.
The industries / services sectors included in the data ranged from financial and accounting;
education, training and development; local government, water and related services;
manufacturing and engineering; wholesale and retail; health and welfare to insurance
services. Table 12 provides an overview of the industries / services sectors represented in
each sample.

97
Australia New Zealand USA South-African
White
South-African
Non-White
Sri Lanka
% Freq % Freq % Freq % Freq % Freq % Freq Financial and
Accounting
services
10.6
343
-
-
-
-
12.4
36
6.2
21
1.4
8
Education,
training and
development
services
20.9
674
9.3
22
15.7
45
27.2
79
13.4
45
-
-
Health and
Welfare
11.1 357 5.9 14 14 40 26.2 76 22.8 77 - -
Manufacturing,
production,
engineering
6.3
202
10.2
24
-
-
-
-
-
-
68.1 403
Legal - - - - - - - - - - 3.5 21
Insurance - - - - - - 10.8 31 4.7 16 - -
IT systems, Tele-
communications
- - - - - - 12.4 36 46.9 158 2.2 13
Local government - - 25.4 60 6.6 19 - - - - - -
Wholesale and
retail
14 453 7.6 18 10.1 29 - - - - 1.5 9
Other 37.1 1195 17 40 13.2 38 7.6 22 4.5 15 23.3 138
Missing 0 0 24.6 58 40.4 116 3.4 10 1.5 5 0 0
Total 100 3224 100 236 100 287 100 290 100 337 100 592
New Zealand sample
The New Zealand data (n=236) was part of the Genos Pty Ltd SUEIT database. This
sample consisted of 116 male participants (49.2%) and 117 female participants (49.6%).
Three participants did not indicate their gender (1.3%). A total of 54 (22.8%) of the
participants did not report their age. For the rest of the sample (n=182), the mean age was
40.5 (SD=9.8). Forty six participants (19.5%) reported having a post graduate qualification
(MA or PhD), 21.6% (51 participants) an undergraduate qualification (BA or advanced
diploma), 14.4% (34 participants) a post secondary school certificate (diploma, certificate),
and 3.4% (8 participants) reported having a secondary school qualification. A total of 92
participants (39%) did not report any information on their qualification status. Table 12 lists
the five most prominent industries within which the data was gathered in New Zealand.
United States of America (USA) sample
This data was gathered by Genos Pty Ltd collaborators in the USA (n=287). A total of 13
participants (4.5%) did not report their gender. The average age of the sample was 44.9
(SD=13.0) and consisted of 100 males (34.8%) and 174 females (60.6%). Sixty four
participants did not report their age (16%). All the participants had obtained some form of
Table 12:
Industry representation per sample
NOTE: No information on industry representation for the Italian sample was available.

98
post secondary school education. More specifically, 4 participants (1.4%) had obtained a
secondary school certificate (diploma, certificate) and 111 participants (38.6%) reported
having obtained an undergraduate qualification (BA or advanced diploma). A notable large
portion of this sample (92 participants, 32.1%) had a post graduate qualification (72
participants a master’s degree, and 20 participants a PhD). Table 12 contains information
regarding the industries within which the data was collected.
Sri Lanka sample
This data (n=592) was collected from April – May 2007 with the Genos Pty Ltd online
system with the help of a Sri Lankan business consultant, currently living in Australia.
Most of the data was collected in a single large multinational manufacturing / production
company in Sri Lanka. The mean age of the sample was 33.5 (SD=7.6). Twenty two
participants (3.4%) did not report their age. The sample consisted of 412 male (69.6%) and
180 female participants (30.4%). Regarding education levels, 268 participants (45.3%) had
obtained an undergraduate qualification (BA or advanced diploma). A total of 166
participants (28%) had obtained a post secondary school certificate (diploma, certificate),
whilst 86 participants (14.5%) had obtained a senior secondary school qualification.
Information on the other industries that was included in the data is listed in table 12.
Italian sample
The Italian workplace sample (n=320) was collected by a co-worker in Rome, Italy (2004 –
2005). Unfortunately not other demographic information19
except for the age and gender
was provided. The mean age of the sample was 35.3 (SD=10.3) (none missing) and
consisted of 40.6% males (130 participants) and 59.4% females (190 participants). An
Italian translation equivalent version of the SUEIT was used to gather this data. In
accordance with cross-cultural assessment practices, the instrument was translated into
Italian and back-translated into English to ensure that an adequate translation was obtained.
19
The researcher employed various strategies to try and locate the original researcher. Unfortunately the
individual had left the tertiary educational institution and could not the contacted to receive more information
on the sample.

99
South African samples
The South African samples (non-White, n=337 and White, n=290) was collected over a
period of three years (2005 – 2007) in various organisations in the Western Cape region.
Electronic invitations were sent out with a request to follow a designated link to a website
where the questionnaire could be completed. Appendix 1 contains the cover letter that was
distributed in two large Western Cape universities, an IT company, as well as an insurance
company, to request participation in the study. The invitation was also sent out via an
electronic newsletter of the business school of the one university, as well as to a list of part
time adult students (all working) enrolled in a management program at a management
research institute situated at the one university. All of this data was collected via the online
system. Included in the South African database, is also data that was collected via paper-
and-pen test administration at various hospitals and a large call centre in the Western Cape.
Logistical limitations (access to the internet, computers) did not allow for online data
collection in these samples. Hence the difference in the administration procedure (online
versus paper-and-pen) should be noted as a limitation of the results related to this sample.
Although the South African sample is not representative of the South African population, it
does contain a sizable proportion of data from the three most prominent ethnic groups in
the Western Cape (i.e. White, Coloured and African individuals).
The average age of the White sample was 39.10 (SD=10.22) and consisted of 111 male
participants (38.3%) and 179 female participants (61.7%). Eleven participants (3.8%) did
not report their age. A total of 28 participants (9.6%) had obtained a secondary school
qualification, whilst 44 participants (15.1%) were in possession of a post secondary school
certificate (diploma, certificate). Twenty-one participants (7.2%) had obtained a bachelors
degree, whilst 119 participants (41%) held a post graduate qualification (Honours degree =
8.6%; Masters degree = 21.7% and Doctoral degree = 10.7%). A total of 78 participants
(26.9%) did not report information on their educational qualifications. Table 12 contains
information on the industries within which the participants were employed at the time of
the survey.

100
The non-White sample20
(121 Black / African participants, 35.9%; 216 Coloured
participants, 64.1%) consisted of 128 male participants (38%) and 200 female participants
(59.3%). Nine participants did not report their gender (2.7%). The mean age of the sample
was 32.82 (SD=8.93). Twenty four participants did not report their age (7.1%). About a
third of the sample reported having a secondary school educational qualification (125
participants, 37.1%), whilst 70 participants had obtained a post secondary school certificate
(20.8%). Forty participants reported having obtained a bachelors degree (11.9%) and 56
participants was in possession of a post graduate qualification (16.6%). More specifically,
25 participants (7.4%) had obtained an honours degree, 25 participants was in possession of
a masters degree (7.4%), whilst 6 participants had obtained a doctoral degree (1.8%).
Forty-six participants did not report any information on their educational qualification
(13.6%).
4.4.5 Data analytic procedure
Structural Equation Modeling (SEM) fit indices
With SEM analysis, various assumptions about the latent structure of a set of indicators are
evaluated by investigating various fit indices. Multiple criteria (Bentler, 1990;
Diamantapolous & Siguaw, 2000; Kelloway, 1998) were used in assessing the goodness-of-
fit of the datasets to the proposed models, as most researchers agree that SEM has no single
statistical test that best describes the ‘strength’ of the model’s predictions (Bollen & Long,
1993; Diamantapolous & Siguaw, 2000; Kelloway, 1998, Schumaker & Lomax, 1996).
More specifically, the following absolute and incremental fit indices are reported in order to
reach an integrative judgment on model fit: the Satorra-Bentler Chi-square (a correction for
the chi-square test statistic; Satorra & Bentler, 1988), Satorra-Bentler Chi-square/df ratio,
the Comparative Fit Index (CFI; Bentler, 1990), the Non-normed Fit Index / Tucker Lewis
Index (NNFI / TLI; Bentler & Bonnett, 1980), the Root Mean Square Error of
Approximation Index with confidence interval (RMSEA; Steiger, 1990), the Root Mean
Square Residual (RMR), as well as the standardized RMR (SRMR).
20
Due to sample size requirements for the SEM analyses (n>200), the Coloured and African participant’s data
was consolidated in one sample as the Black / African data would not have been enough to include on its own.

101
The chi-square statistic is a likelihood ratio test statistic (Byrne et al., 1989) which assesses
whether the unrestricted population variance / covariance matrix of the observed variables
is equal to the model-implied variance covariance matrix (Diamantopoulos & Siguaw,
2000; Kelloway, 1998; Mueller, 1996). The chi-square statistic is known to be affected by
sample size (Cheung & Rensvold, 2002; Diamantopoulos & Siguaw, 2000; Marsh, Balla, &
McDonald, 1988) providing a highly sensitive statistical test for large sample sizes. Any
deviation from perfect model fit is likely to result in a rejection of the hypothesised model
(Jöreskog, 1969) and hence obtaining non-significant test statistics in this instance is
unlikely (Kelloway, 1998). In addition, others have argued that the null hypothesis of
perfect fit may be considered to be rather unrealistic (Brown & Cudeck, 1993). Therefore,
alternative goodness-of-fit indices should be considered when evaluating model fit. The
CFI (Bentler, 1990), an incremental fit index, indexes the relative reduction in lack of fit as
estimated by the noncentral chi-square of a target model versus a baseline model (Hoyle &
Panter, 1995). The NNFI (also called the Tucker-Lewis Index, TLI), introduced by Tucker
and Lewis (1973) within the context of factor analysis, and discussed in SEM by Bentler
and Bonnet (1980), assesses the relative improvement of fit by comparing the target model
to a more conservative baseline (e.g. independence or null model) where no relations
among variables are specified. It is noted as a particularly suitable indicator of model fit in
cross-cultural measurement invariance studies (such as the present study) as the NNFI / TLI
rewards model parsimony, a characteristic which is of paramount importance in an
examination of nested models, a practice commonly utilised to assess invariance across
groups (Vandenberg & Lance, 2000). A brief perusal of a few similar cross-cultural,
generalisability or measurement invariance / equivalence studies (Bonaccio & Reeve, 2006;
Culhane et al., 2006; Ghorbani et al., 2002; Gomez & Fisher, 2005; Parker et al., 2005;
Shevlin & Adamson, 2005; Wang, Liu, Biddle, & Spray, 2005) revealed general agreement
in cutoff values for the aforementioned indices. Values of 0.9 and above for the CFI,
TLI/NNFI was referred to as indicating ‘well fitting models’ (Gomez & Fisher, 2005),
‘good model fit’ (Ghorbani et al., 2002) ‘acceptable’ fit (Wang et al., 2005) and an
‘appropriate lower bound of adequate fit’ (Bonaccio & Reeve, 2006). Others denote values
of > 0.95 as indicating ‘acceptable fit / good fit’ (Bonaccio & Reeve, 2006; Shevlin &

102
Adamson, 2005) citing Hu and Bentler (1999) as reference. Moreover, Wang et al (2005)
employed values of > 0.95 as indicative of ‘excellent fit’.
The RMSEA (Steiger, 1990) focuses on the discrepancy between the Σ and Σ(θ) per degree
of freedom (Diamantopoulos & Siguaw, 2000). It compensates for model complexity and
sample size. According to Brown and Cudeck (1993) values of 0.05 and less indicate close
fit, whilst Hu and Bentler (1999) recommend 0.06 as a cut-off for good-fitting models.
Values under 0.08 and between 0.08 and 0.10 indicate reasonable (Widaman & Reise,
1997), and mediocre fit respectively (Diamantopoulos & Siguaw, 2000). Values larger than
0.10 indicate poor fitting models (Brown & Cudeck, 1993). All the studies survey applied
these cutoff criteria. In addition, a test of close fit (in contrast to exact fit) is performed by
LISREL by testing Ho: RMSEA ≤ 0,05 against Ha: RMSEA > 0,05. That is, if a p-value for
close fit >0.05 is obtained, close fit has been achieved. The standardised RMR is a
summary measure of standardised residuals which represents the average differences
between the elements of the sample covariance matrix and the fitted covariance matrix
(Diamantopoulos & Siguaw, 2000). The SRMR (Jöreskog & Sörbom, 1981) is known to be
sensitive to model misspecification with values below 0.05 suggesting the model fits the
data very well (Kelloway, 1998). Values less than 0.08 are considered to be indicative of
acceptable model fit (Hu & Bentler, 1999) or well-fitting models (Vandenberg & Lance,
2000), a cutoff value also consistently applied over different studies. In summary, and in
accordance with the aforementioned criteria, cutoff values of 0.9021
for the CFI, TLI /
NNFI, 0.08 for the SRMR and 0.06 for the RMSEA22
will be employed to indicate well
fitting models in this study. The close fit value will also be interpreted.
Parameter estimation, variable type and item parcels
The purpose of parameter estimation is to find numerical values for the freed parameters of
the model that would minimise the difference between the observed and estimated /
21
In models with more that 30 observed variables (as is this case in this study) simulation research suggests
that with a sample of n<250 CFI cutoff values of 0.92 should be used. With n>250 and more than 30 observed
variables, a CFI cutoff of 0.90 should be applied (Hu & Bentler, 1999; Marsh, Hau, & Wen, 2004). Moreover,
more complex models with smaller samples may require somewhat less strict criteria for evaluation with
multiple fit indices (Sharma, Mukherjee, Jumar, & Sillon, 2005). 22
The <0.08 (reasonable fit) and <.10 (mediocre fit) RMSEA cut-off values were also utilised, especially
where models were compared over different countries, in order to ascertain relative fit between them.

103
reproduced sample variance / covariance matrices (Diamantopoulos & Siguaw, 2000).
LISREL 8.8 offers a number of different estimation methods, e.g. Generally Weighted
Least Squares (WLS), Diagonally Weighted Least Squares (DWLS), and Maximum
Likelihood (ML) (Diamantopoulos & Siguaw, 2000; Jöreskog & Sörbom, 1996). The
nature of the variables to be analysed, as well as the distributional properties of the data,
should be considered in order to decide on the appropriate estimation technique. For
example, the ML estimator assumes continuous multivariate normal observed variables
(Muthén & Kaplan, 1985). Questions pertaining to the most appropriate data analyses
strategy for this study, included: Which estimation technique should be used? Should the
correlation or covariance matrices be analysed? How should the variable type be defined?
Should item parcels be used? How will the distributional properties of the data impact the
results and what is an accepted strategy to deal with the implications of the sample
properties? What strategy should be used to deal with missing values?
As responses on the 64 individual SUEIT items are captured on a five point Likert scale, it
has been argued that the ordinal nature of the data requires that polychoric correlations and
the asymptotic covariance matrix should be analysed (Jöreskog, 2005). With this strategy,
Weighted Least Squares (WLS) or DWLS estimation techniques are used to derive the
model parameters as they fall within the category of asymptotic distribution-free estimators
(Diamantopoulos & Siguaw, 2000). Employing either of these estimation techniques,
require very large sample sizes (Diamantopoulos & Siguaw, 2000; Jöreskog & Sörbom,
1996) and extensive memory and processing time. This problem is exacerbated when multi-
group comparisons of measurement models on item level are conducted (as is the case in
this study). To overcome this, item parceling has increasingly been used (Bandalos &
Finney, 2001; Hagtvet & Nasser, 2004). In initial analyses in this study, the Jöreskog
(2005) methodology was applied (specifying the variable type as ordinal, using DWLS as
estimation technique). Due to the complexity of the model, the analyses were unstable and
required extensive memory and processing time. Upon an inquiry for a more practical
strategy from the developer of LISREL, Prof Jöreskog (personal communication, 2007)
advised the use of item parcels.

104
Item parcels is a heuristic approach applied to convert ordered categorical data to
continuous data (Bentler & Bonnett, 1980; Bentler & Chou, 1987; Nasser & Takahashi,
2003) in order to better meet the assumptions of ML estimation and improve non-normality
and variable to sample size ratio (e.g. Bonnacio & Reeve, 2006). Other cited advantages
range from increased stability of parameter estimates (Bandalos, Geske, &, Finney, 2001;
Bandalos, 2002) to lower skewness and kurtosis, as well as higher reliability and validity
for parcels than individual items (Nasser & Takahashi, 2003). Disadvantages include that
item parceling may improve model fit for all models, even if they are misspecified, as
parcel-based models tend to cancel out random and systematic error by aggregating across
these errors, improving model fit (Bandalos et al., 2001; Little, Cunningham, Shahar, &
Widaman, 2002).
Jöreskog’s recommendation of item parceling (personal communication, 2007) was
carefully considered in the light of the goals of this study. Two reasons are put forward for
why an item parceling strategy was not considered appropriate. First, the focus of this
research is on measurement invariance of the measurement model at the item level.
Utilising item parcels would not allow for the attainment of individual item parameter
estimates and possibly confound bias problems of individual items when parceled together.
Secondly, the results of a simulation study by Meade and Kroustalis (2005) illustrated that
when tests of metric invariance with item parcel indicators are conducted, “…pervasive and
considerable differences between groups can be masked” (p.7) by the parcels. The authors
conclude that when conducting MI analyses – as in the current study - items, and not
parcels, should be used as indicator variables.
A Monte Carlo study by Muthén and Kaplan (1985) investigated results derived from
different estimation techniques (i.e. ML, Generalized Least-Squares, Asymptotically
Distribution Free, Categorical variable methodoloy) when applied within a CFA SEM
framework on non-normal categorical variables, treated as interval scale (continuous) non-
normal variables. The results suggested that the practice of using ML estimation, where the
ordered five-category Likert scales are specified to be continuous and where these variables
are moderately skewed and kurtotic, is allowable as no severe distortion of the parameter,

105
standard error and chi-square estimates were observed. The authors concluded that,
“…these normal theory estimators (ML, Generalized Least-Squares) perform quite well
even with ordered categorical and moderately skewed/kurtotic variables” (Muthén &
Kaplan, 1985, p.187). Hence in this study the 64 observed variables were specified to be
continuous and ML was specified as the estimation technique.
ML assumes multivariate normality when fitting measurement models to continuous data
(Mels, 2003). The assumption of multivariate normality in a multi-group context is more
complex than with single population studies. According to Lubke and Muthen (2004, p.
515), “…results from robustness studies in a single homogeneous population concerning
the analysis of Likert-type data while violating the normality assumption, do not
necessarily carry over to the multiple group situation, and group comparisons may have
problems in addition to those encountered in single populations.” Results from their study
revealed that the source of unacceptable fit remains obscure in multi-group CFA of ordered
categorical data whilst incorrectly assuming multivariate normality (Lubke & Muthen,
2004). They concluded that it could not be known whether unfavourable measures of GOF
are due to a violation of ML assumptions, threshold differences across items that result in
structural differences or a result of the fact that the data are categorical and measures of
GOF based on the assumption of normally distributed data do not function properly (Lubke
& Muthen, 2004). In the light of these findings, the univariate and multivariate normality of
the indicator variables in all the samples were routinely inspected with PRELIS (Jöreskog
& Sörbom, 1996). Where the null hypothesis of univariate and multivariate normality was
rejected, Robust Maximum Likelihood (RML) was specified as the estimation technique
(Tabachnick & Fidell, 2001). This procedure produces the Satorra-Bentler chi-square
statistic (S-Bχ2) which tests for the closeness of fit between the unrestricted sample
covariance matrix and the postulated covariance matrix, after correcting for multivariate
normality. By employing this strategy, estimation problems of model testing related to a
lack of multivariate normality, e.g. underestimation of fit indices (Mels, 2003; West, Finch,
& Curran, 1995), are minimised.

106
Missing values: imputation by matching
Various strategies to treat missing values exist. Three categories can be distinguished:
deletion methods (list-wise and pair-wise deletion), model based (distributional) and non-
model based methods. The decision regarding the most suitable method for addressing the
problem of missing values in this study, should be based on the potential of the method to
enhance the inferential validity of the results (Raghunathan, 2004). List-wise deletion
(complete-case analysis) generally results in loss of large amounts of data which may
distort the representivity of the original sample (Raghunathan, 2004). Pair-wise deletion
could potentially produce invalid estimates due to the varying samples sizes used to
estimate parameters (Pigott, 2001). Model based methods like Full Information Maximum
Likelihood (FIML) and Multiple Imputations have clear advantages over traditional
deletion methods (Enders & Bandalos, 2001; Roth, 1994). For example, FIML has been
found to reduce bias that typically results from list- or pair-wise deletion of cases (Enders
& Bandalos, 2001) whilst Multiple Imputation corrects for bias by conducting several
imputations for each missing value (Sartori, Salvan, & Thomaseth, 2005). However, these
methods require data with a multivariate normal distribution (Pigott, 2001). In addition,
computational difficulties often render these methods impractical and cumbersome.
Although Multiple Imputation provides completed data sets after imputation (which is
needed to conduct the subsequent analysis in this study), FIML does not. Based on these
considerations, alternative non-model based methods of imputing missing values were
considered.
Non-model based methods (single mean imputation and imputation by matching) do not
require multivariate normal data. Single mean imputation is considered to be a fairly crude
method which is known to produce biased results (Pigott, 2001) as the variance of a given
variable is decreased by simply replacing all missing values (on the variable) with the mean
of all cases on that variable. Imputation by matching (similar response pattern imputation)
attempts to impute values from another case with similar observed values. Imputation does
not take place in the case where there is no observation with complete data on the set of
matching variables (Enders & Bandalos, 2001) and hence sample sizes could be slightly
attenuated. The main advantage of using this method is that the estimated data will preserve

107
deviations from the mean and the shape of the distribution (Little et al., 2002). Hence, this
method was chosen as the most appropriate strategy for addressing missing values in all the
samples with missing values. The procedure that was followed included to (a) obtain a
description of the exact number of missing values per item with PRELIS (in LISREL 8.8),
(b) identify matching variables (variables with no missing values), and (c) impute missing
values with PRELIS.
Most of the data was collected with the computerised online SUEIT system. This may have
restricted the number of missing values as the system does not allow a participant to skip a
question. Missing values would appear if the Internet connection was disconnected during
testing. The USA, Italian, Sri Lanka and South African White data contained no missing
values. Two cases in the New Zealand data had more than 50% missing values, and were
removed from the dataset (final n=234). Imputation by matching was used on the two
Australian samples (Australian n=3224, split sample), as well as the South African non-
White sample. In the Australia A sample (n=1618) 53.1% of the items had 5 or less missing
observations (one item had none). The remaining 46.9% of items had between 6 and 9
missing observations. In the Australia B sample (n=1618), three items had no missing
values, whilst 84.4% of the sample had seven or less observations. The remainder of items
(10) had all 8 or less missing observations. In the South African non-White sample (n=337)
21 items (32.8%) had no missing values. A total of 39 items (60.9%) had 5 or less missing
observations. Item 54 had the largest number of missing observations (7). After imputation,
the Australian A sample size was attenuated from n=1618 to n=1604, and Australia B from
n=1618 to n=1605. Imputation by matching on the SA non-White sample retained all cases
of the original sample (n=337).
Matching the samples
The validity of cross-cultural comparisons may be impeded if subjects from different
cultural groups are not matched on demographic characteristics (Van de Vijver & Leung,
1997). The practice of matching samples allows the researcher to rule out sample-specific
differences as alternative explanations for observed cultural differences. In this study the
invariance analyses entailed fitting six separate series of multi-group CFA models, for each

108
of the six countries (cultures) with Australia as the reference group (e.g. Australia and
USA, Australia and Sri Lanka etc). Therefore, comparable matched samples, for the
invariance analyses, were randomly drawn from the Australian sample (the 1658 cases
where age was reported). All the samples were matched on age and gender only23
. For
example, the USA sample (n=287) had a gender distribution of male = 40% and female =
60% and mean age of 44.89 (SD=13.01). The Australian matched sample (n=287) for the
Australia, USA MI analyses was therefore randomly drawn from the Australian sample
based on the USA sample characteristics. In all instances sample sizes were also matched,
as some GOF measures (e.g. chi-square statistic) is known to be affected by sample size
(Cheung & Rensvold, 2002; Diamantopoulos & Siguaw, 2000; Marsh et al., 1988). The
final list of matched samples for the MI analyses included (appendix 2 contains the
descriptive statistics for all raw data utilised in this study): Australia (n=287) and USA
(n=287), Australia (n=234) and New Zealand (n=234), Australia (n=320) and Italy (n=320),
Australia (n=337) and South Africa non-White (n=337), Australia (n=290) and South
Africa White (n=290), and Australia (n=587) and Sri Lanka (n=587).
4.5 Results
4.5.1 Results: Validity extension (loose replication)
The results for this section will be presented separately for each sample. First, the
descriptive statistics (means and standard deviations, univariate and multivariate normality
and reliability analysis) for models M2 and M2a are reported (appendix 3 contains the
descriptive statistics for models M1 and M3). This is followed by the single group CFA
analyses results, based on the selection of fit indices described in section 4.4.5. Results for
each of the separate factor structures (M1, M2, M2a and M3) are reported. Due to the fact
that model M2a was used for the invariance analyses, this section only reports the factor
loadings for this model per country. In accordance with recommendations by Cattell (1978)
as well as Ward, Kersh, and Waxmonsky (1998) items with loadings larger than |0.15| will
be considered as potentially significant. This fairly moderate criterion is applied as item
23
It is acknowledged that a there may be a range of potentially confounding variables (e.g. education, socio-
economic background) that may limit the comparability of the samples. Unfortunately, information on such
variables was not available over all the samples in order to empirically test their effects on the results.

109
level analyses tend to be more unreliable than subscales/facet level analyses (Gignac,
2005). In section 4.5.2 a discussion of the results of all the samples is presented.
4.5.1.1 Australian results
The Australian (n=3224) sample was randomly split with SPSS (version 15) into two
samples (sample A=1618, sample B=1618) to allow for cross-validation of the Australian
results. Missing values were imputed (multiple imputation) with PRELIS 2.8 (Jöreskog &
Sörbom, 2002) resulting in a slight decrease of both the sample sizes (sample: A=1604,
sample: B=1605). The age and gender distributions for the analysis sample (sample A:
M=43.12, SD= 9.01, 47.2% missing; male=51.7%, female: 46.3%, 2% missing) and the
holdout / calibration sample (sample B: M=43.28, SD= 9.47, 49.5% missing;
male=53.27%, female: 45.1%, 1.7% missing) were comparable. PRELIS 2.8 (Jöreskog &
Sörbom, 2002) was used to evaluate the univariate and multivariate normality of the 64
observed variables (items). In both samples the null hypothesis of multivariate normality
was rejected (skewness and kurtosis in sample A: χ2=10559.9, p=0.000, n=1604; sample B:
χ2=18899.3, p=0.000, n=1605). Robust Maximum Likelihood Estimation was employed to
derive model parameter estimates. The internal reliabilities, means and standard deviations
for the subscales of M2 and M2a over the two samples are reported in table 13 (refer to
appendix 3 for summary statistics of M1 and M3).
Australia (n=1604) Australia (n=1605)
Scale M SD α* N of
Items
M SD α* N of
Items
Emotional Recognition 7.93 1.12 0.60 2 7.99 1.10 0.54 2
Emotional Expression 31.49 4.63 0.81 9 31.71 4.51 0.79 9
Understanding Emotions External 77.67 7.77 0.90 20 78.25 7.50 0.89 20
Emotions Direct Cognition 35.09 6.56 0.86 12 35.20 6.340 0.85 12
Emotional Management Self 25.92 3.72 0.84 7 25.96 3.71 0.83 7
Emotional Management Others 17.28 2.52 0.67 5 17.43 2.51 0.65 5
Emotional Control 33.60 4.22 0.80 9 33.53 4.23 0.80 9
Total EI (M2) 230.08 20.52 0.71 7 230.08 20.52 0.73 7
Total EI (M2a)** 185.96 16.99 0.73 5 186.89 16.97 0.75 5
Table 13
Subscale internal reliabilities, means and standard deviations for Australian split samples for models M2 and M2a
*Alphas calculated after missing values were imputed.
**Model M2a mean scores were calculated by omitting ER and EDC subscales.

110
The results of the single group CFA analyses conducted with LISREL 8.8 (Jöreskog &
Sörbom, 2002) for the four different measurement models over both the samples are
reported in table 14. Overall, the data fit very well to models M2, M2a and M3 (i.e.
RMSEA <0.06, SRMR<0.08). The original five factor structure (M1) obtained acceptable
to good model fit with a RMSEA <0.06 and a SRMR of <0.09. Evidence for close fit
emerged for the nine factor model, not obtained with the other models. All the incremental
fit statistics were above 0.90. The increase in the NNFI and CFI indices, as well as decrease
in RMSEA values as the latent factors being modeled, increases, clearly suggests that more
latent factors underlie the 64 items, than the original hypothesised five factor model. More
specifically, the current results provide clear evidence that replicate the finding of nine
substantive factors within the SUEIT (Gignac, 2005). All the factor loadings for both
samples were statistically significant, ranging from 0.33 (item 23) to 0.75 (item 57) (sample
A) and 0.35 – 0.74 (sample B) (same items). The only item that obtained a loading below
0.30 in both samples (0.26, sample A and 0.28, sample B) is item 37 (“Colleagues know
when I’m worried”).
Model χ2 S-Bχ2 df S-Bχ2/
df
NNFI CFI RMSR SRMR RMSEA (CI) P
(close) M1
Australia A
15327.25*
13298.53*
1942
6.85
0.93
0.93
0.051
0.087
0.060
(0.059; 0.061)
0.00
Australia B 15289.64* 12880.06* 1942 6.63 0.92 0.93 0.050 0.085 0.059
(0.058; 0.060)
0.00
M2
Australia A
12990.58*
11078.90*
1931
5.74
0.94
0.94
0.044
0.074
0.054
(0.053; 0.055)
0.00
Australia B 13118.13* 10649.12* 1931 5.51 0.94 0.94 0.044 0.074 0.053
(0.052; 0.054)
0.00
M2a
Australia A
9104.71*
7676.40*
1165
6.59
0.94
0.94
0.042
0.074
0.059
(0.058; 0.060)
0.00
Australia B 8437.88* 6823.30* 1165 5.86 0.95 0.95 0.040 0.071 0.055
(0.054; 0.056)
0.00
M3
Australia A
8140.33*
7087.53*
1916
3.69
0.97
0.97
0.031
0.054
0.041
(0.040; 0.042)
1.00
Australia B 8423.47* 7079.35* 1916 3.69 0.96 0.97 0.032 0.055 0.041
(0.040; 0.042)
1.00
Table 14
Goodness-of-fit statistics results of the single-group SUEIT CFAs for Australia A (n=1604) and Australia B (n=1605)
samples
Note: S-Bχ2, Sattora-Bentler Scaled Chi-square; NNFI, non-normed fit index; CFI, comparative fit index; RMSR, root
mean squared residuals; SRMR, standardised root mean residual; RMSEA, root mean square error of approximation
with 90% confidence interval
* p < 0.001
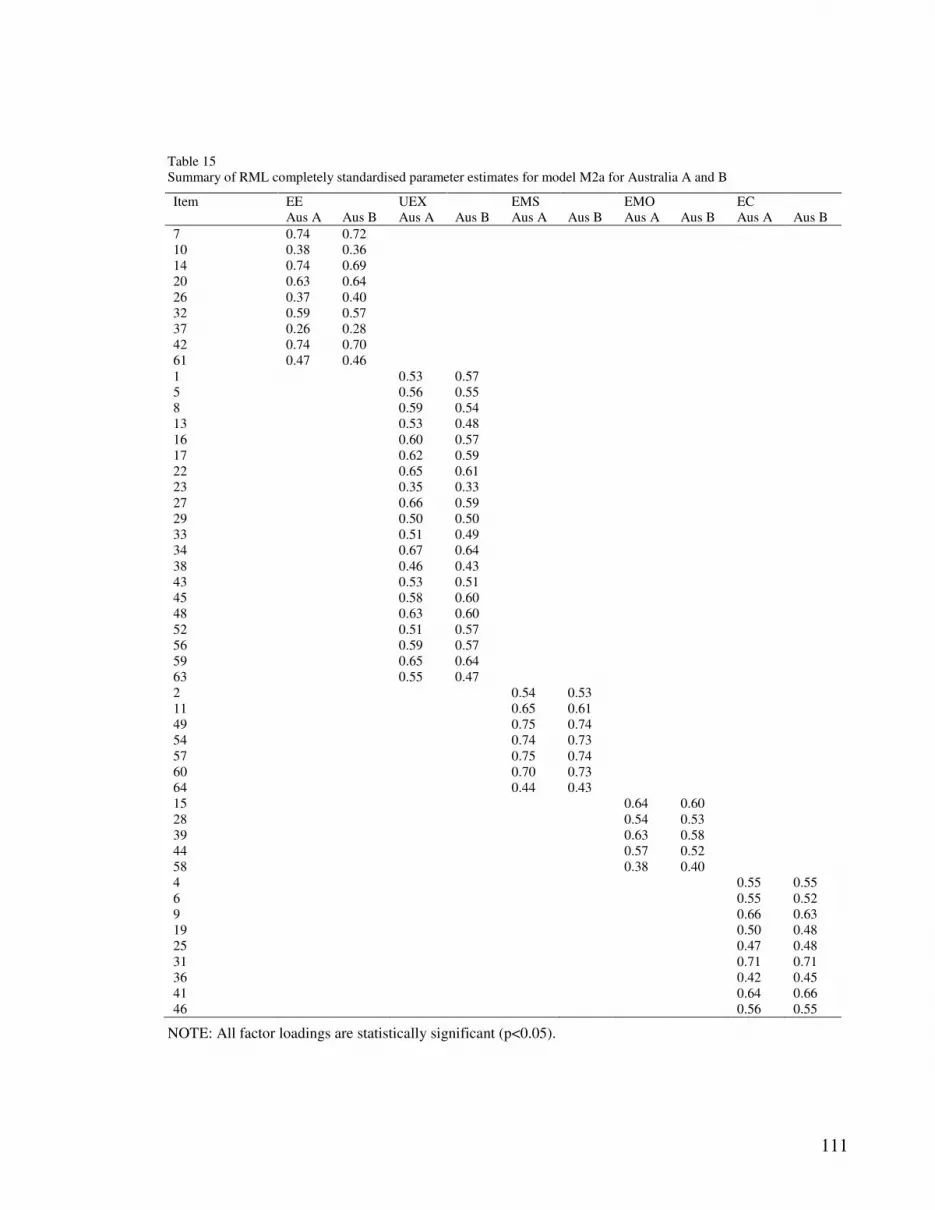
111
Item EE
Aus A
Aus B
UEX
Aus A
Aus B
EMS
Aus A
Aus B
EMO
Aus A
Aus B
EC
Aus A
Aus B
7 0.74 0.72
10 0.38 0.36
14 0.74 0.69
20 0.63 0.64
26 0.37 0.40
32 0.59 0.57
37 0.26 0.28
42 0.74 0.70
61 0.47 0.46
1 0.53 0.57
5 0.56 0.55
8 0.59 0.54
13 0.53 0.48
16 0.60 0.57
17 0.62 0.59
22 0.65 0.61
23 0.35 0.33
27 0.66 0.59
29 0.50 0.50
33 0.51 0.49
34 0.67 0.64
38 0.46 0.43
43 0.53 0.51
45 0.58 0.60
48 0.63 0.60
52 0.51 0.57
56 0.59 0.57
59 0.65 0.64
63 0.55 0.47
2 0.54 0.53
11 0.65 0.61
49 0.75 0.74
54 0.74 0.73
57 0.75 0.74
60 0.70 0.73
64 0.44 0.43
15 0.64 0.60
28 0.54 0.53
39 0.63 0.58
44 0.57 0.52
58 0.38 0.40
4 0.55 0.55
6 0.55 0.52
9 0.66 0.63
19 0.50 0.48
25 0.47 0.48
31 0.71 0.71
36 0.42 0.45
41 0.64 0.66
46 0.56 0.55
Table 15
Summary of RML completely standardised parameter estimates for model M2a for Australia A and B
NOTE: All factor loadings are statistically significant (p<0.05).

112
4.5.1.2 New Zealand results
Table 16 contains the descriptive statistics for the subscales of models M2 and M2a (refer
to appendix 3 for descriptive statistics on M1 and M3). The internal reliability results
closely matched the results obtained in the Australian samples with alpha values ranging
from 0.77 to 0.88, expect for the two subscales with the least number of items (i.e.
Emotional Recognition, α=0.57 and Emotional Management Others, α=0.63) which still
obtained reasonable results (given the small number of items). Investigation of the
univariate and multivariate normality of the 64 observed variables (items) with PRELIS 2.8
(Jöreskog & Sörbom, 2002) revealed the rejection of the null hypothesis for both the
univariate and multivariate normality (multivariate normality results - skewness and
kurtosis: χ2=1294.95 p<0.05). The Satorra-Bentler chi-square statistic is reported. Table 17
contains the results of the single group CFA analyses for the four measurement models.
Table 18 contains the factor loadings for model M2a. All the loadings were statistically
significant (p<0.05).
New Zealand (n=234)
Scale M SD α* N of Items
Emotional Recognition 8.08 1.08 0.57 2
Emotional Expression 32.06 4.11 0.77 9
Understanding Emotions External 78.64 6.90 0.88 20
Emotions Direct Cognition 36.39 5.86 0.84 12
Emotional Management Self 26.05 3.50 0.82 7
Emotional Management Others 17.30 2.34 0.63 5
Emotional Control 33.76 3.83 0.77 9
Total EI (M2) 232.27 18.07 0.69 7
Total EI (M2a)** 187.81 14.89 0.70 5
*Alphas calculated after missing values were imputed.
**Model M2a mean scores was calculated by omitting ER and EDC subscales.
Table 16
Subscale internal reliabilities, means and standard deviations for New-Zealand sample (n=234) models M2 and M2a

113
Model χ2 S-Bχ2 df S-Bχ2/
df
NNFI CFI RMSR SRMR RMSEA (CI) P
(close)
M1 3955.71* 3545.37* 1942 1.83 0.90 0.91 0.054 0.10 0.060
(0.056; 0.063)
0.00
M2 3588.63* 3214.64* 1931 1.66 0.92 0.93 0.050 0.093 0.053
(0.050; 0.057)
0.043
M2a 2179.36* 1925.82* 1165 1.65 0.94 0.94 0.045 0.089 0.053
(0.049; 0.057)
0.12
M3 2840.37* 2567.67* 1916 1.34 0.96 0.96 0.038 0.073 0.038
(0.034; 0.042)
1.00
A similar pattern for the model fit results, in comparison with the Australian results,
emerged. In comparison with the other models, model M1 obtained the worse results.
Although a RMSEA of 0.06 was achieved for this model, the SRMR of 0.1 raises some
doubts regarding the adequacy of the five factor model fit. The NNFI and CFA values
further confirmed this, by obtaining values on and just above the 0.90 cutoff. A notable
improvement in model fit is evident with the splitting of the original Emotional
Recognition and Expression, as well as Emotional Management factors, both into two
factors (i.e. Emotional Recognition, Emotional Expression, Emotional Management Self
and Emotional Management Others). Models M2a and M3 obtained NNFI and CFI values
close to, and above 0.95. In addition, close fit was achieved as the H0: RMSEA ≤ 0.05
could not be rejected given a p-value for the test of close fit (RMSEA < 0.05) equal to 0.12
(M2a) and 1.00 (M3) in both the models. It should be noted that, even with a RMSEA
value well below the 0.06 cutoff (RMSEA = 0.038) for the best fitting model (M3), an
SRMR value of just below 0.08 (0.074) was achieved. This is at odds with the Australian
results, where the low RMSEA values (0.041), obtained for model M3 was further
confirmed with a SRMR values equal to 0.05 (indicating excellent fit, Kelloway, 1998).
Item 14 (“When I’m anxious at work I find it difficult to express this to my colleagues”)
obtained the highest factor loading (0.74). Similar to the Australian results, item 37
(“Colleagues know when I’m worried”) obtained the lowest loading (0.25).
Note: S-Bχ2, Sattora-Bentler Scaled Chi-square; NNFI, non-normed fit index; CFI, comparative fit index; RMSR, root
mean squared residuals; SRMR, standardised root mean residual; RMSEA, root mean square error of approximation
with 90% confidence interval
* p < 0.001
Table 17
Goodness-of-fit statistics results of the single-group SUEIT CFAs for New-Zealand sample (n=234).

114
Item EE UEX EMS EMO EC
7 0.71
10 0.31
14 0.74
20 0.57
26 0.30
32 0.45
37 0.25
42 0.70
61 0.49
1 0.53
5 0.58
8 0.52
13 0.52
16 0.44
17 0.58
22 0.60
23 0.37
27 0.54
29 0.55
33 0.43
34 0.71
38 0.28
43 0.53
45 0.50
48 0.58
52 0.50
56 0.58
59 0.56
63 0.47
2 0.53
11 0.68
49 0.67
54 0.73
57 0.72
60 0.69
64 0.41
15 0.59
28 0.53
39 0.53
44 0.58
58 0.33
4 0.44
6 0.54
9 0.58
19 0.45
25 0.50
31 0.69
36 0.44
41 0.61
46 0.46
Table 18
Summary of RML completely standardised parameter estimates for model M2a for New Zealand
NOTE: All factor loadings are statistically significant (p<0.05).

115
4.5.1.3 USA results
The means, standard deviations, and Cronbach Alpha’s per subscale for models M2 and
M2a, are presented in table 19 (refer to appendix 3 for descriptive statistics of M1 and M3).
Once again, both the null hypotheses of univariate and multivariate normality for the 64
observed variables (items) was rejected (skewness and kurtosis: χ2=2235.43 p<0.05).
Robust Maximum Likelihood Estimation was employed to derive model parameter
estimates. The validity extension results for the four measurement models are presented in
table 20, whilst table 21 contains the factor loadings obtained for model M2a. The internal
reliability results closely resemble the Australian and New Zealand results.
USA (n=287)
Scale M SD α* N of Items
Emotional Recognition 7.97 1.27 0.60 2
Emotional Expression 31.70 5.05 0.79 9
Understanding Emotions External 79.12 9.27 0.91 20
Emotions Direct Cognition 36.89 7.05 0.85 12
Emotional Management Self 25.75 4.42 0.86 7
Emotional Management Others 17.57 2.78 0.66 5
Emotional Control 33.40 5.07 0.83 9
Total EI (M2)* 232.42 24.52 0.75 7
Total EI (M2a)** 187.54 20.41 0.76 5
Model χ2 S-Bχ2 df S-Bχ2/
df
NNFI CFI RMSR SRMR RMSEA (CI) P
(close)
M1 4926.96* 4344.66* 1942 2.24 0.92 0.93 0.072 0.099 0.066
(0.063; 0.068)
0.00
M2 4447.03* 3936.07* 1931 2.04 0.94 0.94 0.066 0.090 0.060
(0.058; 0.063)
0.00
M2a 2850.58* 2391.10* 1165 2.05 0.95 0.95 0.063 0.087 0.061
(0.057; 0.064)
0.00
M3 3527.47* 3134.90* 1916 1.64 0.96 0.96 0.051 0.070 0.047
(0.044; 0.050)
0.94
Table 19
Subscale internal reliabilities, means and standard deviations for USA sample (n=287) models M2 and M2a
Note: S-Bχ2, Sattora-Bentler Scaled Chi-square; NNFI, non-normed fit index; CFI, comparative fit index; RMSR, root
mean squared residuals; SRMR, standardised root mean residual; RMSEA, root mean square error of approximation
with 90% confidence interval
* p < 0.001
Table 20
Goodness-of-fit statistics results of the single-group SUEIT CFAs for USA sample (n=287).
*Alphas calculated after missing values were imputed.
**Model M2a mean scores was calculated by omitting ER and EDC subscales.

116
Item EE UEX EMS EMO EC
7 0.73
10 0.36
14 0.65
20 0.68
26 0.36
32 0.66
37 0.23
42 0.65
61 0.46
1 0.63
5 0.66
8 0.45
13 0.51
16 0.64
17 0.70
22 0.69
23 0.34
27 0.65
29 0.46
33 0.54
34 0.74
38 0.58
43 0.49
45 0.66
48 0.72
52 0.55
56 0.61
59 0.68
63 0.49
2 0.61
11 0.66
49 0.78
54 0.81
57 0.75
60 0.70
64 0.46
15 0.55
28 0.51
39 0.70
44 0.59
58 0.34
4 0.59
6 0.55
9 0.72
19 0.56
25 0.51
31 0.73
36 0.47
41 0.68
46 0.57
Table 21
Summary of RML completely standardised parameter estimates for model M2a for USA
NOTE: All factor loadings are statistically significant (p<0.05).

117
Close fit evidence was only achieved for model M3 – similar to the Australian results. As
expected, goodness of fit systematically increased from model M1 to M3. Here, model M2
obtained NNFI and CFI values which approach the 0.95 cutoff, whilst clear evidence for
good model fit was indicated by the other results (RMSEA = 0.06, SRMR = 0.09). M3 once
again obtained the best fit. All factor loadings were statistically significant and ranged
from 0.23 (item 37) to 0.81 (item 54).
4.5.1.4 Italian results
Appendix 3 contains the descriptive statistics for M1 and M3, whilst table 22 contains the
descriptive statistics for measurement models M2 and M2a in this sample. The univariate
and multivariate normality of the 64 observed variables was inspected with PRELIS 2.8
(Jöreskog & Sörbom, 2002). The null hypothesis of multivariate normality (skewness and
kurtosis: χ2=4370.41, p=0.05) was rejected and hence the Satorra-Bentler chi-square
statistic is reported. Apart from the two subscales with the least number of items where
internal consistency is far below the acceptable benchmark of 0.70 (Nunnaly & Bernstein,
1994) the Emotional Management Self (and others) subscales also obtained an
unacceptably low alpha values. More specifically, the results revealed that the item 2 (“I
generate positive moods and emotions within myself to get over being frustrated at work”),
item 64 (“When a colleague upsets me at work, I think through what the person has said
and find a solution to the problem”) and item 54 (“I can easily snap out of feeling down at
work”) obtained negligible corrected item total correlations with the other items in the scale
(item 2 = 0.01, item 54 = 0.12 and item 64 = -0.01). This suggests that these items are not
measuring the same underlying construct24
.
24
Normally the standard procedure would be to remove these items from the scale before continuing with
other analyses. In this case the items were retained for the CFA analyses, so as to ascertain the practical
implications thereof, should the SUEIT be used in Italy in this form.

118
Italy (n=320)
Scale M SD α* N of Items
Emotional Recognition 7.18 1.44 0.33 2
Emotional Expression 28.62 5.53 0.72 9
Understanding Emotions External 72.61 9.25 0.82 20
Emotions Direct Cognition 33.57 6.04 0.69 12
Emotional Management Self 23.04 3.54 0.45 7
Emotional Management Others 15.48 2.82 0.39 5
Emotional Control 30.64 5.46 0.72 9
Total EI (M2)* 211.14 19.98 0.57 7
Total EI (M2a)** 170.39 18.14 0.62 5
Model χ2 S-Bχ2 df S-Bχ2/
df
NNFI CFI RMSR SRMR RMSEA (CI) P
(close)
M1 5151.72* 4213.28* 1942 2.17 0.79 0.80 0.10 0.096 0.061
(0.058; 0.063)
0.00
M2 4918.35* 4015.90* 1931 2.08 0.81 0.82 0.099 0.092 0.058
(0.056; 0.061)
0.00
M2a 3026.44* 2421.26* 1165 2.08 0.84 0.85 0.099 0.093 0.058
(0.055; 0.061)
0.00
M3 3963.59* 3221.02* 1916 1.68 0.88 0.89 0.088 0.082 0.046
(0.043; 0.049)
0.99
Table 23 provides the goodness-of-fit results for the single group CFA analyses over the
four measurement models. Even though the obtained RMSEA values over the four models
closely resemble the values obtained in the Australian analyses (which range from 0.060 to
0.041), poor incremental fit values emerged over all the models. Even when close fit was
achieved with model M3, the NNFI and CFI values did not meet the 0.90 cutoff criteria.
Table 24 contains the factor loadings for model M2a. Three items (items 64, 2, 32) obtain
non significant loadings smaller than |0.15|. Item 58 (“When colleagues get worked up I
stay out of their way”) obtained a non-significant loading (0.16). Item 37 (“Colleagues
Table 22
Subscale internal reliabilities, means and standard deviations for Italian sample (n=320) models M2 and M2a.
Note: S-Bχ2, Sattora-Bentler Scaled Chi-square; NNFI, non-normed fit index; CFI, comparative fit index; RMSR, root
mean squared residuals; SRMR, standardised root mean residual; RMSEA, root mean square error of approximation
with 90% confidence interval
* p < 0.001
*Alphas calculated after missing values were imputed.
**Model M2a mean scores was calculated by omitting ER and EDC subscales.
Table 23
Goodness-of-fit statistics results of the single-group SUEIT CFAs for Italian sample (n=320).

119
know when I am worried”) obtained the highest loading (0.77). This is a direct contrast
with the Australian, New Zealand and USA results where this item consistently obtained
the lowest loading over the entire instrument.
Item EE UEX EMS EMO EC
7 0.28
10 0.63
14 0.40
20 0.31
26 0.43
32 0.05
37 0.77
42 0.36
61 0.74
1 0.52
5 0.53
8 0.19
13 0.43
16 0.45
17 0.49
22 0.39
23 0.28
27 0.40
29 0.39
33 0.26
34 0.63
38 0.48
43 0.48
45 0.51
48 0.60
52 0.28
56 0.54
59 0.42
63 0.45
2 -0.02
11 0.48
49 0.65
54 0.22
57 0.61
60 0.58
64 -0.04
15 0.41
28 0.41
39 0.31
44 0.44
58 0.16
4 0.49
6 0.51
9 0.47
19 0.43
25 0.62
31 0.69
36 0.30
41 0.24
46 0.47
Table 24
Summary of RML completely standardised parameter estimates for model M2a for Italy
NOTE: All factor loadings are statistically significant (p<0.05) unless underlined.

120
4.5.1.5 Sri Lanka results
The means, standard deviations, and Cronbach Alpha’s per subscale for models M2 and
M2a, are presented in table 25 (see appendix 3 for the descriptive statistics of M1 and M3).
Consistent with the previous results, low alpha values were obtained for the two scales with
the least number of items (Emotional Recognition and Emotional Management Others)25
.
Contrary to the Italian results, and in line with the Australian, New Zealand and USA
results, the Emotional Management Self subscale obtained a relatively high alpha value
(0.74). This indicates that all the items contribute to an internally consistent description of
the Emotional Management Self dimension in this sample. Investigation of the univariate
and multivariate normality of the 64 observed variables revealed the rejection of the null
hypothesis of multivariate normality (skewness and kurtosis: χ2=8119.061, p=<0.05).
Results of the CFA analyses for models M2a and M3, with Robust Maximum Likelihood
estimation, is reported in table 26. No results for M1 and M2 are reported. For these two
measurement models, estimation problems were encountered and the solutions failed to
converge.
Sri Lanka (n=587)
Scale M SD α* N of Items
Emotional Recognition 7.26 1.20 0.30 2
Emotional Expression 30.58 4.39 0.69 9
Understanding Emotions External 73.98 8.11 0.84 20
Emotions Direct Cognition 33.28 4.93 0.64 12
Emotional Management Self 25.03 3.83 0.74 7
Emotional Management Others 17.36 2.33 0.40 5
Emotional Control 31.90 4.58 0.72 9
Total EI (M2)* 219.41 17.47 0.59 7
Total EI (M2a)** 178.80 17.39 0.73 5
25
Normally the standard procedure would be to remove these items from the scale before continuing with
further analyses. Similar to the Italian results these items were retained for the CFA analyses, so as to
ascertain the practical implications thereof, should the SUEIT be used in Sri Lanka in this form.
Table 25
Subscale internal reliabilities, means and standard deviations for Sri Lanka sample (n=587) models M2 and M2a.
*Alphas calculated after missing values were imputed.
**Model M2a mean scores was calculated by omitting ER and EDC subscales.

121
The absolute fit indices for Model M2a indicated reasonable to acceptable model fit, as an
RMSEA of 0.066 and SRMR of 0.080 were obtained. However, the incremental fit indices
did not meet the 0.90 cutoff. For M3 close fit was achieved as the H0: RMSEA ≤ 0.05
could not be rejected given that a p-value for the test of close fit (RMSEA < 0.05) equal to
0.17 emerged. Here the SRMR achieved the <0.08 cutoff, indicating a well-fitting model.
However, although the RMSEA value fell below the 0.06 cutoff for well-fitting models, the
incremental fit indices did not lean towards 0.95 as one would expect for a model that has
achieved close fit (e.g. as with the Australian, New Zealand results).
Model χ2 S-Bχ2 df S-Bχ2/
df
NNFI CFI RMSR SRMR RMSEA (CI) P
(close)
M2a 5297.12* 4149.78* 1165 3.56 0.87 0.87 0.061 0.080 0.066
(0.064; 0.068)
0.00
M3 5974.71* 4862.49* 1916 2.54 0.91 0.92 0.054 0.073 0.051
(0.049; 0.053)
0.17
As is evident in table 27, all the factor loadings were statistically significant and ranged
from 0.21 (item 37) to 0.70 (item 31: “I find it difficult to think clearly when I’m feeling
anxious about something at work”). In line with the Australian, New Zealand and USA
results, item 37 obtained the lowest loading over the whole instrument.
Note: S-Bχ2, Sattora-Bentler Scaled Chi-square; NNFI, non-normed fit index; CFI, comparative fit index; RMSR, root
mean squared residuals; SRMR, standardised root mean residual; RMSEA, root mean square error of approximation
with 90% confidence interval
* p < 0.001
Table 26
Goodness-of-fit statistics results of the single-group SUEIT CFAs for Sri Lanka sample (n=587).

122
Item EE UEX EMS EMO EC
7 0.58
10 0.26
14 0.61
20 0.54
26 0.33
32 0.45
37 0.21
42 0.57
61 0.35
1 0.48
5 0.51
8 0.49
13 0.45
16 0.23
17 0.48
22 0.52
23 0.47
27 0.45
29 0.50
33 0.50
34 0.41
38 0.43
43 0.50
45 0.51
48 0.38
52 0.52
56 0.46
59 0.58
63 0.39
2 0.35
11 0.60
49 0.67
54 0.45
57 0.65
60 0.65
64 0.40
15 0.36
28 0.27
39 0.56
44 0.42
58 0.23
4 0.39
6 0.44
9 0.59
19 0.43
25 0.55
31 0.70
36 0.28
41 0.42
46 0.48
4.5.1.6 South African White results
The descriptive statistics for measurement models M2 and M2a for this sample is presented
in table 28 (refer to appendix 3 for M1 and M3 descriptive statistics). The null hypotheses
Table 27
Summary of RML completely standardised parameter estimates for model M2a for Sri Lanka
NOTE: All factor loadings are statistically significant (p<0.05).

123
of univariate and multivariate normality was rejected (multivariate skewness and kurtosis:
χ2=3309.04 p<0.05). Robust Maximum Likelihood Estimation was employed to derive the
model parameter estimates for the four measurement models, presented in table 29. All the
subscales (except for Emotional Recognition) obtained alpha values well above the 0.70
cutoff. The alpha values ranged from 0.76 (Emotional Control and Emotional Expression)
to 0.89 (Understanding Emotions). The α=0.33 obtained for the Emotional Expression
subscale is in line with the Italian and Sri Lanka results and may be subscribed to the fact
that the scale only contains two items (“At work, I can detect my emotions as I experience
them” and “I find it hard to distinguish my emotions at work”).
South African White sample (n=290)
Scale M SD α* N of Items
Emotional Recognition 7.37 1.28 0.33 2
Emotional Expression 29.29 4.85 0.76 9
Understanding Emotions External 73.61 9.19 0.89 20
Emotions Direct Cognition 33.29 6.78 0.81 12
Emotional Management Self 24.25 4.09 0.78 7
Emotional Management Others 16.37 2.67 0.61 5
Emotional Control 32.15 4.87 0.76 9
Total EI (M2)* 216.33 20.21 0.59 7
Total EI (M2a)** 175.67 19.25 0.73 5
Model χ2 S-Bχ2 df S-Bχ2/
df
NNFI CFI RMSR SRMR RMSEA (CI) P
(close)
M1 8745.42* 6892.84* 1942 3.55 0.80 0.81 0.11 0.14 0.094
(0.092; 0.096)
0.00
M2 7761.03* 6080.73* 1931 3.15 0.84 0.84 0.10 0.13 0.086
(0.084; 0.089)
0.00
M2a 6072.63* 4627.44* 1165 3.97 0.80 0.81 0.10 0.13 0.10
(0.098; 0.10)
0.00
M3 6759.26* 5295.31* 1916 2.76 0.86 0.87 0.084 0.11 0.078
(0.076; 0.081)
0.00
Note: S-Bχ2, Sattora-Bentler Scaled Chi-square; NNFI, non-normed fit index; CFI, comparative fit index; RMSR, root
mean squared residuals; SRMR, standardised root mean residual; RMSEA, root mean square error of approximation
with 90% confidence interval
* p < 0.001
Table 29
South African White (n=290) goodness-of-fit statistics results for the single-group SUEIT CFAs
Table 28
Subscale internal reliabilities, means and standard deviations for South African White sample (n=290) models M2 and
M2a.
*Alphas calculated after missing values were imputed.
**Model M2a mean scores was calculated by omitting ER and EDC subscales.
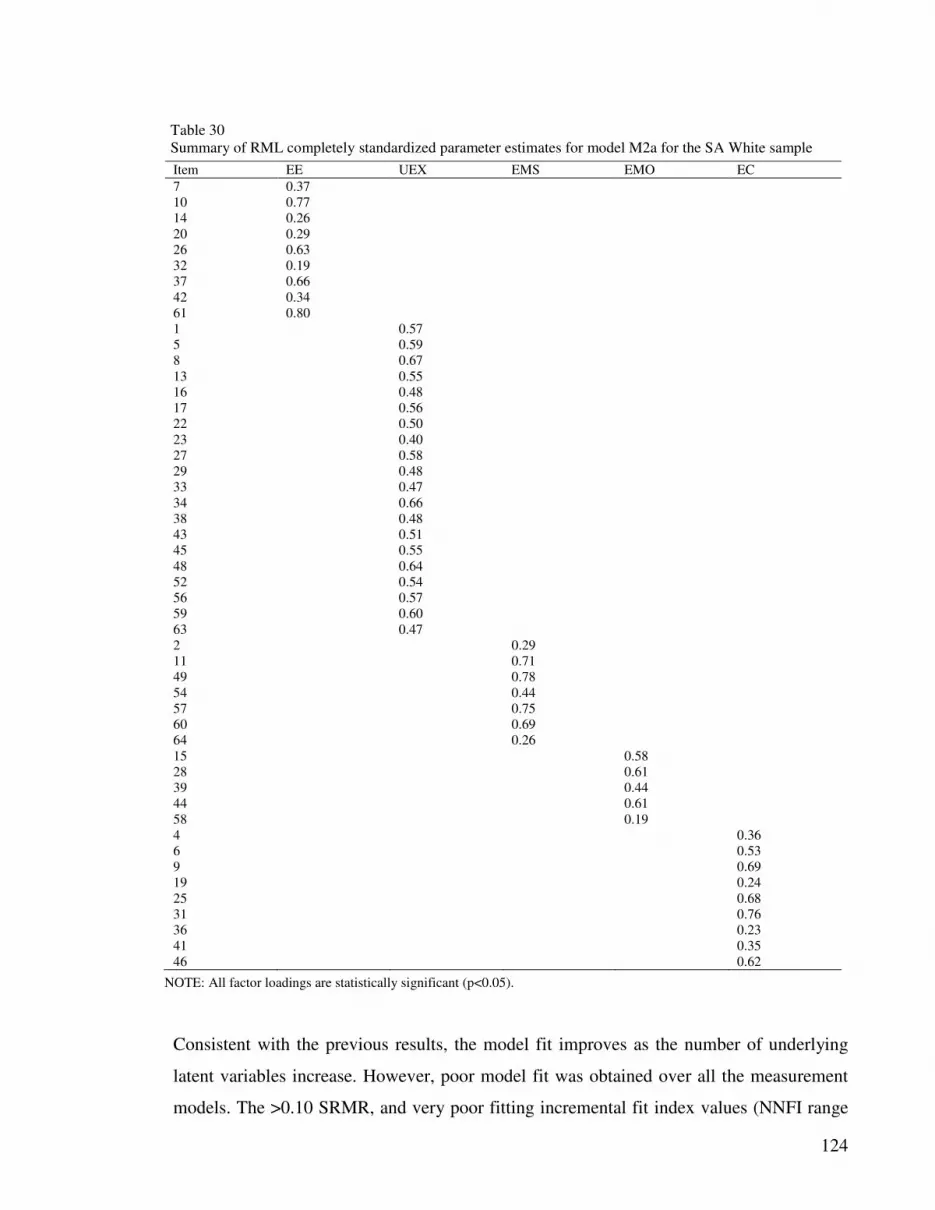
124
Item EE UEX EMS EMO EC
7 0.37
10 0.77
14 0.26
20 0.29
26 0.63
32 0.19
37 0.66
42 0.34
61 0.80
1 0.57
5 0.59
8 0.67
13 0.55
16 0.48
17 0.56
22 0.50
23 0.40
27 0.58
29 0.48
33 0.47
34 0.66
38 0.48
43 0.51
45 0.55
48 0.64
52 0.54
56 0.57
59 0.60
63 0.47
2 0.29
11 0.71
49 0.78
54 0.44
57 0.75
60 0.69
64 0.26
15 0.58
28 0.61
39 0.44
44 0.61
58 0.19
4 0.36
6 0.53
9 0.69
19 0.24
25 0.68
31 0.76
36 0.23
41 0.35
46 0.62
Consistent with the previous results, the model fit improves as the number of underlying
latent variables increase. However, poor model fit was obtained over all the measurement
models. The >0.10 SRMR, and very poor fitting incremental fit index values (NNFI range
Table 30
Summary of RML completely standardized parameter estimates for model M2a for the SA White sample
NOTE: All factor loadings are statistically significant (p<0.05).

125
from 0.80 – 0.86, and CFI range from 0.81 – 0.87) does not meet the cutoff criteria for
reasonable / acceptable fit. The RMSEA results support this, as the best value obtained
(M3) only marginally fell below the 0.080 cutoff for acceptable fit.
The factor loadings were all statistically significant and ranged from 0.19 (for item 32, “At
work I have trouble finding the right words to express how I feel” and item 58, “When
colleagues get worked-up I stay out of their way”) to 0.80 (item 61, “Colleagues can easily
tell how I feel”). In contrast with the Australian, and USA results where only one item
loading below 0.30 was obtained, in this sample 8 items obtained loadings lower than 0.30.
4.5.1.7 South African non-White results
Table 31 contains the means, standard deviations, and Cronbach Alpha’s per subscale for
models M2 and M2a (see appendix 3 for M1 and M3 descriptive statistics). Consistent with
the previous results, Emotional Recognition obtained the lowest alpha value. The value
obtained here is, however, the lowest over all the samples and would cast serious doubt on
using this subscale in any further analyses. Two other subscales obtained values below the
0.70 cutoff (i.e. the Emotional Management Others subscale with a value of 0.47 and the
Emotions Direct Cognition subscale which obtained a value of 0.65). In comparison with
the Emotional Management Others subscale which only has five items, the Emotions Direct
Cognition scale is the second longest subscale in the instrument (12 items). The relative
low alpha here, casts doubt on the internal consistency of the items contained in this scale,
when used in this sample. Both the null hypotheses of univariate and multivariate normality
for the 64 observed variables (items) were evaluated with PRELIS 2.8 (Jöreskog &
Sörbom, 2002) and was rejected (skewness and kurtosis: χ2=6080.94, p<0.05). Robust
Maximum Likelihood Estimation was employed to derive the model parameter estimates
presented in table 32. Similar to the Sri Lanka results, no results for models M1 and M2 are
reported. Estimation problems were encountered and the solutions failed to converge.

126
South African Non-White sample (n=337)
Scale M SD α* N of Items
Emotional Recognition 7.03 1.48 0.06 2
Emotional Expression 27.51 5.62 0.73 9
Understanding Emotions External 70.26 10.61 0.87 20
Emotions Direct Cognition 33.69 6.19 0.65 12
Emotional Management Self 24.25 4.73 0.74 7
Emotional Management Others 16.43 2.95 0.47 5
Emotional Control 31.72 5.99 0.79 9
Total EI (M2)* 211.12 25.29 0.69 7
Total EI (M2a)** 170.76 23.89 0.79 5
Model χ2 S-Bχ2 df S-Bχ2/
df
NNFI CFI RMSR SRMR RMSEA (CI) P
(close)
M2a 5503.49* 4043.73* 1165 3.47 0.87 0.88 0.13 0.12 0.086
(0.083; 0.089)
0.00
M3 5412.10* 4191.58* 1916 2.19 0.91 0.92 0.10 0.090 0.059
(0.057; 0.062)
0.00
From the results it is clear that for model M2a poor fit was achieved (RMSEA <0.09 and
SRMR >0.10). The poor incremental fit index values (NNFI=0.87 and CFI = 0.88) further
confirm the poor fit for this measurement model. A notable improvement is evident for
model M3. Here a RMSEA <0.060 indicative of a well-fitting model, coupled with NNFI
and CFI values that obtained the 0.90 cutoff provide evidence for a well-fitting model. Two
items obtained non significant loadings (items 58 and 64) smaller than |0.15|. However, no
other item loadings under 0.30 were obtained. Item 57 (“I find it difficult to maintain
positive moods and emotions when I’m under stress”) obtained the highest loading (0.82).
Note: S-Bχ2, Sattora-Bentler Scaled Chi-square; NNFI, non-normed fit index; CFI, comparative fit index; RMSR, root
mean squared residuals; SRMR, standardised root mean residual; RMSEA, root mean square error of approximation
with 90% confidence interval
* p < 0.001
Table 32
South African Non-White (n=337) goodness-of-fit statistics results of the single-group SUEIT CFAs
Table 31
Subscale internal reliabilities, means and standard deviations for South African Non-White sample (n=337) models
M2 and M2a.
*Alphas calculated after missing values were imputed.
**Model M2a mean scores was calculated by omitting ER and EDC subscales.

127
Item EE UEX EMS EMO EC
7 0.43
10 0.52
14 0.31
20 0.55
26 0.53
32 0.41
37 0.63
42 0.35
61 0.61
1 0.54
5 0.51
8 0.43
13 0.60
16 0.46
17 0.66
22 0.43
23 0.51
27 0.43
29 0.52
33 0.49
34 0.58
38 0.45
43 0.64
45 0.50
48 0.54
52 0.46
56 0.47
59 0.63
63 0.47
2 0.33
11 0.69
49 0.69
54 0.39
57 0.82
60 0.77
64 0.10
15 0.48
28 0.49
39 0.45
44 0.48
58 0.03
4 0.37
6 0.63
9 0.67
19 0.35
25 0.65
31 0.73
36 0.30
41 0.40
46 0.67
Table 33
Summary of RML completely standardised parameter estimates for model M2a for SA Non-White sample
NOTE: All factor loadings are statistically significant (p<0.05) unless underlined.

128
4.5.2 Results: Validity generalisation
Models M1-M3 are nested models. In Model M2a two subscales (Emotional Recognition
and Emotions Direct Cognition) were omitted from the seven factor structure measurement
model (M2). Hence, the chi-square difference test26
could not be used to compare M1- M3
with M2a. An alternative strategy, the comparison of the Expected Cross-Validation Index
(ECVI; Brown & Cudeck, 1989) and Akaike’s Information Criterion (AIC)27
, was used.
The ECVI is most useful in comparing the performance of one model to another (Hair et
al., 2006). Table 34 lists the values obtained for the various samples and models. Lower
values indicate better fit as they are a function of the minimum values of the population
discrepancy function (Mels, personal communication, 2008).
From the results it is clear that model M2a, consistently obtained the lowest ECVI and AIC
values over all the samples. The only exception is with the Australian sample A where the
ECVI = 4.63, and AIC = 7415.53 for model M3 was lower than for model M2a (ECVI =
4.93, AIC = 7896.40). Based on these results, model M2a was used as the baseline model
for the invariance analyses.
4.5.3 Discussion: validity extension and generalisation results
Validity extension is a form of model cross-validation (Diamantopoulos & Siguaw, 2000).
The aim of applying this loose replication strategy (Bentler, 1980) was to assess the
factorial validity of various SUEIT measurement models over various cultural groups. It is
proposed that the successful replication of a given measurement model (i.e. M1 / M2 / M2a
/ M3) in different cultures may provide some support for regarding EI (and its various
facets as encapsulated by the SUEIT) as a universal individual difference (at least over the
limited cultural groups included in this study). The practice of fitting competing factor
26
The chi-square difference test can only be used for comparison of nested models. According to (Mels,
personal communication, 2008) models are considered to be nested when the parameter estimates are derived
from exactly the same items and covariation matrix. With the omission of 14 items for the purposes of fitting
model M2a, this assumption is violated, and an alternative strategy was used to compare the four
measurement model results. 27
The information criteria require a sample size of at least 200 to make its application reliable. This fit
measure is also affected by departures from multivariate normality (Diamantopoulos & Sigauw, 2000). Both
these conditions were met in the present study as all samples had more than 200 cases, and multivariate
normality problems were addressed by employing RML estimation.

M1 M2 M2a M3
Model ECVI
(Indep, Sat)
Model AIC
(Indep, Sat)
Model ECVI
(Indep, Sat)
Model AIC
(Indep, Sat)
Model ECVI
(Indep, Sat)
Model AIC
(Indep, Sat)
Model ECVI
(Indep, Sat)
Model AIC
(Indep, Sat)
Australia A (n=1604) 8.47
(99.40; 2.60)
13574.53
(159336.79; 4160.00)
7.10
(96.75; 2.60)
11376.90
(155086.08; 4160.00)
4.93
(72.42; 1.59)
7896.40
(116085.02; 2550.00)
4.63
(99.40; 2.60)
7415.53
(159336.79; 4160.00)
Australia B (n=1605) 8.20
(94.53; 2.59)
13156.06
(151626.75; 4160.00)
6.82
(91.83, 2.59)
10947.12
(147289.10; 4160.00)
4.39
(68.51; 1.59)
7043
(109885.57; 2550.00)
4.62
(94.53; 2.59)
7407.35
(151626.75; 4160.00)
USA (n=287) 16.16
(122.33; 14.55
4620.66
(34986.49; 4160.00)
14.80
(122.33; 14.55)
4234.07
(34986.49; 4160.00)
9.13
(91.27; 8.92)
2611.10
(26102.19; 2550.00)
12.11
(122.33; 14.55)
3462.90
(34986.49; 4160.00)
New Zealand (n=234) 16.40
(84.05; 17.85)
3821.37
(19582.57; 4160.00)
15.08
(84.05; 17.85)
3512.64
(19582.57; 4160.00)
9.21
(58.62; 10.94)
2145.82
(13657.56; 2550.00)
12.43
(84.05;17.85)
2895.67
(19582.57; 4160.00)
Italy (n=320) 14.07
(42.46; 13.04)
4489.28
(13545.29; 4160.00)
13.52
(42.46; 13.04)
4313.90
(13545.29; 4160.00)
8.28
(29.82, 7.99)
2641.26
(9511.33; 2550.00)
11.13
(42.46; 13.04)
3549.02
(13545.29; 4160.00)
SA White (n=290) 24.81
(98.50; 14.39)
7168.84
(28466.83; 4160.00)
22.07
(98.50; 14.39)
6378.73
(28466.83; 4160.00)
16.77
(68.94; 8.82)
4847.44
(19924.99; 2550.00)
19.46
(98.50; 14.39)
5623.31
(28466.83; 4160.00)
SA Non-White (n=337) - - - - 12.65
(72.37; 7.57)
4263.73
(24388.72; 2550.00)
13.41
(88.56; 12.34)
4519.58
(29843.04; 4160.00)
Sri Lanka (n=587) - - - - 7.46
(42.61; 4.35)
4369.78
(24968.93; 2550.00)
8.78
(62.38; 7.04)
5190.49
(36866.86; 4160.00)
Table 34
Values for absolute fit indices over all countries for the four measurement models
NOTE: M1 = original five factor structure (Palmer & Stough, 2001); M2 = seven factor structure (Stough, personal communication, 2007; M2a = modified five factor structure; M3 =
nine factor structure (Gignac, 2005); Model ECVI / AIC = values derived for the model at hand; Indep = ECVI / AIC for Independence model (a model in which all observed variables
are uncorrelated, Diamantopoulos & Siguaw, 2000); Sat = ECVI / AIC for Saturated model (a model in which the number of parameters to be estimated is exactly equal to the number
of variances and covariances among the observed variables; Diamantopoulos & Siguaw, 2000),

130
structures over different cultures (as was done here), may strenghen this finding as it allows
for a wider investigation regarding possible construct bias over different cultural groups.
That is, by conducting a validity generalisation investigation more / different facets of the
construct were assessed over different cultural groups. However, single group CFA analysis
is a weaker test of investigating construct bias than when configural invariance is tested
over different groups (i.e. analyses presented in section 4.5.4).
From the results it is clear that the original five factor model (Palmer & Stough, 2001) is
the least adequate representation of the data in all the samples. For Australia, the USA and
New Zealand, both the absolute fit index results (SRMR and RMSEA) obtained values that
fell just within the range for well fitting models (SRMR from 0.1 to 0.08; RMSEA from
0.059 to 0.066). In addition, the incremental fit indices confirmed this with values ranging
from 0.90 to 0.93. Generally, it would seem that as the CD between Australia and the non-
Western countries increases, the fit of the five factor model deteriorated substantially. For
example, the five factor model was non admissible in the Sri Lanka and South African non-
White data. For the South African White data very poor model fit was achieved (RMSEA =
0.094, NNFI = 0.80, CFI=0.81). Gignac (2005) conducted a series of unrestricted factor
analyses on the 64 items of the SUEIT (with an Australian sample) and reported the
existence of 6 substantive factors (i.e. Emotional Management Self, Understanding
Emotions External, Emotional Expression, Emotions to Direct Cognition, Emotional
Control, and Emotional Management of Others) that explained 37.2% of the variance,
collectively. In addition, he also concluded that there was evidence suggesting that the
factor structure contained item keyed method variance within the Australian data. In the
light of this finding, it could be argued that the poor fitting five factor structure may be due
to the fact that more factors are needed to represent the data, and/or that method bias is
leading to a distortion of the CFA results (an hypothesis that is investigated in section 4.5.6
of this dissertation). On a practical level, however, these results suggest that the five factor
structure should not be considered generalisable over the cultural groups included in this
study.

131
A fairly clear pattern emerged for the rest of the results. Consistent with known SEM
convention, as the number of latent factors that was modeled increased, so did the
goodness-of-fit results. More specifically, close fit was achieved for the nine factor model
in all, but for the two South African, samples. In the South African White sample, the nine
factor model obtained better fit than models M2 and M2a, although the results here would
still be considered poor (RMSEA = 0.078, SRMR=0.11, NNFI=0.86, CFI=0.87) by
conventional standards. Hence, it is concluded that the nine factor model (M3) was the
model with the best generalisability potential over all the samples. The model with the
second best generalisation potential is model M2a. This model, generally, obtained better
fit indices than model M2 (with the exception of the Australia A and South African White
data). No admissible solutions could be derived for model M2 in the South African non-
White and Sri Lanka data. However, with the omission on the Emotional Recognition and
Emotions Direct Cognition subscales, admissible solutions for model M2a in these two
groups were obtained, although the fit was poor (SA Non-White: RMSEA=0.086,
SRMR=0.12, NNFI=0.87, CFI=0.88; Sri Lanka: RMSEA=0.066, SRMR = 0.080, NNFI =
0.87; CFI = 0.87).
The main goal for investigating the validity generalisation potential of different
measurement models was to identify the model that would replicate the best over all the
samples. This model was used as the baseline model for the invariance analyses. Although
the nine factor model (M3) showed the best generalisation potential, four reasons are put
forward why model M2a was used as the baseline model for the invariance analyses. First,
the nine factor model is very complex (64 items, 9 factors). Various attempts to execute
multi-group CFA with this model failed. Model M2a is less complex with 50 observed
variables and 5 latent factors and MI results were attainable over all the samples. Secondly,
after splitting the original Emotional Recognition and Expression subscale into two
subscales (i.e. Emotional Recognition and Emotional Expression) only two items were
retained in the Emotional Recognition subscale. According to Hair et al., (2006) constructs
with only one or two items increase the likelihood of problems with interpretational
confounding, as well as increasing the higher likelihood of estimation problems. Others
have suggested that a minimum of 4 items per construct is required for SEM research

132
(Muliak & Millsap, 2000). Thirdly, according to Gignac (2005) the negatively and
positively keyed items in the Emotions Direct Cognition subscale share respective
substantive and item keyed variance, making this scale very complicated28
. Gignac (2005)
reported, for example, the largest difference (d=1.96) between the two conceptually
equivalent, but oppositely keyed items, “Examination of feelings is useful in solving work
related problems” and “My problem solving at work is based on sound reasoning rather
than feelings”. He conclude that (Gignac, 2005, p.155), “it would appear that the phrasing
of the positively keyed items makes it easier to endorse. Individuals might believe that the
use of emotions in this context can be useful, however, not to the extent of not using
reasoning. Further, the negatively keyed item has a possible connotation that problem
solving should be based on feelings and not reasoning, which is not what the theory
underlying EDC is (or should be) about”. Lastly, the subscales that remained in model
M2a, after omission of Emotions Direct Cognition and Emotional Recognition, are the core
EI facets that pertain to emotional expression and regulation (i.e. management and control).
Most of the theoretical arguments put forward in chapter three focused on these two aspects
of EI. No substantive arguments regarding proposed cross-cultural differences in emotional
reasoning (i.e. use of emotions in thought), was proposed. Hence, the Emotions Direct
Cognition subscale was not deemed a core area of investigation in this study. In the light of
these considerations, model M2a was utilised as the best fitting baseline model for the
purposes of the invariance analyses.
4.5.4 Results: cross-cultural validation (testing MI)
The MI analyses (series of multi-group analyses) were carried out with measurement model
M2a, utilising the item raw scores in the all the samples. In all the analyses, the fully
unconstrained model (configural invariance model, M0) was used as the fixed baseline
model. The results of the configural invariance models were interpreted in terms of the
28
In a more recent analyses aimed at uncovering a taxonomic model of EI (Palmer, Gignac, Ekermans &
Stough, 2008), the Emotional Reasoning facet (i.e. the skill with which individuals’ reason with emotional
information in thought – the EDC scale in the SUEIT) did not emerge in a exploratory factor analysis of the
subscales of five prominent EI measures (MSCEIT, EQ-i; TMMS, TAS-20 and SEI). It would seem that this
facet of EI is currently not being reliably assessed by other existing measures, as seems to be case with the
EDC scale in the SUEIT.

133
different degrees of structural equivalence that was obtained over the different cultural
groups.
Next, the omnibus test for the equality of variance-covariance matrices (Vandenberg &
Lance, 2000), with the condition that all parameter estimates are set to be equal across
samples (M1), was conducted. If covariance matrices do not differ across groups, then
overall MI is establish, and further test of the other aspects of measurement equivalence are
not necessary. If, however, the null hypothesis (Σg = Σ
g’) of exact fit for model M1 (fully
constrained model) is rejected, then subsequent tests is warranted (Vandenberg & Lance,
2000). The critical question, however, is whether the model fit deteriorate significantly
when the equality constraint (fully constrained) was imposed on the model in comparison
to the multi-group analysis in which parameter estimates were allowed to differ across
samples (fully unconstrained). Hence, to establish the omnibus test result, the difference in
the Satorra-Bentler Chi-Square (based on adjustment formula; Satorra & Bentler, 1999)
under constrained and unconstrained conditions is calculated.
If full measurement invariance (omnibus test) was not achieved, then the test of metric
invariance was conducted next by constraining the factor loadings of like items on latent
variables, to be equal across groups (M2). Failure to reject the null hypothesis (Λg
x =
Λ
g x’)
would provide evidence for metric invariance over the different groups (Vandenberg &
Lance, 2000). Only if evidence of full metric invariance is found then the hypothesis that
the vector of item intercepts is invariant (scalar invariance, τg
x =
τ
g x’) across groups could
be conducted.
The MI results are presented in tables 35 – 40. Separate analyses29
were conducted for
every county with Australia as the reference group.
29
It is possible to conduct one invariance analysis with all the samples. However, the strategy to use separate
analyses served the goals of this study more accurately. That is, in order to establish a pattern of fit between
Australia and the other countries (and test whether it resembles any of the two proposed CDR patterns, see
hypotheses 1 and 2), the separate analyses needed to be executed. In addition, by conducting separate analyses
it was possible to match the age and gender composition of the Australian sample to every other county
sample, separately. If only one analysis was conducted, the comparability of the samples would have been
even lower, as none of them would have been matched on at least size, age and gender (as is currently the
case).

134
Invariance Model S-Bχ2 df S-Bχ2/
df
∆df ∆ S-Bχ2 NNFI
/ TLI
CFI RMSEA
(CI)
P
(close)
SRMR
M0. Unconstrained
(number of factors
invariant)
3874.72* 2330 1.66 - - 0.94 0.94 0.053
(0.050;
0.056)
0.032 0.089
M1. Invariant variance-
covariance matrices
(Σg = Σg’)
1 versus 0
3963.10*
-
2440
-
1.62
-
-
110
-
107.971
0.94
-
0.94
-
0.052
(0.049;
0.055)
-
0.16
-
0.091
-
Invariance Model S-Bχ2 df S-Bχ2/
df
∆df ∆ S-Bχ2 NNFI
/ TLI
CFI RMSEA
(CI)
P
(close)
SRMR
M0. Unconstrained
(number of factors
invariant)
4530.13* 2330 1.94 - - 0.95 0.95 0.057
(0.055;
0.060)
0.00 0.087
M1. Invariant variance-
covariance matrices
(Σg = Σg’)
1 versus 0
4898.63*
-
2440
-
2.01
-
110
303.281
0.95
-
0.95
-
0.059
(0.057;
0.062)
-
0.00
-
0.12
-
M2. Invariance of factor
loadings (Λg = Λg’)
2 versus 0
4597.04*
-
2375
-
1.94
-
-
45
-
58.532
0.95
-
0.95
-
0.057
(0.055;
0.060)
0.00
-
0.094
-
Table 36
Results of the Australian (n=287) and USA (n=287) cross-national configural, omnibus and metric invariance analyses
Note: S-Bχ2, Satorra-Bentler Chi-square, NNFI / TLI; Non-Normed Fit Index / Tucker Lewis Index, CFI,
Comparative Fit Index; RMSEA, Root Mean Square Error of Approximation with 90% confidence interval;
SRMR, Standardised Root Mean Square Residual *p < 0.05; 1: p < 0.05 (p=0.00); 2: p > 0.05 (p=0.084)
Table 35
Results of the Australian (n=234) and New Zealand (n=234) cross-national configural and omnibus invariance analyses
NOTE: S-Bχ2, Satorra-Bentler Chi-square, NNFI / TLI; Non-Normed Fit Index / Tucker Lewis Index, CFI,
Comparative Fit Index; RMSEA, Root Mean Square Error of Approximation with 90% confidence interval;
SRMR, Standardised Root Mean Square Residual *p<0.05; 1: p > 0.05 (p=0.536)
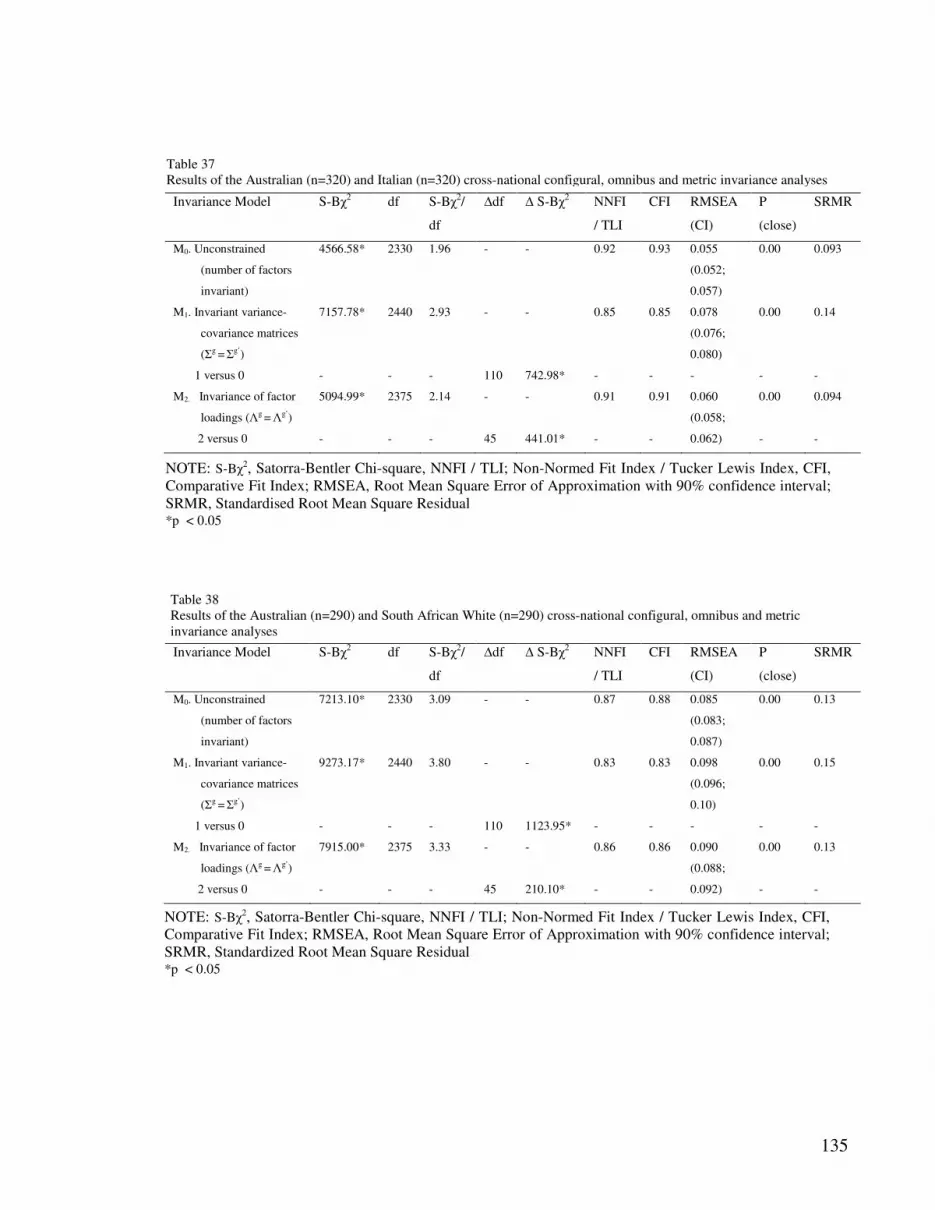
135
Invariance Model S-Bχ2 df S-Bχ2/
df
∆df ∆ S-Bχ2 NNFI
/ TLI
CFI RMSEA
(CI)
P
(close)
SRMR
M0. Unconstrained
(number of factors
invariant)
4566.58* 2330 1.96 - - 0.92 0.93 0.055
(0.052;
0.057)
0.00 0.093
M1. Invariant variance-
covariance matrices
(Σg = Σg’)
1 versus 0
7157.78*
-
2440
-
2.93
-
-
110
-
742.98*
0.85
-
0.85
-
0.078
(0.076;
0.080)
-
0.00
-
0.14
-
M2. Invariance of factor
loadings (Λg = Λg’)
2 versus 0
5094.99*
-
2375
-
2.14
-
-
45
-
441.01*
0.91
-
0.91
-
0.060
(0.058;
0.062)
0.00
-
0.094
-
Invariance Model S-Bχ2 df S-Bχ2/
df
∆df ∆ S-Bχ2 NNFI
/ TLI
CFI RMSEA
(CI)
P
(close)
SRMR
M0. Unconstrained
(number of factors
invariant)
7213.10* 2330 3.09 - - 0.87 0.88 0.085
(0.083;
0.087)
0.00 0.13
M1. Invariant variance-
covariance matrices
(Σg = Σg’)
1 versus 0
9273.17*
-
2440
-
3.80
-
-
110
-
1123.95*
0.83
-
0.83
-
0.098
(0.096;
0.10)
-
0.00
-
0.15
-
M2. Invariance of factor
loadings (Λg = Λg’)
2 versus 0
7915.00*
-
2375
-
3.33
-
-
45
-
210.10*
0.86
-
0.86
-
0.090
(0.088;
0.092)
0.00
-
0.13
-
Table 38
Results of the Australian (n=290) and South African White (n=290) cross-national configural, omnibus and metric
invariance analyses
NOTE: S-Bχ2, Satorra-Bentler Chi-square, NNFI / TLI; Non-Normed Fit Index / Tucker Lewis Index, CFI,
Comparative Fit Index; RMSEA, Root Mean Square Error of Approximation with 90% confidence interval;
SRMR, Standardized Root Mean Square Residual *p < 0.05
Table 37
Results of the Australian (n=320) and Italian (n=320) cross-national configural, omnibus and metric invariance analyses
NOTE: S-Bχ2, Satorra-Bentler Chi-square, NNFI / TLI; Non-Normed Fit Index / Tucker Lewis Index, CFI,
Comparative Fit Index; RMSEA, Root Mean Square Error of Approximation with 90% confidence interval;
SRMR, Standardised Root Mean Square Residual *p < 0.05

136
Invariance Model S-Bχ2 df S-Bχ2/
df
∆df ∆ S-Bχ2 NNFI
/ TLI
CFI RMSEA
(CI)
P
(close)
SRMR
M0. Unconstrained
(number of factors
invariant)
6197.86* 2330 2.66 - - 0.90 0.91 0.070
(0.068;
0.072)
0.00 0.11
M1. Invariant variance-
covariance matrices
(Σg = Σg’)
1 versus 0
9068.13*
-
2440
-
3.72
-
-
110
-
880.65*
0.84
-
0.85
-
0.090
(0.088;
0.092)
-
0.00
-
0.17
-
M2. Invariance of factor
loadings (Λg = Λg’)
2 versus 0
6770.43*
-
2375
-
2.85
-
-
45
-
470.58*
0.89
-
0.90
-
0.074
(0.072;
0.076)
0.00
-
0.11
-
Invariance Model S-Bχ2 df S-Bχ2/
df
∆df ∆ S-Bχ2 NNFI
/ TLI
CFI RMSEA
(CI)
P
(close)
SRMR
M0. Unconstrained
(number of factors
invariant)
7770.82* 2330 3.34 - - 0.91 0.91 0.063
(0.062;
0.065)
0.00 0.080
M1. Invariant variance-
covariance matrices
(Σg = Σg’)
1 versus 0
9366.94*
-
2440
-
3.83
-
-
110
-
938.91*
0.89
-
0.89
-
0.070
(0.068;
0.071)
-
0.00
-
0.10
-
M2. Invariance of factor
loadings (Λg = Λg’)
2 versus 0
8029.65*
-
2375
-
3.38
-
-
45
-
258.69*
0.91
-
0.91
-
0.064
(0.062;
0.065)
0.00
-
0.085
-
Table 39
Results of the Australian (n=337) and South Africa Non-White (n=337) cross-national configural, omnibus and metric
invariance analyses
Table 40
Results of the Australian (n=587) and Sri Lanka (n=587) cross-national configural, omnibus and metric invariance
analyses
NOTE: S-Bχ2, Satorra-Bentler Chi-square, NNFI / TLI; Non-Normed Fit Index / Tucker Lewis Index, CFI,
Comparative Fit Index; RMSEA, Root Mean Square Error of Approximation with 90% confidence interval;
SRMR, Standardised Root Mean Square Residual *p < 0.05
NOTE: S-Bχ2, Satorra-Bentler Chi-square, NNFI / TLI; Non-Normed Fit Index / Tucker Lewis Index, CFI,
Comparative Fit Index; RMSEA, Root Mean Square Error of Approximation with 90% confidence interval;
SRMR, Standardized Root Mean Square Residual *p < 0.05

137
4.5.5 Discussion: cross-cultural validation
Construct bias
This discussion will focus on all the results, as well as the specific hypotheses that were
investigated. These included:
Hypothesis 1(a): The construct bias pattern of influence on the transportability of the
SUEIT will resemble CDR pattern 1 (described in tables 4 & 6).
Hypothesis 1(b): The construct bias pattern of influence on the transportability of the
SUEIT will resemble CDR pattern 2 (described in table 5).
In the Australian, New Zealand analyses the null hypothesis of Σg = Σ
g’ could not be
rejected (∆ S-Bχ2
(110) = 107.97, p>0.05). Thus, evidence for full measurement invariance
was attained in this sample. No further tests of invariance were needed here (Vandenberg &
Lance, 2000) and latent mean scores may be compared directly over these two cultural
groups. Hence, the results suggest that the instrument may be transported and used in New
Zealand to make meaningful inferences over these two groups.
For the separate Australian and USA, Italian, South African White and non-White, as well
as Sri Lanka analyses the results of the omnibus test revealed that full invariance was not
achieved (USA: ∆ S-Bχ2
(110) = 303.28, p<0.05; Italian: ∆ S-Bχ2
(110) = 742.98, p<0.05; South
African White: ∆ S-Bχ2
(110) = 1123.95, p<0.05; South African Non-White: ∆ S-Bχ2
(110) =
880.65, p<0.05; Sri Lanka: ∆ S-Bχ2
(110) = 938.91, p<0.05).
As expected (due to the omnibus test results), the best configural invariance (M0) results
were attained in the Australian, New Zealand analyses. Here the p-value for close fit
(p=0.032) leaned towards the p>0.05 cutoff and the incremental fit indices leaned towards
0.95 (NNFI = 0.94, CFI=0.94). The RMSEA of 0.053 underscored this result. Although the
Australian, USA analysis attained slightly better NNFI and CFI values for model M0 (0.95),
the rest of the results suggested that the configural invariance fit was not as good as for the
New Zealand analyses (i.e. RMSEA = 0.057, p(close fit)<0.05). The results, however, still
indicate a very well fitting model (RMSEA < 0.060, CFI and NNFI = 0.95, SRMR<0.09).
The next best configural invariance model fit was achieved with the Australian, Italian
138
analysis. Here the RMSEA of 0.055 is slightly better than the value obtained in the USA
analyses. However, in comparison with the other USA results, less good fit was indicated
(NNFI=0.92, CFI=0.93, SRMR=0.093). Surprisingly, the results suggested that the
Australian, Sri Lanka M0 model fit was better than for both the South African analyses.
More specifically, here a RMSEA=0.063 and NNFI=0.90, CFI=0.91 was achieved. The
SRMR also attained the 0.080 cutoff. The Australian, South African non-White data results
(RMSEA=0.070, NNFI=0.90, CFI=0.91 and SRMR=0.11) was better than the Australian,
South African White results (RMSEA=0.085, NNFI=0.87, CFI=0.88, SRMR=0.13). Hence
the pattern for the configural invariance results is as follows: New Zealand, USA, Italy, Sri
Lanka, South Africa non-White and South Africa White. This sequence does not
correspond with either of the proposed CDR patterns (pattern 1 or 2). Thus, neither
hypothesis 1(a) or 1(b) is supported.
The results do, however, provide some support for the transportability of the instrument, at
least at structural equivalence level30
, to all the samples (although the South African White
results were mediocre). The New Zealand and USA results also provide some evidence to
suggest that for the smallest cultural distance (i.e. all Western countries) the influence of
construct bias would seem to be the least. That is, the psychometric properties of the
instrument would seem to not be adversely impacted when the instrument is transported to
these cultures.
As evidence for configural invariance was established in all the samples, the metric
invariance test was conducted next. The results revealed that full metric invariance was
obtained in the Australia, USA analysis (∆ S-Bχ2
(45) = 58.53, p>0.05). The pattern of non -
metric invariance, according to the chi-square different test, is as follows: South Africa
White (∆ S-Bχ2
(45) = 210.10, p<0.05), Sri Lanka (∆ S-Bχ2
(45) = 258.69, p<0.05), Italy (∆ S-
Bχ2
(45) = 441.01, p<0.05), South African non-White (∆ S-Bχ2
(45) = 470.58, p<0.05). Model
comparisons may also be evaluated based on the change in the CFI. More specifically,
changes in CFI of -0.01 or less indicate that the invariance hypothesis should not be
30
This is a replication / confirmation of the Tucker’s Phi results (see appendix 4) where congruence
coefficients of >0.98 was achieved over all the samples (except for the Italian Emotional Management self
subscale).
139
rejected. Possible differences may be evidenced by a change of between -0.01 and -0.02,
whilst changes greater than -0.02 point to a definite lack of invariance (Vandenberg &
Lance, 2000). In the Italian and South African White results CFI changes of -0.02 was
obtained, supporting the lack of metric invariance. In the Sri Lanka results, no change in the
CFI was evident, whilst a -0.01 change was observed for the South African non-White
analysis. This may suggest that for these two samples, according to the practical
significance test, full metric invariance was obtained. The remaining fit indices in the Sri
Lanka results indicated good model fit (RMSEA=0.064, SRMR=0.085) whilst the same
was not true for the South African non-White results (RMSEA=0.074, SRMR=0.11). This
does cast some doubt on the plausibility of assuming full metric invariance did hold here.
After consideration of all the results obtained over all the samples, the overall pattern for
(non)metric invariance may be listed as follows: USA (∆ S-Bχ2
(45) = 58.53, p>0.05, ∆CFI
=0), Sri Lanka (∆ S-Bχ2
(45) = 258.69, p<0.05, ∆CFI = 0), South Africa Non-White (∆ S-Bχ2
(45) = 470.58, p<0.05, ∆CFI= -0.01), Italy (∆ S-Bχ2
(45) = 441.01, p<0.05, ∆CFI=-0.02) and
South Africa White (∆ S-Bχ2
(45) = 210.10, p<0.05, ∆CFI=-0.02). It was proposed that lack
of metric invariance is likely due to method bias (Van Herk et al., 2004). Thus, it could be
argued that the possibility of a common method artifact may have obscured the South
African, and possibly the other results, influencing the viability of the MI testing
procedures. Hence, the method bias results are reported next.
4.5.6 Results: method bias
Two sources of method bias (i.e. cultural response styles attributed to national cultural
dimension differences and the influence of verbal ability / bilingualism of respondents) on
the MI results were investigated. Two approaches were followed.
Response styles: ERS and ARS indices
In this study national differences in response styles are viewed as a potential source of
method bias and, thus, as potentially resulting in a distortion of cross-cultural differences in
the target variables. The metric invariance results were further investigated by exploring the
ERS and ARS per sample and subscale. In order to obtain a comprehensive overview the
ERS and ARS indices were calculated for all the samples.
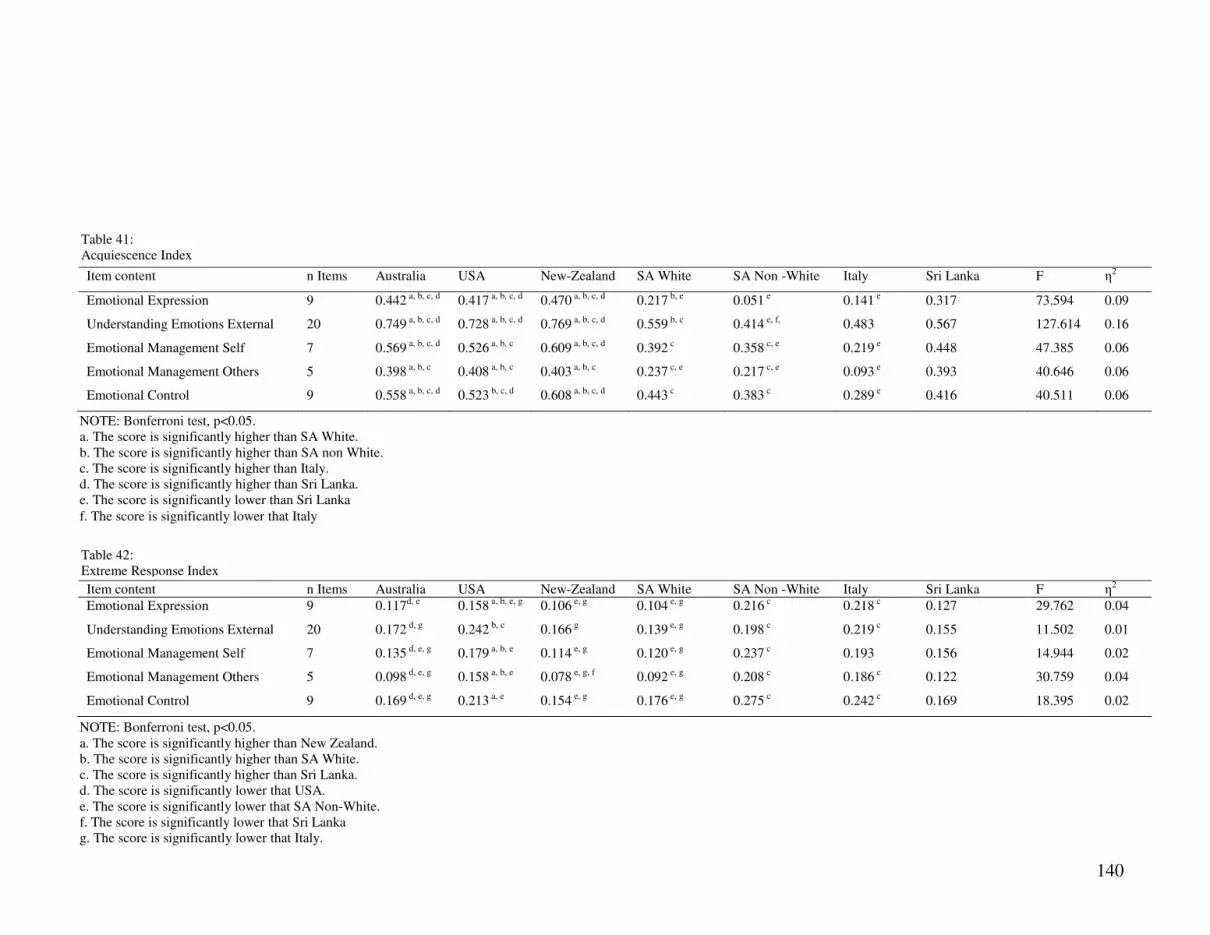
140
Item content n Items Australia USA New-Zealand SA White SA Non -White Italy Sri Lanka F η2
Emotional Expression 9 0.442 a, b, c, d 0.417 a, b, c, d 0.470 a, b, c, d 0.217 b, e 0.051 e 0.141 e 0.317 73.594 0.09
Understanding Emotions External 20 0.749 a, b, c, d 0.728 a, b, c, d 0.769 a, b, c, d 0.559 b, c 0.414 e, f, 0.483 0.567 127.614 0.16
Emotional Management Self 7 0.569 a, b, c, d 0.526 a, b, c 0.609 a, b, c, d 0.392 c 0.358 c, e 0.219 e 0.448 47.385 0.06
Emotional Management Others 5 0.398 a, b, c 0.408 a, b, c 0.403 a, b, c 0.237 c, e 0.217 c, e 0.093 e 0.393 40.646 0.06
Emotional Control 9 0.558 a, b, c, d 0.523 b, c, d 0.608 a, b, c, d 0.443 c 0.383 c 0.289 e 0.416 40.511 0.06
Item content n Items Australia USA New-Zealand SA White SA Non -White Italy Sri Lanka F η2
Emotional Expression 9 0.117d, e 0.158 a, b, e, g 0.106 e, g 0.104 e, g 0.216 c 0.218 c 0.127 29.762 0.04
Understanding Emotions External 20 0.172 d, g 0.242 b, c 0.166 g 0.139 e, g 0.198 c 0.219 c 0.155 11.502 0.01
Emotional Management Self 7 0.135 d, e, g 0.179 a, b, e 0.114 e, g 0.120 e, g 0.237 c 0.193 0.156 14.944 0.02
Emotional Management Others 5 0.098 d, e, g 0.158 a, b, e 0.078 e, g, f 0.092 e, g 0.208 c 0.186 c 0.122 30.759 0.04
Emotional Control 9 0.169 d, e, g 0.213 a, e 0.154 e, g 0.176 e, g 0.275 c 0.242 c 0.169 18.395 0.02
Table 41:
Acquiescence Index
Table 42:
Extreme Response Index
NOTE: Bonferroni test, p<0.05.
a. The score is significantly higher than SA White.
b. The score is significantly higher than SA non White.
c. The score is significantly higher than Italy.
d. The score is significantly higher than Sri Lanka.
e. The score is significantly lower than Sri Lanka
f. The score is significantly lower that Italy
NOTE: Bonferroni test, p<0.05.
a. The score is significantly higher than New Zealand.
b. The score is significantly higher than SA White.
c. The score is significantly higher than Sri Lanka.
d. The score is significantly lower that USA.
e. The score is significantly lower that SA Non-White.
f. The score is significantly lower that Sri Lanka
g. The score is significantly lower that Italy.

141
The procedure described in Van Herk et al. (2004) was used to compute the ERS and ARS
indices. To calculate the ERS index the frequencies of responses in the 1 and 5 response
categories (per respondent) over the different samples were counted. The number was
divided by the number of items in scale. The ERS index range is from 0.00 to 1.00. A
similar procedure was used to calculate the ARS index. The frequencies of responses in the
two highest categories on the rating scale (4 and 5) were counted and subtracted from the
number of clearly negative scores (two lowest categories, 1 and 2). The number was
divided by the number of items and resulted in an index with a range from -1.00 to 1.00.
The results are presented in tables 41 and 42. The discussion follows in section 4.5.7.
Verbal ability / bilingualism of respondents (item keying effects)
In an attempt to salvage the problem of acquiescence, positively and negatively keyed items
is used (Watson, 1992; Wong et al., 2003). However, this is known to lead to
corresponding method factors. That is, the inclusion on such items can ‘distort’ the factor
structure of an inventory, with the effect that the positively and negatively keyed items
form their own factors (Williams, Ford, & Nguyen, 2002).
In order to investigate the possible effect of verbal ability (i.e. bilingualism of respondents)
on the MI results, a model with negatively and positively keyed factors (M2b) was fitted to
the data from all the countries with bilingual respondents, as well as the Australian data (for
comparison purposes). The two method factors were allowed to correlate (Van de Vijver,
personal communication, 2008). The results are presented in table 43. For the Sri Lanka
analyses, only respondents that indicated they converse primarily in Sinhala (n=188) were
included in this analysis31
. M2a results are included for comparison purposes, with
measurement model M2b results.
31
Estimation problems were encountered and no admissible solution for the full Sri Lanka sample (n=587)
could be obtained.

142
Model χ2 S-Bχ2 df S-Bχ2/
df
NNFI CFI RMSR SRMR RMSEA (CI) P
(close)
Australia A
M2a
9104.71*
7676.40*
1165
6.59
0.94
0.94
0.042
0.074
0.059
(0.058; 0.060)
0.00
M2b 4534.16* 3868.19* 1114 3.47 0.97 0.98 0.022 0.039 0.039
(0.037; 0.041)
1.00
Australia B
M2a
8437.88*
6823.30*
1165
5.86
0.95
0.95
0.040
0.071
0.055
(0.054; 0.056)
0.00
M2b 4132.46* 3376.80* 1114 3.03 0.98 0.98 0.022 0.039 0.036
(0.034; 0.037)
1.00
Sri Lanka
Sinhala
M2a
2450.42*
1965.16*
1165
1.68
0.87
0.87
0.067
0.089
0.061
(0.056; 0.065)
0.00
M2b 1566.81* 1306.00* 1114 1.17 0.97 0.97 0.054 0.070 0.030
(0.023; 0.037)
1.00
SA White
M2a
6072.63*
4627.44*
1165
3.97
0.80
0.81
0.10
0.13
0.10
(0.098; 0.10)
0.00
M2b 1914.78* 1509.05* 1114 1.35 0.98 0.98 0.046 0.060 0.035
(0.030; 0.039)
1.00
SA Non-White
M2a
5503.49*
4043.73*
1165
3.47
0.87
0.88
0.13
0.12
0.086
(0.083; 0.089)
0.00
M2b 2057.18* 1606.74* 1114 1.44 0.98 0.98 0.063 0.056 0.036
(0.032; 0.040)
1.00
A correlation of 0.29 (p<0.05) between the negative and positively keyed method factors in
the South African White data emerged. The results revealed that for the South African non-
White analysis, this correlation increased to r=0.48 (p<0.05), whilst a similar correlation of
r=0.50 (p<0.05) between the two method factors emerged in the Sinhala analysis. A
different picture emerged with the Australian analysis. Here the correlation between the
positive and negatively keyed method factors was 0.81 (p<0.05) in sample A and 0.84
(p<0.05) in sample B. This confirms the finding by Gignac (2005) where he reports an r =
0.74 (p<0.001) between the negatively keyed and positively keyed method factors modeled
as part of the SUEIT nine factor structure with 64 items in an Australian sample. Tables 44
– 47 contain the factor loadings obtained in all the analyses.
NOTE: S-Bχ2, Sattora-Bentler Scaled Chi-square; NNFI, non-normed fit index; CFI, comparative fit index; RMSR, root
mean squared residuals; SRMR, standardised root mean residual; RMSEA, root mean square error of approximation
with 90% confidence interval
* p < 0.05
Table 43:
CFA results for models M2a and M2b in Australian, Sri Lanka (Sinhala) and South African samples
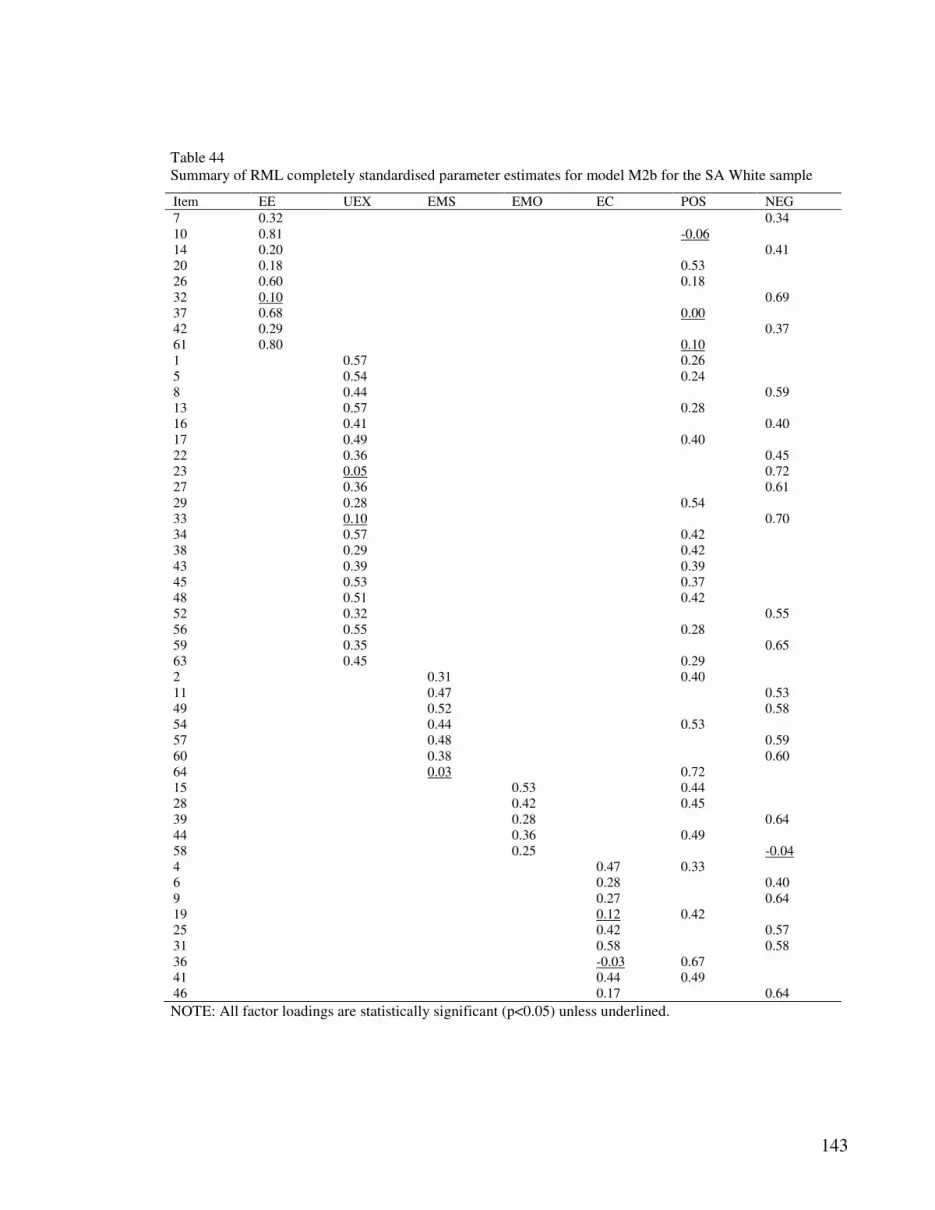
143
Item EE UEX EMS EMO EC POS NEG
7 0.32 0.34
10 0.81 -0.06
14 0.20 0.41
20 0.18 0.53
26 0.60 0.18
32 0.10 0.69
37 0.68 0.00
42 0.29 0.37
61 0.80 0.10
1 0.57 0.26
5 0.54 0.24
8 0.44 0.59
13 0.57 0.28
16 0.41 0.40
17 0.49 0.40
22 0.36 0.45
23 0.05 0.72
27 0.36 0.61
29 0.28 0.54
33 0.10 0.70
34 0.57 0.42
38 0.29 0.42
43 0.39 0.39
45 0.53 0.37
48 0.51 0.42
52 0.32 0.55
56 0.55 0.28
59 0.35 0.65
63 0.45 0.29
2 0.31 0.40
11 0.47 0.53
49 0.52 0.58
54 0.44 0.53
57 0.48 0.59
60 0.38 0.60
64 0.03 0.72
15 0.53 0.44
28 0.42 0.45
39 0.28 0.64
44 0.36 0.49
58 0.25 -0.04
4 0.47 0.33
6 0.28 0.40
9 0.27 0.64
19 0.12 0.42
25 0.42 0.57
31 0.58 0.58
36 -0.03 0.67
41 0.44 0.49
46 0.17 0.64
Table 44
Summary of RML completely standardised parameter estimates for model M2b for the SA White sample
NOTE: All factor loadings are statistically significant (p<0.05) unless underlined.

144
Item EE UEX EMS EMO EC POS NEG
7 0.30 0.39
10 0.66 0.09
14 0.14 0.44
20 0.23 0.55
26 0.43 0.36
32 0.06 0.63
37 0.64 0.26
42 0.22 0.42
61 0.73 0.18
1 0.40 0.43
5 0.47 0.35
8 0.35 0.39
13 0.50 0.50
16 0.15 0.51
17 0.37 0.57
22 0.17 0.53
23 0.04 0.67
27 0.21 0.45
29 -0.07 0.65
33 0.02 0.68
34 0.14 0.62
38 0.06 0.45
43 0.21 0.68
45 0.44 0.43
48 0.14 0.58
52 0.15 0.60
56 0.51 0.35
59 0.28 0.67
63 0.40 0.34
2 0.20 0.42
11 0.46 0.52
49 0.31 0.61
54 0.31 0.42
57 0.52 0.67
60 0.28 0.73
64 0.03 0.44
15 0.04 0.58
28 0.24 0.55
39 -0.01 0.66
44 0.25 0.52
58 0.01 0.11
4 0.37 0.36
6 0.38 0.51
9 0.32 0.59
19 0.32 0.44
25 0.18 0.65
31 0.38 0.64
36 -0.01 0.64
41 0.28 0.47
46 0.30 0.60
Table 45
Summary of RML completely standardized parameter estimates for model M2b for the SA Non-White sample
NOTE: All factor loadings are statistically significant (p<0.05) unless underlined.

145
Item EE UEX EMS EMO EC POS NEG
7 0.46 0.53
10 0.69 -0.04
14 0.41 0.58
20 0.34 0.56
26 0.51 0.14
32 0.19 0.66
37 0.66 -0.17
42 0.47 0.53
61 0.80 0.02
1 0.43 0.31
5 0.57 0.21
8 0.49 0.36
13 0.49 0.25
16 0.51 0.33
17 0.52 0.36
22 0.56 0.36
23 0.13 0.43
27 0.57 0.38
29 0.27 0.48
33 0.23 0.55
34 0.53 0.41
38 0.33 0.34
43 0.43 0.41
45 0.51 0.33
48 0.48 0.43
52 0.35 0.41
56 0.55 0.27
59 0.46 0.51
63 0.52 0.25
2 0.33 0.49
11 0.50 0.42
49 0.59 0.48
54 0.61 0.47
57 0.53 0.53
60 0.47 0.52
64 0.13 0.55
15 0.44 0.49
28 0.43 0.40
39 0.37 0.54
44 0.30 0.49
58 0.15 0.38
4 0.56 0.29
6 0.32 0.42
9 0.38 0.52
19 0.31 0.38
25 0.45 0.26
31 0.62 0.45
36 0.15 0.52
41 0.62 0.38
46 0.32 0.43
Table 46
Summary of RML completely standardized parameter estimates for model M2b for the Australia A sample
NOTE: All factor loadings are statistically significant (p<0.05) unless underlined.

146
Item EE UEX EMS EMO EC POS NEG
7 0.19 0.56
10 0.47 0.28
14 0.01 0.65
20 0.12 0.47
26 0.30 0.28
32 -0.03 0.63
37 0.56 0.20
42 0.07 0.56
61 0.60 0.34
1 0.20 0.37
5 0.21 0.47
8 0.19 0.47
13 0.26 0.53
16 0.05 0.17
17 0.27 0.44
22 0.44 0.50
23 0.28 0.54
27 0.61 0.33
29 0.16 0.55
33 0.32 0.49
34 0.32 0.32
38 0.20 0.45
43 0.60 0.33
45 0.30 0.42
48 0.02 0.35
52 0.30 0.53
56 0.15 0.43
59 0.18 0.54
63 0.38 0.28
2 0.19 0.32
11 0.35 0.43
49 0.66 0.35
54 0.31 0.30
57 0.39 0.36
60 0.42 0.54
64 0.21 0.60
15 0.27 0.32
28 0.02 0.33
39 0.65 0.50
44 0.17 0.52
58 -0.17 0.29
4 0.28 0.30
6 0.46 0.21
9 0.36 0.39
19 0.38 0.24
25 0.42 0.30
31 0.37 0.50
36 0.33 0.34
41 0.44 0.35
46 0.29 0.31
Table 47
Summary of RML completely standardized parameter estimates for model M2b for the Sri Lanka (Sinhala)
sample
NOTE: All factor loadings are statistically significant (p<0.05) unless underlined.

147
4.5.7 Discussion: method bias
Response styles: ERS and ARS indices
The validity of cross-cultural comparisons may be greatly distorted by systematic
differences in response styles between countries. The results of the investigation into the
national cultural response styles were presented in section 4.5.6. Indices were calculated for
all the countries. This discussion will focus on all the results, as well as the specific
hypotheses that were investigated.
ERS
The results in tables 41 and 42 provide evidence that there are differences in response styles
between the different cultural groups. That is, significant differences between cultural
groups (F test, p<0.05) on both ERS and ARS emerged. For the ERS results (table 42) the
average η2
is 0.026 (ranging from 0.01 to 0.04). This is a small effect (Cohen, 1988).
Overall, it would seem that the results suggest that although there are ERS differences over
the different cultural groups, these differences are negligible. Previous research by Johnson
et al., (2005) reports a positive relation between ERS and Power Distance over 19 nations.
They argue that, “…extreme response style serves the goals of achieving clarity, precision,
and decisiveness in one’s explicit verbal statements, characteristics that are valued in
masculine and high Power Distance cultures” (Johnson et al., 2005, p.273). It was argued
that Sri Lankan respondents subscribe to the cultural value dimension of high Power
Distance and would exhibit more ERS.
Hence, it was hypothesised:
Hypothesis 2: Method bias (i.e. ERS) will have the most pronounced effect on the
transportability of the SUEIT when applied within the Sri Lankan sample.
This hypothesis (2) was not supported. The pattern of ERS in the Sri Lanka data did not
differ much from the pattern obtained for the Western countries. Hui and Triandis (1989)
showed that Hispanics showed more extreme responses when completing questionnaires in
Spanish as opposed to in English. They concluded that in studies using bilingual
respondents, extreme response ratings vary with the language of response used. All the Sri

148
Lankan respondents in this study were bilingual and answered the questionnaire in English.
This may be a possible explanation for the absence of ERS in the Sri Lanka results.
In addition, it was hypothesised that:
Hypothesis 3: Method bias (i.e. ERS) will not have an effect on the transportability of the
SUEIT when applied within the Australian, USA and New Zealand samples.
As expected, no substantial effect of ERS was evident in the Western countries. Hence,
hypothesis 3 is supported.
ARS
The differences in acquiescence indices are only meaningful if they account for a
substantive proportion of the variance (Cohen, 1988). The average η2
for the ARS results
(over the five EI subscales, reported in table 41) is 0.086 (ranging from 0.06 to 0.16) which
is considered to be a medium to large effect (>0.06 and <0.14) according to Cohen (1988).
It was hypothesised:
Hypothesis 4: Method bias (i.e. ARS) will have an effect on the transportability of the
SUEIT when applied within the Australian, USA and New Zealand samples.
The results clearly indicate that respondents from the three Western Anglo cultures
(Australia, USA and New Zealand) which are most similar in terms of Individualism and
Power Distance exhibited similar ARS patterns. That is, more ARS was exhibited by these
respondents than the Italian and South African non - White respondents. Hence, hypothesis
4 is supported.
Although no specific prediction regarding the South African White sample was made, a
similar trend to the other Western Anglo cultures was expected. This was not the case.

149
It was also hypothesised:
Hypothesis 5: Method bias (i.e. ARS) will not have an effect on the transportability of the
SUEIT when applied within the Sri Lankan sample.
The results revealed that Sri Lanka exhibited the closest ARS pattern to the three Western
cultures. Hence, hypothesis 5 is not supported.
EI Subscale Individualism Power Distance
ARS ERS ARS ERS
Emotional Expression 0.177** -0.088** -0.147** 0.055**
Understanding Emotions External 0.282** 0.003 -0.256** -0.021
Emotional Management Self 0.184** -0.058** -0.125** 0.061**
Emotional Management Others 0.110** -0.091** -0.033* 0.079**
Emotional Control 0.194** -0.043** -0.156** 0.031*
From table 48 it is clear that there are numerous significant weak relationships between the
Hofstede Individualism and Power Distance dimensions and the ERS and ARS indices.
Similar patterns are observed over all the subscales in the SUEIT. No notable relationships
(all correlations below 0.1) exist between Power Distance and ERS which is a replication of
the Johnson et al., (2004) findings for the Western countries. However, Johnson et al.,
(2004) report a positive relationship between high Power Distance and ERS. This was
finding was not replicated in this study. According to Johnson et al., (2004) ERS is not
related to Individualism. This finding is replicated in this study as negligible significant
correlations between ERS and Individualism emerged. In addition, Johnson et al., (2004)
report a negative relationship between Individualism and ARS. However, in the present
study weak positive correlations between ARS and Individualism (correlations ranging
from 0.110 to 0.282) exist. In addition, weak negative relationships between ARS and
Power Distance emerged. This confirms the Johnson et al., (2004, p. 272) finding,
“…contrary to our expectations, persons in high Power Distance countries were less likely
to engage in acquiescent responding”.
Table 48
Pearson correlations between Hofstede dimensions (IND, PD) and ARS and ERS indices over all the samples
Note: *p < 0.05, **p < 0.001

150
The aim of investigating ERS and ARS in this study was twofold. First, uncovering method
bias has practical implications. That is, if left unevaluated, it may be misconstrued as
substantive differences in the latent construct (EI). Generally it is believed that
measurement and predictive bias is consistent. Measurement bias refers to sources of
irrelevant variance that result in systematically higher or lower scores for members of
particular groups. Predictive bias refers to the usefulness, validity and fairness of the test
for the purpose for which it was designed, and is found when for a given subgroup,
consistent nonzero errors of prediction are made for members of the subgroup (Cleary,
1968). It is generally believed that evidence of predictive invariance should be regarded as
supportive evidence for measurement invariance, and vice versa32
. A lack of MI evidence
(due to the undetected presence of method bias) may result in adverse impact. Adverse
impact is an important issue in personnel selection. It occurs when a specific selection
strategy affords members of a specific group (e.g. cultural group) a lower likelihood to be
selected than members of another group. Personnel selection procedures would want to
minimse adverse impact to avoid litigation, and ensure equal job opportunities across
groups in the labour market (in proportion to the size of the groupings) (Theron, 2007).
Hence, uncovering measurement bias may be an important step to assist in attaining this
goal.
Secondly, the investigation of these response styles as a type of method bias had a
theoretical grounding. That is, the aim was to seek replication of previous research on
culturally driven response styles. This would continue to inform on the cultural variation of
response styles. However, a definite limitation of the results is that the empirical
comparisons between the response style patterns, involved a comparison of only 6 different
cultural groups. Hence, the ability to generalise from this evidence remains severely
limited. More conclusive verification regarding the presence of these response styles will
only be available upon examination of a larger multinational dataset. It should be noted that
the main goal, however, was to investigated method bias, so as to judge the transportability
32
Although this is viewpoint widely supported, it should be noted that Millsap (1995) has proposed the
Duality Theorem, which states that not only are there are exceptions to the consistency rule (i.e. the two forms
of bias or invariance are consistent), but that inconsistency is, in fact, the rule (for a discussion, see Millsap,
1995).

151
of the instrument to various cultures. The replication of previous research regarding cultural
driven response styles, and the exploration of this in the South African data, was a
complementary goal in this study.
The findings reported here endeavoured to expand current knowledge on the relation
between culture and response styles. On a practical level it suggests that the effects of
cultural driven response styles may not be a big source of method bias in the current data.
Although the results are based on a small sample of cultures, two characteristics of the
results may be considered as valuable. First, much of the surveyed research on culture and
response styles has been conducted with mainly big European datasets. For example, the
Van Herk et al., (2004) study included three Mediterranean and three Northwestern
European countries. Cheung and Rensvold (2000) conducted an ERS and ARS SEM
illustrative example with USA and Italian data. Johnson et al., (2004) reported on the
relationships between culture and ERS and ARS over 19 countries. No African data was
included and the authors pointed out that, “…Europe is somewhat overrepresented, with
data contributed from 9 countries” (Johnson et al., 2004, p.268). The current investigation
of response styles in the South African data is a first investigation of this kind33
. Secondly,
the results seem to suggest that these specific response styles may not be a confounding
method bias factor for these cultural groups (based on this data). That is, the response styles
of the White and non-White South Africans were not drastically different from the other
groups included in this study – which is contrary to an intuitive expectation. That is, if it is
argued that the non-White respondents subscribe to a typical non-Western collectivistic,
high Power Distance cultural orientation, then one would expect some evidence of the
accompany response style (e.g. ARS). However, the Sithole (2001) cultural dimension
scores for non-White South Africans indicate that this group have a much more
individualistic orientation than is generally thought. This may be due to the effects of social
mobility theory in this group (Cutright, 1968; Miller, 1960). That is, an increase in wealth
is said to facilitate the movement from a collectivistic to individualistic cultural value
orientation. Considering the fact that workplace samples were used here, it may be assumed
33
No published study with South African data could be located which used the Van Herk et al., (2004)
methodology for calculating ERS and ARS.

152
that the surveyed non-White respondents already have an above average income compared
to the group norm. That is, they are probably not representative of the majority of non-
White South Africans and their current socio economic status. They may, however, be
representative of then non-White working population in South Africa. In this instance, the
practical implications of the current results are useful. Response styles may not be a
significant source of method bias in this group’s data. The theoretical explanation power of
the results from a cultural perspective, however, remains limited if it is argued that the non-
White group is in fact another ‘sub-cultural’ group shaped by their level of affluence (i.e.
more opportunities for tertiary education, entry into the labour market than what is
generally the norm for this group). It would seem that different ethnic groups in South
Africa are now not as purely advantaged or disadvantaged as before 1994 (the end of the
Apartheid era). The effect of acculturation and assimilation into Western culture may also
influence the extent to which individuals (e.g. non-White South Africans) identify with the
cultural origin of their ethnic group (Marsella, Dubanoski, Hamada, & Morse, 2000).
In a similar vein to the non-White results, the results of the White group were also contrary
to the general expectation. White South Africans are grouped in the Anglo Western cultural
cluster (Gupta & Hanges, 2004). Other societies in this cluster include Australia, New
Zealand, USA, Canada and England. More convergence in terms of the response style
results between the South African White data, and these Western cultures was therefore
expected. The Sri Lankan results also did not confirm the expected hypotheses (i.e
hypothesis two and five). No notable response style effects were evident. These results
may, in part, be explained in terms of the cultural accommodation hypothesis (Ralston,
Cunniff, & Gustafson, 1995). According to Yang and Bond (1980) cultural attitudes and
values associated with a language is acquired when an individual masters a second
language. Hence, bilingual subjects develop a mindset, partially shaped by the values
associated with the second-language culture (Bond & Yang, 1982). Consequently, it has
been argued individuals will respond in a manner that favours or accommodates the culture
associated with the language of presentation. More specifically, bilingual individuals (as is
the case with the South African White, non-White and Sri Lankan data) when responding to
a survey instrument in a secondary language, will accommodate the culture associated with

153
the secondary language (i.e. English). Ralston et al., (1995) report findings that support
notion. In their study Hong Kong Chinese managers responding to the English version of
the Schwartz Value Survey, scored higher on all five of the Western culturally important
values, compared to the Hong Kong Chinese managers that used the Chinese language
version of the test. They conclude that, “the language in which an instrument is
administered may produce ‘culturally accommodating’ responses that can affect the results
of a cross-cultural study” (Ralston et al., 1995, p.714). Hence, the hypothesised effects (in
this study) may not have been observed due to the fact that second language testing was
conducted. That is, due to responding in English and not Afrikaans, an African language,
Sinhala or Tamil, the respondents may have drawn more on a Western cultural frame of
reference, than their native culture (associated with their native language). This may have
‘neutralised’ the effects of culturally driven response styles, in these results. More research
is needed in this domain, specifically in the South African context. It will assist in a better
understanding of whether, and how culture drives response styles which may influence test
results.
In conclusion, it would seem that the ERS and ARS results do not suggest a strong presence
of this type of response style method bias in the current data. Hence, another possible
source of method bias, which may account for the lack of metric invariance, was
investigated.
Verbal ability / bilingualism of respondents (item keying effects)
The effect of respondent’s verbal ability on the MI results was investigated by fitting a
model with negatively and positively keyed factors (M2b) to the data from all the countries
with bilingual respondents. For comparison purposes, the model was also fitted to the
Australian data.
The following hypothesis was investigated:
Hypothesis 6: Method bias (i.e. due to verbal ability of respondents) will have the most
pronounced effect on the transportability of the SUEIT when applied within the Sri Lankan,
South African White and Non-White samples.

154
The results are consistent and fairly convincing (refer to table 43). By adding the two
method factors to the measurement model, the model fit in all the samples with bilingual
respondents improved considerably (in comparison with M2a results where no method
effects were modeled). In all the cases (M2b results), close fit was achieved (i.e. p(close
fit)>0.05). The biggest method bias effect is noted in the South African data. For example,
the RMSEA dropped drastically in the South African White analyses from 0.10 (M2a) to
0.035 (M2b), and from 0.086 (M2a) to 0.036 (M2b) in the South African non-White
analysis. The other model fit indices also consistently improved considerably. In fact,
evidence for very good model fit (e.g. NNFI and CFIs of 0.98, SRMR ≤ 0.060) was
obtained for both the South African datasets when the method effects were accounted for.
In a similar vein, the Sri Lanka results improved notably when the positively and negatively
keyed method effects were modeled (e.g. RMSEA dropped from 0.061 to 0.030, SRMR
from 0.089 to 0.070, NNFI and CFI increased drastically). The Australian results also
improved when the method effects were modeled (e.g. sample A: RMSEA dropped from
0.059 to 0.039, SRMR from 0.042 to 0.022 etc.). It is apparent, however, that modeling of
the method effects influenced the South African and Sri Lanka results much more than the
Australian results. This is seen in the consistent drastic improvements in model fit for these
groups (from M2a to M2b), relative to the improvements obtained in the Australian results
(for M2a and M2b). In addition, the correlation between the two method factors was small
(r=0.29) to moderate (r=0.49 and 0.50) for the groups with bilingual respondents. However,
a very strong correlation (r= 0.84 and 0.81) emerged between these factors in the
Australian data. This is interpreted as evidence that the positively and negatively keyed
method factors are more distinct entities in the data from the bilingual respondents (e.g.
Afrikaans speaking White South Africans) than the non-bilingual respondents (e.g.
Australians). It is concluded that method bias, due to the verbal ability of the bilingual
respondents in South Africa and Sri Lanka, has the most pronounced influence on the
transportability of the instrument to these groups. Therefore, hypothesis 6 is supported.
The common practice of using Western imported tests in multicultural, multilingual non-
Western societies (like South Africa or Sri Lanka), justifies the need for research on the

155
influence of language proficiency on test results. The majority of White, Black and
Coloured South Africans speak English as either a second or third language (Wallis & Birt,
2003). However, most psychological testing is done in English. The large number of
official languages in South Africa, limited availability of test administrators who speak
these languages and different dialects and lack of language standardisation, limits the
practice of test translation into native languages (Van Eeden, 2007). This does not,
however, negate the responsibility of the test user to prudently consider the possibility that
language proficiency may have on test results. According to the Society of Industrial and
Organisational Psychology of South Africa’s publication, Guidelines for the Validation and
Use of Assessment Procedures for the Workplace, whether use of an English test for second
or third language users is considered as fair, is judged on how it relates to the requirement
of the position. “For a position where the ability to read and understand material written in
English is critical and an inherent requirement of the job, use of such a test would be
considered fair, justifiable and legally defensible” (Guidelines for the Validation and Use of
Assessment Procedures for the Workplace, 2005, p. 47). Method bias, such as was
uncovered in this section due to testing conducted in a second language, however, if simply
ignored, may lead to invalid inferences if such effects are not accounted for. Group
membership in terms of language proficiency may influence the validity of test results.
4.5.8 Results: Differential Item Functioning
Two approaches were used to investigate the DIF of items contained in the SUEIT. First,
the 2-way analysis of variance (ANOVA) approach proposed by Van de Vijver and Leung
(1997) for detecting item bias was utilsed on all the items and datasets. This approach is
traditionally used in cross-cultural research. This was followed by the application of the
MACS DIF approach (Chan, 2000) described in section 4.4.4 to all the datasets. In all the
analyses, Australia was used as the reference group. All the items (50) included in model
M2a were subjected to the DIF analyses.
It should be noted that although these two methods / approaches share a similar purpose,
they are, “…vastly discrepant in terms of both their theoretical underpinning and their
statistical approach to the task” (Byrne & Watkins, 2003, p. 159). Although both zero in on

156
item scores relative to total scores, three main distinctions exist. Firstly, analysis of
covariance is focused on co-variation among item scores whilst ANOVA is focused on
differences in item score levels. Secondly, with ANOVA score level is not treated as a
latent trait as is the case with analysis of covariance. Thirdly, ANOVA results are based on
sample subgroups. These subgroups are calculated based on the Van de Vijver and Leung
(1997) methodology34
. Analysis of covariance is based on the entire sample for each culture
(Byrne & Watkins, 2003). Although these methods have the same goal, it was expected that
discrepancies in the results would exist. However, a similar pattern in the results was
expected. The traditional ANOVA approach was supplemented with the MACS DIF
approach, as the latter approach allowed for the comparison of latent mean differences,
after the DIF items were flagged and freed in the final partially constrained model.
4.5.8.1 Results: 2-way ANOVA DIF
With the ANOVA approach, an item is viewed as biased if eta-squared values of at least
0.02 for the uniform (group main effect) or non-uniform (interaction effect) components are
found (Pietersen, 2004; Van de Vijver, Personal communication, 2008). This low value was
used because of the overall low level of the effect sizes (Meiring et al., 2005) in the results.
In addition, an eta-squared value of 0.06 is taken to point towards a moderate effect size
(Van de Vijver, Personal communication, 2008). Tables 49 – 52 contain the results of the
ANOVA bias analyses.
34
With the ANOVA procedure, item score serves as the dependent variable and culture and score levels as
independent variables. Score levels are calculated by splitting the score distribution based on the score of all
cultural groups together, with the same cutoff scores being applied to all cultural groups. Cutoff points are
identified such that the number of respondents in each score group is approximately equal (Van de Vijver &
Leung, 1997).

157
Australia and New Zealand Australia and USA Australia and SA White
Item Uniform bias Non-uniform
bias
Uniform bias Non-uniform
bias
Uniform bias Non-uniform
bias 1 0.000 0.006 0.000 0.011 0.001 0.003 2 0.000 0.008 0.001 0.001 0.001 0.006 4 0.003 0.000 0.001 0.001 0.012 0.000 5 0.001 0.009 0.000 0.012 0.002 0.000 6 0.001 0.004 0.001 0.003 0.004 0.001 7 0.002 0.003 0.000 0.005 0.002 0.001 8 0.000 0.008 0.000 0.001 0.004 0.017 9 0.001 0.013 0.000 0.002 0.016 0.000 10 0.004 0.002 0.000 0.005 0.000 0.009 11 0.002 0.003 0.005 0.002 0.002 0.006 13 0.000 0.006 0.000 0.001 0.002 0.004 14 0.006 0.003 0.003 0.000 0.001 0.013 15 0.000 0.000 0.002 0.000 0.002 0.003 16 0.000 0.001 0.000 0.005 0.009 0.002 17 0.004 0.002 0.000 0.006 0.015 0.006 19 0.001 0.003 0.001 0.000 0.004 0.012 20 0.000 0.004 0.000 0.001 0.004 0.004 22 0.000 0.008 0.000 0.005 0.003 0.001 23 0.000 0.005 0.002 0.001 0.005 0.015 25 0.008 0.001 0.000 0.007 0.000 0.006 26 0.002 0.001 0.000 0.004 0.000 0.003 27 0.001 0.001 0.004 0.002 0.001 0.011 28 0.001 0.001 0.003 0.005 0.000 0.003 29 0.000 0.004 0.001 0.004 0.017 0.015 31 0.000 0.006 0.000 0.003 0.002 0.002 32 0.001 0.005 0.000 0.009 0.004 0.007
NOTE: EDC and ER subscale items not included in the bias analyses. *Items with significant
(non)uniform bias at p < 0.05
Table 49
Uniform and non-uniform item bias effects for SUEIT (M2a) items 1-32 for New Zealand, USA and SA White data.

158
Australia and New Zealand Australia and USA Australia and SA White
Item Uniform bias Non-uniform
bias
Uniform bias Non-uniform
bias
Uniform bias Non-uniform
bias
33 0.000 0.005 0.002 0.004 0.009 0.002
34 0.001 0.006 0.000 0.006 0.000 0.002
36 0.000 0.006 0.007 0.002 0.018 0.009
37 0.004 0.004 0.002 0.001 0.003 0.007
38 0.008 0.019 0.019 0.017 0.001 0.008
39 0.000 0.001 0.000 0.015 0.013 0.003
41 0.001 0.010 0.000 0.007 0.009 0.010
42 0.000 0.001 0.000 0.004 0.007 0.002
43 0.005 0.005 0.003 0.001 0.002 0.003
44 0.008 0.009 0.004 0.006 0.001 0.004
45 0.000 0.004 0.000 0.002 0.011 0.005
46 0.000 0.002 0.003 0.001 0.005 0.009
48 0.000 0.003 0.001 0.004 0.006 0.001
49 0.001 0.002 0.003 0.003 0.001 0.000
52 0.003 0.002 0.005 0.003 0.001 0.001
54 0.001 0.003 0.001 0.004 0.000 0.007
56 0.000 0.001 0.001 0.001 0.006 0.004
57 0.001 0.009 0.000 0.001 0.000 0.001
58 0.002 0.007 0.027* 0.002 0.002 0.001
59 0.000 0.001 0.001 0.004 0.001 0.002
60 0.001 0.004 0.000 0.001 0.004 0.007
61 0.004 0.001 0.000 0.002 0.001 0.001
63 0.006 0.012 0.004 0.009 0.001 0.004
64 0.001 0.010 0.003 0.004 0.000 0.005
NOTE: EDC and ER subscale items not included in the bias analyses. *Items with significant
(non)uniform bias at p < 0.05
Table 50
Uniform and non-uniform item bias effects for SUEIT (M2a) items 33 - 64 for New Zealand, USA and SA White data.

159
Australia and Italy Australia and Sri Lanka Australia and SA non-White
Item Uniform bias Non-uniform
bias
Uniform bias Non-uniform
bias
Uniform bias Non-uniform
bias
1 0.041* 0.006 0.003 0.004 0.022* 0.010
2 0.025* 0.004 0.008 0.002 0.003 0.004
4 0.078* 0.009 0.003 0.001 0.001 0.007
5 0.003 0.019 0.001 0.006 0.012 0.002
6 0.012 0.007 0.043* 0.000 0.011 0.005
7 0.000 0.002 0.010 0.003 0.003 0.004
8 0.002 0.003 0.003 0.002 0.000 0.000
9 0.007 0.003 0.005 0.001 0.005 0.008
10 0.002 0.012 0.000 0.000 0.003 0.001
11 0.037 0.003 0.001 0.003 0.001 0.003
13 0.002 0.003 0.040* 0.005 0.005 0.009
14 0.013 0.004 0.004 0.001 0.001 0.002
15 0.015 0.005 0.000 0.002 0.010 0.003
16 0.023 0.003 0.066* 0.007 0.007 0.009
17 0.009 0.002 0.052* 0.005 0.007 0.001
19 0.035* 0.016 0.011 0.001 0.002 0.004
20 0.026* 0.002 0.006 0.001 0.015 0.006
22 0.012 0.008 0.001 0.001 0.011 0.003
23 0.000 0.009 0.007 0.009 0.000 0.021* 25 0.000 0.004 0.002 0.004 0.000 0.026*
26 0.054* 0.001 0.001 0.005 0.004 0.004
27 0.000 0.009 0.010 0.002 0.016 0.001
28 0.007 0.004 0.005 0.005 0.000 0.005
29 0.059* 0.003 0.018 0.003 0.002 0.003
31 0.034* 0.002 0.014 0.001 0.001 0.012
32 0.001 0.011 0.009 0.002 0.000 0.009
NOTE: EDC and ER subscale items not included in the bias analyses. *Items with significant
(non)uniform bias at p < 0.05
Table 51
Uniform and non-uniform item bias effects for SUEIT (M2a) items 1-32 for Italian, Sri Lanka and SA Non- White data.
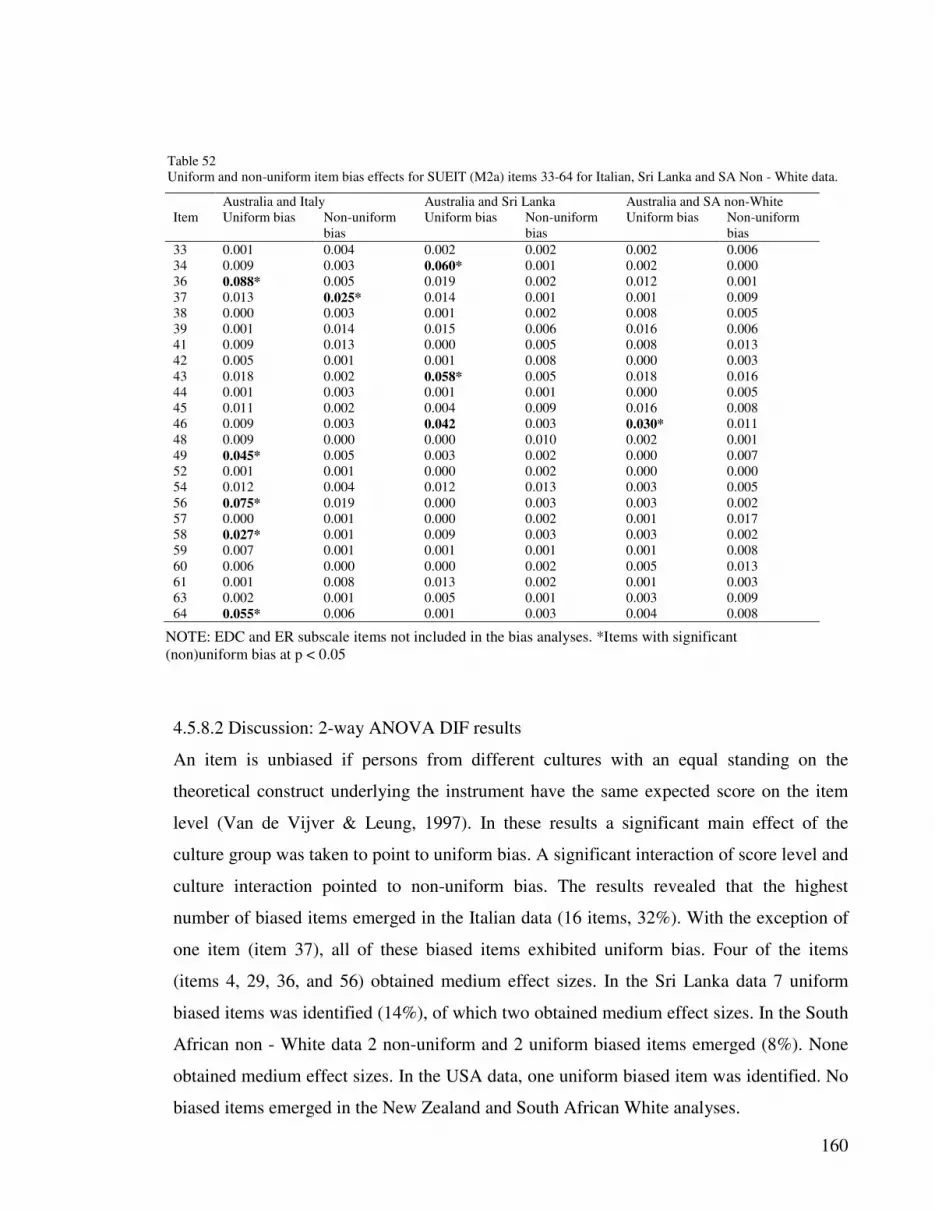
160
Australia and Italy Australia and Sri Lanka Australia and SA non-White
Item Uniform bias Non-uniform
bias
Uniform bias Non-uniform
bias
Uniform bias Non-uniform
bias
33 0.001 0.004 0.002 0.002 0.002 0.006
34 0.009 0.003 0.060* 0.001 0.002 0.000
36 0.088* 0.005 0.019 0.002 0.012 0.001
37 0.013 0.025* 0.014 0.001 0.001 0.009
38 0.000 0.003 0.001 0.002 0.008 0.005
39 0.001 0.014 0.015 0.006 0.016 0.006
41 0.009 0.013 0.000 0.005 0.008 0.013
42 0.005 0.001 0.001 0.008 0.000 0.003
43 0.018 0.002 0.058* 0.005 0.018 0.016
44 0.001 0.003 0.001 0.001 0.000 0.005
45 0.011 0.002 0.004 0.009 0.016 0.008
46 0.009 0.003 0.042 0.003 0.030* 0.011
48 0.009 0.000 0.000 0.010 0.002 0.001
49 0.045* 0.005 0.003 0.002 0.000 0.007
52 0.001 0.001 0.000 0.002 0.000 0.000
54 0.012 0.004 0.012 0.013 0.003 0.005
56 0.075* 0.019 0.000 0.003 0.003 0.002
57 0.000 0.001 0.000 0.002 0.001 0.017
58 0.027* 0.001 0.009 0.003 0.003 0.002
59 0.007 0.001 0.001 0.001 0.001 0.008
60 0.006 0.000 0.000 0.002 0.005 0.013
61 0.001 0.008 0.013 0.002 0.001 0.003
63 0.002 0.001 0.005 0.001 0.003 0.009
64 0.055* 0.006 0.001 0.003 0.004 0.008
4.5.8.2 Discussion: 2-way ANOVA DIF results
An item is unbiased if persons from different cultures with an equal standing on the
theoretical construct underlying the instrument have the same expected score on the item
level (Van de Vijver & Leung, 1997). In these results a significant main effect of the
culture group was taken to point to uniform bias. A significant interaction of score level and
culture interaction pointed to non-uniform bias. The results revealed that the highest
number of biased items emerged in the Italian data (16 items, 32%). With the exception of
one item (item 37), all of these biased items exhibited uniform bias. Four of the items
(items 4, 29, 36, and 56) obtained medium effect sizes. In the Sri Lanka data 7 uniform
biased items was identified (14%), of which two obtained medium effect sizes. In the South
African non - White data 2 non-uniform and 2 uniform biased items emerged (8%). None
obtained medium effect sizes. In the USA data, one uniform biased item was identified. No
biased items emerged in the New Zealand and South African White analyses.
Table 52
Uniform and non-uniform item bias effects for SUEIT (M2a) items 33-64 for Italian, Sri Lanka and SA Non - White data.
NOTE: EDC and ER subscale items not included in the bias analyses. *Items with significant
(non)uniform bias at p < 0.05
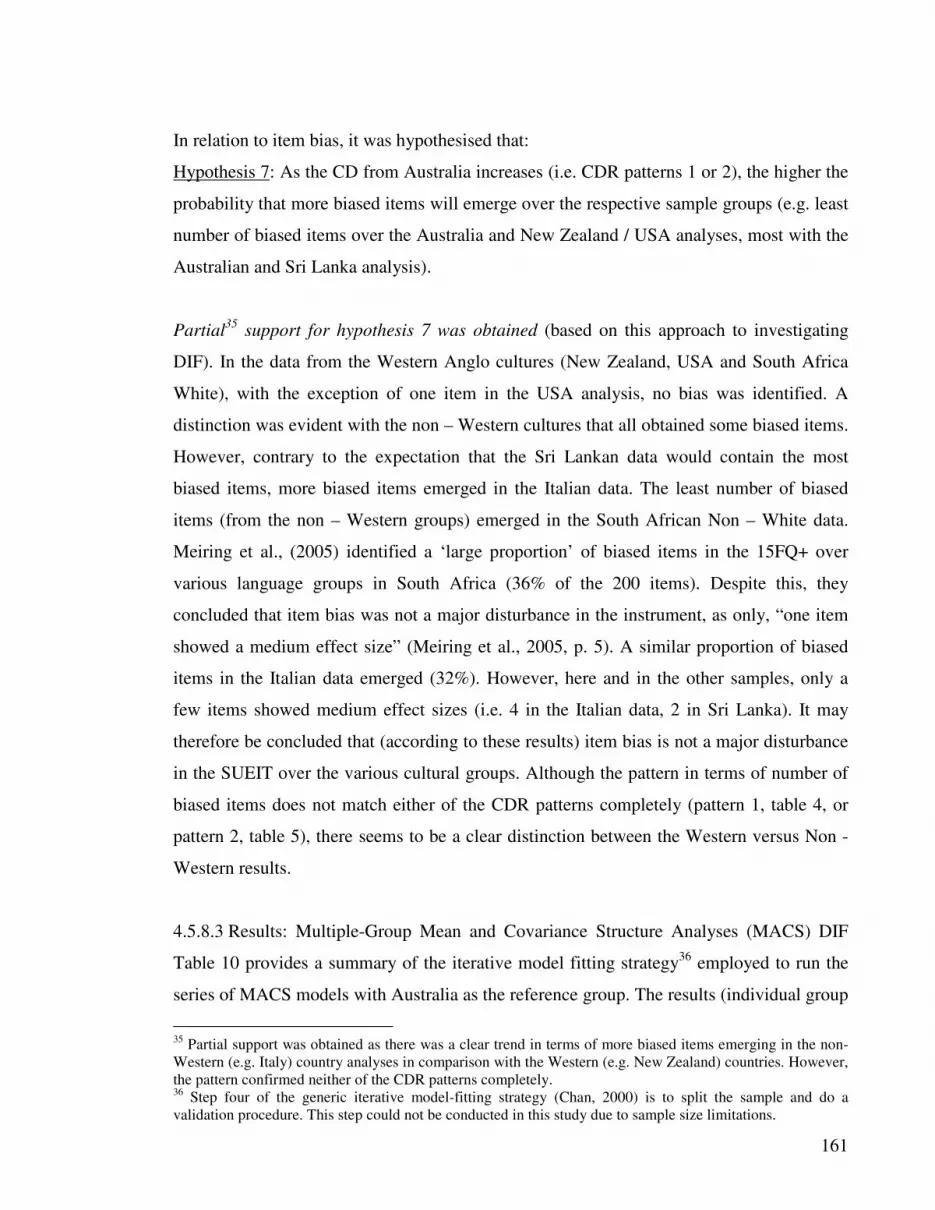
161
In relation to item bias, it was hypothesised that:
Hypothesis 7: As the CD from Australia increases (i.e. CDR patterns 1 or 2), the higher the
probability that more biased items will emerge over the respective sample groups (e.g. least
number of biased items over the Australia and New Zealand / USA analyses, most with the
Australian and Sri Lanka analysis).
Partial35
support for hypothesis 7 was obtained (based on this approach to investigating
DIF). In the data from the Western Anglo cultures (New Zealand, USA and South Africa
White), with the exception of one item in the USA analysis, no bias was identified. A
distinction was evident with the non – Western cultures that all obtained some biased items.
However, contrary to the expectation that the Sri Lankan data would contain the most
biased items, more biased items emerged in the Italian data. The least number of biased
items (from the non – Western groups) emerged in the South African Non – White data.
Meiring et al., (2005) identified a ‘large proportion’ of biased items in the 15FQ+ over
various language groups in South Africa (36% of the 200 items). Despite this, they
concluded that item bias was not a major disturbance in the instrument, as only, “one item
showed a medium effect size” (Meiring et al., 2005, p. 5). A similar proportion of biased
items in the Italian data emerged (32%). However, here and in the other samples, only a
few items showed medium effect sizes (i.e. 4 in the Italian data, 2 in Sri Lanka). It may
therefore be concluded that (according to these results) item bias is not a major disturbance
in the SUEIT over the various cultural groups. Although the pattern in terms of number of
biased items does not match either of the CDR patterns completely (pattern 1, table 4, or
pattern 2, table 5), there seems to be a clear distinction between the Western versus Non -
Western results.
4.5.8.3 Results: Multiple-Group Mean and Covariance Structure Analyses (MACS) DIF
Table 10 provides a summary of the iterative model fitting strategy36
employed to run the
series of MACS models with Australia as the reference group. The results (individual group
35
Partial support was obtained as there was a clear trend in terms of more biased items emerging in the non-
Western (e.g. Italy) country analyses in comparison with the Western (e.g. New Zealand) countries. However,
the pattern confirmed neither of the CDR patterns completely. 36
Step four of the generic iterative model-fitting strategy (Chan, 2000) is to split the sample and do a
validation procedure. This step could not be conducted in this study due to sample size limitations.

162
comparisons between Australia and New Zealand, USA, Italy, South Africa White and non-
White data, and Sri Lanka for each of the five subscales) are presented in tables 53 - 59.
Because the DIF analysis assumes the unidimensionality37
of a given subscale (Chan,
2000), this assumption was tested as a first step in the analysis. Hence, a multi-group
single-factor CFA model in which factor loadings and intercepts were allowed to vary
freely (fully unconstrained model), except for those constraints imposed for identification
and scaling purposes, was fitted as a first step in the analyses. If the results revealed a
violation of the unidimensionality assumption, an EFA38
was conducted. Next, the fully
constrained model (model in which all corresponding factor loadings as well as item
intercepts were constrained to be equal across groups) was fitted to the data from both
groups. The size of the modification indices (MIs) associated with each item parameter was
then identified to flag items exhibiting DIF (Chan, 2000). In accordance with the procedure
37
It should be noted that the methodological ideal (based on the results in section 4.5.7) would have been to
model the positive and negatively keyed method factors in the DIF analysis. This was not possible as the
unidimensionality assumption, a necessary prerequisite for this procedure, would have been violated. In
addition, the goal was to uncover DIF in the instrument as it would manifest in its real world application. That
is, to establish to what extent the instrument may not be transportable to another culture. Generally, the effect
of method factors are not taken into account in inferences based on scores derived from a particular
instrument. 38
A series of EFA’s was conducted (Principle Axis Factoring with Direct Oblimin rotation, SPSS 15) on the
Emotional Expression and Emotional Control subscales, as the fully unconstrained CFA results over all the
samples did not obtain good fit (i.e. in all the analyses RMSEA >0.1, CFA and NNFI<0.90). Over all the
samples, The Emotional Expression subscale results revealed two substantive factors. Generally, items 7, 14,
20, 32, and 42 load unto the same factor (factor 1). The content of these items all assess verbal emotional self
expression at work (e.g. “I find it difficult to talk about my feelings with my colleagues”; “When I’m anxious
at work, I find it difficult to express this to my colleagues”). Items 10, 37, and 61 assess other’s perception
(factor 2) on an individual’s emotional expression (“Colleagues find it easy to pick-up on how I’m feeling”;
“Colleagues know when I am worried”). Item 26 (“I can portray how I’m feeling to colleagues through my
body language alone”) assesses a non-verbal aspect of emotional expression and hence did not load unto the
factor one. The first factor (emotional self expression) was used in the DIF analyses as most of the theoretical
arguments of how culture might affect emotional expression (i.e. through cultural display rules, the influence
of cultural dimensions like Uncertainty Avoidance and Collectivism) relates to emotional self expression. The
EFA results over all the samples for the Emotional Control subscale, revealed two factors. Generally, items 6,
9, 19, 36, and 46 load unto the same factor. These items all seem to measure different aspects of controlling
strong emotions like stress and anger in the workplace (“When I’m under stress, I tend to get irritated by
colleagues”, “I find it easy to control my anger at work”). Items 4, 25, 31, and 41 all measure the extent to
which an individual allows strong emotions, for example anxiety, being upset or excitement, to detract them
from their focus on a specific work-related task (“When I’m anxious, I can remain focused on what I’m
doing”, “I find it hard to concentrate on a task when I’m really excited about something”, I find it difficult to
think clearly when I’m feeling anxious about something at work”). The first factor was used for the DIF
analyses, as the arguments presented in chapter three regarding cultural display rules, and whether strong
emotions should be concealed (as is the norm in collectivistic societies) would more directly be testable
through the content of these items. That is because the content of the items more explicitly relates to
controlling strong emotions like anger, how easy the individual finds it to deal with this emotion (i.e. easy or
hard to overcome, control) as well as strategies to deal with these emotions (i.e. getting irritated or not,
thinking through what is causing the emotion).

163
stipulated by Chan (2000), the between-group equality constraint for the flagged item’s
factor loading (non-uniform DIF) was lifted. The model was refitted. Once again the MI
values for the factor loadings were inspected and the appropriate strategy followed (if
significant, the item loading was flagged and freed in the subsequent model). This process
was repeated, until the largest MI value was no longer significant39
, whereupon the MI
values associated with the item intercepts were inspected to detect uniform DIF. The same
iterative procedure was followed. According to Hair et al., (2006) partial metric and scalar
invariance is achieved, when at least two items do not display non-uniform or uniform DIF.
It thus follows that the iterative model fitting procedure was not continued (i.e. examining
the item intercepts) after examining the item slopes, if not at least two items were found to
not display non-uniform DIF. In some cases no items was found to display DIF. Hence, the
Satorra-Bentler chi-square difference between the fully constrained and fully unconstrained
models were (based on the S-B adjustment formula, Satorra & Bentler, 1999) calculated. A
non-significant difference points to full metric and scalar equivalence (supported by the
absence of any DIF items) and allows for meaningful latent mean comparisons (e.g.
Emotional Expression over Australia and New Zealand) on the subscale level, without
freeing any item. However, there were also three cases where no invariant items per
subscale could be found (i.e. the Emotional Management Self subscale over Australia and
Italy; Emotional Management Subscale over Australia and Sri Lanka; the Emotional
Control subscale over Australia and South Africa Non-White). Hence, no latent mean
comparisons between these groups on the respective subscales were possible.
In group comparisons where two or more invariant items were found, the latent means
(Kappa) were interpreted from the final partially constrained MACS model (PC Final). If
measurement instruments are at least partially invariant, valid cross-national comparisons
can be conducted even when the ideal of full invariance is not realised (Steenkamp &
Baumgartner, 1998). For the Australia and USA Emotional Management Others subscale,
no Kappa value was estimated. There was a non-significant difference between the fully
39
This procedure required that the MI values of the set of items on each scale were inspected multiple times
for statistical significance. Thus, a Bonferronni correction was employed to determine the alpha value at each
step of the iterative procedure.

164
constrained and unconstrained models40
.That is, all the items are invariant and hence no
Kappa value was estimated. In this case it is therefore possible to make meaningful direct
comparisons between the means of the Emotional Management Others subscale over
Australia and the USA.
Australia and New Zealand
The results of the Australia, New Zealand DIF analyses (table 53) indicate that there is no
evidence of DIF over the two groups for four of the five EI subscales. For these four
subscales each item (included in the original scale, or retained after the EFA analysis)
functions equivalently for both Australians and New Zealanders.
Model df χ2 S-Bχ2 MI ∆df ∆ S-Bχ2 NNFI CFI RMSEA (CI) P
(close)
EE
Fully Unconstrained 10 32.21* 27.03* - - - 0.96 0.98 0.086
(0.046; 0.013)
0.061
Fully Constrained 18 35.67* 31.31* - 8 3.39ns 0.98 0.98 0.056
(0.019; 0.089)
0.34
UEX
Fully Unconstrained 340 611.86* 529.62* - - - 0.97 0.97 0.049
(0.041; 0.057)
0.58
Fully Constrained 378 653.06* 570.45 - 38 39.19ns 0.97 0.97 0.047
(0.039; 0.054)
0.75
PC Free λ5,2 377 645.13* 563.96 15.291 - - 0.97 0.97 0.046
(0.038 ; 0.054)
0.79
PC Free λ1,2 376 641.17* 561.05 9.782 - - 0.97 0.97 0.046
(0.038 ; 0.054) 0.80
PC Free τ38,2 375 636.43* 556.00 10.443 - - 0.97 0.97 0.046
(0.037 ; 0.053) 0.82
PC Final 375 636.43* 556.00 - 3 14.28* 0.97 0.97 0.046
(0.037 ; 0.053) 0.82
EMS
Fully Unconstrained 28 66.43* 59.04* - - - 0.98 0.98 0.069
(0.044 ; 0.094) 0.098
Fully Constrained 40 70.25* 63.41* - 12 3.58 ns 0.99 0.99 0.050
(0.025 ; 0.073)
0.47
EMO
Fully Unconstrained 10 14.94ns 12.98ns - - - 0.98 0.99 0.036
(0.00; 0.084)
0.63
Fully Constrained 18 19.17ns 17.66ns - 8 4.21 ns 1.00 1.00 0.00
(0.00; 0.057)
0.90
EC
Fully Unconstrained 10 14.04 ns 13.49 ns - - - 0.99 0.99 0.039
(0.00; 0.086)
0.59
Fully Constrained 18 18.59 ns 17.82 ns - 8 4.34 ns 1.00 1.00 0.00
(0.00; 0.058)
0.90
40
The LISREL output for the constrained model did not estimate any non-zero modification indices for
Lamda-X or Tau-X.
Table 53
MACS DIF results: Australia (n=234) and New Zealand (n=234)
Note: EE = Emotional Expression (5 items); UEX = Understanding Emotions External; EMS = Emotional Management
Self; EMO = Emotional Management Others; EC = Emotional Control (5 items); *p < 0.05; 1: p<0.0025; 2: p<0.0026; 3:
p<0.0027; ns = non significant

165
In the Understanding Emotions External subscale, only two items displayed non-uniform
(10%) and one item, uniform DIF (5%) (table 53). Overall, all the models obtained good
model fit (NNFI and CFI > 0.95; RMSEA <0.08; and p(close fit)>0.05). The proportion of
non-uniform biased items for the entire instrument was 4%, whilst only 2% of the items
exhibited uniform bias.
Australia and USA
The results of the Australia and USA analyses (table 54) revealed all items contained in the
Emotional Management Others subscale to be invariant. The Emotional Management Self
subscale (which contains 7 items) obtained the highest proportion of biased items,
compared to the other subscales. Two items (28.5%) displayed non-uniform bias and 1 item
(14.28%) uniform bias. Analyses of the Understanding Emotions External subscale
revealed 3 non-uniform (15%) and 2 uniform bias items (10%). Over all the five subscales,
12% of the items displayed non-uniform bias and 8% uniform bias. As with the New
Zealand analyses, all the model fit results were good (NNFI and CFI > 0.95; RMSEA
<0.08; and p(close fit)>0.05). One exception is the RMSEA obtained for the Emotional
Expression subscale (>0.1). It should be noted, however, that this subscale consistently
obtained over most of the other samples, for the fully unconstrained model, RMSEA values
outside of the <0.08 range (e.g. 0.086 in Italy; 0.085 for Sri Lanka). As expected, the model
fit increased gradually as flagged items was freed. In all the cases, the final partially
constrained model exhibited very good fit (NNFI and CFI > 0.96; p(close fit)>0.05; RMSEA <
0.06 – except for the Emotional Expression subscale).
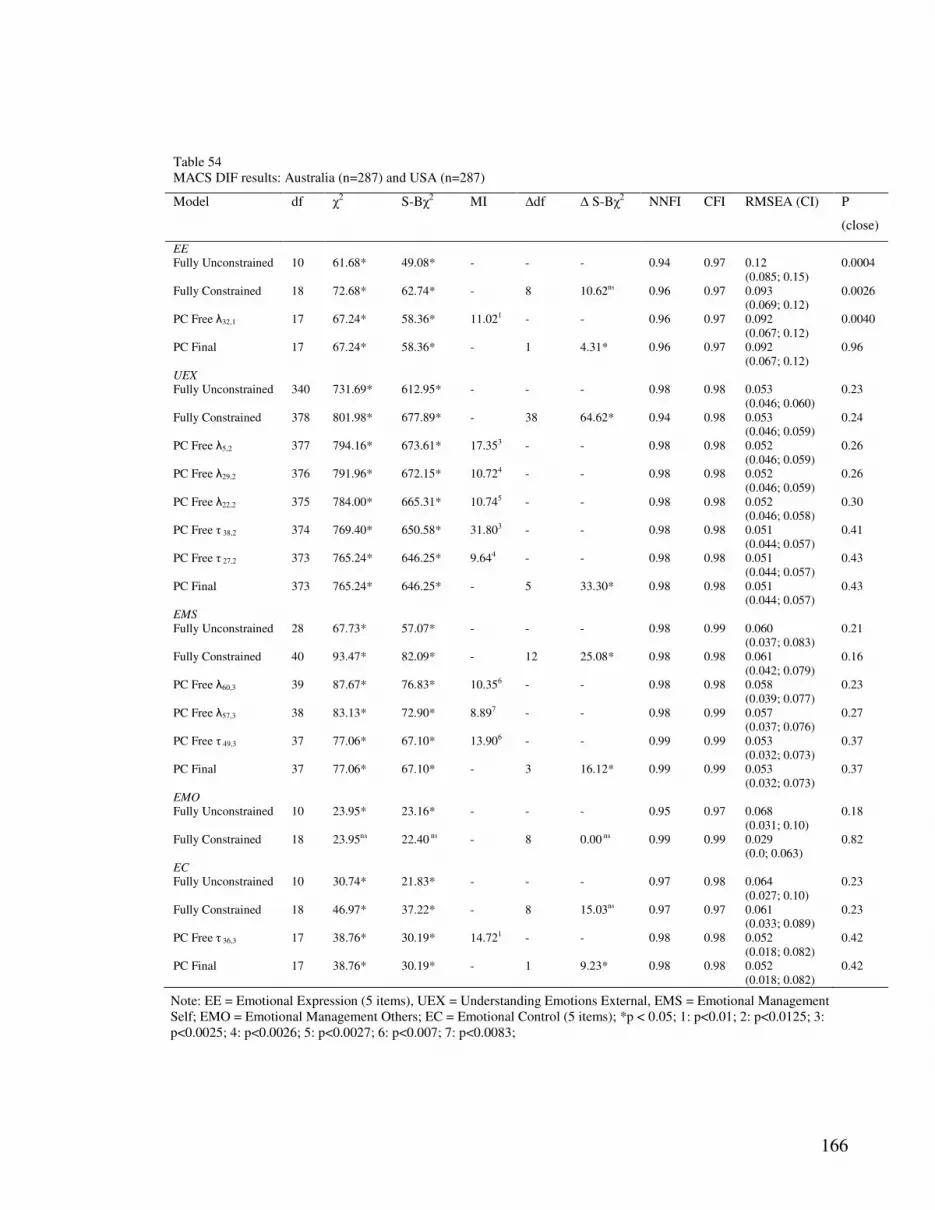
166
Model df χ2 S-Bχ2 MI ∆df ∆ S-Bχ2 NNFI CFI RMSEA (CI) P
(close)
EE
Fully Unconstrained 10 61.68* 49.08* - - - 0.94 0.97 0.12
(0.085; 0.15)
0.0004
Fully Constrained 18 72.68* 62.74* - 8 10.62ns 0.96 0.97 0.093
(0.069; 0.12)
0.0026
PC Free λ32,1 17 67.24* 58.36* 11.021 - - 0.96 0.97 0.092
(0.067; 0.12)
0.0040
PC Final 17 67.24* 58.36* - 1 4.31* 0.96 0.97 0.092
(0.067; 0.12)
0.96
UEX
Fully Unconstrained 340 731.69* 612.95* - - - 0.98 0.98 0.053
(0.046; 0.060)
0.23
Fully Constrained 378 801.98* 677.89* - 38 64.62* 0.94 0.98 0.053
(0.046; 0.059)
0.24
PC Free λ5,2 377 794.16* 673.61* 17.353 - - 0.98 0.98 0.052
(0.046; 0.059)
0.26
PC Free λ29,2 376 791.96* 672.15* 10.724 - - 0.98 0.98 0.052
(0.046; 0.059)
0.26
PC Free λ22,2 375 784.00* 665.31* 10.745 - - 0.98 0.98 0.052
(0.046; 0.058)
0.30
PC Free τ 38,2 374 769.40* 650.58* 31.803 - - 0.98 0.98 0.051
(0.044; 0.057)
0.41
PC Free τ 27,2 373 765.24* 646.25* 9.644 - - 0.98 0.98 0.051
(0.044; 0.057)
0.43
PC Final 373 765.24* 646.25* - 5 33.30* 0.98 0.98 0.051
(0.044; 0.057)
0.43
EMS
Fully Unconstrained 28 67.73* 57.07* - - - 0.98 0.99 0.060
(0.037; 0.083)
0.21
Fully Constrained 40 93.47* 82.09* - 12 25.08* 0.98 0.98 0.061
(0.042; 0.079)
0.16
PC Free λ60,3 39 87.67* 76.83* 10.356 - - 0.98 0.98 0.058
(0.039; 0.077)
0.23
PC Free λ57,3 38 83.13* 72.90* 8.897 - - 0.98 0.99 0.057
(0.037; 0.076)
0.27
PC Free τ 49,3 37 77.06* 67.10* 13.906 - - 0.99 0.99 0.053
(0.032; 0.073)
0.37
PC Final 37 77.06* 67.10* - 3 16.12* 0.99 0.99 0.053
(0.032; 0.073)
0.37
EMO
Fully Unconstrained 10 23.95* 23.16* - - - 0.95 0.97 0.068
(0.031; 0.10)
0.18
Fully Constrained 18 23.95ns 22.40 ns - 8 0.00 ns 0.99 0.99 0.029
(0.0; 0.063)
0.82
EC
Fully Unconstrained 10 30.74* 21.83* - - - 0.97 0.98 0.064
(0.027; 0.10)
0.23
Fully Constrained 18 46.97* 37.22* - 8 15.03ns 0.97 0.97 0.061
(0.033; 0.089)
0.23
PC Free τ 36,3 17 38.76* 30.19* 14.721 - - 0.98 0.98 0.052
(0.018; 0.082)
0.42
PC Final 17 38.76* 30.19* - 1 9.23* 0.98 0.98 0.052
(0.018; 0.082)
0.42
Note: EE = Emotional Expression (5 items), UEX = Understanding Emotions External, EMS = Emotional Management
Self; EMO = Emotional Management Others; EC = Emotional Control (5 items); *p < 0.05; 1: p<0.01; 2: p<0.0125; 3:
p<0.0025; 4: p<0.0026; 5: p<0.0027; 6: p<0.007; 7: p<0.0083;
Table 54
MACS DIF results: Australia (n=287) and USA (n=287)

167
Australia and Italy
In the Australian and Italian analyses (refer to tables 55 and 56), all of the subscales
contained some non-invariant items. More specifically, no invariant items could be
identified for the Emotional Management Self subscale and hence no results are reported
for this subscale. The results for the Understanding Emotions External subscale revealed 10
non-uniform (50%) and 8 uniform (40%) biased items. Apart from the Emotional
Management Self subscale, this was the highest proportion of both types of identified bias
in one subscale. Overall, with the items from the Emotional Management Self subscale
included, 19 non-uniform (38%) and 18 (36%) uniform biased items emerged. In all cases
where the non-invariant items were freed, the final partially constrained MACS model
exhibited evidence of very good model fit (NNFI and CFI > 0.96; p(close fit)>0.05; RMSEA <
0.07).
Model df χ2 S-Bχ2 MI ∆df ∆ S-Bχ2 NNFI CFI RMSEA (CI) P
(close)
EE
Fully Unconstrained 10 42.69* 33.44* - - - 0.96 0.98 0.086
(0.055; 0.12)
0.031
Fully Constrained 18 97.47* 85.43* - 8 56.39* 0.93 0.94 0.11
(0.086; 0.13)
0.00
PC Free τ 20,1 17 53.01* 44.81* 90.941 - - 0.97 0.97 0.072
(0.046; 0.098)
0.076
PC Free τ 7,1 16 48.41* 40.41* 10.442 - - 0.97 0.98 0.069
(0.043 ; 0.096)
0.11
PC Final 16 48.41* 40.41* - 2 71.65* 0.97 0.98 0.069
(0.043 ; 0.096)
0.11
Note: EE = Emotional Expression (5 items), *p < 0.05; 1: p<0.01; 2: p<0.0125; ns= non significant; PC=Partially Constrained
model
Table 55
MACS DIF results: Australia (n=320) and Italy (n=320) for EE

168
Model df χ2 S-Bχ2 MI ∆df ∆ S-Bχ2 NNFI CFI RMSEA (CI) P
(close)
UEX
Fully Unconstrained 340 730.23* 566.91* - - - 0.97 0.97 0.046
(0.039; 0.052)
0.85
Fully Constrained 378 1097.01* 885.68* - 38 460.48* 0.94 0.94 0.065
(0.059; 0.070)
0.00
PC Free λ1,2 377 1061.31* 855.48* 45.243 - - 0.94 0.94 0.063
(0.057; 0.069)
0.00
PC Free λ5,2 376 1040.59* 838.10* 42.594 - - 0.94 0.94 0.062
(0.056; 0.068)
0.00
PC Free λ 56,2 375 1027.24* 822.99* 21.915 - - 0.94 0.95 0.061
(0.056; 0.067)
0.00
PC Free λ 16,2 374 1007.46* 805.12* 23.466 - - 0.95 0.95 0.060
(0.054; 0.066)
0.002
PC Free λ 33,2 373 986.51* 787.99* 24.87 - - 0.95 0.95 0.059
(0.053; 0.065)
0.005
PC Free λ 59,2 372 963.40* 769.79* 21.148 - - 0.95 0.95 0.058
(0.052; 0.064)
0.013
PC Free λ 22,2 371 948.33* 756.46* 18.99 - - 0.95 0.95 0.057
(0.051; 0.063)
0.024
PC Free λ 52,2 370 933.28* 745.73* 19.8510 - - 0.95 0.95 0.056
(0.051; 0.062)
0.036
PC Free λ 8,2 369 921.71* 738.31* 17.9111 - - 0.95 0.95 0.056
(0.050; 0.062)
0.047
PC Free λ 17,2 368 912.59* 729.39* 12.3012 - - 0.95 0.96 0.055
(0.050; 0.061)
0.063
PC Free τ 56,2 367 844.28* 672.21* 130.813 - - 0.96 0.96 0.051
(0.045; 0.057)
0.38
PC Free τ 29,2 366 805.07* 637.92* 65.1614 - - 0.97 0.97 0.048
(0.042; 0.054)
0.67
PC Free τ 16,2 365 787.46* 623.31* 34.5615 - - 0.97 0.97 0.047
(0.041; 0.053)
0.77
PC Free τ 17,2 364 776.60* 613.95* 27.616 - - 0.97 0.97 0.046
(0.040; 0.053)
0.82
PC Free τ 1,2 363 767.93* 606.03* 19.8617 - - 0.97 0.97 0.046
(0.039; 0.052)
0.86
PC Free τ 63,2 362 759.64* 598.34* 16.3818 - - 0.97 0.97 0.045
(0.039; 0.052)
0.89
PC Free τ 22,2 361 751.23* 590.24* 15.619 - - 0.97 0.97 0.045
(0.038; 0.051)
0.92
PC Free τ 59,2 360 748.51* 586.72* 13.6620 - - 0.97 0.97 0.044
(0.038; 0.051)
0.92
PC Final 360 748.51* 586.72* - 18 703.05* 0.97 0.97 0.044
(0.038; 0.051)
0.92
EMO
Fully Unconstrained 10 16.82ns 13.58 ns - - - 0.97 0.99 0.034
(0.0; 0.074)
0.7
Fully Constrained 18 36.92* 31.48* - 8 18.43* 0.95 0.95 0.048
(0.017; 0.076)
0.5
Free λ58,4 17 20.85 ns 17.54 ns 33.5321 1 17.80* 1.00 1.00 0.01
(0.0; 0.052)
0.94
EC
Fully Unconstrained 10 33.87* 27.50* _ _ _ 0.95 0.98 0.074
(0.042; 0.11)
0.10
Fully Constrained 18 108.40* 99.38* _ 8 81.48* 0.88 0.89 0.12
(0.097; 0.14)
0.00
PC Free λ 19,5 17 108.15* 99.05* 6.7321 _ _ 0.87 0.89 0.12
(0.10; 0.15)
0.00
PC Free τ 19,5 16 43.42* 38.04* 128.121 - - 0.96 0.97 0.066
(0.039; 0.093)
0.15
PC Final 16 43.42* 38.04* - 2 94.80* 0.96 0.97 0.066
(0.039; 0.093)
0.15
Note: UEX = Understanding Emotions External, *3: p<0.0025; 4: p<0.0026; 5: p<0.0027; 6: p<0.0029; 7: p<0.0031; 8:
p<0.0033; 9: p<0.0035; 10: p<0.0038; 11: p<0.0041; 12: p<0.0045; 13: p<0.0025; 14: p<0.0027; 15: p<0.0029; 16: p<0.0031;
17: p<0.0033; 18: p<0.0035; 19: p<0.0038; 20: p<0.0041; 21: p<0.01; ns= non significant; PC=Partially Constrained model
Table 56
MACS DIF results: Australia (n=320) and Italy (n=320) for UEX, EMO and EC

169
Australia and South Africa White
The South African EFA results for the Emotional Control subscale revealed that item 19 (“I
find it easy to control my anger at work”) did not obtain a sufficient loading (0.187) on the
first factor (measuring control of strong emotions like stress and anger in the workplace).
However, a strong loading (0.665) was obtained in the Australian data for this item on this
factor. Consequently, the item was eliminated from the Emotional Control item pool for the
DIF analysis.
The results of the Australian and South African White analyses revealed that the highest
proportion of both types of biased items emerged in the Emotional Expression subscale
(table 57). More specifically, 2 non-uniform (40%) and 2 uniform (40%) biased items was
identified. In addition, from the four items that was retained in the Emotional Control
subscale, 1 (25%) exhibited non-uniform bias and 2 uniform bias (50%) (see table 59).
Over all the subscales a total of 9 items displayed non-uniform bias (18%) whilst 15 items
(31%) displayed uniform bias.
Model df χ2 S-Bχ2 MI ∆df ∆ S-Bχ2 NNFI CFI RMSEA (CI) P
(close)
EE
Fully Unconstrained 10 31.43* 26.60* - - - 0.97 0.98 0.076
(0.041; 0.11)
0.10
Fully Constrained 18 58.60* 51.14* - 8 24.67* 0.96 0.97 0.080
(0.055; 0.11)
0.028
PC Free λ20,1 17 48.79* 43.07* 23.961 - - 0.97 0.97 0.073
(0.046; 0.10)
0.077
PC Free λ14,1 16 45.78* 39.80* 7.122 - - 0.97 0.98 0.072
(0.044; 0.10)
0.093
PC Free τ14,1 15 35.47* 30.58* 18.841 - - 0.98 0.98 0.060
(0.028; 0.090)
0.27
PC Free τ20,1 14 32.64* 28.11* 7.502 - - 0.98 0.99 0.059
(0.026; 0.091)
0.29
PC Final 14 32.64* 28.11* - 4 23.76* 0.98 0.99 0.059
(0.026; 0.091)
0.29
The final PC Understanding Emotions External model (table 58) obtained NNFI, CFI, and
RMSEA values that indicate less good model fit, compared to the pattern in the other
subscales. It may be that the dimensionality of the subscale is questionable. Although the
results for the incremental fit indices in the Emotional Management Self subscale (table 58)
Table 57
MACS DIF results: Australia (n=290) and SA White (n=290) for EE
Note: EE = Emotional Expression (5 items), PC = Partially Constrained model; *p < 0.05; 1: p<0.01; 2: p<0.0125

170
obtained the 0.95 cutoff for good model fit, the RMSEA of 0.092 and p(close fit)=0.00 did not
underscore this result. The rest of the results revealed that for the remaining two subscales
(Emotional Management Others and Emotional Control; table 59) final partially
constrained models with good model fit could be specified (NNFI and CFI ≥ 0.95; p(close
fit)>0.05; RMSEA < 0.06).
Model df χ2 S-Bχ2 MI ∆df ∆ S-Bχ2 NNFI CFI RMSEA (CI) P
(close)
UEX
Fully Unconstrained 340 1278.68* 1278.68* - - - 0.91 0.92 0.098
(0.092; 0.10)
0.00
Fully Constrained 378 1797.80* 1410.38* - 38 139.08* 0.91 0.91 0.097
(0.092; 0.10)
0.00
PC Free λ23,2 377 1794.62* 1406.90* 12.443 - - 0.91 0.91 0.097
(0.092; 0.10)
0.00
PC Free λ8,2 376 1795.07* 1405.54* 12.714 - - 0.91 0.91 0.097
(0.092; 0.10)
0.00
PC Free τ29,2 375 1792.75* 1399.71* 33.343 - - 0.91 0.91 0.097
(0.092; 0.10)
0.00
PC Free τ17,2 374 1764.90* 1373.50* 28.284 - - 0.91 0.91 0.096
(0.091; 0.10)
0.00
PC Free τ45,2 373 1741.44* 1350.64* 25.305 - - 0.91 0.91 0.095
(0.090; 0.10)
0.00
PC Free τ56,2 372 1724.30* 1334.53* 21.566 - - 0.91 0.91 0.095
(0.089; 0.10)
0.00
PC Free τ8,2 371 1727.00* 1332.83* 20.127 - - 0.91 0.91 0.095
(0.089; 0.10)
0.00
PC Free τ13,2 370 1712.78* 1320.82* 12.868 - - 0.91 0.91 0.094
(0.089; 0.100)
0.00
PC Free τ5,2 369 1701.67* 1310.29* 13.909 - - 0.91 0.91 0.094
(0.088; 0.099)
0.00
PC Free τ33,2 368 1696.95* 1305.16* 9.2210 - - 0.91 0.92 0.094
(0.088; 0.099)
0.00
PC Free τ16,2 367 1693.06* 1301.38* 9.6211 - - 0.91 0.92 0.094
(0.088; 0.099)
0.00
PC Final 367 1693.06* 1301.38* - 11 263.25* 0.91 0.92 0.094
(0.088; 0.099)
0.00
EMS
Fully Unconstrained 28 150.02* 110.14* - - - 0.93 0.96 0.10
(0.081; 0.12)
0.00
Fully Constrained 40 211.84* 160.65* - 12 50.78* 0.93 0.94 0.10
(0.086; 0.12)
0.00
PC Free λ54,3 39 184.49* 142.59* 31.1412 - - 0.94 0.95 0.096
(0.079; 0.11)
0.00
PC Free λ 2,3 38 171.76* 132.96* 14.8813 - - 0.94 0.95 0.093
(0.076; 0.11)
0.00
PC Free λ 64,3 37 163.63* 126.82* 11.3114 - - 0.95 0.95 0.092
(0.074; 0.11)
0.00
PC Final 37 163.63* 126.82* - 3 28.88* 0.95 0.95 0.092
(0.074; 0.11)
0.00
Table 58
MACS DIF results: Australia (n=290) and SA White (n=290) for UEX, EMS
Note: UEX = Understanding Emotions External, EMS = Emotional Management Self (5 items); PC = Partially Constrained
model; *p < 0.05; 3: p<0.0025; 4: p<0.0026; 5: p<0.0027; 6: p<0.0029; 7: p<0.0031; 8: p<0.0033; 9: p<0.0035; 10:
p<0.0038; 11: p<0.0041; 12: p<0.007; 13: p<0.008; 14: p<0.01
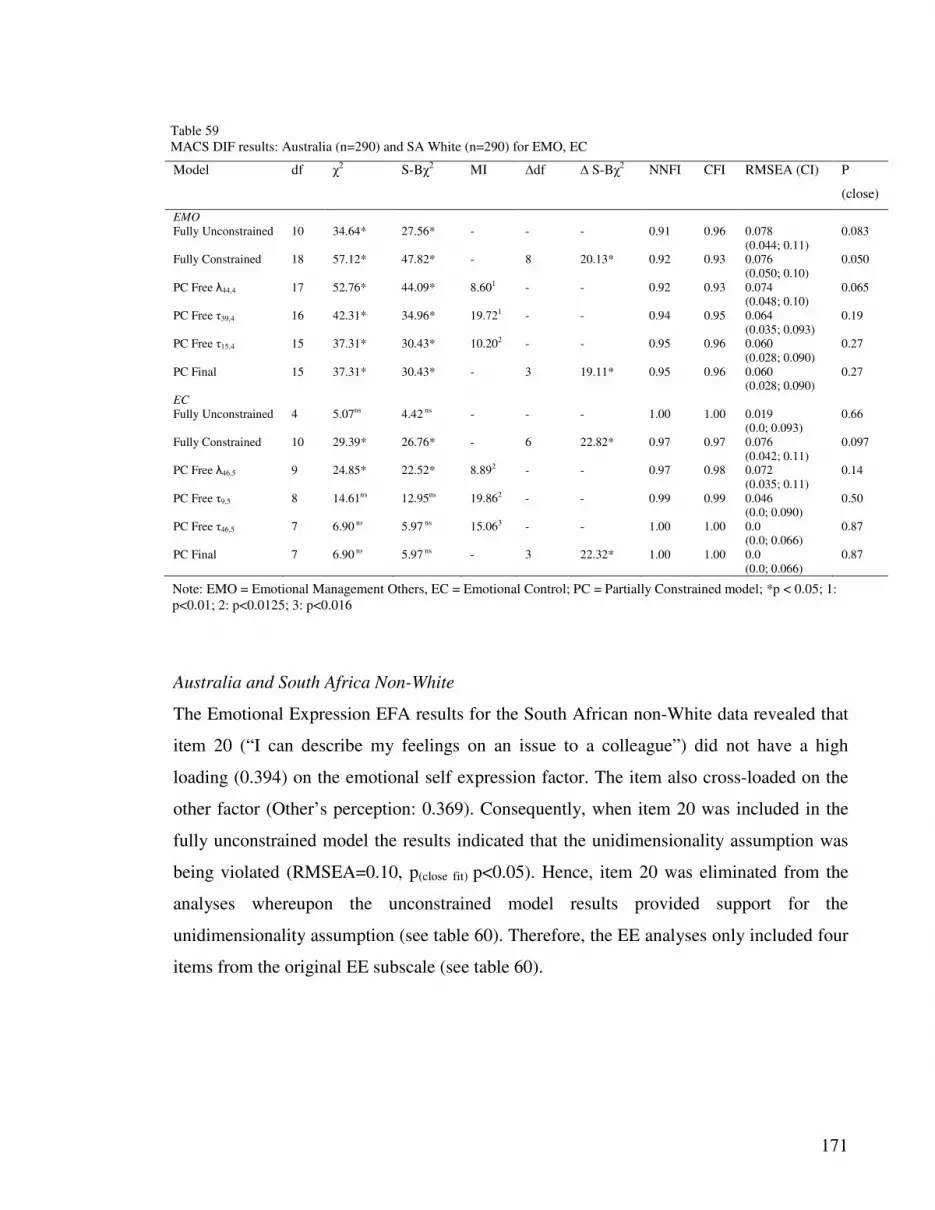
171
Model df χ2 S-Bχ2 MI ∆df ∆ S-Bχ2 NNFI CFI RMSEA (CI) P
(close)
EMO
Fully Unconstrained 10 34.64* 27.56* - - - 0.91 0.96 0.078
(0.044; 0.11)
0.083
Fully Constrained 18 57.12* 47.82* - 8 20.13* 0.92 0.93 0.076
(0.050; 0.10)
0.050
PC Free λ44,4 17 52.76* 44.09* 8.601 - - 0.92 0.93 0.074
(0.048; 0.10)
0.065
PC Free τ39,4 16 42.31* 34.96* 19.721 - - 0.94 0.95 0.064
(0.035; 0.093)
0.19
PC Free τ15,4 15 37.31* 30.43* 10.202 - - 0.95 0.96 0.060
(0.028; 0.090)
0.27
PC Final 15 37.31* 30.43* - 3 19.11* 0.95 0.96 0.060
(0.028; 0.090)
0.27
EC
Fully Unconstrained 4 5.07ns 4.42 ns - - - 1.00 1.00 0.019
(0.0; 0.093)
0.66
Fully Constrained 10 29.39* 26.76* - 6 22.82* 0.97 0.97 0.076
(0.042; 0.11)
0.097
PC Free λ46,5 9 24.85* 22.52* 8.892 - - 0.97 0.98 0.072
(0.035; 0.11)
0.14
PC Free τ9,5 8 14.61ns 12.95ns 19.862 - - 0.99 0.99 0.046
(0.0; 0.090)
0.50
PC Free τ46,5 7 6.90 ns 5.97 ns 15.063 - - 1.00 1.00 0.0
(0.0; 0.066)
0.87
PC Final 7 6.90 ns 5.97 ns - 3 22.32* 1.00 1.00 0.0
(0.0; 0.066)
0.87
Australia and South Africa Non-White
The Emotional Expression EFA results for the South African non-White data revealed that
item 20 (“I can describe my feelings on an issue to a colleague”) did not have a high
loading (0.394) on the emotional self expression factor. The item also cross-loaded on the
other factor (Other’s perception: 0.369). Consequently, when item 20 was included in the
fully unconstrained model the results indicated that the unidimensionality assumption was
being violated (RMSEA=0.10, p(close fit) p<0.05). Hence, item 20 was eliminated from the
analyses whereupon the unconstrained model results provided support for the
unidimensionality assumption (see table 60). Therefore, the EE analyses only included four
items from the original EE subscale (see table 60).
Table 59
MACS DIF results: Australia (n=290) and SA White (n=290) for EMO, EC
Note: EMO = Emotional Management Others, EC = Emotional Control; PC = Partially Constrained model; *p < 0.05; 1:
p<0.01; 2: p<0.0125; 3: p<0.016

172
Model df χ2 S-Bχ2 MI ∆df ∆ S-Bχ2 NNFI CFI RMSEA (CI) P
(close)
EE
Fully Unconstrained 4 7.85ns 6.60 ns - - - 0.99 1.00 0.044
(0.0; 0.10)
0.49
Fully Constrained 10 24.76* 21.12* - 6 14.56* 0.98 0.98 0.058
(0.022; 0.092)
0.32
PC Free λ32,1 9 20.25* 17.25* 6.962 - - 0.98 0.99 0.052
(0.0077; 0.089)
0.41
PC Free λ7,1 8 12.66 ns 10.92 ns 12.0212 - - 0.99 0.99 0.033
(0.0; 0.077)
0.69
PC Free τ7,1 7 10.03 ns 8.66 ns 7.881 - - 0.99 1.00 0.027
(0.0; 0.076)
0.73
PC Final 7 10.03 ns 8.66 ns - 3 12.22* 0.99 1.00 0.027
(0.0; 0.076)
0.73
UEX
Fully Unconstrained 340 1258.38* 972.74* - - - 0.93 0.94 0.074
(0.069; 0.080)
0.00
Fully Constrained 378 1430.45* 1132.59* - 38 174.03* 0.93 0.93 0.077
(0.072; 0.082)
0.00
PC Free λ43,2 377 1415.76* 1122.50* 29.563 - - 0.93 0.93 0.077
(0.072; 0.082)
0.00
PC Free λ45,2 376 1401.72* 1108.27* 20.994 - - 0.93 0.93 0.076
(0.071; 0.081)
0.00
PC Free λ1,2 375 1394.88* 1101.79* 13.415 - - 0.93 0.93 0.076
(0.071; 0.081)
0.00
PC Free λ23,2 374 1392.92* 1100.71* 13.136 - - 0.93 0.93 0.076
(0.071; 0.081)
0.00
PC Free λ56,2 373 1390.04* 1097.71* 8.917 - - 0.93 0.93 0.076
(0.071; 0.081)
0.00
PC Free τ45,2 372 1355.72* 1069.67* 43.003 - - 0.93 0.93 0.075
(0.069; 0.080)
0.00
PC Free τ17,2 371 1331.54* 1047.40* 42.954 - - 0.93 0.94 0.074
(0.068; 0.079)
0.00
PC Free τ27,2 370 1320.82* 1037.63* 20.545 - - 0.93 0.94 0.073
(0.068; 0.079)
0.00
PC Free τ13,2 369 1307.57* 1024.54* 35.606 - - 0.94 0.94 0.073
(0.067; 0.078)
0.00
PC Free τ56,2 368 1303.12* 1019.56* 14.347 - - 0.94 0.94 0.073
(0.067; 0.078)
0.00
PC Free τ59,2 367 1295.26* 1011.73* 14.528 - - 0.94 0.94 0.072
(0.067; 0.078)
0.00
PC Free τ23,2 366 1295.87* 1010.59* 14.069 - - 0.94 0.94 0.072
(0.067; 0.078)
0.00
PC Final 366 1295.87* 1010.59* - 12 199.57* 0.94 0.94 0.072
(0.067; 0.078)
0.00
No invariant items could be identified for the Emotional Control subscale. The Emotional
Management Self subscale (see table 61) obtained the highest proportion of both types of
biased items (42.85% non-uniform and 42.85% uniform). In the Emotional Expression
subscale 2 of the 4 retained items displayed non-uniform bias (50%) and 1 uniform bias
(25%) (see table 60). The Emotional Management Others subscale (table 61) obtained the
highest proportion of uniform biased items (3 items, 60%). However, the specification that
Table 60
MACS DIF results: Australia (n=337) and SA Non-White (n=337) for EE, UEX
Note: EE = Emotional Expression (4 items), UEX = Understanding Emotions External, PC = Partially Constrained model;
*p < 0.05; 1: p<0.01; 2: p<0.0125; 3: p<0.0025; 4: p<0.0026; 5: p<0.0027; 6: p<0.0029; 7: p<0.0031; 8: p<0.0033; 9:
p<0.0035

173
at least 2 items should be found invariant was still adhered to. The final partially
constrained MACS models for three of the four subscales obtained very good model fit
(NNFI and CFI ≥ 0.95; p(close fit)>0.05; RMSEA ≤ 0.05). Consistent with the South African
White results, the Understanding Emotions External subscale did not obtain model fit
results in the same range as the other subscales. Although a slightly better RMSEA (0.072)
was obtained (than in the South African White results), the NNFI and CFI values of 0.94
and p(close fit)=0.00 once again may be interpreted as evidence that negate the
unidimensionality assumption. Over all the subscales, a total of 16 (33%) and 19 (39%)
items displayed non-uniform and uniform bias, respectively.
Model df χ2 S-Bχ2 MI ∆df ∆ S-Bχ2 NNFI CFI RMSEA (CI) P
(close)
EMS
Fully Unconstrained 28 68.68* 53.95* - - - 0.98 0.99 0.053
(0.031; 0.073)
0.39
Fully Constrained 40 190.36* 155.83* - 12 110.46* 0.94 0.95 0.093
(0.078; 0.11)
0.00
PC Free λ54,3 39 143.12* 118.43* 55.723 - - 0.96 0.96 0.078
(0.062; 0.094)
0.0024
PC Free λ64,3 38 117.56* 97.52* 31.644 - - 0.97 0.97 0.068
(0.052; 0.085)
0.036
PC Free λ2,3 37 95.40* 79.69* 33.781 - - 0.98 0.98 0.059
(0.041; 0.076)
0.20
PC Free τ60,3 36 87.85* 72.83* 16.323 - - 0.98 0.98 0.055
(0.037; 0.073)
0.30
PC Free τ54,3 35 80.30* 66.08* 13.684 - - 0.98 0.99 0.051
(0.032; 0.070)
0.43
PC Free τ64,3 34 75.72* 61.86* 11.441 - - 0.98 0.99 0.049
(0.029; 0.069)
0.49
PC Final 34 75.72* 61.86* - 6 94.93* 0.98 0.99 0.049
(0.029; 0.069)
0.49
EMO
Fully Unconstrained 10 17.59* 15.00ns - - - 0.97 0.98 0.039
(0.0; 0.076)
0.64
Fully Constrained 18 62.64* 53.74* - 8 38.94* 0.87 0.89 0.077
(0.054; 0.10)
0.030
PC Free λ15,4 17 58.29* 49.87* 11.631 - - 0.88 0.90 0.076
(0.052; 0.10)
0.039
PC Free τ15,4 16 44.65* 38.16* 25.041 - - 0.91 0.93 0.064
(0.038; 0.091)
0.17
PC Free τ39,4 15 35.11* 29.65* 15.322 - - 0.94 0.95 0.054
(0.024; 0.082)
0.37
PC Free τ58,4 14 30.96* 25.84* 8.465 - - 0.95 0.96 0.050
(0.017; 0.080)
0.46
PC Final 14 30.96* 25.84* - 4 30.12* 0.95 0.96 0.050
(0.017; 0.080)
0.46
Note: EMS = Emotional Management Self (5 items); EMO = Emotional Management Others; PC = Partially Constrained
model; *p < 0.05; 1: p<0.01; 2: p<0.0125; 3: p<0.007; 4: p<0.0083; 5: p<0.016
Table 61
MACS DIF results: Australia (n=337) and SA Non-White (n=337) for EMS, EMO

174
Australia and Sri Lanka
No invariant items in the Emotional Management Others subscale could be identified. The
Emotional Control (see table 62) subscale obtained the highest proportion of both uniform
and non-uniform biased items (both 60%). For the remaining three subscales (tables 62 and
63), at least 42.85% of the items in each scale displayed uniform bias. Overall, the highest
proportion of biased items over the five SUEIT subscales emerged in these analyses
(compared to the other cross-cultural DIF analyses presented previously). That is, 18 (36%)
of the items displayed non-uniform bias, whilst 23 items (47%) displayed uniform bias.
Although evidence for close fit was not obtained for the PC final Emotional Expression and
Understanding Emotions External models, the remaining model fit results was within the
range (NNFI, CFI ≥ 0.95, RMSEA ≤ 0.07) obtained by the other PC final MACS models.
Model df χ2 S-Bχ2 MI ∆df ∆ S-Bχ2 NNFI CFI RMSEA (CI) P
(close)
EMS
Fully Unconstrained 28 101.01* 73.12* - - - 0.98 0.99 0.052
(0.038; 0.067)
0.37
Fully Constrained 40 174.78* 137.76* - 12 73.34* 0.97 0.97 0.065
(0.053; 0.077)
0.020
PC Free λ54,3 39 153.13* 121.01* 36.971 - - 0.98 0.98 0.060
(0.048; 0.072)
0.084
PC Free λ2,3 38 139.67* 109.66* 27.342 - - 0.98 0.98 0.057
(0.044; 0.069)
0.17
PC Free τ54,3 37 123.04* 95.71* 38.401 - - 0.98 0.98 0.052
(0.039; 0.065)
0.38
PC Free τ2,3 36 110.25* 85.05* 22.782 - - 0.98 0.99 0.048
(0.035; 0.062)
0.57
PC Free τ49,3 35 106.73* 81.71* 6.383 - - 0.98 0.99 0.048
(0.034; 0.061)
0.59
PC Final 35 106.73* 81.71* - 5 67.61* 0.98 0.99 0.048
(0.034; 0.061)
0.59
EC
Fully Unconstrained 10 56.23* 42.96* - - - 0.94 0.97 0.075
(0.053; 0.099)
0.033
Fully Constrained 18 183.66* 157.47* - 8 128.96* 0.85 0.87 0.11
(0.099; 0.13)
0.00
PC Free λ6,5 17 156.76* 131.61* 50.733 - - 0.87 0.89 0.11
(0.091; 0.12)
0.00
PC Free λ9,5 16 152.80* 127.98* 11.074 - - 0.87 0.89 0.11
(0.091; 0.12)
0.00
PC Free λ19,5 15 149.71* 125.18* 6.465 - - 0.87 0.89 0.11
(0.091; 0.12)
0.00
PC Free τ6,3 14 75.78* 61.41* 131.223 - - 0.93 0.95 0.076
(0.057; 0.096)
0.013
PC Free τ9,3 13 59.87* 47.85* 31.124 - - 0.95 0.97 0.068
(0.048; 0.089)
0.071
PC Free τ19,3 12 56.83* 44.66* 8.225 - - 0.95 0.97 0.068
(0.048; 0.090)
0.072
PC Final 12 56.83* 44.66* - 6 132.95* 0.95 0.97 0.068
(0.048; 0.090)
0.072
Note: EMS = Emotional Management Self (5 items); EMO = Emotional Management Others; EC = Emotional Control; PC
= Partially Constrained model; *p < 0.05; 1: p<0.007; 2: p<0.0083; 3: p<0.01; 4: p<0.0125; 5: p<0.0025; 4: p<0.0026; 5:
p<0.016
Table 62
MACS DIF results: Australia (n=587) and Sri Lanka (n=587) for EMS, EC

175
Model df χ2 S-Bχ2 MI ∆df ∆ S-Bχ2 NNFI CFI RMSEA (CI) P
(close)
EE
Fully Unconstrained 10 61.46* 52.49* - - - 0.95 0.98 0.085
(0.063; 0.11)
0.0050
Fully Constrained 18 125.88* 111.78* - 8 60.19* 0.94 0.95 0.094
(0.078; 0.11)
0.00
PC Free λ32,1 17 121.11* 108.71* 7.811 - - 0.94 0.95 0.096
(0.079; 0.11)
0.00
PC Free τ32,1 16 93.27* 82.73* 45.641 - - 0.95 0.96 0.084
(0.067; 0.10)
0.00
PC Free τ20,1 15 68.25* 59.49* 54.562 - - 0.97 0.98 0.071
(0.053; 0.091)
0.030
PC Free τ7,1 14 64.84* 55.92* 6.6812 - - 0.97 0.98 0.071
(0.052; 0.092)
0.033
PC Final 14 64.84* 55.92* - 4 60.47* 0.97 0.98 0.071
(0.052; 0.092)
0.033
UEX
Fully Unconstrained 340 1316.84* 1048.81* - - - 0.95 0.95 0.060
(0.056; 0.064)
0.00
Fully Constrained 378 2052.31* 1726.56* - 38 1246.10* 0.91 0.91 0.078
(0.074; 0.082)
0.00
PC Free λ17,2 377 2029.00* 1703.15* 36.63 - - 0.91 0.91 0.077
(0.074; 0.081)
0.00
PC Free λ43,2 376 2002.79* 1677.32* 39.124 - - 0.91 0.91 0.077
(0.073; 0.081)
0.00
PC Free λ34,2 375 1981.56* 1653.74* 38.065 - - 0.91 0.91 0.076
(0.073; 0.080)
0.00
PC Free λ13,2 374 1952.90* 1623.79* 36.266 - - 0.91 0.92 0.076
(0.072; 0.079)
0.00
PC Free λ48,2 373 1941.73* 1615.34* 29.567 - - 0.91 0.92 0.075
(0.072; 0.079)
0.00
PC Free λ45,2 372 1927.76* 1601.95* 22.348 - - 0.92 0.92 0.075
(0.071; 0.079)
0.00
PC Free λ29,2 371 1917.14* 1590.73* 12.179 - - 0.92 0.92 0.075
(0.071; 0.079)
0.00
PC Free τ16,2 370 1789.24* 1475.82* 157.583 - - 0.92 0.93 0.071
(0.068; 0.075)
0.00
PC Free τ34,2 369 1666.45* 1370.58* 141.944 - - 0.93 0.93 0.068
(0.064; 0.072)
0.00
PC Free τ43,2 368 1573.62* 1288.22* 151.565 - - 0.94 0.94 0.065
(0.061; 0.069)
0.00
PC Free τ17,2 367 1495.90* 1219.61* 113.966 - - 0.94 0.94 0.063
(0.059; 0.067)
0.00
PC Free τ13,2 366 1433.10* 1163.94* 100.047 - - 0.94 0.95 0.061
(0.057; 0.065)
0.00
PC Free τ29,2 365 1400.65* 1134.16* 68.188 - - 0.95 0.95 0.060
(0.056; 0.064)
0.00
PC Free τ27,2 364 1375.68* 1110.99* 48.449 - - 0.95 0.95 0.059
(0.055; 0.063)
0.00
PC Free τ22,2 363 1368.37* 1103.82* 16.3010 - - 0.95 0.95 0.059
(0.055; 0.063)
0.00
PC Free τ52,2 362 1363.88* 1099.09* 10.5011 - - 0.95 0.95 0.059
(0.055; 0.063)
0.00
PC Final 362 1363.88* 1099.09* - 16 104790.3* 0.95 0.95 0.059
(0.055; 0.063)
0.00
Table 63
MACS DIF results: Australia (n=587) and Sri Lanka (n=587) for EE, UEX
Note: EE = Emotional Expression (5 items), UEX = Understanding Emotions External, EMS = Emotional Management Self (5
items); EMO = Emotional Management Others; EC = Emotional Control; PC = Partially Constrained model; *p < 0.05; 1:
p<0.01; 2: p<0.0125; 3: p<0.0025; 4: p<0.0026; 5: p<0.0027; 6: p<0.0029; 7: p<0.0031; 8: p<0.0033; 9: p<0.0035; 10:
p<0.0038; 11: p<0.0041; p<0.007; 11: p<0.0083; 12: p<0.016

176
4.5.8.4 Discussion: MACS DIF results
As predicted, various discrepancies in the DIF results obtained with the MACS, compared
to the ANOVA approach, exist. A key question, however, was whether a similar pattern of
the number of item bias that emerged, as the CD with Australia increased, were obtained.
Hence, it was hypothesised that:
Hypothesis 7: As the CD from Australia increases (i.e. CDR patterns 1 or 2), the higher the
probability that more biased items will emerge over the respective sample groups (e.g. least
number of biased items over the Australia and New Zealand / USA analyses, most with the
Australian and Sri Lanka analysis).
Partial41
support for hypothesis 7 emerged. The ANOVA DIF results revealed the
following pattern (from least to most bias): New Zealand (none), South Africa (none), USA
(2% uniform), South Africa Non-White (4% uniform, 4% non-uniform), Sri Lanka (14%
uniform), and Italy (32% uniform, 2% non-uniform). The MACS result pattern was as
follows: New Zealand (2% uniform, 4% non-uniform), USA (8% uniform, 12% non-
uniform), South Africa White (31% uniform, 18% non-uniform), South Africa Non-White
(39% uniform, 33% non-uniform), Italy (36% uniform, 38% non-uniform), and Sri Lanka
(47% uniform, 36% non-uniform). Although there are slight differences in these two
patterns, the MACS results, similar to the ANOVA results, revealed a marked difference in
amount of biased items between the Western (e.g. New Zealand, USA – least) and non-
Western cultures (e.g. Sri Lanka - most).
However, the proportion of MACS DIF items in each analysis was noticeably higher, than
in the ANOVA results (when similar cultures are compared). No cut-off value for the
proportion of DIF items on a scale above which practical implications may be important,
exist. Chan (2000, p.191) holds that, “when DIF occurs for only one or a few out of many
items on a scale, the practical implication may be trivial”. He advises computing an index
41
Partial support was obtained as there was a clear trend in terms of more biased items emerging in the non-
Western (e.g. Sri Lanka – larger CD) country analyses in comparison with the Western (e.g. New Zealand –
smaller CD) countries. However, the MACS results pattern confirmed neither of the CDR patterns (i.e. tables
4 and 5) completely.

177
of ‘practical significance’ by computing the mean score on the affected subscale for each
group, with and without removing the offending item(s). Then the standardised mean
difference (d statistic) is computed over the two groups42
. A summary of the results over
all the affected subscales and cultural groups are provided in table 64. Generally, the
following criterion for the interpretation of Cohen’s d, is applied: small, d = 0.2 to 0.49;
medium, d = 0.5 to 0.79; large, d = 0.8 or bigger (Cohen, 1988).
The results in table 64 indicate that over all the subscales and cultural groups, the practical
implication of removing the DIF items is small. However, relative to the other cultural
groups, the average between-group differences for Italy (average d over all subscales =
0.19) and Sri Lanka (average d over all subscales = 0.17) was the largest. This was
followed by the South African non White (average d = 0.09), the South African White
(average d = 0.07) and USA results (average d = 0.05). What is evident from the results is
that the transfer of the SUEIT to Sri Lanka, Italy or South Africa, would require a fair
number of effort spent on adaptation of the original instrument (judged by the number of
affected items) even if the sensitivity analyses (as conducted here) does not show evidence
of large influences when affected items are removed. It should also be noted that in some
cases only a minimum of two items showed no DIF (e.g. Emotional Control and Emotional
Expression subscales in Sri Lanka, Emotional Management Others and Emotional
Expression subscales in South African non-White; Emotional Control, Emotional
Management Others in South African White analyses). This would hamper the integrity of
further SEM research on these models, as a minimum of four items per construct (Muliak &
Millsap, 2000) is generally required to obtain reliable (and replicable) results.
42
For this calculation, the pooled standard deviation was used. According to Cohen (1988, p.44), “the pooled
standard deviation is found as the root mean square of the two standard deviations”.

178
Standardised mean difference
Australia &
New Zealand
Australia &
USA
Australia &
Italy
Australia &
Sri Lanka
Australia &
SA White
Australia &
SA Non-
White
EE n.a. 0.02 0.18 0.10 0.07 0.08
UEX 0.03 0.04 0.22 0.25 0.08 0.11
EMS n.a. 0.08 n.a. 0.02 0.02 0.10
EMO n.a. n.a. 0.22 n.a. 0.07 0.07
EC n.a. 0.06 0.15 0.33 0.13 n.a.
A work group of The International Test Commission (ITC) developed a set of guidelines
for the translation and adaption of psychological and educational tests for use in different
linguistic and cultural contexts (Hambleton, 1994; Van de Vijver & Hambleton, 1996).
These guidelines apply wherever tests are transported from one cultural setting to another –
regardless of whether there is a need for translation. Guidelines concerned with instrument
development and adaptation include, for example, that, “Test developers/publishers should
provide statistical evidence of the equivalence of questions for all intended populations”
(such as was provided above) and “Non-equivalent questions between versions intended for
different populations should not be used in preparing a common scale or in comparing these
populations” (Van de Vijver & Hambleton, 1996, p.95). This would imply that, based on
these results up to almost half of the items in the SUEIT should not be used to calculate
mean scores (for research or practical purposes) in the affected non-Western cultures
included in this study. Moreover, when adapting the instrument, it may be that not only
modifications in wording of items are needed. Sometimes a change in stimulus content is
also needed. It may be that non-equivalence of stimuli points to ‘cultural decentering’ that
is, “…the cross-cultural non-identity of the trait being measured by the instrument” (Berry
et al., 2002, p. 306). Hence, cross-cultural investigations based on an established taxonomic
model of EI (see Palmer et al., 2008) should be supplemented with cultural specific studies
to uncover cultural specific elements of EI.
Although the issue of partial invariance is sometimes met with skepticism it is likely to be
the typical case in many research situations (Steenkamp & Baumgartner, 1998). In this
study, partial invariance was used as a strategy where the ideal of full invariance was not
Table 64
Standardised mean difference (d statistic) for affected SUEIT subscales over various cultural groups
Note: EE = Emotional Expression; UEX = Understanding Emotions External; EMS = Emotional Management Self; EMO
= Emotional Management Others; EC = Emotional Control

179
realised, in order to allow for valid cross-cultural comparisons between the cultural groups
on the EI dimensions.
4.5.9 Results: Latent mean differences in EI
With the approach that was followed in the previous section, the final partially constrained
model provides evidence for partial metric and scalar invariance (i.e. at least two item
slopes and intercepts per subscale are found to be invariant)43
. Latent mean differences
(tabel 65) were therefore interpreted from the final partially constrained models (per EI
subscale) obtained from the MACS analyses (section 4.5.8.3).
The results revealed (table 65) that for the Australia and Italy (Emotional Management
Self), Sri Lanka (Emotional Management Others), as well as South African non-White
(Emotional Control) analyses, the minimum requirement of two invariant item slopes and
intercepts could not be satisfied. No latent mean comparisons between these groups on the
subscale scores were permissible. For the Australia and USA Emotional Management
Others’ subscale, no Kappa value was estimated as no non-zero modification indices could
be identified. Here mean scores (raw scores) may be meaningfully compared over the two
groups.
The following research questions regarding latent mean differences were investigated:
When subscale scores can be meaningfully compared across different cultures (countries),
do significant latent mean differences in emotional expression and regulation as key
aspects of emotionally intelligent behaviour exist over cultures (countries)? Are the
expected differences (i.e. significance and direction) congruent with theoretical arguments
in this regard?
43
Steenkamp and Baumgartner (1998, p.81-82) state that, “it can be shown that at least one item besides the
marker item has to have invariant factor loadings and invariant intercepts in order for cross-national
comparisons of factor means to be meaningful (proof of this proposition is available from the authors).
Ideally, a majority of factor loadings and intercepts will be invariant across countries because in that case the
latent means are estimated more reliably (i.e. they are based on many cross-nationally comparable items) and
differences in latent means succinctly summarise the pattern of differences in observed means across
countries”.

180
44KAPPA (κ)
Australia &
New Zealand
Australia &
USA
Australia &
Italy
Australia &
Sri Lanka
Australia &
SA White
Australia &
SA Non-
White
EE 0.10
(0.06)
1.67
-0.02
(0.05)
-0.43
-0.15
(0.06)
-2.64*
-0.07
(0.04)
-1.71
-0.36
(0.05)
-6.63**
-0.33
(0.06)
-5.82**
UEX 0.02
(0.04)
0.43
0.04
(0.03)
1.11
-0.34
(0.04)
-8.45**
-0.14
(0.03)
-5.15**
-0.27
(0.04)
-6.40**
-0.46
(0.04)
-10.22**
EMS 0.03
(0.05)
0.61
-0.13
(0.06)
-2.12*
n.a. -0.12
(0.04)
-2.98*
-0.26
(0.06)
-4.09**
-0.12
(0.05)
-2.23*
EMO 0.00
(0.05)
0.09
n.e. -0.64
(0.07)
-9.65**
n.a. -0.12
(0.03)
-3.72*
-0.07
(0.03)
-2.27*
EC 0.06
(0.03)
1.65
0.02
(0.04)
0.67
-0.03
(0.05)
-0.61
-0.36
(0.04)
-9.38**
-0.04
(0.07)
-0.58
n.a.
In terms of latent mean differences between Sri Lanka and Australia, it was hypothesised:
Hypothesis 8: Sri Lanka as a Collectivistic, high Power Distance non-Western society will
obtain a significant higher latent mean score on Emotional Control than Australia, an
Individualistic, low Power Distance Western society.
Although there was a significant latent mean difference between Sri Lanka and Australia on
the Emotional Control subscale, the results revealed (tabel 65) that this difference was not
in the hypothesised direction. That is, Sri Lanka obtained a lower (not higher) latent mean
score relative to Australia, on Emotional Control. Hence, hypothesis 8 is not supported.
44
The Kappa values represent the results of the latent mean differences between each of the groups and
Australia separately. Due to the fact that individual group comparisons were conducted, it is not possible to
directly compare the different groups with each other (as the measurement scale may differ over the different
analyses). Hence no horisontal group comparisons in this table should be interpreted. Rather, each of the
values should be viewed as latent mean differences with Australia (as the reference group). As the reference
indicator value over the different subscales also differed, the magnitude of the latent mean differences
(vertical) may also not be compared with each other.
Note: EE = Emotional Expression; UEX = Understanding Emotions External; EMS = Emotional Management Self;
EMO = Emotional Management Others; EC = Emotional Control, *p < 0.05; **p < 0.001, n.a = not applicable to
calculate latent mean differences; n.e. = not estimated
Table 65
EI Latent mean differences

181
Hypothesis 9: Sri Lanka as a Collectivistic, high Power Distance non-Western society will
obtain a significant higher latent mean score on Emotional Management Self than
Australia, an Individualistic, low Power Distance Western society.
From the results (table 65) it is evident that a lower (not higher) mean score was estimated
for the Sri - Lanka Emotional Management Self subscale, relative to Australia. Although a
significant difference in estimated means emerged, the difference was not in the
hypothesised direction. Therefore, hypothesis 9 is not supported.
Hypothesis 10: Sri Lanka as a Collectivistic, high Power Distance non-Western society will
obtain a significant lower latent mean score on Emotional Expression than Australia, an
Individualistic, low Power Distance Western society.
As is evident from the results (table 65), no significant difference in Emotional Expression
latent means (Sri - Lanka relative to Australia) emerged. Hence, hypothesis 10 is not
supported.
In terms of latent mean differences between Italy and Australia, it was hypothesised:
Hypothesis 11: Italy, as an Individualistic, high Uncertainty Avoidance society, will obtain
a significant lower latent mean score on Emotional Management Self than Australia, an
Individualistic, moderate Uncertainty Avoidance Western society.
For the Emotional Management Self subscale in the Italian, Australian MACS analysis, the
minimum requirement of two invariant item slopes and intercepts could not be satisfied.
Hence, no latent mean for Italy (relative to Australia) on the Emotional Management Self
subscale could be estimated. Hypothesis 11 is not supported.
Hypothesis 12: Italy, as an Individualistic, high Uncertainty Avoidance society, will obtain
a significant lower latent mean score on Emotional Control than Australia, an
Individualistic, moderate Uncertainty Avoidance Western society.

182
As is evident from the results (table 65) no significant difference in Emotional Control
latent means between Italy and Australia was estimated. Hypothesis 12 is not supported.
Hypothesis 13: Italy, as an Individualistic, high Uncertainty Avoidance society, will obtain
a significant higher latent mean score on Emotional Expression, than Australia, an
Individualistic, moderate Uncertainty Avoidance Western society.
From the results (table 65) it is evident that a lower (not higher) mean score was estimated
for the Italian Emotional Expression subscale, relative to Australia. Although a significant
difference in estimated means emerged, the difference was not in the hypothesised
direction. Therefore, hypothesis 13 is not supported.
In terms of latent mean differences between the USA, New Zealand and Australia, it was
hypothesised:
Hypothesis 14: There will not be significant latent mean score differences on the Emotional
Management Self, Emotional Control and Emotional Expression subscales between the
USA and Australia, as similar Western societies.
The results revealed (table 65) that non-significant differences emerged for two (i.e.
Emotional Expression, Emotional Control) of the three hypothesised subscales in the USA /
Australia analyses. The negative kappa value for the Emotional Management self subscale
implies a lower latent mean score for the USA group, compared to Australia. Hypothesis 14
is only partially supported.
Hypothesis 15: There will not be significant latent mean score differences on the Emotional
Management Self, Emotional Control and Emotional Expression subscales between New
Zealand and Australia, as similar Western societies.
As predicted, no significant differences between estimated latent means (on the three
respective subscales) for New Zealand, relative to Australia, emerged (tabel 65). Hence,
Hypothesis 15 is supported.

183
In terms of latent mean differences between South Africa White45
and Australia, it was
hypothesised:
Hypothesis 16: South Africa White, as an Individualistic, low Uncertainty Avoidance
society, will obtain a significant lower latent mean score on Emotional Expression, than
Australia, an Individualistic, moderate Uncertainty Avoidance Western society.
From the results (table 65) it is evident that a lower latent mean score (significant) was
estimated for the South African Emotional Expression subscale, relative to Australia.
Therefore, hypothesis 16 is supported.
Hypothesis 17: South Africa White, as an Individualistic, low Uncertainty Avoidance
society, will obtain a significant higher latent mean score on Emotional Control, than
Australia, an Individualistic, moderate Uncertainty Avoidance Western society.
As is evident from the results (table 65) no significant difference in Emotional Control
latent means between South Africa White and Australia was estimated. Hypothesis 17 is not
supported.
Hypothesis 18: South Africa White, as an Individualistic, low Uncertainty Avoidance
society, will obtain a significant higher latent mean score on Emotional Management Self,
than Australia, an Individualistic, moderate Uncertainty Avoidance Western society.
From the results (table 65) it is evident that a lower (not higher) mean score was estimated
for the South African Emotional Management Self subscale, relative to Australia. Although
a significant difference in estimated means emerged, the difference was not in the
hypothesised direction. Therefore, hypothesis 18 is not supported.
45
No specific hypotheses were formulated for the South African non-White group, due to a moderate standing
on the uncertainty avoidance dimension.
184
4.5.10 Discussion: latent mean differences in EI
In general the results showed a clear Western (with the exception of the South African
White data) versus non-Western split in the pattern of significance of latent mean
differences. That is, with the exception of one subscale (Emotional Management Self), no
significant differences existed between New Zealand and the USA, compared to Australia.
It would, therefore, not be erroneous to conclude that equal ‘amounts’ of the respective EI
facets (measured per subscale) seem to manifest in a similar manner in these Western
groups. A similar pattern over the non-Western cultural groups (i.e. South Africa non-
White, Sri Lanka and Italy) emerged. The significant, lower latent means in almost all of
the facets of the non-Western groups (compared to Australia), indicate that these cultures
seem to exhibit ‘less’ of these EI latent traits, than their Western counterpart (i.e. Australia).
The individual non – Western group comparison results mostly did not confirm the
predicted direction of latent mean differences, based on the cultural dimension scores and
related arguments put forward in this regard. One exception is the South African (White)
Emotional Expression result. Here it was argued that the extreme low Uncertainty
Avoidance score may have the opposite effect on beliefs held regarding behaviours related
to emotional expression, than in high Uncertainty Avoidance societies (generally, more
expressive societies). That is, societies characterised by low Uncertainty Avoidance would
inhibit overly emotional expressive behavior. The result indicated that White South
Africans do seem to possess less of the emotional expression latent trait than Australians.
To the knowledge of the author, only one study that reports latent mean differences in EI
has been published. Batista-Foguet, Boyatzis, Guillen and Serlavos (2008) report on
differences in emotional and social competencies (as measured by a university specific
version of the Emotional Competency Inventory – ECI-U) over three culturally diverse
samples (from two business schools, one situated in Ohio, USA and the other in Barcelona,
Spain), after conducting the necessary invariance test. The first analysis established the
equivalence of English and Spanish versions of the test (respondents all from the Spanish
business school). In a subsequent analysis, the equivalence of English speaking US and
Asian data (US business school) with English speaking Spanish, European and Latin

185
American data (Spanish business school), were established (per competency cluster). Not
all of the competency clusters met the invariance requirements to allow latent mean
comparisons. For example, for the self-awareness46
cluster in both of the analyses, only
configural invariance was established. The authors conclude that because these
competencies refer to inner feelings, there are cultural differences in the willingness to
reveal, or express such emotional self-awareness. The Emotional Expression subscale
results in the current study may reflect a similar trend as significant latent mean differences
between Western (Australia) versus non – Western (Italy, South Africa) cultures were
found. This may mirror what is known about the differential susceptibility of cultural
influence on different components of emotion. For example, Soto, Levenson, and Ebling
(2005) found that Chinese Americans reported experiencing significant less emotion
(consistent with their cultural origin of emotional moderation) than did Mexican Americans
(origin of emotional expressiveness) when exposed to an aversive acoustical startle
stimulus. However, physiological differences among the groups were minimal and evidence
for greater emotional expression was only found when participants who most strongly
identified with their culture of origin, were compared. The authors conclude that this
reflects the extent to which emotional response (i.e. expression) are susceptible to voluntary
control as well as the social visibility of those components. Self report emotional
experiences (i.e. what we say we are feeling, how we label emotions) seem to be quite
pliable in the presence of cultural values and customs (‘display rules’).
Furthermore, in the Batista-Foguet et al., (2008) study, the Spanish group obtained higher
means in the social skills cluster (i.e. teamwork and collaboration, empathy, leveraging
diversity, building bonds) then their English counterparts (first analysis). In the second
analysis higher latent means for the self management cluster (flexibility, emotional self-
control, achievement orientation) was obtained by the US sample (Western) compared to
the English Spanish (non-Western) sample. This result is partially replicated in the current
study where higher latent means on Emotional Management Self was observed for the
Australia (Western) versus Sri Lanka, and South African groups.
46
The Self awareness cluster include a self awareness competency (i.e. recognising one’s emotions and their
effects) as well as a self-confidence competency (i.e. having a strong sense of one’s self-worth and
capabilities).

186
From the latent mean results it is clear that there are differences in EI facets possessed by
different cultural groups. These differences become more pronounced when the cultural
distance with the reference group (Australia) increases. In the absence of previous research
of this nature (with the SUEIT or other similar EI measures), these exploratory results can
only truly be accepted once replication has been shown.
4.6 General discussion
The transfer of validity (e.g. construct and predictive validity) of psychological
measurement instruments from one cultural context to another should routinely be
demonstrated. It should not be taken for granted. Larger cultural distances will generally
jeopardise the validity more (Van de Vijver & Hambleton, 1996). The notion of EI has
largely been based on Western research. Psychometric data on EI in the East, for example,
have been noted as, “rather scanty” (Gangopadhyay & Mandal, 2008, p.118) although
notable ongoing efforts do exist to adapt and evaluate Western tests for non-Western
contexts (for a review on such efforts in India, for example, see Srivastava, Sibia & Misra,
2008).
This investigation focused on the generalisability and transportability of a Western EI
measure to several Western and non-Western cultures. It aimed to examine the extent to
which culture systematically influences the transportability of the psychometric properties
of the SUEIT. Replicable factor structures, for example, may indicate the absence of
construct bias in exported Western measures. It may also strengthen beliefs in the existence
of EI as a pancultural construct.
Methodological, theoretical and practical implications of this investigation can be
identified. The most pronounced methodological implication relates to employing different
data analytic strategies for conducting cross-cultural research. For some, but not all of the
analyses, a similar pattern of results with the different methodologies (SEM versus
traditional cross-cultural methods) were attained (e.g. DIF results). The SEM results,
however, seem to be more sensitive in capturing a ‘true’ picture of subtle cultural

187
influences affecting the portability of the instrument (e.g. item keying effects). For
example, if the Tucker’s Phi results are considered one would conclude that the instrument
shows adequate structural equivalence. All, but one dimension (Emotional Management
Self in the Italian data), obtained congruence coefficients of >0.98 over all the samples.
However, the individual CFA and multi-group configural invariance results, paint a
different picture. Clear evidence emerged that substantiates the fact that there are more than
five latent traits underlying the original 64-item instrument. This replicates Gignac’s (2005)
seminal work on the SUEIT based on Australian data. However, this trend was noted in all
the other Western and non-Western results in this study.
Moreover, methodologically it was argued that the practice of conducting validity extension
studies may not be stringent enough to find the most generalisable model over various
groups. To this end it was argued that a validity generalisation procedure (Diamantopoulos
& Siguaw, 2000) should routinely be conducted. This would indicate a superior
measurement model (i.t.o. generalisation potential) between competing models. Such types
of analyses procedures may be the starting point of uncovering the universal structure of the
EI construct – a critical theoretical contribution to the development of our understanding of
the cultural nature of the construct. Facets that do not replicate could point towards cultural
specificity of the construct.
For example, Palmer et al., (2008) has recently suggested that a comprehensive taxonomy
of EI is likely to contain six facets. These include, (1) Emotional Self-Awareness, (2)
Emotional Expression, (3) Emotional Awareness of Others, (4) Emotional Reasoning, (5)
Emotional Self-Management, and (6) Emotional Management of Others. A rigorous
empirical generalisability study (with application of MI procedures) with a large multi-
national dataset (Western and non-Western cultures) may inform on the universality of
these facets. Such a study should be supplemented by a similar approach based on an
indigenous EI taxonomy (for an example see description of the Srivastava, Sibia, and
Misra, 2008, model in chapter five of this dissertation). Facets of EI that withstand a cross-
validation over Western and non-Western cultural groups of both these taxonomies, should
be regarded as cultural universal facets of the construct.

188
Regarding the transportability of the SUEIT (and the practical implications thereof), a clear
pattern over the Western cultures emerged. When the measure was scrutinised for bias (i.e.
equivalence at different levels) full measurement invariance obtained in the Australian and
New Zealand analyses support the use of the SUEIT over these two groups, without
requiring New Zealand norms. Although it is good practice to always ensure the use of
country specific norms, for research applications, however, Australian and New Zealand
respondents may be meaningfully compared on the respective latent traits (EI dimensions).
Although the results for the ‘clear’ Western countries (New Zealand and USA) was
consistent in terms of least amount of bias and no significant latent mean differences
(except for the Emotional Management Self subscale in the USA analysis) it is interesting
to note that New Zealand displayed the smallest amount of bias and not the USA. This was
contradictory to the prediction that the USA has a smaller cultural distance with Australia,
than New Zealand (see CDR patterns 1 and 2, tabels 4 and 5).
A possible explanation for this result may be the fact that there is a greater amount of
cultural integration between Australia and New Zealand, than Australia and the USA,
probably due to the geographical proximity between these two countries. Under the 1973
Trans-Tasman Travel Arrangement, citizens from Australia and New Zealand has been
allowed access (for visit, living and work purposes) to each other’s countries – without
having to apply for authority to do so47
. Australia is the largest New Zealand expatriate
community in the world. By the 2000s, it was estimated that one in nine New Zealanders
lived in Australia (Migration to Australia, n.d.). The Australian Government Department of
Immigration and Citizenship estimated 449000 New Zealand citizens present in Australia at
30 June 2005 (Fact sheet 17- New Zealanders in Australia, n.d.). Most of them are
economically active (in 2000, 62% were between 20 and 49 years) (Migration to Australia,
n.d.). The practical implication of this result is that New-Zealand emigrants working in
Australia would not be adversely affected if their SUEIT scores are used to inform selection
47
Since amendments to the Migration Act 1958 on 1 September 1994, all non-citizens lawfully in Australia,
are required to hold visas. This, however, implied no practical change in procedures for New Zealanders
entering Australia. A Special Category Visa (SCV) is automatically granted upon arrival in Australia with a
valid New Zealand Passport (Fact sheet 17- New Zealanders in Australia, n.d.).

189
decisions (in comparison with Australians). However, USA specific norms would be
required when using the instrument on native USA respondents.
Another practical implication of the Western countries’ results pertains to the ARS
response style that was evident in the data. It is not known to what extent the ARS results
may reflect a social desirability response set (i.e. the tendency to present a favourable
impression of oneself in terms of prevailing cultural norms, when responding to
questionnaire items, Mick, 1996). Research on the Bar-On EQ-i: S (Grubb & McDaniel,
2007) has shown the measure to be susceptible to social desirability. Future research /
application of the SUEIT in the Western context may benefit from the inclusion of a social
desirability measure to quantify this type of bias in the data.
Equivalence and bias are crucial issues in any society where psychological assessment tools
are used to contribute to the efficiency of selection, placement and management of human
resources in the workplace. The results of this study provide evidence that the
transportability of the SUEIT is adversely affected when the instrument is applied in non-
Western cultures with a notable cultural distance with Australia. For example, cultural
specific norms for all groups included in this study should be used to avoid adverse impact
in personnel selection decisions when applicants from different countries are being tested.
In addition, evidence emerged for a method bias effect in the data of bilingual respondents
from non-Western countries. It was shown that language proficiency influences the validity
of test results.
In South Africa, psychologists are required to be proactively48
involved in providing
evidence that tests are fair and unbiased (Van de Vijver & Rothmann, 2004). Section 8 of
the Employment Equity Act 55 of 1998 (Government Gazette, 1998) stipulates that:
“Psychological testing and other similar assessments are prohibited unless the test or the
assessment being used – (a) has been scientifically shown to be valid and reliable, (b) can
be applied fairly to all employees; and (c) is not biased against any employee or group.”
48
This is at odds with most other countries where fairness of psychological tests are assumed, unless proven
otherwise.

190
This implies that South African I/O Psychologists should be pursuing the validation of
existing instruments for use in multicultural, multilingual groups. This is a daunting task as
South Africa has 11 national languages. However, in a qualitative study on psychological
test usage in South African workplaces, two views regarding the practical implication of
non-mother tongue testing, generally emerge (Paterson & Uys, 2005). Some argue in
favour of English testing as language barriers (not being proficient in English due to
speaking another mother tongue) will reflect in work performance. Practitioners that hold
this view simply disregard the stated legal requirements for demonstrating unbiased
assessment of multilingual groups. Others do acknowledge that poor test performance may
be due to poor language skills and not the latent trait being measured (Paterson & Uys,
2005). This study provide further evidence that the latter view is a true reflection of the
reality of cross-cultural multilingual assessment in South Africa. It concurs with similar
South African studies on other individual difference attributes (see e.g. Foxcroft & Aston,
2006). In an attempt to meet legal requirements and assure ethical use of the SUEIT in
multilingual cultural groups in general (not just in South Africa), all role players (i.e. I/O
Psychologists, researchers) should be cognisant of this challenge and its implications.
For example, cross-cultural adaptation of the SUEIT may be necessary. According to Van
de Vijver and Tanzer (1997), three options should be considered. Application involves a
literal translation of the instrument into the target language. Here it is assumed that the
underlying constructs are similar in the different cultural groups. Concurrent development
of dual language assessments (e.g. Solano-Flores, Trumbull & Nelson-Barber, 2002) may
be used to overcome limitations of the Application approach. Adaptation include a
combination of development of new items (to incorporate cultural peculiar expressions), as
well as changes to/and literal translation of existing items. With the Assembly option a new
instrument is assembled. DIF of a majority of the original items or indigenous facets of the
construct, not included in the original instrument, are reasons for choosing Assembly.
Undoubtedly, the cost effectiveness of these options will differ (for a review on costs and
benefits of cross-cultural assessment for different role players, see Van de Vijver, 2002).
191
This investigation also focused on culturally driven response styles (i.e. ERS or ARS) as a
source of method bias in cross-cultural assessment. ERS differences were found to be
negligible. ARS was evident in the Western cultural groups. Overall, however, it was
concluded that these response styles may not have been a confounding method bias factor
in the current data. The theoretical contribution of the results centered on the replication of
previous research on culturally driven response styles. The results mostly did not confirm
previous research. However, closer inspection of sample properties revealed that the some
of the results could be explained in terms of social mobility theory (i.e. movement from a
low to higher status group) and the cultural accommodation hypothesis (see section 4.5.7).
That is, the effects of changes in education and socio economic standing (associated with
social mobility theory), as well as bilingualism on respondents’ survey responses.
Two implications of these results for future research should be mentioned. Firstly, it is
imperative that future studies collect information on subject and context variables (e.g.
educational background, socio economic status, attitudes regarding cultural origin). This
would allow for an empirical verification of social mobility in a given cultural group (e.g.
non-White South Africans). It may inform on the need to establish specific group norms for
such ‘sub-cultural’ groups in the workplace. Secondly, social mobility may be associated
with a greater measure of psychological acculturation. Psychological acculturation refers to
changes that an individual experiences as a result of being in contact with other cultures
(Berry et al., 2002). As the speed of globalisation accelerates, the workplace continues to
see unprecedented collaborations from people with diverse backgrounds and cultures. For
example, one in every 10 persons living in more developed regions is a migrant, whilst
more than 21% of the Australian and 17% of the Canadian population, are foreign born
(Hong, Wan, No, & Chiu, 2007). According to Ota (2004) exposure to knowledge from
different cultures highlights cultural contrasts and could trigger cultural change. Increased
global communication may cause shifts in cultural values (e.g. Collectivism to
Individualism). China, for example, has undergone major economic and social
transformation. Here a movement away from traditional collectivistic values is evident in
modernity and individualistic values portrayed in current Chinese advertising (Zhang &
Shavitt, 2003). On an individual level, acculturation results in, “the multidimensionality of

192
cultural selves” (Hong et al., 2007, p.329). That is, multiple cultural identities that coexist
in any given individual without adverse psychological consequences. With prolonged
contact, individuals may develop adjustment repertoires that facilitate internalisation of
new cultural identities. Such changes could help overcome cultural difficulties encountered
in multicultural workplaces, due to cultural differences. Hence, the effects of psychological
acculturation should be considered in research and practical applications of cross-cultural
assessment.
One such effect is linguistic assimilation. It entails a movement from a subordinate
ethnolinguistic group (i.e. Sinhala, Afrikaans) to a dominant ethnolinguistic group
(English). Such language shifts may also result in cultural value shifts (Van der Merwe,
Ashley, Charton, & Huber, 1974). Future research should routinely explore the effects of
bilingual responses in cross-cultural assessment. For example, Muller, Hausmann, and
Straatmann (2008) recently explored the effects of bilingual responses on the MI of a job
satisfaction measure (n=11500 from 10 countries). The results revealed substantial
commonalities in the degree of cross-cultural MI for both groups (native English
respondents versus bilinguals’ responses to the English measure). Adopting such a research
design allows for the testing of specific response characteristics of bilinguals or other
sources of measurement equivalence, independent of translation ambiguities. The results of
such studies should be used to decide whether translation equivalent versions of the
instrument are needed for unbiased testing in a multilingual environment.
In the final part of this investigation an exploratory investigation of latent mean differences
on the EI facets included in the SUEIT, was conducted. No previous research of this nature
could guide hypotheses in this regard. It was argued that the most prominent cultural
dimension characteristics of a respective cultural group (e.g. Collectivism) would find
expression in prominent differences in EI facets (e.g. emotional expression) in order to
conform with cultural norms of emotionally intelligent behavior for that group (i.e.
primarily Western versus non-Western). Almost none of the predictions were supported by
empirical results. It should be noted that the partial invariance models should be considered
as weak models of the measured construct. This is because in most cases only two items

193
were retained upon which latent mean differences could be estimated. The use of two items
(to measure one latent trait) could be considered as a severe construct under representation
and for practical purposes would not be deemed suitable to measure a psychological
construct appropriately. Thus, although this procedure allowed for a preliminary
exploratory look at the latent mean differences between the cultural groups, replication is
needed.
4.7 Limitations and suggestions for future research
Several limitations of this study should be noted. This study aimed to investigate whether
Hofstede’s cultural framework could be used to systematically account for the pattern of
transportability of the SUEIT to other Western and non-Western cultures. Generally, a
Western / non-Western pattern in transportability emerged in most of the results. Finer
distinctions between Western and non-Western cultures, as evidenced by the Cultural
Distance (Kogut & Singh, 1988) calculation and CDR pattern, was not confirmed. There
was also a lack of consistency over the results. That is, different patterns of transportability
emerged for the configural and metric invariance results. None of these confirmed either of
the CDR patterns (tables 4 and 5) calculated for this study. The method bias results
provided evidence that a common method artifact may have obscured the invariance results
of the South African data, affecting the resultant transportability pattern. This being said, it
makes sense to discuss the limitations inherent to, firstly, the nature of the Hofstede cultural
dimensions and, secondly, with the use of cultural dimensions in the construction of a CD
index, as was utilised in this study. Then several methodological limitations of this study
will be addressed. Suggestions for future research are incorporated into the discussion
where applicable.
Hofstede’s framework of cultural dimensions has been very prominent and its impact
widespread. Some have argued that it has continuing authority in various disciplines;
including international business research (Chandy & Williams, 1994) as well as psychology
(Oyserman, Coon, & Kemmelmeier, 2005; Triandis, 1994). At the time (1980s), Culture’s
Consequences promoted sensitivity to cultural diversity in the workplace and beyond
(Ailon, 2008), illustrating that national culture could not be disregarded in an increasingly

194
global environment. Since its inception, criticism has been severe (e.g. Kitayama, 2002;
Schooler, 1983; Singh, 1990). Ongoing points of criticism relate to the internal validity of
the dimensions, as well as how they were constructed (Kogut & Singh, 1988). Hofstede
(2001) himself notes most common sources of criticism and his response to them in the
latest edition of Cultures Consequences (Hofstede, 2001). These range from issues related
to using nations as units for culture, the questionable number of dimensions and out-
datedness of the data. However, more recently Blodgett, Bakir and Rose (2008) argued that
the conceptual appeal of the framework tends to blind researchers to the fact that little
empirical scrutiny of the psychometric properties of the Values Survey Model instrument
has been noted. This echoes McSweeney’s (2002) view that ongoing absolute acceptance of
the framework suggests a far too loose standard of ‘acceptable evidence’ (i.e. empirical
research evidence) in some management disciplines. For example, Kagitcibasi (1994) has
reported low reliabilities of the dimensions. Little congruency between Hofstede’s and
Schwartz’s49
(1994) cultural frameworks has been found (Ng, Lee, & Soutar, 2007). In
addition, a very recent study (Blodgett et al., 2008) found that a majority of the items in
Hofstede’s cultural instrument did not exhibit face validity. Moreover, the reliabilities of
the four dimensions were low (i.e. Individualism / Collectivism, α=0.66; Masculinity /
Femininity, α=0.65; Uncertainty Avoidance, α=0.35; Power Distance, α=0.30) and no
evidence for the four factor structure emerged. The authors caution against using the
cultural framework at an individual unit of analysis level. National culture indices utilise a
high level of aggregation, which could hide important variations in individual differences
and experiences (Laroche, Kalamas, & Cleveland, 2005). Ailon (2008), however, recently
argued that another more fundamental challenge related to using Hofstede’s indices is
embedded in the cultural relativism50
constituting the essence of the writing of Culture’s
Consequences. He provides a thought provoking analysis, ‘mirroring’ the work against
itself in terms of its own proposed value dimensions (Power Distance, Individualism etc.),
49
Schwartz (1994) identified ten individual-level value dimensions from data spanning 41 cultural groups in
38 (later 64) nations. His approach spans both individual and national levels of analyses. There are conceptual
similarities with Hofstede’s dimensions (Hofstede, 2001) although Schwartz (1994) has argued that his
dimensions are more grounded in the literature and empirically validated. 50
Ailon (2008) holds that Hofstede’s commitment to cultural relativism developed and tightened throughout
his career as evidenced by, amongst others, his understanding of the Western bias inherent in his work in the
late 1980s (Hofstede & Bond, 1988; Hofstede 1991), and assertions of the cultural boundedness of 1990s
American and European management writings (Hofstede 1994, 1996)

195
to answer the question: in what ways, and to what effect is the book itself bounded by the
cultural milieu from which it sprung? His analysis illustrates how the text (similar to other
mainstream organisational texts) constructs the social reality in ways that attribute lesser
value to various others. He concludes that (Ailon, 2008, p.900),
“It is a problem of power – of a tendency to see the world in a way that is not only limited by one’s
own culture but also limiting in terms of its effect on other cultures. Apparently, the cultural bias is not
politically random. Theorising this bias should take into account the fact that it is characterised by the
tendency to suppress foreign cultures - to subject them to categories of analysis that make them familiar in
ways that privilege ‘our’ own…when their findings are applied by practitioners, they run the risk of creating a
vicious cycle in which organisational members are required to define their indigenous culture in terms that are
external and foreign to it and, moreover, that essentialise its inferiority. The devaluing / overvaluing
mechanisms may thus be continually reproduced. Striving to influence, and in fact influencing actual work
lives, writers should be especially watchful of the political subtext of their research reports – of their
‘science’”.
What is the implication of this for future cross-cultural EI research? Future research should
seek to replicate the current study with other cultural frameworks. Two such frameworks,
generally understood as further developments of Hofstede’s work, exist: the work of
Schwartz (1994) and the GLOBE (House et al., 2004) study (briefly mentioned in chapter 2
of this dissertation). Replications of similar trends in latent mean differences (as was found
in this study) on EI facets may inform on such universal cultural differences. To guard
against the cultural boundedness of further EI research, the ‘integrated epistemology’ for
conducting research on EI in the workplace, suggested by Emmerling (2008), should be
followed. Emmerling (2008) argues that the zeitgeist of current EI research may be limiting
our ability to produce research insights that inform practice related to developing EI in
diverse cultures. He calls for (Emmerling, 2008, p.81), “…the current desire to generalise
theory and practice be tempered with a desire to establish the validity and utility of specific
EI-based theories within specific cultures and organisations.”
In addition to the criticism of the Hofstede framework, the concept of cultural distance
(derived from the Hofstede indices) that was utilised in this study has also been under
scrutiny for various conceptual and methodological reasons (discussed in section 4.2). Most
pronounced, and of particular interest to this study, is that it has been argued that

196
Hofstede’s dimensions fail to capture the complexities of national culture (e.g. Shenkar,
2001). In addition, the robustness of the Kogut and Singh (1988) method for constructing a
CD index has also been scrutinised. Failure to interpret the results of this study in terms of
the CDR patterns may thus be a consequence of the aggregated nature of the national
cultural dimensions as reflected in the CD index. In addition, for Sri Lanka and the South
African non-White data no Hofstede county scores were available. For Sri Lanka, an
aggregated score derived from other countries in the Southern Asian cluster were used.
However, there may be substantial differences between such ‘close’ countries (Harzing,
2003). Hence, the results of this study should be interpreted within the boundaries of this
limitation of the CD construct. Future research should seek to replicate the current study
with other cultural frameworks mentioned previously.
A last point of criticism against the use of Hofstede indices, relates to what Hofstede
termed the ‘ecological fallacy’ (Hofstede, 2001). Originally coined by Robinson (1950), it
points towards the fact that it is often inadequate to generalise a relationship which was
found on an aggregate level to the individual level. That is, national level data of cultural
frameworks are used to predict individual or organisational behaviour despite no guarantee
that an individual or organisation will act in the way his/her national culture dictates (Kim
& Gray, 2008). This is also a limitation of the current study.
Numerous methodological limitations of this study can be identified. Firstly, convenience
sampling was used. This has led to an overrepresentation of affluent countries in the final
dataset. This is often the case in cross-cultural research (Van de Vijver & Leung, 1997).
Future research should strive to include data from countries from a wider range of cultural
clusters (e.g. Europe – Latin, Nordic, Eastern; Latin America, Asia). To address research
questions related to the equivalence (e.g. linguistic etc.) of the SUEIT in South Africa, data
from at least the four biggest linguistic / ethnic groups (e.g. Xhosa, Zulu, Sepedi &
Afrikaans) should be included in subsequent studies. Secondly, although the samples were
matched in terms of age and gender, they cannot be considered representative of the
populations of the countries included in this study. This limits the generalisability of the
results. Thirdly, small samples in SEM research may result in unstable results. This is
197
especially true when the measurement model is relatively complex (Hair et al, 2006) – as
was the case in this study. However, opinions regarding minimum sample sizes for SEM
research have varied (MacCallum, 2003; MacCallum, Widaman, Preacher, & Hong).
Future research on the SUEIT should ensure to employ ‘bigger’ sample sizes judged on
factors like model complexity and measurement model characteristics (see Hair et al., 2006
for a list of factors).
Cross validation of modified models (i.e. partial invariance research, as is the case with the
DIF analyses) is rarely done in practice, although repeatedly stressed in the literature
(Steenkamp & Baumgartner, 1998). A fourth limitation of this study is that the samples
were not big enough to re-estimate the various models in a validation sample (split sample).
Future research should incorporate such cross-validation procedures. Lastly, another
potential problem associated with the practice of testing for partial invariance, is related to
the selection of the reference indicator in the model. One item is selected as a referent
indicator to assign a metric to the latent variable. If however, an ‘offending’ item (i.e. the
item was calibrated to the underlying true score differently in one or more groups) is
unknowingly selected, poor fit may be an artifact of the standardisation of the latent
variable to difference metrics and not due to ‘real’ differences in the models (Chan, 2000;
Vandenberg & Lance, 2000). However, no clear solution for problem exists. Chan (2000)
recommends the testing of results with different choices in reference indicators, to see
whether the results differ substantially.
4.8 Conclusion
The aim of this research was to investigate the generalisability and transportability of the
self-report EI measure, the SUEIT (Palmer & Stough, 2001) over various cross-national
samples. Various hypotheses regarding construct, method and item bias were investigated.
Overall it would seem that the transportability of the instrument is not severely affected
when used in other Western cultures. Sufficient evidence was obtained that the EI
construct, as operationalised by the SUEIT, is generalisable to the Western countries
included in this study. No significant latent mean differences on the various EI facets, when
these countries were compared to Australia, were found. Evidence was found for cultural

198
bias when the instrument was applied to respondents from several non-Western cultures.
For these cultural groups the transportability of the instrument seems to be adversely
affected. There was not sufficient evidence to suggest that larger cultural distances with
Australia, would necessary result in larger adverse effects. It may be necessary to adapt the
instrument for adequate use in some of the non-Western cultural groups.

199
CHAPTER 5
Final discussion and conclusions
5.1 Introduction
Measurement has always been, and continues to be, a pivotal issue in I/O psychology
research. Numerous journals are fully, or partially devoted to measurement issues (e.g.
Applied Psychological Measurement, Journal of Applied Psychology, Multivariate
Behavioural Research, Organizational Research Methods, Structural Equation Modelling).
Developments in the evaluation of measurement quality, which extend beyond tradition
classical test theory, are in part due to recent advances in analytic tools (Vandenberg &
Lance, 2000). On a methodological level, this dissertation aimed to highlight the
importance of conducting invariance research, specifically at this fairly early stage in the
existence of the EI construct. It illustrated how SEM multi-group CFA procedures could be
utilised, within a cross-cultural research paradigm to explicate cultural bias from true
construct variance. The issue of instrument invariance is often overlooked (Steenkamp &
Baumgartner, 1998) although the implications may be severe or even fatal1 (e.g. research
results are misleading, Steenkamp & Baumgartner, 1998; weakens the conclusions of a
study, Horn, 1991). The lack of invariance studies is attributed to various factors, e.g. lack
of agreed-upon terminology, methodological complexities, and few clear guidelines for
adequate invariance (Lubke & Muthen, 2004; Steenkamp & Baumgartner, 1998;
Vandenberg & Lance, 2000). A recent narrowing towards a uniform understanding of, and
approach to invariance research is evident, based on the efforts of many researchers (e.g
Byrne & Watkins, 2003; Cheung & Rensvold, 2000; Mavondo, Gabbott, & Tsarenko,
2003; Steenkamp & Baumgartner, 1998; Vandenberg & Lance, 2000; Vandenberg, 2002)
even though many disparities still exist. Hence, some may not agree with the analytic
approach followed here although it is in accordance with acceptable standards that have
been used previously (described in the MI review by Vandenberg & Lance, 2000, and
Chan’s, 2000, article). On a pragmatic level true meaningful (cultural) group comparisons
1 For an example discussion of misleading results due to an absence of invariance evidence, refer to
Steenkamp and Baumgartner (1998, p. 88).

200
regarding the nature of the EI construct would not be permissible in the absence of
invariance evidence. This may impede our understanding of the true nature of the construct
in different groups, as well as conclusions regarding how this group difference may affect
organisational functioning.
As a first step in the advancement of cross-cultural EI research, this study aimed to
illustrate the need to differentiate cultural bias from true construct variance in a self-report
mixed model measure of EI. This is important in cross-cultural EI research in general. It
also has practical implications when such measures are utilised in the increasingly
multicultural workplace. The equivalence of measurement operations of transported
measures should routinely be inspected before mean differences on the latent trait may be
meaningfully compared across groups. EI has been described as, “highly influential and
important in occupational settings, a construct that may even hold the promise of a
predictor with reduced adverse impact” (Zeidner et al., 2004, p. 394). EI has been found
predictive of real life criteria (Van Rooy & Viswesvaren, 2004) and is increasingly being
used in the workplace as a predictor (Van Rooy et al., 2005). If equivalence assumptions
remain untested, the practical utility of EI as a valid predictor when utilised over different
cultural groups, may be questionable. An absence of metric equivalence, for example,
requires within group norms to avoid adverse impact in personnel selection decisions.
Whether such norms are available and being used is an issue beyond the scope of this
dissertation. What should be noted is an increased awareness of issues regarding global
norming (i.e. the challenge of international norms). For example, a recent special issue of
the International Journal of Testing (volume 8, nr. 4) was completely devoted to aspects
related to the international norming of personality measures. Most of the concerns
addressed are also directly applicable to EI measurement. For example, applicability of
norms should not be assumed, but actively be demonstrated. In the case where a respondent
is from a different cultural group than the normative sample, person-fit statistics (see e.g.
Emons, Sijtsma, & Meijer, 2005) may be used to empirically establish the applicability of
norms.

201
5.2 Theoretical and practical implications
The main contributions of this study are of a theoretical and practical nature. The evidence
for cultural bias that was found raises questions regarding the practical implications of
exporting the SUEIT from its Western origin to the other non-Western cultures included in
this study. Test transportability is an important issue in psychological measurement as
foreign developed tests are used in most countries more frequently that nationally
developed tests (e.g. Oakland, 2004). The multicultural nature of populations has, in the last
decade, become more prominent in many countries (Van De Vijver, & Rothmann, 2004).
This implies that in the global workplace the cultural heterogeneity in assessment continues
to increase, because of the composition of the applicant pool (Van de Vijver, 2008).
Equitable and fair test usage requires a keen focus on cross-cultural applicability of tests
(Paterson & Uys, 2005). Validity transfer (construct or predictive) should actively be
demonstrated.
On a practical level cross-cultural EI assessment practices should be uniformly applied –
especially when research is being conducted. As illustrated in this study, a respondent’s test
language proficiency may influence test results in the form of method bias and confound
MI (equivalence) results. Individuals with less verbal skill (e.g. bilinguals) may have
difficulty reading negatively keyed items, accurately, particularly those items with double
negatives. A possible strategy to combat this problem is that mother tongue testing should
be considered. This implies that translation equivalent versions of instruments should be
used. This applies to the cross-national application of a given instrument. It also applies to
using the instrument on subgroups or subpopulations (e.g. language groups) within a given
country (e.g. different language groups in South Africa).
It is well known that test translation poses its own problems. For example, it may not
always be possible to preserve trans-linguistic and trans-cultural meaning of items, e.g. see
Daouk, Rust, & McDowell). Constructs may have different meanings across cultures. It
may also be that items may sound stronger or weaker in the target language. This could
result in a shift in the relationship between raw scores and latent trait level (Bartram, 2008).

202
Hence, the accuracy of translations should be judged in terms of linguistic and
psychological equivalence. The former implies the mapping of linguistic word and sentence
meaning. The latter entails the mapping of the psychological meaning of the item. For
example, does the item serve the same psychological function in all languages? To this
end, Harkness and Van de Vijver (2009) have recently identified four equivalence
perspectives that good test translation / adaptation should combine. These include
construct- (i.e. similarity in source and target culture), cultural- (similarity in norms about
interaction / modes of address), linguistic- (translation accuracy, i.e. the retention of
denotation and connotation of item wording), and measurement equivalence (similarity of
factors measure by the test and comparability of scores). Ensuring a high combination of all
of these constitutes good translation / adaptation practice. Due attention should also be
given to the International Test Commission’s (ITC) guidelines for test translation and
adaptation (Hambleton, 2001; Van de Vijver & Hambleton, 1996). More specifically,
guidelines in the ‘context and test development’ categories should routinely be applied
when different language versions of instruments are developed. The context category
describes issues regarding construct equivalence in the language and cultural groups of
interest. For example, guideline C1 (“Effects of cultural differences which are not relevant
or important to the main purposes of the study should be minimised to the extent possible”)
taps into the basic principle of avoiding construct, method and item bias (Van de Vijver &
Hambleton, 1996). Guidelines in the test development category cover issues like providing
evidence that language use in items are appropriate for all cultural and language
populations (D2), that test adaptation takes full account of linguistic and cultural
differences among populations (D1), and that test developers / publishers should provide
evidence of the equivalence (e.g. item equivalence, guideline D6) of different language
versions (guidelines D5, D7, D9 etc.).
Prominent EI assessments are increasingly being translated. Recently it has been reported
(Caruso, 2008) that the MSCEIT, for example, has already been, or is currently being
translated into 17 languages. Twenty two different language translations of the Bar-On EQ-
i (1997) exist (Bar-On, 2000) and 18 language translations of the TAS-20 (Parker et al.,

203
2003) have been used in cross-cultural assessment. Little is known about the translation /
adaptation processes for these different versions of prominent EI measures. The ITC
guidelines specifically require that documentation of changes (when tests are translated or
adapted) should be provided2. Providing this information to potential test users is a standard
ethical requirement to be met. However, a wealth of information on cultural, linguistic, and
socioeconomic differences between the original, mostly Western cultural contexts, and
target (mostly non-Western) cultural contexts, where adaptation has been conducted, has
probably been accumulated for these tests. Consolidating this information would provide
valuable information for the future cross-cultural adaptation / translation of EI inventories.
It could also provide a unique opportunity to better understand the conceptualisations of EI
from within the cultural group to which the translation was conducted. For example, Caruso
(2008) recently provided an overview of interesting issues that were encountered when the
MSCEIT was being adapted and translated for use in Japan. In the Facilitation task of the
Using Emotions branch of the MSCEIT model, cultural differences were evident in a item
that referred to using of different moods that assist in “planning a fun birthday party at
home”. Japanese are not accustomed to having parties at their homes, and the item was
therefore adapted to suit their cultural customs. Adaptations to stories (i.e. hypothetical
situations involving a personal emotional situation) contained in the Emotional
Management Task was also necessary to contextualise the items within Japanese culture.
A further unique challenge EI researchers and test developers should be cognisant of when
cross-cultural adaptation is being conducted, is the specific role of language in emotion.
Psychological reality is interpreted within a cultural context – according to a relativistic
perspective. In this cultural or social construction, language fulfils a central role. We
interpret our environment within the frames of reference that are formed by language.
Emotions are encoded in language. For example, lexical theorists (e.g. Lutz & Abu-
Lughod, 1990) argue that the essence of emotion lies in the ways that people label their
subjective experiences. Hence, the meaning of emotion words would be particularly
2 Guideline I1 state that (Hambleton, 2001, p.169), “When a test is adapted for use in another population,
documentation of the changes should be provided, along with evidence of equivalence”.
204
sensitive to the impact of culture on emotion. Wierzbicka (1986, p. 584) have persistently
argued against the notion of universal emotions, “neatly identified by means of English
words….Polish, for example, does not have a word corresponding exactly to the English
word disgust”. Other examples include that in Tahitian language there are 46 words for
anger (Levy, 1973) and no word for sadness. There is no word for depression in Xhosa
(South Africa), Chewong (Malaysia), Yoroba (Nigeria), Mandarin (Russell, 1991). Cheng
(1977) report that no exact translation in Chinese for anxiety could be found. A word for
guilt is missing from the Sri Lanka Sinhala language (Obeyesekere, 1981). Many more
examples exist. Culture also seems to dictate whether emotions are ‘hyper-cognised’
(reflected in many lexical labels) or ‘hypo-cognised’ (reflected in few lexical labels).
Meaning differences in emotion terms, differences in lexical variations, or absence of
equivalent emotion concepts will generate bias and inequivalence when Western tests are
translated / adapted for non-Western cultures. Therefore, any cross-cultural EI assessment
instrument should be developed / adapted with a thorough understanding of cross-cultural
similarities and differences in emotion terms. To this end, a recent international project on
the identification of the emotion lexicon (i.e. the prototypicality, frequency and clearness of
emotion words) and emotional referents of emotion words (on the basis of the componential
emotion theory3) in different cultural and language groups could be very useful.
Researchers at the Swiss Centre of Affective Studies have been working with a
multidisciplinary group of emotion researchers from different cultures on the componential
GRID research program (see e.g. Fontaine, Scherer, Roesch, Ellsworth, 2007). A local
South African project is also underway in the eleven national languages. One of the goals
of the program is that extensive component profiles for emotion terms in the studied
cultural groups would be documented. This would improve the precision and efficiency of
the intercultural translation of emotion words. Utilising the outcomes of this research
program (it is hoped that a consolidated dictionary of emotion terms in different cultural
3 According to this theory, emotions are not conceptualised as states but as dynamic multicomponential
processes that are triggered by specific situational antecedents. To study an emotion, then, is to study the
situational antecedents and the synchronised activity it elicits in each of the emotion components. These
include the appraisal, action tendency, subjective feelings, expression, and regulation components (Scherer,
1984).

205
and languages groups would be produced) could be invaluable in the cross-cultural
translation / adaptation of current EI measures. It will also benefit the development of new
EI measures.
In this study method bias was also investigated for theoretical and practical purposes. There
is a large body of research which suggests that national differences in response styles (i.e.
culturally driven response styles) exist. Demonstrating that a measure is free of ERS and
ARS eliminates alternative explanations for observed cross-cultural differences. Such
response styles may lead to invalid inferences in cross-cultural research (Van Herk et al.,
2004) if left undetected. The results of this study were limited in replicating previous
research on response styles (i.e. theoretical contribution). The ERS and ARS results did
allow for ruling out (to a certain extent) these sources of method bias. Hence, more
confidence could be placed in the subsequent method bias results (language proficiency).
On a practical level EI researchers should be cognisant of culturally driven response styles
and that it should routinely be inspected in future cross-cultural EI research. Hanges and
Dickson (2004) propose correcting for response bias by ipsatising scores within each
individual.
This study also examined DIF of SUEIT items over various cultural groups. In chapter
three propositions regarding differences in national value dimensions and implications for
DIF was proposed. It was argued that where a larger cultural distance with Australia exists
more item bias would be detected. Overall, the pattern of results confirmed this notion. DIF
analyses, however, indicate differential functioning, but cannot explain the cause of that
difference. Studies that predict DIF is scarce. Only one other study has used Hofstede
cultural dimensions to predict the presence of DIF in a global employee opinion survey
(Ryan et al., 2000). Only seven items in one subscale (supervision) of the instrument were
investigated. That is because studies of this kind can be quite laborious since item by item
analyses are conducted to examine DIF. Similar to this study, the authors did find evidence
of higher rates of DIF among countries which are more culturally dissimilar. The authors
conclude that (Ryan et al., 2000, p.554), “…one can anticipate DIF in survey development

206
by examining item content in light of cross-cultural theories. We do not think that one can a
priori determine and eliminate all DIF that will occur. However, we do believe that
awareness of cultural differences can be heightened by the use of such data in corporate
surveying.” The current study was a first step in that direction for cross-cultural EI
assessments that are being used for global corporate assessment purposes.
The results of this study also concur with the results of Ryan et al., (2000) which detected
DIF, assumed to not be ‘true DIF’ ascribed to cultural influences. For example, in this
study 10 SUEIT items were identified for which item bias were theoretically predicted
(table 3, chapter 3). The results showed that 4 (of the 10) items showed DIF in three or
more cultural groups. Item 19 “I find it easy to control my anger at work” displayed both
uniform and non-uniform DIF in three of the four non-Western samples. Uniform DIF in
three samples (Italy, South African non-White and Sri Lanka) and non-uniform DIF in
South-African non-White and Sri Lanka was evident for Item 7, “I find it hard to convey
my anxiety to colleagues”. It is interesting to note that these two items contain the words
‘anxiety’ and ‘anger’. It may well be that elements of Power Distance (South African non-
White) or Collectivism (Sri Lanka) could have ‘caused’ this DIF. This cannot be verified
by the results of this study. There is no way to establish for certain if the detected DIF is
due to cultural differences or other factors. For example, 2 other items (of the original 10),
item 2 (“I generate positive moods and emotions within myself to get over being frustrated
at work”) and 64 (“When a colleague upsets me at work, I think through what the person
has said and find a solution to the problem”) attained non-uniform DIF in three or more of
the non-Western samples. Both these items are lengthy and complex. Moreover, upon
inspection of all the DIF results, it was evident that another lengthy item (item 56, “I can
tell when a colleague feels the same way as myself about another colleague without
actually discussing it”) also produced uniform DIF in three non-Western samples. Evidence
of non-uniform DIF for this item was also found in two of these samples (Italy and South
Africa non-White). According to Budgell et al., (1995) DIF may be influenced by
numerous factors, one of which is item complexity. This underscores the previous
conclusion – DIF may be caused by various factors. Another example is found in item 54

207
(“I can easily snap out of feeling down at work”). This item showed non-uniform DIF in all
four non-Western samples. Evidence for uniform DIF in three of the non-Western samples
(i.e. Italy, South African non-White and Sri Lanka) also emerged. It may be that the
phrasing, ‘snap out of’ in this item could be a nuisance factor which represents typical
English Western jargon, more easily understood by Western than non-Western respondents.
The results do, however, raise awareness of susceptibility of items that contain emotion
words (such as items 19 and 7) that might have different meaning connotations over
different cultural groups. It also points toward other item characteristics (e.g. ambiguities in
interpretation, low familiarity / appropriateness of item content; Van de Vijver & Tanzer,
2004) that may influence DIF. Such characteristics should also be taken into account in EI
test development / adaptation. For example, in future cross-cultural adaptations of the
SUEIT item complexity should be reduced. Lengthy items (e.g. 2, 56 and 64) should be
shortened. In addition, when items that contain specific emotion words (e.g. anger, anxiety)
are translated, care should be taken that correct translations are used.
Lastly, this dissertation contributed to our understanding of whether cultures differ in
various emotional intelligence facets. The limitations of the partial invariance models upon
which the latent mean differences were estimated, impede the practical implications of the
results. Future research should aim to replicate the current results. It may well be that the EI
construct and its facets is more salient in Western, affluent countries. Van de Vijver and
Poortinga (2002), for example, observed this trend with the postmaterialism scale
(emphasising self-expression and quality of life) in the World Values Survey 1990 – 1991
of Inglehart (1997). This construct (postmaterialism) was easier to measure and more
relevant in affluent countries. Future cross-cultural EI research may provide an answer to
the question if a similar trend could be noted for the EI construct.
5.3 Future research
What can be done to deal with bias? To deal with construct bias, a strategy of cultural
decentering (Werner & Campbell, 1970) can be used. This implies removing cultural
particulars and restricting the instrument to universal aspects found across the cultures.

208
Another strategy is to examine cross-cultural differences in the nomological network of EI.
It could point to the presence of construct bias in the Western current conceptualisation of
the construct, which limits its generalisability potential to non-Western cultures. A
convergence approach as specified by Campbell (1986) may also be applied. That is,
independent within-culture developments of instruments, with subsequent cross-cultural
administration of all instruments, are conducted.
The development of EI inventories in Asia and Africa (convergence approach), independent
of Western influences, might add valuable knowledge to the current Western
conceptualisation of the construct. The development of such indigenous scales may uncover
other aspects of emotional intelligent behaviours which are cultural specific, and have
strong predictive validity within that culture (or even other cultures). It is proposed that the
development of such inventories should be completely void of Western influence so as to
allow for true cultural conceptualisations of the construct to be captured. For example, even
though The Emotional Intelligence Scale (WLEIS) was developed in Hong Kong by Wong
and Law (2002) it may still not capture the full conceptualisation of EI in this culture. This
is because the scale was developed by asking students to generate items for the four Mayer
and Salovey (1997) EI dimensions. It may be argued that this imposed a Western,
ethnocentric definition of the construct into the scale development process. Although a
recent replication in the Beijing and Shandong provinces in mainland China found support
for the four factor structure of the WLEIS (Wang, 2007), it does not necessarily preclude
the existence of other dimensions of EI in this culture (not included in this scale).
Sibia, Srivastava, and Misra (2003) recently developed an Indian indigenous model of EI.
The model has four dimensions which makes explicit the fact that EI is embedded in a
traditional, religious and philosophical context. Rooted in a strong collectivistic value
orientation, it acknowledges the role of family and society in the shaping of emotions. For
example, the first dimension social sensitivity, encompass all aspects of relating to others.
That is, showing respect and engaging in pro-social activities (e.g. helping, cooperating,
empathizing), expressing and experiencing affection (including understanding other’s

209
emotions and connect with them), as well as building social support for oneself by
influencing others and appropriately express and control of negative emotions (e.g. anger,
unhappiness, intolerance). The second dimension, pro-social values, focuses on enhancing
group welfare through values like patience, affect, kindness and endurance. Action
tendencies, the third dimension, describe competencies such as persistence, dedication, and
discipline which facilitates task performance. Lastly, affective states, refers to quality of
emotional life and how emotional states like happiness, being optimistic and content,
facilitate one’s life course (Srivastava et al., 2008). In a follow-up study Sibia, Srivastava
and Misra (2005) elaborated this model further by integrating Mayer and Salovey’s (1997)
model (the four dimensions of identification, assimilation, understanding, and management
of emotions) and the above mentioned four dimensions of their indigenous EI model. The
test is available in both Hindi and English and retest reliability was reported as 0.75 for the
English, and 0.79 for the Hindi versions, respectively.
As argued previously, in our search for cultural universal and specific facets of the
construct, an cross-validation study of both a Western (e.g. Palmer et al, 2008 taxonomy)
and non-Western (Srivastava et al., 2008) taxonomy of EI on both Western and non-
Western cultural groups, should be conducted. Such a study may be the starting point in
providing answers to questions like whether a Western EI taxonomy is suitable for
identifying the structure of EI in non-Western groups, and if the same structure of EI is
found in non-Western and Western groups when indigenous and Western taxonomies are
cross-validated?
Future cross-cultural EI research should also be aimed at the quantification of bias and
equivalence. Suspected biasing factors should be measured (Van de Vijver & Leung, 2000).
By including a measure of social desirability or language proficiency (i.e. mastery of the
test language) together with the EI measure in the design of a study, the presence or
absence of a particular type of bias may be confirmed / rejected. The measurement of
contextual factors (i.e. including explanatory variables) may also assist in verifying (or
rejecting) particular interpretations of cross-cultural differences. Such better designed

210
cross-cultural studies, would assist in limiting post-hoc speculative unvalidated
interpretations, often found in exploratory cross-cultural studies. A monotrait-multimethod
research design could also be used to empirically examine bias (Van de Vijver & Leung,
2000).
Another distinction that should be accounted for in future research is the differentiation
between collectivist cultures and collectivist individual orientations. It is entirely possible
for individuals, or groups of individuals in a culture with traditionally collectivist norms, to
score low on collectivism (i.e. high on individualism). For example, McAuliffe, Jetten,
Hornsy and Hogg (2003) report evidence across two experimental studies which support
the notion of attenuation of the preference for collectivist over individualist group member
behaviour, when group norms prescribe individualism. That is, individualist group member
behaviour is promoted and collectivist group member behaviour reduced, when the group
norm represents individualism. In the current study, for example, the Sri-Lanka data was
collected in a single multinational company in Sri-Lanka (all the other datasets were
collected in multiple organisations). It may therefore be that the company culture (e.g.
individualistic norms) could be attenuating the influence of the national Sri-Lanka
collectivistic cultural value dimensions on individual behaviour, in this company. Future
studies should aim to incorporate multiple samples from different organisations to control
for this possible influence. In addition, future cross-cultural EI studies that are conducted in
multinational companies should measure company culture norms. Ryan et al., (2000,
p.557), for example, note that, “...within a global company there will be variability in the
extent to which local culture norms override or clash with company culture norms”. The
separation between national culture (e.g. Hofstede dimensions) and company culture may
well be subject to acculatarisation forces as globalisation is on the increase. This should be
an important consideration when cross-cultural EI research is conducted within the global
workplace.

211
5.4 Conclusion
This dissertation aimed to investigate the EI construct from a cross-cultural perspective.
The central research question was: to what extent do Hofstede (1980, 2001) cultural
dimensions systematically influence the cross-cultural transportability of a self report EI
measure? The results seem to suggest that cultural dimensions could be an important factor
that should be accounted for in the global assessment of EI. Cultural distance of the host
country (e.g. Sri Lanka) with the origin of the SUEIT (i.e. Australia) did influence the
validity transfer of the instrument. Evidence of method and item bias did emerge as
potential threats to the transportability of the instrument.
The current status of EI research on conceptualisation, assessment, and applications of the
construct, continues to be debated (e.g. Keele & Bell, 2008; Zeidner, Roberts, & Matthews,
2008). Chapter two of this dissertation provided a review of published cross-cultural
applications of prominent EI measures. Without a doubt, the factorial validity of these
measures remains a key issue to be addressed. In 2008, Zeidner et al., (2008, p.69) noted
that, “research is sorely needed to test for factorial invariance of current measures of EI
across sociocultural groups”. It is hoped that this dissertation has provided a starting point
of addressing this need. It may well be that cultural bias is a much more prevalent issue in
EI measurement, than generally thought. In addition, Zeidner et al., (2008) note that no
published DIF EI research study currently exist. This dissertation addressed this gap in EI
research. In conclusion, this dissertation illustrate that research which differentiates cultural
bias from true construct variance in self report EI measures, may help address the
assessment issues that currently surround the construct and hinder its practical utility.

212
REFERENCES
Abrahams, F., & Mauer, K.F. (1999b). Qualitative and statistical impacts of home language
on responses to the items of the Sixteen Personality Factor Questionnaire (16PF) in
South Africa. South African Journal of Psychology, 29, 76-86.
Ailon, G. (2008). Mirror, mirror on the wall: Culture’s Consequences in a value test of its
own design. Academy of Management Review, 33(4), 885-904.
Antonakis, J. (2004). On why “Emotional Intelligence” will not predict leadership
effectiveness beyond IQ or the “Big Five”: an extension and rejoinder.
Organizational Analysis, 12(2), 171-182.
Arvey, R. D., Renz, G. L., & Watson, T. W. (1998). Emotionality and job performance:
implications for personnel selection. In G. R. Ferris (Ed.), Research in personnel
and human resources management (Vol. 16, pp. 103-147). Stanford, CR: JAI Press
Ashkanasy, N. M., Hartel, C. E. J., & Zerbe, W. J. (Eds.). (2000). Emotions in the
workplace: research theory, and practice. Westport, CT: Quorum Books.
Ashkansky, N. M., Härtel, C. E. J. & Daus, C. S. (2002). Diversity and Emotion: the new
frontiers in organizational behaviour research. Journal of Management, 28 (3), 307-
338.
Austin, E. J., Evans, P., Goldwater, R., & Potter, V. (2005). A preliminary study of
emotional intelligence, empathy and exam performance in first year medical
students. Personality and Individual Differences, 39, 1395-1405.
Austin, E. J., Saklofske, D., Huang, S. H. S., McKenney, D. (2004). Measurement of trait
emotional intelligence: testing and cross-validating a modified version of Schutte et
al.’s (1998) measure. Personality and Individual Differences, 36, 555-562.

213
Averill, J. R. (1982). Anger and Aggression: an essay on emotion. New York: Springer-
Verlag.
Bagby, R. M., Parker, J. D. & Taylor, G. J. (1994). The twenty item Toronto Alexithymia
Scale – I. Item selection and cross-validation of the factor structure. Journal of
Psychosomatic Research, 38, 23-32.
Bagby, R. M., Taylor, G. J., & Parker, J. D. (1994). The twenty item Toronto Alexithymia
Scale – II. Convergent, discriminant, and concurrent validity. Journal of
Psychosomatic Research, 38, 33-40.
Bagozzi, R. P. (2003). Positive and Negative Emotions in Organisations. In K. S. Cameron,
J. E. Dutton & R. E.Quinn (Eds.), Positive Organisational Scholarship: foundations
of a new discipline, (pp. 176-193). San Francisco: Berrett-Koehler Publishers, Inc.
Bandalos, D. (2002). The effects of item parceling on goodness-of-fit and parameter
estimate bias in structural equation modeling. Structural Equation Modeling, 9(1),
78-102.
Bandalos, D. L., & Finney, S. J. (2001). Item parceling issues in structural equation
modeling. In G. A. Marcoulides & R. E. Schumacker (Eds.), Advanced structural
equation modeling: New developments and techniques. New York: Lawrence
Erlbaum Associates, Inc.
Bandalos, D. L., Geske, J. A. & Finney, S. J. (2001). A model of statistics performance
based on achievement goal theory. Journal of Educational Psychology, 95(3), 604-
616.
Bar-On, R (1998). The development of an operational concept of psychological well-being.
Unpublished doctoral dissertation, Rhodes University, South Africa.

214
Bar-On, R. & Parker, J. (2000). The Handbook of Emotional Intelligence: theory,
development, assessment, and application at home, school and in the workplace.
San Francisco: Josssey-Bass.
Bar-On, R. (1997). BarOn Emotional Quotient Inventory (EQ-i): Technical Manual.
Toronto, Canada: Multi-Health Systems.
Bar-On, R. (2000). Emotional and social intelligence: Insights from the Emotional Quotient
Inventory. In R. Bar-On & J. D. A. Parker (Eds.), The handbook of emotional
intelligence (pp. 363-388). San Francisco: Jossey-Bass.
Bar-On, R. (2002). BarOn Emotional Quotient Inventory: Short (EQ-i: S): Technical
manual. Canada: Multi-Health Systems Inc.
Bar-On, R., & Parker, J. D. A. (2000). The Bar-On EQ-i: YV: technical manual. Toronto
Canada: Multi-Health Systems.
Bar-On, R., Brown, J.M., Kirkcaldy, B.D., & Thome, E.P. (2000). Emotional expression
and implications for occupational stress; an application of the Emotional Quotient
Inventory (EQ-i). Personality and Individual Differences, 28, 1107-1118.
Bar-On, R., Tranel, D. Denburg, N. L. & Bechara,
A. (2003). Exploring the neurological
substrate of emotional and social intelligence. Brain, 126(8), 1790-1800.
Barrett, L. F. & Gross, J. J. (2001). Emotional Intelligence: a process model of emotion
resprentation and regulation. In T. J. Mayne & G. A. Bananno (Eds.), Emotions:
current issues and future directions, (pp. 286-310). New York: Guilford Press.
Bartram, D. (2004). Assessment in organisations. Applied Psychology: An International
Review, 53 (2), 237-259.
215
Batista-Foguet, J. M., Boyatzis, R. E., Guillen, L., & Serlavos, R. (2008). Assessing
Emotional Intelligence competencies in two global contexts. In R. J. Emmerling, V.
K. Shanwal, & M. K. Mandal (eds.), Emotional Intelligence: theoretical and cultural
perspectives (pp.98 - 114). New York: Nova Science Publishers, Inc.
Bentler, P. M. (1980). Multivariate analysis with latent variables: causal modeling. Annual
Review of Psychology, 31, 419-456
Bentler, P. M. (1990). Comparative fit indexes in structural models. Psychological Bulletin,
107, 238–246.
Bentler, P. M., & Chou, C. (1987). Practical issues in structural modeling. Sociological
Methods and Research, 16(1), 78-118.
Bentler, P.M. & Bonett, D.G. 1980. Significance tests and goodness of fit in the analysis of
covariance structures. Psychological Bulletin, 88(3), 588 - 606.
Berry, J. W. (1969). On cross-cultural comparability. International Journal of Psychology,
4, 119-128.
Berry, J. W. (1980). Ecological analyses for cross-cultural psychology. In N Warren (Ed.),
Studies in cross-cultural psychology (vol. II, p.157-189). London: Academic Press.
Berry, J. W. (1994). An ecological perspective on cultural and ethnic psychology. In E. J.
Trickett, R. J. Watts, & D. Birman (Eds.), Human diversity: Perspectives on people
in context (pp.115-141). San Francisco, CA: Jossey-Bass.
Berry, J. W., Poortinga, Y. H., Segall, M. H., & Dasan, P. R. (2002). Cross-cultural
psychology: Research and applications (2nd ed.). Cambridge: Cambridge University
Press.

216
Besharat, M. A. (2007). Psychometric properties of Farsi version of the Emotional
Intelligence Scale-41 (FEIS-41). Personality and Individual Differences, 43, 991-
1000.
Blodgett, J. G., Bakir, A., & Rose, G. M. (2008). A test of the validity of Hofstede’s
cultural framework. Journal of Consumer Marketing, 25 (6), 339 – 349.
Bochner, S., & Hesketh, B. (1994). Power distance, individualism / collectivism, and job-
related attitudes in a culturally diverse work group. Journal of Cross-Cultural
Perspectives, 25, 233-257.
Bollen, K.A. and Long, J.S. (1993). Testing structural equation models. Newbury Park:
Sage Publications.
Bonaccio, S., & Reeve, C. L. (2006). Differentiation of cognitive abilities as function of
neuroticism level: A measurement equivalence / invariance analysis. Intelligence,
34(4), 403-417.
Bond, M. H., & Yang, R. (1982). Ethnic affirmation versus cross-cultural accommodation.
Journal of Cross-Cultural Psychology, 13, 169-185.
Boski, P. (1996). Cross-cultural psychology at the crossroads or: Lake Victoria is not Lake
Mwanza, while cross-cultural psychology is not cultural (enough). Paper presented
at the Twelfth International Congress of the International Association for Cross-
Cultural Psychology, Pamplona-Iruna, Navarra, Spain.
Brody, N. (2004). What cognitive intelligence is and what emotional intelligence is not.
Psychological Inquiry, 15(3), 234-238.
Brown, M. W., & Cudeck, R. (1989). Single sample cross-validation indices for covariance
structures. Multivariate Behavioral Research, 24, 445-455.

217
Brown, M. W., & Cudeck, R. (1993). Alternative ways of assessing model fit. In K. A.
Bollen & J. S. Long (Eds.), Testing structural equation models. Newbury Park: Sage
Publications.
Budgell, G. R., Raju, N. S., & Quartetti, D. A. (1995). Analysis of differential item
functioning in translated assessment instruments. Applied Psychological
Measurement, 19(4), 309-321.
Butcher, J. N., Cheung, F. M., Lim, J. (2003). Use of the MMPI-2 with Asian populations.
Psychological Assessment, 15 (3), 248-256.
Byrne, B & Watkins, D. (2003). The Issue of Measurement Invariance Revisited. Journal of
Cross-Cultural Psychology, 34(2), 155-175.
Byrne, B. M., Shavelson, R. J., & Muthen, B. (1989). Testing for the equivalence of factor
covariance and mean structures: The issue of partial measurement invariance.
Psychological Bulletin, 105(3), 456-466.
Campbell, D. T. (1986). Science’s social system of validity-enhancing collective believe
changes and the problems of the social sciences. In D. W. Fiske & R. A. Shweder
(Eds.), Metatheory in social science (pp.108-135). Chicago: University of Chicago
Press.
Carmeli, A., & Josman, Z. E. (2006). The relationship among emotional intelligence, task
performance and organizational citizenship behaviors. Human Performance, 19(4),
403-419.
Caruso, D. R. (2008). Emotions and the Ability Model of Emotional Intelligence. In R. J.
Emmerling, V. K. Shanwal, & M. K. Mandal (eds.), Emotional Intelligence:
theoretical and cultural perspectives (pp.1-16). New York: Nova Science Publishers,
Inc.

218
Casillas, A., & Robbins, S. B. (2005). Testing and cross-cultural assessment from a
business perspective: issues and recommendations. International Journal of Testing,
5(1), 5-21.
Cattel, R. B. (1978). The Scientific Use of Factor Analysis. New York: Plenum Press.
Chan, D. (2000). Detection of differential item functioning on the Kirton Adaption-
Innovation Inventory using multiple group mean and covariance structure analyses.
Multivariate behavioral research, 35(2), pp.169-199.
Chan, D. W. (2004). Perceived emotional intelligence and self efficacy among Chinese
secondary school teachers in Hong Kong. Personality and Individual Differences,
36, 1781-1795.
Chandy, P. R. & Williams, T. G. E. (1994). The impact of journals and authors on
international business. Journal of International Business Studies, 25, 715-728.
Chapman, B. P. & Hayslip, B. (2005). Incremental validity of a measure of emotional
intelligence. Journal of Personality Assessment, 85(2), 154-169.
Cheng, T. (1977). A phenomenological study of emotional experience: A search for
cultural differences and similarities in the construction of emotion by a Hong Kong
Chinese sample. Unpublished master’s thesis, University of Hong Kong.
Cherniss, C., Extein, M., Goleman, D., & Weissberg, R. P. (2006). Emotional Intelligence:
what does the research really indicate? Educational Psychologist, 41(4), 239-248.
Cheung, F. M. (1996). The assessment of psychopathology in Chinese societies. In M. H.
Bond (Ed.), The handbook of Chinese psychology (pp.393-411). Hong Kong:
Oxford University Press.

219
Cheung, F. M., Cheung, S. F., Wada, S., & Zhang, J. (2003). Indigenous measures of
personality assessment in Asian countries: A review. Psychological Assessment, 15,
280-289.
Cheung, G. W., & Rensvold, R. B. (2000). Assessing extreme and acquiescence response
sets in cross-cultural research using structural equations modeling. Journal of Cross-
Cultural Psychology, 31 (2), 187-212.
Cheung, G. W., & Rensvold, R. B. (2002). Evaluating goodness-of-fit indexes for testing
measurement invariance. Structural Equation Modeling, 9(2), 233-255.
Church, A. T. (2001). Personality measurement in cross-cultural perspective. Journal of
Personality, 69(9), 989-1006.
Ciarrochi, J. V., Chan, A. Y. C. & Caputi, P. (2000). A critical evaluation of the emotional
intelligence construct. Personality and Individual Differences, 28, 539-561.
Ciarrochi, J., Dean, F. P., & Anderson, S. (2002). Emotional intelligence moderates the
relationship between stress and mental health. Personality and Individual
Differences, 32, 197–209.
Claassen, N. C. W., Krynauw, A. H., Holtzhausen, H., & Wa Ga Mathe, M. (2001). A
standardisation of the WAIS-III for English-speaking South Africans. Pretoria:
Human Sciences Research Council.
Cleary, T. A. (1968). Test bias: prediction of grades of negro and white students in
integrated colleges. Journal of Educational Measurement, 5, 115-124.
Cohen, C., & Gunz, A. (2002). As seen by the other…: Perspectives on the self in the
memories and emotional perceptions of Easterners and Westerners. Psychological
Science, 13, 55-59.

220
Cohen, D., & Nisbett, R. E. (1994). Self-protection and the culture of honor: explaining
southern violence. Personality and Social Psychology Bulletin, 20(5), 551-567.
Cohen, J. (1988). Statistical power analysis for the behavioral sciences. New York:
Academic Press.
Crockett, L. J., Shen, Y., Randall, B. A., Russell, S. T., & Driscoll, A. K. (2005).
Measurement equivalence of the center for epidemiological studies depression scale
for latino and anglo adolescents: A national study. Journal of Consulting and
Clinical Psychology, 73(1), 47-58.
Cronbach, L. J. (1950). Further evidence on response sets and test design. Educational and
Psychological Measurement, 10, 3-31.
Culhane, S. E., Morera, O. P., & Watson, P. J. (2006). The assessment of factorial
invariance in need for cognition using Hispanic and Anglo samples. The Journal of
Psychology, 140(1), 53-67.r
, 8, 3-4.tural Psychology Bulletin, 8, 3-4.
Cutright, P. (1968). Occupational inheritance: a cross-national analysis. American
Sociological Review, 73, 400-416.
D’Andrade, R. G. (1984). Cultural meaning systems. In R. A. Shweder & R. A. Le Vine
(Eds.), Cultural theory: Essays on mind, self, and emotion (pp.88-119). New York:
Cambridge University Press.
Daouk, L., Rust, J. & McDowall, A. (2005). Navigating the test maze with confidence.
Selection and Development Review, 21(4), 11–13
Darwin, C. (1965). The expression of the emotions in man and animals. New York: Oxford
University Press (original work published in 1872).

221
Daus, C. S., & Ashkanasy, N. M. (2003). Will the real emotional intelligence please stand
up? On deconstructing the emotional intelligence ‘debate’. The Industrial and
Organizational Psychologist, 41(2): 69-72.
Davies, M., Stankov, L. & Roberts, R. D. (1998). Emotional Intelligence: In Search of an
Elusive Construct. Journal of Personality and Social Psychology, 75 (4), pp. 989-
1015.
Dawda, D., & Hart, S. D. (2000). Assessing emotional intelligence: Reliability and validity
of the Bar-On Emotional Quotient Inventory (EQ-i) in university students.
Personality and Individual Differences, 28, 797-812.
De Beuckelear, A., Lievens, F., & Swinnen, G. (2007). Measurement equivalence in the
conduct of a global organizational survey across countries in six cultural regions.
Journal of Occupational and Organizational Psychology, 80, 575 – 600.
De Frias, M. C., & Dixon, R. A. (2005). Confirmatory factor structure and measurement
invariance of the memory compensation questionnaire. Psychological Assessment,
17(2), 168-178.
Diamantopoulos, A. & Sigauw, J. A. (2000). Introducing LISREL: A guide for the
uninitiated. London : SAGE Publications.
Diener, E. (1999). Introduction to the special section on the structure of emotion. Journal of
Personality and Social Psychology, 76, 803-804.
Dimitriades, Z. S. (2007). Managing emotionally intelligence service workers: personal and
positional effects in the Greek context. Journal of European Industrial Training,
31(3), 223-240.

222
Downey, L. A., Godfrey, J., Hansen, K., & Stough, C. (2006). The impact of social
desirability and expectation of feedback on emotional intelligence in the workplace.
E-Journal of Applied Psychology, 2(2), 12-18.
Durvasula, S., Andrews, J. C., Lysonski, S. & Netemeyer, R. G. (1993). Assessing the
Cross-national applicability of consumer behaviour models: a model of attitude
toward advertising in general. Journal of Consumer Research, 19, 626-636.
Ekman, P. (1972). Universals and cultural differences in facial expressions of emotion. In J.
Cole (Ed.), Nebraska symposium on motivation, 1971 (pp. 207–283). Lincoln:
University of Nebraska Press.
Ekman, P., & Friesen, W. (1975). Unmasking the human face: a guide to recognizing
emotions from facial expressions. Engelwood Cliffs, NJ: Prentice-Hall.
Ekman, P., & Friesen, W. V. (1969). The repertoire of nonverbal behavior: categories,
origins, usage, and coding. Semiotica, 1, 49-98.
Ekman, P., & Friesen, W. V. (1971). Constants across cultures in the face and emotions.
Journal of Personality and Social Psychology, 17, 124-129.
Elfbein, H. A., & Ambady, N. (2002). On the universality and cultural specificity of
emotion recognition: a meta-analysis. Psychological Bulletin, 128 (2), 203-235.
Ellsworth, P. (1994). Sense, culture and sensibility. In S. Kitayama & H. R. Markus (Eds.),
Emotion and Culture (pp.23-50). Washington, DC: American Psychological
Association.
Emmerling, R. J. (2008). Towards an applied science of Emotional Intelligence in the
global workplace: Key issues and challenges. In R. J. Emmerling, V. K. Shanwal, &
223
M. K. Mandal (eds.), Emotional Intelligence: theoretical and cultural perspectives
(pp.17-38). New York: Nova Science Publishers, Inc.
Emons, W.H.M., Sijtsma, K., & Meijer, R.R. (2005). Global, local and graphical person fit
analysis using person response functions. Psychological Methods, 10(1), 101-119.
Enders, C. K., & Bandalos, D. L., (2001). The relative performance of full maximum
likelihood estimation for missing data in structural equation modeling. Structural
Equation Modeling, 8(3), 430-457.
Erni, T., Lötscher, K., & Modestin, J. (1997). Two-factor solution of the 20 - Item Toronto
Alexithymia Scale confirmed. Psychopathology, 30, 335–340.
Extremera, N., & Fernández-Berrocal, P. (2005). Perceived emotional intelligence and life
satisfaction: predictive and incremental validity using the Trait Meta-Mood Scale.
Personality and Individual Differences, 39, 937-948.
Fact sheet 17- New Zealanders in Australia. (n.d.). Retrieved August 12, 2008, from
http://www.immi.gov.au/media/fact-sheets/17nz.htm
Fernandez-Berrocal, P., Extremera, N., & Ramos, N. (2004). Validity and reliability of the
Spanish modified version of the Trait Meta-Mood Scale. Psychological Reports, 94,
751-755.
Fiske, A. P., Kitayama, S., Markus, H. R., & Nisbett, R. E. (1998). The cultural mix of
social psychology. In D. T. Gilbert, S. T. Fiske, & G. Lindzey (Eds.), The handbook
of social psychology (4th
ed., Vol. 2, pp. 915-981). Boston: McGraww-Hill.
Fontaine, J. R. J. (2005). Equivalence. In K. Kempf-Leonard (Ed.), Encyclopedia of Social
Measurement, (Vol. 1, pp. 803-813). San Diego: Academic Press.

224
Fontaine, J. R. J. (2008). Traditional and multilevel approaches in Cross-Cultural Research:
an integration of methodological frameworks. In F. J. R. van de Vijver, D. A. van
Hemert, & Y. H. Poortinga. Multilevel Analysis of Individuals and Cultures. New
York: Lawrence Erlbaum Associates.
Fontaine, J. R., Scherer, K. R., Roesch, E. B., Ellsworth, P. (2007). The world of emotion
is not two-dimensional. Psychological Science, 18(2), 1050–1057.
Foxcroft, C. D. (1997). Psychological testing in South Africa: Perspective regarding ethical
and fair practices. European Journal of Psychological Assessment, 13, 229-235.
Foxcroft, C. D., & Aston, S. (2006). Critically examining language bias in the South
African adaptation of the WAIS-III. SA Journal of Industrial Psychology, 32(4), 97-
102.
Fredrickson, B. L. (2003). Positive Emotions and Upward Spirals in Organisations. In K. S.
Cameron, J. E. Dutton & R. E.Quinn (Eds.), Positive Organisational Scholarship:
foundations of a new discipline, (pp. 163-175). San Francisco: Berrett-Koehler
Publishers, Inc.
Freudenthaler, H. H., Fink, A., & Neubauer, A. C. (2005). Emotional abilities and cortical
activation during emotional information processing. Personality and Individual
Differences, 41, 685-695.
Friesen, W. V. (1972). Cultural difference in facial expression in a social situation: An
experimental test of the concept of display rules. Unpublished doctoral dissertation,
University of California, San Francisco.
Gangopadhyay, M., & Mandal, M. K. (2008). Emotional Intelligence – a universal or a
culture-specific construct? In R. J. Emmerling, V. K. Shanwal, & M. K. Mandal

225
(eds.), Emotional Intelligence: theoretical and cultural perspectives (pp.115-134).
New York: Nova Science Publishers, Inc.
Gardner, H. (1983). Frames of Mind: The theory of multiple intelligences. New York:
Basic Books.
Gardner, L. & Stough, C. (2002). Examining the relationship between leadership and
emotional intelligence in senior level managers. Leadership and Organization
Development Journal, 23 (2), pp.68-78.
Gawryluk, J. R., & McGlone, J. (2007). Does the concept of emotional intelligence
contribute to our understanding of temporal lobe resections? Epilepsy & Behavior,
11(3), 421-426.
Ghorbani, N., Davison, H. K., Bing, M. N., Watson, P. J. & Mack, D. A. (2002). Self-
reported Emotional Intelligence: construct similarity and functional dissimilarity of
higher-order processing in Iran and the United States. International Journal of
Psychology, 37 (5), 297-308.
Gibbs, N. (1995). The EQ factor. TIME magazine, 2 October 1995.
Gignac, G. E., Palmer, B. R., Monacha, R., & Stough, C. (2005). An examination of he
factor structure of the Schutte self-report emotional intelligence (SSREI) scale via
confirmatory factor analysis. Personality and Individual difference, 39, 1029-1042.
Gignac, G. E. (2005). Determining the dimensionality of a self-report emotional
intelligence inventory (SUEIT) and testing its unique factorial validity. Unpublished
doctoral dissertation. Melbourne: Swinburne University of Technology.
Gignac, G. E. (2005). Evaluating the MSCEIT V2.0 via CFA: Corrections to Mayer et al.,
2003. Emotion, 5, 232-235.

226
Gignac, G. E. (2006). Self-reported emotional intelligence and life satisfaction: testing
incremental predictive validity hypotheses via structural equation modeling (SEM)
in a small sample. Personality and Individual Differences, 40, 1569-1577.
Gignac, G. E., Palmer, B. R., & Stough, C. (2007). A Confirmatory Factor Analytic
Investigation of the TAS-20: Corroboration of a Five-Factor Model and Suggestions
for Improvement. Journal of Personality Assessment, 89(3), 247-257.
Gohm, C. L. (2004). Moving forward with Emotional Intelligence. Psychological Inquiry,
15(3), 222-227.
Goleman, D. (1995). Emotional Intelligence: why it can matter more than IQ. New York:
Bantam books.
Goleman, D. (1998). Working with emotional intelligence. NewYork: Bantam Books.
Gomez, R., & Fisher, J. W. (2005). The spiritual well-being questionnaire: Testing for
model applicability, measurement and structural equivalencies, and latent mean
differences across gender. Personality and Individual Differences, 39, 1383-1393.
Government Gazette. (1998). Republic of South Africa, 400 (19370). Cape Town, 19
October, 1998.
Greenfield, P. M. (1997). Culture as process: Empirical methods for cultural psychology. In
J. W. Berry, Y. H. Poortinga & J. Pandey (Eds.), Handbook of cross-cultural
psychology: Theory and methods (2nd ed., Vol. 1, pp. 301-346). Needham Heights:
Allyn & Bacon.
Greenfield, P. M., (1997). You can’t take it with you: Why ability assessments don’t cross
cultures. American Psychologist, 52, 1115-1124.
227
Gross, J. (1999). Emotion regulation: past, present and future. Cognition and Emotion, 13,
551-573.
Grubb, H. J. & Ollendick, T. H. (1986). Cultural-distance perspective: An exploratory
analysis of its effect on learning and intelligence. International Journal of
Intercultural Relations, 10 (4), 399 – 414.
Grubb, W. L. & McDaniel, M. A. (2007). The fakability of Bar-On’s Emotional Quotient
inventory Short Form: Catch Me if You Can. Human Performance, 20 (1), 43-59.
Guidelines for the Validation and Use of Assessment Procedures for the Workplace.
(2005). Pretoria: Society for Industrial & Organisational Psychology of South
Africa.
Gupta, V. & Hanges, P. J. (2004). Regional and climate clustering of societal cultures. In R.
J. House, P. J. Hanges., M. Javidan, P. W. Dorfman, & V. Gupta (Eds.), Culture,
leadership, and organizations: the GLOBE study of 62 societies. California: SAGE
Publications
Gupta, V., Hanges, P. J., & Dorfman, P. (2002). Cultural clusters: Methodology and
findings. Journal of World Business, 37, 11-15.
Hagvat, K. A., & Nasser, F. M. (2004). How well do item parcels represent conceptually
defined latent constructs? A two facet approach. Structural Equation Modeling,
11(2), 168-193.
Hair, J. F., Black, B., Babin, B., Anderson, R. E., & Tatham, R. L. (2006). Multivariate
Data Analysis (6th
edition). USA: Prentice Hall.

228
Hambleton, R. K. (1994). Guidelines for adapting education and psychological tests: a
progress report. European Journal of Psychological Assessment, 10, 229-244.
Hambleton, R. K. (2001). The Next Generation of the ITC Test Translation and Adaptation
Guidelines. European Journal of Psychological Assessment, 17(3), 164-172.
Hamilton, D. L. (1968). Personality attributes associated with extreme response style.
Psychological Bulletin, 69, 192-203.
Hanges, P. J., & Dickson, M. W. (2004). The development and validation of the GLOBE
Culture and Leadership scales. In R. J. House, P. J., Hanges, M. Javidan, P. W.
Dorfman, & V. Gupta, (Eds.). Culture, leadership, and organizations: the GLOBE
study of 62 societies (pp.122-145). California: SAGE Publications
Harkness, J. A., & Van de Vijver, F. J. R. (2009). Workshop on Design and Methods in
Cross-Cultural Assessment. Unpublished workshop notes, Tilburg University.
Harzing, A. W. K. (2003). The role of culture in entry mode studies: From negligence to
myopia? Advances in International Management, 15, 75-127.
Hassan, K., & Sadar, M. (2005). Adapting and Validating the BarOn EQ-i: YV in the
Lebanese Context. International Journal of Testing, 5(3), 301-317.
Hedlund, J. & Sternberg, R. J. (2000). Too Many Intelligences? Integrating social,
emotional and practical intelligence. In R Bar-On & J. D. A. Parker (Eds.),
Handbook of emotional intelligence, (pp. 136-167). San Francisco: Jossey-Bass.
Herkenhoff, L. (2004). Culturally tuned emotional intelligence: an effective change
management tool? Strategic Change, 13(2), 73-81.

229
Hinkle, J. S. (1994). Practitioners and cross cultural assessment: a practical guide to
information and training. Measurement and Evaluation in Counseling and
Development, 27(2), 748-756.
Hofstede, G & Bond. M. H. (1988). The Confucius connection: From cultural roots to
economic growth. Organizational Dynamics, 16 (4), 4-21.
Hofstede, G. (1980). Culture’s Consequences: international differences in work-related
values. Beverly Hills, CA: Sage Publications.
Hofstede, G. (1983). The Cultural Relativity of Organisational Practices and Theories.
Journal of International Business Studies, 75 – 92.
Hofstede, G. (1984). Culture’s consequences: international difference in work-related
values. Beverly Hills, CA: Sage.
Hofstede, G. (1991). Cultures and Organisations: Software of the mind. England:
McGraww-Hill.
Hofstede, G. (1994). Management scientists are human. Management Science, 40, 4-13.
Hofstede, G. (1996). An American in Paris: The influence of nationality on organization
theories. Organization Studies, 17, 525-537.
Hofstede, G. (1997). Cultural constraints in management theories. In R. P. Vecchio (Ed.),
Leadership: Understanding the dynamics of power and influence in organizations
(pp. 465-483). Notre Dame, IN: University of Notre Dame Press.
Hofstede, G. (2001). Culture’s Consequences: comparing values, behaviours, institutions
and organizations across nations (2nd
edition). California: Sage Publications.
230
Hong, Y-Y., Wan, C., No, S., & Chiu, C. Y. (2007). Multicultural identities. In S.
Kitayama & D Cohen (eds.), Handbook of Cultural Psychology (pp.323-345). New
York: Guilford Press.
Horn, J. L. (1991). Comments on ‘Issues in Factorial Invariance’ in Best Methods for the
Analysis of Change. In L. M. Collins & J. L. Horn (eds.), Best Methods for the
Analysis of Change (pp. 114-125). Washington, DC: American Psychological
Association.
Horn, J. L., & McArdle, J. J. (1992). A practical and theoretical guide to measurement
invariance in aging research. Experimental Aging Research, 18, 117-144.
House, R. J., Hanges., P. J., Javidan, M., Dorfman, P. W., & Gupta, V. (Eds.). (2004)
Culture, leadership, and organizations: the GLOBE study of 62 societies. California:
SAGE Publications
Hoyle, R. H., & Panter, A. T. (1995). Writing about structural equation models. In R. H.
Hoyle (Ed.), Structural equation modeling: Concepts, issues and applications (pp.
158-198). New Delhi: Sage Publications.
Hu, L., & Bentler, P. M. (1999). Covariance structure analysis: conventional criteria versus
new alternatives. Structural Equation Modeling, 6 (1), 1-55.
Huang, Y., Tang, S., Helmeste, D., Shioiri, T., Smoeya, T. (2001). Differential judgment of
static facial expressions of emotions in three cultures. Psychiatry and Clinical
Neurosciences, 55, 479-483.
Hui, C. H., & Triandis, H. C. (1985). Measurement in cross-cultural psychology: A review
and comparison of strategies. Journal of Cross-Cultural Psychology, 16,131-152.

231
Hui, C. H., & Triandis, H. C. (1989). Effects of culture and response format on extreme
response style. Journal of Cross-Cultural Psychology, 20, 296-309.
Inglehart, R. (1997). Modernization and post modernization. Cultural, economic and
political change in 43 societies. Princeton, NJ: Princeton University Press.
Izard, C. E. (1971). The face of emotion. New York: Appleton-Century-Crofts.
Jackson, D. N., & Messick, S. (1958). Content and style in personality assessment,
Psychological Bulletin, 55, 243-252.
Jahoda, G., & Krewer, B. (1997). History of cross-cultural and cultural psychology. In J.
W. Berry, Y. H. Poortinga & J. Pandey (Eds.), Handbook of cross-cultural
psychology: Theory and method (2nd ed., Vol. 1). USA: Allyn & Bacon.
Johnson, T. P., O’Rouke, D., Chavez, N., Sudman, S., Warnecke, R., Lacey, L. (1997).
Social Cognition and responses to survey questions among culturally diverse
populations. In L. Lyberg, P. Biemer, M. Collings, E. de Leeuuw, C. Dippo, N.
Schwarz, & D. Trewin (Eds.), Survey measurement and process quality (pp. 87-
113). New York: John Wiley & Sons.
Johnson, T., Kulesa, P., Cho, Y. I., Shavitt, S. (2005). The relation between culture and
response styles: evidence from 19 countries. Journal of Cross-Cultural Psychology,
36 (2), 264-277.
Jordan, J. P., Ashkanasy, N. M., Hartel, C. E. J. & Hooper, G. S. (2002). Workgroup
emotional intelligence: scale development and relationship to team process
effectiveness and goal focus. Human Resource Management Review, 12(2), 195-
214.
Jöreskog, K. G. (1969). A general approach to confirmatory maximum likelihood factor
analysis. Psychometrika, 34, 183-202.
232
Jöreskog, K. G. (1971). Simultaneous factor analysis in several populations.
Psychometrika, 36, 409-426.
Jöreskog, K. G. (2005). Structural Equation Modeling with Ordinal Variables using
LISREL. Scientific Software International. Retrieved 22 February, 2007, from
http//www.ssicentral.com/lisrel/corner.htm
Jöreskog, K. G., & Sörbom, D. (1981). LISREL V: Analysis of linear structural
relationships by the method of maximum likelihood. Chicago: National Educational
Resources.
Jöreskog, K. G., & Sörbom, D. (1989). LISREL 7: A guide to the program and applications
(2nd ed.). Chicago: Scientific Software International.
Jöreskog, K. G., & Sörbom, D. (1993). LISREL 8: Structural equation modeling with the
simple command language. Chicago: Scientific Software International.
Jöreskog, K. G., & Sörbom, D. (1996). LISREL 8: User's reference guide. Chicago:
Scientific Software International.
Jöreskog, K.G. & Sörbom, D. (2002). LISREL. Chicago: Scientific Software International.
Kagitcibasi, C. (1994). Individualism and Collectivism. In U. Kim., H. Triandis., C
Kagitcibasi, S. C. Choi, and G. Yoon, (eds.), Individualism and Collectivism:
Theory, Method, and Applications. California: Sage.
Kalat, J. W., & Shiota, M. N. (2007). Emotion. California: Thomson Wadsworth.
Keele, S. M. & Bell, R. C. (2008). The factorial validity of emotional intelligence: an
unresolved issue. Personality and Individual Differences, 44, 487-500.

233
Kelloway, E. K. (1998). Using LISREL for Structural Equation Modeling. USA: Sage
Publications.
Kemp, A, Cooper, N, Hermens, G, Gordon, E, Bryant, R, Williams, L. (2005). Toward an
integrated profile of emotional intelligence: introducing a brief measure. Journal of
integrative neuroscience, 4, 41-61.
Kim, Y., & Gray, S. J. (2009). An assessment of alternative empirical measures of cultural
distance: Evidence from the Republic of Korea. Asia Pacific Journal of
Management, 26, 55-74.
Kirton, M. J. (1976). Adaptors and Innovators: A description and a measure. Journal of
Applied Psychology, 61, 622-629.
Kitayama, S (2002). Culture and basic psychological processes – Toward a system view of
culture: Comment on Oyserman et al. (2002). Psychological Bulletin, 128, 89-96.
Kitayama, S. & Markus, H. R. (1994). Emotion and Culture: empirical studies of mutual
influence. Washington, DC: American Psychological Association.
Kogut, B., & Singh, H. (1988). The effect of national cultural on the choice of entry mode.
Journal of International Business Studies, 411-431.
Kuhn, T. S. (1962). The structure of Scientific Revolutions (2nd
ed.). London: The
University of Chicago Press.
Laroche, M., Kalamas, M., & Celveland, M. (2005). ‘I’ versus ‘we’: how individualists and
collectivists use information sources to formulate their service expectation.
International Marketing Review, 22(3), 279-308.
234
Larsen, R. J. (2000). Emotion and personality: introduction to the special section.
Personality and Social Psychology Bulletin, 26, 651-655.
Leong, F. T. L., Okazaki, S., & Tak, J. (2003). Assessment of depression and anxiety in
East Asia. Psychological Assessment, 15 (3), 290-305.
Leu J., Mesquita B., Ellsworth P. C. (2006). Cultural models of emotion regulation in East
and West: “dialectical” emotions vs. the pursuit of pleasantness. Unpublished
Manuscript.
Leung, K., & Zang, J. X. (1995). Systematic considerations: Factors facilitating and
impeding the development of psychology in developing countries. International
Journal of Psychology, 30, 693-706.
Leung, P. W. L., & Wong, M. M. T. (2003). Measures of child and adolescent
psychopathology in Asia. Psychological Assessment, 15 (3), 268-279.
Levy, R. I. (1973). Tahitians. Chicago: University of Chicago Press.
Little, T. D. (1997). Mean and Covariance Structures (MACS) analyses of cross-cultural
data: Practical and theoretical issues. Multivariate behavioral research, 32(1), 53-76.
Little, T. D., Cunningham, W. A., Shahar, G., & Widaman, K. F. (2002). To parcel or not
to parcel: Exploring the question, weighing the merits. Structural Equation
Modeling, 9, 151-173.
Liu, C., Borg, I., & Spector, P. E. (2004). Measurement Equivalence of the German Job
Satisfaction Survey used in a multinational organization: Implications of Schwartz’s
Culture Model. Journal of Applied Psychology, 89 (6), 1070 – 1082.

235
Loas, G., Corcas, M., Stephan, P., Pellet, J., Bizouard, P., Venisse, J.L., Perezdiaz, F.
Guekfi, J. D., Flament, M., Jeammet, P. (2001). Factorial Structure of the 20-item
Toronto Alexithymia Scale. Confirmatory factorial analyses in nonclinical and
clinical samples, Journal of Psychosomatic Research, 50, 255-261.
Loiselle, C. G., & Cossette, S. (2001). Cross-cultural validation of the Toronto Alexithymia
Scale (TAS-20) in US and Peruvian populations. Transcultural Psychiatry, 38, 348-
362.
Lonner, W. J. (1992). Does the Association need a name change? Cross-Cultural
Psychology Bulletin, 26, 1.
Lonner, W. J., & Adamopoulos, J. (1997). Culture as antecedent to behavior. In J. W.
Berry, Y. H. Poortinga & J. Pandey (Eds.), Handbook of cross-cultural psychology:
Theory and method (2nd ed., Vol. 1, pp. 43-83). Needham Heights: Allyn & Bacon.
Lord, R. G., Klimoski, R. J. & Kanfer, R. (2002). Emotions in the workplace:
understanding the structure and role of emotions in organisational behaviour. San
Francisco, CA: Jossey-Bass.
Lubke, G. H., & Muthen, B. O. (2004). Applying multigroup confirmatory factor models
for continuous outcomes to likert scale data complicates meaningful group
comparisons. Structural Equation Modeling, 11(4), 513 - 534.
Luthans, F. & Jensen, S. M. (2001). Positive organisational behaviour: a new approach to
global management. Nanyang Singapore Business Review, 1, 14-25.
Luthans, F. (2002). Positive Organisational Behaviour (POB): Implications for the
Workplace. Academy of Management Executive, 16, 57-76.

236
Lutz, C. A., & Abu-Lughod, L. (Eds.) (1990). Language and the politics of emotion.
Studies in Emotion and Social Interaction. New York: Cambridge University Press
Lyons, J. B., & Schneider, T. R. (2005). The influence of emotional intelligence on
performance. Personality and Individual Differences, 39, 693-703.
MacCallum, R. C. (2003). Working with Imperfect Models. Multivariate Behavioral
Research, 38(1), 113-139.
MacCallum, R. C., Roznowski, M., Mar, C. M., & Reith, J. (1994). Alternative strategies
for cross-validation of covariance structure models. Multivariate Behavioural
Research, 29(1), 1-32.
MacCallum, R. C., Widaman, K. F., Preacher, K. J., & Hong, S. (2001). Sample size in
factor analysis: the role of model error. Multivariate Behavioral Research, 36(4),
611-637.
Marsella, A. J., Dubanoski, J., Hamada, W. C., & Morse, H. (2000). The measurement of
personality across cultures: Historical, conceptual, and methodological issues and
considerations. American Behavioral Scientist, 44(1), 10-31.
Marsh, H. W. (1986). Negative item bias in rating scales for preadolescent children: A
cognitive-development phenomena. Developmental Psychology, 22(1), 37-49.
Marsh, H. W. (1996). Positive and negative global self-esteem: a substantively meaningful
distinction or artifacts? Journal of Personality and Social Psychology, 70 (4), 810-
819.
Marsh, H. W., Balla, J. R., & McDonald, R. P. (1988). Goodness-of-fit indices in
confirmatory factor analysis: The effect of sample size. Psychological Bulletin, 103,
391-410.

237
Marsh, H. W., Hau, K. T., & Wen, Z., (2004). In search of golden rules: comment on
hypothesis testing approaches to setting cutoff values for fit indexes and dangers in
overgeneralizing Hu and Bentler’s (1999) findings. Structural Equation Modeling,
11 (3), 320-341.
Masuda, T., Ellsworth, P.C., Mesquita, B., Leu, J., & Veerdonk, E. (2005). Putting the face
in context: Cultural differences in the perception of emotions from facial behaviour.
Unpublished manuscript, University of Michigan, Ann Arbor.
Matsumoto, D. & Ekman, P. (1988). Japanese and Caucasian Facial Expressions of
Emotion (JACFEE) Slides. Intercultural and Emotion Research Laboratory,
Department of Psychology, State University, San Francisco.
Matsumoto, D. (1989). Cultural influences on the perception of emotion. Journal of Cross-
Cultural Psychology, 20, pp. 92 – 105.
Matsumoto, D. (1990). Cultural similarities and differences in display rules. Motivation and
Emotion, 14, 195-214.
Matsumoto, D. (1993). Ethnic difference in affect intensity, emotion judgments, display
rule attitudes, and self-reported emotional expression in an American sample.
Motivation and Emotion, 17(2), 107-123.
Matsumoto, D. (1996). Unmasking Japan: Myths and realities about the emotions of the
Japanese. Stanford, CA: Stanford University Press.
Matsumoto, D. (2004). The role of Individualism-Collectivism in future cross-cultural
research. Cross-Cultural Psychology Bulletin, 10, 10-18.
Matsumoto, D., & Assar, M. (1992). The effects of language on judgments of universal
facial expressions of emotion. Journal of Nonverbal Behaviour, 16, 85-99.

238
Matsumoto, D., & Ekman, P. (1989). American-Japanese cultural differences in intensity
ratings of facial expressions of emotion. Motivation and Emotion, 13, 143-157.
Matsumoto, D., Consolacion, T., Yamada, H, Suzuki, R., Franklin, B., Paul, S. (2002).
American and Japanese cultural differences in judgments of emotional expressions
of difference intensities. Cognition and Emotion, 16, 721-747.
Matsumoto, D., Weissman, M., Preston, K., Brown, B., & Kupperbuscg, C. (1997).
Context-specific measurement of individualism-collectivism on the individual level:
The IC Interpersonal Assessment Inventory (ICIAI). Journal of Cross-Cultural
Psychology, 28, 743-767.
Matsumoto, D., Yoo, S. H., Hirayama, S., & Petrova, G. (2005). Development and
validation of a measure of display rule knowledge: the display rule assessment
inventory. Emotion, 5, 23-40.
Matthews, G., Roberts, R. D., & Zeidner, M. (2003). Development of Emotional
Intelligence: a skeptical – but not dismissive – perspective. Human Development,
46, 109-114.
Matthews, G., Roberts, R. D., & Zeidner, M. (2004). Seven Myths about Emotional
Intelligence. Psychological Inquiry, 15(3), 179-196.
Matthews, G., Zeidner, M. & Roberts, R. D. (2002). Emotional Intelligence: Science and
Myth. USA: The MIT Press.
Mavondo, F., Gabbott, M. Tsarenko, Y. (2003). Measurement Invariance of marketing
instruments: an implication across countries. Journal of Marketing Management, 19,
523-540.

239
Mayer, J. D., & Salovey, P. (1997). What is emotional intelligence? In P. Salovey & D.
Sluyter (Eds.). Emotional Development and Emotional Intelligence: implications for
educators (pp.3-31). New York: Basic Books.
Mayer, J. D., Caruso, D. R., & Salovey, P. (2000). Emotional Intelligence meets traditional
standards for intelligence. Intelligence, 27 (4), 267-298.
Mayer, J. D., Caruso, D. R., & Salovey, P. (2000). Selecting a measure of Emotional
Intelligence: the case for ability scales. In R. Bar-On & J. D. A. Parker (eds.), The
handbook of emotional intelligence: theory, development, assessment, and
application at home, school and in the workplace (pp. 320-342). San Francisco:
Jossey-Bass.
Mayer, J. D., DiPaolo, M. T., & Salovey, P. (1990). Perceiving affective content in
ambiguous visual stimuli: A component of emotional intelligence. Journal of
Personality Assessment, 54, 772-781.
Mayer, J. D., Salovey, P., & Caruso, D. (2002). Mayer-Salovey-Caruso Emotional
Intelligence Test: User’s manual. Toronto, Ontario, Canada: Multi-Health Systems.
Mayer, J. D., Salovey, P., & Caruso, D. R. (2000). Models of emotional intelligence. In R.
J. Sternberg (Ed.), Handbook of intelligence, (pp. 396-420). New York: Cambridge.
Mayer, J. D., Salovey, P., & Caruso, D. R. (2004). Emotional Intelligence: Theory,
Findings, and Implications. Psychological Inquiry, 15 (3), 197-215.
Mayer, J. D., Salovey, P., Caruso, D. R., & Sitarenios, G. (2001). Emotional intelligence as
a standard intelligence. Emotion, 1, 232-242.
Mayer, J. D., Salovey, P., Caruso, D. R., & Sitarenios, G. (2003). Measuring emotional
intelligence with the MSCEIT V2.0. Emotion, 3, 97-105.

240
Mayer, J. D., Caruso, D., & Salovey, P. (1999). Emotional Intelligence meets traditional
standards for an intelligence. Intelligence, 27, 267-298.
McAuliffe, B., Jetten, J., Hornsey, M. J., & Hogg, M. A. (2003). Individualist and
collectivist norms: when it’s ok to go your way. European Journal of Social
Psychology, 33, 57-70.
McSweeney, B. (2002) Hofstede’s model of national cultural differences and their
consequences: A triumph of faith – A failure of analysis. Human Relations, 55, 89-
118.
Meade, A. W. & Kroustalis, C. M. (2005). Problems with item parceling for confirmatory
factor analysis tests of measurement invariance of factor loadings. Paper presented
at the 20th
annual conference of the Society for Industrial and Organizational
Psychology, Los Angeles, CA.
Meiring, D., Van de Vijver, F., Rothmann, S., & Barrick, M. R. (2005). Construct, item and
method bias of cognitive and personality tests in South Africa. South African
Journal of Industrial Psychology, 31 (1), 1-8.
Mels, G. (2003). A workshop on structural equation modeling with LISREL 8.54 for
Windows. Chicago: Scientific Software International.
Meredith, W. (1993). Measurement invariance, factor analysis and factorial invariance.
Psychometrika, 58, 525-543.
Mesquita, B., & Frijda, N. H. (1992). Cultural variations in emotions: A review.
Psychological Bulletin, 112, 197–204.

241
Mick., D. G. (1996). Are studies of dark side variables confounded by socially desirable
responding? The case of materialism. Journal of Consumer Research, 23(2), 106-
119.
Middleton, K. L., & Jones, J. L. (2000). Socially desirable response sets: The impact of
country culture. Psychology & Marketing, 17(2), 149-163.
Migration to Australia. (n.d.). Retrieved August 12, 2008, from
http://teara.govt.nz/NewZealanders/NewZealandPeoples/KiwisOverseas/4/en
Mikolajczak, M., Luminet, O., Leroy, C., & Roy, E. (2007). Psychometric Properties of the
Trait Emotional Intelligence Questionnaire: factor structure, reliability, construct,
and incremental validity in a French Speaking population. Journal of Personality
Assessment, 88(3), 338-353.
Miller, J. G. (1997). Taking culture into account in social cognitive development.
Psychology and Developing Societies, 9, 9-34.
Miller, J. G. (1997). Theoretical issues in cultural psychology. In J Berry, Y. H. Poortinga,
& J. Pandey (Eds), Handbook of cross-cultural psychology (Vol. 1, 2nd
edition, pp.
85-128). Boston: Allyn & Bacon.
Miller, S. M. (1960). Comparative social mobility. Current Sociology, 95, 1-89.
Millsap, R. E. (1995). Measurement Invariance, Predictive Invariance, and the Duality
Paradox. Multivariate Behavioral Research, 30 (4), 577-605.
Mondillon, L., Niedenthal, P. M., Brauer, M., Rohmann, A., Dalle, N., & Uchida, Y.
(2005). “Cultures” of power and beliefs about power and emotional experience.
Personality and Social Psychology Bulletin, 31, 1112-1122.

242
Mueller, R. O. (1996). Basic principles of structural equation modeling: An introduction to
LISREL and EQS. New York: Springer.
Mulaik, S. A., & Millsap, R. E. (2000). Doing the Four-Step right. Structural Equation
Modeling, 7(1), 36-73.
Mullen, M. (1995). Diagnosing measurement equivalence in cross-national research.
Journal of International Business Studies, 36, 169-179.
Muller, K., Hausmann, N., & Straatmann, T. (2008). The effects of bilingual responses on
the cross-cultural measurement equivalence of job satisfaction measures. Abstracts
of the XIXth International Congress of the International Association for Cross-
Cultural Psychology (p.115), Bremen, Germany.
Munroe, R. L., & Munroe, R. H. (1997). A comparative anthropological perspective. In J.
W. Berry, Y. H. Poortinga & J. Pandey (Eds.), Handbook of cross-cultural
psychology (2nd ed., Vol. 1, pp. 171-213). Needham Heights: Allyn & Bacon.
Muthén, B., & Kaplan, D. (1985). A comparison of some methodologies for the factor
analyses of non-normal Likert variables. British Journal of Mathematical and
Statistical Psychology, 38, 171-189.
Nasser, F., & Takahashi, T. (2003). The effect of using item parcels on ad hoc Goodness-
of-Fit Indices in Confirmatory Factor Analysis: An example using Sarason's
Reactions to tests. Applied Measurement in Education, 16, 75-97.
Ng, S. I., Lee, J. A., & Soutar, G. N. (2007). Are Hofstede’s ad Schwartz’s value
frameworks congruent? International Marketing Review, 24 (2), 164-180.
Nunnaly, J. C. & Bernstein, I. (1994). Psychometric Theory. New York: McGraw-Hill
Series.

243
Oakland, T. (2004). Use of Educational and Psychological Tests Internationally. Applied
Psychology: An International Review, 53 (2), 157-172.
Obeyesekere,G. (1981). Medusa’s hair: As essay on personal symbols and religious
experience. Chicago: University of Chicago Press.
Ogińska-Bulik, N. (2005). Emotional intelligence in the workplace: exploring its effects on
occupational stress and health outcomes in human service workers. International
Journal of Occupational Medicine and Environmental Health, 18(2), 167-175.
Ota, H. (2004). Culture and intergenerational communication: implications for cultures for
communication across age groups. In S.H. Ng, C. Candlin, & C. Y. Chiu (eds.),
Languages matters: Communication, Culture and Social identity (pp. 183-201).
Hong Kong: City University of Hong Kong Press.
Owen, K. (1991). Test bias: The validity of the Junior Aptitude Test for various population
groups in South Africa regarding constructs measured. South African Journal of
Psychology, 21, 112-118.
Oyserman, D., Coon, H., & Kemmelmeier, M. (2002). Rethinking individualism and
collectivism: Evaluation of theoretical assumptions and meta-analyses.
Psychological Bulletin, 128, 3-72.
Palmer, B. & Stough, C. (2001). Workplace SUEIT Interim Technical Manual. Swinburne
University: Swinburne Organizational Psychology Unit.
Palmer, B. R., Gignac, G., Bates, T. & Stough, C. (2003). Examining the Structure of the
Trait-Meta Mood Scale. Australian Journal of Psychology, 55(3), 154-158.

244
Palmer, B. R., Monacha, R., Gignac, G., & Stough, C. (2003). Examining the factor
structure of the Bar-On Emotional Quotient Inventory with an Australian general
population sample. Personality and Individual Differences, 35, 1191-1210.
Palmer, R. B., Gignac, G., Ekermans, G., & Stough, C. (2008). A comprehensive
framework for emotional intelligence. In R. J. Emmerling, V. K. Shanwal, & M. K.
Mandal (eds.), Emotional Intelligence: theoretical and cultural perspectives (pp.17-
38). New York: Nova Science Publishers, Inc.
Palmer. B. R., Gardner, L. & Stough, C. (2003) Measuring Emotional Intelligence In The
Workplace With The Swinburne University Emotional Intelligence Test. Emotional
Intelligence in Organisations. Proceedings of the First International Conference on
Contemporary Management (pp. 91-100), Adelaide, 1 – 2 September, 2003.
Parker, J. D. A. (2000). Emotional intelligence: clinical and therapeutic implications. In R
Bar-On & J. D. A. Parker (Eds.), Handbook of emotional intelligence, (pp. 490-
504). San Francisco, CA: Jossey-Bass.
Parker, J. D. A., Creque, R. E., Barnhart, D. L., Harris, J. I., Majeski, S. A., Wood, L. M.,
Bond, B. J., & Hogan, M. J. (2004). Academic achievement in high school: does
emotional intelligence matter? Personality and Individual Differences, 37, 1321-
1330.
Parker, J. D. A., Saklofske, D. H., Shaughnessy, P. A., Huang, S. H. S., Wood, L. M.,
Eastabrook, J.M. (2005). Generalizability of the emotional intelligence construct: A
cross-cultural study of North American aboriginal youth. Personality and Individual
Differences, 39 (1), 215-227.
Parker, J. D. A., Taylor, G. J., & Bagby, R. M. (2003). The 20-Item Toronto Alexithymia
Scale: III. Reliability and factorial validity in a community population. Journal of
Psychosomatic Research, 55, 269-275.

245
Parker, J. D., Bagby, R. M., Taylor, G. J., Endler, N. S., & Schmitz, P. (1993). Factorial
validity of the 20-item Toronto Alexithymia Scale. European Journal of Personality,
7, 221-232.
Parker, J.D.A., Taylor, G.J., & Bagby, M. (2001). The relationship between emotional
intelligence and alexithymia. Personality and Individual Differences, 30, 107–115.
Paterson, H., & Uys, K. (2005). Critical issues in psychological test use in the South
African workplace. SA Journal of Industrial Psychology, 31 (3), 12-22.
Petrides, K. V. & Furnham, A. (2003). Trait Emotional Intelligence: behavioural validation
in two studies of emotional recognition and reactivity to mood induction. European
Journal of Personality, 17, 39-57.
Petrides, K. V. (2001). A psychometric investigation into the construct of emotional
intelligence. Doctoral dissertation. University College London.
Petrides, K. V., Pérez-González, J. C., & Furnham, A. (2007a). On the criterion and
incremental validity of trait emotional intelligence. Cognition and Emotion, 21 (1),
26-55.
Petrides, K. V., Pita, R., & Kokkinaki, F. (2007b). The location of trait emotional
intelligence in personality factor space. British Journal of Psychology, 98, 273-289.
Petrides, K.V. & Furnham, A. (2000). On the dimensional structure of emotional
intelligence. Personality and Individual Differences, 29, 313-320.
Petrides, K.V. & Furnham, A. (2001). Trait emotional intelligence: Psychometric
investigation with reference to established trait taxonomies. European Journal of
Personality, 15, 425-448.

246
Pietersen, J. J. (2004). User’s Manual for the Statistica Macros: CIB_INT (Construct and
Item Bias for Interval scales items) and CIB_DI (Construct and Item bias for
Dichotomous items). Port Elizabeth, South Africa: Department of Statistics, Nelson
Mandela Metropolitan University.
Pigott, T. D. (2001). A review of methods for missing data. Educational Research &
Evaluation, 7(4), 353-383.
Pittam, J., Gallois, C., Iwawaki, S., & Kroonenberg, P. (1995). Australian and Japanese
concepts of expressive behavior. Journal of Cross-Cultural Psychology, 26, 451-
473.
Poortinga, Y. H. & Van der Vijver, F. J. R. (1987). Explaining cross-cultural differences:
bias analysis and beyond. Journal of Cross-Cultural Psychology, 18, 259-282.
Poortinga, Y. H. (1997). Towards convergence? In J. W. Berry, Y. H. Poortinga & J.
Pandey (Eds.), Handbook of cross-cultural psychology (2nd ed., Vol. 1, pp. 347-
387). Needham Heights: Allyn & Bacon.
Poortinga, Y. H., & Van de Vijver, F. J. R. (1994). IACCP or IACP? Cross-Cultural
Psychology Bulletin, 8, 3-4.
Prince, R. (1987). Alexithymia and verbal psychotherapies in cultural context.
Transcultural Psychiatry Research Review, 24, 107-118.
Queirós, M. M., Fernández-Berrocal, P., Extremera, N. Carral, J. M. C. e Queirós, P. S.
(2005). Validação e fiabilidade da versão portuguesa modificada da Trait Meta-
Mood Scale. Revista de Psicologia, Educação e Cultura, 9, 199-216.
Raghunathan, T. E. (2004). What do we do with missing data? Some options for analysis of
incomplete data. Annual Review of Public Health, 25(1), 99-117.

247
Rahim, M. A., Psenicka, C., Polychroniou, P., Zhao, J., Yu, C., Chan, K. A., Dudana, K. A.
Y., Alves, M. G., Lee, C., Rahman, M. S., Ferdausy, S., & Van Wyk, R. (2002). A
model of emotional intelligence and conflict management strategies: a study in
seven countries. The International Journal of Organizational Analysis, 10(4), 302-
326.
Ralston, D. A., Cunniff, M. K., & Gustafson, D. J. (1995). Cultural Accommodation: the
effect of language on the responses of bilingual Hong Kong managers. Journal of
Cross-Cultural Psychology, 26 (6), 714-727.
Randall, D. M., Huo, Y. P., & Pawelk, P. (1993). Social desirability bias in cross-cultural
ethics research. The International Journal of Organizational Analysis, 1(2), 185-202.
Reise, S. P., Widaman, K. F., & Pugh, R. H. (1993). Confirmatory factor analysis and item
response theory: Two approaches for exploring measurement invariance.
Psychological Bulletin, 114(3), 552-566.
Riordan, C. M., & Vandenberg, R. J. (1994). A central question in cross-cultural research:
Do employees of different cultures interpret work-related measures in an equivalent
manner? Journal of Management, 20, 643-671.
Roberts, R. D., Schulze, R., O’Brien, K., MacCann., Reid, R., & Maul, A. (2006).
Exploring the validity of the Mayer-Salovey-Caruso Emotional Intelligence Test
(MSCEIT) with established emotion measures. Emotion, 6, 663-669.
Roberts, R. D., Zeidner, M., & Matthews, G. (2001). Does emotional intelligence meet
traditional standards for an intelligence? Some new data and conclusions. Emotion,
1, 196-231.
Robinson, W. S. (1950). Ecological correlations and the behavior of individuals. American
Sociological Review, 15, 351-157.

248
Roth, P. L. (1994). Missing data: a conceptual review for applied psychologists. Personnel
Psychology, 47(3), 829-844.
Rozelle, J. E., Pettijohn, C. E. & Parker, R. S. (2002). An empirical evaluation of
Emotional Intelligence: the impact on management development. Journal of
Management Development, 21 (4), 272-289.
Russell, J. A. (1991). Culture and the categorisation of emotions. Psychological Bulletin,
110(3), 426 - 450.
Russell, J. A. (1994). Is there universal recognition of emotions from facial expression? A
review of cross-cultural studies. Psychological Bulletin, 115, 102-141.
Ryan, A. M., Horvath, M., Ployhart, R. E., Schmitt, N. & Slade, L. A. (2000).
Hypothesizing Differential Item Functioning in Global Employee Opinion Surveys.
Personnel Psychology, 53, 531-562.
Saklofske, D. H., Austin, E. J., & Minske. P. S. (2003). Factor structure and validity of a
trait emotional intelligence measure. Personality and Individual Differences, 34,
707-721.
Saklofske, D. H., Austin, E. J., Galloway, J., & Davidson, K. (2007). Individual difference
correlated of health-related behaviours: preliminary evidence for links between
emotional intelligence and coping. Personality and Individual Differences, 42, 491-
502.
Salovey, P. & Mayer, J. D. (1990). Emotional Intelligence. Imagination, Cognition and
Personality, 9, 185-211.
Salovey, P., Mayer, J. D., Goldman, S. L., Turvey, C., & Palfai, T. P. (1995). Emotional
attention, clarity, and repair: Exploring emotional intelligence using the Trait Meta-

249
Mood Scale. In J. W. Pennebaker (Ed.), Emotion, disclosure, and health (pp. 125–
154). Washington, DC: American Psychological Association.
Salovey, P., Stroud, L. R., Woolery, A., & Epel, E. S. (2002). Perceived emotional
intelligence, stress reactivity, and symptom reports: Further explorations using the
Trait Meta-Mood Scale. Psychology and Health, 17, 611-627.
Sartori, N., Salvan, A., Thomaseth, K. (2005). Multiple imputation of missing values in a
cancer mortality analysis with estimated exposure does. Computational statistics &
Data Analysis, 49(3), 937-953.
Satorra, A., Bentler, P. M. (1999). A scale difference chi-square test statistic for moment
structure analysis. (UCLA Statistics Series 260). Los Angeles: University of
California, Department of Psychology.
Satorra, A., & Bentler, P. M. (1988). Scaling corrections for chi-square statistics in
covariance structure analysis. Proceedings of the American Statistical Association,
308-313.
Scherer, K. R. (1984). Approaches to emotion. In K. R. Scherer & P Ekman (Eds.), On the
Nature and Function of Emotion: A Component Process Approach (pp.293–317).
New York: Erlbaum,
Scherer, K. R., & Wallbott, H. G. (1994). Evidence for universality and cultural variation of
differential emotion response patterning. Journal of Personality and Social
Psychology, 66, 310-328.
Scherer, K. R., Banse, R., & Wallbott, H. (2001). Emotion inferences from vocal
expression correlate across languages and cultures. Journal of Cross-Cultural
Psychology, 32, 76-92.

250
Scherer, K. R., Wallbott, H. G., Matsumoto, D., & Kudoh, T. (1988). Emotional experience
in cultural context: a comparison between Europe, Japan, and the United States. In
K. R. Scherer (Ed.), Facets of emotions (pp.5-30). Hillsdale, NJ: Lawrence Erlbaum
Associates, Inc.
Schooler, C. (1983). Book review of Culture’s consequences: International differences in
work-related values. Contemporary Sociology, 12, 167.
Schumacker, R.E. and Lomax, R.G. 1996. A beginner’s guide to structural equation
modeling. Mahaw, New Jersey: Lawrence Erlbaum Associates, Publishers.
Schutte, N. S., Malouff, J. M., Hall, L. E., Haggerty, D. J., Cooper, T.J., Golden, C. J. &
Dornheim, L. (1998). Development and validation of a measure of emotional
intelligence. Personality and Individual Differences, 25, 167-177.
Schutte, N. S., Malouff, J. M., Thorsteinsson, E. B., Bhullar, N. & Rooke, S. E. (2007). A
meta-analytic investigation of the relationship between emotional intelligence and
health. Personality and Individual Differences, 42 (6), 921-933.
Schuttleworth-Edwards, A. B., Kemp, R. D., Rust, A. L., Muirhead, J. G. L., Hartman, N.
P., & Radloff, S. E. (2004). Cross-Cultural effects on IQ test performance: A review
and preliminary normative indications on WAIS-III test performance. Journal of
Clinical and Experimental Neuropsychology, 26 (7), 903-920.
Schwartz, S. H. (1994). Beyond individualism-collectivism: New cultural dimensions of
values. In E. Kim., H. C. Triandis, S-C. Choi, & G. Yoon (eds.), Individualism and
collectivism: theory, methods and applications (pp.85-119). Newbury Park, CA:
Sage.
Segall, M. H., Lonner, W. J., & Berry, J. W. (1998). Cross-cultural psychology as a
scholarly discipline. American Psychologist, 53(10), 1101-1110.

251
Sekaran, U. (1983). Methodological and Theoretical Issues and Advancements in Cross-
Cultural Research. Journal of International Business Studies, 14(2), 61-73.
Sharma, S., Mukherjee, S. S., Kumar, A., & Dillon, W. R. (2005). A Simulation Study to
Investigate the use of cutoff values for assessing model fit in covariance structure
models. Journal of Business Research, 58, 935-943.
Shenkar, O. (2001). Cultural Distance revisited: towards a more rigorous conceptualization
and measurement of cultural differences. Journal of International Business Studies,
32 (3), 519-535.
Shevlin, M., & Adamson, G. (2005). Alternative factor models and factorial invariance of
the ghq-12: A large sample analysis using confirmatory factor analysis.
Psychological Assessment, 17(2), 231-236.
Sibia, A., Misra, G., & Srivastava, A. K. (2003). Emotional Intelligence: Western and
Indian perspectives. Indian Psychological Abstracts and Reviews, 10, 3-42.
Sibia, A., Srivastava, A. K., & Misra, G. (2005). Identification and nurturance of emotional
intelligence in primary school children: An exploration. New Delhi: National
Council of Educational Research and Training.
Singh, J. P. (1990). Managerial culture and work-related values in India. Organization
Studies, 11, 75-101.
Sithole, M. & Hall, S. (2000). Cultural Influence in Global Marketing: A South African
Perspective. Association of Marketing Theory and Practice.
Sithole, M. M. (2001). The impact of demographic heterogeneity on the national cultural of
the Republic of South Africa. Unpublished doctoral thesis. Nova Southeastern

252
University: Wayne Huizenga Graduate Business School of Business and
Entrepreneurship.
Slaski, M. & Cartwright, S. (2002). Health performance and emotional intelligence: an
exploratory study of retail managers. Stress and Health, 18 (2), 63-68.
Smith, P. B. (2004). Acquiescent response bias as an aspect of cultural communication
style. Journal of Cross-Cultural Psychology, 35, 50-61.
Solano-Flores, G., Trumbull, E., & Nelson-Barber, S. (2002). Concurrent Development of
Dual Language Assessments: An Alternative to Translating Tests for Linguistic
Minorities. International Journal of Testing, 2(2), 107-129.
Sörbom, D. (1974). A general method for studying differences in factor means and factor
structure between groups. British Journal of Mathematical and Statistical
Psychology, 27, 221-239.
Sörbom, D. (1982). Structural equation models with structured means. In K. G. Jöreskog &
H. Wold (Eds.), Systems under direct observation (pp. 183-195). New York:
Praeger.
Soto, J. A., Levenson, R. W., & Ebling, R. (2005). Cultures of moderation and expression:
emotional experience, behavior, and physiology in Chinese Americans and Mexican
American. Emotion, 5(2), 154-165.
South African Department of Census and Statistics. (2001). Statistics South Africa, Census
2001. Retrieved 25 March, 2007, from, http://www.statssa.gov.za/default.asp
Srivastava, A. K., Sibia, A., & Misra, G. (2008). Research on Emotional Intelligence: the
Indian experience. In R. J. Emmerling, V. K. Shanwal, & M. K. Mandal (eds.),

253
Emotional Intelligence: theoretical and cultural perspectives (pp.115-134). New
York: Nova Science Publishers, Inc.
Statistics South Africa. (2007). Labour Force Survey (Statistical Release Document
P0210). Retrieved 20 June, 2008, from http://www.statssa.gov.za
Steenkamp, J. E. M., & Baumgartner, H. (1998). Assessing measurement invariance in
cross-national consumer research. Journal of Consumer Research, 25, 78 - 90.
Steiger, J. H. (1990). Structural Model Evaluation and Modification: An Interval
Estimation Approach. Multivariate Behavioural Research, 25, 173-180.
Stough, C., Saklofske, D. H., & Parker, J. D. A. (eds.) (2009). Assessing Emotional
Intelligence: Theory, Research and Applications. New York: Springer.
Sue, S. & Chang, J. (2003). The state of psychological assessment in Asia. Psychological
Assessment, 15 (3), 306-310.
Tabachnick, B. G. & Fidell, L. S. (2001). Using multivariate statistics (4th
edition). USA:
Allyn & Bacon.
Tayeb, M. (1994). Organizations and national culture: Methodology considered.
Organizational Studies, 15,429-446.
Taylor, G. J., Bagby, R. M., & Parker, J. D. (2003). The 20-Item Toronto Alexithymia
Scale VI. Reliability and factorial validity in different languages and cultures.
Journal of Psychosomatic Research, 55, 277-283.
Tett, R., Wang, A., Gribler, J., & Martinez, A. (1997). Development of self report measures
of emotional intelligence. Annual Convention of Southeastern Psychological
Association.

254
Theron, C. (2007). Confessions, Scapegoats and Flying Pigs: Psychometric Testing and the
Law. SA Journal of Industrial Psychology, 33(1), 102 -117.
Thomas, A., & Bendixen, M. (2000). The Management implications of Ethnicity in South
Africa. Journal of International Business Studies, 31 (3), 507-519.
Thorndike, R. L. (1920). Intelligence and its uses. Harper’s Magazine, 140, 227-235.
Triandis, H. C. (1988). Collectivism and individualism: A reconceptualization of a basic
concept in cross-cultural social psychology. In G. L. Verma & C. Bagley (Eds.),
Personality, attitudes, and cognitions (pp.60-95). London: Macmillan.
Triandis, H. C. (1994). Culture and social behavior. New York: McGraw-Hill.
Triandis, H. C. (1994). Major cultural syndromes and emotion. In S. Kitayama & H. R.
Markus (Eds.), Emotion and culture: empirical studies of mutual influence (pp. 285-
306). Washington, DC: American Psychological Association.
Triandis, H. C., & Gelfand, M. J. (1998). Converging measurement of horizontal and
vertical individualism and collectivism. Journal of Personality and Social
Psychology, 74, 118-128.
Tsai, J. L., & Chentsova-Dutton, Y. (2003). Variation among European Americans in
emotional facial expression. Journal of Cross-Cultural Psychology, 34, 650-657.
Tucker, L. R. & Lewis, C. (1973). A reliability coefficient for maximum likelihood factor
analyses. Psychometrika, 38, 1-10.
Tucker, L. R. (1951). A method for synthesis of factor analysis studies (Personnel Research
Section Report No. 984). Washington, DC: Department of the Army.

255
Van Bezooijen, R., Otto, S. A., & Heenan, T. A. (1983). Recognition of vocal expressions
of emotion: A three-nation study to identify universal characteristics. Journal of
Cross-Cultural Psychology, 14, 387-406.
Van de Vijver, A. J. R. & Rothmann, S. (2004) Assessment in multicultural groups: The
South African Case. SA Journal of Industrial Psychology, 30 (4), 1-7.
Van de Vijver, F. (2002). Cross-Cultural Assessment: value for money? Applied
Psychology: An International Review, 51(4), 545-566.
Van de Vijver, F. (2008). Personality Assessment of Global Talent: Conceptual and
Methodological Issues. International Journal of Testing, 8, 304-314.
Van de Vijver, F. J. R. (2003). Bias and equivalence: Cross -cultural perspectives. In J. A.
Harkness, F. J. R. Van de Vijver & P. P. Mohler (Eds.), Cross-cultural survey
methods (pp. 143-155). New York: John Wiley & Sons.
Van de Vijver, F. J. R., & Hambleton, R. K. (1996). Translating tests: Some practical
guidelines. European Psychologist, 1, 89-99.
Van de Vijver, F. J. R., & Leung, K. (2000). Methodological issues in psychological
research in culture. Journal of Cross-Cultural Psychology, 31 (1), 33-51.
Van de Vijver, F., & Leung, K. (1997). Methods and data analysis for cross-cultural
research. In J. W. Berry, Y. H. Poortinga & J. Pandey (Eds.), Handbook of cross-
cultural psychology: Theory and method (2nd ed., Vol. 1, pp.257-300). Needham
Heights: Allyn & Bacon.
Van de Vijver, F., & Leung, K. (2001). Personality in cultural context: Methodological
issues. Journal of Personality, 69(6), 1007-1031.

256
Van de Vijver, F., & Poortinga, Y. H. (1997). Towards an integrated analysis of bias in
cross-cultural assessment. European Journal of Psychological Assessment, 13, 21-
39.
Van de Vijver, A. J. R., & Poortinga, Y. H. (2002). Structural Equivalence in Multilevel
Research. Journal of Cross-Cultural Psychology, 33(2), 141-156
Van de Vijver, F., & Tanzer, N. K. (1997). Bias and equivalence in cross-cultural
assessment: An overview. European Review of Applied Psychology, 47, 263-279.
Van de Vijver, F., & Tanzer, N. K. (2004). Bias and equivalence in cross-cultural
assessment: an overview. Revue eureopéenne de psychologie appliqué, 54, 119-135.
Van der Merwe, H.W., Ashley, M. J., Charton, C. J. & Huber, B. J. (1974). White South
African elites: A study of incumbents of top positions in the Republic of South
Africa. Cape Town: Juta.
Van Eeden, R., & Mantsha, T. R. (2007). Theoretical and methodological considerations in
the translation of the 16PF into an African language. SA Journal of Psychology,
37(1), 62-81.
Van Hemert, D. A., Van de Vijver, F., Poortinga, Y., & Georgas, J. (2002). Structure and
score levels of the Eysenck Personality Questionnaire across individuals and
countries. Personality and Individual Differences, 33, 1229-1249.
Van Herk, H., Poortinga, Y. H., & Verhallen, T. M. M. (2004). Response styles in rating
scales: evidence of method bias in data from six EU countries. Journal of Cross-
Cultural Psychology, 35 (3), 346-360.
Van Oudenhoven, J. P. (2001). Do organizations reflect national culture? A 10-nation
study. International Journal of Intercultural Relations, 25, 89 – 107.

257
Van Rooy, D. L. & Viswesvaran, C. (2004). Emotional intelligence: a meta-analytic
investigation of predictive validity and nomological net. Journal of Vocational
Behavior, 65, 71-95.
Van Rooy, D. L., Alonso, A., Viswesvaran, C. (2005). Group differences in emotional
intelligence scores: theoretical and practical implications. Personality and Individual
Differences, 38, 689-700.
Van Rooy, D. L., Viswesvaran, C., & Alonso, A. (2004, April). The susceptibility of a
mixed model measure of emotional intelligence to faking: A Solomon 4-group
design. Paper presented at the 19th
annual meeting of the Society for Industrial and
Organizational Psychology, Chicago, IL.
Vandenberg, R. J. (2002). Toward a further understanding of and improvement in
measurement invariance methods and procedures. Organizational Research
Methods, 5(2), pp. 139 - 158.
Vandenberg, R. J., & Lance, C. E. (2000). A review and synthesis of the measurement
invariance literature: Suggestions, practices, and recommendations for
organizational research. Organizational Research Methods, 3(1), 4 - 70.
Wallis, T., & Birt, M. (2003). A comparison of native and non-native English-speaking
groups’ understanding of the vocabulary contained within the 16PF (SA92). SA
Journal of Psychology, 33(3), 182-190.
Wang, C. K. J., Liu, W. C., Biddle, S. J. H., & Spray, C. M. (2005). Cross-cultural
validation of the conceptions of the Nature of Athletic Ability Questionnaire
Version 2. Personality and Individual Differences, 38, 1245-1256.
Wang, J. S. L. (2007). Validation of emotional intelligence scale in Chinese university
students. Personality and Individual Differences, 43, 377-387.

258
Ward, L. C., Kersh, B. C., & Waxmonsky, J. A. (1998). Factor structure of the Paranoia
Scale of the MMPI-2 in relation to the Harris-Lingoes subscales and Comrey factor
analysis. Psychological Assessment, 10, 292-296.
Watson, D. (1992). Correcting for acquiescent response bias in the absence of a balanced
scale: an application to class consciousness. Sociological Methods & Research, 21,
52-88.
Weis, H. M., & Cropanzano, R. (1996). Affective events theory: A theoretical discussion of
the structure, causes and consequences of affective experiences at work. In B. M.
Staw & L. L. Cummings (Eds.), Research in organizational behavior (Vol. 18, pp.1-
74). Stanford, CT: JAI Press.
Werner, O., & Campbell, D. T. (1970). Translating, working through interpreters, and the
problem of decentering. In R. Naroll & R. Cohen (eds.), A handbook of cultural
anthropology, (pp.398 – 419). New York: American Museum of Natural History.
West, S. G., Finch, J. F., & Curran, A. (1995). Structural equation models with nonnormal
variables: Problems and remedies. In R. H. Hoyle (Ed.), Structural equation
modeling: Concepts, issues and applications (pp. 56-75). Thousand Oaks, CA: Sage.
Widaman, K. F., & Reise, S. P. (1997). Exploring the measurement invariance of
psychological instruments: Applications in the substance use domain. In K. J.
Bryant, M. Windle, & S. G. West (Eds.) The science of prevention: Methodological
advances from alcohol and substance abuse research. (pp. 281-324). Washington,
DC: American Psychological Association.
Wierzbicka, A. (1986). Human emotions: Universal or culture-specific? American
Anthropologist, 82, 584-594.

259
Wierzbicka, A. (1994). Emotion, language and cultural scripts. In S. Kitayama & H. R.
Markus (Eds.), Emotion and culture: empirical studies of mutual influence. (pp.
133-196). Washington, DC: American Psychological Association.
Wierzbicka, A. (1999). Emotions across languages and cultures: diversity and universals.
Cambridge: University Press.
Williams, L. J., Ford, L. R., & Nguyen, N. (2002). Basic and advanced measurement
models for confirmatory factor analysis. In S. Rogelberg (Ed.), Handbook of
research methods in industrial and organizational psychology (pp. 366–389).
Oxford, UK: Blackwell Publishers.
Wong, C & Law, K. S. (2002). The effects of follower emotional intelligence on
performance and attitude: an exploratory study. The Leadership Quarterly, 13, 243-
274.
Wong, C., Foo, M., Wang, C., & Wong, P. (2007). The feasibility of training and
development of EI: an exploratory study in Singapore, Hong Kong and Taiwan.
Intelligence, 35(2), 141-150.
Wong, N., Rindfleish, A., & Burroughs, J. E. (2003). Do reverse-worded items confound
measures in cross-cultural consumer research? The case of the Material Values
Scale. Journal of Consumer Research, 30, 72-91.
Yang, K. S., & Bond, M. H. (1980). Ethnic affirmation by Chinese bilinguals. Journal of
Cross-Cultural Psychology, 11, 411-425.
Zeidner, A., Shani-Zinovich, I., Matthews, G., & Roberts, R. D. (2005). Assessing
emotional intelligence in gifted and non-gifted high school students: outcomes
depend on the measure. Intelligence, 33, 369-391.

260
Zeidner, M., Roberts, R. D, & Matthews, G. (2008). The Science of Emotional
Intelligence: Current Consensus and Controversies. European Psychologist, 13 (1),
64-78.
Zeidner, M., Matthews, G., & Roberts, R. D. (2001). Slow down, you move too fast:
Emotional Intelligence remains an “elusive” intelligence. Emotion, 1(3), 265-275.
Zeidner, M., Matthews, G., & Roberts, R. D. (2004). Emotional intelligence in the
workplace: a critical review. Applied Psychological: An International Review,
53(3), 371-399.
Zeidner, M., Matthews, G., Roberts, R. D. & MacCann, C. (2003). Development of
Emotional Intelligence: towards a multi-level investment model. Human
Development, 46, 69-96.
Zhang, J., & Shavitt, S. (2003) Cultural values in advertisements to the Chinese X-
generation. Journal Advertising, 32, 23-33.
261
APPENDIX 1
Cover letters to request participation
Beste Departementshoof: Prof….
OPROEP OM DEELNAME IN NAVORSING
Geliewe my die geleentheid te gun om met hierdie skrywe ‘n versoek aan u te rig om die
meegaande kennisgewing (‘n oproep om deelname aan my PhD studie) aan al die personeel in u
departement uit te stuur. Die internasionale studie in organisasiegedrag word in samewerking met
navorsers aan die Swinburne Universiteit in Melbourne, Australie, onderneem.
Die etiese komittee van die Universiteit Stellenbosch het die studie en meegaande vraelys op 5
April 2005 goedgekeur. Vir u doeleindes heg ek die brief van goedkeuring van die etiese komittee
aan.
Die prosedure vir deelname word in die meegaande kennisgewing verduidelik. Neem asb kennis
dat deelname ten volle vrywillig is. Terugvoering sal op versoek aan respondente beskikbaar wees
(voorsiening word daarvoor aan die einde van die vraelys gemaak).
U samewerking met die uitstuur van die meegaande kennisgewing (wat die skakel na die webwerf
met die vraelys, wat op die US se intranet le) word hoog op prys gestel.
Baie dankie vir u tyd en belangrike bydrae tot hierdie internasionale studie!
Beste wense,
Gina Ekermans (PhD student: Universiteit van Stellenbosch
Prof C Stough (Instituut vir Neurologiese navorsing, Swinburne Universiteit van Tegnologie)
Dear Head of Department: Prof…
CALL TO PARTICIPATE IN RESEARCH With this letter, please afford me the opportunity to request your assistance in distributing the
attached notice (a call to participate in my PhD study) to all the personnel in your department. This
international study in organizational behaviour is being conducted in conjunction with researchers at
Swinburne University in Melbourne, Australia.
The ethical committee of Stellenbosch University approved the study and attached questionnaire on
5 April 2005. I attach the letter of approval of the ethical committee for your perusal. The procedure
to participate in the study is outlined in the attached notice. Please note that participation is
completely voluntary. Respondents will have the opportunity to request feedback on their results at
the end of the questionnaire, should they wish to do so.
Your assistance in forwarding the notice (that contains the cover letter and link providing access to
the webpage with the questionnaire, located on the US intranet) will be greatly appreciated.
Thank you for your time and important contribution to this international study!
Best wishes,
Gina Ekermans (PhD student: Stellenbosch University)
Prof C Stough (Brain Sciences Institute, Swinburne University of Technology)

262
NOTICE CALL TO PARTICIPATE IN RESEARCH: INTERNATIONAL STUDY ON ORGANISATIONAL BEHAVIOUR Dear staff member, In order to conduct joint international research between Stellenbosch University and researchers
at the Brain Sciences Institute at the Swinburne University of Technology in Melbourne,
Australia, we need information regarding your behaviour in the organisation where you work. We
therefore request your help with the completion of a questionnaire. In responding to the
questionnaire you will provide us with information about the way you see yourself typically dealing
with emotions in the workplace, as well as other information regarding your preferences and/or
current situation. Please note that your participation in the study is completely voluntary. You can decide for
yourself whether you will participate by choosing to complete the questionnaire. All responses will
be treated with anonymity and confidentiality and will only be used for the research purposes of this
project.
To access the questionnaire please click on the following link (Internet access will be needed): http://academic.sun.ac.za/bedryfsnav/index.asp
At the end of the questionnaire you can request feedback by simply filling in your name and e-mail
address when prompted to do so.
Thank you for your time and important contribution to this international study!
Best wishes, Gina Ekermans (PhD student: Swinburne University of Technology) Prof C Stough (Brain Sciences Institute, Swinburne University of Technology)
Please note: for technical support phone (021) 808 3596 or e-mail: [email protected]

263
APPENDIX 2
Descriptive statistics for SUEIT data utilised in chapter 4
This appendix includes the descriptive statistics for the raw SUEIT data utilised to fit the
modified measurement model with 50 items (M2a). It also contains the descriptive statistics
for the matched Australian samples randomly drawn from the n=3224 Australian sample
for the purposes of the measurement invariance analyses.
AUSTRALIAN SAMPLE A
Total Sample Size = 1604
Univariate Summary Statistics for Continuous Variables
Variable Mean St. Dev. T-Value Skewness Kurtosis Minimum Freq. Maximum Freq.
-------- ---- -------- ------- -------- -------- ------- ----- ------- -----
i1 3.976 0.504 316.010 -0.337 2.277 1.000 1 5.000 176
i2 3.774 0.760 198.762 -0.380 0.228 1.000 6 5.000 237
i4 3.748 0.755 198.771 -0.617 0.654 1.000 8 5.000 191
i5 4.015 0.604 266.033 -0.380 1.241 1.000 2 5.000 285
i6 3.282 0.764 172.132 -0.272 0.371 1.000 27 5.000 57
i7 3.401 0.919 148.242 -0.262 -0.237 1.000 35 5.000 162
i8 3.581 0.747 191.998 -0.377 0.064 1.000 5 5.000 120
i9 3.774 0.762 198.424 -0.333 0.108 1.000 5 5.000 243
i10 3.307 0.861 153.767 -0.347 -0.523 1.000 21 5.000 70
i11 3.448 0.799 172.707 -0.540 0.269 1.000 24 5.000 84
i13 3.881 0.627 247.882 -0.317 0.686 1.000 2 5.000 206
i14 3.416 0.842 162.409 -0.225 -0.348 1.000 12 5.000 121
i15 3.525 0.760 185.743 -0.370 -0.083 1.000 5 5.000 103
i16 3.858 0.731 211.240 -0.788 1.249 1.000 7 5.000 232
i17 3.554 0.706 201.665 -0.537 0.398 1.000 8 5.000 76
i19 4.223 0.680 248.588 -0.668 0.737 1.000 1 5.000 561
i20 4.028 0.735 219.518 -0.573 0.429 1.000 1 5.000 401
i22 3.901 0.668 233.886 -0.601 1.332 1.000 5 5.000 234
i23 3.818 0.599 255.344 -0.344 0.645 1.000 1 5.000 144
i25 3.430 0.833 164.835 -0.190 -0.022 1.000 20 5.000 136
i26 3.482 0.799 174.606 -0.371 -0.052 1.000 12 5.000 109
i27 3.966 0.680 233.454 -0.636 1.235 1.000 3 5.000 291
i28 3.245 0.807 161.139 -0.294 -0.017 1.000 30 5.000 55
i29 4.360 0.717 243.619 -1.022 1.056 1.000 2 5.000 770
i31 3.373 0.760 177.818 -0.245 0.202 1.000 17 5.000 75
i32 3.823 0.783 195.447 -0.388 0.107 1.000 6 5.000 290
i33 3.638 0.694 209.941 -0.273 0.342 1.000 6 5.000 127
i34 4.181 0.610 274.702 -0.581 1.938 1.000 3 5.000 444
i36 3.971 0.757 210.187 -0.696 0.972 1.000 8 5.000 358
i37 3.165 0.833 152.118 -0.175 -0.325 1.000 30 5.000 52
i38 3.883 0.655 237.543 -0.730 1.559 1.000 3 5.000 200
i39 3.564 0.641 222.677 -0.310 0.235 1.000 4 5.000 65
i41 3.779 0.740 204.434 -0.823 1.310 1.000 12 5.000 183
i42 3.430 0.812 169.145 -0.276 -0.059 1.000 16 5.000 110
i43 4.193 0.589 285.134 -0.330 0.973 1.000 1 5.000 450
i44 3.918 0.809 193.872 -0.698 0.579 1.000 8 5.000 353
i45 3.993 0.685 233.470 -0.329 0.110 2.000 29 5.000 341
i46 4.022 0.702 229.409 -0.528 0.762 1.000 4 5.000 371
i48 4.039 0.666 242.987 -0.654 1.466 1.000 3 5.000 343
i49 3.645 0.785 186.039 -0.425 0.303 1.000 12 5.000 175
i52 3.708 0.659 225.371 -0.429 0.365 1.000 1 5.000 120
i54 3.784 0.763 198.528 -0.523 0.383 1.000 5 5.000 228
i56 3.531 0.736 192.208 -0.557 0.357 1.000 11 5.000 80
i57 3.579 0.751 190.735 -0.229 0.122 1.000 8 5.000 141
i58 3.027 0.802 151.093 0.060 0.155 1.000 37 5.000 52
i59 3.741 0.603 248.326 -0.581 1.237 1.000 5 5.000 98

264
i60 3.817 0.681 224.358 -0.357 0.474 1.000 3 5.000 204
i61 3.434 0.792 173.604 -0.461 -0.190 1.000 11 5.000 74
i63 3.853 0.632 244.348 -0.736 1.654 1.000 3 5.000 164
i64 3.878 0.691 224.659 -0.458 0.654 1.000 3 5.000 245
AUSTRALIAN SAMPLE B
Total Sample Size = 1605
Univariate Summary Statistics for Continuous Variables
Variable Mean St. Dev. T-Value Skewness Kurtosis Minimum Freq. Maximum Freq. -------- ---- -------- ------- -------- -------- ------- ----- ------- ----- i1 3.993 0.510 313.778 -0.379 2.724 1.000 2 5.000 192 i2 3.793 0.747 203.527 -0.400 0.339 1.000 6 5.000 237 i4 3.750 0.727 206.677 -0.543 0.573 1.000 5 5.000 179 i5 4.060 0.601 270.720 -0.300 0.899 1.000 1 5.000 326 i6 3.281 0.756 173.913 -0.178 0.318 1.000 22 5.000 61 i7 3.411 0.903 151.418 -0.287 -0.262 1.000 29 5.000 150 i8 3.611 0.739 195.833 -0.465 0.297 1.000 7 5.000 122 i9 3.748 0.784 191.419 -0.409 0.212 1.000 8 5.000 236 i10 3.321 0.842 157.968 -0.317 -0.468 1.000 17 5.000 72 i11 3.447 0.795 173.612 -0.491 0.196 1.000 21 5.000 86 i13 3.886 0.626 248.779 -0.432 1.182 1.000 4 5.000 203 i14 3.460 0.848 163.509 -0.394 -0.048 1.000 22 5.000 126 i15 3.561 0.769 185.623 -0.600 0.492 1.000 16 5.000 106 i16 3.865 0.743 208.488 -0.921 1.780 1.000 14 5.000 238 i17 3.603 0.677 213.359 -0.638 0.587 1.000 6 5.000 72 i19 4.190 0.707 237.535 -0.903 1.851 1.000 7 5.000 531 i20 4.023 0.770 209.191 -0.727 0.857 1.000 7 5.000 418 i22 3.927 0.658 239.103 -0.698 1.801 1.000 6 5.000 240 i23 3.811 0.618 247.061 -0.252 0.274 2.000 25 5.000 158 i25 3.426 0.841 163.191 -0.265 -0.070 1.000 21 5.000 127 i26 3.559 0.773 184.328 -0.391 0.139 1.000 10 5.000 127 i27 3.969 0.689 230.800 -0.716 1.506 1.000 5 5.000 296 i28 3.307 0.817 162.252 -0.315 0.073 1.000 30 5.000 74 i29 4.404 0.731 241.450 -1.339 2.354 1.000 7 5.000 833 i31 3.390 0.774 175.568 -0.281 0.168 1.000 18 5.000 82 i32 3.844 0.762 202.143 -0.416 0.318 1.000 7 5.000 286 i33 3.669 0.717 205.096 -0.320 0.316 1.000 6 5.000 151 i34 4.204 0.632 266.538 -0.683 1.948 1.000 4 5.000 488 i36 3.958 0.772 205.384 -0.636 0.662 1.000 7 5.000 366 i37 3.185 0.831 153.524 -0.168 -0.420 1.000 24 5.000 53 i38 3.924 0.623 252.300 -0.752 2.250 1.000 5 5.000 208 i39 3.544 0.659 215.512 -0.182 0.064 1.000 3 5.000 76 i41 3.784 0.728 208.346 -0.821 1.160 1.000 7 5.000 175 i42 3.457 0.796 174.005 -0.272 -0.031 1.000 13 5.000 112 i43 4.191 0.594 282.712 -0.318 0.818 1.000 1 5.000 453 i44 3.948 0.833 189.914 -0.797 0.815 1.000 14 5.000 393 i45 4.044 0.694 233.565 -0.441 0.344 1.000 1 5.000 390 i46 4.007 0.722 222.228 -0.567 0.815 1.000 6 5.000 374 i48 4.090 0.681 240.720 -0.826 2.049 1.000 6 5.000 396 i49 3.651 0.776 188.424 -0.459 0.468 1.000 14 5.000 171 i52 3.744 0.634 236.760 -0.524 0.748 1.000 2 5.000 117 i54 3.811 0.747 204.437 -0.622 0.712 1.000 6 5.000 225 i56 3.583 0.699 205.254 -0.696 0.960 1.000 14 5.000 76 i57 3.594 0.772 186.577 -0.324 0.212 1.000 11 5.000 152 i58 3.070 0.811 151.671 0.032 0.089 1.000 35 5.000 58 i59 3.779 0.577 262.258 -0.432 0.706 1.000 1 5.000 105 i60 3.800 0.708 214.921 -0.304 0.173 1.000 2 5.000 218 i61 3.450 0.773 178.911 -0.368 -0.153 1.000 8 5.000 82 i63 3.895 0.627 248.925 -0.847 2.335 1.000 5 5.000 184 i64 3.869 0.733 211.505 -0.514 0.652 1.000 6 5.000 269

265
NEW ZEALAND
Total Sample Size = 234
Univariate Summary Statistics for Continuous Variables
Variable Mean St. Dev. T-Value Skewness Kurtosis Minimum Freq. Maximum Freq.
-------- ---- -------- ------- -------- -------- ------- ----- ------- -----
i1 4.004 0.495 123.848 0.010 1.155 3.000 28 5.000 29
i2 3.808 0.663 87.884 -0.123 -0.081 2.000 4 5.000 29
i4 3.825 0.699 83.713 -0.963 2.251 1.000 2 5.000 26
i5 4.077 0.610 102.287 -0.155 0.129 2.000 1 5.000 52
i6 3.239 0.749 66.187 -0.361 -0.350 1.000 2 5.000 3
i7 3.462 0.889 59.561 -0.271 -0.098 1.000 4 5.000 25
i8 3.628 0.683 81.275 -0.269 -0.022 2.000 11 5.000 16
i9 3.816 0.703 83.059 -0.026 -0.406 2.000 4 5.000 36
i10 3.282 0.790 63.558 -0.178 -0.505 1.000 1 5.000 8
i11 3.440 0.769 68.463 -0.312 -0.468 2.000 29 5.000 11
i13 3.897 0.546 109.132 -0.062 0.255 3.000 48 5.000 24
i14 3.513 0.804 66.870 -0.543 0.338 1.000 3 5.000 16
i15 3.509 0.701 76.567 -0.181 -0.210 2.000 16 5.000 12
i16 3.936 0.747 80.592 -0.768 1.214 1.000 1 5.000 45
i17 3.551 0.628 86.507 -0.562 -0.072 2.000 12 5.000 5
i19 4.308 0.593 111.181 -0.340 0.086 2.000 1 5.000 87
i20 4.094 0.655 95.628 -0.468 0.698 2.000 4 5.000 58
i22 3.991 0.579 105.540 -0.671 2.345 2.000 5 5.000 33
i23 3.748 0.594 96.568 -0.478 0.556 2.000 5 5.000 14
i25 3.363 0.819 62.851 -0.334 0.383 1.000 5 5.000 14
i26 3.654 0.783 71.355 -0.440 0.157 1.000 1 5.000 25
i27 4.026 0.641 96.014 -0.712 1.751 2.000 7 5.000 44
i28 3.338 0.730 69.893 -0.421 0.026 1.000 2 5.000 5
i29 4.432 0.734 92.404 -1.274 1.420 2.000 6 5.000 129
i31 3.359 0.769 66.803 -0.202 0.032 1.000 2 5.000 11
i32 3.902 0.726 82.234 -0.256 0.214 1.000 1 5.000 46
i33 3.684 0.695 81.061 -0.255 0.451 1.000 1 5.000 22
i34 4.235 0.579 111.917 -0.203 0.293 2.000 1 5.000 72
i36 4.009 0.741 82.736 -0.715 1.139 1.000 1 5.000 55
i37 3.154 0.754 63.986 -0.141 -0.645 1.000 1 5.000 3
i38 3.983 0.571 106.727 -0.980 4.466 1.000 1 5.000 30
i39 3.538 0.636 85.149 -0.246 0.468 1.000 1 5.000 9
i41 3.803 0.671 86.687 -0.434 0.465 2.000 8 5.000 26
i42 3.551 0.764 71.135 -0.495 0.404 1.000 2 5.000 16
i43 4.188 0.627 102.105 -0.794 2.937 1.000 1 5.000 67
i44 3.923 0.777 77.250 -0.586 0.268 2.000 13 5.000 49
i45 4.090 0.659 94.967 -0.460 0.632 2.000 4 5.000 58
i46 4.034 0.680 90.757 -0.373 0.235 2.000 4 5.000 54
i48 4.137 0.613 103.189 -0.536 2.245 1.000 1 5.000 59
i49 3.620 0.739 74.954 -0.226 -0.174 2.000 15 5.000 21
i52 3.718 0.673 84.567 -1.132 2.783 1.000 3 5.000 14
i54 3.829 0.727 80.564 -0.605 0.547 2.000 13 5.000 32
i56 3.607 0.687 80.363 -0.672 0.678 1.000 1 5.000 11
i57 3.615 0.722 76.623 -0.237 -0.128 2.000 14 5.000 19
i58 2.996 0.826 55.475 -0.176 0.050 1.000 9 5.000 5
i59 3.765 0.556 103.553 -0.633 0.862 2.000 4 5.000 11
i60 3.850 0.680 86.608 -0.714 2.054 1.000 2 5.000 30
i61 3.449 0.780 67.605 -0.429 0.057 1.000 2 5.000 12
i63 3.940 0.626 96.359 -0.488 1.087 2.000 5 5.000 34
i64 3.889 0.750 79.303 -0.492 0.228 2.000 11 5.000 43

266
UNITED STATES OF AMERICA
Total Sample Size = 287
Univariate Summary Statistics for Continuous Variables
Variable Mean St. Dev. T-Value Skewness Kurtosis Minimum Freq. Maximum Freq. -------- ---- -------- ------- -------- -------- ------- ----- ------- ----- i1 4.084 0.658 105.068 -0.460 0.639 2.000 5 5.000 70 i2 3.815 0.800 80.757 -0.396 0.245 1.000 2 5.000 54 i4 3.648 0.872 70.877 -0.462 0.159 1.000 4 5.000 42 i5 4.084 0.753 91.922 -0.882 1.920 1.000 3 5.000 82 i6 3.192 0.781 69.229 -0.039 0.137 1.000 4 5.000 11 i7 3.429 1.011 57.456 -0.407 -0.400 1.000 10 5.000 36 i8 3.669 0.868 71.597 -0.466 0.207 1.000 4 5.000 44 i9 3.666 0.908 68.376 -0.332 -0.262 1.000 3 5.000 52 i10 3.366 0.886 64.347 -0.575 0.116 1.000 9 5.000 16 i11 3.251 0.931 59.150 -0.336 -0.083 1.000 12 5.000 19 i13 3.937 0.726 91.837 -0.786 1.985 1.000 3 5.000 54 i14 3.460 0.915 64.081 -0.322 -0.377 1.000 4 5.000 30 i15 3.645 0.848 72.795 -0.599 0.239 1.000 3 5.000 34 i16 3.944 0.859 77.774 -0.959 1.225 1.000 4 5.000 70 i17 3.624 0.770 79.776 -0.259 0.002 1.000 1 5.000 30 i19 4.247 0.747 96.373 -0.945 1.241 1.000 1 5.000 115 i20 4.073 0.805 85.689 -0.862 1.065 1.000 2 5.000 88 i22 4.042 0.737 92.862 -0.698 1.023 1.000 1 5.000 73 i23 3.767 0.737 86.576 -0.392 0.668 1.000 2 5.000 39 i25 3.463 0.941 62.338 -0.210 -0.267 1.000 6 5.000 39 i26 3.547 0.907 66.275 -0.651 0.491 1.000 9 5.000 32 i27 4.091 0.766 90.514 -0.767 0.888 1.000 1 5.000 86 i28 3.261 0.868 63.664 -0.339 0.111 1.000 9 5.000 15 i29 4.449 0.666 113.110 -1.170 1.605 2.000 5 5.000 152 i31 3.380 0.888 64.468 -0.190 -0.053 1.000 6 5.000 27 i32 3.871 0.928 70.678 -0.613 0.083 1.000 4 5.000 78 i33 3.700 0.885 70.798 -0.622 0.545 1.000 6 5.000 47 i34 4.261 0.698 103.404 -0.780 0.746 2.000 6 5.000 111 i36 3.864 0.908 72.110 -0.857 0.857 1.000 6 5.000 67 i37 3.063 0.959 54.120 -0.342 -0.381 1.000 19 5.000 10 i38 3.787 0.789 81.324 -0.722 0.806 1.000 2 5.000 41 i39 3.638 0.767 80.331 -0.635 1.035 1.000 4 5.000 26 i41 3.791 0.876 73.316 -0.554 0.034 1.000 2 5.000 57 i42 3.418 0.904 64.042 -0.239 -0.243 1.000 5 5.000 29 i43 4.314 0.636 114.855 -0.790 1.443 2.000 5 5.000 112 i44 4.129 0.870 80.446 -1.185 1.850 1.000 5 5.000 105 i45 4.136 0.728 96.205 -0.707 0.957 1.000 1 5.000 90 i46 4.150 0.808 87.046 -0.721 0.227 1.000 1 5.000 108 i48 4.136 0.775 90.429 -0.967 1.598 1.000 2 5.000 94 i49 3.707 0.903 69.522 -0.506 0.185 1.000 5 5.000 53 i52 3.878 0.721 91.104 -0.545 0.815 1.000 1 5.000 47 i54 3.767 0.884 72.205 -0.566 0.139 1.000 3 5.000 55 i56 3.575 0.841 72.038 -0.629 0.663 1.000 6 5.000 28 i57 3.505 0.892 66.546 -0.313 -0.052 1.000 5 5.000 34 i58 2.902 0.922 53.314 0.034 -0.332 1.000 16 5.000 10 i59 3.791 0.688 93.319 -0.415 0.722 1.000 1 5.000 34 i60 3.847 0.800 81.411 -0.334 -0.300 2.000 15 5.000 58 i61 3.474 0.864 68.106 -0.590 0.355 1.000 7 5.000 22 i63 3.850 0.759 85.990 -0.759 1.200 1.000 2 5.000 45 i64 3.857 0.830 78.704 -0.466 -0.210 2.000 20 5.000 61

267
ITALIAN
Total Sample Size = 320
Univariate Summary Statistics for Continuous Variables
Variable Mean St. Dev. T-Value Skewness Kurtosis Minimum Freq. Maximum Freq. -------- ---- -------- ------- -------- -------- ------- ----- ------- ----- i1 3.462 0.848 73.016 -0.487 0.790 1.000 10 5.000 28 i2 3.138 1.125 49.876 -0.287 -0.464 1.000 36 5.000 35 i4 2.841 1.072 47.383 -0.031 -0.799 1.000 37 5.000 14 i5 3.700 1.067 62.030 -0.749 0.143 1.000 16 5.000 76 i6 3.244 1.202 48.270 -0.163 -0.853 1.000 28 5.000 57 i7 3.034 1.217 44.595 -0.108 -0.831 1.000 45 5.000 41 i8 3.253 1.106 52.597 -0.179 -0.570 1.000 22 5.000 46 i9 3.591 1.124 57.120 -0.421 -0.639 1.000 13 5.000 80 i10 3.038 1.211 44.882 -0.072 -0.973 1.000 38 5.000 38 i11 3.359 1.139 52.772 -0.175 -0.782 1.000 17 5.000 61 i13 3.578 0.947 67.594 -0.561 0.311 1.000 11 5.000 48 i14 3.266 1.164 50.174 -0.279 -0.736 1.000 27 5.000 48 i15 2.947 1.120 47.071 -0.124 -0.570 1.000 43 5.000 26 i16 3.878 0.989 70.120 -0.750 0.162 1.000 7 5.000 95 i17 3.434 0.951 64.588 -0.283 -0.167 1.000 9 5.000 40 i19 3.612 1.139 56.729 -0.696 -0.213 1.000 21 5.000 73 i20 3.447 1.010 61.079 -0.544 -0.101 1.000 15 5.000 39 i22 3.825 1.123 60.937 -0.867 0.069 1.000 16 5.000 103 i23 3.597 1.016 63.358 -0.464 -0.088 1.000 12 5.000 64 i25 3.188 1.058 53.919 -0.093 -0.499 1.000 19 5.000 37 i26 2.694 1.134 42.505 0.169 -0.658 1.000 56 5.000 21 i27 3.744 1.178 56.831 -0.763 -0.282 1.000 19 5.000 100 i28 2.700 1.102 43.840 0.064 -0.720 1.000 54 5.000 15 i29 3.638 1.059 61.427 -0.843 0.259 1.000 18 5.000 59 i31 3.406 1.096 55.596 -0.169 -0.650 1.000 14 5.000 62 i32 3.725 1.082 61.557 -0.644 -0.177 1.000 13 5.000 87 i33 3.441 0.948 64.903 -0.228 -0.124 1.000 9 5.000 43 i34 3.716 0.929 71.571 -0.917 1.182 1.000 13 5.000 54 i36 3.119 1.096 50.883 -0.309 -0.648 1.000 30 5.000 25 i37 3.069 1.104 49.744 -0.094 -0.560 1.000 30 5.000 33 i38 3.619 0.953 67.954 -0.727 0.606 1.000 13 5.000 49 i39 3.231 0.932 62.043 0.039 -0.166 1.000 9 5.000 31 i41 3.712 0.963 68.996 -0.840 0.619 1.000 11 5.000 58 i42 3.281 1.021 57.477 -0.088 -0.515 1.000 12 5.000 40 i43 3.766 0.870 77.432 -0.676 0.575 1.000 5 5.000 57 i44 3.559 1.061 60.031 -0.696 0.139 1.000 20 5.000 56 i45 3.525 0.956 65.931 -0.569 0.318 1.000 13 5.000 43 i46 3.928 1.019 68.947 -0.839 0.281 1.000 9 5.000 109 i48 3.612 0.896 72.144 -0.552 0.560 1.000 9 5.000 46 i49 3.638 1.074 60.587 -0.552 -0.223 1.000 14 5.000 75 i52 3.534 0.859 73.566 -0.167 -0.049 1.000 4 5.000 41 i54 3.237 1.062 54.520 -0.328 -0.465 1.000 22 5.000 32 i56 3.850 0.918 75.027 -0.750 0.522 1.000 6 5.000 77 i57 3.191 1.007 56.688 -0.186 -0.237 1.000 19 5.000 30 i58 3.047 0.977 55.805 0.007 -0.162 1.000 19 5.000 24 i59 3.631 0.857 75.765 -0.593 0.672 1.000 7 5.000 41 i60 3.281 0.968 60.660 0.017 -0.249 1.000 10 5.000 39 i61 3.062 0.996 54.978 -0.145 -0.236 1.000 23 5.000 22 i63 3.806 0.903 75.421 -0.868 1.107 1.000 9 5.000 65 i64 3.194 0.976 58.525 -0.254 -0.140 1.000 18 5.000 25

268
SOUTH AFRICA (WHITE)
Total Sample Size = 290
Univariate Summary Statistics for Continuous Variables
Variable Mean St. Dev. T-Value Skewness Kurtosis Minimum Freq. Maximum Freq.
-------- ---- -------- ------- -------- -------- ------- ----- ------- -----
i1 3.817 0.648 100.333 -0.419 1.027 1.000 1 5.000 32
i2 3.645 0.807 76.871 -0.379 0.131 1.000 2 5.000 35
i4 3.797 0.882 73.274 -0.808 0.763 1.000 5 5.000 54
i5 3.921 0.704 94.858 -0.368 0.537 1.000 1 5.000 54
i6 3.248 0.963 57.429 -0.164 -0.176 1.000 12 5.000 27
i7 3.079 1.021 51.368 -0.238 -0.446 1.000 22 5.000 18
i8 3.431 0.932 62.680 -0.365 -0.423 1.000 5 5.000 28
i9 3.300 0.961 58.477 -0.397 -0.232 1.000 12 5.000 22
i10 3.069 0.964 54.209 -0.092 -0.656 1.000 12 5.000 14
i11 3.217 0.990 55.335 -0.167 -0.632 1.000 10 5.000 23
i13 3.786 0.667 96.602 -0.851 2.024 1.000 2 5.000 26
i14 3.255 0.947 58.543 -0.382 -0.365 1.000 11 5.000 17
i15 3.479 0.857 69.118 -0.632 0.410 1.000 7 5.000 21
i16 3.455 0.970 60.660 -0.331 -0.560 1.000 5 5.000 35
i17 3.510 0.816 73.252 -0.380 -0.097 1.000 2 5.000 23
i19 4.055 0.787 87.718 -0.526 -0.153 2.000 10 5.000 88
i20 3.762 0.799 80.164 -0.528 0.223 1.000 1 5.000 43
i22 3.524 0.881 68.117 -0.380 -0.378 1.000 2 5.000 30
i23 3.455 0.941 62.527 -0.522 -0.127 1.000 8 5.000 28
i25 3.272 0.969 57.497 -0.225 -0.603 1.000 8 5.000 23
i26 3.314 0.881 64.035 -0.139 -0.385 1.000 4 5.000 21
i27 3.638 0.983 63.054 -0.522 -0.413 1.000 4 5.000 51
i28 3.038 0.882 58.686 0.017 -0.255 1.000 9 5.000 12
i29 3.969 0.778 86.927 -0.613 0.291 2.000 15 5.000 68
i31 3.252 0.961 57.652 -0.216 -0.500 1.000 9 5.000 22
i32 3.441 1.061 55.221 -0.361 -0.510 1.000 12 5.000 46
i33 3.341 0.839 67.859 -0.429 0.043 1.000 6 5.000 14
i34 3.979 0.730 92.869 -0.506 0.320 2.000 10 5.000 64
i36 3.710 0.810 77.995 -0.604 0.395 1.000 2 5.000 37
i37 3.059 0.904 57.639 -0.144 -0.429 1.000 11 5.000 10
i38 3.666 0.777 80.319 -0.764 0.885 1.000 3 5.000 26
i39 3.252 0.764 72.494 -0.461 0.342 1.000 6 5.000 6
i41 3.834 0.869 75.175 -0.917 0.939 1.000 4 5.000 54
i42 3.152 0.801 67.024 -0.159 -0.347 1.000 4 5.000 7
i43 4.076 0.618 112.336 -0.314 0.620 2.000 3 5.000 64
i44 3.734 0.866 73.467 -0.521 -0.132 1.000 1 5.000 48
i45 4.017 0.718 95.303 -0.534 0.437 2.000 9 5.000 68
i46 3.683 1.067 58.796 -0.562 -0.368 1.000 9 5.000 71
i48 3.793 0.752 85.856 -0.572 0.845 1.000 2 5.000 41
i49 3.300 0.909 61.809 -0.463 0.016 1.000 11 5.000 17
i52 3.459 0.865 68.127 -0.324 -0.262 1.000 3 5.000 25
i54 3.510 0.873 68.442 -0.471 -0.071 1.000 4 5.000 27
i56 3.531 0.820 73.350 -0.575 0.514 1.000 5 5.000 23
i57 3.359 0.961 59.538 -0.371 -0.241 1.000 10 5.000 27
i58 2.869 0.886 55.124 -0.011 -0.264 1.000 16 5.000 7
i59 3.524 0.816 73.566 -0.348 -0.266 1.000 1 5.000 24
i60 3.483 0.908 65.299 -0.604 0.414 1.000 10 5.000 28
i61 3.155 0.904 59.456 -0.340 -0.481 1.000 10 5.000 9
i63 3.717 0.760 83.321 -0.572 0.688 1.000 2 5.000 33
i64 3.734 0.795 80.017 -0.612 0.534 1.000 2 5.000 38

269
SOUTH AFRICA (NON-WHITE)
Total Sample Size = 337
Univariate Summary Statistics for Continuous Variables
Variable Mean St. Dev. T-Value Skewness Kurtosis Minimum Freq. Maximum Freq.
-------- ---- -------- ------- -------- -------- ------- ----- ------- -----
i1 3.522 0.806 80.259 -0.159 -0.108 1.000 2 5.000 33
i2 3.777 0.997 69.520 -0.736 0.308 1.000 11 5.000 83
i4 3.510 1.086 59.344 -0.392 -0.535 1.000 14 5.000 66
i5 3.546 0.981 66.338 -0.548 0.112 1.000 13 5.000 51
i6 3.374 1.146 54.069 -0.267 -0.704 1.000 21 5.000 63
i7 2.893 1.152 46.091 -0.013 -0.641 1.000 50 5.000 31
i8 3.297 1.012 59.784 -0.362 -0.355 1.000 17 5.000 32
i9 3.481 1.066 59.917 -0.357 -0.473 1.000 14 5.000 61
i10 2.858 1.154 45.472 0.047 -0.842 1.000 46 5.000 26
i11 3.279 1.017 59.165 -0.189 -0.426 1.000 15 5.000 38
i13 3.774 0.901 76.890 -0.816 0.951 1.000 9 5.000 64
i14 3.151 1.060 54.594 -0.094 -0.557 1.000 21 5.000 35
i15 3.588 1.040 63.304 -0.578 -0.065 1.000 15 5.000 64
i16 3.335 0.996 61.493 -0.457 -0.190 1.000 17 5.000 31
i17 3.332 0.965 63.404 -0.467 0.039 1.000 17 5.000 29
i19 4.080 1.048 71.489 -1.270 1.250 1.000 14 5.000 142
i20 3.427 1.132 55.586 -0.364 -0.527 1.000 22 5.000 65
i22 3.362 1.083 57.007 -0.504 -0.381 1.000 23 5.000 41
i23 3.522 1.049 61.611 -0.502 -0.189 1.000 16 5.000 59
i25 3.288 1.204 50.130 -0.342 -0.748 1.000 34 5.000 56
i26 2.985 1.073 51.067 -0.159 -0.535 1.000 36 5.000 23
i27 3.383 1.099 56.520 -0.464 -0.411 1.000 23 5.000 48
i28 3.154 1.083 53.475 -0.296 -0.376 1.000 32 5.000 33
i29 3.878 1.018 69.957 -0.913 0.559 1.000 12 5.000 100
i31 3.223 1.108 53.404 -0.159 -0.545 1.000 25 5.000 47
i32 3.448 1.162 54.494 -0.406 -0.540 1.000 25 5.000 71
i33 3.386 1.060 58.611 -0.248 -0.393 1.000 17 5.000 55
i34 3.742 1.024 67.060 -0.819 0.377 1.000 14 5.000 77
i36 3.620 1.071 62.054 -0.718 0.082 1.000 19 5.000 68
i37 2.804 1.174 43.849 0.175 -0.693 1.000 52 5.000 33
i38 3.457 1.046 60.670 -0.513 -0.118 1.000 19 5.000 50
i39 3.211 0.970 60.773 -0.275 -0.134 1.000 18 5.000 26
i41 3.792 1.037 67.120 -0.831 0.367 1.000 14 5.000 89
i42 3.098 1.023 55.581 -0.114 -0.366 1.000 23 5.000 28
i43 3.739 0.915 75.051 -0.939 1.118 1.000 11 5.000 56
i44 3.801 1.052 66.347 -0.753 0.013 1.000 11 5.000 95
i45 3.911 0.918 78.185 -0.866 0.913 1.000 8 5.000 91
i46 3.516 1.134 56.918 -0.582 -0.307 1.000 24 5.000 67
i48 3.641 0.922 72.503 -0.672 0.522 1.000 10 5.000 51
i49 3.368 1.145 54.006 -0.421 -0.529 1.000 27 5.000 55
i52 3.377 0.972 63.808 -0.306 -0.126 1.000 13 5.000 39
i54 3.457 1.128 56.253 -0.480 -0.474 1.000 22 5.000 61
i56 3.377 1.016 60.988 -0.381 -0.184 1.000 17 5.000 42
i57 3.365 1.123 54.983 -0.325 -0.584 1.000 22 5.000 56
i58 2.691 1.032 47.872 0.336 -0.307 1.000 38 5.000 19
i59 3.454 0.909 69.767 -0.377 0.193 1.000 10 5.000 37
i60 3.433 1.116 56.456 -0.490 -0.364 1.000 24 5.000 57
i61 2.887 1.123 47.199 0.122 -0.669 1.000 38 5.000 30
i63 3.460 1.120 56.695 -0.557 -0.388 1.000 23 5.000 56
i64 3.706 1.023 66.481 -0.710 0.170 1.000 13 5.000 75

270
SRI LANKA
Total Sample Size = 587
Univariate Summary Statistics for Continuous Variables
Variable Mean St. Dev. T-Value Skewness Kurtosis Minimum Freq. Maximum Freq. -------- ---- -------- ------- -------- -------- ------- ----- ------- ----- i1 3.927 0.741 128.373 -0.539 0.900 1.000 4 5.000 119 i2 3.804 0.851 108.292 -0.397 -0.071 1.000 4 5.000 123 i4 3.683 0.941 94.815 -0.513 -0.083 1.000 10 5.000 110 i5 3.922 0.833 114.093 -0.368 -0.319 1.000 2 5.000 155 i6 3.499 0.948 89.419 -0.022 -0.398 1.000 10 5.000 103 i7 3.462 0.995 84.311 -0.170 -0.442 1.000 15 5.000 97 i8 3.470 0.901 93.264 -0.282 -0.058 1.000 12 5.000 68 i9 3.482 0.867 97.299 -0.047 -0.229 1.000 6 5.000 73 i10 3.232 0.937 83.562 -0.314 -0.272 1.000 23 5.000 36 i11 3.307 0.898 89.190 -0.089 -0.403 1.000 9 5.000 48 i13 4.029 0.704 138.638 -0.541 0.873 1.000 2 5.000 139 i14 3.402 0.893 92.320 -0.013 -0.263 1.000 8 5.000 68 i15 3.516 0.812 104.884 -0.628 0.695 1.000 12 5.000 42 i16 3.230 0.949 82.446 -0.113 -0.395 1.000 18 5.000 48 i17 3.733 0.789 114.583 -0.637 0.680 1.000 5 5.000 75 i19 3.942 0.867 110.218 -0.662 0.369 1.000 6 5.000 161 i20 3.811 0.814 113.468 -0.613 0.662 1.000 6 5.000 104 i22 3.622 0.890 98.609 -0.466 0.129 1.000 10 5.000 85 i23 3.777 0.838 109.162 -0.572 0.493 1.000 7 5.000 104 i25 3.293 1.022 78.096 -0.312 -0.270 1.000 33 5.000 64 i26 3.336 0.837 96.512 -0.294 -0.058 1.000 10 5.000 33 i27 3.610 0.974 89.816 -0.667 0.103 1.000 18 5.000 90 i28 3.440 0.881 94.613 -0.529 0.304 1.000 17 5.000 47 i29 3.898 0.773 122.218 -0.535 0.404 1.000 2 5.000 118 i31 3.366 0.859 94.962 -0.051 -0.278 1.000 6 5.000 51 i32 3.535 0.974 87.922 -0.315 -0.255 1.000 15 5.000 98 i33 3.555 0.776 110.993 -0.405 0.400 1.000 6 5.000 48 i34 3.591 0.880 98.863 -0.852 0.932 1.000 19 5.000 59 i36 3.542 0.974 88.116 -0.680 0.092 1.000 21 5.000 73 i37 3.281 0.943 84.338 -0.329 -0.172 1.000 23 5.000 44 i38 3.801 0.739 124.673 -0.558 0.630 1.000 2 5.000 80 i39 3.421 0.731 113.390 -0.184 0.492 1.000 6 5.000 31 i41 3.634 0.849 103.713 -0.448 0.012 1.000 5 5.000 75 i42 3.361 0.803 101.470 -0.168 0.150 1.000 8 5.000 37 i43 3.714 0.730 123.329 -0.452 0.426 1.000 2 5.000 62 i44 3.814 0.843 109.583 -0.734 0.799 1.000 8 5.000 108 i45 3.913 0.730 129.813 -0.656 1.123 1.000 3 5.000 106 i46 3.460 0.931 90.051 -0.182 -0.290 1.000 11 5.000 78 i48 3.894 0.671 140.720 -0.556 1.241 1.000 2 5.000 86 i49 3.445 0.867 96.209 -0.207 0.002 1.000 10 5.000 60 i52 3.509 0.806 105.489 -0.237 0.123 1.000 6 5.000 54 i54 3.489 0.863 97.922 -0.517 0.216 1.000 12 5.000 50 i56 3.358 0.819 99.355 -0.332 0.380 1.000 13 5.000 35 i57 3.496 0.930 91.078 -0.192 -0.417 1.000 8 5.000 82 i58 3.172 1.010 76.102 0.129 -0.551 1.000 19 5.000 67 i59 3.593 0.772 112.685 -0.447 0.273 1.000 4 5.000 50 i60 3.664 0.908 97.802 -0.400 -0.048 1.000 9 5.000 104 i61 3.138 0.890 85.456 -0.230 -0.159 1.000 22 5.000 25 i63 3.802 0.791 116.398 -0.670 1.017 1.000 7 5.000 94 i64 3.831 0.822 112.877 -0.492 0.231 1.000 4 5.000 117

271
AUSTRALIAN (N=234) MATCHED TO NEW ZEALAND (N=234)
Total Sample Size = 234
Univariate Summary Statistics for Continuous Variables
Variable Mean St. Dev. T-Value Skewness Kurtosis Minimum Freq. Maximum Freq.
-------- ---- -------- ------- -------- -------- ------- ----- ------- -----
i1 3.979 0.511 119.052 -1.007 6.128 1.000 1 5.000 24
i2 3.799 0.692 83.988 -0.338 0.204 2.000 8 5.000 29
i4 3.692 0.735 76.854 -0.426 0.439 1.000 1 5.000 24
i5 4.098 0.551 113.778 -0.261 1.588 2.000 2 5.000 46
i6 3.231 0.734 67.329 0.002 0.253 1.000 2 5.000 8
i7 3.355 0.902 56.894 -0.231 -0.193 1.000 5 5.000 20
i8 3.598 0.748 73.623 -0.434 0.238 1.000 1 5.000 18
i9 3.671 0.838 67.002 -0.243 -0.037 1.000 2 5.000 37
i10 3.368 0.782 65.895 -0.368 -0.138 1.000 2 5.000 9
i11 3.376 0.846 61.018 -0.462 -0.095 1.000 4 5.000 12
i13 3.880 0.651 91.224 -0.254 0.246 2.000 4 5.000 33
i14 3.355 0.807 63.628 -0.138 -0.139 1.000 2 5.000 14
i15 3.496 0.719 74.360 -0.229 0.144 1.000 1 5.000 13
i16 3.885 0.741 80.209 -0.770 1.571 1.000 2 5.000 39
i17 3.590 0.637 86.172 -0.391 -0.010 2.000 10 5.000 9
i19 4.214 0.679 94.976 -0.790 1.297 2.000 6 5.000 78
i20 4.073 0.705 88.384 -0.622 1.170 1.000 1 5.000 61
i22 3.936 0.622 96.854 -0.498 1.140 2.000 5 5.000 33
i23 3.714 0.655 86.794 -0.367 0.251 2.000 8 5.000 18
i25 3.453 0.844 62.582 -0.197 -0.008 1.000 3 5.000 22
i26 3.560 0.734 74.150 -0.406 0.576 1.000 2 5.000 16
i27 4.026 0.635 97.032 -0.326 0.533 2.000 3 5.000 47
i28 3.265 0.751 66.463 -0.295 -0.524 1.000 1 5.000 4
i29 4.410 0.670 100.682 -0.790 -0.115 2.000 1 5.000 119
i31 3.312 0.798 63.520 -0.314 0.184 1.000 4 5.000 10
i32 3.833 0.804 72.962 -0.339 -0.035 1.000 1 5.000 47
i33 3.637 0.724 76.842 -0.761 1.439 1.000 3 5.000 16
i34 4.167 0.588 108.437 -0.306 0.907 2.000 2 5.000 61
i36 3.996 0.671 91.053 -0.510 0.786 2.000 6 5.000 46
i37 3.226 0.836 59.010 -0.225 -0.269 1.000 4 5.000 9
i38 3.850 0.641 91.874 -0.842 2.210 1.000 1 5.000 24
i39 3.556 0.628 86.661 -0.579 0.630 1.000 1 5.000 6
i41 3.791 0.696 83.360 -0.926 1.636 1.000 1 5.000 22
i42 3.487 0.809 65.945 -0.326 0.000 1.000 2 5.000 18
i43 4.248 0.577 112.579 -0.074 -0.430 3.000 17 5.000 75
i44 3.991 0.758 80.518 -0.581 0.316 2.000 10 5.000 56
i45 4.013 0.732 83.820 -0.284 -0.372 2.000 4 5.000 60
i46 3.957 0.763 79.359 -0.572 0.610 1.000 1 5.000 53
i48 4.085 0.730 85.568 -1.067 2.677 1.000 2 5.000 61
i49 3.585 0.799 68.635 -0.232 -0.108 1.000 1 5.000 25
i52 3.756 0.597 96.210 -0.343 0.357 2.000 4 5.000 16
i54 3.803 0.744 78.205 -0.485 0.231 2.000 13 5.000 33
i56 3.568 0.691 78.941 -0.601 0.487 1.000 1 5.000 10
i57 3.585 0.788 69.576 -0.073 -0.130 1.000 1 5.000 27
i58 3.004 0.816 56.346 -0.008 0.175 1.000 7 5.000 7
i59 3.744 0.603 95.028 -0.652 1.629 1.000 1 5.000 14
i60 3.812 0.717 81.347 -0.481 0.356 2.000 11 5.000 31
i61 3.521 0.771 69.894 -0.413 -0.019 1.000 1 5.000 15
i63 4.004 0.536 114.232 -0.333 1.819 2.000 2 5.000 32
i64 3.885 0.752 78.984 -0.112 -0.574 2.000 5 5.000 49

272
AUSTRALIAN (N=287) MATCHED TO USA (N=287)
Total Sample Size = 287
Univariate Summary Statistics for Continuous Variables
Variable Mean St. Dev. T-Value Skewness Kurtosis Minimum Freq. Maximum Freq. -------- ---- -------- ------- -------- -------- ------- ----- ------- ----- i1 4.017 0.498 136.681 -0.305 2.522 2.000 2 5.000 36 i2 3.843 0.709 91.774 -0.475 0.399 2.000 12 5.000 41 i4 3.704 0.738 85.007 -0.570 0.525 1.000 1 5.000 28 i5 4.052 0.574 119.608 -0.220 0.914 2.000 2 5.000 53 i6 3.247 0.732 75.109 -0.047 0.079 1.000 2 5.000 9 i7 3.470 0.900 65.347 -0.375 -0.157 1.000 5 5.000 29 i8 3.603 0.721 84.641 -0.364 0.249 1.000 1 5.000 21 i9 3.690 0.809 77.224 -0.372 0.150 1.000 2 5.000 40 i10 3.390 0.763 75.321 -0.316 -0.566 2.000 39 5.000 10 i11 3.460 0.769 76.186 -0.537 0.251 1.000 3 5.000 13 i13 3.857 0.656 99.583 -0.366 0.455 2.000 7 5.000 37 i14 3.401 0.859 67.086 -0.373 -0.052 1.000 5 5.000 20 i15 3.533 0.774 77.309 -0.566 0.433 1.000 3 5.000 18 i16 3.882 0.766 85.804 -0.922 1.750 1.000 3 5.000 48 i17 3.585 0.678 89.523 -0.888 1.047 1.000 2 5.000 9 i19 4.199 0.699 101.780 -0.851 1.325 2.000 9 5.000 95 i20 4.084 0.739 93.674 -0.711 0.985 1.000 1 5.000 81 i22 3.948 0.715 93.535 -0.906 2.118 1.000 2 5.000 51 i23 3.801 0.619 103.993 -0.110 -0.004 2.000 3 5.000 29 i25 3.425 0.865 67.058 -0.256 0.004 1.000 5 5.000 26 i26 3.557 0.777 77.534 -0.395 0.192 1.000 2 5.000 23 i27 3.937 0.666 100.147 -0.573 0.977 2.000 9 5.000 46 i28 3.289 0.773 72.064 -0.185 -0.242 1.000 2 5.000 10 i29 4.446 0.712 105.813 -1.536 3.622 1.000 2 5.000 156 i31 3.359 0.748 76.070 -0.089 0.386 1.000 3 5.000 15 i32 3.930 0.745 89.411 -0.347 -0.106 2.000 9 5.000 61 i33 3.666 0.704 88.163 -0.210 -0.084 2.000 13 5.000 26 i34 4.237 0.603 119.095 -0.927 4.620 1.000 2 5.000 88 i36 4.010 0.722 94.139 -0.634 1.018 1.000 1 5.000 66 i37 3.178 0.806 66.766 -0.133 -0.045 1.000 5 5.000 10 i38 3.951 0.595 112.464 -0.787 2.982 1.000 1 5.000 37 i39 3.592 0.589 103.281 -0.312 0.479 1.000 1 5.000 9 i41 3.812 0.689 93.701 -0.833 1.883 1.000 2 5.000 31 i42 3.481 0.775 76.119 -0.299 0.066 1.000 2 5.000 19 i43 4.206 0.600 118.796 -0.407 0.968 2.000 3 5.000 84 i44 4.038 0.777 88.071 -0.968 1.668 1.000 2 5.000 74 i45 4.063 0.692 99.491 -0.338 -0.058 2.000 4 5.000 74 i46 4.052 0.739 92.888 -0.659 0.873 1.000 1 5.000 76 i48 4.122 0.706 98.848 -1.016 2.700 1.000 2 5.000 79 i49 3.686 0.766 81.538 -0.433 0.463 1.000 2 5.000 33 i52 3.746 0.627 101.206 -0.435 0.460 2.000 8 5.000 21 i54 3.892 0.719 91.765 -0.577 0.912 1.000 1 5.000 48 i56 3.585 0.723 83.967 -0.971 1.441 1.000 4 5.000 12 i57 3.578 0.811 74.774 -0.553 0.904 1.000 6 5.000 28 i58 3.199 0.770 70.351 0.059 0.157 1.000 3 5.000 12 i59 3.787 0.542 118.370 -0.368 0.421 2.000 2 5.000 16 i60 3.885 0.722 91.122 -0.608 0.946 1.000 1 5.000 47 i61 3.547 0.727 82.668 -0.275 -0.198 2.000 22 5.000 18 i63 3.892 0.678 97.181 -1.150 2.996 1.000 2 5.000 35 i64 4.010 0.656 103.615 -0.310 0.290 2.000 4 5.000 59

273
AUSTRALIAN (N=320) MATCHED TO ITALY (N=320)
Total Sample Size = 320
Univariate Summary Statistics for Continuous Variables
Variable Mean St. Dev. T-Value Skewness Kurtosis Minimum Freq. Maximum Freq. -------- ---- -------- ------- -------- -------- ------- ----- ------- ----- i1 4.025 0.542 132.781 -0.693 4.108 1.000 1 5.000 46 i2 3.778 0.702 96.262 -0.044 -0.327 2.000 7 5.000 44 i4 3.659 0.708 92.468 -0.791 1.349 1.000 3 5.000 21 i5 4.100 0.573 127.960 -0.197 0.830 2.000 2 5.000 68 i6 3.272 0.794 73.671 -0.111 -0.165 1.000 3 5.000 14 i7 3.397 0.945 64.333 -0.172 -0.432 1.000 6 5.000 37 i8 3.603 0.748 86.142 -0.289 -0.181 2.000 24 5.000 27 i9 3.691 0.820 80.535 -0.232 -0.080 1.000 2 5.000 50 i10 3.341 0.867 68.914 -0.313 -0.441 1.000 4 5.000 18 i11 3.416 0.849 72.001 -0.539 -0.103 1.000 5 5.000 17 i13 3.891 0.651 106.917 -0.300 0.348 2.000 6 5.000 46 i14 3.425 0.860 71.202 -0.108 -0.275 1.000 3 5.000 31 i15 3.572 0.764 83.600 -0.498 0.721 1.000 4 5.000 25 i16 3.928 0.711 98.804 -0.737 1.639 1.000 2 5.000 56 i17 3.566 0.669 95.392 -0.558 0.395 1.000 1 5.000 12 i19 4.244 0.706 107.532 -0.815 0.891 2.000 8 5.000 120 i20 4.072 0.787 92.608 -0.633 0.318 1.000 1 5.000 99 i22 3.950 0.631 111.898 -0.788 2.868 1.000 2 5.000 47 i23 3.778 0.641 105.367 -0.408 0.466 2.000 9 5.000 29 i25 3.422 0.923 66.285 -0.190 -0.181 1.000 7 5.000 38 i26 3.503 0.788 79.542 -0.185 -0.016 1.000 2 5.000 27 i27 4.056 0.611 118.808 -0.362 0.912 2.000 4 5.000 65 i28 3.288 0.822 71.542 -0.236 -0.253 1.000 4 5.000 14 i29 4.441 0.701 113.277 -1.351 2.791 1.000 2 5.000 173 i31 3.353 0.821 73.047 -0.256 0.067 1.000 5 5.000 19 i32 3.856 0.798 86.392 -0.442 0.269 1.000 2 5.000 65 i33 3.663 0.767 85.446 -0.474 0.632 1.000 3 5.000 34 i34 4.234 0.661 114.576 -1.213 4.568 1.000 3 5.000 105 i36 3.975 0.763 93.172 -0.511 0.343 1.000 1 5.000 77 i37 3.184 0.834 68.265 -0.162 -0.384 1.000 5 5.000 11 i38 3.894 0.663 104.996 -0.658 1.533 1.000 1 5.000 44 i39 3.575 0.624 102.491 -0.248 0.354 1.000 1 5.000 13 i41 3.775 0.751 89.948 -0.634 0.632 1.000 1 5.000 40 i42 3.459 0.818 75.648 -0.266 0.120 1.000 4 5.000 26 i43 4.209 0.584 128.834 -0.354 1.036 2.000 3 5.000 92 i44 3.994 0.823 86.823 -0.702 0.378 1.000 1 5.000 87 i45 4.062 0.719 101.123 -0.399 -0.084 2.000 6 5.000 87 i46 3.987 0.734 97.156 -0.459 0.148 2.000 10 5.000 74 i48 4.112 0.690 106.592 -0.784 1.719 1.000 1 5.000 86 i49 3.656 0.792 82.563 -0.334 0.340 1.000 3 5.000 40 i52 3.722 0.629 105.833 -0.542 0.539 2.000 11 5.000 20 i54 3.825 0.752 91.038 -0.325 -0.085 2.000 14 5.000 53 i56 3.656 0.653 100.101 -0.459 0.218 2.000 14 5.000 18 i57 3.600 0.797 80.768 -0.125 -0.224 1.000 1 5.000 38 i58 2.978 0.797 66.808 -0.035 0.084 1.000 9 5.000 7 i59 3.772 0.572 117.974 -0.469 1.336 1.000 1 5.000 20 i60 3.822 0.706 96.885 -0.326 0.122 2.000 11 5.000 45 i61 3.491 0.772 80.915 -0.483 0.036 1.000 2 5.000 17 i63 3.975 0.623 114.142 -0.688 1.770 2.000 9 5.000 49 i64 3.900 0.740 94.246 -0.445 0.169 2.000 13 5.000 60

274
AUSTRALIAN (N=290) MATCHED TO SOUTH AFRICA WHITE (N=290)
Total Sample Size = 290
Univariate Summary Statistics for Continuous Variables
Variable Mean St. Dev. T-Value Skewness Kurtosis Minimum Freq. Maximum Freq. -------- ---- -------- ------- -------- -------- ------- ----- ------- ----- i1 4.014 0.532 128.364 -0.124 1.108 2.000 1 5.000 42 i2 3.821 0.717 90.713 -0.287 0.002 2.000 10 5.000 43 i4 3.690 0.802 78.306 -0.675 0.680 1.000 3 5.000 33 i5 4.059 0.623 111.023 -0.386 0.849 2.000 4 5.000 61 i6 3.255 0.822 67.464 -0.315 0.377 1.000 8 5.000 13 i7 3.490 0.908 65.421 -0.290 -0.425 1.000 3 5.000 33 i8 3.590 0.730 83.696 -0.368 0.189 1.000 1 5.000 21 i9 3.655 0.851 73.105 -0.256 -0.344 1.000 1 5.000 44 i10 3.341 0.898 63.344 -0.237 -0.626 1.000 3 5.000 20 i11 3.348 0.827 68.918 -0.504 0.097 1.000 6 5.000 12 i13 3.893 0.633 104.786 -0.406 0.725 2.000 6 5.000 38 i14 3.476 0.845 70.053 -0.461 0.189 1.000 5 5.000 23 i15 3.600 0.757 80.988 -0.632 0.752 1.000 3 5.000 21 i16 3.872 0.749 88.003 -0.781 1.349 1.000 2 5.000 47 i17 3.548 0.710 85.065 -0.667 0.609 1.000 2 5.000 12 i19 4.245 0.729 99.149 -1.008 1.726 1.000 1 5.000 111 i20 4.052 0.772 89.380 -0.771 0.901 1.000 1 5.000 80 i22 3.886 0.733 90.295 -0.934 2.145 1.000 3 5.000 45 i23 3.772 0.663 96.917 -0.286 0.190 2.000 8 5.000 30 i25 3.400 0.868 66.726 -0.169 -0.026 1.000 5 5.000 27 i26 3.559 0.784 77.326 -0.261 -0.110 1.000 1 5.000 26 i27 3.972 0.700 96.582 -0.936 2.417 1.000 2 5.000 53 i28 3.324 0.827 68.471 -0.222 -0.287 1.000 3 5.000 15 i29 4.400 0.748 100.203 -1.354 2.453 1.000 2 5.000 153 i31 3.307 0.856 65.799 0.032 0.062 1.000 5 5.000 25 i32 3.814 0.815 79.692 -0.418 -0.009 1.000 1 5.000 55 i33 3.707 0.721 87.597 -0.333 0.343 1.000 1 5.000 31 i34 4.228 0.663 108.611 -1.006 3.306 1.000 2 5.000 96 i36 3.993 0.776 87.640 -0.794 1.443 1.000 3 5.000 71 i37 3.197 0.903 60.264 -0.030 -0.522 1.000 5 5.000 18 i38 3.900 0.686 96.780 -0.840 2.188 1.000 2 5.000 42 i39 3.552 0.680 88.917 -0.288 0.275 1.000 1 5.000 15 i41 3.783 0.752 85.693 -0.997 1.753 1.000 3 5.000 32 i42 3.541 0.739 81.562 -0.324 0.346 1.000 2 5.000 20 i43 4.262 0.583 124.587 -0.217 0.071 2.000 1 5.000 96 i44 4.014 0.840 81.367 -0.908 0.943 1.000 2 5.000 81 i45 4.062 0.688 100.513 -0.466 0.396 2.000 6 5.000 72 i46 3.952 0.779 86.400 -0.712 0.990 1.000 2 5.000 65 i48 4.134 0.690 101.980 -0.882 2.080 1.000 1 5.000 81 i49 3.590 0.807 75.758 -0.393 0.479 1.000 4 5.000 31 i52 3.738 0.650 97.938 -0.518 0.523 2.000 11 5.000 22 i54 3.731 0.800 79.409 -0.375 -0.196 2.000 22 5.000 42 i56 3.607 0.709 86.660 -0.442 0.012 2.000 20 5.000 18 i57 3.579 0.821 74.266 -0.408 0.373 1.000 4 5.000 31 i58 2.959 0.831 60.640 0.151 -0.288 1.000 6 5.000 8 i59 3.728 0.627 101.302 -0.487 1.033 1.000 1 5.000 20 i60 3.790 0.735 87.791 -0.331 0.008 2.000 13 5.000 41 i61 3.476 0.772 76.653 -0.373 -0.182 1.000 1 5.000 16 i63 3.848 0.664 98.732 -0.680 1.076 2.000 12 5.000 33 i64 3.845 0.739 88.547 -0.313 -0.060 2.000 11 5.000 49

275
AUSTRALIAN (N=337) MATCHED TO SOUTH AFRICA NON WHITE (N=337)
Total Sample Size = 337
Univariate Summary Statistics for Continuous Variables
Variable Mean St. Dev. T-Value Skewness Kurtosis Minimum Freq. Maximum Freq. -------- ---- -------- ------- -------- -------- ------- ----- ------- ----- i1 4.006 0.506 145.368 -0.267 2.074 2.000 2 5.000 42 i2 3.760 0.747 92.384 -0.223 -0.197 2.000 15 5.000 48 i4 3.671 0.772 87.243 -0.409 0.308 1.000 2 5.000 38 i5 4.095 0.605 124.265 -0.288 0.670 2.000 3 5.000 76 i6 3.270 0.870 68.985 -0.390 0.241 1.000 12 5.000 18 i7 3.457 0.889 71.375 -0.317 -0.097 1.000 6 5.000 34 i8 3.599 0.709 93.191 -0.507 0.318 1.000 1 5.000 20 i9 3.721 0.838 81.545 -0.353 0.225 1.000 4 5.000 58 i10 3.409 0.892 70.149 -0.243 -0.637 1.000 2 5.000 28 i11 3.383 0.794 78.249 -0.365 -0.148 1.000 3 5.000 15 i13 3.955 0.628 115.705 -0.258 0.404 2.000 4 5.000 55 i14 3.475 0.849 75.157 -0.259 -0.214 1.000 3 5.000 31 i15 3.561 0.781 83.687 -0.448 0.317 1.000 3 5.000 27 i16 3.908 0.748 95.872 -0.963 1.725 1.000 2 5.000 56 i17 3.564 0.670 97.630 -0.414 0.309 1.000 1 5.000 15 i19 4.255 0.699 111.792 -0.765 1.008 1.000 1 5.000 130 i20 4.071 0.745 100.372 -0.507 0.031 2.000 9 5.000 97 i22 3.920 0.683 105.326 -1.025 2.952 1.000 3 5.000 49 i23 3.774 0.638 108.568 -0.248 0.186 2.000 7 5.000 32 i25 3.407 0.861 72.599 -0.186 0.039 1.000 6 5.000 31 i26 3.501 0.768 83.682 -0.461 0.267 1.000 3 5.000 20 i27 4.047 0.653 113.799 -0.822 2.384 1.000 1 5.000 69 i28 3.344 0.831 73.870 -0.216 -0.339 1.000 3 5.000 19 i29 4.350 0.745 107.136 -1.190 1.960 1.000 2 5.000 163 i31 3.291 0.771 78.400 0.037 -0.055 1.000 2 5.000 17 i32 3.798 0.780 89.424 -0.389 0.103 1.000 1 5.000 56 i33 3.647 0.718 93.306 -0.332 0.249 1.000 1 5.000 29 i34 4.237 0.648 120.077 -0.935 3.164 1.000 2 5.000 112 i36 3.923 0.794 90.662 -0.614 0.403 1.000 1 5.000 74 i37 3.163 0.869 66.784 -0.077 -0.328 1.000 7 5.000 16 i38 3.938 0.626 115.464 -0.467 1.004 2.000 7 5.000 49 i39 3.540 0.663 98.015 -0.271 0.232 1.000 1 5.000 15 i41 3.745 0.813 84.564 -0.872 1.025 1.000 4 5.000 42 i42 3.469 0.802 79.436 -0.421 0.177 1.000 4 5.000 22 i43 4.261 0.595 131.431 -0.415 0.795 2.000 3 5.000 112 i44 3.985 0.840 87.121 -0.730 0.630 1.000 3 5.000 94 i45 4.009 0.709 103.777 -0.365 0.022 2.000 7 5.000 79 i46 3.985 0.730 100.252 -0.486 0.510 1.000 1 5.000 77 i48 4.065 0.712 104.745 -0.791 1.495 1.000 1 5.000 84 i49 3.540 0.786 82.655 -0.281 0.211 1.000 3 5.000 30 i52 3.718 0.655 104.182 -0.527 0.465 2.000 14 5.000 24 i54 3.700 0.792 85.774 -0.352 -0.203 2.000 26 5.000 44 i56 3.629 0.687 96.957 -0.584 0.205 2.000 22 5.000 18 i57 3.493 0.791 81.055 -0.175 0.124 1.000 3 5.000 29 i58 2.914 0.857 62.453 0.052 -0.045 1.000 14 5.000 10 i59 3.772 0.586 118.137 -0.266 0.250 2.000 4 5.000 24 i60 3.730 0.704 97.292 -0.288 0.038 2.000 14 5.000 36 i61 3.469 0.820 77.658 -0.405 -0.256 1.000 2 5.000 22 i63 3.914 0.651 110.328 -0.499 0.861 2.000 9 5.000 49 i64 3.875 0.750 94.915 -0.347 -0.070 2.000 13 5.000 63
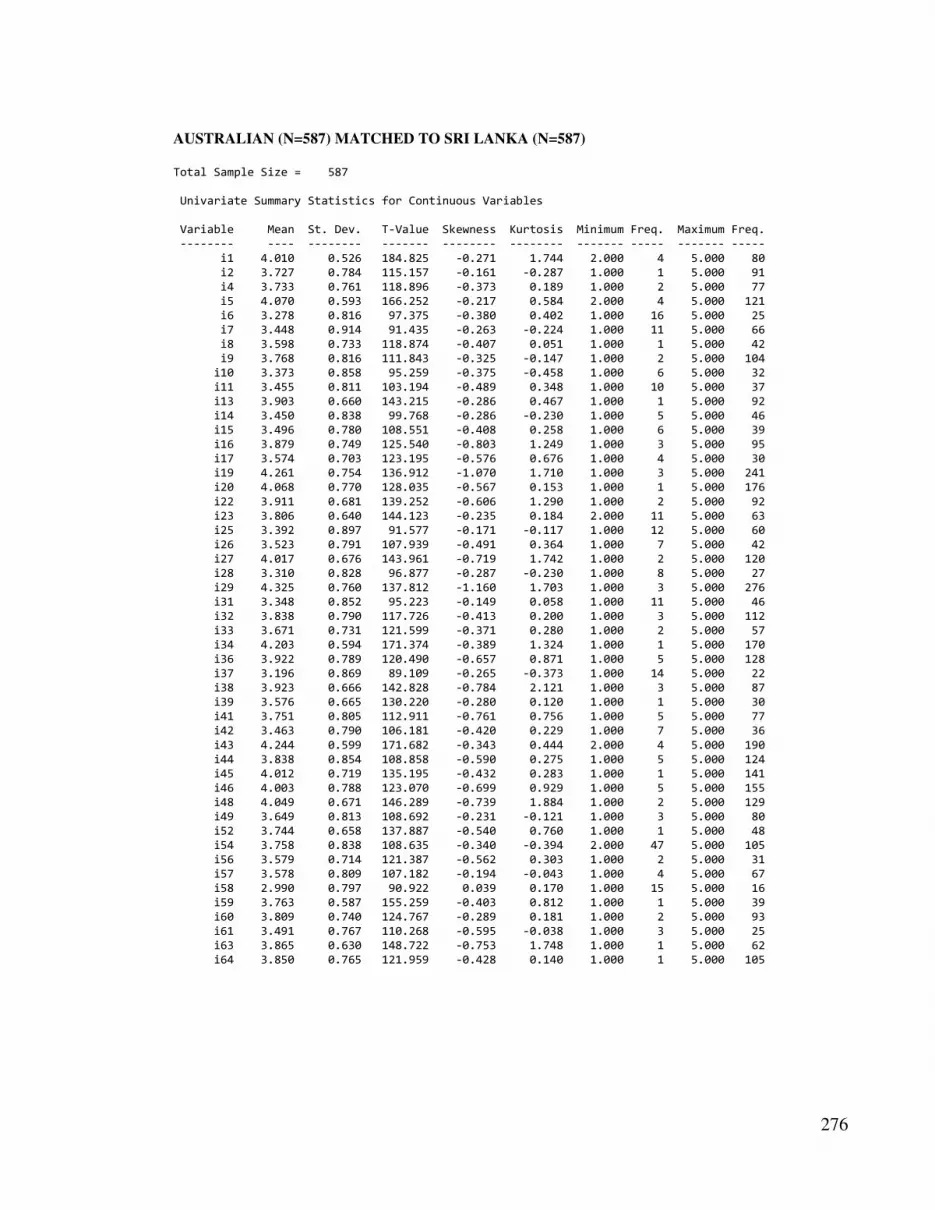
276
AUSTRALIAN (N=587) MATCHED TO SRI LANKA (N=587)
Total Sample Size = 587
Univariate Summary Statistics for Continuous Variables
Variable Mean St. Dev. T-Value Skewness Kurtosis Minimum Freq. Maximum Freq. -------- ---- -------- ------- -------- -------- ------- ----- ------- ----- i1 4.010 0.526 184.825 -0.271 1.744 2.000 4 5.000 80 i2 3.727 0.784 115.157 -0.161 -0.287 1.000 1 5.000 91 i4 3.733 0.761 118.896 -0.373 0.189 1.000 2 5.000 77 i5 4.070 0.593 166.252 -0.217 0.584 2.000 4 5.000 121 i6 3.278 0.816 97.375 -0.380 0.402 1.000 16 5.000 25 i7 3.448 0.914 91.435 -0.263 -0.224 1.000 11 5.000 66 i8 3.598 0.733 118.874 -0.407 0.051 1.000 1 5.000 42 i9 3.768 0.816 111.843 -0.325 -0.147 1.000 2 5.000 104 i10 3.373 0.858 95.259 -0.375 -0.458 1.000 6 5.000 32 i11 3.455 0.811 103.194 -0.489 0.348 1.000 10 5.000 37 i13 3.903 0.660 143.215 -0.286 0.467 1.000 1 5.000 92 i14 3.450 0.838 99.768 -0.286 -0.230 1.000 5 5.000 46 i15 3.496 0.780 108.551 -0.408 0.258 1.000 6 5.000 39 i16 3.879 0.749 125.540 -0.803 1.249 1.000 3 5.000 95 i17 3.574 0.703 123.195 -0.576 0.676 1.000 4 5.000 30 i19 4.261 0.754 136.912 -1.070 1.710 1.000 3 5.000 241 i20 4.068 0.770 128.035 -0.567 0.153 1.000 1 5.000 176 i22 3.911 0.681 139.252 -0.606 1.290 1.000 2 5.000 92 i23 3.806 0.640 144.123 -0.235 0.184 2.000 11 5.000 63 i25 3.392 0.897 91.577 -0.171 -0.117 1.000 12 5.000 60 i26 3.523 0.791 107.939 -0.491 0.364 1.000 7 5.000 42 i27 4.017 0.676 143.961 -0.719 1.742 1.000 2 5.000 120 i28 3.310 0.828 96.877 -0.287 -0.230 1.000 8 5.000 27 i29 4.325 0.760 137.812 -1.160 1.703 1.000 3 5.000 276 i31 3.348 0.852 95.223 -0.149 0.058 1.000 11 5.000 46 i32 3.838 0.790 117.726 -0.413 0.200 1.000 3 5.000 112 i33 3.671 0.731 121.599 -0.371 0.280 1.000 2 5.000 57 i34 4.203 0.594 171.374 -0.389 1.324 1.000 1 5.000 170 i36 3.922 0.789 120.490 -0.657 0.871 1.000 5 5.000 128 i37 3.196 0.869 89.109 -0.265 -0.373 1.000 14 5.000 22 i38 3.923 0.666 142.828 -0.784 2.121 1.000 3 5.000 87 i39 3.576 0.665 130.220 -0.280 0.120 1.000 1 5.000 30 i41 3.751 0.805 112.911 -0.761 0.756 1.000 5 5.000 77 i42 3.463 0.790 106.181 -0.420 0.229 1.000 7 5.000 36 i43 4.244 0.599 171.682 -0.343 0.444 2.000 4 5.000 190 i44 3.838 0.854 108.858 -0.590 0.275 1.000 5 5.000 124 i45 4.012 0.719 135.195 -0.432 0.283 1.000 1 5.000 141 i46 4.003 0.788 123.070 -0.699 0.929 1.000 5 5.000 155 i48 4.049 0.671 146.289 -0.739 1.884 1.000 2 5.000 129 i49 3.649 0.813 108.692 -0.231 -0.121 1.000 3 5.000 80 i52 3.744 0.658 137.887 -0.540 0.760 1.000 1 5.000 48 i54 3.758 0.838 108.635 -0.340 -0.394 2.000 47 5.000 105 i56 3.579 0.714 121.387 -0.562 0.303 1.000 2 5.000 31 i57 3.578 0.809 107.182 -0.194 -0.043 1.000 4 5.000 67 i58 2.990 0.797 90.922 0.039 0.170 1.000 15 5.000 16 i59 3.763 0.587 155.259 -0.403 0.812 1.000 1 5.000 39 i60 3.809 0.740 124.767 -0.289 0.181 1.000 2 5.000 93 i61 3.491 0.767 110.268 -0.595 -0.038 1.000 3 5.000 25 i63 3.865 0.630 148.722 -0.753 1.748 1.000 1 5.000 62 i64 3.850 0.765 121.959 -0.428 0.140 1.000 1 5.000 105

277
APPENDIX 3
Descriptive statistics per subscale for the different SUEIT measurement models
This appendix includes the means, standard deviations and internal reliabilities per subscale
for the five and nine factor SUEIT measurement models fitted to each sample separately.
AUSTRALIAN SAMPLES A (N=1604) AND B (N=1605)
Australia (n=1604) Australia (n=1605)
Scale M SD α* N of
Items
M SD α* N of
Items
Emotional Recognition and
Expression
39.41 5.13 0.81 11 39.70 5.02 0.80 11
Understanding Emotions External 77.67 7.77 0.90 20 78.25 7.50 0.89 20
Emotions Direct Cognition 35.08 6.56 0.86 12 35.20 6.34 0.85 12
Emotional Management 43.20 5.49 0.84 12 43.39 5.40 0.83 12
Emotional Control 33.60 4.22 0.80 9 33.53 4.23 0.80 9
Total EI 228.97 20.45 0.72 5 228.97 20.45 0.75 5
Australia (n=1604) Australia (n=1605)
Scale M SD α* N of
Items
M SD α* N of
Items
Emotional Recognition 7.93 1.12 0.60 2 7.99 1.11 0.54 2
Personal Expression 18.09 3.15 0.83 5 18.19 3.07 0.81 5
Others Perception 13.39 2.53 0.77 4 13.51 2.39 0.73 4
Understanding Emotions External 70.21 7.22 0.90 18 70.77 6.97 0.89 18
Emotions Direct Cognition negative 14.73 4.02 0.86 6 14.66 3.94 0.85 6
Emotions Direct Cognition positive 20.36 3.34 0.72 6 20.54 3.33 0.71 6
Emotional Management Others 32.58 3.91 0.77 9 32.74 3.95 0.76 9
Emotional Control 14.33 2.37 0.77 4 14.35 2.36 0.77 4
Emotional Management Self 37.35 5.08 0.87 10 37.32 5.06 0.87 10
Total EI 228.97 20.45 0.74 7 230.08 20.52 0.76 7
Table 3.1
Five factor structure: subscale internal reliabilities, means and standard deviations for Australian split samples
*Alphas calculated after missing values were imputed
*Alphas calculated after missing values were imputed
Table 3.2
Nine factor structure: subscale internal reliabilities, means and standard deviations for Australian split samples

278
NEW ZEALAND (N=234)
New Zealand (n=234)
Scale M SD α* N of Items
Emotional Recognition and Expression 40.14 4.51 0.76 11
Understanding Emotions External 78.64 6.90 0.88 20
Emotions Direct Cognition 36.39 5.86 0.84 12
Emotional Management 43.35 5.12 0.83 12
Emotional Control 33.76 3.83 0.77 9
Total EI 232.27 18.07 0.70 5
Italy (n=320)
Scale M SD α* N of Items
Emotional Recognition 8.08 1.08 .57 2
Personal Expression 18.52 2.82 .78 5
Others Perception 13.54 2.29 .72 4
Understanding Emotions External 71.21 6.39 .87 18
Emotions Direct Cognition negative 15.35 3.79 .87 6
Emotions Direct Cognition positive 21.04 3.02 .68 6
Emotional Management Others 32.63 3.74 .75 9
Emotional Control 14.35 2.23 .74 4
Emotional Management Self 37.56 4.62 .85 10
Total EI 232.27 18.08 .72 7
Table 3.3
Five factor structure: subscale internal reliabilities, means and standard deviations for New-Zealand sample (n=234)
*Alphas calculated after missing values were imputed
Table 3.4
Nine factor structure: subscale internal reliabilities, means and standard deviations for NZ sample (n=234)
*Alphas calculated after missing values were imputed

279
UNITED STATES OF AMERICA
USA (n=287)
Scale M SD α* N of Items
Emotional Recognition and Expression 39.68 5.67 0.81 11
Understanding Emotions External 79.12 9.27 0.91 20
Emotions Direct Cognition 36.89 7.05 0.85 12
Emotional Management 43.32 6.25 0.84 12
Emotional Control 33.40 5.07 0.83 9
Total EI 232.42 24.52 0.77 5
Italy (n=320)
Scale M SD α* N of Items
Emotional Recognition 7.98 1.27 .600 2
Personal Expression 18.25 3.46 .812 5
Others Perception 13.45 2.73 .747 4
Understanding Emotions External 71.65 8.55 .912 18
Emotions Direct Cognition negative 15.60 4.34 .843 6
Emotions Direct Cognition positive 21.29 3.62 .725 6
Emotional Management Others 32.76 4.55 .772 9
Emotional Control 14.28 2.84 .803 4
Emotional Management Self 37.15 6.02 .891 10
Total EI 232.42 24.52 .767 7
Table 3.5
Five factor structure: subscale internal reliabilities, means and standard deviations for USA sample (n=287)
*Alphas calculated after missing values were imputed
Table 3.6
Nine factor structure: subscale internal reliabilities, means and standard deviations for USA sample (n=287)
*Alphas calculated after missing values were imputed

280
ITALIAN
Italy (n=320)
Scale M SD α* N of Items
Emotional Recognition and Expression 35.80 6.09 0.72 11
Understanding Emotions External 72.61 9.25 0.82 20
Emotions Direct Cognition 33.57 6.04 0.69 12
Emotional Management 38.52 4.86 0.48 12
Emotional Control 30.64 5.46 0.72 9
Total EI 211.14 19.98 0.59 5
Italy (n=320)
Scale M SD α* N of Items
Emotional Recognition 7.18 1.44 .33 2
Personal Expression 16.75 3.56 .65 5
Others Perception 11.86 3.32 .73 4
Understanding Emotions External 65.57 8.66 .82 18
Emotions Direct Cognition negative 14.79 3.96 .69 6
Emotions Direct Cognition positive 18.78 3.65 .57 6
Emotional Management Others 28.83 4.04 .47 9
Emotional Control 13.15 2.82 .59 4
Emotional Management Self 34.22 5.59 .69 10
Total EI 211.14 19.98 .60 7
Table 3.7
Five factor structure: subscale internal reliabilities, means and standard deviations for Italian sample (n=320)
*Alphas calculated after missing values were imputed
Table 3.8
Nine factor structure: subscale internal reliabilities, means and standard deviations for Italian sample (n=320)
*Alphas calculated after missing values were imputed

281
SOUTH AFRICA (WHITE)
South African White sample (n=290)
Scale M SD α* N of Items
Emotional Recognition and Expression 36.65 5.43 .76 11
Understanding Emotions External 73.61 9.19 .89 20
Emotions Direct Cognition 33.29 6.78 .81 12
Emotional Management 40.62 5.72 .78 12
Emotional Control 32.14 4.89 .76 9
Total EI 216.32 20.22 .59 5
Sri-Lanka (n=592)
Scale M SD α* N of Items
Emotional Recognition 7.37 1.28 .33 2
Personal Expression 16.69 3.14 .69 5
Others Perception 12.59 2.94 .82 4
Understanding Emotions External 66.81 8.41 .89 18
Emotions Direct Cognition negative 14.40 5.11 .89 6
Emotions Direct Cognition positive 18.89 3.25 .64 6
Emotional Management Others 30.61 4.257 .72 9
Emotional Control 34.8000 5.85771 .704 4
Emotional Management Self 7.3655 1.27967 .833 10
Total EI 216.3276 20.20722 609 7
Table 3.9
Five factor structure: subscale internal reliabilities, means and standard deviations for South African White sample (n=290)
*Alphas calculated after missing values were imputed
Table 3.10
Nine factor structure: subscale internal reliabilities, means and standard deviations for South African White sample (n=290)
*Alphas calculated after missing values were imputed

282
SOUTH AFRICA (NON-WHITE)
South African Non-White sample (n=337)
Scale M SD α* N of Items
Emotional Recognition and Expression 34.54 6.32 .74 11
Understanding Emotions External 70.36 10.77 .87 20
Emotions Direct Cognition 33.69 6.19 .65 12
Emotional Management 40.79 7.02 .76 12
Emotional Control 31.75 6.08 .79 9
Total EI 211.12 25.29 .70 5
Sri-Lanka (n=338)
Scale M SD α* N of Items
Emotional Recognition 7.05 1.45 .06 2
Personal Expression 16.03 3.59 .66 5
Others Perception 11.53 3.39 .74 4
Understanding Emotions External 63.61 9.78 .86 18
Emotions Direct Cognition negative 14.61 4.84 .76 6
Emotions Direct Cognition positive 19.21 3.67 .59 6
Emotional Management Others 30.71 4.93 .67 9
Emotional Control 13.81 3.15 .67 4
Emotional Management Self 35.04 7.22 .85 10
Total EI 211.02 25.29 .71 7
Table 3.11
Five factor structure: subscale internal reliabilities, means and standard deviations for South African Non-White sample (n=337)
*Alphas calculated after missing values were imputed
Table 3.12
Nine factor structure: subscale internal reliabilities, means and standard deviations for South African Non-White sample (n=337)
*Alphas calculated after missing values were imputed

283
SRI LANKA
Sri-Lanka (n=592)
Scale M SD α* N of Items
Emotional Recognition and Expression 37.84 4.83 0.69 11
Understanding Emotions External 73.97 8.13 0.84 20
Emotions Direct Cognition 33.27 4.94 0.64 12
Emotional Management 42.39 5.39 0.75 12
Emotional Control 31.90 4.58 0.72 9
Total EI 219.38 17.48 0.58 5
Sri-Lanka (n=592)
Scale M SD α* N of Items
Emotional Recognition 7.26 1.20 0.30 2
Personal Expression 17.59 3.03 0.69 5
Others Perception 12.99 2.67 0.73 4
Understanding Emotions External 66.64 7.40 0.83 18
Emotions Direct Cognition negative 13.47 3.52 0.69 6
Emotions Direct Cognition positive 19.81 2.81 0.46 6
Emotional Management Others 32.07 3.88 0.63 9
Emotional Control 13.98 2.56 0.65 4
Emotional Management Self 35.58 5.24 0.79 10
Total EI 219.41 17.47 0.60 7
Table 3.13
Five factor structure: subscale internal reliabilities, means and standard deviations for Sri-Lanka sample (n=587)
*Alphas calculated after missing values were imputed
Table 3.14
Nine factor structure: subscale internal reliabilities, means and standard deviations for Sri-Lanka sample (n=587)
*Alphas calculated after missing values were imputed

284
APPENDIX 4
SUEIT Tucker’s Phi results
This appendix contains the results of the Tucker’s Phi analyses that were conducted
separately for every SUIET subscale (based on measurement model M2b – that is five
subscales) and country (culture), with Australia as the reference group.
A two-step procedure was used to examine construct bias which is based on exploratory
factor analysis. In the first step the covariance matrices of the two cultural groups were
combined (weighted by sample size) in order to create a single, pooled data matrix.
Factor(s) derived from this pooled covariance matrix define the global solution, with which
the factor(s) obtained in the separate cultural groups were compared (after target rotation to
the pooled solution). The agreement was evaluated by means of the factor congruence
coefficient, Tucker’s phi (Van de Vijver & Leung, 1997).
AUSTRALIA AND NEW ZEALAND
SUEIT subscale
Tucker’s phi
Australia (n=234) New-Zealand (n=234)
Emotional Expression 0.998 0.997
Understanding Emotions External 0.997 0.996
Emotional Management Self 0.999 0.999
Emotional Management Others 0.999 0.999
Emotional Control 0.999 0.998
AUSTRALIA AND USA
SUEIT subscale
Tucker’s phi
Australia (n=287) USA (n=287)
Emotional Expression 0.998 0.999
Understanding Emotions External 0.997 0.998
Emotional Management Self 0.999 0.999
Emotional Management Others 0.996 0.998
Emotional Control 0.999 0.999
Table 4.1
Tucker’s phi results for Australia and New Zealand
Table 4.2
Tucker’s phi results for Australia and USA

285
AUSTRALIA AND ITALY
SUEIT subscale
Tucker’s phi
Australia (n=320) Italy (n=320)
Emotional Expression 0.982 0.985
Understanding Emotions External 0.990 0.993
Emotional Management Self 0.968 -0.908
Emotional Management Others 0.995 0.993
Emotional Control 0.994 0.995
AUSTRALIA AND SA WHITE
SUEIT subscale
Tucker’s phi
Australia (n=290) SA White (n=290)
Emotional Expression 0.993 0.993
Understanding Emotions External 0.997 0.998
Emotional Management Self 0.997 0.996
Emotional Management Others 0.994 0.995
Emotional Control 0.995 0.993
AUSTRALIA AND SA NON-WHITE
SUEIT subscale
Tucker’s phi
Australia (n=337) SA Non-White (n=337)
Emotional Expression 0.992 0.994
Understanding Emotions External 0.993 0.998
Emotional Management Self 0.986 0.990
Emotional Management Others 0.989 0.990
Emotional Control 0.995 0.997
Table 4.3
Tucker’s phi results for Australia and Italy
Table 4.4
Tucker’s phi results for Australia and SA White
Table 4.5
Tucker’s phi results for Australia and SA Non-White

286
AUSTRALIA AND SRI LANKA
SUEIT subscale
Tucker’s phi
Australia (n=587) SA Non-White (n=587)
Emotional Expression 0.997 0.992
Understanding Emotions External 0.995 0.996
Emotional Management Self 0.998 0.997
Emotional Management Others 0.994 0.986
Emotional Control 0.998 0.997
Table 4.6
Tucker’s phi results for Australia and Sri-Lanka
Recommended


