2018-07-09
1
CHAPTER 16
FINANCIAL LEVERAGE AND CAPITAL STRUCTURE
POLICY
Copyright © 2016 by McGraw-Hill Education. All rights reserved.
CHOOSING A CAPITAL STRUCTURE
• What is the primary goal of financial managers?
Maximize stockholder wealth
• We want to choose the capital structure that will maximize stockholder wealth
• We can maximize stockholder wealth by maximizing the value of the firm or minimizing the WACC
16-2
2018-07-09
2
CORPORATE BORROWING AND HOMEMADE LEVERAGE
• It is tempting to make a conclusion as follows:
– Because of the impact that financial leverage has
on both the expected return to stockholders and the
riskiness of the stock, capital structure is an important
consideration.
• Surprisingly, this conclusion is incorrect.
– The reason is that shareholders can adjust the
amount of financial leverage by borrowing and
lending on their own.
– This use of personal borrowing to alter the degree of
financial leverage is called homemade leverage.
16-3
CAPITAL STRUCTURE THEORY
• Modigliani and Miller (M&M)Theory of Capital Structure Proposition I – firm value
Proposition II – WACC
• The value of the firm is determined by the cash flows to the firm and the risk of the assets
• Changing firm value Change the risk of the cash flows
Change the cash flows16-4
2018-07-09
3
CAPITAL STRUCTURE THEORY UNDER THREE SPECIAL CASES
• Case I – Assumptions
No corporate or personal taxes
No bankruptcy costs
• Case II – Assumptions
Corporate taxes, but no personal taxes
No bankruptcy costs
• Case III – Assumptions
Corporate taxes, but no personal taxes
Bankruptcy costs
16-5
CASE I – PROPOSITIONS I AND II
• Proposition I
The value of the firm is NOT affected by changes in
the capital structure
The cash flows of the firm do not change; therefore,
value doesn’t change
• Proposition II
The WACC of the firm is NOT affected by capital
structure
16-6
2018-07-09
4
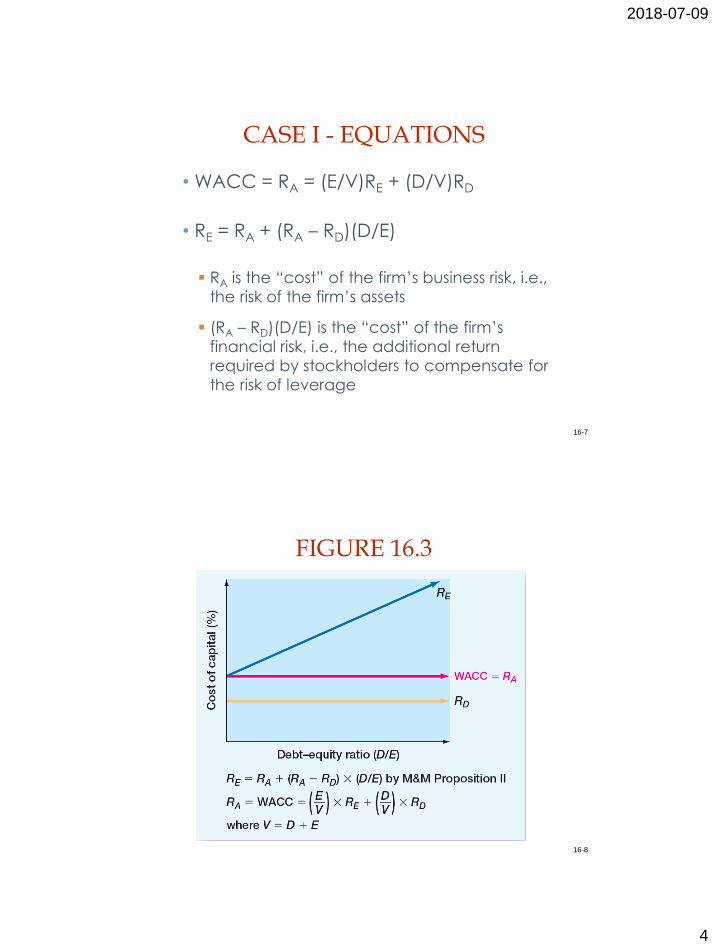
CASE I - EQUATIONS
• WACC = RA = (E/V)RE + (D/V)RD
• RE = RA + (RA – RD)(D/E)
RA is the “cost” of the firm’s business risk, i.e.,
the risk of the firm’s assets
(RA – RD)(D/E) is the “cost” of the firm’s
financial risk, i.e., the additional return
required by stockholders to compensate for
the risk of leverage
16-7
FIGURE 16.3
16-8
2018-07-09
5
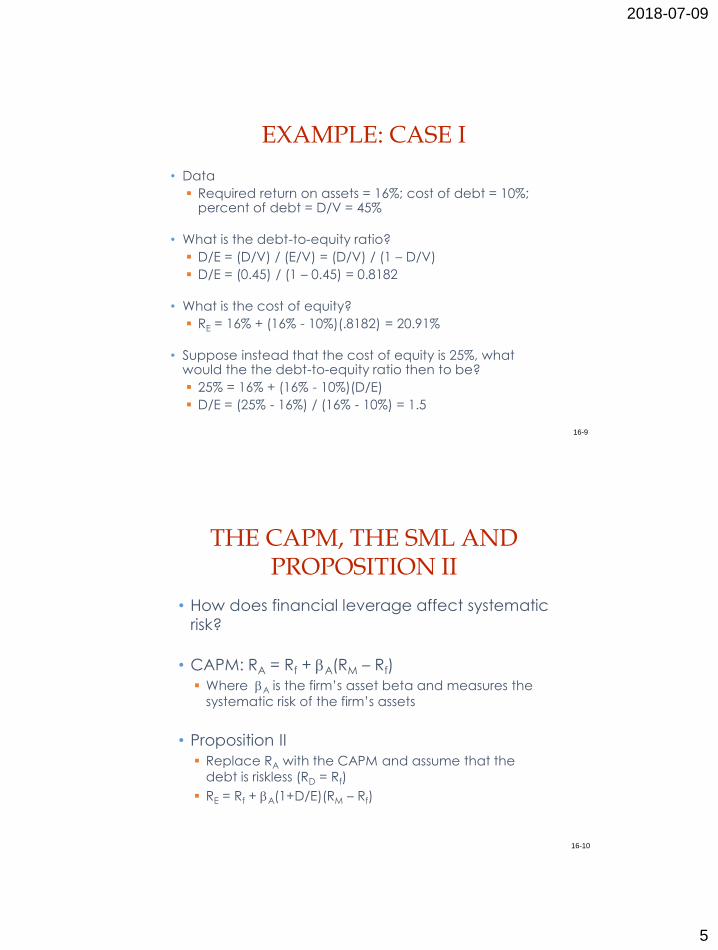
EXAMPLE: CASE I
• Data
Required return on assets = 16%; cost of debt = 10%; percent of debt = D/V = 45%
• What is the debt-to-equity ratio?
D/E = (D/V) / (E/V) = (D/V) / (1 – D/V)
D/E = (0.45) / (1 – 0.45) = 0.8182
• What is the cost of equity?
RE = 16% + (16% - 10%)(.8182) = 20.91%
• Suppose instead that the cost of equity is 25%, what would the the debt-to-equity ratio then to be?
25% = 16% + (16% - 10%)(D/E)
D/E = (25% - 16%) / (16% - 10%) = 1.5
16-9
THE CAPM, THE SML AND PROPOSITION II
• How does financial leverage affect systematic
risk?
• CAPM: RA = Rf + A(RM – Rf)
Where A is the firm’s asset beta and measures the
systematic risk of the firm’s assets
• Proposition II
Replace RA with the CAPM and assume that the
debt is riskless (RD = Rf)
RE = Rf + A(1+D/E)(RM – Rf)
16-10
2018-07-09
6
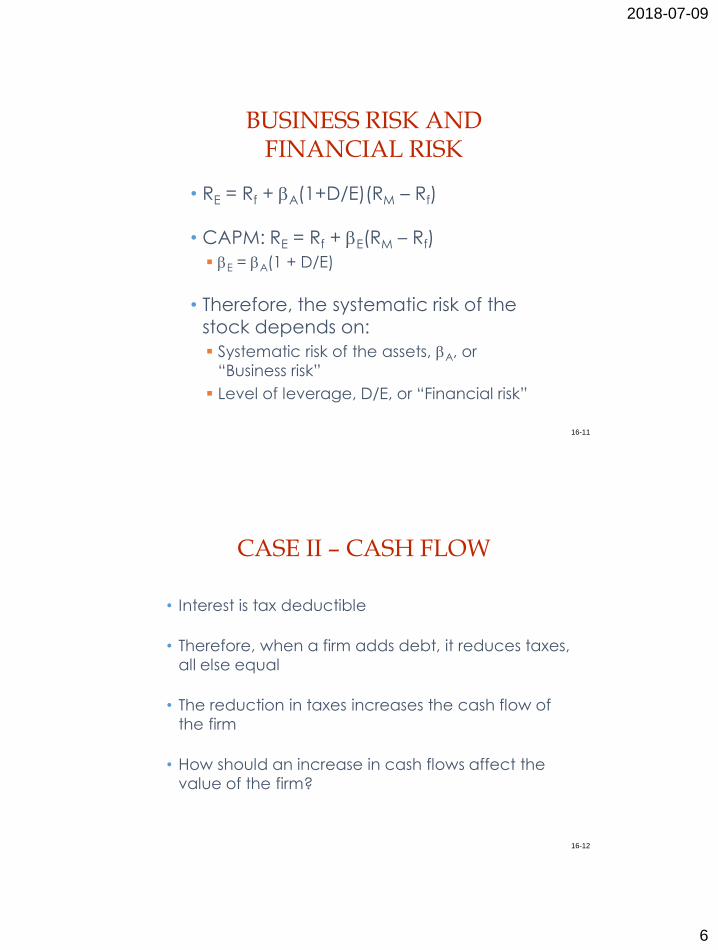
BUSINESS RISK AND FINANCIAL RISK
• RE = Rf + A(1+D/E)(RM – Rf)
• CAPM: RE = Rf + E(RM – Rf)
E = A(1 + D/E)
• Therefore, the systematic risk of the stock depends on:
Systematic risk of the assets, A, or
“Business risk”
Level of leverage, D/E, or “Financial risk”
16-11
CASE II – CASH FLOW
• Interest is tax deductible
• Therefore, when a firm adds debt, it reduces taxes,
all else equal
• The reduction in taxes increases the cash flow of
the firm
• How should an increase in cash flows affect the
value of the firm?
16-12
2018-07-09
7
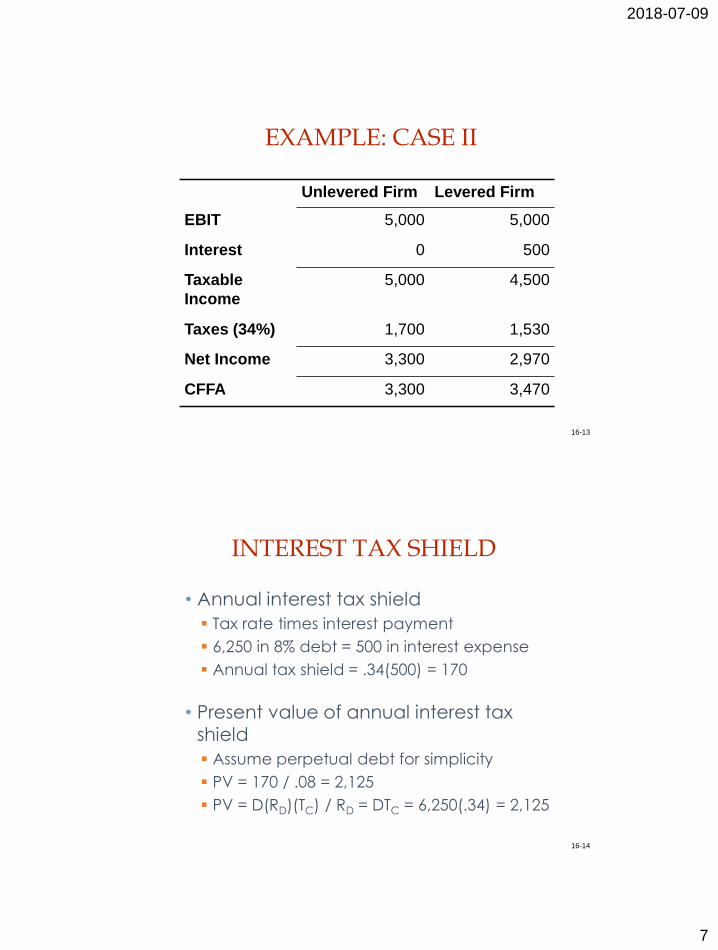
EXAMPLE: CASE II
Unlevered Firm Levered Firm
EBIT 5,000 5,000
Interest 0 500
Taxable
Income
5,000 4,500
Taxes (34%) 1,700 1,530
Net Income 3,300 2,970
CFFA 3,300 3,470
16-13
INTEREST TAX SHIELD
• Annual interest tax shield
Tax rate times interest payment
6,250 in 8% debt = 500 in interest expense
Annual tax shield = .34(500) = 170
• Present value of annual interest tax shield
Assume perpetual debt for simplicity
PV = 170 / .08 = 2,125
PV = D(RD)(TC) / RD = DTC = 6,250(.34) = 2,125
16-14
2018-07-09
8
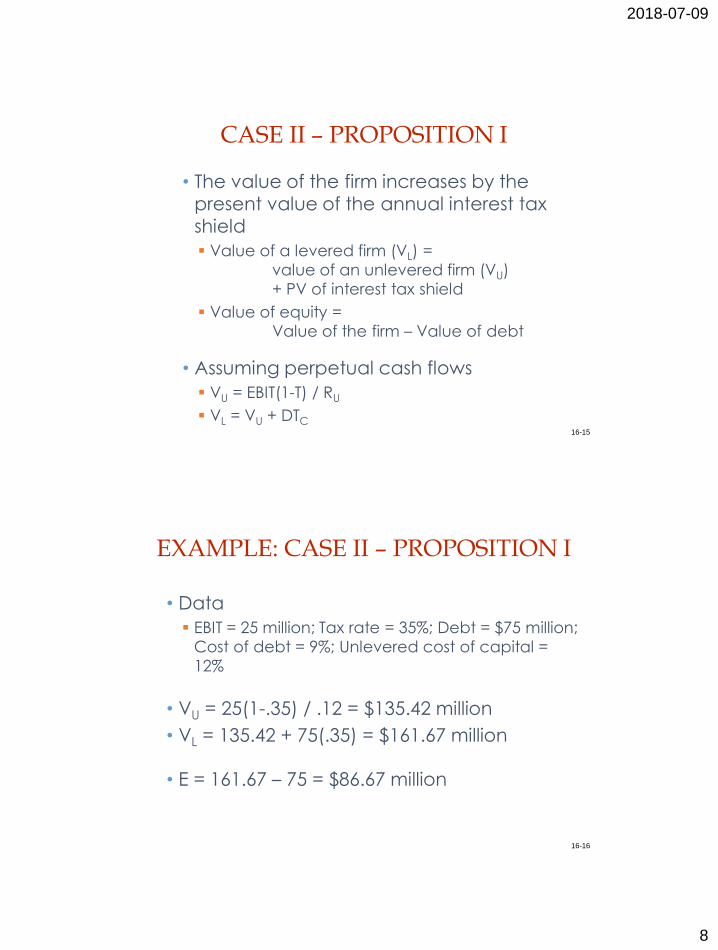
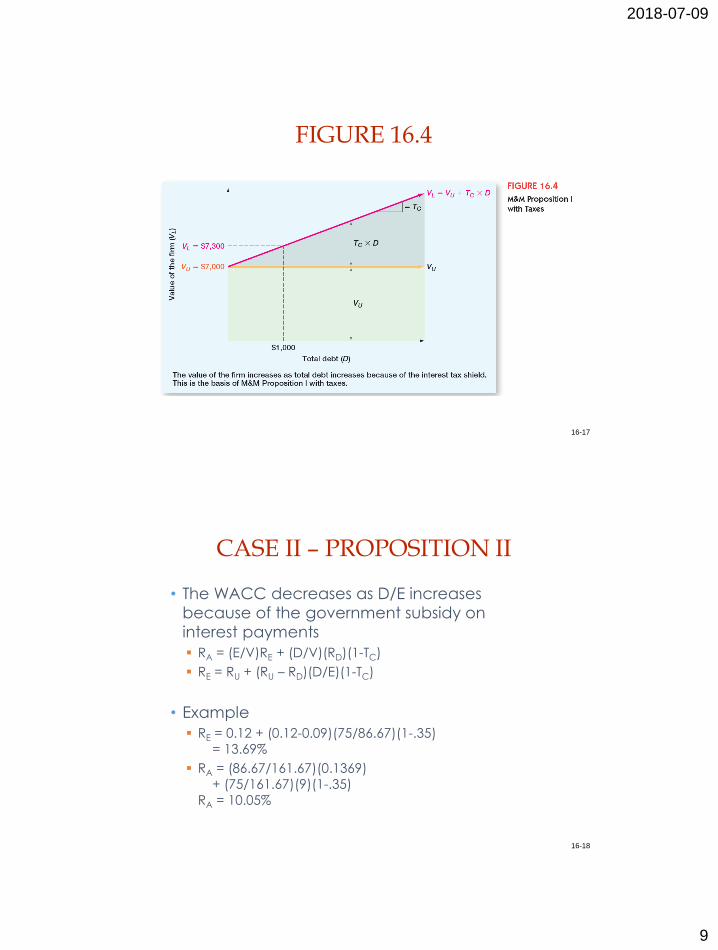
CASE II – PROPOSITION I
• The value of the firm increases by the present value of the annual interest tax shield
Value of a levered firm (VL) =
value of an unlevered firm (VU)
+ PV of interest tax shield
Value of equity =
Value of the firm – Value of debt
• Assuming perpetual cash flows
VU = EBIT(1-T) / RU
VL = VU + DTC16-15
EXAMPLE: CASE II – PROPOSITION I
• Data
EBIT = 25 million; Tax rate = 35%; Debt = $75 million;
Cost of debt = 9%; Unlevered cost of capital =
12%
• VU = 25(1-.35) / .12 = $135.42 million
• VL = 135.42 + 75(.35) = $161.67 million
• E = 161.67 – 75 = $86.67 million
16-16
2018-07-09
9
FIGURE 16.4
16-17
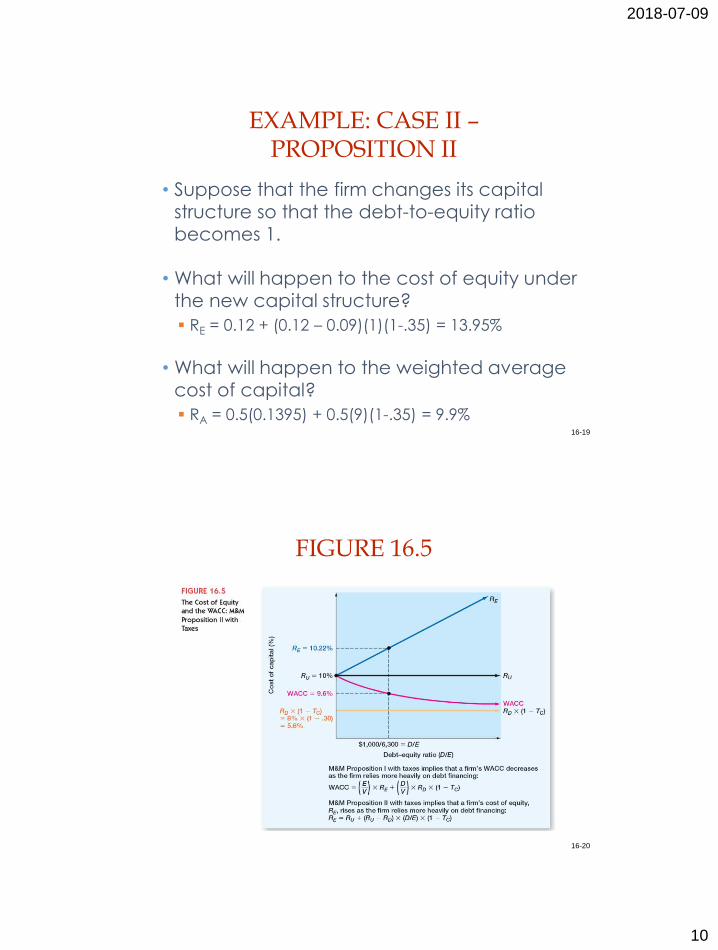
CASE II – PROPOSITION II
• The WACC decreases as D/E increases
because of the government subsidy on
interest payments
RA = (E/V)RE + (D/V)(RD)(1-TC)
RE = RU + (RU – RD)(D/E)(1-TC)
• Example
RE = 0.12 + (0.12-0.09)(75/86.67)(1-.35)
= 13.69%
RA = (86.67/161.67)(0.1369)
+ (75/161.67)(9)(1-.35)
RA = 10.05%
16-18
2018-07-09
10
EXAMPLE: CASE II –PROPOSITION II
• Suppose that the firm changes its capital structure so that the debt-to-equity ratio becomes 1.
• What will happen to the cost of equity under the new capital structure?
RE = 0.12 + (0.12 – 0.09)(1)(1-.35) = 13.95%
• What will happen to the weighted average cost of capital?
RA = 0.5(0.1395) + 0.5(9)(1-.35) = 9.9%16-19
FIGURE 16.5
16-20
2018-07-09
11
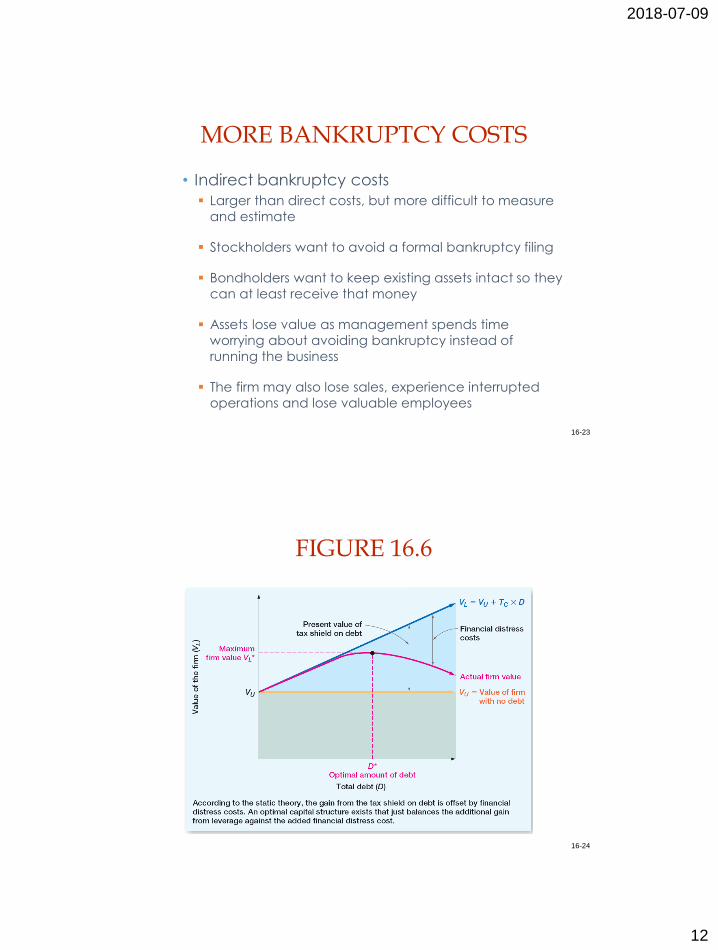
CASE III
• Now we add bankruptcy costs
• As the D/E ratio increases, the probability of bankruptcy increases
• This increased probability will increase the expected bankruptcy costs
• At some point, the additional value of the interest tax shield will be offset by the increase in expected bankruptcy cost
• At this point, the value of the firm will start to decrease, and the WACC will start to increase as more debt is added
16-21
BANKRUPTCY COSTS
• Direct costs
Legal and administrative costs
Ultimately cause bondholders to incur
additional losses
Disincentive to debt financing
• Financial distress
Significant problems in meeting debt
obligations
Firms that experience financial distress do
not necessarily file for bankruptcy
16-22
2018-07-09
12
MORE BANKRUPTCY COSTS
• Indirect bankruptcy costs
Larger than direct costs, but more difficult to measure
and estimate
Stockholders want to avoid a formal bankruptcy filing
Bondholders want to keep existing assets intact so they
can at least receive that money
Assets lose value as management spends time
worrying about avoiding bankruptcy instead of
running the business
The firm may also lose sales, experience interrupted
operations and lose valuable employees
16-23
FIGURE 16.6
16-24
2018-07-09
13
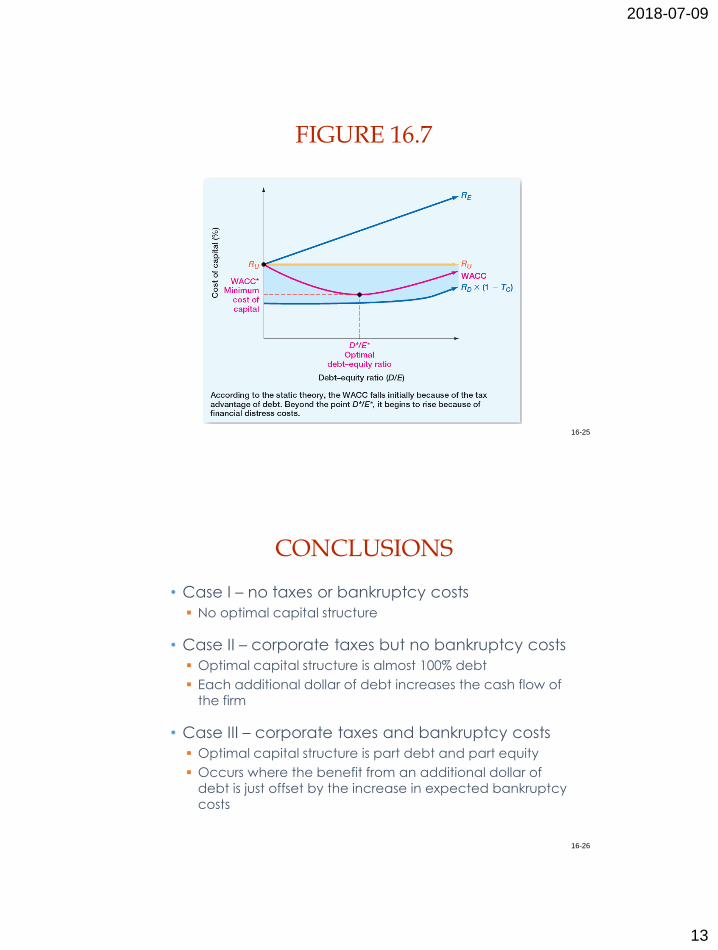
FIGURE 16.7
16-25
CONCLUSIONS
• Case I – no taxes or bankruptcy costs
No optimal capital structure
• Case II – corporate taxes but no bankruptcy costs
Optimal capital structure is almost 100% debt
Each additional dollar of debt increases the cash flow of
the firm
• Case III – corporate taxes and bankruptcy costs
Optimal capital structure is part debt and part equity
Occurs where the benefit from an additional dollar of
debt is just offset by the increase in expected bankruptcy
costs
16-26
2018-07-09
14
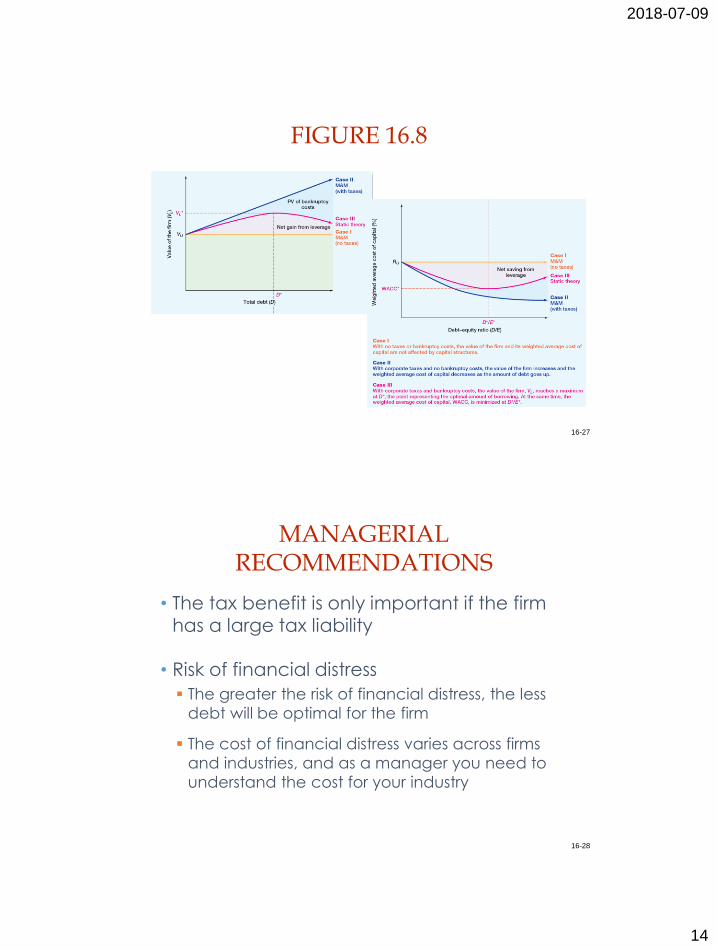
FIGURE 16.8
16-27
MANAGERIAL RECOMMENDATIONS
• The tax benefit is only important if the firm has a large tax liability
• Risk of financial distress
The greater the risk of financial distress, the less
debt will be optimal for the firm
The cost of financial distress varies across firms
and industries, and as a manager you need to
understand the cost for your industry
16-28
2018-07-09
15
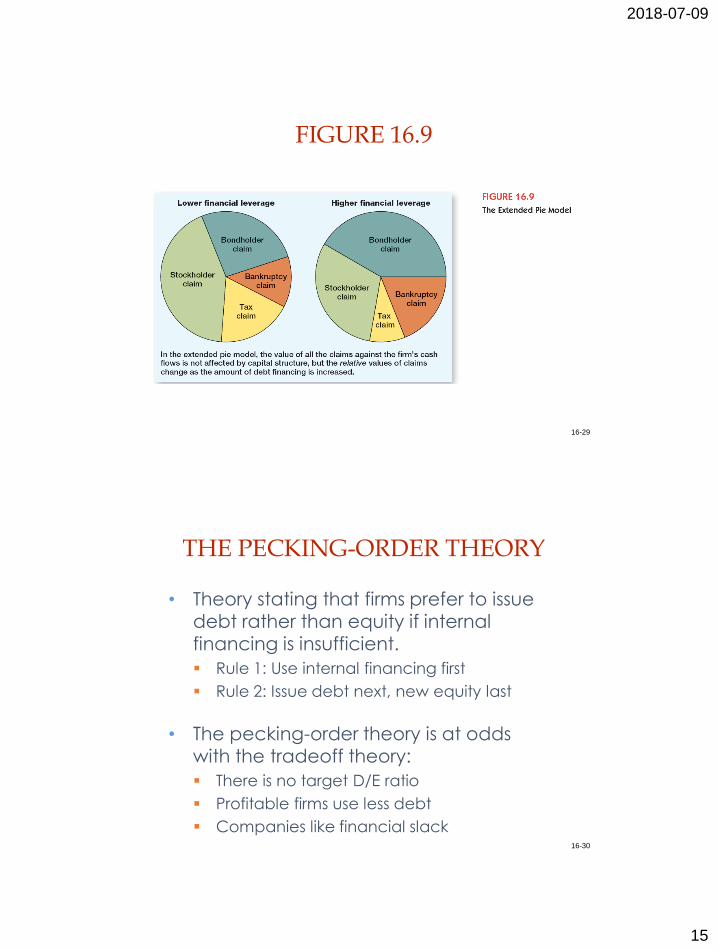
FIGURE 16.9
16-29
THE PECKING-ORDER THEORY
• Theory stating that firms prefer to issue debt rather than equity if internal financing is insufficient.
Rule 1: Use internal financing first
Rule 2: Issue debt next, new equity last
• The pecking-order theory is at odds with the tradeoff theory:
There is no target D/E ratio
Profitable firms use less debt
Companies like financial slack16-30
2018-07-09
16
OBSERVED CAPITAL STRUCTURE
• Capital structure does differ by industry
Lowest levels of debt• Drugs
• Computer s
Highest levels of debt• Electric utilities
• Paper
16-31
Recommended