
HATCH Technical Training – Finite Element Analysis
SEMC 2001: FEA Tests on a Simple Beam – Important Information for Users of FEA Software (by R.P. Prukl and P.M. Lopes)
htt-fea.the_cst2-10.doc Page 1 of 16 05/07/04 / 08:50 PM
Finite Element Analysis (FEA) Tests on a Simple Beam – Important Information for Users of FEA Software
by R.P. Prukl, Hatch Africa, Private Bag X20, Gallo Manor, 2052 RSA
P.M. Lopes, 18 Tulp Street, Brackenhurst, Alberton, 1448 RSA Nine years have passed since the FEMSA’92 Symposium (Finite Elements in South Africa) where R.P. Prukl presented a paper with the title “The CST (Constant Strain Triangle) – an insidious survivor from the infancy of FEA” [1]. The information contained in that paper is still very important for all users of finite element software but, unfortunately, the message has not been widely spread. The purpose of this present paper is to bring to the attention of the readers the contents of the paper presented at FEMSA ’92 and the results of further work that has been carried out: • Results from other FEA programs (Strand7 [12], Prokon [13]) were included and
compared with the results from Fesdec [11], • Other meshes and boundary conditions were investigated, • Other elements (plane stress, brick elements) were used. It should be noted that many of the 2-dimensional meshes used in this paper do not contain triangles only, but also triangles and quadrilaterals or quadrilaterals only. Compared with version 9, in this version 10 of this file all Prokon SF runs for shell elements were re-run on version 06/07/2001 of the Prokon SF program.
HATCH Technical Training – Finite Element Analysis
SEMC 2001: FEA Tests on a Simple Beam – Important Information for Users of FEA Software (by R.P. Prukl and P.M. Lopes)
htt-fea.the_cst2-10.doc Page 2 of 16 05/07/04 / 08:50 PM
1. INTRODUCTION
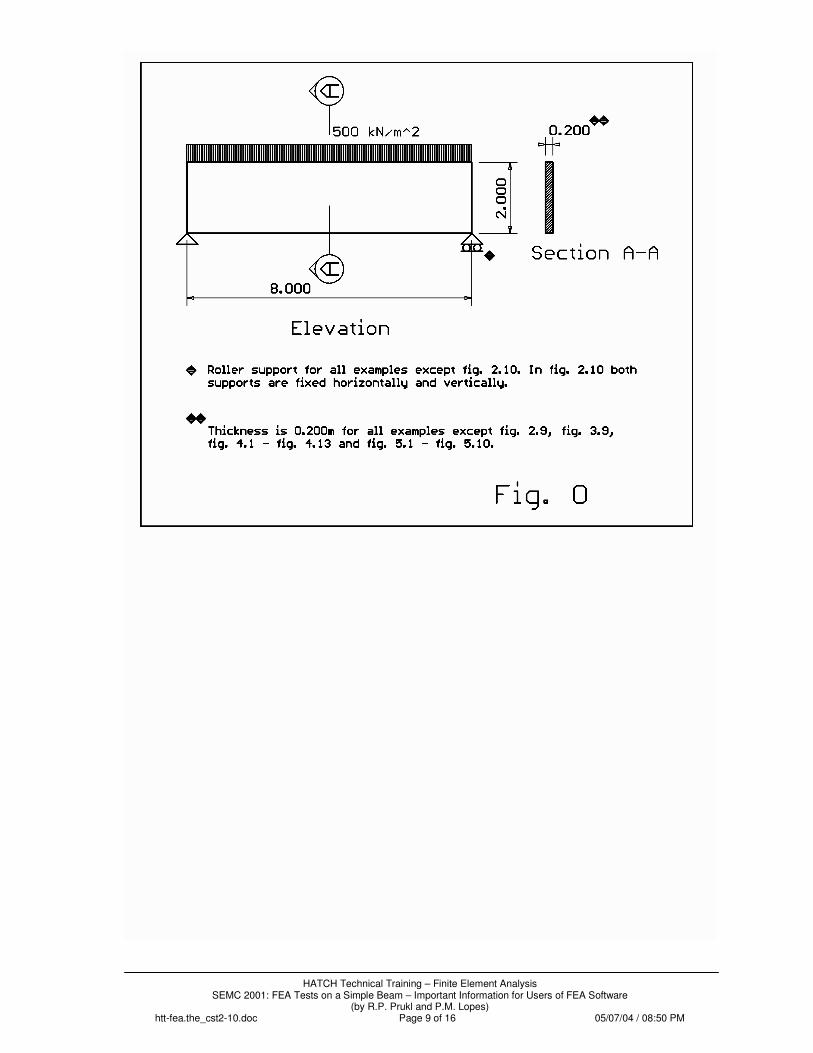
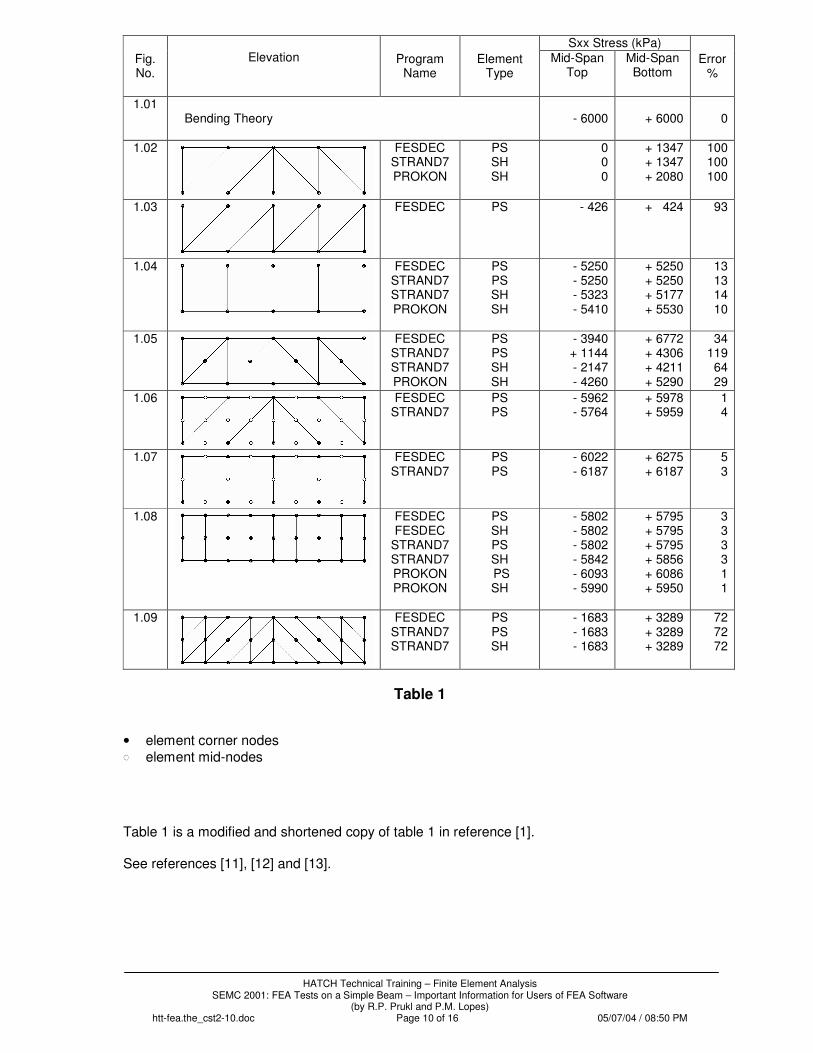
A concrete beam, 8m long, 2m high and 0,2m thick is loaded with a vertical u.d.l. of 100 kN/m at the top (see fig. 0). The material properties are: Young’s modulus 3,0 x 10⁷ kPa and Poisson’s ratio v = 0,2. The horizontal stresses at mid-span can easily be calculated manually using bending theory. They are –6000 kPa (compression) at the top and +6000 kPa (tension) at the bottom. Table 1 shows the results for various meshes from ref. [1]. In the “Element Type” column PS denotes plane stress elements, PN plane strain elements and SH shell elements. The definition of “Error” is as follows: Error = 100 * MAX ( ABS (1 + Sxx,top / 6000), ABS (1 - Sxx,bottom / 6000) ). The Fesdec results are identical for plane stress and shell elements, whereas both Strand7 and Prokon produce different results for different element types. The biggest differences in the “Error” column occur in fig. 1.05. The error for the run using the program Prokon Space Frame is only (!) 29 %, followed by 34% for Fesdec, 64% for Strand7 with shell elements and 119% for Strand7 with plane stress elements, where the program calculates tensile stresses not only at the bottom, but also at the top of the beam, where there is compression. It should be noted, however, that in fig. 1.05 the four-noded elements have been squashed into triangles, with one internal angle being 180 degrees whereas in most of the literature the recommended maximum internal angle is 135 degrees. One of our colleagues at Hatch, Bernard Potgieter, tried to run mesh 1.05 on MSC Nastran. The program however refused to analyse the structure because of the bad shape of the elements. Nevertheless, Prokon SF and Fesdec are very robust and can even handle this problem fairly well. Definitions for aspect ratio, skewness, tapers, convexity etc. as well as other important information can be found in ref. [2] to [10].
2. ADDITIONAL 2D-MESHES
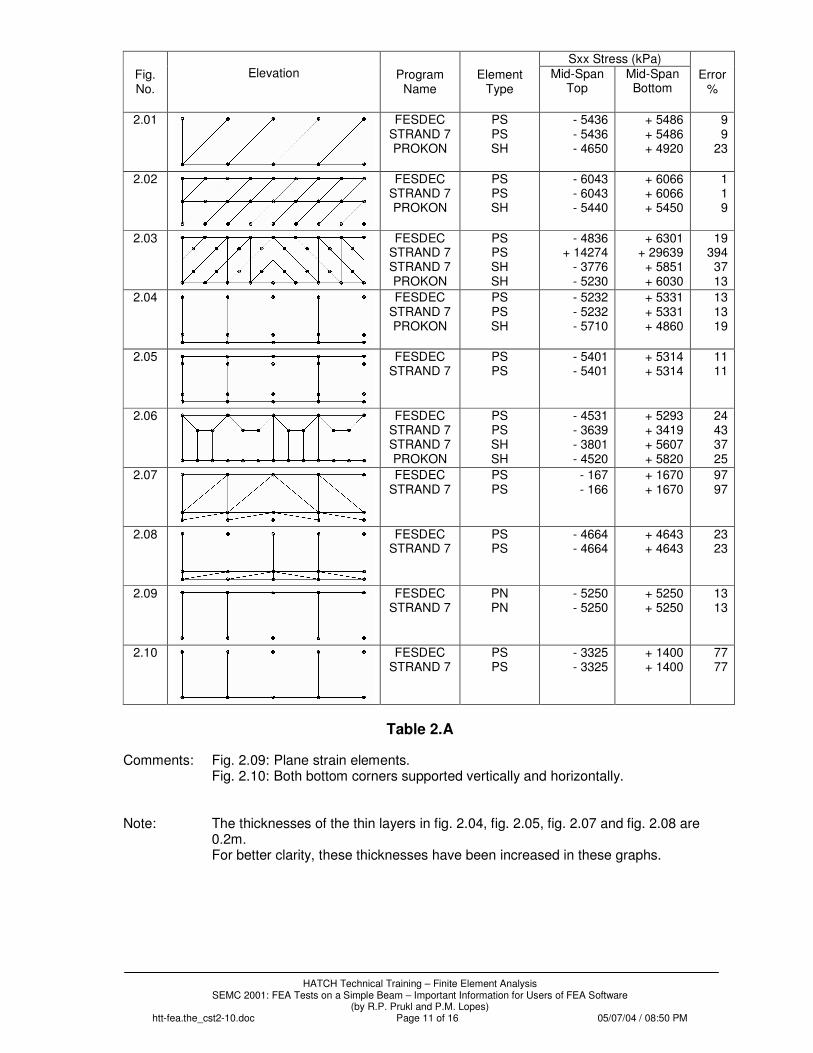
Additional meshes were tested and the results were summarised in table 2. Here are some comments: Fig. 2.01: This skew mesh, consisting of two triangles and three quadrilaterals, surprisingly
yields more accurate results (9% error) than the 4 squares in fig. 1.04 (13% error). Although one can deduce that the skewness of the elements does not affect the accuracy of the results badly, one must not, however, come to the conclusion that skewness is beneficial for accuracy. The Sxx stress contours in the vicinity of the triangular elements do not look very good. Plots of these stresses have not been included in this paper to keep the number of pages as low as possible. Such plots, however, can be obtained from the authors on request.
Fig. 2.02: Again, this skew mesh gives better results (1% error) than the square elements
(13% error) – see fig. 1.08. It must be made clear to the reader that the “maximum error” is based purely on the maximum error in the horizontal stresses at mid-span. No other stresses were investigated, nor were the deflections.
Fig. 2.03: This mesh is a refinement of the mesh in fig. 1.05. Compared with that mesh, the
Fesdec results improve from a 34% to a 19% error, the Strand7 shell results from 64% to 37%, the Prokon results from 29% to 13%, but the Strand7 plane stress results become much worse, they change from 119% to 394%. To summarise, Fesdec and Prokon can handle these extreme element shapes relatively well, the
HATCH Technical Training – Finite Element Analysis
SEMC 2001: FEA Tests on a Simple Beam – Important Information for Users of FEA Software (by R.P. Prukl and P.M. Lopes)
htt-fea.the_cst2-10.doc Page 3 of 16 05/07/04 / 08:50 PM
Strand7 shells give much greater errors and the Strand7 plane stress elements are unable to handle such distortions.
Fig. 2.04: It is not recommended to use elements with an aspect ratio greater than 4, but the
example shows that an additional layer of thin elements with an aspect ratio of 10 does not affect the accuracy of the Sxx stress results for Fesdec and Strand7.
Fig. 2.05: The comment for this figure is similar to the comment for fig. 2.04. Fig. 2.06: A big surprise! Who would have thought that the results would be much worse
than for the four square elements (fig. 1.04: 13%)? Fesdec now gives a 24% error, Prokon 25%, Strand7 shells 37% and Strand7 plane stress 43%. Such meshes are being promoted in literature to reduce the total number of nodes in a model, with a finer mesh at areas with higher stresses and a coarser mesh for less important areas. On page 63 in “Analytical modelling of structural systems” by Iain MacLeod [10] there is a very misleading rule: “Keep the number of nodes and elements to a minimum.” Why? There is no explanation given. The author must have been thinking in terms of available computer storage capacities forty years ago.
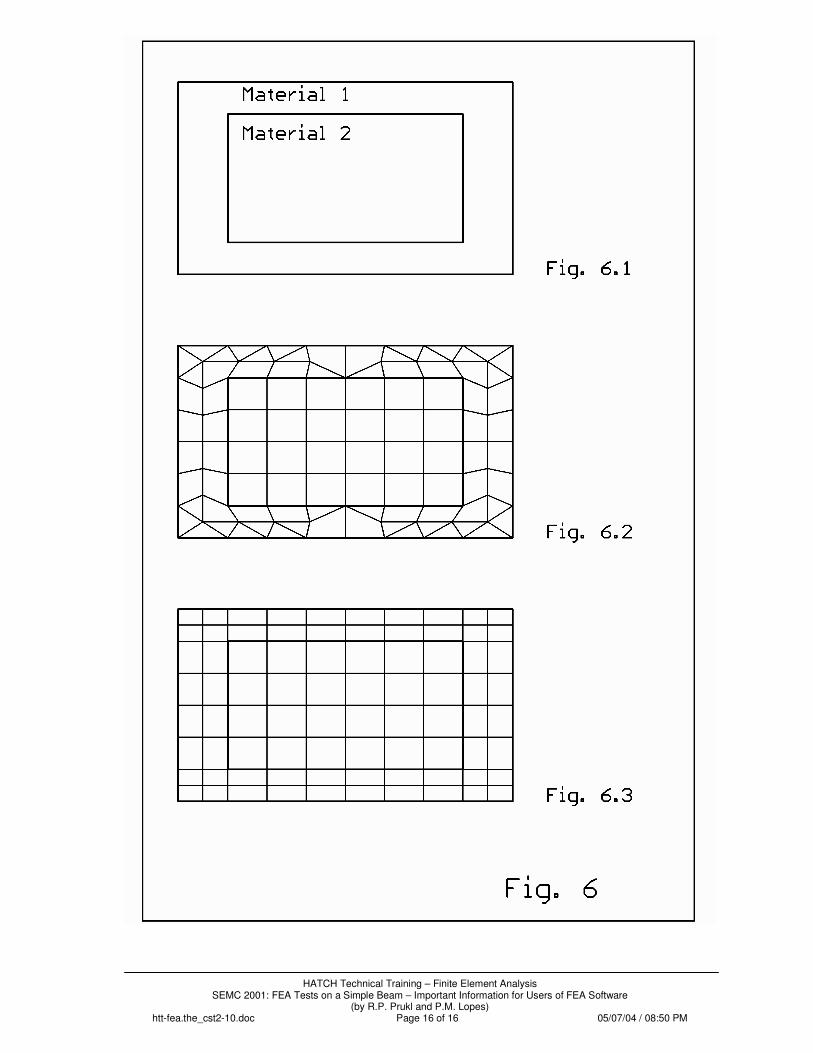
Take another example of misleading advice. On page 9 of “What every engineer should know about finite element analysis” by John R. Brauer [6] there is a plot of a complicated mesh of a rectangular section consisting of two different materials (see fig. 6.2). A simple rectangular mesh (fig. 6.3) would have been the logical answer, but that would have appeared too easy. How many users of FEA have been mislead by this picture, not knowing that quadrilateral elements are far superior to triangular ones? This is the curse of auto-meshing.
Fig. 2.07: The error of 97% is not unexpected. Fig. 2.08: To add triangular elements at the bottom of the beam is not a good idea. The error
increases from 13 to 23%. Fig. 2.09: In this model plane strain elements were used instead of plane stress elements.
The results are identical. Fig. 2.10: In this example both bottom corners were supported vertically and horizontally.
The difference in the stress results is therefore not surprising. An inexperienced user of FEA could easily make such a mistake (the right hand corner should not be supported horizontally). If the structure had been modelled with beam elements it would not have mattered for this load case whether the right hand support was only vertical or whether it was vertical and horizontal. When using two-dimensional elements, however, the additional horizontal support makes a big difference. Had the beam been loaded with a temperature load, the additional horizontal support would have also made a big difference if beam elements had been used.
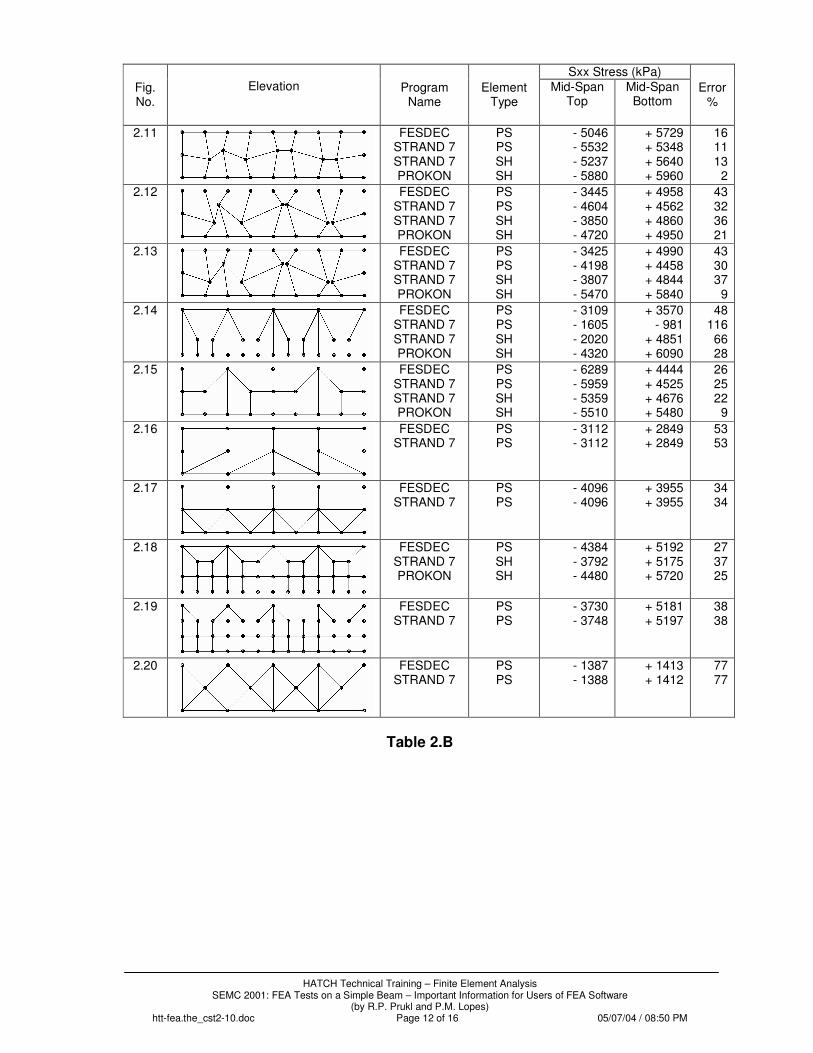
Fig. 2.11: Compared with fig. 1.08 the error increases from 3% to 16% in the Fesdec run and
from 3% to 13% in the Strand7 run using shell elements. Fig. 2.12: For this badly distorted mesh the errors are much worse than for fig. 2.11: Fesdec
36% error, Strand7 using shell elements 43% error, Prokon 21% error. Fig. 2.13: If the two elements in fig. 2.12 with internal angles of more than 180 degrees are
“repaired” (angles changed to less than 180 degrees), the errors in Fesdec and Strand7 do not change much, whereas the error in Prokon drops from 21% to 9%.
Fig. 2.14: What a disaster! Compared with fig. 2.06, the Fesdec error doubles (from 24% to
48%), the Strand7 plane stress elements are useless for this example (116% error: compression at the bottom of the beam instead of tension), the error for the
HATCH Technical Training – Finite Element Analysis
SEMC 2001: FEA Tests on a Simple Beam – Important Information for Users of FEA Software (by R.P. Prukl and P.M. Lopes)
htt-fea.the_cst2-10.doc Page 4 of 16 05/07/04 / 08:50 PM
Strand7 shell elements shoots up from 37% to 66% and only the Prokon elements behave relatively well (error increasing from 25% to 28%).
Fig. 2.15: Compared with fig. 2.14, the results are much more accurate. Fig. 2.16: The large errors (53%), caused by the triangular elements, are not unexpected. Fig. 2.17: Compared with fig. 2.16, the errors drop from 53% to 34%. Fig. 2.18: The errors are about the same as for fig. 2.06. Fig. 2.19: Due to the triangular elements the results are worse than for fig. 2.18. Fig. 2.20: As expected for triangular elements, the errors are very high (77%).
3. FURTHER 2D-MESHES
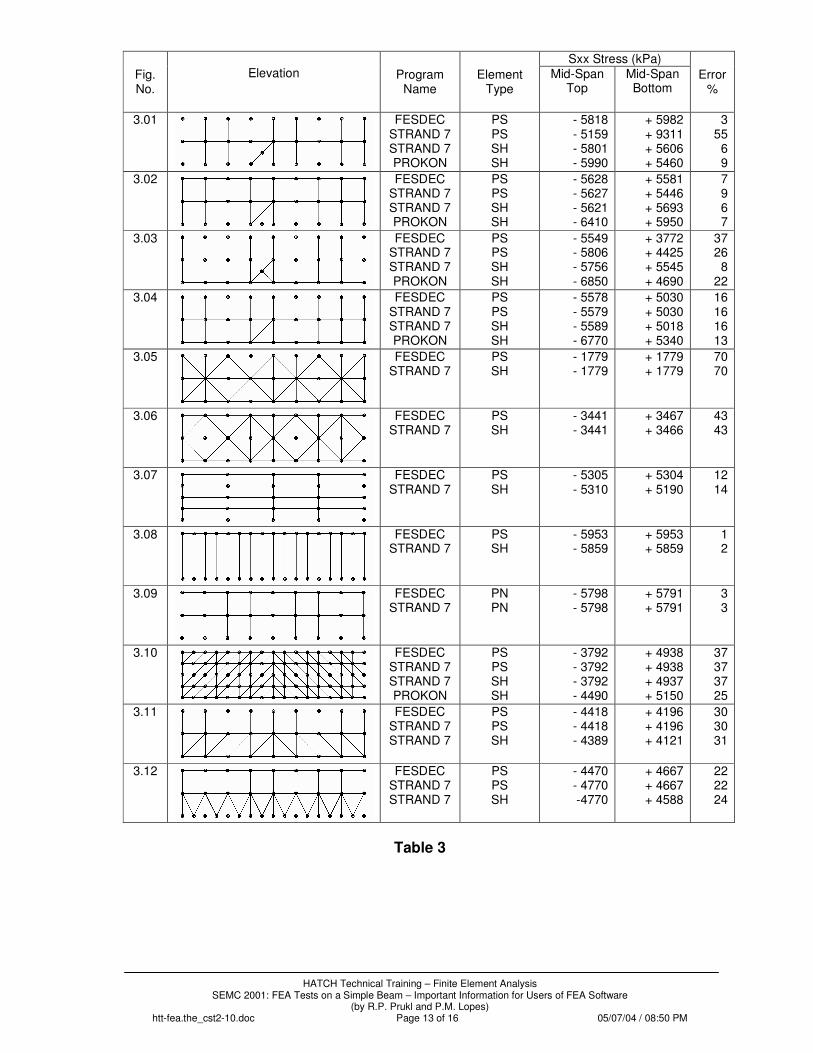
Further meshes were tested and the results were summarised in table 3. Here are some comments: Fig. 3.01: Compared with the regular 8x2 square grid (see fig. 1.08) with an error of 3% the
error in Fesdec is unchanged and the error for the Strand7 plane stress elements is remarkably high (55%). The Strand7 shells perform well (6%) and the Prokon shells have an error of 9%.
Fig. 3.02: The shell elements of all three programs give errors of less than 10%. Fig. 3.03: Fesdec cannot handle this type of mesh well (15 square elements, 1 triangular
quadrilateral, 2 triangles) – the error is 37%. The Strand7 shell model has an error of only 8%.
Fig. 3.04: All results have errors between 13 and 16%. Fig. 3.05: Compared with fig. 1.09 (error 72%) this two-layer triangular mesh behaves
similarly (error 70%). Fig. 3.06: Compared with fig. 3.05, this mesh yields more accurate results (43% error). This
is quite surprising. Fig. 3.07: The results from this mesh are similar to the results from fig. 1.04 (4 square
elements, 13% error). Fig. 3.08: The results for this mesh are much more accurate than those for fig. 3.07 (error 1
to 2% only). Fig. 3.09: The results of this model (plane strain) are identical to the results of fig. 1.08
(plane stress), the error is 3%. Fig. 3.10: The errors for this four-layer triangular grid are still two to three times higher than
the errors for one layer of square elements. Fig. 3.11: The errors are 30%, compared with 37% for fig. 3.10. Fig. 3.12: Compared with fig. 3.11, the maximum error drops from 30% to approximately
23%.
HATCH Technical Training – Finite Element Analysis
SEMC 2001: FEA Tests on a Simple Beam – Important Information for Users of FEA Software (by R.P. Prukl and P.M. Lopes)
htt-fea.the_cst2-10.doc Page 5 of 16 05/07/04 / 08:50 PM
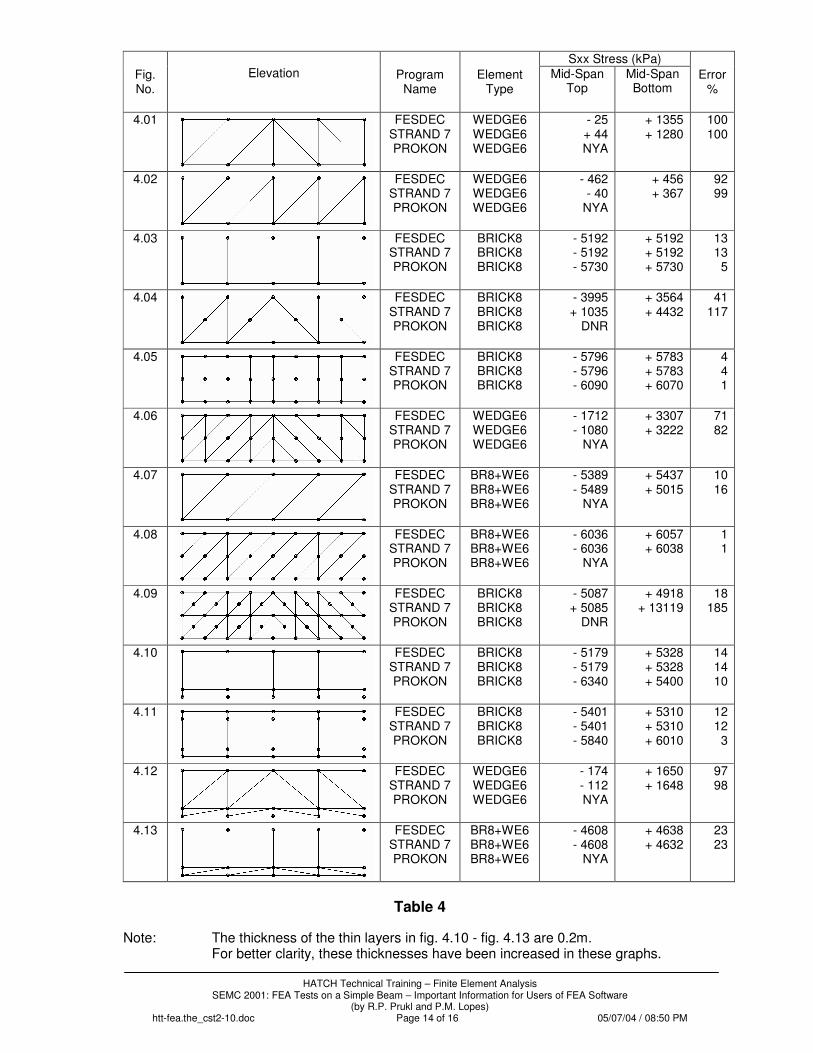
4. 3D-MESHES
The meshes are shown in fig. 8 and 9 and the results are summarised in table 4. To create a meaningful test for brick elements, the beam thickness has been increased from 0,200m to 1,000m. Prokon has presently, as solid elements, only 8-noded brick elements; 6-noded wedge elements are in preparation. If Prokon’s 8-noded bricks are shaped into wedges (forming 4-noded triangles on two surfaces), the Prokon program refuses to carry out the analysis. Fig. 4.01: Similar to fig. 1.02. Fig. 4.02: Similar to fig. 1.03. Fig. 4.03: Similar to fig. 1.04. Fig. 4.04: Compared to fig. 1.05, the error increases from 34% to 41% for Fesdec and the
Strand7 elements produce errors of more than 100%. Fig. 4.05: The results are similar to fig. 1.08. Fig. 4.06: The results are similar to fig. 1.09. Fig. 4.07: The results are similar fig. 2.01. Fig. 4.08: The error is only 1%. Fig. 4.09: The Fesdec run has an error of 18%. Strand7 cannot handle such a problem and
produces an error of 185%. Fig. 4.10: The errors for Fesdec and Strand7 are 14%, compared to 13% for fig. 4.03. The
error for Prokon is 10%, twice as much as for fig. 4.03. Fig. 4.11: The results are similar to fig. 4.10. Fig. 4.12: Only 6-noded wedges were used and one layer has aspect ratios of 10. The errors
are close to 100%. Similar to fig. 2.07. Fig. 4.13: Similar to fig. 2.08.
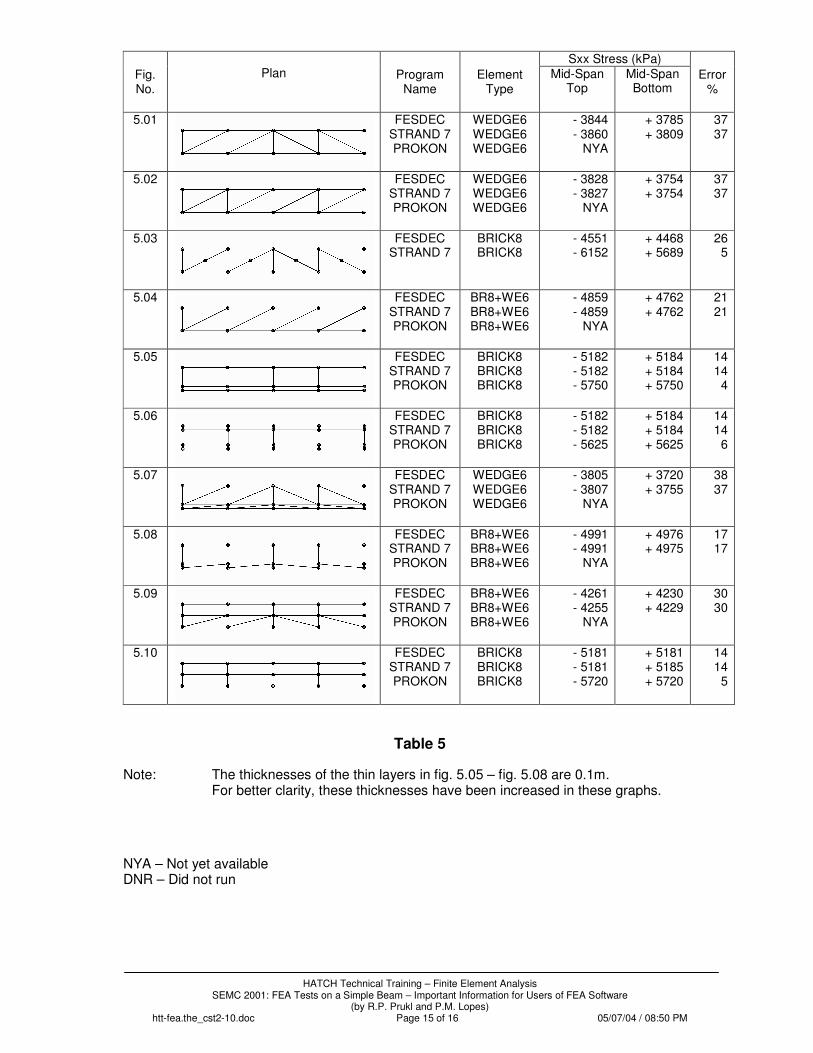
5. ADDITIONAL 3D-MESHES
The meshes in table 4 had only two nodes across the 1.000 m width of the beam. The meshes in table 5 have two to four nodes. For the calculation of the “error”, the most inaccurate of the stresses across the width of the beam was used. Fig. 5.01: The mesh pattern is the same as the mesh pattern in fig. 4.01. The error however,
is reduced dramatically if the elements are loaded on the triangular faces (error 37%) compared to a loading on the quadrilateral faces (100%).
Fig. 5.02: The errors are the same as for fig. 5.01. Fig. 5.03: Compared with fig. 4.04, there is a big improvement (in Fesdec from 41% to 26%,
in Strand7 from 117% to 5%).
HATCH Technical Training – Finite Element Analysis
SEMC 2001: FEA Tests on a Simple Beam – Important Information for Users of FEA Software (by R.P. Prukl and P.M. Lopes)
htt-fea.the_cst2-10.doc Page 6 of 16 05/07/04 / 08:50 PM
Fig. 5.04: Compared with fig. 4.07, the results are worse (the Fesdec error changes from 10% to 21%, the Strand7 error from 16% to 21%).
Fig. 5.05: The errors are the same as for fig. 4.10. Fig. 5.06: The errors are similar to the errors in fig. 4.11. Fig. 5.07: Compared with fig. 4.12, there is a big improvement (in Fesdec from 97% to 38%,
in Strand7 from 98% to 37%. Fig. 5.08: Compared with fig. 4.13, there is an improvement from 23% to 17%. Fig. 5.09: Compared with fig. 5.08, the error increases from 17% to 30%. This is unexpected.
One would rather expect an improvement because of the lower aspect ratio of the wedge elements.
Fig. 5.10: Compared with fig. 4.03, the errors are almost unchanged.
6. CONCLUSIONS AND COMMENTS 6.1 Triangular 3-noded shells should be avoided if they are loaded in such a way that they
produce mainly midplane stresses (Sxx, Syy, Sxy). If they are loaded such that they produce mainly bending moments (Mxx, Myy, Mxy), these elements perform much better. They also perform much better in heat transfer and similar applications.
It is however, not always easy to predict whether elements will be stressed more in bending or by mid-plane stresses. Changes in the model may drastically change stress patterns and additional load cases might produce high direct stresses, where in previous load cases elements were mainly loaded in bending. To be safe, triangular 3-noded elements should only be used as fillers between quadrilateral elements.
6.2 4-noded quadrilateral shell elements are usually good elements, except in programs
where such elements are invisible to the user, subdivided into four triangular elements internally.
The best performance is achieved by square elements. Try to keep the internal angles close to 90 degrees (maximum 135 degrees) and keep the aspect ratio small (maximum 4).
Certain programs (e.g. Prokon) can even handle quadrilateral elements with internal
angles of more than 180 degrees. However, checks should be built into all programs to restrain models with internal angles greater than 180 degrees from execution.
Different programs behave differently. Shapes, like in fig. 2.01, can be handled well by
Fesdec and Strand7, but not so well by Prokon. For this reason it is advisable that all important analyses are checked by using different software.
Mesh refinement as in figs. 2.06, 2.14, 2.15 and 2.18 causes considerable errors (in some
cases more than 50%). To use a fine model for the whole mesh does not appear as sophisticated, but the results are much more accurate.
6.3 6-noded triangular shell elements are very accurate (more accurate than 4-noded
quadrilaterals) but they also have their disadvantages, especially with regard to their mid-nodes:
• No corner nodes (e.g. from beam elements) should be connected to mid-nodes. • Mid-nodes should be at the edge centres and not off centre. • Mid-nodes should not be loaded by point loads. • If mid-nodes are supported, the reaction forces are wrong.
HATCH Technical Training – Finite Element Analysis
SEMC 2001: FEA Tests on a Simple Beam – Important Information for Users of FEA Software (by R.P. Prukl and P.M. Lopes)
htt-fea.the_cst2-10.doc Page 7 of 16 05/07/04 / 08:50 PM
It is much safer to use 4-noded quadrilaterals instead of 6-noded triangles. 6.4 8-noded quadrilateral shell elements.
The same comments as for 6.3 apply.
6.5 6-noded wedge elements. If loaded by pressure on one of the three 4-noded surfaces, they behave badly (with
errors up to 100%). If loaded by pressure on one of the two 3-noded surfaces, they behave better, but models should be built such that reasonable accuracy will be achieved for all load cases. Therefore, six-noded wedge elements should only be used as fillers between 8-noded brick elements.
6.6 8-noded brick elements. These elements give more accurate results than the 6-noded wedges. The internal angles
on the quadrilateral surfaces should be limited to 135 degrees although certain programs (e.g. Fesdec) can even handle angles of 180 degrees.
It should be noted that the error for the two-dimensional model in fig. 1.05, is 34% and for the same model in three dimensions (see fig. 4.04) the error is 41%.
7. SUMMARY Different programs give different results and often different versions of a program give
different results and often the users are not being informed of these changes. Some programs can handle internal angles of 180 degrees, others fail to do so. To increase the number of nodes and elements in a model is not sufficient to increase its
accuracy. Fig. 1.04, with 10 active nodes gives an error of 13% whereas fig. 2.18 with 39 active nodes yields a 27% error. A mesh consisting of 8x2 square elements and 9x3=27 nodes (see fig 1.08) only creates an error of 3%.
This paper is not a complete entity. It can be improved and extended (including 15-noded
wedges, 20-noded bricks and 4- and 10-noded tetrahedrons). It should, however, give the reader, the inexperienced as well as the experienced, valuable information and guidance. Hopefully it will trigger further research at universities and technikons. Without such research Finite Element Analysis is a dangerous tool even in the hands of experts.
8. ACKNOWLEDGEMENTS
A great thank you to all our colleagues whose keen interest in the subject has inspired this paper.
HATCH Technical Training – Finite Element Analysis
SEMC 2001: FEA Tests on a Simple Beam – Important Information for Users of FEA Software (by R.P. Prukl and P.M. Lopes)
htt-fea.the_cst2-10.doc Page 8 of 16 05/07/04 / 08:50 PM
9. REFERENCES
[1] The CST (Constant Strain Triangle) – An insidious survivor from the infancy of FEA, by R.P. Prukl, FEMSA92 Symposium, 11th Symposium on Finite Element Methods in South Africa, 15-17 January 1992, organised by FRD/UCT Centre for Research in Computational and Applied Mechanics, University of Cape Town
[2] A new look at element shape parameters, by John Robinson, April 1985, NAFEMS [3] Basic and shape sensitivity tests for membrane and plate bending finite elements,
by John Robinson, April 1985, NAFEMS [4] An introduction to hierarchical displacement elements and the adaptive technique,
by John Robinson, November 1986, NAFEMS [5] Distortion measures for quadrilaterals with curved boundaries, by John Robinson,
August 1987, NAFEMS [6] What every engineer should know about finite element analysis, edited by John R.
Brauer, CAD Comp. Inc., Milwaukee, Wisconsin, Marcel Dekker Inc., New York and Basel
[7] Distortion effects in isoparametric elements, an analytic approach, by John Barlow,
Proceedings of NAFEMS AGM / Technical Session, 1987 [8] The standard NAFEMS benchmarks, October 1989, NAFEMS [9] Shell finite element evaluation tests, by, A.J. Morris, August 1985, NAFEMS [10] Analytical modelling of structural systems, by Iain A. MacLeod, 1990, Ellis
Horwood [11] Fesdec, General Finite Element Program from Cape Engineering UK Limited,
Birmingham Road,Warwick, England CV34 4TX [12] Strand7, General Finite Element Program from G+D Computing, Suite1, Level 7,
541 Kent Street, Sydney NSW 2000, Australia [13] Prokon, Program Module Space Frame (SF) from Prokon Software Consultants,
P.O Box 17295, Groenkloof 0027, South Africa.
HATCH Technical Training – Finite Element Analysis
SEMC 2001: FEA Tests on a Simple Beam – Important Information for Users of FEA Software (by R.P. Prukl and P.M. Lopes)
htt-fea.the_cst2-10.doc Page 9 of 16 05/07/04 / 08:50 PM
HATCH Technical Training – Finite Element Analysis
SEMC 2001: FEA Tests on a Simple Beam – Important Information for Users of FEA Software (by R.P. Prukl and P.M. Lopes)
htt-fea.the_cst2-10.doc Page 10 of 16 05/07/04 / 08:50 PM
Sxx Stress (kPa) Fig. No.
Elevation
Program
Name
Element
Type Mid-Span
Top Mid-Span Bottom
Error
%
1.01 Bending Theory
- 6000
+ 6000
0
1.02
FESDEC STRAND7 PROKON
PS SH SH
0 0 0
+ 1347 + 1347 + 2080
100 100 100
1.03
FESDEC
PS - 426 + 424 93
1.04
FESDEC STRAND7 STRAND7 PROKON
PS PS SH SH
- 5250 - 5250 - 5323 - 5410
+ 5250 + 5250 + 5177 + 5530
13 13 14 10
1.05
FESDEC STRAND7 STRAND7 PROKON
PS PS SH SH
- 3940 + 1144 - 2147 - 4260
+ 6772 + 4306 + 4211 + 5290
34 119 64 29
1.06
FESDEC STRAND7
PS PS
- 5962 - 5764
+ 5978 + 5959
1 4
1.07
FESDEC STRAND7
PS PS
- 6022 - 6187
+ 6275 + 6187
5 3
1.08
FESDEC FESDEC
STRAND7 STRAND7 PROKON PROKON
PS SH PS SH PS SH
- 5802 - 5802 - 5802 - 5842 - 6093 - 5990
+ 5795 + 5795 + 5795 + 5856 + 6086 + 5950
3 3 3 3 1 1
1.09
FESDEC STRAND7 STRAND7
PS PS SH
- 1683 - 1683 - 1683
+ 3289 + 3289 + 3289
72 72 72
Table 1
• element corner nodes
element mid-nodes Table 1 is a modified and shortened copy of table 1 in reference [1]. See references [11], [12] and [13].
HATCH Technical Training – Finite Element Analysis
SEMC 2001: FEA Tests on a Simple Beam – Important Information for Users of FEA Software (by R.P. Prukl and P.M. Lopes)
htt-fea.the_cst2-10.doc Page 11 of 16 05/07/04 / 08:50 PM
Sxx Stress (kPa)
Fig. No.
Elevation
Program
Name
Element
Type Mid-Span
Top Mid-Span Bottom
Error
%
2.01
FESDEC STRAND 7 PROKON
PS PS SH
- 5436 - 5436 - 4650
+ 5486 + 5486 + 4920
9 9
23
2.02
FESDEC STRAND 7 PROKON
PS PS SH
- 6043 - 6043 - 5440
+ 6066 + 6066 + 5450
1 1 9
2.03
FESDEC STRAND 7 STRAND 7 PROKON
PS PS SH SH
- 4836 + 14274
- 3776 - 5230
+ 6301 + 29639
+ 5851 + 6030
19 394 37 13
2.04
FESDEC STRAND 7 PROKON
PS PS SH
- 5232 - 5232 - 5710
+ 5331 + 5331 + 4860
13 13 19
2.05
FESDEC STRAND 7
PS PS
- 5401 - 5401
+ 5314 + 5314
11 11
2.06
FESDEC STRAND 7 STRAND 7 PROKON
PS PS SH SH
- 4531 - 3639 - 3801 - 4520
+ 5293 + 3419 + 5607 + 5820
24 43 37 25
2.07
FESDEC STRAND 7
PS PS
- 167 - 166
+ 1670 + 1670
97 97
2.08
FESDEC STRAND 7
PS PS
- 4664 - 4664
+ 4643 + 4643
23 23
2.09
FESDEC STRAND 7
PN PN
- 5250 - 5250
+ 5250 + 5250
13 13
2.10
FESDEC STRAND 7
PS PS
- 3325 - 3325
+ 1400 + 1400
77 77
Table 2.A
Comments: Fig. 2.09: Plane strain elements. Fig. 2.10: Both bottom corners supported vertically and horizontally. Note: The thicknesses of the thin layers in fig. 2.04, fig. 2.05, fig. 2.07 and fig. 2.08 are
0.2m. For better clarity, these thicknesses have been increased in these graphs.
HATCH Technical Training – Finite Element Analysis
SEMC 2001: FEA Tests on a Simple Beam – Important Information for Users of FEA Software (by R.P. Prukl and P.M. Lopes)
htt-fea.the_cst2-10.doc Page 12 of 16 05/07/04 / 08:50 PM
Sxx Stress (kPa) Fig. No.
Elevation
Program
Name
Element
Type Mid-Span
Top Mid-Span Bottom
Error
%
2.11
FESDEC STRAND 7 STRAND 7 PROKON
PS PS SH SH
- 5046 - 5532 - 5237 - 5880
+ 5729 + 5348 + 5640 + 5960
16 11 13
2 2.12
FESDEC STRAND 7 STRAND 7 PROKON
PS PS SH SH
- 3445 - 4604 - 3850 - 4720
+ 4958 + 4562 + 4860 + 4950
43 32 36 21
2.13
FESDEC STRAND 7 STRAND 7 PROKON
PS PS SH SH
- 3425 - 4198 - 3807 - 5470
+ 4990 + 4458 + 4844 + 5840
43 30 37
9 2.14
FESDEC STRAND 7 STRAND 7 PROKON
PS PS SH SH
- 3109 - 1605 - 2020
- 4320
+ 3570 - 981
+ 4851 + 6090
48 116 66 28
2.15
FESDEC STRAND 7 STRAND 7 PROKON
PS PS SH SH
- 6289 - 5959 - 5359 - 5510
+ 4444 + 4525 + 4676 + 5480
26 25 22
9 2.16
FESDEC STRAND 7
PS PS
- 3112 - 3112
+ 2849 + 2849
53 53
2.17
FESDEC STRAND 7
PS PS
- 4096 - 4096
+ 3955 + 3955
34 34
2.18
FESDEC STRAND 7 PROKON
PS SH SH
- 4384 - 3792 - 4480
+ 5192 + 5175 + 5720
27 37 25
2.19
FESDEC STRAND 7
PS PS
- 3730 - 3748
+ 5181 + 5197
38 38
2.20
FESDEC STRAND 7
PS PS
- 1387 - 1388
+ 1413 + 1412
77 77
Table 2.B
HATCH Technical Training – Finite Element Analysis
SEMC 2001: FEA Tests on a Simple Beam – Important Information for Users of FEA Software (by R.P. Prukl and P.M. Lopes)
htt-fea.the_cst2-10.doc Page 13 of 16 05/07/04 / 08:50 PM
Sxx Stress (kPa)
Fig. No.
Elevation
Program
Name
Element
Type Mid-Span
Top Mid-Span Bottom
Error
%
3.01
FESDEC STRAND 7 STRAND 7 PROKON
PS PS SH SH
- 5818 - 5159 - 5801 - 5990
+ 5982 + 9311 + 5606 + 5460
3 55
6 9
3.02
FESDEC STRAND 7 STRAND 7 PROKON
PS PS SH SH
- 5628 - 5627 - 5621 - 6410
+ 5581 + 5446 + 5693 + 5950
7 9 6 7
3.03
FESDEC STRAND 7 STRAND 7 PROKON
PS PS SH SH
- 5549 - 5806 - 5756 - 6850
+ 3772 + 4425 + 5545 + 4690
37 26
8 22
3.04
FESDEC STRAND 7 STRAND 7 PROKON
PS PS SH SH
- 5578 - 5579 - 5589 - 6770
+ 5030 + 5030 + 5018 + 5340
16 16 16 13
3.05
FESDEC STRAND 7
PS SH
- 1779 - 1779
+ 1779 + 1779
70 70
3.06
FESDEC STRAND 7
PS SH
- 3441 - 3441
+ 3467 + 3466
43 43
3.07
FESDEC STRAND 7
PS SH
- 5305 - 5310
+ 5304 + 5190
12 14
3.08
FESDEC STRAND 7
PS SH
- 5953 - 5859
+ 5953 + 5859
1 2
3.09
FESDEC STRAND 7
PN PN
- 5798 - 5798
+ 5791 + 5791
3 3
3.10
FESDEC STRAND 7 STRAND 7 PROKON
PS PS SH SH
- 3792 - 3792 - 3792 - 4490
+ 4938 + 4938 + 4937 + 5150
37 37 37 25
3.11
FESDEC STRAND 7 STRAND 7
PS PS SH
- 4418 - 4418 - 4389
+ 4196 + 4196 + 4121
30 30 31
3.12
FESDEC STRAND 7 STRAND 7
PS PS SH
- 4470 - 4770 -4770
+ 4667 + 4667 + 4588
22 22 24
Table 3
HATCH Technical Training – Finite Element Analysis
SEMC 2001: FEA Tests on a Simple Beam – Important Information for Users of FEA Software (by R.P. Prukl and P.M. Lopes)
htt-fea.the_cst2-10.doc Page 14 of 16 05/07/04 / 08:50 PM
Sxx Stress (kPa)
Fig. No.
Elevation
Program
Name
Element
Type Mid-Span
Top Mid-Span Bottom
Error
%
4.01
FESDEC STRAND 7 PROKON
WEDGE6 WEDGE6 WEDGE6
- 25 + 44 NYA
+ 1355 + 1280
100 100
4.02
FESDEC STRAND 7 PROKON
WEDGE6 WEDGE6 WEDGE6
- 462 - 40
NYA
+ 456 + 367
92 99
4.03
FESDEC STRAND 7 PROKON
BRICK8 BRICK8 BRICK8
- 5192 - 5192 - 5730
+ 5192 + 5192 + 5730
13 13
5
4.04
FESDEC STRAND 7 PROKON
BRICK8 BRICK8 BRICK8
- 3995 + 1035
DNR
+ 3564 + 4432
41 117
4.05
FESDEC STRAND 7 PROKON
BRICK8 BRICK8 BRICK8
- 5796 - 5796 - 6090
+ 5783 + 5783 + 6070
4 4 1
4.06
FESDEC STRAND 7 PROKON
WEDGE6 WEDGE6 WEDGE6
- 1712 - 1080
NYA
+ 3307 + 3222
71 82
4.07
FESDEC STRAND 7 PROKON
BR8+WE6 BR8+WE6 BR8+WE6
- 5389 - 5489
NYA
+ 5437 + 5015
10 16
4.08
FESDEC STRAND 7 PROKON
BR8+WE6 BR8+WE6 BR8+WE6
- 6036 - 6036
NYA
+ 6057 + 6038
1 1
4.09
FESDEC STRAND 7 PROKON
BRICK8 BRICK8 BRICK8
- 5087 + 5085
DNR
+ 4918 + 13119
18 185
4.10
FESDEC STRAND 7 PROKON
BRICK8 BRICK8 BRICK8
- 5179 - 5179 - 6340
+ 5328 + 5328 + 5400
14 14 10
4.11
FESDEC STRAND 7 PROKON
BRICK8 BRICK8 BRICK8
- 5401 - 5401 - 5840
+ 5310 + 5310 + 6010
12 12
3
4.12
FESDEC STRAND 7 PROKON
WEDGE6 WEDGE6 WEDGE6
- 174 - 112 NYA
+ 1650 + 1648
97 98
4.13
FESDEC STRAND 7 PROKON
BR8+WE6 BR8+WE6 BR8+WE6
- 4608 - 4608
NYA
+ 4638 + 4632
23 23
Table 4
Note: The thickness of the thin layers in fig. 4.10 - fig. 4.13 are 0.2m. For better clarity, these thicknesses have been increased in these graphs.
HATCH Technical Training – Finite Element Analysis
SEMC 2001: FEA Tests on a Simple Beam – Important Information for Users of FEA Software (by R.P. Prukl and P.M. Lopes)
htt-fea.the_cst2-10.doc Page 15 of 16 05/07/04 / 08:50 PM
Sxx Stress (kPa)
Fig. No.
Plan
Program
Name
Element
Type Mid-Span
Top Mid-Span Bottom
Error
%
5.01
FESDEC STRAND 7 PROKON
WEDGE6 WEDGE6 WEDGE6
- 3844 - 3860
NYA
+ 3785 + 3809
37 37
5.02
FESDEC STRAND 7 PROKON
WEDGE6 WEDGE6 WEDGE6
- 3828 - 3827
NYA
+ 3754 + 3754
37 37
5.03
FESDEC STRAND 7
BRICK8 BRICK8
- 4551 - 6152
+ 4468 + 5689
26 5
5.04
FESDEC STRAND 7 PROKON
BR8+WE6 BR8+WE6 BR8+WE6
- 4859 - 4859
NYA
+ 4762 + 4762
21 21
5.05
FESDEC STRAND 7 PROKON
BRICK8 BRICK8 BRICK8
- 5182 - 5182 - 5750
+ 5184 + 5184 + 5750
14 14
4
5.06
FESDEC STRAND 7 PROKON
BRICK8 BRICK8 BRICK8
- 5182 - 5182 - 5625
+ 5184 + 5184 + 5625
14 14
6
5.07
FESDEC STRAND 7 PROKON
WEDGE6 WEDGE6 WEDGE6
- 3805 - 3807
NYA
+ 3720 + 3755
38 37
5.08
FESDEC STRAND 7 PROKON
BR8+WE6 BR8+WE6 BR8+WE6
- 4991 - 4991
NYA
+ 4976 + 4975
17 17
5.09
FESDEC STRAND 7 PROKON
BR8+WE6 BR8+WE6 BR8+WE6
- 4261 - 4255
NYA
+ 4230 + 4229
30 30
5.10
FESDEC STRAND 7 PROKON
BRICK8 BRICK8 BRICK8
- 5181 - 5181 - 5720
+ 5181 + 5185 + 5720
14 14
5
Table 5 Note: The thicknesses of the thin layers in fig. 5.05 – fig. 5.08 are 0.1m. For better clarity, these thicknesses have been increased in these graphs. NYA – Not yet available DNR – Did not run
HATCH Technical Training – Finite Element Analysis
SEMC 2001: FEA Tests on a Simple Beam – Important Information for Users of FEA Software (by R.P. Prukl and P.M. Lopes)
htt-fea.the_cst2-10.doc Page 16 of 16 05/07/04 / 08:50 PM
Recommended


