
Fish
ery
Man
agem
ent
Pla
n f
or
Pal
k B
ay B
lue
Swim
min
g C
rab
CMFRI Marine Fisheries Policy Series No.15ISSN: 2394-8019
Fishery Management Plan for
Indian Council of Agricultural ResearchCentral Marine Fisheries Research Institute

Indian Council of Agricultural ResearchCentral Marine Fisheries Research Institute
Josileen JoseG. MaheswaruduShelton PaduaGeetha SasikumarEldho VargheseK. S. Mohamed
CMFRI Marine Fisheries Policy Series No.15ISSN: 2394-8019

Fishery Management Plan for Palk Bay Blue Swimming Crab Published byDr. A. GopalakrishnanDirector, ICAR - Central Marine Fisheries Research InstitutePost Box No. 1603, Ernakulam North P.O.Kochi – 682 018, Kerala, India
www.cmfri.org.inEmail: [email protected]. No.: +91-0484-2394867Fax No.: +91-0484-2394909
Design: Blackboard, KochiPrinted at: PrintExPress, Kaloor, Kochi
Publication, Production & Co-ordinationLibrary & Documentation Centre, CMFRI
CMFRI Marine Fisheries Policy Series No.15ISSN: 2394-8019
© 2019 ICAR - Central Marine Fisheries Research Institute, KochiAll rights reserved. Material contained in this publication may not be reproduced in anyform without the permission of the publisher.
Citation: Jose Josileen., G. Maheswarudu, Shelton Padua, Geetha Sasikumar, Eldho Varghese and K. S. Mohamed. 2019. Fishery Management Plan for Palk Bay Blue Swimming Crab. ICAR-CMFRI Mar. Fish. Policy Series No.15. ICAR-Central Marine Fisheries Research Institute, Kochi, Kerala, India, 100pp.

Crabs are widely distributed in Indian seas and form minor fishery at various regions along the east and west coasts. Crabs contribute a share of 11.1 % in total crustacean landings, with an approximate production of 53476 tonnes in 2017. Three portunid crabs, Portunus pelagicus, Portunus sanguinolentus and Charybdis feriatus form the majority of the regular crab landings in India.
The demand for Portunus pelagicus, commonly known as Blue Swimming Crab (BSC) is consistently increasing ever since its export started in the beginning of the century. The State of Tamil Nadu is leading in marine crab landings particularly for the blue swimming crab production in India. The major landing centres for BSC are located in the Palk Bay (PB) and Gulf of Mannar (GoM) areas of Ramanathapuram, Pudukkottai and Thanjavur districts of the state. BSC products form the most important internationally traded commodity from the region and contribute significantly to the livelihood of crab merchants and crab fishers of the area. The Central Marine Fisheries Research Institute has been monitoring the BSC fishery and studying the biology the species along with other marine resources. During the last decade of the 20th century more focused and in-depth studies have been conducted on Portunus pelagicus and established the fact that apart from its fisheries importance, BSC is also a suitable candidate species for farming.
This document gives insights on BSC fishing zones, major fishing craft and gears, area wise and centre wise production details, trade, processing industry and export markets. Furthermore, it elucidates the complete life cycle of the species including its growth and reproductive biology as these form essential and integral inputs while formulating the management decisions. As BSC is a highly valuable commodity it necessitates urgent attention to its responsible exploitation and action plan for the judicious management of the resource to accomplish BSC as a sustained fishery. Conclusions have drawn based on the facts and evidences, acquired from exhaustive field and laboratory studies and guidance on a Fishery Management Plan for Palk Bay BSC fishery are presented.
Dr. A. Gopalakrishnan Director, CMFRI
Foreword

Contents
Foreword � � � � � � � � � � � � � � � � � � � � � � � � � � � � � � � � � � � � � � � � � � � � � � � � � � � � � � � � � � � � � � � � � � � � � � � � 5
Executive Summary � � � � � � � � � � � � � � � � � � � � � � � � � � � � � � � � � � � � � � � � � � � � � � � � � � � � � � � � � � � � � � 8
Acronyms � � � � � � � � � � � � � � � � � � � � � � � � � � � � � � � � � � � � � � � � � � � � � � � � � � � � � � � � � � � � � � � � � � � � � � 10
1� Introduction � � � � � � � � � � � � � � � � � � � � � � � � � � � � � � � � � � � � � � � � � � � � � � � � � � � � � � � � � � � � � � � � � � 13
2� Material and methods � � � � � � � � � � � � � � � � � � � � � � � � � � � � � � � � � � � � � � � � � � � � � � � � � � � � � � � � 15
Results � � � � � � � � � � � � � � � � � � � � � � � � � � � � � � � � � � � � � � � � � � � � � � � � � � � � � � � � � � � � � � � � � � � � � � � � � 21
3.1. General description . . . . . . . . . . . . . . . . . . . . . . . . . . . . . . . . . . . . . . . . . . . . . . . . . . . . . . . . . . 21
3.2. Different sea bottom ecosystems on the Indian side of Palk Bay . . . . . . . . . . . . . . . . . . 21
3.3. Area, districts and Zone-wise landing centres of Palk Bay . . . . . . . . . . . . . . . . . . . . . . . . 24
3.4. Fisher-folk Population and Fishing Crafts of Palk Bay . . . . . . . . . . . . . . . . . . . . . . . . . . . . 26
3.5. Crab Landing Centres & Total BSC Landings . . . . . . . . . . . . . . . . . . . . . . . . . . . . . . . . . . . . 29
3.6. BSC Catch and Catch trends . . . . . . . . . . . . . . . . . . . . . . . . . . . . . . . . . . . . . . . . . . . . . . . . . . 32
3.6a. Trawl . . . . . . . . . . . . . . . . . . . . . . . . . . . . . . . . . . . . . . . . . . . . . . . . . . . . . . . . . . . . . . . . . . 32
3.6b. Gill net . . . . . . . . . . . . . . . . . . . . . . . . . . . . . . . . . . . . . . . . . . . . . . . . . . . . . . . . . . . . . . . . 37
3.7. Historic-data in Trawl and Gillnets . . . . . . . . . . . . . . . . . . . . . . . . . . . . . . . . . . . . . . . . . . . . . 46
3.8. By- catch . . . . . . . . . . . . . . . . . . . . . . . . . . . . . . . . . . . . . . . . . . . . . . . . . . . . . . . . . . . . . . . . . . . 48
3.9. Annexure for Tables . . . . . . . . . . . . . . . . . . . . . . . . . . . . . . . . . . . . . . . . . . . . . . . . . . . . . . . . . 53
4� BSC Price Structure � � � � � � � � � � � � � � � � � � � � � � � � � � � � � � � � � � � � � � � � � � � � � � � � � � � � � � � � � �63
4.1. Value Chain . . . . . . . . . . . . . . . . . . . . . . . . . . . . . . . . . . . . . . . . . . . . . . . . . . . . . . . . . . . . . . . . . 63
4.2. Export . . . . . . . . . . . . . . . . . . . . . . . . . . . . . . . . . . . . . . . . . . . . . . . . . . . . . . . . . . . . . . . . . . . . . 65
4.3. Crab Processing Companies . . . . . . . . . . . . . . . . . . . . . . . . . . . . . . . . . . . . . . . . . . . . . . . . . . 65
5� BSC Biology & Life History � � � � � � � � � � � � � � � � � � � � � � � � � � � � � � � � � � � � � � � � � � � � � � � � � � � �67
5.1. Life cycle . . . . . . . . . . . . . . . . . . . . . . . . . . . . . . . . . . . . . . . . . . . . . . . . . . . . . . . . . . . . . . . . . . . . 67
5.2. Larval Phase . . . . . . . . . . . . . . . . . . . . . . . . . . . . . . . . . . . . . . . . . . . . . . . . . . . . . . . . . . . . . . . . 69
5.3. Size Composition and Sex Ratio . . . . . . . . . . . . . . . . . . . . . . . . . . . . . . . . . . . . . . . . . . . . . . . 69

5.4. Size at Maturity . . . . . . . . . . . . . . . . . . . . . . . . . . . . . . . . . . . . . . . . . . . . . . . . . . . . . . . . . . . . . . 70
5.5. Breeding cycle and composition of berried crabs . . . . . . . . . . . . . . . . . . . . . . . . . . . . . . . 70
5.6. Spawning . . . . . . . . . . . . . . . . . . . . . . . . . . . . . . . . . . . . . . . . . . . . . . . . . . . . . . . . . . . . . . . . . . 72
5.7. Fecundity . . . . . . . . . . . . . . . . . . . . . . . . . . . . . . . . . . . . . . . . . . . . . . . . . . . . . . . . . . . . . . . . . . . 73
5.8. Carapace width and Total weight relationship . . . . . . . . . . . . . . . . . . . . . . . . . . . . . . . . . . 73
5.9. Food & feeding . . . . . . . . . . . . . . . . . . . . . . . . . . . . . . . . . . . . . . . . . . . . . . . . . . . . . . . . . . . . . 76
5.10. Growth in the laboratory . . . . . . . . . . . . . . . . . . . . . . . . . . . . . . . . . . . . . . . . . . . . . . . . . . . . 76
5. 11. Growth in Wild crabs . . . . . . . . . . . . . . . . . . . . . . . . . . . . . . . . . . . . . . . . . . . . . . . . . . . . . . . 80
6� Earlier Stock Assessment � � � � � � � � � � � � � � � � � � � � � � � � � � � � � � � � � � � � � � � � � � � � � � � � � � � � � 81
6.1. Probability of capture . . . . . . . . . . . . . . . . . . . . . . . . . . . . . . . . . . . . . . . . . . . . . . . . . . . . . . . . 81
6.2. Mortality parameters . . . . . . . . . . . . . . . . . . . . . . . . . . . . . . . . . . . . . . . . . . . . . . . . . . . . . . . . 82
6.3. Yield-per-recruit (Y/R) . . . . . . . . . . . . . . . . . . . . . . . . . . . . . . . . . . . . . . . . . . . . . . . . . . . . . . . . 82
7� Current Estimation of Maximum Sustainable Yield (MSY) – Palk Bay BSC � � � � � �84
8� Projection on advantages of not fishing berried females � � � � � � � � � � � � � � � � � � � � �87
9� Harvest Control Rules for BSC Fishery of Palk Bay � � � � � � � � � � � � � � � � � � � � � � � � � � � �90
10� Strengths and Weakness � � � � � � � � � � � � � � � � � � � � � � � � � � � � � � � � � � � � � � � � � � � � � � � � � � � �92
11� BSC Management Plan (BSCMP) � � � � � � � � � � � � � � � � � � � � � � � � � � � � � � � � � � � � � � � � � � � � �94
12� References � � � � � � � � � � � � � � � � � � � � � � � � � � � � � � � � � � � � � � � � � � � � � � � � � � � � � � � � � � � � � � � � � �96
Acknowledgements � � � � � � � � � � � � � � � � � � � � � � � � � � � � � � � � � � � � � � � � � � � � � � � � � � � � � � � � � � � �98
Central Marine Fisheries Research Institute8
Executive Summary
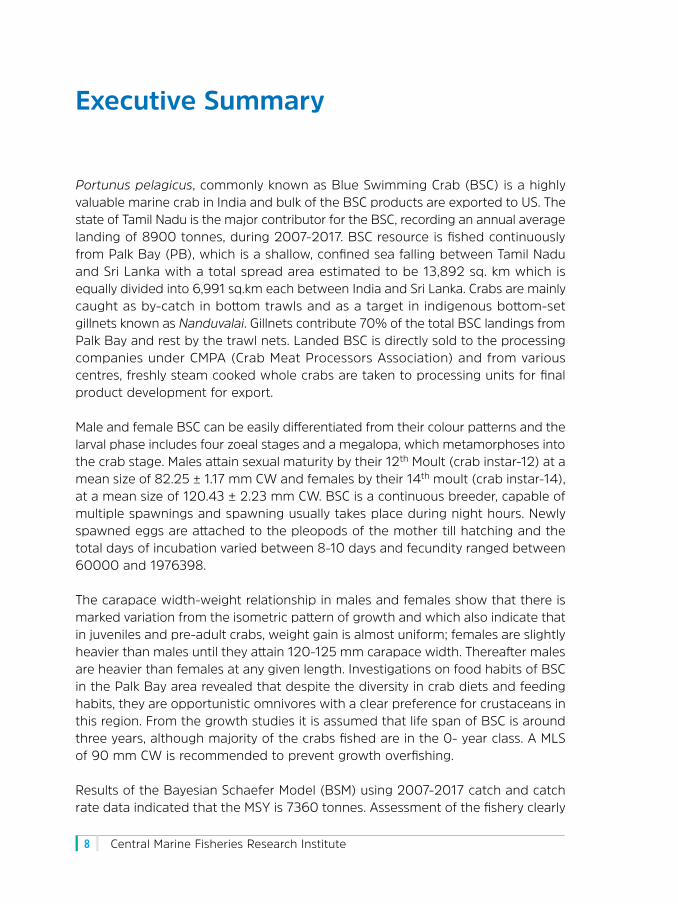
Portunus pelagicus, commonly known as Blue Swimming Crab (BSC) is a highly valuable marine crab in India and bulk of the BSC products are exported to US. The state of Tamil Nadu is the major contributor for the BSC, recording an annual average landing of 8900 tonnes, during 2007-2017. BSC resource is fished continuously from Palk Bay (PB), which is a shallow, confined sea falling between Tamil Nadu and Sri Lanka with a total spread area estimated to be 13,892 sq. km which is equally divided into 6,991 sq.km each between India and Sri Lanka. Crabs are mainly caught as by-catch in bottom trawls and as a target in indigenous bottom-set gillnets known as Nanduvalai. Gillnets contribute 70% of the total BSC landings from Palk Bay and rest by the trawl nets. Landed BSC is directly sold to the processing companies under CMPA (Crab Meat Processors Association) and from various centres, freshly steam cooked whole crabs are taken to processing units for final product development for export.
Male and female BSC can be easily differentiated from their colour patterns and the larval phase includes four zoeal stages and a megalopa, which metamorphoses into the crab stage. Males attain sexual maturity by their 12th Moult (crab instar-12) at a mean size of 82.25 ± 1.17 mm CW and females by their 14th moult (crab instar-14), at a mean size of 120.43 ± 2.23 mm CW. BSC is a continuous breeder, capable of multiple spawnings and spawning usually takes place during night hours. Newly spawned eggs are attached to the pleopods of the mother till hatching and the total days of incubation varied between 8-10 days and fecundity ranged between 60000 and 1976398.
The carapace width-weight relationship in males and females show that there is marked variation from the isometric pattern of growth and which also indicate that in juveniles and pre-adult crabs, weight gain is almost uniform; females are slightly heavier than males until they attain 120-125 mm carapace width. Thereafter males are heavier than females at any given length. Investigations on food habits of BSC in the Palk Bay area revealed that despite the diversity in crab diets and feeding habits, they are opportunistic omnivores with a clear preference for crustaceans in this region. From the growth studies it is assumed that life span of BSC is around three years, although majority of the crabs fished are in the 0- year class. A MLS of 90 mm CW is recommended to prevent growth overfishing.
Results of the Bayesian Schaefer Model (BSM) using 2007-2017 catch and catch rate data indicated that the MSY is 7360 tonnes. Assessment of the fishery clearly

Fishery Management Plan for Palk Bay Blue Swimming Crab 9
reveals catches are on the declining trend and stock has been overfished. It is also alarming that the berried females indiscriminately exploited without any restriction. It is recommended that to sustain the Blue Swimmer Crab fishery strict management of the fishery is essential and the best possible immediate action is a total ban on landing and sale of berried females. It is estimated that if berried females are not landed in Trawls/gillnets for a month, after a period of five months, an equal quantity of one month’s production can be obtained from a trawl centre and 32% of a month’s catch can be obtained from a gillnet centre. For the BSC fishery the harvest strategy would be to maintain yields close to the estimated MSY (7360 tonnes) using a catch and effort based harvest control measure (Y/MSY and F/ Fmsy) as reference points.
Based on the facts and evidences gathered and proved over by many years systematic studies on BSC, rules and regulations are recommended for the implementation in the Palk Bay region. Initial phase the proposed plan can be implemented in the Palk Bay and later it can be implemented to other main BSC fishing regions also, and these actions would eventually helpful for sustaining the BSC fishery a longstanding.

Central Marine Fisheries Research Institute10
Acronyms
‘a’ y-intercept or the initial growth coefficient AL Abdomen LengthANOVA Analysis of varianceAW Abdomen Width‘b’ the slope or growth coefficient.B BiomassBmsy Biomass capable of producing MSYBODC British Oceanographic Data CentreBSC Blue Swimming CrabBSCFGC BSC fisheries Governance CouncilBSM Bayesian Schaefer Model C-1 Crab instar-1CL Carapace LengthCMFRI Central Marine Fisheries Research InstituteCMPA Crab Meat Processors Association CPD Chelar Propodus DepthCPH Catch Per HourCPL Chelar Propodus LengthCPUE Catch Per Unit EffortCW Carapace WidthE Exploitation rateETP Endangered Threatened and ProtectedF Total instantaneous fishing mortality coefficient FIMSUL Fisheries Management for Sustainable LivelihoodsFmsy Rate of fishing mortality compatible with MSYFRAD Fisheries Resources Assessment Division of CMFRIg gramGEBCO General Bathymetric Chart of the OceansGoI Government of IndiaGoM Gulf of MannarGPS Global Positioning System HCRs Harvest Control RulesHP Horse PowerIB In-BoardIBBSGN Inboard Bottom Set GillnetICPA Indian Crab Processors Association IMBL International Maritime Boundary Line K Growth rate coefficient
Fishery Management Plan for Palk Bay Blue Swimming Crab 11
k Parameter of the Schaefer model indicating unexploited stock sizeKg KilogramL∞ Asymptotic average lengthLRP Limit Reference PointMDTN Multiday Trawl NetMLS Minimum Legal Sizemm MillimetreMSY Maximum Sustainable YieldMTN Mechanised Trawl NetN Total instantaneous natural mortality coefficient NMBSGN Non-Mechanised Bottom Set GillnetNMFDC National Marine Fishery Resources Data Centre NMTN Non Mechanised Trawl netOAL Over All LengthOB Out-BoardOBBSGN Outboard Bottom Set GillnetOBGN Outboard GillnetOMCAR Organization for Marine Conservation, Awareness and ResearchPB Palk Bayq Catchability coefficientr Correlation coefficient Rs Indian RupeesSDMRI Sugandhi Devadason Marine Research Institute Sp Singular species Spp Plural speciest TonnesTN Tamil NaduTRP Target Reference PointTW Total WeightUSA United States of America VBGF von Bertalanffy Growth FunctionW expected weightY/R Yield-per-recruitZ Total instantaneous mortality coefficient Z-1 Zoea 1$ US Dollar


Fishery Management Plan for Palk Bay Blue Swimming Crab 13
1. Introduction
Blue swimming crab, known in Tamil Nadu as olakkal nandu was used for consumption since many years and for the last two decades it is a very popular choice of seafood lovers. Portunus pelagicus (Linnaeus, 1758) commonly known as the Blue Swimming Crab (BSC) represents a valuable component of crustacean fishery in many parts of the world. In India, it forms a small scale fishery at different regions along the east and west coasts. Along the west coast, the fishery is seasonal except in Gujarat where BSC is landed in almost 8 months. Along east coast, species is landed throughout the year at Palk Bay and Gulf of Mannar and contribute to a major part of the Tamil Nadu BSC catch. A good landing is also recorded from Kakinada Bay, Andhra Pradesh for 3-4 months of the year. Total crab landings in India during 1975-2017 is presented in Figure 1. The landing was around 19,893 tonnes in the 1975, increased over the years and reached 53,476 tonnes in 2017 registering 63% increase in the production. Among the maritime states, Tamil Nadu ranks first in crab landings for the past several years (Fig. 2) and crabs were in the 7th position among the top ten demersal and pelagic fishery resource (12,496 t) obtained from the annual average production in three different sectors (mechanised, motorised & non-motorised) in Tamil Nadu during 2001-2010.
0
10
20
30
40
50
60
70
80
90
0
10
20
30
40
50
60
1975
1977
1979
1981
1983
1985
1987
1989
1991
1993
1995
1997
1999
200
1
2003
200
5
2007
200
9
2011
2013
2015
2017
Percentage
Land
ings
in th
ousa
nd to
nnes
India Tamil Nadu Percentage
Figure 1- Total crab landings (t) in India and Tamil Nadu and its percentage during 1975-2017

Central Marine Fisheries Research Institute14
Figure 2- Total Portunus pelagicus (BSC) landings (t) in India and Tamil Nadu during 2007-2017
Portunus pelagicus is widely distributed throughout the Indo-West Pacific region and there have been indications that it may be a species complex. The systematics of the Portunus pelagicus (Linnaeus, 1758) has been recently revised by Lai et al., (2010) and four distinct species, P. pelagicus (Linnaeus, 1758), P. segnis (Forskål, 1775), P. reticulatus (Herbst, 1799) and P. armatus (A. Milne-Edwards, 1861), are recognised based on morphological and DNA characters as well as biogeographical considerations. Morphological examinations of P. pelagicus from different locations of India show that several distinct colour morphs exist. Josileen et al. (2014) studied the taxonomic characters of Portunus pelagicus species complex in Palk Bay and Gulf of Mannar region using morphological and mitochondrial DNA markers, which suggest the existence of two species i.e., Portunus reticulatus and P. pelagicus. However, in this document Portunus pelagicus (BSC) is used, as it is widely identified by that name.
History of BSC Fishery
Blue swimming crab fishing with traditional craft and gears may have started very long back and exact details of its genesis are not available. Perhaps, the first report on its fishery and fishing methods exclusively from the area was published in 1952 by Prasad and Tampi, and later in 1978 by Ameer Hamsa. However, the earlier report does not include estimates on total production or catch per unit effort for this commercially important crab. The latter publication, gave an account of its fishery from Palk Bay and Gulf of Mannar, the catch per unit effort at the three landing places Devipattanam, Vedalai and Mandapam for the period 1972-74. Later, Josileen (2001) and Josileen & Menon (2007) were also elaborated on the fishery and species growth parameters.
0
2000
4000
6000
8000
10000
12000
14000
16000
2007 2008 2009 2010 2011 2012 2013 2014 2015 2016 2017
All India Tamil Nadu
Land
ings
in to
nnes

Fishery Management Plan for Palk Bay Blue Swimming Crab 15
2. Material and methods
Estimation of Marine fish landings in India
The catch and effort data in the present work were obtained from the National Marine Fishery Resources Data Centre (NMFDC) of CMFRI. The data was collected through an observer based stratified multi-stage random sampling technique which estimates species-wise/Zone-wise/centre-wise landings. In this, the stratification is over space and time. Over space, each maritime state is divided into suitable, non-overlapping zones on the basis of fishing intensity and geographical considerations. The number of centres may vary from zone to zone. These zones have been further stratified into substrata, on the basis of intensity of fishing. There are some major fisheries harbours/centres which are classified as single centre zones for which there is an exclusive and extensive coverage. The stratification over time is a calendar month. One zone and a calendar month is a space-time stratum and primary stage sampling units are landing centre days (Fig.3).
For example, if in a zone, there are 20 landing centres, there will be 20 x 30 = 600 landing centre days in that zone for that month (of 30 days). For observation purpose, a month is divided into 3 groups, each of 10 days. From the first five days of a month, a day is selected at random, and the next 5 consecutive days are automatically selected. From this three clusters of two consecutive days are formed. For example, for a given zone, in a given month, from the five days if the date (day) selected at random is 4, then these clusters are formed, namely, (4, 5); (6, 7) and (8, 9) in the first ten-day group. In the remaining ten day groups, the clusters are systematically selected with an interval of 10 days. For example, in the above case, the cluster of observation days in the remaining groups are (14, 15), (16, 17), (18, 19) (24, 25), (26, 27) and (28, 29). Normally, in a month there will be 9 clusters of two days each. From among the total number of landing centres in the given zone, 9 centres are selected with replacement and allotted to the 9 cluster days as described earlier. Thus in a month 9 landing centre days are observed. The observation is made from 1200 hrs to 1800 hrs on the first day and from 0600 hrs to 1200 hrs on the second day, in a centre. For the intervening period of these two days, the data are collected by enquiry from 1800 hrs of the first day of observation to 0600 hrs of the 2nd day of observation of a landing centre-day, which is termed as 'night landing '. The ̀ night landing' obtained by enquiry on the second day covering the period of 1800 hrs of the first day to 0600 hrs of the next day are added to the day landings so as to arrive at the landings for one (landing centre day) day (24 hours). From the boats, the catches are normally removed in baskets of standard volume. The weight of resource contained in these baskets being

Central Marine Fisheries Research Institute16
known, the weight of resources in each boat under observation is obtained. The weight is recorded rounded to the nearest kilograms against the sampled boat. From each centre, the landing for all the units are added and observation day’s catch is estimated and accordingly monthly zonal landing are estimated and from these, total landings from districts, state and all India are estimated (Srinath et al.,2005).
Tamil Nadu
Puducherry
Andra Predesh Bay ofBengal
ArabianSea
Indian Ocean
Odisha
West Bengal
Kerala
Karnataka
Maharashtra
Gujarat
Goa
Figure 3- Diagram showing the different steps involved Resource Monitoring System (Source: Srinath et al., 2005)
India has a coastal length of 8219 Km and 1265 fish landing
centres
A wide range of fishing craft and gear are employed to fish
Fishes are landed at fishing harbours and landing centres
A scientifically developed statistical design is employed
to collect data
The data is transmitted to headquarters where they are verified, analysed, processed
and stored in a database
Data further processed and used for stock assessment, Resource status, Modelling,
Forecasting and Marine Fisheries Policy
RESOURCE MONITORING SYSTEM

Fishery Management Plan for Palk Bay Blue Swimming Crab 17
Maps
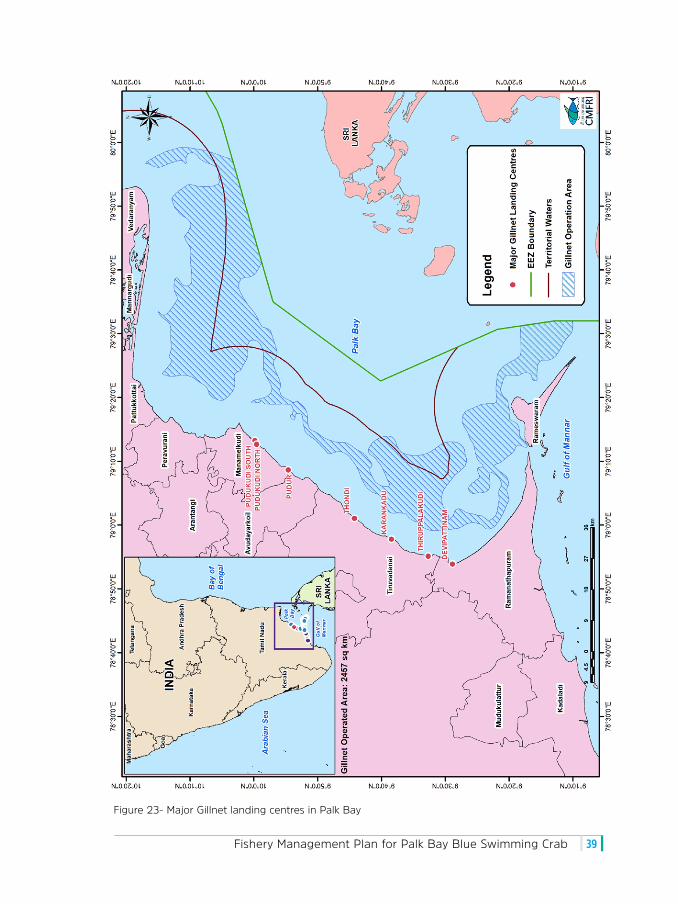
Location maps and fishing operation area maps were prepared using ArcGIS 10.0 and QGIS 2.18.14 software. The extent of sea bottom ecosystems of the Indian side of Palk Bay was extracted from Kasim (2015). The contour lines were derived from 30 arc second bathymetric data obtained from GEBCO database (General Bathymetric Chart of the Oceans) hosted by the British Oceanographic Data Centre (BODC). The landing locations and other details were obtained from CMFRI database. Major trawl and gillnet centres, depth contour and details of ecosystems in Palk Bay etc. are presented as separate maps under respective sections. The total area under gillnet operation in the study region is 2457 km2 and that under trawl operation is 4915 km2.
Estimation of growth parameters in laboratory grown BSC
Growth of BSC from the first instar to stage 16 was studied by rearing the crabs in the laboratory. For this purpose, the juvenile blue swimmer crabs were produced in the hatchery. Forty five healthy crabs (instar I) within a size range of 2.0-2.5 mm carapace width (CW) were used for the experiments (a total of 3 trials, with 15 crabs each). The details are given in Josileen & Menon (2005).
The data of the laboratory rearing experiments on the growth of male and female crabs were entered as a growth increment data file in the computer program FiSAT. Further analysis of growth increment for fitting a growth curve was carried out using Gulland & Holt (1959), Fabens (1965) and Munro’s (1982) methods. The estimates of L∞ and K thus obtained were analysed using the inverse von Bertalanffy growth equation, to arrive at corresponding length at age. The optimum parameters (L∞ and K) were fixed, based on the data obtained during the laboratory growth studies.
Maximum Sustainable Yield (MSY)
Biomass and Yield
Portunus pelagicus in the region are caught in motorized, mechanized and non-motorised gears as directed fishery or as incidental catches. Bottom set gillnets and trawls contribute to a sizeable proportion of the landings. The commercial directed fishery for the resource is mainly by bottom set gillnets and trawls. Trawl fleets have been categorized by a combination of gear and horsepower (MTN, NMTN, MDTN) and the corresponding Catch Per Hour (CPH). CPH in this case was estimated by taking the average weight (kg) per one hour of trawling. The fishing efforts in gillnets were similarly estimated as the actual fishing hour (soak time) of the gear. Due to the importance of CPUE in many stock assessments and the
Central Marine Fisheries Research Institute18
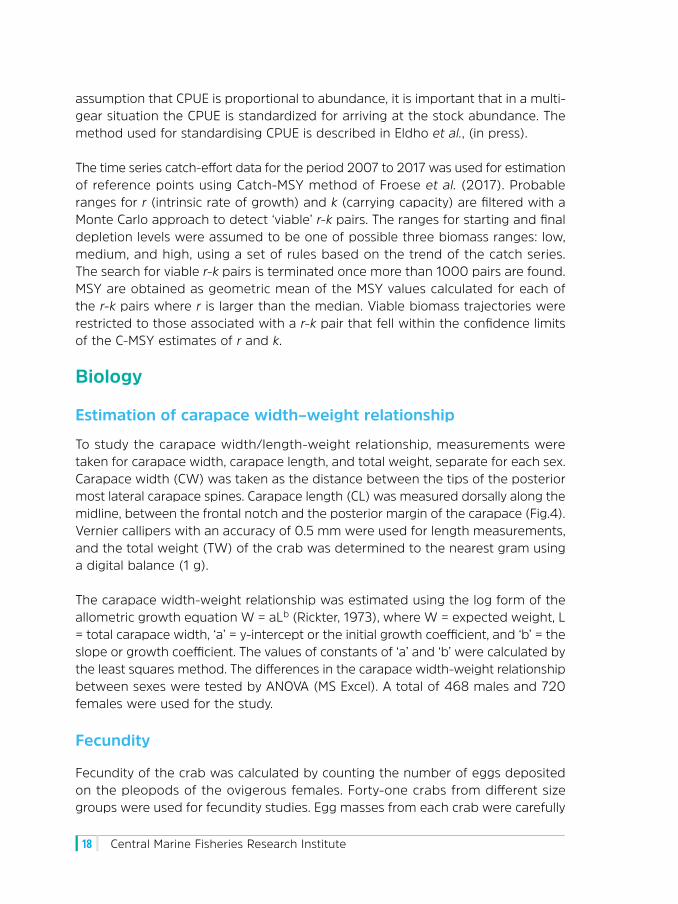
assumption that CPUE is proportional to abundance, it is important that in a multi-gear situation the CPUE is standardized for arriving at the stock abundance. The method used for standardising CPUE is described in Eldho et al., (in press).
The time series catch-effort data for the period 2007 to 2017 was used for estimation of reference points using Catch-MSY method of Froese et al. (2017). Probable ranges for r (intrinsic rate of growth) and k (carrying capacity) are filtered with a Monte Carlo approach to detect ‘viable’ r-k pairs. The ranges for starting and final depletion levels were assumed to be one of possible three biomass ranges: low, medium, and high, using a set of rules based on the trend of the catch series. The search for viable r-k pairs is terminated once more than 1000 pairs are found. MSY are obtained as geometric mean of the MSY values calculated for each of the r-k pairs where r is larger than the median. Viable biomass trajectories were restricted to those associated with a r-k pair that fell within the confidence limits of the C-MSY estimates of r and k.
Biology
Estimation of carapace width–weight relationship
To study the carapace width/length-weight relationship, measurements were taken for carapace width, carapace length, and total weight, separate for each sex. Carapace width (CW) was taken as the distance between the tips of the posterior most lateral carapace spines. Carapace length (CL) was measured dorsally along the midline, between the frontal notch and the posterior margin of the carapace (Fig.4). Vernier callipers with an accuracy of 0.5 mm were used for length measurements, and the total weight (TW) of the crab was determined to the nearest gram using a digital balance (1 g).
The carapace width-weight relationship was estimated using the log form of the allometric growth equation W = aLb (Rickter, 1973), where W = expected weight, L = total carapace width, ‘a’ = y-intercept or the initial growth coefficient, and ‘b’ = the slope or growth coefficient. The values of constants of ‘a’ and ‘b’ were calculated by the least squares method. The differences in the carapace width-weight relationship between sexes were tested by ANOVA (MS Excel). A total of 468 males and 720 females were used for the study.
Fecundity
Fecundity of the crab was calculated by counting the number of eggs deposited on the pleopods of the ovigerous females. Forty-one crabs from different size groups were used for fecundity studies. Egg masses from each crab were carefully

Fishery Management Plan for Palk Bay Blue Swimming Crab 19
removed from the pleopods and weighed accurately using electronic balance. A 0.1 g sample was taken from each egg mass, smeared and dispersed in seawater and were counted through binocular compound microscope. The total number of eggs counted in the sample was then computed. Ocular micrometer (ERMA, Japan) calibrated with stage micrometer was used to take micro metric measurements of eggs in different stages of development. Correlation coefficient (r) was used to determine the fecundity relationship (Snedecor and Cochran, 1967). The relationship between carapace width (CW) and egg mass weight/fecundity; crab weight and egg mass weight/fecundity; egg mass weight and fecundity were determined by regression analysis. Egg mass index was determined using the formula: Egg mass index = Mean egg mass weight x 100/ Mean crab weight.
Food and feeding studies
For food and feeding studies, specimens of Portunus pelagicus were collected from the commercial catches of shrimp trawlers in the Mandapam area (9º20-25' N 79º5-10' E). Samples were collected once a month for a period of one year
Carapace Length (CL)
Carapace Width (CW)
Figure 4- Diagram showing the measurements used carapace width and length in BSC

Central Marine Fisheries Research Institute20
continuously (1997). Studies on food and feeding were carried out following a method adapted from Sukumaran (1995): after recording the carapace width and length and the total weight of the crab, the dorsal side of the body was cut open and the foregut was removed carefully. The fullness of the stomach was visually examined and assessed as 0, 25, 50, 75 or 100%. The foreguts were preserved in 10% formalin for a week, prior to being cut open and their contents transferred into Petri dishes with distilled water. The food components of the gut contents were separated and identified under a compound microscope. As is characteristic of brachyurans, most of the food items were found to be unidentifiable as a result of having been highly crushed and hence only the hard structures that could be identified were relied upon for determining food composition and further evaluation. Gut contents were broadly classified into five categories, as follows:
1. Crustacean remains — penaeid shrimp appendages; body parts of crabs and crab eggs; isopod and stomatopod parts.
2. Fish remains —fins, scales, bones, and vertebrae.3. Molluscan remains— parts of bivalve and gastropod shells.4. Miscellaneous—algal filaments, nematodes, polychaetes, and unidentified items.5. Debris— sand and mud.
Neither the quantity of food nor the food components were significantly different in males and females, and hence the food data for both sexes were combined. Only stomachs that contained food were considered for analysis and calculation. For each specimen, the whole stomach content was segregated according to food-groups, and each group’s contribution was determined visually. Dominance of food groups was evaluated by ranking them by their percentage frequency of occurrence and so-called percentage points. The percentage frequency of occurrence was estimated as: No. of stomachs with particular food group × 100/ Total no. of stomachs with food.
To estimate the volume of the food by food-group, points were assigned to each group as suggested by Stehlik (1993): to quote one example, a food group that formed 50% of the total food content of a stomach that was 50% full, was assigned 25 points (50 points × 0.50). Percentage points were thus estimated as: Point of the particular food group × 100/ Total points of all food groups.

Fishery Management Plan for Palk Bay Blue Swimming Crab 21
3. Results
3.1. General description of Palk Bay
Palk Bay is a shallow, confined, comparatively calm sea falling between Tamil Nadu in India on the western side and North western Province of Sri Lanka on the east, with three openings, one into the Bay of Bengal on the northeast, another a shipping channel into the Gulf of Mannar on the south and the third one a shallow opening into the Gulf of Mannar on the east littered with a series of sandy islets called Adam’s Bridge. It was being used historically and peacefully by the coastal fishers of both the countries since time immemorial till the time when the International Maritime Boundary Line (IMBL) was introduced dividing the Bay into the Indian side (west) and Sri Lankan side (east) by an agreement in 1974 followed by another in 1976. The IMBL is only 6.9 km away from Dhanushkodi, 11.5 km away from Rameswaram, 15.9 km away from Point Calimere, 23 km away from Vedaranyam and 24.5 km away from Thondi (Kumaraguru et al, 2008).
3.2. Different sea bottom ecosystems on the Indian side of Palk BayThe productivity of the near shore water depends mainly on the nature of sea bottom ecosystem. As described by the expert fishers of the respective regions, underwater diving survey carried out by the artificial reef deployment team of CMFRI and the underwater sea grass and sea weed survey team of CMFRI, the sea bottom ecosystem of Tamil Nadu near shore waters of Palk Bay consisted of muddy (13%), sandy(6%), sea grass bed (20%) and rocky (2%) and the so called deeper area of the Indian side of Palk Bay up to all along the International Maritime Boundary Line is reported to be almost sandy/silty (58%), an excellent trawling ground for mechanized trawlers (table 1).

Central Marine Fisheries Research Institute22
Table 1. Different sea bottom ecosystems of Palk Bay
Ecosystem Area (Sq�km) Area (%)
Sandy silty sea bottom 4069 58
Seagrass ecosystem 1430 20
Mudflat ecosystem 933 13
Sandy ecosystem 392 6
Rocky ecosystem 167 2
Total 6991 100
The northern most near shore sea bottom is muddy and it extends up to Sethubavachathram in the south, where the sea grass starts appearing as the sea bottom changes from muddy to sandy and mixture of both. Further down south up to Morepanai in Ramanathapuram district the sea bottom along coastal area is full of sea grasses of different varieties indicating that the sea bottom is sandy and sparsely muddy. The sandy ecosystem mixed sparsely with rocky terrain is witnessed further down south from Morepanai to Mudiveeranpattinam near Aathangarai and then the sea bottom was noticed to be completely rocky from Mudiveeranpattinam to Pamban bridge followed by sandy sea bottom till the end of Tamil Nadu side of Palk Bay up to Arichal Munai near Adam’s bridge. Map of the Palk Bay showing different depth contours and different ecosystems are shown in Figure 5.
The entire coast of Pudukkottai and northern Ramanathapuram districts are very rich in seagrasses and seaweeds. Extensive surveys and research on seagrasses and seaweeds were carried out by different research organisations such as, CMFRI, Sugandhi Devadason Marine Research Institute (SDMRI) and OMCAR Foundation. SDMRI (2013) has reported all the 14 species of seagrasses found all over the world to occur and Thalassia hemprichii, Syringodium isoetifolium and Cymodocea serrulata are the dominant species. The luxuriant growth was reported in Puthupattinam, Mullumunai and Thondi zones. The distribution from shore towards the sea ranged between 3.5 km and 8.56 km. While the zones of Iranianvalasai, R. Puthur, Kottaipattinam and Athiramapattinam had seagrass cover to a distance of 7 km from shore and minimal cover was observed in other zones up to 3.5 km from shore.
The treasure of seagrass in Palk Bay, however, faces threat from human activities and environmental degradation as nearly 20 per cent of healthy seagrass beds were already degraded in the stretch owing to the use of bottom trawling by the mechnaised boats, shore seine and push nets by the traditional fishermen (Mathews et al., 2010). The average macro faunal density on seagrass beds in Palk Bay are given in Table-2 and Table-3 lists the crustacean species/groups in seagrass areas of Palk Bay.

Fishery Management Plan for Palk Bay Blue Swimming Crab 23
Figure 5- Map Showing the depth contour and nature of ecosystems in Indian Palk Bay (Source: Kasim,2015)

Central Marine Fisheries Research Institute24
Table 2. Average macro faunal density (no./ 5 m2) in seagrass beds in Palk Bay
Fauna Nearshore Zone Middle Zone Offshore Zone
Crustaceans 0.99 1.24 0.65
Bivalves 2.34 2.85 1.23
Gastropods 3.26 4.25 1.56
Polychaetes 1.34 1.45 0.56
Echinoderms 1.75 1.35 0.53
Ascidians 0.63 0.56 0.32
Sea Anemones 1.11 1.56 0.86
Sponges 0.62 0.78 0.34
Source: Mathews et al.,2010
Table 3. List of Common Crustaceans/groups in the Seagrass Area
Crustaceans Gulf of Mannar Palk Bay
Portunus pelagicus ü ü
Calappa sp. ü ü
Charybdis natator ü ü
Amphipods ü ü
Isopod ü ü
Source: Mathews et al.,2010
3.3. Area, districts and Zone-wise landing centres of Palk BayThe total spread area of Palk Bay is estimated to be 13,892 sq. km which is equally divided into 6,991 sq.km each between India and Sri Lanka. The width of Palk Bay between Tamil Nadu and Sri Lanka varies between 64 and 137 km. The maximum depth recorded is 15 m with an average of 9 m. This critical shallowness is considered to be the backbone of its productivity which in turn supports a wide diversity of marine living resources and also related diversified livelihoods (Kasim, 2015).
Palk Bay covers a coast line of around 296 kilometers (Stephen et al., 2013) along Tamil Nadu, stretching from Kodiakarai (Point Calimere) in Nagapattinam district to Dhanushkodi in Ramanathapuram district, encompassing 5 revenue districts in Tamil Nadu. The split up of the coastline indicate that Nagapattinam district has 58 km, Thiruvarur 19 km, Thanjavur 29 km, Pudukkottai 49 Km and Ramanathapuram 141 Km. Out of the five coastal districts which border the Palk Bay only 3 districts are actively involved in fishing and Ramanathapuram (CMFRI fishing zone -11-Palk

Fishery Management Plan for Palk Bay Blue Swimming Crab 25
Figure 6- Map of fish landing centres in three coastal districts of Palk Bay showing important BSC centres

Central Marine Fisheries Research Institute26
Bay) is the major district comprising about 54 major and minor landing centres and also harbours 33 major and minor landing centres along the Gulf of Mannar side. Pudukkottai (CMFRI fishing zone -10) and Thanjavur (CMFRI fishing zone -9) districts have 19 and 25 major and minor landing centres respectively. Details of crab landing centres of the Palk Bay Zones, Ramanathapuram (TN-11), Pudukkottai (TN-10) and Thanjavur (TN-9) are presented in the Figure 6.
3.4. Fisher-folk Population and Fishing Crafts of Palk Bay
Tamil Nadu state has 13 coastal districts and among them Ramanathapuram is the major district with maximum share of landing centres (20.6%), fishing villages (31%) and fishermen population (23.7%). General summary of the coastal districts Ramanathapuram, Pudukkottai and Thanjavur bordering the Palk Bay is given in the Table 4.
According to 2016 marine fisheries census conducted by CMFRI, the details of mechanised, motorised (inboard & outboard) and non-motorised fishing crafts at important landing centres of Thanjavur (TN-9), Pudukkottai (TN-10) and Ramanathapuram (TN-11) are presented in Table 5. A total of 1211 mechanised, 6486 motorised and 4854 non-motorised fishing crafts were there used from these landing centres. Ownership (100% /< 100%) of different category of crafts by fisher-folk of Thanjavur, Pudukkottai and Ramanathapuram coastal districts of Palk Bay is presented in Table 6.
As per the 2016 CMFRI census, the fisher population of Ramanathapuram district was 188915, followed by Thanjavur district 30797 and Pudukkottai 28485. The details of fishermen families at important landing centres are given in Table 7.
Table 4. General summary of Coastal districts of Palk Bay
Dist
rict
Land
ing
cent
res
No�&
(% in
Tot
al
coas
tal d
istr
icts
)
Fish
ing
villa
ges
No�&
(% in
Tot
alco
asta
l dis
tric
ts)
Fish
erm
en fa
mili
esNo
�& (%
in T
otal
coas
tal d
istr
icts
)
Trad
ition
al fi
sher
men
fa
mili
esNo
�& (%
in T
otal
coas
tal d
istr
icts
)
BPL
fam
ilies
No�&
(% in
Tot
alco
asta
l dis
tric
ts
coas
tal d
istr
icts
)
Fish
er fo
lk
popu
latio
nNo
�& (%
in T
otal
coas
tal d
istr
icts
)
Thanjavur 23 (6.59) 31 (5.39) 7070 (3.5) 7062 (3.59) 7066 (3.85) 30797 (3.87)
Pudukkottai 21 (6.02) 34 (5.91) 6645 (3.29) 6514 (3.31) 6456 (3.51) 28485 (3.58)
Ramanathapuram 72 (20.63) 178 (30.96) 42672 (21.14)
39612 (20.13) 36605 (19.93) 188915 (23.74)
Total (13 Districts) 349 575 201855 196784 183683 795708
Source: CMFRI, TN Census report (draft), 2016.

Fishery Management Plan for Palk Bay Blue Swimming Crab 27
Table 5. Details of different fishing crafts used in the major Crab landing centres of Palk Bay
Name of the village Mechanized Inboard Outboard Non-motorized
Sethubavachatram 25 2 20 3
Mallipattinam 84 0 57 0
THANJAVUR TOTAL 203 5 1175 94
Percentage in Total TN 7.72 0.20 6.21 0.63
Pudukudi 0 0 237 2
Jagathapattinam 0 0 18 1
Kottaipattinam 6 69 37 7
PUDUKKOTTAI TOTAL 199 102 1363 693
Percentage in Total TN 7.57 4.08 7.20 4.66
Mandapam 59 31 0 48
Rameswaram 31 2 0 10
Soliakudi 33 0 7 16
Devipattinam (North) 0 2 131 0
Devipattinam (South) 1 0 182 0
Thiruppalakudi (North) 0 0 156 622
Thiruppalakudi (South) 1 3 73 255
Thondi 0 0 128 56
Karangadu 0 0 28 1
RAMANATHAPURAM TOTAL 809 1283 2558 4067
Percentage in Total TN 30.76 51.28 13.51 27.36
TAMILNADU TOTAL 2630 2502 18930 14864
Source: CMFRI, TN Census report (draft), 2016.

Central Marine Fisheries Research Institute28
Table 6. Craft Owned by Fisherfolk along the coastal districts of Palk Bay
Type Thanjavur Pudukkottai Ramanathapuram Thanjavur Pudukkottai Ramanathapuram
100% Ownership <100% Ownership
Mechanized
Trawler 202 189 778 1 3 113
Gilnetter 0 0 13 0 0 5
Ringseiner 1 10 7 0 0 0
Liner 0 0 0 0 0 0
Others 0 0 11 0 0 1
Inboard
Wooden Built 2 41 884 0 0 106
Iron Built 0 0 17 0 0 2
Wood Fiber 3 53 366 0 0 46
Others 0 8 16 0 0 0
Outboard
Catamaran 5 7 13 0 2 1
Dugout canoe 1 6 10 0 0 0
Plank built boat 2 12 204 0 0 5
Plywood boat 0 1 118 0 0 4
Fiber glass boat 1142 1240 2034 8 120 226
Ferro cement boat 0 6 1 0 1 0
Teppa 0 2 23 0 0 0
Others 25 89 155 0 2 11
Dugout canoe 1 8 59
Catamaran 4 171 745
Plank built boat 89 472 1493
Ferro cement boat 0 1 0
Thermocol 0 5 1690
Outrigger canoe 0 1 1
Musula boat 0 17 21
Others 0 18 58
Source: CMFRI, TN Census report (draft), 2016.
Fishery Management Plan for Palk Bay Blue Swimming Crab 29
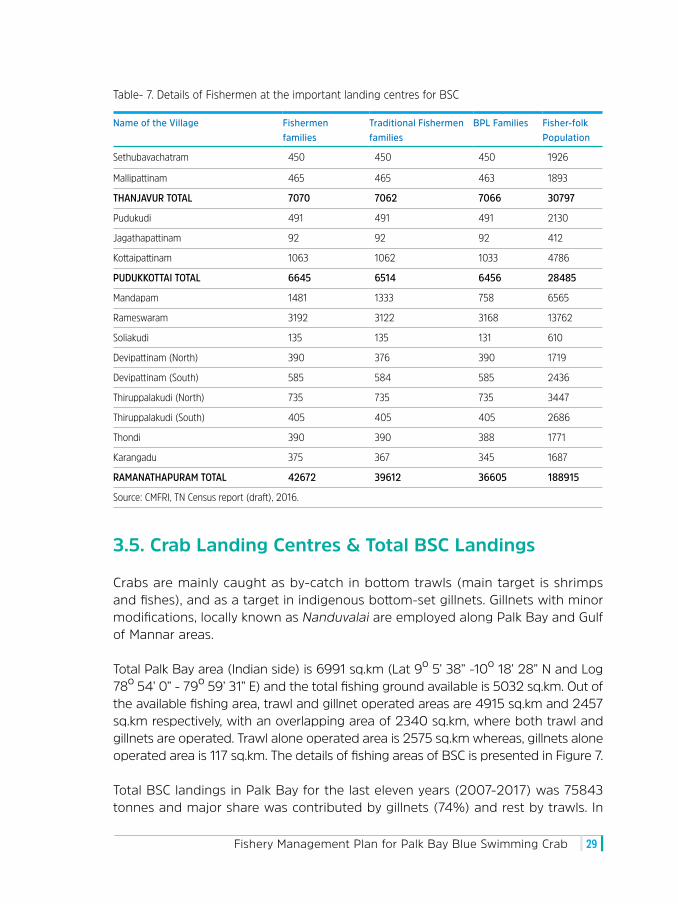
Table- 7. Details of Fishermen at the important landing centres for BSC
Name of the Village Fishermen families
Traditional Fishermen families
BPL Families Fisher-folk Population
Sethubavachatram 450 450 450 1926
Mallipattinam 465 465 463 1893
THANJAVUR TOTAL 7070 7062 7066 30797
Pudukudi 491 491 491 2130
Jagathapattinam 92 92 92 412
Kottaipattinam 1063 1062 1033 4786
PUDUKKOTTAI TOTAL 6645 6514 6456 28485
Mandapam 1481 1333 758 6565
Rameswaram 3192 3122 3168 13762
Soliakudi 135 135 131 610
Devipattinam (North) 390 376 390 1719
Devipattinam (South) 585 584 585 2436
Thiruppalakudi (North) 735 735 735 3447
Thiruppalakudi (South) 405 405 405 2686
Thondi 390 390 388 1771
Karangadu 375 367 345 1687
RAMANATHAPURAM TOTAL 42672 39612 36605 188915
Source: CMFRI, TN Census report (draft), 2016.
3.5. Crab Landing Centres & Total BSC Landings
Crabs are mainly caught as by-catch in bottom trawls (main target is shrimps and fishes), and as a target in indigenous bottom-set gillnets. Gillnets with minor modifications, locally known as Nanduvalai are employed along Palk Bay and Gulf of Mannar areas.
Total Palk Bay area (Indian side) is 6991 sq.km (Lat 9º 5’ 38” -10º 18’ 28” N and Log 78º 54’ 0” - 79º 59’ 31” E) and the total fishing ground available is 5032 sq.km. Out of the available fishing area, trawl and gillnet operated areas are 4915 sq.km and 2457 sq.km respectively, with an overlapping area of 2340 sq.km, where both trawl and gillnets are operated. Trawl alone operated area is 2575 sq.km whereas, gillnets alone operated area is 117 sq.km. The details of fishing areas of BSC is presented in Figure 7.
Total BSC landings in Palk Bay for the last eleven years (2007-2017) was 75843 tonnes and major share was contributed by gillnets (74%) and rest by trawls. In

Central Marine Fisheries Research Institute30
Figure 7. Map showing major crab landing centres and crab fishing areas of the Palk Bay

Fishery Management Plan for Palk Bay Blue Swimming Crab 31
gillnets maximum landing was recorded in 2010 (6576 tonnes) whereas in trawls maximum was recorded in 2008 (2472 tonnes). During last four years (2014-’17) landings both in gillnet and trawls showed a declining trend. Among the districts, maximum landing (22888 tonnes) was contributed by Pudukkottai (TN-10) followed by Thanjavur (TN-9) and Ramanathapuram (TN-11), 20721 tonnes and 12988 tonnes respectively. Year-wise details are presented in Figures 8 & 9.
0
1000
2000
3000
4000
5000
6000
Tonn
es
7000
8000
9000
2007 2008 2009 2010 2011 2012 2013 2014 2015 2016 2017
Total Gill Net Trawl
0
1000
2000
3000
4000
5000
6000
7000
2007 2008 2009 2010 2011 2012 2013 2014 2015 2016 2017
Land
ings
(To
nnes
)
Thanjavur (TN-9) Pudukko ai (TN-10) Ramanathapuram (TN-11)
Figure 8- Total Portunus pelagicus (BSC) landings at Palk Bay
Figure 9- Total BSC landings (other than trawl) from the coastal districts of Palk Bay during 2007-17

Central Marine Fisheries Research Institute32
3.6. BSC Catch and Catch trends
3.6a. Trawl
At Mandapam, one of the major BSC landing centre, bottom trawlers land P. pelagicus catch along with other resources. This fishing is an year round process (except during ban period of April-May) along Palk Bay while at Gulf of Mannar fishing activities are restricted for the season, October-March. The trawlers either operate both during day-night or night only and the fishing area is upto a maximum of 50 m in the Gulf of Mannar side, with normal fishing in grounds less than 25 m of depth. However, in Palk Bay maximum depth is 15 m and main fishing operation happens in less than 10 m depth (Fig.10).
Among the trawlers, overall length of the boat range is 15-20 m and horsepower varies between 110-400 HP. At Mandapam trawlers engine power ranged between 110-200 HP and at Rameswaram and Pamban boats are bigger with 400 HP engines. The strength of the crew is between 3-4 at Mandapam and 5-6 persons per boat at Rameswaram. Other major trawl landing centres of Palk Bay are Soliakudi, Jagathapattinam, Kottaipattinam, Sethubavachathram and Mallipattinam and their locations are shown in the Figure 11.
Figure 10. Mandapam trawl landing centre at Palk Bay

Fishery Management Plan for Palk Bay Blue Swimming Crab 33
Figure 11. Map showing major trawl landing centres of the Palk Bay

Central Marine Fisheries Research Institute34
Palk Bay total BSC trawl landings during 2007-2017 was 19320 tonnes with an average landing of 1756 tonnes, catch per unit effort 9.5 kg and catch rate (catch per hour) 0.57 kg. The highest landing was recorded in 2008 (2472 tonnes) and lowest in 2017 (1218 tonnes). Overall, the landings were fluctuating during 2007-2013 period and thereafter showed a declining trend. Maximum share was contributed by Rameswaram (5488 tonnes), followed by Mandapam (4150 tonnes) and Kottaipattinam (2846 tonnes) landing centres. Total BSC landings in trawls and centre-wise landings for the 2007-2017 period are presented in the Figures 12-21.
1756
0.57
9.50
0
2
4
6
8
10
12
14
0
500
1000
1500
2000
Tonn
es
2500
3000
2007 2008 2009 2010 2011 2012 2013 2014 2015 2016 2017 Average
Total Catch(t) CPH(Kg) CPUE (Kg)
0
200
400
600
800
1000
Tonn
es
2007 2008 2009 2010 2011 2012 2013 2014 2015 2016 2017
Mandapam Rameswaram Soliakudi Mallipa�inam Sethubavachatram Ko aipa inam Jagathapa inam
Figure 12- Total BSC landings from trawl at Palk Bay during 2007-2017
Figure 13- Total BSC landings from trawl centres of Palk Bay during 2007-2017

Fishery Management Plan for Palk Bay Blue Swimming Crab 35
0
2
4
6
8
10
12
14
16
0 50
100 150 200 250 300 350 400 450 500
2007 2008 2009 2010 2011 2012 2013 2014 2015 2016 2017
Kilogram To
nnes
Total Landings (t) CPH (Kg) CPU (Kg)
Tonn
es
Kilogram
0 2 4 6 8 10 12 14 16
0
200
400
600
800
1000
2007 2008 2009 2010 2011 2012 2013 2014 2015 2016 2017
Total Landings (t) CPUE (kg) CPH(Kg)
0 1 2 3 4 5 6 7 8 9 10
10 20 30 40 50 60 70 80 90
100 110
2007 2008 2009 2010 2011 2012 2013 2014 2015 2016 2017
Total Landings (t)
Tonn
es
Kilogram
CPUE (kg)
CPH(Kg)
Figure 14- Total BSC landings from Mandapam (PB) during 2007-2017
Figure 15- Total BSC landings from Rameswaram (PB) during 2007-2017
Figure 16- Total BSC landings from Soliakudi (PB) during 2007-2017

Central Marine Fisheries Research Institute36
0
2
4
6
8
10
12
14
0
50
100
150
200
250
300
350
400
2007 2008 2009 2010 2011 2012 2013 2014 2015 2016 2017
Total Landings (t) CPUE (kg) CPH(Kg)
Tonn
es
Kilogram
0
2
4
6
8
10
12
14
16
0
50
100
150
200
250
300
350
2007 2008 2009 2010 2011 2012 2013 2014 2015 2016 2017
Total Landings (t) CPUE (kg) CPH(Kg)
Tonn
es
Kilogram
0
5
10
15
20
25
0 20 40 60 80
100 120 140 160 180 200
2007 2008 2009 2010 2011 2012 2013 2014 2015 2016 2017
Total Landings (t) CPUE (kg) CPH(Kg)
Tonn
es
Kilogram
Figure 17- Total BSC landings from Jagathapattinam (PB) during 2007-2017
Figure 18- Total BSC landings from Kottaipattinam (PB) during 2007-2017
Figure 19- Total BSC landings from Sethubavachatram (PB) during 2007-2017

Fishery Management Plan for Palk Bay Blue Swimming Crab 37
3.6b. Gillnet
At many centres in Palk Bay such as Thondi, Karankadu, Devipattinam etc., crab fishery is exclusively by a traditional set gillnet known as nanduvalai, which is in use for several decades in the area. Earlier days fishermen used dug-out canoes with overall length varying between 3-7 m with 2-3 crew members which is locally known as Vathai. Later they started using similar type of bigger crafts in a size range of 7-12 m, commonly known as Vallam and accommodates 3-4 fishermen. These traditional crafts usually carry 15-20 nets depending on the number of crew.
However, in recent years 95% of these wooden crafts been replaced with fibre glass boats and their overall length range between 7.5-10 m. A single craft carries 30-35
0
5
10
15
20
25
30
0
50
100
150
200
250
300
350
2007 2008 2009 2010 2011 2012 2013 2014 2015 2016 2017
Total Landings (t) CPUE (kg) CPH(Kg)
Tonn
es
Kilogram
0
10
20
30
40
50
60
0
100
200
300
400
500
600
700
Jan Feb Mar Apr May Jun Jul Aug Sep Oct Nov Dec
Tonnes Tonn
es
Total monthly Landings (2007-2017)
Monthly Total BSC Landing Monthly Average BSC Landing
Figure 20- Total BSC landings from Mallipattinam (PB) during 2007-2017
Figure 21- Monthly BSC trawl landings (t) at Mandapam (PB) during 2007-2017

Central Marine Fisheries Research Institute38
nets; boat owner carries 15 numbers and other crew 10 each. Each net is 60-100 m in length and 90-120 cm in height, many of these joints are tied together to make up the length of each nanduvalai to 1000-1200 m. The netting is made of high-density nylon mono-filament with a stretched mesh of 80-110 mm. The head rope is a nylon with a 1.5 cm in thickness and small floats are attached at intervals of about one and a half feet or marked by flag and the foot rope is with small sinkers. Each sinker weighs about 20g and in one complete stretch of net a total of 350 numbers of sinkers are used weighing about 7kg in total weight. These help the bottom of the net to rest firmly on the sea bed or little above, and the net form a loose upright wall making the crabs entangle in it. Both sides of the nets also attached to an anchor and flags will be attached as a warning to other fishing crafts passing through the area. Some fishers use GPS to mark the position of the set nets. Each nanduvalai weighs about 35-40 Kg, comprising the weight of the nets, sinkers and floats. Total cost of the unit of nanduvalai is approximately Rs.7000/-.
The above is a general description about the nanduvalai; however, few variations have been noticed in size of the net and other aspects of crab nets used in different localities. Diagrammatic sketch of crab net used in 1950’s is shown in Fig. 22 and major gillnet landing centres of Palk Bay are presented in the Figure 23.
The nets are used in fleets; several nets are tied end to end forming a long chain. Nets are spread parallel to the coastal line to a maximum length of 1 to 1.2 km in a single stretch in same direction and then to the opposite direction for the same length so that finally these nets form few rows, covering a considerable area in the sea. A decade back, majority of the boats were non-motorised and fishermen set sail for fishing during evening hours, carrying the fleet of these nets. One person rudders the Vathai or Vallam, while others lay the net at a depth of 4-5 metres
Bridle Wooden floatFloat
Stone Weight Source: Prasad and Thampi (1952)Stone Weight Load Weight
Figure 22- Diagram showing model of a crab net used in 1950’s.
Fishery Management Plan for Palk Bay Blue Swimming Crab 39
Figure 23- Major Gillnet landing centres in Palk Bay

Central Marine Fisheries Research Institute40
and about 1.0 to 3 km from the shore. During those days the actual fishing period was three hours only i.e. in the first hour they spread the net, next one hour they will wait for entangling crabs and third hour will be spent for hauling the nets with entangled crabs. The crabs which try to cross the long chain of net get themselves further entangled in the meshes and cling to the nets. The entangled crabs are removed from the nets with much care and skill without breaking its appendages. These crabs are either sold in the local market or to the wholesale merchants.
However, this situation is changed, at present majority of the boats are motorised and fishermen go for fishing at afternoon hours and come back early morning hours around 5 am. Some fishermen come back to shore after laying the nets and then go back at the early morning to take out the gears and reach the shore around 7-8 am. They fish from deeper areas of 8-10 meters at a maximum distance of 10-12 Km. The nets are hauled manually, however the fishermen use inboard (IB) or outboard (OB) engines to reach the fishing ground. When gillnets carrying vessels are fitted with IB it is classified as IBBSGN (Inboard Bottom-set Gillnet) and if it
Figure 24- Crab fishing boat with an Outboard (OB) engine
Figure 25- A traditional craft Vathai with sail used for crab fishing in Palk Bay
Figure 26- BSC landing centre at Karankad, Palk Bay

Fishery Management Plan for Palk Bay Blue Swimming Crab 41
is OB, it known as OBBSGN (Outboard Bottom-set Gillnet; Fig. 24). In some areas few crafts are still without any motorisation, working solely with sail and wind, those non-mechanised/ non-motorised are known as NMBSGN (Non-mechanised Bottom-set Gillnet; fig.25). In OBBSGN, an outboard motor is the propulsion system for boats, consisting of a self-contained unit that includes engine, gearbox and propeller or jet drive, designed to be affixed to the outside of the transom. They are the most common motorized method of propelling small crafts. In IBBSGN an inboard motor is a marine propulsion system for boats which is enclosed within the hull of the boat, usually connected to a propulsion screw by a drive-shaft. Motorised units use 9-10 HP engines (Kirloskar, Kangaroo, Texmo etc.) and total cost of the craft including engine ranges between Rupees 2-2.5 lakhs.
Figure 27- A Crab fisherman with nanduvalai
Figure 28- Crab fishers cleaning their nets after landing the day’s catch – A view from Damodirapattinam, Palk Bay

Central Marine Fisheries Research Institute42
Major crab landing centres have collection centres of crab processing companies and crab catch is directly sold to the companies. The present whole sale price of BSC is between Rs.250-300/Kg. These centres also have the steam cooking facility and crabs landed are steam cooked in fresh condition. After cooling, the cooked crabs are packed in polythene bags (approximately 8 kg/bag) and transported to the processing units. Details of total BSC landings and catch details (other than trawl) from Palk Bay is presented in the Figure 31.
Figure 30- Crab landing centre at Thondi
Figure 29- Devipattinam Crab landing centre at dawn with crab boats

Fishery Management Plan for Palk Bay Blue Swimming Crab 43
The year-wise total BSC landings in gillnets and catch rate (CPUE & CPH) in Zones TN-11, TN-10 & TN-9 are given in Figures 32 to 36. Crabs are the major species (>95%) landed in this gear. By-catch of other species is very meagre. Species composition of crabs shows that in TN-11 (Ramanathapuram) 98.24% of the landing comprised of BSC, 1.5% by P. sanguinolentus and 0.2% by Charybdis natator during 2007-2017; In TN-10 (Pudukkottai), 98.65% by BSC and rest by P. sanguinolentus and TN- 9 (Thanjavur) 99.53% was by BSC only.
BSC gillnet landings at Ramanathapuram during 2007-2017 mainly contributed by four type of gillnets i.e., OBBSGN (7306 tonnes), NMBSGN (1943 tonnes), IBBSGN (739 tonnes) and OBGN (547 tonnes). Among these, OBBSGN’s share was consistently good and during the period contributed 70% of the BSC landings in the zone. From 2013 onwards, NMBSGN and IBBSGN landings were very poor and OBGN showed an increasing trend. Year-wise details are given in Figure 32.
0
2
4
6
8
10
12
14
16
0
1000
2000
3000
4000
5000
6000
7000
2007 2008 2009 2010 2011 2012 2013 2014 2015 2016 2017
Total Landing(t)
Tonn
es
Kilogram
CPH (Kg)
CPU (Kg)
0 10 20 30 40 50 60 70 80 90 100
0
200
400
600
800
1000
1200
1400
2007 2008 2009 2010 2011 2012 2013 2014 2015 2016 2017
percentage
tonn
es
OBBSGN NMBSGN IBBSGN OBGN OBBSGN NMBSGN IBBSGN OBGN
Figure 31- Total BSC landings from Palk Bay (Other than trawl) during 2007-2017
Figure 32- BSC landings in gillnets and their percentage at TN-11 (Ramanathapuram) during 2007-2017

Central Marine Fisheries Research Institute44
Catch rate of these four gillnets is presented in Figure 33. Catch rate in IBBSGN recorded a sudden increase in 2012 though the catches almost uniform during 2011 & 2012. It was due to drastic reduction in effort (54%) than 2011 and in the following year (2013) number of units further reduced by 93% and contribution by the IBBSGN was only1.68 tonnes, recording reduction in both catch per unit effort (CPUE) and catch per hour (CPH).
At Pudukkottai (TN-10) during 2007-2017, BSC gillnets landings were mainly contributed by OBBSGN. On an average, 89% of the landing was contributed by them and in some years (2009,2011, 2013 & 2014) almost 99 % of the entire catch was landed by OBBSGN. Non- mechanised gillnets (NMBSGN) not been operating since 2013 and OBGN contributed a small share during 2011-2012 & 2015-2017 (<1 to <5%). The OBBSGN landings during the period is presented in the Figure 34.
0.0
0.2
0.4
0.6
0.8
1.0
1.2
1.4
1.6
1.8
2.0
0
5
10
15
20
25
2007 2008 2009 2010 2011 2012 2013 2014 2015 2016 2017
IBBSGN (CPUE) NMBSGN(CPUE) OBBSGN(CPUE) OBGN(CPUE) IBBSGN (CPH) NMBSGN(CPH) OBBSGN(CPH) OBGN(CPH)
Kilo
gram Kilogram
0
10
20
30
40
50
60
70
80
90
100
0
500
1000
1500
2000
2500
3000
3500
4000
2007 2008 2009 2010 2011 2012 2013 2014 2015 2016 2017
Total Landing
Percentage in all gears
CPUE(Kg)
CPH (Kg) Tonn
es
Figure 33- Catch rate of BSC in gillnets at TN-11 (Ramanathapuram) during 2007-2017
Figure 34- BSC landings in major gillnet at TN-10 (Pudukkottai) during 2007-2017

Fishery Management Plan for Palk Bay Blue Swimming Crab 45
At Thanjavur, during 2007-2017, major portion of the gillnet landing was contributed by OBBSGN (84%) and other main contribution was by OBGN (10%). In OBBSGN maximum landing was recorded during 2010 (3296 tonnes) and in OBGN during 2012 (384 tonnes). In OBBSGN catch per unit effort (CPUE) ranged between 34.2 kg (2007) & 8.21 kg (2014) whereas, in OBGN it was between 0.5 kg (2009) & 5.65 kg (2010). Catch per hour (CPH) in OBBSGN ranged between 0.51 kg (2014) & 2.2 kg (2007) and in OBGN between 0.1 kg (2007) & 0.45 (2010). Details are presented in the Figures 35-36.
0 10 20 30 40 50 60 70 80 90 100
0
500
1000
1500
2000
2500
3000
3500
2007 2008 2009 2010 2011 2012 2013 2014 2015 2016 2017
OBBSGN (t) OBGN (t) OBBSGN (%) OBGN (%) To
nnes
Percentage
0.00
0.50
1.00
1.50
2.00
2.50
0
5
10
15
20
25
30
35
40
2007 2008 2009 2010 2011 2012 2013 2014 2015 2016 2017
OBBSGN (CPU Kg) OBGN (CPU Kg) OBBSGN (CPH Kg) OBGN (CPH Kg) Kilogram
Kilo
gram
Figure 35- BSC landings in major gillnets at TN-9 (Thanjavur) during 2007-2017
Figure 36- Catch rate of BSC in gillnets at TN-9 (Thanjavur) during 2007-2017

Central Marine Fisheries Research Institute46
3.7. Historic-data in Trawl and Gillnets
Historical information is available on the BSC fishery from the Palk Bay (Ameer Hamsa, 1978; Josileen, 2001; Josileen & Menon, 2007; Rajamani and Palanichmay,2010) included in present study as these would be beneficial to get a better understanding the successive growth of the fishery and to compare the trends.
BSC trawl and gillnet landings in Palk Bay & Gulf of Mannar during 1972-74 was 510 tonnes and 227 tonnes respectively. Year-wise details are presented in the Table 8. During 1995-’98, the total estimated catch of P. pelagicus at Mandapam (Palk Bay) was 502.4 tonnes with an average CPUE (catch per unit effort) and CPH (catch per hour) of 4.2 kg and 0.3 kg respectively and details are presented in Table 9. In all the years, the maximum catch was recorded during June at Mandapam (PB) and the size (CW) composition in fishery was contributed by size ranging from 70-195 mm. The major portion of the catch was contributed by 105-170 mm group in both the sexes. The Maximum recorded size was 195 mm for male and 193 mm for female.
Table- 8. Estimated monthly catches of Portunus pelagicus (tonnes) at Palk Bay & Gulf of Mannar during 1972-1974.
Year 1972 1973 1974
Gear Gillnet Trawl Net Gillnet Trawl Net Gillnet Trawl Net
Jan 20.37 3.74 17.08 11.11 9.87 19.18
Feb 22.50 2.92 14.56 8.38 11.35 7.64
Mar 12.90 2.89 19.36 5.18 14.90 8.34
Apr 12.62 3.25 19.02 6.77 18.73 12.10
May 11.79 2.25 19.18 3.64 15.75 7.82
Jun 13.76 2.69 14.18 3.27 15.58 9.43
Jul 13.01 3.31 14.73 4.24 9.69 6.96
Aug 15.58 2.68 13.06 7.62 13.81 3.86
Sep 12.45 2.87 17.34 8.25 11.68 5.47
Oct 11.34 2.22 14.37 10.66 11.39 9.55
Nov 11.21 2.97 11.66 4.74 12.19 12.07
Dec 10.05 2.84 12.47 6.49 10.14 9.97
Total 167.58 34.63 187.01 80.34 155.07 112.39
Source: Ameer Hamsa (1978)

Fishery Management Plan for Palk Bay Blue Swimming Crab 47
Table- 9. Total Trawl BSC Landings (tonnes) at Mandapam (PB) during 1995-98
Year Total Units
Total Fishing Hours
Total Catch (t)
CPH (kg)
CPUE (kg)
% of Crab in Total Landings
1995-96 41110 535290 197.243 0.39 4.8 3.3
1996-97 41582 540697 181.755 0.33 4.4 3.5
1997-98 36344 475730 123.386 0.26 3.4 2.6
Total 119036 1551717 502.384 0.32 4.2 3.2
Source: Josileen (2001)
At Thirupalakudi the total BSC landings in 2007 & 2008 were 98 t with a CPUE of 5.5 Kg and 57 t with a CPUE of 4.9 kg respectively. The details of BSC landings from Thirupalakudi is given in Table 10. At Devipattinam, the estimated catch for the three years was 108.2 t with a CPUE of 13.3 kg and CPH of 4.4 kg during 1995-’98 (Table 11). The maximum catch was during September in the first year, March in the second year and June in the last year. The fishery was contributed by size range of 81-182 mm. The maximum recorded sizes for male and female were 182 and 176 mm respectively.
Table- 10. Total BSC Landings and catch details at Thirupalakudi (PB) during 2007-08
2007 2008
Months No� of Units
Estimated Catch (kg)
Catch rate (CPU)
No� of units
Estimated Catch (kg)
Catch Rate (CPU)
Jan 1625 12253 7.5 1032 1649 1.6
Feb 1944 14061 7.2 1012 5674 5.6
Mar 1688 13631 8.1 1020 5352 5.2
Apr 1938 12385 6.4 1075 4475 4.2
May 1553 10008 6.4 588 2530 4.3
Jun 336 915 2.7 1038 5001 4.8
Jul 1610 10259 6.4 850 4928 5.8
Aug 1339 6238 4.7 1274 4043 3.2
Sep 1534 6281 4.1 1063 5869 5.5
Oct 1840 4962 2.7 840 5370 6.4
Nov 1274 4479 3.5 805 5877 7.3
Dec 1050 2672 2.5 880 5896 6.7
Total 17731 98144 5.5 11477 56664 4.9
Source: Rajamani & Palanichamy (2010)

Central Marine Fisheries Research Institute48
3.8. By-catch
Crab Gillnets
Crab gillnet, commonly known as nanduvalai mainly target Portunus pelagicus (BSC) and bulk of the landings from the different centres of Thanjavur (TN-9), Kottaipattinam (TN-10) and Ramanathapuram (TN-11) are composed of BSC. Other species included were other crabs and fishes. None of the ETP species protected by GoI were reported in the gillnet landings. The details are provided below and catch composition of other species in three districts are presented in Tables 12-17 (Annexure).
Thanjavur (TN-9)
During 2007-2017, bulk of the BSC landings (84.2%) was contributed by bottom-set gillnet (OBBSGN) and other crabs included were Portunus sanguinolentus (2011 & 2017) and Scylla serrata (2007) and their percentage of contribution was < 1%. Year wise details are presented in the Figure 37 and details of other species are presented in Table 12. Other species contributed 16% and among them, the Waigieu seaperch Psammoperca waigiensis was dominant with 29.9% followed by the stingray Himantura spp. (23.5%), the flower shrimp Penaeus semisulcatus (12%), the Slender bambooshark Chiloscyllium indicum (7.4%), the rabbitfish Siganus spp. (4%), the emperor Lethrinus spp. (3.6%) and the threadfin Polynemus spp. (1.3%).
Pudukkottai (TN-10)
During 2007-2017, more than 50% of the total landings was contributed by bottom-set gillnet (OBBSGN) and it was the dominating gear throughout period, the except for 2016 and 2017 (Fig. 38) and 88.5% of the total BSC catch also recorded from the same gear. Among the crabs landed, 98.7% was BSC, 1.3 % Portunus sanguinolentus and 0.009% Scylla serrata, which was recorded only in 2017 and
Table- 11. Total BSC Landings and catch details at Devipattinam (PB) during 1995-98
Year Total Units Total Fishing Hours Total Catch (t) CPH (kg) CPUE (kg)
1995-96 3937 11811 30.33 2.6 7.7
1996-97 2686 8056 42.615 5.3 15.9
1997-98 1508 4524 35.222 7.8 23.4
Total 8131 24391 108.167 4.4 13.3
Source: Josileen (2001)

Fishery Management Plan for Palk Bay Blue Swimming Crab 49
the details from all the gillnets are presented in the Figure 39. Among the other species Sardinella spp. was dominating with 21.2% followed by Chiloscyllium indicum (4.87%), Penaeus semisulcatus (4.72%), Arius spp. (2.71%), Chiloscyllium spp. (2.61%), Himantura spp. (2.15%) and Siganus spp. (1.75%). More than fifty percent (54.5%) of the catch was comprised by miscellaneous group. The details are given in the Table 13.
Ramanathapuram (TN-11)
During 2007-2017, more than 60% of the BSC catch in the zone was contributed by bottom set gillnet OBBSGN followed by NMBSGN (17.6%) and the details are presented in the Figure 40. Among the crabs landed, 98.3% was BSC, 1.5 % Portunus sanguinolentus and 0.2% Charybdis natator, which was recorded only
0
20
40
60
80
100
2007 2008 2009 2010 2011 2012 2013 2014 2015 2016 2017
% of all species of Crab % of BSC % of all other Spp.
0
10
20
30
40
50
60
70
80
2007 2008 2009 2010 2011 2012 2013 2014 2015 2016 2017 Average
Perc
enta
ge
% OBBSGN %OBGN % OBTN
Figure 37- Catch Composition (%) in OBBSGN at Thanjavur (TN-9) during 2007-2017
Figure 38- Percentage of gear composition in total Landings (TN-10) during 2007-2017

Central Marine Fisheries Research Institute50
in four years in negligible quantities. The details of the species composition are presented in the Figure 41.
Percentage of by catch is less in NMBSGN (8.6%) and IBBSGN (19%) whereas in major contributing gear OBBSGN nearly 40% comprised of other species. The details are presented in Figure 42 and Tables-14-17 (Annexure).
82
84
86
88
90
92
94
96
98
100
2007 2008 2009 2010 2011 2012 2013 2014 2015 2016 2017 Average
P. pelagicus Pe
rcen
tage
P. sanguinolentus
0
10
20
30
40
50
60
70
80
90
100
2007 2008 2009 2010 2011 2012 2013 2014 2015 2016 2017 Average
Perc
enta
ge
IBBSGN NMBSGN OBBSGN OBGN OBTN
Figure 39- Catch Composition (%) of crabs in gillnets at Pudukkottai (TN-10) during 2007-2017
Figure 40- Percentage composition of BSC in different gears at TN-11 during 2007-2017.

Fishery Management Plan for Palk Bay Blue Swimming Crab 51
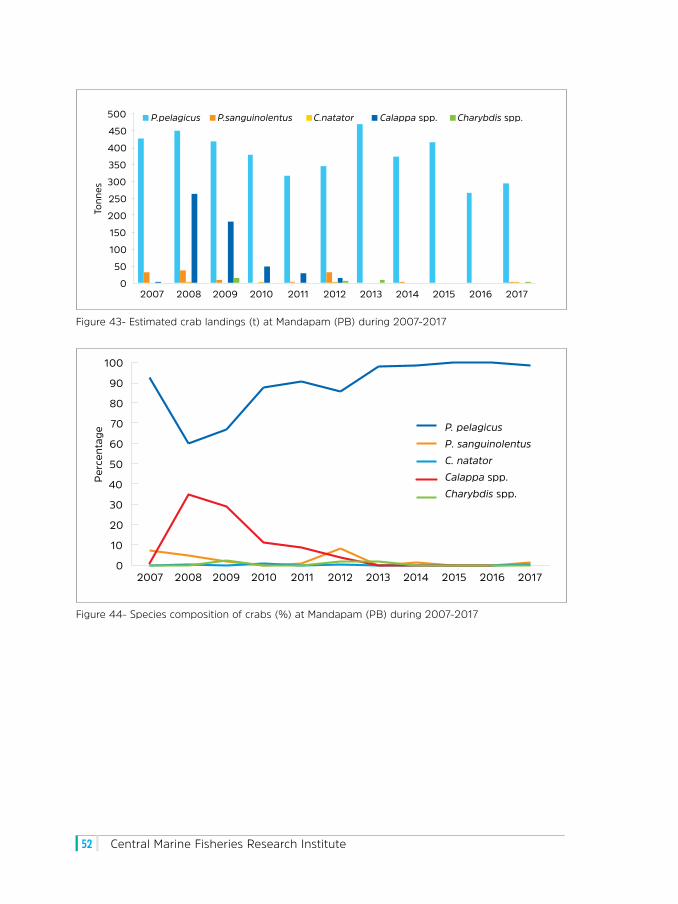
TrawlCrabs are landed as bycatch in trawls which targets for fishes and shrimps. The crabs (BSC) are kept live and individually tied and brought the shore for selling to the merchants in live condition. Among the crabs landed at Mandapam during this period, 89% were BSC and the for the last 4 years their percentage was 99-100%. Other species were Calappa spp. (8%), Portunus sanguinolentus (2.3%), negligible quantities of Charybdis natator, Charybdis spp., and Scylla serrata (only 0.1% in 2010). The details are presented in Figures 43 & 44.
0
10
20
30
40
50
60
70
80
90
100
0
200
400
600
800
1000
1200
1400
1600
1800
2007 2008 2009 2010 2011 2012 2013 2014 2015 2016 2017
P. pelagicus (t) P. sanguinolentus (t) C. natator (t) P. pelagicus (%) P. sanguinolentus (%) C. natator (%)
Tonn
es
Percentage
0
20
40
60
80
100
120
IBBSGN NMBSGN OBBSGN OBGN
perc
enta
ge
Gillnet
Crab Fish & other shellfish
Figure 41- Species composition of crabs in gillnets at TN-11 during 2007-2017
Figure 42- Percentage of resources in gillnets at TN-11 (Ramanathapuram) during 2007-2017
Central Marine Fisheries Research Institute52
0
50
100
150
200
250
300
350
400
450
500
2007 2008 2009 2010 2011 2012 2013 2014 2015 2016 2017
Tonn
es
P.pelagicus P.sanguinolentus C.natator Calappa spp. Charybdis spp.
0
10
20
30
40
50
60
70
80
90
100
2007 2008 2009 2010 2011 2012 2013 2014 2015 2016 2017
P. pelagicus P. sanguinolentus C. natator Calappa spp. Charybdis spp.
Perc
enta
ge
Figure 43- Estimated crab landings (t) at Mandapam (PB) during 2007-2017
Figure 44- Species composition of crabs (%) at Mandapam (PB) during 2007-2017

Fishery Management Plan for Palk Bay Blue Swimming Crab 53
3.9.
Ann
exur
e fo
r Ta
bles
Tabl
e 12
- Cat
ch o
f oth
er s
pecie
s re
cord
ed in
OBB
SGN
(tonn
es)–
Tha
njav
ur d
istric
t (TN
-9)
Spec
ies
2007
2008
2009
2010
2011
2012
2013
2014
2015
2016
2017
Tota
l (t)
%
Ariu
s spp
.1
137
210.
6
Cara
nx sp
p.8
80.
2
Chilo
scyll
ium
indi
cum
163
9473
980
275
7.4
Gerre
s spp
.1
10
Him
antu
ra sp
p.2
168
9943
211
814
045
00
087
823
.5
Kath
ala a
xillar
is0
00
00
05
00
00
50.
1
Leth
rinus
spp.
00
134
00
00
00
00
134
3.6
Misc
ellan
eous
611
438
00
6166
5618
551
3961
616
.5
Mugi
l spp
.0
00
00
06
00
00
60.
2
Pena
eus s
emisu
lcatu
s0
00
00
00
044
60
044
612
Polyn
emus
spp.
00
00
00
480
00
048
1.3
Psam
mop
erca
waig
iensis
015
123
424
210
716
995
6354
10
1116
29.9
Scom
bero
ides
spp.
2121
0.6
Sepi
a ac
ulea
ta3
03
0.1
Sepi
a sp
p.3
30.
1
Sepi
oteu
this
lesso
nian
a3
03
0.1
Sigan
us sp
p.10
134
122
149
4
Tota
l (t)
844
960
880
229
825
326
126
269
451
4337
2910
0.0

Central Marine Fisheries Research Institute54
Tabl
e 13
- Cat
ch o
f oth
er s
pecie
s re
cord
ed in
OBB
SGN–
Pudu
kkott
ai d
istric
t (TN
-10)
Spec
ies
2007
2008
2009
2010
2011
2012
2013
2014
2015
2016
2017
Tota
l (t)
% in
Tot
al
Ariu
s spp
.4
00
00
00
00
061
652.
71
Carc
harh
inus
sorra
h0
00
00
00
00
01
10.
03
Chilo
scyll
ium
indi
cum
00
00
00
00
060
5611
64.
87
Chilo
scyll
ium
spp.
00
00
00
00
00
6262
2.61
Dasy
atis
spp.
00
00
00
00
02
02
0.09
Gerre
s spp
.0
00
00
00
00
03
30.
13
Him
antu
ra sp
p.0
00
00
00
00
051
512.1
5
Meta
pena
eus s
pp.
00
00
00
00
00
55
0.23
Misc
ellan
eous
170
7010
193
150
142
154
169
115
4785
1296
54.5
2
Octo
pus s
pp.
00
00
00
00
10
2828
1.20
Pena
eus s
emisu
lcatu
s11
00
012
00
02
1672
112
4.72
Psam
mop
erca
waig
iensis
00
00
00
00
024
832
1.36
Sard
inell
a sp
p.0
00
00
00
252
252
00
503
21.17
Scol
iodo
n lat
icaud
us0
00
00
00
00
190
190.
78
Sepi
a ph
arao
nis
00
00
00
00
294
06
0.26
Sigan
us ca
nalic
ulat
us0
00
00
00
00
130
130.
55
Sigan
us sp
p.6
00
00
00
00
296
421.7
5
Tera
pon
spp.
00
00
00
00
00
11
0.03
Triac
anth
us sp
p.0
00
00
00
00
01
10.
03
Trich
iuru
s lep
turu
s0
00
00
00
00
00.
20.
20.
01
Upen
eus s
pp.
00
00
00
00
00
1414
0.57
Urot
euth
is du
vauc
elii
00
00
00
00
06
06
0.25
Tota
l19
170
101
9316
214
215
442
037
122
045
223
7710
0.00

Fishery Management Plan for Palk Bay Blue Swimming Crab 55
Tabl
e 14
- Cat
ch o
f oth
er s
pecie
s re
cord
ed in
IBBS
GN–R
aman
atha
pura
m d
istric
t (TN
-11)
Spec
ies
2007
2008
2009
2010
2011
2012
2013
2014
2015
2016
2017
Tota
l (t)
%
Ariu
s spp
.
1005
953
634
0
0
00
0
6369
336
.12
Cara
nx sp
p.
10
584
1058
46.
00
Carc
harh
inus
spp.
2790
2790
1.58
Gerre
s spp
.
24
108
16
8025
788
14.6
2
Him
antu
ra sp
p.
29
4057
12
8652
4.91
Leth
rinus
spp.
1764
16
8034
441.9
5
Lutja
nus s
pp.
560
560
0.32
Misc
ellan
eous
280
1395
16
750.
95
Mugi
l spp
.
37
24
37
242.1
1
Pena
eus i
ndicu
s
1929
19
291.0
9
Pena
eus s
emisu
lcatu
s
39
20
39
202.
22
Penn
ahia
spp.
40
6
406
0.23
Plat
ycep
halu
s ind
icus
60
9
609
0.35
Plat
ycep
halu
s spp
.
44
10
44
102.
50
Psam
mop
erca
waig
iensis
2058
2058
1.17
Scom
bero
ides
spp.
4704
4704
2.67
Scom
bero
mor
us co
mm
erso
n
88
20
88
205.
00
Sepi
a ac
ulea
ta
64
16
64
163.6
4
Sepi
a ph
arao
nis
1116
27
13
630
4459
2.53
Sepi
oteu
this
lesso
nian
a
47
74
47
742.
71
Sigan
us sp
p.
28
028
00.
16
Upen
eus s
pp.
1264
2
12
642
7.17
Tota
l39
0613
003
1474
9171
070
063
00
00
4200
1763
37

Central Marine Fisheries Research Institute56
Tabl
e 15
- Cat
ch o
f oth
er s
pecie
s re
cord
ed in
OBB
SGN–
Ram
anat
hapu
ram
dist
rict (
TN-1
1)
Spec
ies
2007
2008
2009
2010
2011
2012
2013
2014
2015
2016
2017
Tota
l(t)
%
Ariu
s spp
.
3255
0
4340
4629
330
042
1529
3511
8680
1246
239
7302
7.3
Arot
hron
(=Te
trado
n) sp
p.
2940
3780
6720
0.1
Cara
nx sp
p.
9114
1591
333
8817
360
1975
2
6552
71.2
Carc
harh
inus
spp.
9548
8463
18
011
0.3
Chan
os ch
anos
3472
3472
0.1
Chilo
scyll
ium
indi
cum
97
65
3892
2036
445
57
1718
818
0057
566
1.1
Cyno
glos
sus s
pp.
2240
57
87
58
40
1386
70.
3
Deca
pter
us sp
p.
8820
88
200.
2
Gerre
s spp
.
3602
2
3675
011
9535
4381
123
2883
1830
9726
623
6787
2112
.5
Him
antu
ra sp
p.
2236
016
501
6500
1541
9
7595
7174
2
1401
172.
6
Him
antu
ra u
arna
k
1063
3
1063
30.
2
Holo
thur
ia (M
etria
tyla)
scab
ra
5880
58
800.
1
Hypo
loph
us (=
Past
inac
hus)
se
phen
23
87
2387
0.0
Leio
gnat
hus s
pp.
6720
36
260
4620
47
600
0.9
Leth
rinus
spp.
94
40
2461
711
935
18
9047
882
0.9
Misc
ellan
eous
388
3906
60
76
33
869
4423
90.
8
Mugi
l cep
halu
s
1950
2
1724
026
505
6324
71.2
Mugi
l spp
.
23
15
2219
910
52
08
22
2743
341
.0
Nem
atalo
sa n
asus
1272
7
12
727
0.2
Octo
pus s
pp.
2170
7233
1176
821
171
0.4
Otol
ithes
rube
r
20
832
2083
20.
4
Pate
obat
is bl
eeke
ri (H
. bl
eeke
ri)
1302
13
020.
0

Fishery Management Plan for Palk Bay Blue Swimming Crab 57
Spec
ies
2007
2008
2009
2010
2011
2012
2013
2014
2015
2016
2017
Tota
l(t)
%
Pello
na d
itche
la
4410
2061
561
540
1795
510
4520
1.9
Pena
eus i
ndicu
s
71
40
4600
9779
1745
738
976
0.7
Pena
eus m
onod
on
25
3925
390.
0
Pena
eus s
emisu
lcatu
s
26
880
19
964
26
040
19
9617
850
6818
516
0915
3.0
Penn
ahia
anea
(m
acro
phth
almus
)
2940
29
400.
1
Penn
ahia
spp.
2352
7595
1116
1106
30.
2
Plat
ycep
halu
s ind
icus
1527
3
84
15
357
0.3
Polyn
emus
spp.
54
25
5425
0.1
Pom
adas
ys sp
p.
86
8
86
80.
0
Psam
mop
erca
waig
iensis
3472
9135
2048
220
615
1946
898
59
8303
11.5
Sard
inell
a alb
ella
5334
0
53
340
1.0
Sard
inell
a gi
bbos
a
14
980
1498
00.
3
Sard
inell
a lo
ngice
ps
2520
25
200.
0
Scar
us (=
Cally
odon
) spp
.
24
8
24
80.
0
Scom
bero
ides
spp.
22
785
6837
2962
20.
5
Selar
oide
s lep
tolep
is
10
416
1041
60.
2
Sepi
a ac
ulea
ta
61
6073
78
43
171
1446
330
359
5064
765
4815
8726
2.9
Sepi
a ph
arao
nis
2240
9765
6923
51
028
9290
39
038
3259
1215
432.
2
Sepi
a sp
p.
3654
026
040
2470
535
986
36
386
1596
572.
9
Sepi
ella
iner
mis
16
275
16
275
0.3
Sepi
oteu
this
lesso
nian
a
20
365
10
831
5878
311
624
1016
031.9
Sepi
oteu
this
spp.
1367
1
1076
924
440
0.4
Sepi
oteu
this
spp.
1076
910
769
0.2
Sigan
us sp
p.
3255
2170
210
3228
514
000
496
7368
2628
186
065
1.6

Central Marine Fisheries Research Institute58
Spec
ies
2007
2008
2009
2010
2011
2012
2013
2014
2015
2016
2017
Tota
l(t)
%
Sillag
o sih
ama
3724
027
125
6944
7130
91.3
Sphy
raen
a sp
p.
16
520
19
8435
452
6820
6077
61.1
Tera
pon
spp.
2893
3600
16
831
0097
610.
2
Triac
anth
us b
iacul
eatu
s
19
091
1909
10.
4
Triac
anth
us sp
p.
97
9297
920.
2
Turb
inell
a(=
Xanc
us) p
yrum
3906
3906
0.1
Upen
eus s
pp.
2352
7812
6532
9
2432
240
983
14
0798
2.6
Urot
euth
is (=
L. du
vauc
elli)
6491
6491
0.1
Urot
euth
is(Ph
otol
olig
o)(=
Lolig
o) sp
p.
50
63
50
630.
1
Tota
l
56
472
1871
7280
640
1177
6528
8117
623
1343
7113
6283
7563
3347
8854
3828
110
0.0

Fishery Management Plan for Palk Bay Blue Swimming Crab 59
Tabl
e 16
- Cat
ch o
f oth
er s
pecie
s re
cord
ed in
NM
BSGN
–Ram
anat
hapu
ram
dist
rict (
TN-1
1)
Spec
ies
2007
2008
2009
2010
2011
2012
2013
2014
2015
2016
2017
Tota
l(t)
%
Ariu
s spp
.79
0338
23
86
8
1910
00
0
1450
47.8
Gerre
s spp
.13
8021
70
3550
1.9
Him
antu
ra sp
p.
12
4012
400.
7
Leio
gnat
hus s
pp.
651
10
85
17
360.
9
Leth
rinus
spp.
217
15
5
37
20.
2
Lutja
nus s
pp.
310
310
0.2
Misc
ellan
eous
2191
613
373
3574
817
083
6541
6222
10
0883
54.4
Mugi
l cep
halu
s
8680
86
804.
7
Mugi
l spp
.63
11
63
113.4
Nem
atalo
sa n
asus
2713
2713
1.5
Pena
eus i
ndicu
s26
15
2157
1
24
186
13.0
Pena
eus m
onod
on30
20
30
201.6
Pena
eus s
emisu
lcatu
s
33
25
33
251.8
Plat
ycep
halu
s ind
icus
72
3
723
0.4
Psam
mop
erca
waig
iensis
651
651
0.4
Sard
inell
a lo
ngice
ps
37
20
37
202.
0
Sard
inell
a sp
p.
2170
21
701.2
Sepi
a ph
arao
nis
40
0
400
0.2
Sigan
us sp
p.
15
5
15
50.
1
Sillag
o sih
ama
3410
3410
1.8
Tera
pon
spp.
14
47
62
0
20
671.1
Upen
eus s
pp.
1395
1395
0.8
Tota
l43
145
3278
664
876
1708
374
0962
2212
760
00
012
4018
5521
100.
0

Central Marine Fisheries Research Institute60
Tabl
e 17
- Cat
ch o
f oth
er s
pecie
s re
cord
ed in
OBG
N–Ra
man
atha
pura
m d
istric
t (TN
-11)
Spec
ies
2007
2008
2009
2010
2011
2012
2013
2014
2015
2016
2017
Tota
l(t)
%Ab
lenne
s hian
s69
75
69
750.
03Am
blyg
aste
r sirm
(=
Sard
inell
a sir
m)
8370
8370
0.04
Ariu
s spp
.54
336
1407
2510
5381
1574
4117
0016
1043
1476
674
5709
221
7147
2517
0218
3170
1517
998
6.35
Arot
hron
(=Te
trado
n) sp
p.
1176
2726
028
436
0.12
Cara
nx sp
p.92
9369
603
4230
923
380
9685
965
1029
326
1094
1084
287
1357
6250
797
6575
362.
75Ca
rcha
rhin
us sp
p.
86
80
5355
1403
50.
06Ch
anos
chan
os
3472
8333
33
0115
106
0.06
Chilo
scyll
ium
indi
cum
11
848
1519
010
416
4340
65
884
2597
680
106
2137
600.
89Ch
iroce
ntru
s spp
.
5580
12
152
17
732
0.07
Cyno
glos
sus s
pp.
86
810
223
1375
514
5726
303
0.11
Dasy
atis
spp.
19
096
19
096
0.08
Deca
pter
us sp
p.
6468
64
680.
03Du
ssum
ieria
spp.
63
0071
749
49
6083
009
0.35
Gerre
s spp
.16
149
2884
189
531
2435
1212
8357
1340
0119
0728
2854
0117
1843
3474
0137
3078
2008
842
8.40
Hem
iram
phus
spp.
7998
031
249
3280
017
360
1282
5786
814
0798
2921
166
640
7553
450
319
6530
162.
73Hi
lsa ke
lee
15
314
1531
40.
06Hi
lsa sp
p.
46
29
34
944
39
573
0.17
Him
antu
ra sp
p.
30
3886
8060
326
88
20
5425
8628
90.
36Ka
thala
axil
laris
37
80
3780
0.02
Leio
gnat
hus s
pp.
29
241
6820
438
366
5061
056
4220
317
1102
3643
4014
880
4967
439
1510
1.64
Leth
rinus
spp.
5400
42
290
5496
475
591
1122
826
786
5575
937
155
5023
136
648
3960
521.6
6Lo
liolu
s (Ni
ppon
olol
igo)
spp.
2372
5
23
725
0.10
Lutja
nus s
pp.
1350
24
825
4845
1790
0
2064
133
4233
546
0.14
Mega
laspi
s cor
dyla
2100
7750
98
500.
04Mi
scell
aneo
us
420
6615
1260
2205
8736
21
70
2140
60.
09Mu
gil c
epha
lus
1088
143
40
16
478
1070
5
4152
0
1307
4171
202
2858
671.2
0Mu
gil s
pp.
65
1015
190
7922
792
939
6944
6165
5
3018
4
29
2649
1.22
Nem
atalo
sa n
asus
1887
918
879
0.08

Fishery Management Plan for Palk Bay Blue Swimming Crab 61
Spec
ies
2007
2008
2009
2010
2011
2012
2013
2014
2015
2016
2017
Tota
l(t)
%No
tariu
s len
tigin
osus
(=A.
len
tigin
osus
)
21
989
2198
90.
09
Octo
pus s
pp.
3906
1570
032
116
3617
5624
811
1587
0.47
Otol
ithes
rube
r
2604
57
8010
3460
4954
412
783
1741
710.
73Pe
llona
ditc
hela
3780
16
458
2358
151
329
1407
2813
7883
3498
8812
6272
4909
3.03
Pena
eus i
ndicu
s
8680
1461
6
1192
012
203
2232
4965
10.
21Pe
naeu
s mon
odon
1505
1505
0.01
Pena
eus s
emisu
lcatu
s
3183
17
3611
718
3428
4
3704
475
5695
521
0.40
Penn
ahia
anea
(m
acro
phth
almus
)
4199
5
3225
3
7424
80.
31
Penn
ahia
spp.
11
772
9929
10
149
3185
00.
13Pl
atax
spp.
1273
1
12
731
0.05
Plat
ycep
halu
s ind
icus
17
3639
9260
011
312
2025
19
665
0.08
Plat
ycep
halu
s spp
.
4340
372
4712
0.02
Plec
torh
inch
us (=
Gate
rin) s
pp.
2520
1260
0
4620
80
0
2054
00.
09Po
lynem
us sp
p.
69
4431
0037
210
416
0.04
Pom
adas
ys sp
p.
9259
4513
6
54
395
0.23
Psam
mop
erca
waig
iensis
10
416
7425
3255
3897
756
960
1723
464
223
6121
6923
656
9927
9546
1.17
Rast
rellig
er ka
nagu
rta
39
2
39
20.
00Sa
rdin
ella
albell
a13
3920
5620
8615
6798
269
5110
2728
4137
4990
3
6981
842
29.2
1Sa
rdin
ella
gibb
osa
2650
5
26
4978
4777
3914
3766
5728
848
5171
7012
9921
5674
69.
02Sa
rdin
ella
long
iceps
15
5311
15
5311
0.65
Sard
inell
a sp
p.
6697
4500
0
30
886
2170
4500
8556
0
1446
718
9280
0.79
Saur
ida
tum
bil
28
917
36
20
250.
01Sc
arus
(=Ca
llyod
on) s
pp.
17
36
145
900
2781
0.01
Scom
bero
ides
spp.
30
3811
700
85
06
31
234
2280
177
279
0.32
Scom
bero
mor
us co
mm
erso
n
2170
0
31
00
8990
2170
050
455
994
0.23
Selar
oide
s lep
tolep
is
63
900
58
40
2097
790
717
0.38
Sepi
a ac
ulea
ta
3570
4166
9548
4285
392
602
8527
911
0501
2013
8954
9908
2.30
Sepi
a ph
arao
nis
21
713
104
488
7843
030
3858
825
5127
054
544
7491
387
996
4228
251.7
7

Central Marine Fisheries Research Institute62
Spec
ies
2007
2008
2009
2010
2011
2012
2013
2014
2015
2016
2017
Tota
l(t)
%Se
pia
spp.
46
230
46
230
0.19
Sepi
ella
iner
mis
81
3850
686
440.
04Se
piot
euth
is les
soni
ana
17
3688
2084
0939
866
6510
5114
156
584
4677
497
682
3150
3163
2553
2.65
Sepi
oteu
this
spp.
1864
318
643
0.08
Sigan
us ca
nalic
ulat
us
5040
5670
1395
12
105
0.05
Sigan
us sp
p.10
463
6412
1080
0
4532
717
187
5208
710
4032
5586
011
1543
3844
745
2158
1.89
Sillag
o sih
ama
11
393
3763
2
26
0419
560
10
230
6116
248
474
1910
550.
80Sp
hyra
ena
spp.
1088
113
356
6161
235
371
1061
8681
977
8817
328
770
5048
9
1122
2458
9039
2.46
Stol
epho
rus s
pp.
21
0134
3750
2138
840.
89St
rong
ylura
spp.
4590
43
344
6076
1040
9823
800
1622
0218
491
2148
019
8121
9811
268
0314
2.85
Tenu
alosa
ilish
a (=
Hilsa
ilish
a)
3640
1486
818
508
0.08
Tera
pon
spp.
83
7713
888
3780
9383
4666
1463
7
6944
038
196
16
2367
0.68
Thry
ssa
duss
umier
i
1113
9
1113
90.
05Th
ryss
a sp
p.
58
853
494
77
5
5485
70.
23Tr
achi
notu
s spp
.
13
888
1388
80.
06Tr
iacan
thus
biac
ulea
tus
12
586
12
586
0.05
Triac
anth
us sp
p.
2790
0
19
136
4703
60.
20Tr
ichiu
rus s
pp.
1500
620
21
200.
01Ty
losu
rus c
roco
dilu
s 21
168
2279
2708
2
50
529
0.21
Upen
eus s
pp.
1255
522
568
4081
630
059
7796
655
948
1389
3618
1248
9291
642
2058
2608
3813
3590
85.
59Ur
oteu
this(
L. du
vauc
elli)
6089
041
30
756
9367
7514
30.
31Ur
oteu
this=
Lolig
o) sp
p.
46
87
46
870.
02To
tal
4044
4647
0697
7765
9074
4994
1368
927
1550
571
3622
587
2462
920
1956
124
7468
136
3075
059
2390
1051
100.
00

Fishery Management Plan for Palk Bay Blue Swimming Crab 63
4. BSC Price Structure
During 1995, when detailed studies on P. pelagicus was initiated, price of BSC was Rs.35/kg and by the year 2000 it has increased to Rs. 50/kg. Thereafter, the price has gone up as the local/export market, demand of the BSC was increasing steadily and currently the prices varies between Rs. 250-300/ Kg at the wholesale rate. Retail prices are much higher than this.
4.1. Value Chain
The fishers bring the BSC in live condition and sell them to the local merchants, most of them are associated with one of the processing companies. In some areas these traders are selling their crabs exclusively to one company. All the main BSC landing centres have their own crab cooking facilities and are set and maintained by
Figure 45–Steam cooked whole crabs (BSC).

Central Marine Fisheries Research Institute64
the processing companies of the respective areas. After cooking the crabs in steam for 15 minutes and they are spread-out in steel trays for cooling to atmospheric temperature and then packed and transported to mini plants located nearby areas of the landing centres for meat picking (Fig. 45).
The details of raw crab meat utilized by the processing companies are presented Figure 46. This process would be completed within 24-48 hours and from there the picked meat is transported to the main processing plants of the companies ensuring strict quality control protocols. At the processing plants, final products are packed in appropriate cans or plastic containers after grading and shell removal. These containers are pasteurized with automated temperature controlled facilities and stored till shipment. The details of the products are presented in the Figure 47 (Source:CMPA).
0 1000 2000 3000 4000 5000 6000 7000
2001 2002 20032004 2005 2006 2007
2008 2009 2010 20112012 2013 2014 2015 2016 2017
* Total includes BSC catches from Palk Bay, Gulf of Mannar, other areas of TN & Karwar
Figure 46- Total Raw Crab (t) utilized by processing companied during 2001-2017

Fishery Management Plan for Palk Bay Blue Swimming Crab 65
4.2. ExportUnited States of America (USA) has been the biggest market for BSC and 99% of the Indian BSC products are exported to US and the remaining to Australia, Italy, Lebanon, Mauritius and Hong Kong. From India, BSC export is happening since 2001 and for the first four years the import was monopolised by Phillips Foods Inc., Baltimore, Maryland and currently apart from Phillips, five more US companies are importing Indian BSC products. The other companies are Chicken of the Sea Frozen Foods, Handy Seafood Incorporated, Newport International, Trans-Global Inc. and Harbor Seafood Inc.
The current export price for the crab meat ranges between 10-11 US $/ Can (454 g) and it was 12-13 US $/ Can in 2017 and 8-9 US $/ Can during 2015& 2016.
4.3. Crab Processing Companies
Presently seven processing companies are exporting the BSC resource from the region as well as other BSC fishing areas. The Indian Crab Processors Association
Figure 47- Different BSC pasteurised products exported from India a) Jumbo b) Super lump c) Lump d) Special e) Claw meat f) Claw finger
a
d
b
e
c
f

Central Marine Fisheries Research Institute66
(ICPA) was established in 2013 with their head office at Tuticorin, Tamil Nadu. In 2016, they have rechristened the association as Crab Meat Processors Association (CMPA), to promote the crab meat industry in various aspects. The list of the companies (not an exhaustive list) is given in the Table 18.
Table 18- Details of Processing Companies with Crab Meat Processors Association (CMPA)
Sl� No� Name of the Company Year of Establishment
Head Office
1 Phillips Foods India Pvt Ltd. 2000 Thoothukudi, Tamil Nadu
2 Handy Water Base India Pvt Ltd. 2002 Thoothukudi, Tamil Nadu
3 Sandy Bay Seafoods Pvt Ltd. 2005 Visakhapatinam, Andhra Pradesh
4 Vitality Aquaculture Pvt Ltd 2008 Thoothukudi, Tamil Nadu
5 Peninsular Fisheries Pvt Ltd 2014 Kanyakumari, Tamil Nadu
6 Britto Sea Foods Exports Pvt Ltd 2015 Thoothukudi, Tamil Nadu
7 Hirawathy Marine Products Pvt Ltd 2017 Porbandar, Gujarat

Fishery Management Plan for Palk Bay Blue Swimming Crab 67
5. BSC Biology & Life History
5.1. Life cycle
In Portunus pelagicus sexes can be easily differentiated from their colour patterns of dorsal exoskeleton. Males are brightly coloured and more attractive than females. The carapace of the male crab is brilliantly coloured with irregular white patches and the tips of chelate and walking legs bright blue, hence the name 'blue swimming crab'. But female crabs are dull brown in colour with small irregular white patches on the carapace and tips of chelate and walking legs are dark brown (Figs. 48 & 49).
Figure 48 Male crab of Portunus pelagicus (BSC) a) dorsal view b) ventral view
a
b

Central Marine Fisheries Research Institute68
Other sexual dimorphic characters in P. pelagicus are similar to that of other crabs. Sex is readily distinguished in larger individuals by the shape of the abdomen which is narrow and has the shape of inverted 'T' in males. In females, it is triangular in juveniles and changes to semi-circular in adult. In addition, male has relatively larger chelae than female. In mature crabs pleopods can be seen very clearly when abdominal flap is opened. Male has two pairs of pleopods modified as copulatory organs on the first and second abdominal somites. In the case of females, the first four abdominal somites carry pleopods, and are biramous and possess fine setae for attachment of the extruded eggs till hatching.
Figure 49 Female crab of Portunus pelagicus (BSC) a) dorsal view b) ventral view
a
b

Fishery Management Plan for Palk Bay Blue Swimming Crab 69
5.2. Larval Phase
The larval development of Portunus pelagicus includes four zoeal stages and a megalopa (Josileen and Menon, 2004). The megalopa stage metamorphoses into the crab stage (Fig.50).
5.3. Size Composition and Sex Ratio
At Mandapam (Palk Bay), the fishery was contributed by size ranging from 70-195 mm. The major portion of the catch was contributed by 105-170 mm group in both the sexes.
Figure 50- Life cycle of Portunus pelagicus (BSC) (Source: Josileen, 2001)
Berried mother Pleopodal setae with eggs
Zoea-I
Zoea-IIZoea-IIIZoea-IV
Megalopa
Crab instar-I
Life Cycle ofPortunus Pelagicus
(Linnaeus, 1758)

Central Marine Fisheries Research Institute70
The dominant size group during 1996-97 was 106-110 mm in males and 126-130 mm in females. At Devipattinam, the fishery was contributed by size range of 81-182 mm. The maximum recorded sizes for male and female were 182 and 176 mm respectively. The bulk of the catch was comprised of size range 101-150 mm in both sexes. In pooled data of males and females the dominating size group was 121-130 mm (Josileen, 2007).
Earlier (1995-98) studies conducted from trawl catches at Mandapam showed that females were dominating the catches during most of the months; whereas in nanduvalai catches at Devipattinam, females were dominating during 1995 and for the rest of the period males were dominating in most of the months. At Mandapam, females outnumbered the males, the male: female ratio was 0.72: 1 and in Devipattinam there was a preponderance of males, the sex ratio was 1.26: 1 during the study period (Josileen, 2001) and the present observations also showed a clear domination of females in trawls and males in gillnet.
5.4. Size at Maturity
Close laboratory examination of gonads indicated that males of P. pelagicus attained sexual maturity when they attained a size above 80 mm carapace width. The minimum size at which males were mature was 82 mm CW. In females the minimum size at which maturity (ovary stage-IV) recorded was 88 mm CW. In females, mature ovaries were very rare in those below 100 mm CW size. The minimum size of berried females encountered during the study was 105 mm/ 80 g (Josileen,2001).
5.5. Breeding cycle and composition of berried crabs
P. pelagicus is a continuous breeder and berried females were recorded in the landings throughout the year. Berried crabs were more in trawl catches and in near-shore gillnet
38.9
34.2
46.2
35.8
41.6 45.3
32.8
45.2
40.1
25.9
36.4 38.4
0
5
10
15
20
25
30
35
40
45
50
1995 1996 1997 1998 1999 2000 2007 2008 2009 2010 2012 Average
Perc
enta
ge
Figure 51- Annual Percentage of berried crabs in BSC Trawl fishery at Mandapam (PB)

Fishery Management Plan for Palk Bay Blue Swimming Crab 71
catches the percentage was very less and in some months berried females were not represented in the fishery. For maturation and breeding crabs move towards deeper waters (breeding migration) and apparently mature crabs are caught in trawls than in gillnets, as their operational area is deeper than gillnets. So, the annual percentage of berried crabs in trawl is 38.4% (for a period of 11 years) whereas, in gillnets it is only 11.7% (for six years). The details for the composition of berried females from the trawl and gillnets are presented in the Figures 51 & 52.
In trawls in some months more than fifty percent of the female population comprised berried crabs and maximum percentage (84.4%) was recorded during February 2009. BSC is a continuous breeder as the percentage of berried females in the
14.8
10.6
18.4
21.4
2.6
2.6
11.7
0.0 5.0 10.0 15.0 20.0 25.0
1995
1996
1997
1998
2011
2012
Average
Percentage
0
10
20
30
40
50
60
70
80
90
Jan Feb Apr May Jun Jul Aug Sep Oct Nov Dec
Perc
enta
ge
1996 1997 1998 1999 2007 2008 2009 2010 2012 Average
Figure 52- Percentage of berried crabs in BSC nanduvalai fishery in Palk Bay
Figure 53- Monthly Percentage of berried crabs in BSC Trawl fishery at Mandapam (PB)

Central Marine Fisheries Research Institute72
catches did not follow a definite pattern over seasons and annual percentage was always above 25%. Monthly percentage of the berried crabs landed in trawls during different years are presented in Figure 53. At present, there is no ban for fishing berried crabs and hence they are exploited throughout the year.
5.6. Spawning
Spawning usually takes place during night hours and crabs are capable of multiple spawnings and spawn a maximum of 3 times during an intermoult cycle. The newly spawned eggs are bright yellow and as the development progresses colour changes to dull yellow and finally to dark grey just one day before hatching (Fig.54). Spawned eggs are attached to the pleopods of the mother till the hatching. In mature crabs pleopods can be seen very clearly when abdominal flap is opened. In females the first four abdominal somites carry pleopods and are biramous and possess setae for attachment of the extruded eggs till hatching. Male has two pair of pleopods modified as copulatory organs on the first and second abdominal somites. (Fig.55).
The total days taken for embryonic development (incubation period) varied between 8-10 days, depends on the health & size of the mother and water temperature. The incubation time taken by the same crab may also vary between spawnings during the same intermoult period.
Figure 55- Male (a) and Female (b) BSC with open abdomen showing the pleopods
Figure 54- Female BSC with newly spawned eggs (yellow) and ready to hatch eggs (Black)
a b

Fishery Management Plan for Palk Bay Blue Swimming Crab 73
5.7. Fecundity
The number of eggs present in the sponge/berry in P. pelagicus ranged between 60000 and 1976398. Fecundity increased from smaller to larger size groups. In the landings, it was found that the berried crabs that belonged to the size group 120-129 mm were the more frequent, which coincides with the first maturation moult. The egg mass index did not show any clear pattern in relation with the size group of the crab. The increase of the egg mass weight was proportional to the carapace width of the crab, with the highest values in the larger size groups.
The relationships between fecundity (as number of eggs per clutch) and egg mass weight, both related to carapace width and total weight, showed significantly positive correlations, however, the relationships show that, of these parameters, the carapace width and the fecundity constitute the more reliable indices for the estimation of the reproductive potential of P. pelagicus, rather than the weight of the crab (Josileen, 2001 & 2007). The average number of eggs for the different size classes and details are presented in the Table 19.
Table 19- Reproductive potential of BSC females in different size groups.
Size range (mm)
No� Carapace width (mm)
Average weight (g)
Egg mass weight (g)
Average total no�of eggs
Egg mass index
100-109 2 104.7 87.5 13.96 203455 15.95
110-119 6 113.6 ± 2.66 110.96 ± 16.66 11.96 ± 4.07 214175 11.39
120-129 12 124.9 ± 2.93 124.2 ± 19.87 20.84 ± 5.54 640431 16.78
130-139 5 133.8 ± 3.91 148.0 ± 17.18 19.20 ± 8.57 470092 12.97
140-149 4 144.8 ± 3.54 210.0 ± 60.14 28.37 ± 12.00 936731 13.51
150-159 2 157.5 287.5 30.36 1267022 10.56
160-169 2 166.6 320.0 34.50 1230900 10.78
170-179 4 176.1 ± 2.36 406.3 ± 39.87 49.74 ± 5.55 1472240 12.24
180-189 4 183.1 ± 2.01 532.5 ± 32.27 53.41 ± 4.84 1677168 10.03
Source: Josileen (2013)
5.8. Carapace width and Total weight relationship
Carapace width/length-total weight relationship in males and females of Portunus pelagicus are given the Table 20.

Central Marine Fisheries Research Institute74
Table 20- Carapace width/length-total weight relationship Portunus pelagicus (BSC)
Measurements Logarithmic equation Parabolic equation
Male
Carapace Width-Total Weight Log = -12.589 + 3.607 log L W = 0.000003409 L3.607
Carapace Length-Total Weight Log = -7.339 + 3.049 log L W = 0.0006497 L3.049
Female
Carapace Width-Total Weight Log = -11.077 + 3.293 log L W = 0.00001546 L3.293
Carapace Length-Total Weight Log = -6.231 + 2.774 log L W = 0.001967 L2.774
Pooled
Carapace Width-Total Weight Log = -11.779 + 3.438 log L W = 0.000007664 L3.438
Carapace Length-Total Weight Log = -6.746 + 2.902 log L W = 0.001176 L2.902
Source: Josileen (2011b)
The scatter diagram for males and females was obtained by plotting the weight against carapace width /length of individual crabs (Figs. 56 to 59). It is found that there exists a good relation between width and total weight from the closeness of the scatter and from parabolic nature of the plot.
The exponential values (b) for the carapace width-weight relationship in males and females (3.607 and 3.293 respectively) show that there is marked variation from the isometric pattern of growth. The ‘t’ test confirmed that ‘b’ significantly differ
y =0.00000341 L3.607
r = 0.9691 (n = 468)
0
100
200
300
400
500
600
700
75 100 125 150 175 200
Tota
l Wei
ght (
g)
Carapace Width (mm)
Figure 56- Carapace width- weight relationship in male Portunus pelagicus (BSC)

Fishery Management Plan for Palk Bay Blue Swimming Crab 75
from 3, in both sexes. The exponential values (b) for carapace length – weight in males and females (3.049 and 2.774 respectively) indicate that, the significant departure from isometric growth is only evident in females.
y = 0.00002 L3.293
r = 0.9365 (n = 721)
0
100
200
300
400
500
600
75 100 125 150 175 200 Carapace Width (mm)
Tota
l Wei
ght (
g)
y = 0.0006 L3.049
r = 0.9558 (n = 468)
0
100
200
300
400
500
600
700
30 40 50 60 70 80 90 100
Tota
l Wei
ght (
g)
Carapace Length (mm)
Figure 57- Carapace width- weight relationship in female Portunus pelagicus (BSC)
Figure 58- Carapace length–weight relationship in male Portunus pelagicus (BSC)

Central Marine Fisheries Research Institute76
The results of the length-weight relationship analysis in P. pelagicus indicate that in juveniles and pre-adult crabs, weight gain is almost uniform; females are slightly heavier than males until they attain 120-125 mm carapace width. Thereafter males are heavier than females at any given length.
5.9. Food & feeding
Investigations on food habits of BSC in the Palk Bay area revealed that despite the diversity in crab diets and feeding habits, they are opportunistic omnivores with a preference for animal food. In adult (>100 mm CW) crabs, crustaceans constituted the dominant food source and these were present in 78.43% of the stomachs analysed, followed by molluscs and fishes (Josileen, 2011a). The stomach contents of juveniles (< 80 mm CW) and sub-adults (81-100 CW) were dominated by debris. There was no significant difference between sexes in the frequency of occurrence of food items or in their percentage. However, there was a difference between the stomachs of ovigerous and non-ovigerous females. There were also significant differences in the preference for food items in the different size groups of the crab. The results showed that P. pelagicus exhibits, in this region at least, a clear preference for crustaceans (Josileen, 2011a).
5.10. Growth in the laboratory
Male crabs grew from an initial average carapace width of 2.38 ± 0.18 mm to 159.86 ± 3.52 mm CW, i.e., from first instar to 16th instar in a mean period of 272 days. Males were reared to a maximum of 455 days. The average total weight gained
y = 0.002 L 2.774
r = 0.8965 (n = 721)
0
100
200
300
400
500
600
30 40 50 60 70 80 90
Tota
l Wei
ght
(g)
Carapace Length (mm)
Figure 59- Carapace length–weight relationship in female Portunus pelagicus (BSC)

Fishery Management Plan for Palk Bay Blue Swimming Crab 77
was 275.00 ± 25.41 g from an initial weight of 0.008 g (table 21 & Fig.60). Male crabs attain maturity by the 12th moult (crab instar-12), at a mean size of 82.25 ± 1.17 CW and the chelar propodus length (CPL) recorded twofold increase, than the previous crab stage (crab instar-11).
Table 21–Growth details of Male BSC in laboratory
Crab stage
Average days from previous instar
CW(mm)
CL(mm)
CPL(mm)
CPD(mm)
TW(g)
1 0 2.38 ± 0.18 - - - 0.008
2 2.83 ± 0.76 4.23 ± 0.24 - - - 0.014
3 3.40 ± 0.55 5.13 ± 0.18 - - - 0.042
4 4.33 ± 1.03 6.55 ± 0.33 - - - 0.082
5 5.60 ± 1.14 9.10 ± 0.39 - - - 0.1
6 5.63 ± 1.19 12.13 ± 0.85 6.94 ± 0.31 - - 0.189
7 6.00 ± 1.15 16.63 ± 0.25 9.00 ± 0.50 - - 0.299
8 7.88 ± 1.73 23.17 ± 1.04 12.17 ± 0.29 - - 1.088 ± 0.91
9 8.38 ± 1.41 33.86 ± 1.77 16.20 ± 0.41 - - 2.41 ± 0.70
10 14.83 ± 3.31 46.38 ± 3.45 19.50 ± 0.50 20.38 ± 0.48 4.94 ± 0.43 5.13 ± 0.68
11 16.33 ± 1.51 60.80 ± 1.82 26.14 ± 1.35 24.85 ± 1.24 8.05 ± 0.93 14.90 ± 1.10
12 15.80 ± 3.11 82.25 ± 1.17 36.07 ± 1.73 49.08 ± 2.33 11.73 ± 0.25 36.22 ± 3.31
13 25.83 ± 5.42 99.01 ± 3.45 44.00 ± 1.87 60.67 ± 2.52 13.20 ± 0.57 68.33 ± 10.18
14 30.33 ± 6.53 122.13 ± 3.50 56.50 ± 1.91 84.50 ± 1.38 17.18 ± 0.96 123.14 ± 4.74
15 50.67 ± 14.77 141.39 ± 2.66 62.78 ± 2.77 102.71 ± 4.31 18.00 ± 1.31 188.92 ± 15.83
16 73.71 ± 8.96 159.86 ± 3.52 72.22 ± 2.99 121.56 ± 2.96 20.91 ± 4.12 275.00 ± 25.41
(CW- Carapace width; CL-Carapace length; CPL-Chelar propodus length; CPD- Chelar propodus depth & TW – Total weight)
Source: Josileen & Menon (2005)
00 100 200 300 400 500
20406080100120140160180
CW (m
m)
020406080100120140160180
CW (m
m)
Days0 50 100 200 250150 350300
Days
Female
ObservedVBGF
ObservedVBGF
Male
Figure 60- Observed and fitted growth (VBGF) in laboratory grown males and females of BSC
Female crabs grew from an initial average CW of 2.43 ±0.34 mm CW to 154.31± 2.73 mm, and reached the 16th instar in a mean of 332 days. The average weight gain during that period was from 0.006 g to 210.33 ± 18.39 g (table-22).

Central Marine Fisheries Research Institute78
Female crabs attain maturity by the 14th moult (crab instar-14), at a mean size of 120.43 ± 2.23 CW and the abdominal width (AW) recorded about forty percent increase, than the previous crab stage (crab instar-13).
Table 22- Growth details of Female BSC in laboratory.
Crab Stage Average days from previous instar
CW(mm)
CL(mm)
AW(mm)
AL(mm)
TW (g)
1 0 2.43 ± 0.34 - - - 0.006
2 2.83 ± 0.75 4.10 ± 0.14 - - - 0.01
3 3.80 ± 0.84 5.20 ± 0.25 - - - 0.024
4 3.83 ± 0.75 6.58 ± 0.57 - - - 0.075
5 5.80 ± 1.09 9.62 ± 1.10 5.40 ± 0.29 - - 0.099
6 5.60 ± 1.79 13.40 ± 0.60 7.25 ± 0.25 - - 0.177
7 6.20 ± 1.79 17.20 ± 1.20 9.38 ± 0.14 - - 0.32
8 7.00 ± 1.22 24.27 ± 2.06 12.25 ± 0.32 - - 1.44 ± 0.32
9 8.80 ± 1.30 33.33 ± 3.78 16.97 ± 1.44 - - 2.43 ± 0.50
10 14.0 ± 3.54 48.00 ± 4.76 22.30 ± 1.26 9.63 ± 0.95 14.13 ± 1.31 5.98 ± 0.72
11 16.6 ± 2.07 62.88 ± 3.57 27.63 ± 2.29 15.13 ± 1.93 17.88 ± 2.25 15.63 ± 1.70
12 16.0 ± 2.92 85.50 ± 6.75 36.20 ± 3.46 20.50 ± 0.71 24.13 ± 2.59 32.22 ± 2.85
13 25.2 ± 6.66 101.78 ± 2.78 44.11 ± 2.15 25.07 ± 3.12 30.56 ± 3.01 64.33 ± 7.50
14 36.4 ± 7.37 120.43 ± 2.23 51.83 ± 1.17 34.88 ± 3.71 37.00 ± 1.15 106.50 ± 9.94
15 68.2 ± 21.04 139.29 ± 1.81 62.50 ± 1.16 42.75 ± 1.76 47.28 ± 2.17 150.50 ± 2.90
16 112.0 ± 11.89 154.31 ± 2.73 68.23 ± 2.01 50.73 ± 1.38 55.86 ± 2.22 210.33 ± 18.39
(CW- Carapace width; CL-Carapace length; AW-Abdomen width; AL- Abdomen length & TW- Total wieght )
Source: Josileen & Menon (2005)
Laboratory grown crabs: Based on the L∞ and K values monthly growth of P. pelagicus male and female was computed using the inverse VBGF and the monthly growth estimates of male P. pelagicus following the Faben’s method, when compared to actual observed values, gave very close values, while in females the observed mean growth was close to that observed in the Munro’s method. Accordingly, males and females attained a length of 176.9, 203.3 and 207.3 mm and 151.3, 181.2 and 187.2 mm at the end of 1st, 2nd and 3rd year respectively (table 23).
The VBGF estimated for the cultured crabs (laboratory grown) and wild crabs are comparable and the details are presented in the Table 23 and a group of laboratory grown juveniles of BSC are shown in Figure 61.

Fishery Management Plan for Palk Bay Blue Swimming Crab 79
Table 23- Details of von Bertalanffy Growth Function (VBGF) in male and female crabs of BSC
Male Gulland & Holt (mm)
Munro’s(mm)
Faben’s(mm)
Female Gulland & Holt (mm)
Munro’s(mm)
Faben’s(mm)
L∞ (Lab) 219.8 204.1 208.0 L∞ (Lab) 211.8 188.6 211.0
K 1.82 1.9 1.8 K 1.7 1.64 1.62
L∞ (Wild) 199.4 191.9 195.0 L∞ (Wild) 196.9 190.4 190.0
K 1.56 1.68 1.71 K 1.05 1.37 1.42
Observed Lmax 195 Observed Lmax 193
1st year 1st year
culture 184.2 170.4 176.9 culture 173.1 151.3 170.1
wild 157.5 156.1 159.1 wild 128.0 142.0 144.1
2nd year 2nd year
culture 214.6 198.5 203.3 culture 204.7 181.2 203.1
Wild 190.6 185.2 188.6 Wild 172.8 178.1 178.9
3rd year 3rd year
culture 218.9 203.2 207.3 culture 210.5 187.2 209.5
Wild 197.5 190.6 193.8 Wild 188.4 187.2 187.3
Source: Josileen (2001)
Figure 61- Five weeks old laboratory grown Blue Swimming Crab
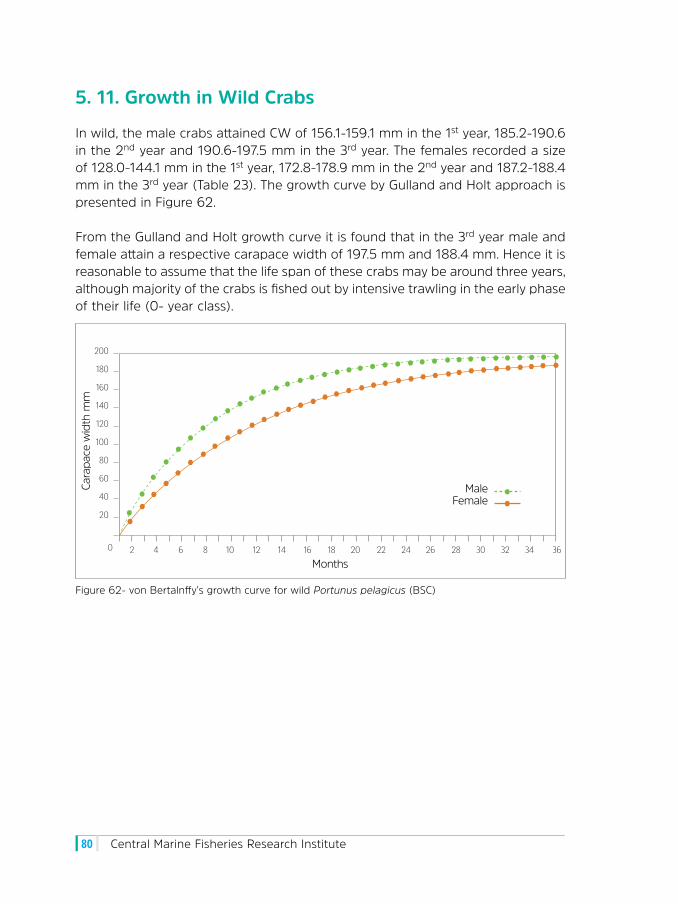
Central Marine Fisheries Research Institute80
5. 11. Growth in Wild Crabs
In wild, the male crabs attained CW of 156.1-159.1 mm in the 1st year, 185.2-190.6 in the 2nd year and 190.6-197.5 mm in the 3rd year. The females recorded a size of 128.0-144.1 mm in the 1st year, 172.8-178.9 mm in the 2nd year and 187.2-188.4 mm in the 3rd year (Table 23). The growth curve by Gulland and Holt approach is presented in Figure 62.
From the Gulland and Holt growth curve it is found that in the 3rd year male and female attain a respective carapace width of 197.5 mm and 188.4 mm. Hence it is reasonable to assume that the life span of these crabs may be around three years, although majority of the crabs is fished out by intensive trawling in the early phase of their life (0- year class).
Figure 62- von Bertalnffy’s growth curve for wild Portunus pelagicus (BSC)
Months
Cara
pace
wid
th m
m
MaleFemale
2
20
40
60
80
100
120
140
160
180
200
0 4 6 8 10 12 14 16 18 20 22 24 26 28 30 32 34 36

Fishery Management Plan for Palk Bay Blue Swimming Crab 81
6. Earlier Stock Assessment
6.1. Probability of capture
In males, the L25, L50 and L75 values were 115.2, 124.7 and 130.4 mm respectively and at carapace width (CW) of 137 mm and above, all the crabs were retained by the trawl. In females these values were 115.4, 122.9 and 129.0 mm respectively and at carapace width of 142 mm and above, all the crabs were retained by the trawl (Fig. 63).
0 73 83 93 103 113 123 133
0.1
0.2
0.3 0.4
0.5
0.6 0.7
0.8 0.9
1
0
0.1
0.2 0.3 0.4
0.5
0.6 0.7
0.8 0.9
1
73 83 93 103 113 123 133
Prob
abilit
y of
cap
yure
Length Classes (mm)
Male L∞ - 199.40M/K - 1.56
L∞ - 196.90M/K - 1.39
Female
Prob
abilit
y of
cap
yure
Length Classes (mm) Figure 63- Probability of capture in male and female Portunus pelagicus (BSC)

Central Marine Fisheries Research Institute82
6.2. Mortality parameters
The total instantaneous mortality coefficient (Z) estimated by length converted catch curve method was 4.54 for males and 3.03 females. The instantaneous natural mortality coefficient (M) estimate for males by following Rikhter & Efanov and Pauly were 2.09 and 2.76. In females the M was 1.46 and 2.11 respectively by the two methods. The instantaneous fishing mortality coefficient (F) was 2.45 for males and 1.57 for females. The exploitation rate (E) was almost similar in males and females, i.e., 0.54 and 0.52 respectively. The details are presented in the Figure 64.
Figure 64 –Catch curve of Portunus pelagicus (BSC) in males (a) & females (b).
Males: Cut off CW (L’): 130.5 mm; mean CW (from L’): 149.6 mm; Z from the catch curve: 4.54; Natural Mortality (M for T= 29ºC): 2.72; M value used: 2.09; Fishing Mortality: 2.45; Exploitation rate: 0.54.Females: Cut off CW (L’): 90.5 mm; mean CW (from L’): 120.5 mm; Z from the catch curve: 3.03; Natural Mortality (M for T = 29ºC): 2.11; M value used: 1.46; Fishing Mortality: 1.57; Exploitation rate: 0.52.
6.3. Yield-per-recruit (Y/R)
Analysis of the stock using 1995-1998 data indicated that the Emax was estimated as 0.64, E 0.1 as 0.62 and E 0.5 as 0.37 for males and 0.64, 0.61 and 0.38 respectively for females. The exploitation rate of males (0.54) and females (0.52) was almost equal. These values are very close to the Emax level (males: 0.638; females:0.648) and well above the 50% exploitation level (males-0.371: females – 0.379) and then yield was close to the MSY level (Figures 65 & 66).
00
4
16
12
8
0
4
16
12
8
321Relative age (years-to) Relative age (years-to)
0 4321
In(N
/∆t)
In(N
/∆t)
a b

Fishery Management Plan for Palk Bay Blue Swimming Crab 83
At present, there is no ban on fishing the berried crabs and the minimum size at capture is not restricted in India except in state of Kerala, where MLS is fixed at 90 mm carapace width (CW). Recently, Sivadas et al., (2019), has recommended 90 mm CW as the MLS for BSC fishery in Tamil Nadu. As a conservation measure,
Figure 65 – Yield per recruitment analysis in male crabs of Portunus pelagicus (BSC)
Figure 66– Yield per recruitment analysis in female crabs of Portunus pelagicus (BSC)
00.51
1.52
2.53
3.54
4.55
5.56
0.25 0.5 0.75 1
Rel. Y
ield
/ re
crui
t (10
^ 2
)
Exploitation rate0
0
.1.2.3.4
.7.8.91
.5
.6
.25 .5 .75 1Re
l. Bio
mas
s / r
ecru
it
Exploitation rate
00
.51
1.52
2.53
3.54
4.55
0.25 0.5 0.75 1
Rel. Y
ield
/ re
crui
t (10
^ 2
)
Exploitation rate0
0
.1.2.3.4
.7.8.91
.5
.6
.25 .5 .75 1
Rel. B
iom
ass
/ rec
ruit
Exploitation rate
fishermen should be educated to release the berried and soft crabs to the sea while they are alive. The governments should take steps to implement the ban on landing and marketing the berried females, certainly these would ensure a sustainable BSC fishery as well as improve the quality of the yield.

Central Marine Fisheries Research Institute84
Figure 67- Total Portunus pelagicus (BSC) landings in Palk Bay during 2007-17 and MSY level
7013 6783 6403
8454 7983
8319 8343
6681 6240
5172
4452
7360
0
1000
2000
3000
4000
5000
6000
7000
8000
9000
2007 2008 2009 2010 2011 2012 2013 2014 2015 2016 2017
Tonn
es
Total landings (t) MSY -7360 (t)
7. Current Estimation of Maximum Sustainable Yield (MSY) – Palk Bay BSC
Results of the Bayesian Schaefer Model (BSM) using 2007-2017 catch and catch rate data indicated that the MSY is 7360 tonnes. When compared with the total BSC landings of Palk Bay during the period 2007-2017 indicated that during four years (2010-2013), total catch from the region was more than MSY limits and rest of the years it was below the MSY estimates. The exploitation (F/Fmsy) during 2017 was 0.726 and most of the years this value was above 1. The B/Bmsy in 2017 was 0.833 and from 2012 onwards it is below 1, indicating that stringent management is required for the BSC stock. The details are presented in Figures 67-69 and Table 24.
Assessment of the fishery clearly reveals catches are on the declining trend and stock has been overexploited. It is also alarming that the berried females indiscriminately exploited without any restriction of fishing on berried females.
Currently trawls are operating on three days per week and they are allowed to fish beyond 3 nautical miles as the state jurisdiction. Also total fishing ban of 61 days during April-May every year is implemented for the trawlers. However, for gillnetters or other traditional fishers presently no such ban is prevailing and also no strict enforcement of total fishing days is in place. To bring the fishery to the

Fishery Management Plan for Palk Bay Blue Swimming Crab 85
Figure 68- Results of CMSY analysis for Portunus pelagicus (BSC) landings in Palk Bay during 2007-17
Figure 69- Summary of CMSY analysis in Portunus pelagicus (BSC) for Palk Bay during 2007-2017

Central Marine Fisheries Research Institute86
sustainable level, the best possible immediate action is the total ban on fishing and landing berried females. This must be immediately bringing to enforcement for all the gears which are exploiting the BSC. The total fishing days of the gillnetters also must be reduced. If these regulatory measures are implemented at the earliest within a couple of years, the BSC stock can be increased. Other suggestions and recommendations are given in the proposed management plan.
Table 24- Estimates of MSY and model parameters of BSC along with confidence limits
Parameters CMSY BSM
MSY 7820 7360
(6060 – 10100) (6760–8020)
r 1.19 1.25
(0.957-1.48) (0.99-1.58)
k 26300 23500
(18500-37200) (18400-30100)
Relative biomass in last year (B 2016/k)
0.457 0.417
(0.218–0.595) (0.289–0.580)
Exploitation F/(r/2) in last year - 0.726
(0.521-1.05)
q - 0.000214
(0.000181-.000254)
Bmsy - 11800
(9220-15000)
Fishing mortality (Fmsy)
- 0.626
(0.496-0.788)
Fmsy in last year - 0.454
(0.326 – 0.654)
MSY–Maximum sustainable yield; MSY = r k/4; r = Maximum intrinsic rate of population increase; k = Parameter of the Schaefer model indicating unexploited stock size; B = Biomass, total weight of exploited fish in the water; q-Catchability coefficient; CPUEt = q Bt; Bmsy -Biomass capable of producing MSY; Fmsy -Rate of fishing mortality compatible with MSY; Fmsy = 0.5 r

Fishery Management Plan for Palk Bay Blue Swimming Crab 87
8. Projection on advantages of not fishing berried females
It is well understood that to sustain the Blue Swimming Crab fishery strict management of the fishery is essential and the best possible immediate action is the total ban on landing and sale of berried females. When berried females exploited indiscreetly that would directly affect the recruitment of the young ones into the fishery.
Tables 25-27 describe the situation/scenario if berried females are not fished and how fishery is going to be benefitted. BSC is a continuous spawner and highly fecund, which ranges between 60000 – 1976398. BSC fishery mainly comprised, of 120-159 mm CW females and the average fecundity of this group is about 828569 nos. Hatchery seed production of crablets proved on an average 5% survival from Zoea 1 to first baby crab stage (Crab instar-1). However, considering the natural predation in the wild, for estimating the seed production survival is fixed at very low percentage (@0.1%). With this survival rate, about 830 baby crabs (crab instar-1) can be produced from a single female and out of that 1 % would survive to the catchable size (100 g) after a period of 4 months. Total duration to obtain this size including the larval phase would be approximately 5 months.
Table 25 – Details of fecundity and survival rates used for the estimation
Size range(mm)
No� of eggs *(Josileen, 2013)
Average fecundity of the major size group in fishery
Facts & Assumptions
100-109 203455 # For further estimation, average no. of fecundity taken as 830000.
# Mass seed production of crablets obtained on an average of 5% survival from Zoea-1 to Crab instar (Josileen, 2001 & Maheswarudu, et al. 2008). However, for estimation in the wild, survival fixed @ 0.1% considering natural predation.
110-119 214175
120-129 640431
828569130-139 470092
140-149 936731
150-159 1267022
160-169 1230900
170-179 1472240
180-189 1677168
Tables 26 & 27 explain the scenario in trawls and gillnets respectively. In trawl landings generally females are dominating, however for estimation 1:1 ratio has taken and in

Central Marine Fisheries Research Institute88
gillnets males are pre- dominant and hence 60:40 ratio used for estimation. Previous studies assessed that in trawls, 38% of the landed females are berried (Fig.51) and in gillnets berried females formed 12% (Fig. 52) and these are also taken for the present calculation. The stages of estimation are shown in the respective tables.
In trawls, if berried crabs are not fished for a month, an equal quantity of that month’s total production can be harvested after a period of 5 months. Similarly, from gillnets, 32% of the particular month’s production can be obtained after a period of 5 months.
Table 26- Illustration – What happens if Berried females are not landed in Trawls for a month
Parameter Logic Estimated value
Expected number of first baby crabs (crab instar-1) from one female
Average fecundity is 830000 and survival from zoea-1 (Z-1) to crab instar-1 (C-1) is presumed to be @ 0.1%
830 nos.
Expected number of recruits from one spawning mother
Out of 830 nos., 1% survive to the catchable size (further 4 months)
8 marketable size crabs
Total landing of females in a trawl centre in one month
Suppose 50 tonnes of crabs are landed in the centre in a month and male: female ratio is 1:1, 25 tonnes would be females
25000 kg
Number of females in one kilogram Average weight of the female is 150 g 7 nos.
Number of berried females in one kilogram
@ 38% of females–considering annual average of berried female for 11 years= 2.66 nos. ~ 2.5 crabs
2.5 nos.
Total number of berried females in one-month catch
25000*2.5 62500 nos.
Potential production of crabs after 5 months
If no fishing of berried crabs for a month, 62500*8 500000 nos.
Total production of marketable size crabs after 5 months
Marketable size = 100 g; 500000*100=50000000 g =50000 kg
50 tonnes
Total value of the 50 tonnes crabs 50000 kg @ 250 Rs. /kg Rs. 12.5 million.
Conclusion: In trawls, if we save berried females for a month, after a period of 5 months*, an equal quantity of one month’s production can be obtained.
(* includes–spawning to hatching period (duration of embryonic development ~ 10 days) & larval development period (zoea-1 to first crab stage ~ 15-18 days) together taken as one month plus four months, duration taken by the first crab (C-1) to reach marketable size)

Fishery Management Plan for Palk Bay Blue Swimming Crab 89
Table 27–Illustration – What happens if Berried females are not landed in Gillnets for a month.
Parameter Logic Estimated value
Expected number of first baby crabs (crab instar-1) from one female
Average fecundity is 830000 and survival from zoea-1 (Z-1) to crab instar-1 (C-1) is presumed to be @ 0.1%
830 nos.
Expected number of recruits from one spawning mother
Out of 830 nos., 1% survive to the catchable size (further 4 months)
8 marketable size crabs
Total landing of females in a gillnet centre in one month
Suppose 100 tonnes of crabs are landed in the centre in a month and male: female ratio is 60:40
40,000 kg
Number of females in one kilogram Average weight of the female is 125 g 8 nos.
Number of berried females in one kilogram
@ 12% of females–considering annual average of berried female for 6 years= 0.966 nos. ~ 1 crab
1 no.
Total number of berried females in one-month catch
40000*1=40000 40000 nos.
Potential production of crabs after 5 months
If no fishing of berried crabs for a month, 40000*8
320000 nos.
Total production of marketable size crabs after 5 months
Marketable size = 100 g; 320000*100=32000000 g =32000 kg
32 tonnes
Total value of the 32 tonnes crabs 32000 kg @ 250 Rs. /kg Rs. 8 million.
Conclusion: In gillnets, if we save berried females for a month, after a period of 5 months*, 32 % of a months catch can be obtained.
(* includes–spawning to hatching period (duration of embryonic development ~ 10 days) & larval development period (zoea-1 to first crab stage ~ 15-18 days) together taken as one month plus four months, duration taken by the first crab (C-1) to reach marketable size)
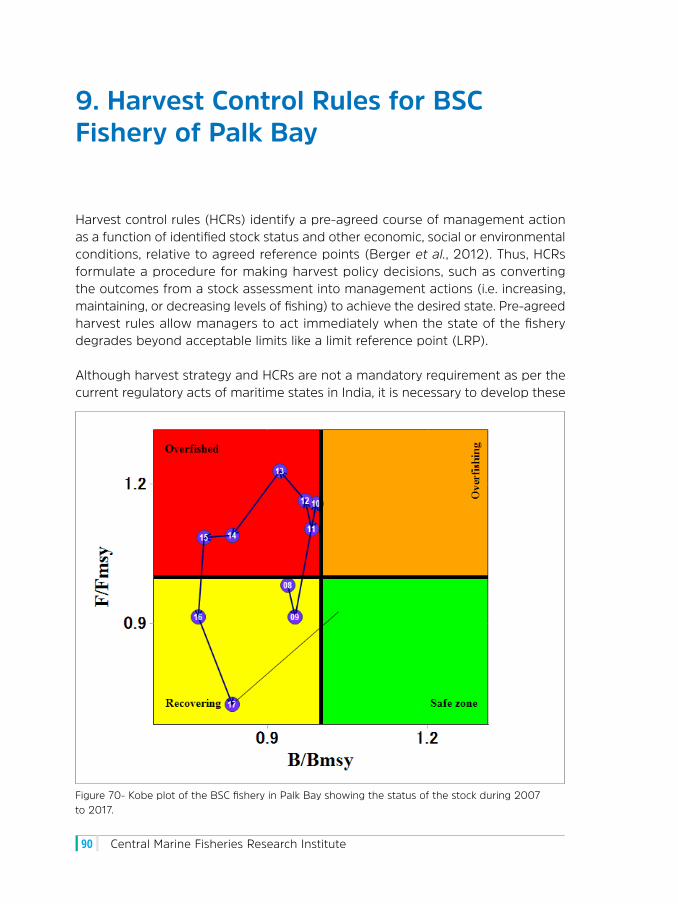
Central Marine Fisheries Research Institute90
9. Harvest Control Rules for BSC Fishery of Palk Bay
Harvest control rules (HCRs) identify a pre-agreed course of management action as a function of identified stock status and other economic, social or environmental conditions, relative to agreed reference points (Berger et al., 2012). Thus, HCRs formulate a procedure for making harvest policy decisions, such as converting the outcomes from a stock assessment into management actions (i.e. increasing, maintaining, or decreasing levels of fishing) to achieve the desired state. Pre-agreed harvest rules allow managers to act immediately when the state of the fishery degrades beyond acceptable limits like a limit reference point (LRP).
Although harvest strategy and HCRs are not a mandatory requirement as per the current regulatory acts of maritime states in India, it is necessary to develop these
Figure 70- Kobe plot of the BSC fishery in Palk Bay showing the status of the stock during 2007 to 2017.

Fishery Management Plan for Palk Bay Blue Swimming Crab 91
so that the fishery managers can judiciously act based on the status of the stock for sustainability of the resources. Berger et al. (2012) further state that without explicit rules to govern harvest levels, there is a tendency for exploitation rates to move towards levels that maximize short-term gains rather than levels that achieve long-term objectives (e.g., stable yields, maximizing catch rates, maintaining sufficient reproductive capacity, or preventing overfishing).
For the BSC fishery the harvest strategy would be to maintain yields close to the estimated MSY (7360 tonnes) using a catch and effort based harvest control measure (Y/MSY and F/Fmsy) as reference points. The Kobe plot of the fishery (Fig. 70) shows the stock status of the fishery during the past 11 years. The plot indicates that the stock was overfished during 2011 to 2015 period with high effort and low biomass, subsequently in 2016 and 2017, the effort was considerably less placing the stock in rebuilding status. In order to turn the stock trajectory to healthy status, the recommendation on protection of berried crabs given in this document would help to build up the crab biomass.
The target reference point (TRP) for the fishery would be the MSY of 7360 tonnes allowing for a fluctuation of plus or minus 20%. Once the fishery yields exceed these limits (lower limit -5888 tonnes & higher limit–8832 tonnes) effort limitation should be introduced to maintain the stock at healthy levels. Should the yields increase or decrease by 50% of the TRP, more stringent effort control by way of fishery closures should be put in place as a precautionary approach.

Central Marine Fisheries Research Institute92
10. Strengths and Weakness
The strength and weakness of the BSC fishery and related aspects are listed out as following:
Strengths
1. Regular monitoring of fishery i.e. Trawl as well as Gillnet fishery is in place
2. Details of the fishing zones and landing centres are available
3. Information available on ecological and geographical parameters of Palk Bay
4. Total landing of the BSC and other resources are available
5. Details of the population characters and biological parameters of the BSC from the area available
6. Complete life cycle of the species studied from wild as well as from captive stock and published data on growth and development, food & feeding, fecundity etc. available
7. Biological studies state that BSC is a continuous breeder with high fecundity
8. Fast growing species reaching 100 g size within 6 months’ time with a short life span of 2.5 to 3 years
9. Mass seed production and farming of the species are proven
10. The marine fisheries policy guidance to the Tamil Nadu state is prepared by CMFRI
11. Crab Meat Processors Association (CMPA) is active and ready to accept and implement the management plan
12. Crab gillnet –Nanduvalai- is a non-destructive gear
13. No ETP species caught in Nanduvalai

Fishery Management Plan for Palk Bay Blue Swimming Crab 93
14. In Crab gillnet, only Crabs are targeted; BSC is the major species caught with minor quantities of other crab spp.
Weakness
1. No fishery management plan in place in general and also no specific management plan for BSC other than 61 days’ ban for trawlers during April-May of every year
2. No self-imposed management measures from local fishermen/groups other than compulsory withdrawal from fishing during unfavourable weather.
3. Traditional sector also has no regulation in number of boats & nets and no harvesting strategies & rules are in place.
4. No management plans for the crab fishing habitat especially for the seagrass beds, which form the nursery ground for BSC
5. No serious Fishermen awareness programme.
6. No limits or specifications fixed for the crab buyers/traders.

Central Marine Fisheries Research Institute94
11. BSC Management Plan (BSCMP)
Objectives
The proposed fishery management plan is intended to judiciously sustain and improve the BSC stock from the region through strict adherence to the rules and regulations with active participation and co-operation of all the stakeholders of the BSC fishery. The proper management requires an integrated approach, each stake-holder should adhere to the proposed measures and ensure the compliance with strict enforcement. Ultimately the goal is to achieve a sustainable exploitation of the BSC without causing any damage or harm to the ecosystem and also protecting its biodiversity through careful observation of the rules and regulations from fishing to trade. Hence, the proposed management plan necessitates an early streamlining of all the concerned activities as a precautionary approach which leads to attain a long-term status for BSC fishery as a well sustained fishery without overfishing or stock depletion. Reflections of a well-managed fishery can be observed not only in the sustenance of the fishery but also in the promotion of the environmental, economic and social sustainability.
Based on the facts and evidences gathered and proved over by many years’ systematic studies on BSC, the following rules and regulations are recommended for the implementation in the Palk Bay region. Initial phase the proposed plan can be implemented in the Palk Bay and later it can be implemented to other main BSC fishing regions also.
Rules and regulations:
1. Minimum Legal Size (MLS) should be fixed at 90 mm CW – a MLS measuring device (Fig. 71) must be distributed to the fishers, traders, etc.
2. Total Ban on landing of berried females- berried crabs must be put back to the sea as early as possible.
3. Soft shelled crabs caught also must be put back to the sea.
4. No trade of berried crabs–Crab processors/merchants should not buy berried crabs/ undersized crabs
5. BSC nursery grounds like coastal seagrass beds must be declared as Protected Area; no fishing should be permitted in these areas.

Fishery Management Plan for Palk Bay Blue Swimming Crab 95
6. Number of fishing days should be restricted to traditional crab fishers – 200 days.
7. Compulsory registration and licenses should be given for BSC fishers, boats, gears and collection centers & processing plants.
8. Strict enforcement through regular monitoring and punishment for violation.
9. Formation local fisher groups /leaders for regulating the crabbers at main BSC landing areas.
10. Fisherfolk must adhere to the management measures and ensure the implementations are followed by themselves through patrolling activities.
11. BSC fisheries Governance Council (BSCFGC) should be formed with specific responsibilities for each unit to fulfil the regulations and management plan.
12. Fishermen must cooperate with other stakeholders and share information, data to implement the management plan.
Figure 71- Design for MLS measuring device for BSC fishery
Blue Swimmer Crab (BSC) - MLS
90 mm Carapace width

Central Marine Fisheries Research Institute96
12. References
Ameer Hamsa, K. M. S. 1978. Fishery of the swimming crab Portunus pelagicus Linnaeus from Palk Bay and Gulf of Mannar. Indian J. Fish., 25 (1 & 2): 229-233.
Berger A M, S J Harley, G M Pilling, N Davies, J Hampton. 2012. Introduction to harvest control rules for WCPO tuna fisheries. WCPFC-SC8-2012/MI-WP-03, 33p.
Eldho Varghese, Sathianandan, T. V., Jayasankar, J., Somy Kuriakose, Mini, K.G. and Muktha, M. 2019. Bayesian state-space implementation of Schaefer production model for assessment of stock status for multi-gear fishery. Journal of the Indian Society of Agricultural Statistics: (In press)
Fabens, A. J., 1965. Properties and fitting of the Von Bertalanffy growth curve. Growth, 29: 265-289.
Froese, R., N. Demirel, G.Coro, K. M. Kleisner and H. Winker, 2017. Estimating fisheries reference points from catch and resilience. Fish and fisheries, 18: 506–526.
Gulland, J. A. & S. J. Holt, 1959. Estimation of growth parameters for data at unequal time intervals. Journ. Cons. CIEM, 25 (1): 47-49.
Josileen, J. 2001. On the fishery, biology and the hatchery technology of the portunid crab Portunus pelagicus. Ph. D Thesis, Cochin University of Science and technology, Cochin, India.137p.
Josileen, J. 2011a. Food and feeding of the blue swimmer crab, Portunus pelagicus (Linnaeus, 1758) (Decapoda, brachyura) along the Coast of Mandapam, Tamil Nadu, India. Crustaceana, 84 (10):1169-1180.
Josileen, J. 2011b. Morphometrics and Length-Weight Relationship in the Blue Swimmer Crab, Portunus pelagicus (Linnaeus, 1758) (Decapoda, Brachyura) from the Mandapam Coast, India. Crustaceana, 84 (14):1665-1681.
Josileen, J. 2013. Fecundity of the Blue Swimmer Crab, Portunus pelagicus (Linnaeus, 1758) (Decapoda, Brachyura, Portunidae) along the coast of Mandapam, Tamil Nadu, India. Crustaceana, 86 (1): 48-55.
Josileen, J. and Menon, N G. 2004. Larval stages of the blue swimmer crab, Portunus pelagicus (Linnaeus, 1758) (Decapoda, Brachyura). Crustaceana, 77 (7): 785-803.
Josileen, J. and N G. Menon, 2005. Growth of the blue swimmer crab, Portunus pelagicus (Linnaeus, 1758) (Decapoda, Brachyura) in captivity. Crustaceana, 78 (1): 1-18.
Josileen, J. and N G. Menon, 2007. Fishery and growth parameters of the blue swimmer crab Portunus pelagicus (Linnaeus, 1758) along the Mandapam coast, India. Journal of the Marine Biological Association of India, 49 (2): 159-165.
Josileen J., A. Gopalakrishnan, P. R. Divya, V. Basheer and G. Maheswarudu. 2014. Taxonomic identity of Portunus pelagicus species complex in Indian waters using morphological and mitochondrial DNA markers. In Marine Ecosystems - Challenges and Opportunities 2-5 Dec 2014, Kochi, Abstract no. MBTP 42, MECOS-2, MBAI: 287p.
Kasim, H. M. 2015. Resources and livelihoods of the Palk Bay: Information from India & Sri Lanka. https://www.researchgate.net/publication/281198322.
Kumaraguru, A.K., V. Edwin Joseph, M. Rajee and T. Blasubramanian. 2008. Palk Bay–Information and Bibliography, CAS in Marine Biology, Annamalai University, Parangipettai and Centre for Marine and Coastal Studies, Madurai Kamaraj University, Madurai. 227 pp.
Lai J.C, Ng P.K.L and Davie P.J.F. 2010. A revision of the Portunus pelagicus (Linnaeus, 1758) species complex (Crustacea: Brachyura: Portunidae), with the recognition of four species. Raffles B Zool 2010, 58: 199-237.
Maheswarudu, G, Josileen Jose, Nair, K. R. Manmadhan, and M. R. Arputharaj. 2008. Evaluation of the seed production and grow out culture of blue swimming crab Portunus pelagicus (Linnaeus, 1758) in India. Indian Journal of Marine

Fishery Management Plan for Palk Bay Blue Swimming Crab 97
Sciences, 37 (3): 313-321.
Mathews, G., K. Diraviya Raj, T. Thinesh, Jamila Patterson, J.K. Patterson Edward and Dan Wilhelmsson. 2010. Status of seagrass diversity, distribution and abundance in Gulf of Mannar Marine National Park and Palk Bay (Pamban to Thondi), Southeastern India. South Indian Coastal and Marine Bulletin, Vol. 2 (2): 1 – 21.
Munro, J. L., 1982. Estimation of parameters of the von Bertalanffy growth equation from recapture data at variable time intervals. Journ. Cons.CIEM, 40: 199-200.
Prasad, R. R. and P. R. S. Tampi. 1952. An account of the fishery and fishing methods for Neptunus pelagicus (L.) near Mandapam. J. Zool. Soc. India, 3(2): 335-339.
Rickter, W. E., 1973. Linear regressions in fisheries research. Journ. Fish. Res. Bd Canada, 30 (3): 409-434.
Rajamani, M and A. Palanichamy. 2010. Current Status of Crab Fishery in Artisanal Sector along Gulf of Mannar and Palk Bay Coasts. In: Coastal Fishery Resources of India–Conservation and sustainable utilisation. Society of Fisheries Technologists, pp.90-97.
SDMRI, 2013. Seagrass-Watch, E-Bulletin.pp12. http: //www.seagrasswatch.org/ publications. html# Ebulletin.
Sivadas, M., P. U. Zacharia, P. T. Sarada, R. Narayanakumar, Shoba Joe Kizhakudan, Margaret Muthu Rathinam, S. Surya, L. Remya, M. Rajkumar, E. M. Chhandaprajnadarsini, P. P. Manojkumar, I. Jagadis, M. Kavitha, K. N. Saleela, Grinson George and P. Laxmilatha 2019. Management Plans for the Marine Fisheries of Tamil Nadu. ICAR-CMFRI Mar. Fish. Policy Series No.11. ICAR-Central Marine Fisheries Research Institute, Kochi, Kerala, India, 104 pp.
Snedecor, G. W. and W.G. Cochran, 1967. Statistical methods applied to experiments in agriculture and biology. 1-534. (The Iowa State College Press, Ames, Iowa).
Srianth, M., Somy Kuriakose and K.G. Mini, 2005. Methodology for estimation of marine fish landings in India. CMFRI Spl. Publ., No. 86, 57 pp.
Stehlik, L. L., 1993. Diets of the brachyuran crabs Cancer irroratus, C. borealis and Ovalipes ocellatus in the New York Bight. Journ. Crust. Biol., 13 (4): 723-735.
Stephen, J., A. Menon and P. Anbazhagan. 2013. Socio-Economic profile of Palk Bay Fisheries India. “Re-incorporating the excluded: providing space for small-scale fishers in the sustainable development of fisheries of South Africa and Sri Lanka”-REINCORPFISH. Netherlands Organisation for Scientific research, Madras Institute of Development Studies. pp 63.

Central Marine Fisheries Research Institute98
Acknowledgements
Authors wish to place on record their sincere gratitude to Dr. A. Gopalakrishnan, Director, CMFRI, for his encouragements and support in bringing out this special publication.
We specially thank Dr. T. V. Sathianandan HoD, Fishery Resource Assessment Division, CMFRI for providing the data and Smt. Sindhu K. Augustine, Technical Officer of the division for her timely help. We are thankful to Shri K. M. David, Artist, CMFRI for the illustrations.
The authors acknowledge crab-fishers of the various landing centres Palk Bay for sharing valuable information and their co-operation at various occasions. The first author is grateful to Shri. A. Gandhi, Technical Officer, MRC of CMFRI, Mandapam Camp for his help and assistance during the interactive sessions with Palk Bay crab fishers.
Information on market trends and trade provided by the various members of Crab Meat Processors Association, augmented the data and authors are thankful to them.
We also thank Dr. Vinod Malayilethu, Team leader, Marine Conservation Programme, WWF-India and Dr. Ranjit Suseelan, MSC Co-ordinator, India for their valuable suggestions.
The inputs from the stakeholder meetings held during 06.01.2018 and 10.10.2018, enormously abetted the enhancement of this document and authors are thankful to them.
The immense help and assistance extended by the Crustacean Fisheries Division colleagues of MRC of CMFRI, Mandapam Camp during the early phase of the BSC research is unforgettable and Dr. Josileen thank them profusely for their immeasurable support.

Portunus pelagicus, commonly known as Blue Swimming Crab (BSC) is a highly
valuable marine crab in India and bulk of the BSC products are exported to US.
BSC is fished continuously from Palk Bay (PB), mainly by indigenous bottom-set
gillnets known as Nanduvalai. Growth studies revealed that life span of BSC is
around three years, although majority of the crabs are fished in the 0-year class.
A Minimum Legal Size (MLS) of 90 mm carapace width is recommended to
prevent growth overfishing. To sustain the BSC fishery strict management of
the fishery is essential and the best possible immediate action is a total ban on
landing and sale of berried females. For the BSC fishery the harvest strategy would
be to maintain yields close to the estimated Maximum Sustainable Yield (7360
tonnes) using catch and effort based harvest control measure as reference points.
Based on the facts and evidences, guidance on a Fishery Management Plan for
Palk Bay BSC fishery are presented.
Fish
ery
Man
agem
ent
Pla
n f
or
Pal
k B
ay B
lue
Swim
min
g C
rab
Indian Council of Agricultural ResearchCentral Marine Fisheries Research Institute
Post Box No.1603, Ernakulam North P.O., Kochi-682 018, Kerala, India.Phone: +91 484 2394357, 2394867 Fax: +91 484 2394909E-mail: [email protected] www.cmfri.org.in
Palk Bay Blue Swimming Crab
Fishery Management Plan for
Recommended


