~ 19 ~
WWJMRD 2020; 6(7): 19-27
www.wwjmrd.com
International Journal
Peer Reviewed Journal
Refereed Journal
Indexed Journal
Impact Factor MJIF: 4.25
E-ISSN: 2454-6615
David O. Balogun
National Biotechnology
Development Agency
(NABDA), Bioresources
Development Centre
(BIODEC) Kano, Nigeria.
Aliyu Ibrahim
National Biotechnology
Development Agency
(NABDA), Bioresources
Development Centre
(BIODEC) Kano, Nigeria.
Samuel Boyi
Department of Geography,
Ahmadu Bello University
Zaria, Kaduna State, Nigeria.
Augustine A. Okewu
Department of Geography,
Ahmadu Bello University
Zaria, Kaduna State, Nigeria.
Ibrahim T. Philip
Advanced Space Technology
Applications Laboratory,
Bayero University Kano,
Nigeria.
Correspondence:
David O. Balogun
National Biotechnology
Development Agency
(NABDA), Bioresources
Development Centre
(BIODEC) Kano, Nigeria.
Flood Inundation Analysis of Lower Usuma River in
Gwagwalada Town Abuja, Nigeria.
David O. Balogun, Aliyu Ibrahim, Samuel Boyi, Augustine A. Okewu,
Ibrahim T. Philip
Abstract Flood inundation analysis of Lower Usuma River in Gwagwalada town Abuja was studied. HEC-RAS
hydrologic modelling system and GIS were used to determine flood inundation for 5, 10, 50 and 100
year return periods. Flood frequency analysis showed that the water surface elevation gradually rises
with increase in return period from 5year to 100year return period and a gradual increase in flooded
area from about 24.76% in 5year return period to 26.75% in 100year return period. Also an increase in
valleys and channel width of the river, the width of the flooded area increases and water expanded in
wider area. The study showed that Gumbel’s distribution is suitable for predicting expected flooding.
Considering the likely impacts of severe flooding in Gwagwalada town along the Lower Usuma River,
there is an urgent need for the State, Local and Administrative Authorities to ensure that appropriate
town planning regulations are adhered.
Keywords: Flood Return Period, Flood Inundation, Hydraulic Modelling, Gumbel Distribution.
1.0. Introduction:
Globally, flooding is regarded as the most ubiquitous natural disaster that affects people in
different dimensions than any other natural disasters [1]. It is an extreme natural occurring
weather event that results in an overflow of large amounts of surface water over land that is
not always inundated [2,3]. It occurs in most terrestrial portions of the globe, causing huge
annual losses in terms of damage and disruption to economic livelihoods, businesses,
infrastructure, services and public health [4]. Long term data on natural disasters suggest that
flooding has been by far the most common causes of natural disasters worldwide over the
past 100 years [5].
Urbanization aggravates flooding by restricting where flood water can go. In an urban areas,
large parts of the ground are covered with roofs, tarred roads and pavements; these obstruct
infiltration of rainfall into the soil thereby accelerating runoff. Consequently even quite
moderate storms could produce high flows in rivers because there are more hard surfaces and
drains [6]. In extreme cases urban floods can result in disasters that setback urban
development by years or even decades. Recent statistics clearly indicate that one-third of the
overall economic losses from natural disasters are caused by flooding and are on the increase [7].
Global warming has been linked to the sudden rise in the number and severity of recent
floods in Jigawa, Kano, and Kaduna, Katsina (in Northern Nigeria), Gombe (North Eastern
Nigeria) and most of the Southern States [8]. As a result, Nigerians have become increasingly
at risk to a wide range of natural hazards with urbanization and high incidence of poverty
pressuring the people, in spite of town planning regulations preventing them from inhabiting
vulnerable flood plains and unstable hillsides.
Flood modeling is a relatively new approach which is widely used for flood hazard, and risk
assessment. Recent advances through the combination of hydraulic simulation model, HEC-
RAS and ArcGIS environment have the potential to further that flexibility to create
geometric representations, simple import and export capabilities and displaying the results in
spatial format in a more cost-effective manner.
World Wide Journal of Multidiscip linary Research and Development
~ 20 ~
World Wide Journal of Multidisciplinary Research and Development
Flood return period is known as a recurrence interval which
is an estimate of the interval of time between flood events
or river discharge flow of a certain intensity or size [9]. It is
a statistical measurement denoting the average recurrence
interval over an extended period of time and to dimension
structures so that they are capable of withstanding an event
of a certain return period (with its associated intensity). The
terms "10 year", "50 year", "100 year" and "500 year"
floods are used to describe the estimated probability of a
flood event happening in any given year [10].
In the past decade in Nigeria, thousands of lives and
properties worth millions of Naira have been lost directly
or indirectly from flooding every year. In most urban
centers of the country most especially in fast growing
towns like Gwagwalada in the Federal Capital Territory
(FCT), human population increase, increasing paved
surfaces, streams and channel obstruction due to bad waste
disposal habit and other human activities on flood plains
were considered to be the major causes of floods [8]. In
addition, rapid urban expansion and encroachment of
settlements into the areas liable to flood is also continuing
rapidly and unabated. For example, [11] has shown that the
built-up area in Gwagwalada town has increased from
0.33km2 in 1981 to about 11.72 km2 in 2006 indicating
extensive human activities.
Flood resulting from the lower Usuma River in
Gwagwalada is becoming an annual event that is capable of
causing wanton destruction to lives, properties and the
environment. This situation puts the dwellers on
environmentally fragile and flood disaster vulnerable
locations where properties are easily washed away by the
floods [12, 13]. Flood Inundated vast area within
Gwagwalada town in year 2003, 2006 and 2009 among
others where lives were lost and property worth billions of
naira were lost to the ravaging floods [14]. River flooding,
coupled with urban development, however, intensifies the
rate of flooding in the lower section of the Usuma River,
Gwagwalada Abuja, Nigeria. This necessitates the
application of flood modeling techniques such as flood
frequency analysis, HEC-RAS and Geographic Information
System in achieving flood inundation analysis for the study
area.
Prior application of GIS technologies in flood studies in
Gwagwalada town has predominantly focused on risk and
vulnerability mapping. There is therefore a paucity of
research in flood frequency and inundation analysis in
Gwagwalada town employing (Hydrologic Engineering
Centers—River Analysis System) HEC-RAS modelling
and Geographic Information System. Such studies are
critical for understanding river geometry, urban planning
and management of lands adjacent to flood plains.
Hence the aim of this study is to carryout flood inundation
analysis of Lower Usuma River in Gwagwalada town
Abuja, Nigeria by predicting probable flooding of Lower
Usuma River using flood frequency analysis and flood
inundation analysis for different return periods using
hydraulic modelling and GIS techniques.
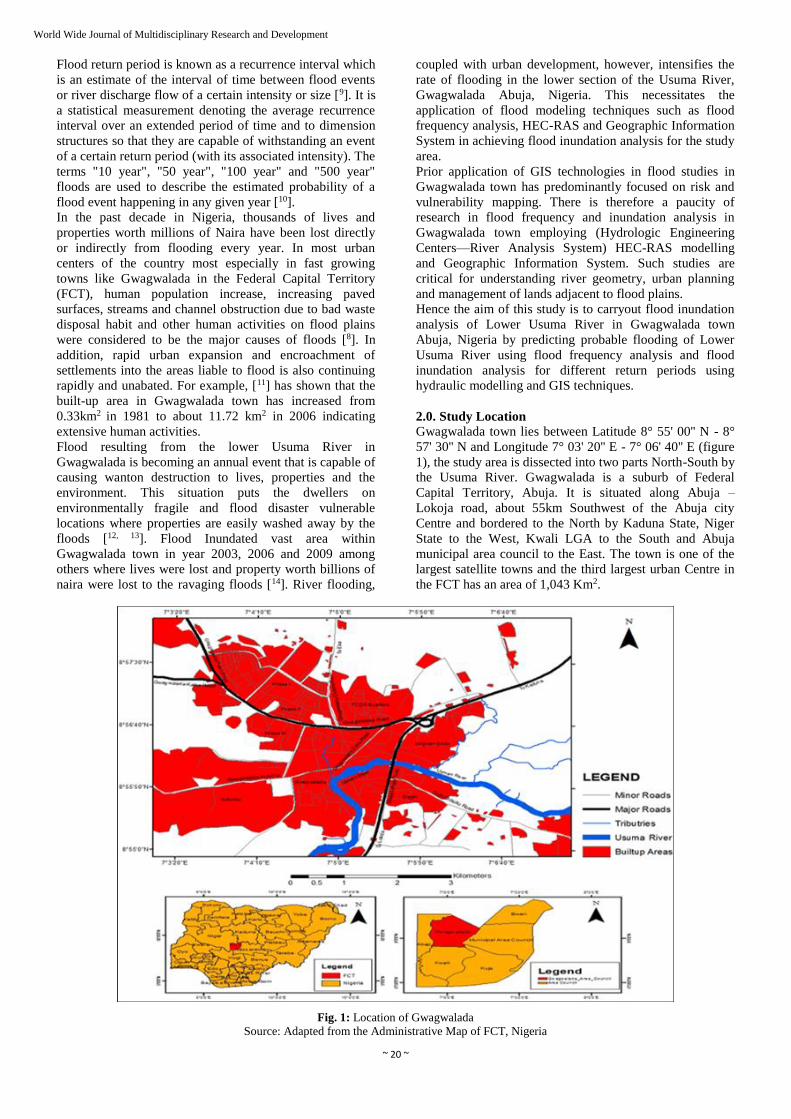
2.0. Study Location
Gwagwalada town lies between Latitude 8° 55' 00'' N - 8°
57' 30'' N and Longitude 7° 03' 20'' E - 7° 06' 40'' E (figure
1), the study area is dissected into two parts North-South by
the Usuma River. Gwagwalada is a suburb of Federal
Capital Territory, Abuja. It is situated along Abuja –
Lokoja road, about 55km Southwest of the Abuja city
Centre and bordered to the North by Kaduna State, Niger
State to the West, Kwali LGA to the South and Abuja
municipal area council to the East. The town is one of the
largest satellite towns and the third largest urban Centre in
the FCT has an area of 1,043 Km2.
Fig. 1: Location of Gwagwalada
Source: Adapted from the Administrative Map of FCT, Nigeria
~ 21 ~
World Wide Journal of Multidisciplinary Research and Development
Gwagwalada town is one of the oldest and fast growing
towns in the FCT and located within Gwagwalada Area
Council, one of the area councils among the six area
councils in the Federal Capital Territory, Abuja. The town
has witnessed mass influx of people thereby increasing the
population. Gwagwalada Area Council has a total of
80,841 people, with Gwagwalada town having 23,114 as at
1996 [15]. The population growth rate of Abuja for 2006
was (3.2%), with a population of 157,770 as at 2006 in
Gwagwalada which puts the projected population of
Gwagwalada for 2015 to be 210,427.
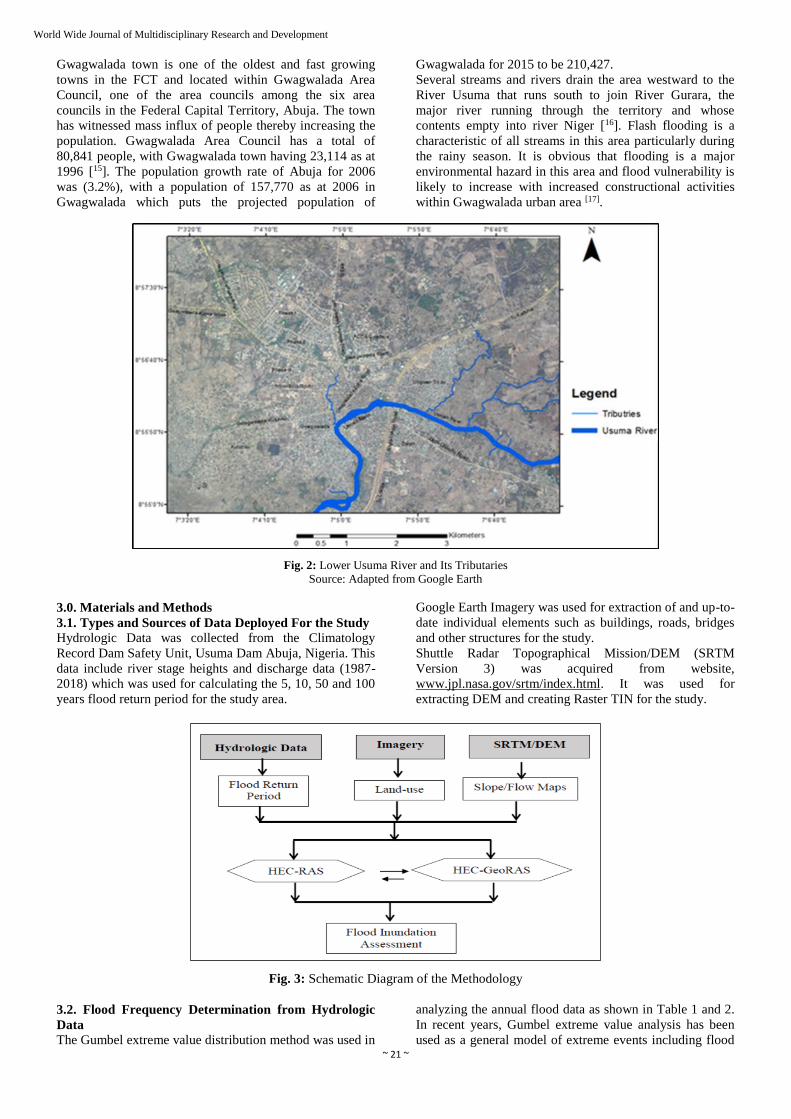
Several streams and rivers drain the area westward to the
River Usuma that runs south to join River Gurara, the
major river running through the territory and whose
contents empty into river Niger [16]. Flash flooding is a
characteristic of all streams in this area particularly during
the rainy season. It is obvious that flooding is a major
environmental hazard in this area and flood vulnerability is
likely to increase with increased constructional activities
within Gwagwalada urban area [17].
Fig. 2: Lower Usuma River and Its Tributaries
Source: Adapted from Google Earth
3.0. Materials and Methods
3.1. Types and Sources of Data Deployed For the Study
Hydrologic Data was collected from the Climatology
Record Dam Safety Unit, Usuma Dam Abuja, Nigeria. This
data include river stage heights and discharge data (1987-
2018) which was used for calculating the 5, 10, 50 and 100
years flood return period for the study area.
Google Earth Imagery was used for extraction of and up-to-
date individual elements such as buildings, roads, bridges
and other structures for the study.
Shuttle Radar Topographical Mission/DEM (SRTM
Version 3) was acquired from website,
www.jpl.nasa.gov/srtm/index.html. It was used for
extracting DEM and creating Raster TIN for the study.
Fig. 3: Schematic Diagram of the Methodology
3.2. Flood Frequency Determination from Hydrologic
Data
The Gumbel extreme value distribution method was used in
analyzing the annual flood data as shown in Table 1 and 2.
In recent years, Gumbel extreme value analysis has been
used as a general model of extreme events including flood
~ 22 ~
World Wide Journal of Multidisciplinary Research and Development
flows. To determine the return periods of extreme flood
events in the study area, the equation below was used to
forecast the flood scenarios for 5, 10, 50 and 100-years
return periods. The annual maximum gauge levels data for
32years (1987-2018) at the Usuma Dam Water Works
Guage site (570.00m) was selected and calculated. The
tables that shows these values are referred to as Gumbel’s
Extreme value distribution.
Gumbel statistics was used in flood frequency analysis,
however, the description of the Gumbel function is stated
in the equation (1);
XT = X + K * SDV ……………………………… (1)
Where:
XT = Value of variate with a return period ‘T’
X = Mean of the variate
SDV = Standard deviation of the sample
K = Frequency factor expressed as:
K = (YT – Yn) / Sn ……………………..………… (2)
YT = -[ln.ln.(Tr/(Tr - 1))] …….…………………. (3)
Where:
Tr = Return period
Yn = Reduced mean from table
Sn = Reduced standard deviation from table
Table 1: Gumbel Distribution Computation Table Using Discharge Data
Source: Gumbel Statistical Analysis
Table 2: Gumbel Distribution Computation Table Gauge Height Data
Source: Gumbel Statistical Analysis
3.3. Flood Inundation Analysis
Flood inundation for different return periods were
determined using hydraulic modeling and GIS techniques
(HEC-RAS/HEC-GeoRAS) [18]. HEC-RAS was used to
calculate water-surface profiles and ArcGIS for GIS data
processing while HEC-GeoRAS extension for ArcGIS was
used to provide the interface between the systems. HEC-
GeoRAS automates the extraction of spatial parameters for
HEC-RAS input, primarily the three-dimensional stream
network and the 3D cross-section definition. Results
exported from HEC-RAS was processed in ArcGIS.
The inundation analysis consist of five steps;
i) Preparation of DEM
ii) HEC-GeoRAS pre-processing to generate HEC-
RAS import file
iii) Running of HEC-RAS to calculate water surface
profiles and modelling water levels using cross
sections
iv) Post processing of HEC-RAS results and
v) Extent of flood inundation for 5, 10, 50 and 100-
year return periods.
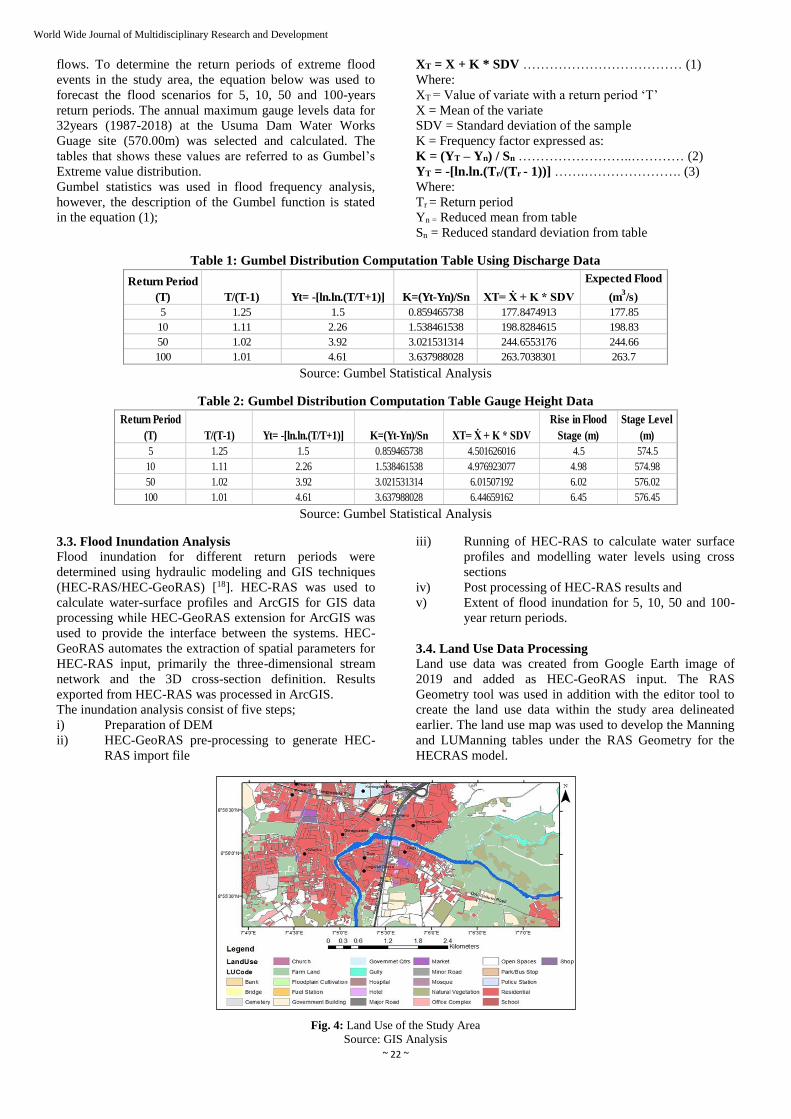
3.4. Land Use Data Processing Land use data was created from Google Earth image of
2019 and added as HEC-GeoRAS input. The RAS
Geometry tool was used in addition with the editor tool to
create the land use data within the study area delineated
earlier. The land use map was used to develop the Manning
and LUManning tables under the RAS Geometry for the
HECRAS model.
Fig. 4: Land Use of the Study Area
Source: GIS Analysis
Return Period
(T) T/(T-1) Yt= -[ln.ln.(T/T+1)] K=(Yt-Yn)/Sn XT= Ẋ + K * SDV
Expected Flood
(m3/s)
5 1.25 1.5 0.859465738 177.8474913 177.85
10 1.11 2.26 1.538461538 198.8284615 198.83
50 1.02 3.92 3.021531314 244.6553176 244.66
100 1.01 4.61 3.637988028 263.7038301 263.7
Return Period
(T) T/(T-1) Yt= -[ln.ln.(T/T+1)] K=(Yt-Yn)/Sn XT= Ẋ + K * SDV
Rise in Flood
Stage (m)
Stage Level
(m)
5 1.25 1.5 0.859465738 4.501626016 4.5 574.5
10 1.11 2.26 1.538461538 4.976923077 4.98 574.98
50 1.02 3.92 3.021531314 6.01507192 6.02 576.02
100 1.01 4.61 3.637988028 6.44659162 6.45 576.45
~ 23 ~
World Wide Journal of Multidisciplinary Research and Development
3.5. Hydraulic Modeling in HEC-RAS and Post-
Processing
The geometry from ArcGIS was imported into HEC-RAS
model. Discharge and normal depth (producing an overall
water surface slope of 0.0003) were put as the boundary
conditions for the upstream and downstream boundaries of
the study reach, respectively. Manning’s n values were
derived from the Gwagwalada town Land-Use database
created with HEC-GeoRAS. Manning n-values were
assigned to each cross section by using Extract N-Values
tool, referring to the class name attribute in land use dataset
and LU-Manning Table.
The HEC-RAS output (RAS SDF file) was converted to a
TIN file in HEC-GeoRAS. The TIN file forms a bounding
polygon created by connecting the endpoints of XS Cut
Lines and it is the analysis extent for inundation mapping.
The TIN file was converted to Raster and using Raster
calculator of ArcGIS, the underlying DEM terrain layer
was subtracted from the water surface raster. The cells with
positive values were identified to be flooded and the values
were the inundation depth for the respective flooding
scenarios / Plan.
4.0. Results and Discussions
4.1. Flood Frequency Analysis
4.1.1. Hydrological Variations for the Lower Usuma
River
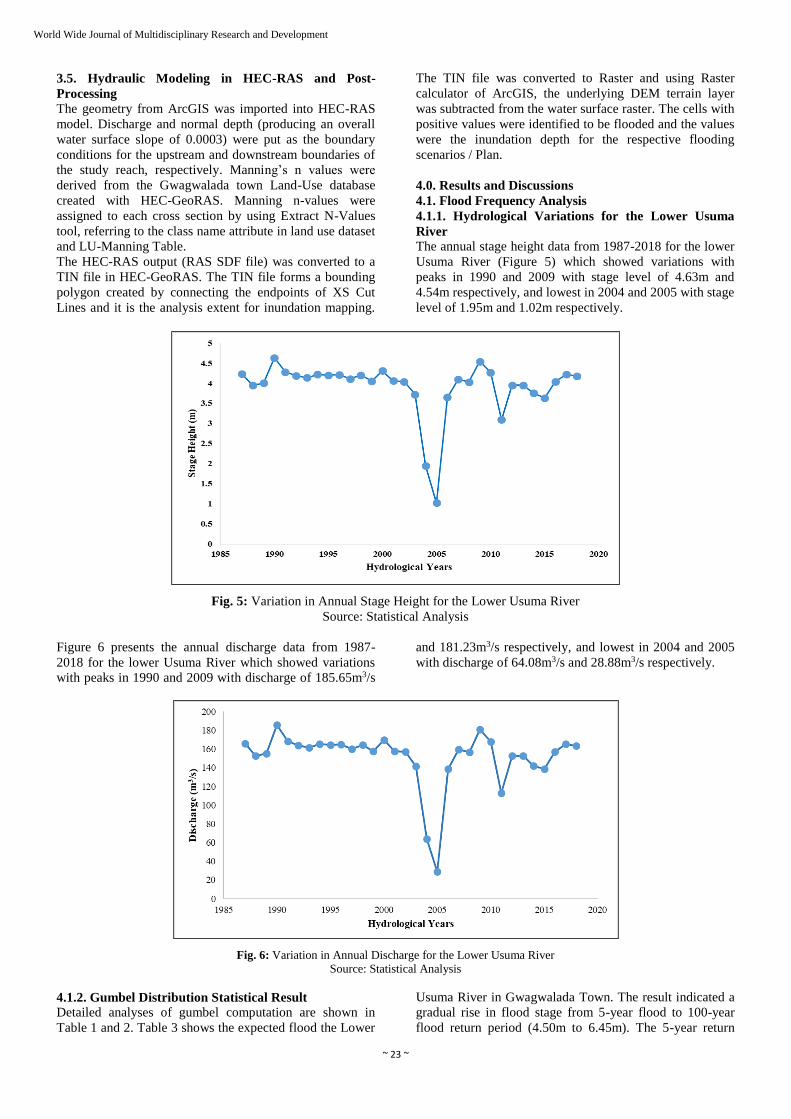
The annual stage height data from 1987-2018 for the lower
Usuma River (Figure 5) which showed variations with
peaks in 1990 and 2009 with stage level of 4.63m and
4.54m respectively, and lowest in 2004 and 2005 with stage
level of 1.95m and 1.02m respectively.
Fig. 5: Variation in Annual Stage Height for the Lower Usuma River
Source: Statistical Analysis
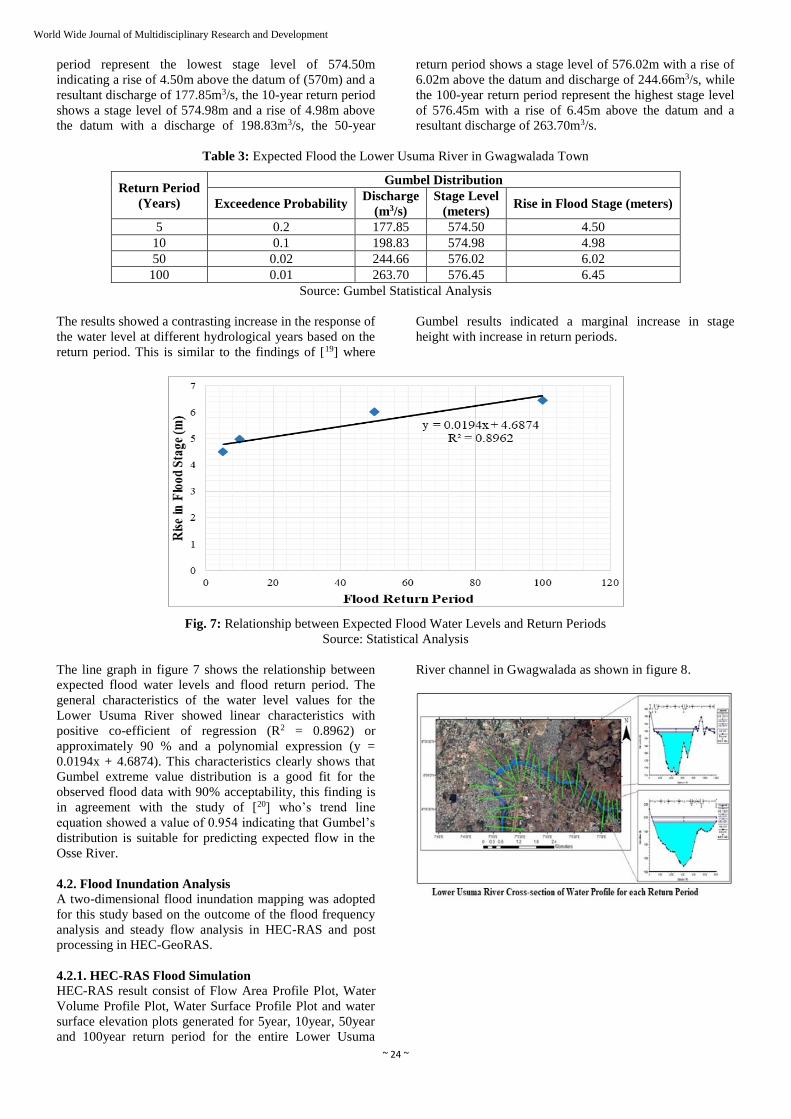
Figure 6 presents the annual discharge data from 1987-
2018 for the lower Usuma River which showed variations
with peaks in 1990 and 2009 with discharge of 185.65m3/s
and 181.23m3/s respectively, and lowest in 2004 and 2005
with discharge of 64.08m3/s and 28.88m3/s respectively.
Fig. 6: Variation in Annual Discharge for the Lower Usuma River
Source: Statistical Analysis
4.1.2. Gumbel Distribution Statistical Result Detailed analyses of gumbel computation are shown in
Table 1 and 2. Table 3 shows the expected flood the Lower
Usuma River in Gwagwalada Town. The result indicated a
gradual rise in flood stage from 5-year flood to 100-year
flood return period (4.50m to 6.45m). The 5-year return
~ 24 ~
World Wide Journal of Multidisciplinary Research and Development
period represent the lowest stage level of 574.50m
indicating a rise of 4.50m above the datum of (570m) and a
resultant discharge of 177.85m3/s, the 10-year return period
shows a stage level of 574.98m and a rise of 4.98m above
the datum with a discharge of 198.83m3/s, the 50-year
return period shows a stage level of 576.02m with a rise of
6.02m above the datum and discharge of 244.66m3/s, while
the 100-year return period represent the highest stage level
of 576.45m with a rise of 6.45m above the datum and a
resultant discharge of 263.70m3/s.
Table 3: Expected Flood the Lower Usuma River in Gwagwalada Town
Return Period
(Years)
Gumbel Distribution
Exceedence Probability Discharge
(m3/s)
Stage Level
(meters) Rise in Flood Stage (meters)
5 0.2 177.85 574.50 4.50
10 0.1 198.83 574.98 4.98
50 0.02 244.66 576.02 6.02
100 0.01 263.70 576.45 6.45
Source: Gumbel Statistical Analysis
The results showed a contrasting increase in the response of
the water level at different hydrological years based on the
return period. This is similar to the findings of [19] where
Gumbel results indicated a marginal increase in stage
height with increase in return periods.
Fig. 7: Relationship between Expected Flood Water Levels and Return Periods
Source: Statistical Analysis
The line graph in figure 7 shows the relationship between
expected flood water levels and flood return period. The
general characteristics of the water level values for the
Lower Usuma River showed linear characteristics with
positive co-efficient of regression (R2 = 0.8962) or
approximately 90 % and a polynomial expression (y =
0.0194x + 4.6874). This characteristics clearly shows that
Gumbel extreme value distribution is a good fit for the
observed flood data with 90% acceptability, this finding is
in agreement with the study of [20] who’s trend line
equation showed a value of 0.954 indicating that Gumbel’s
distribution is suitable for predicting expected flow in the
Osse River.
4.2. Flood Inundation Analysis
A two-dimensional flood inundation mapping was adopted
for this study based on the outcome of the flood frequency
analysis and steady flow analysis in HEC-RAS and post
processing in HEC-GeoRAS.
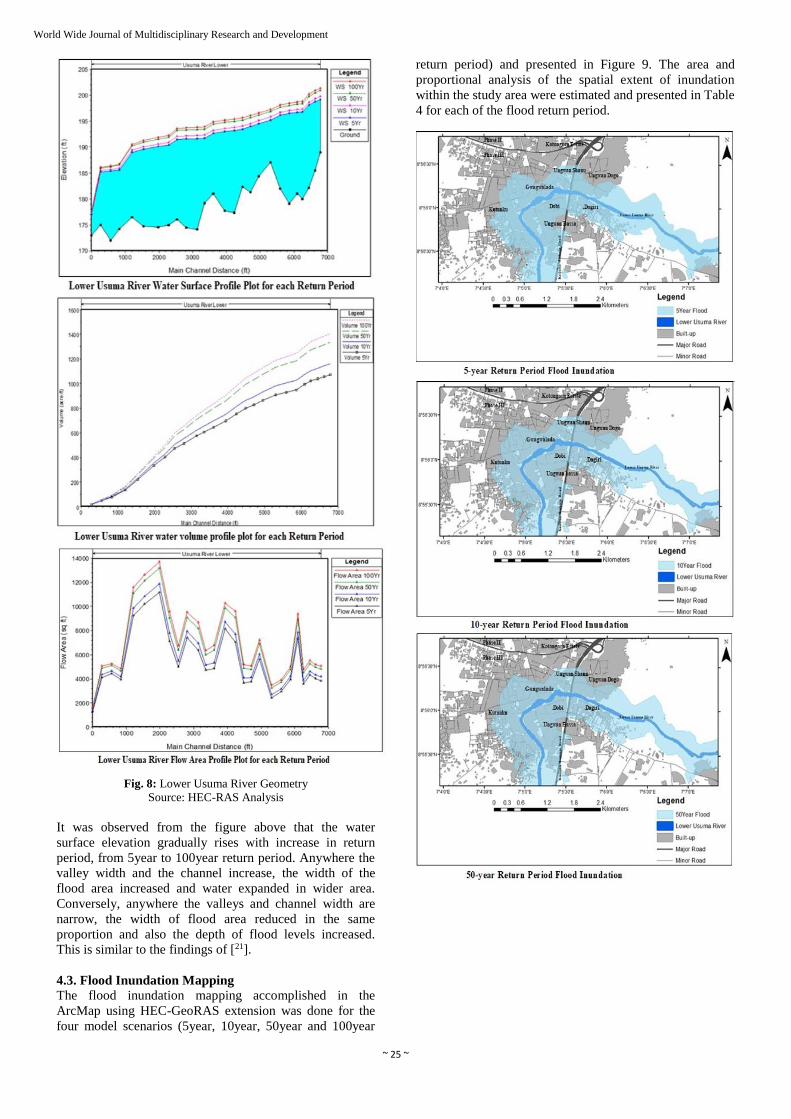
4.2.1. HEC-RAS Flood Simulation
HEC-RAS result consist of Flow Area Profile Plot, Water
Volume Profile Plot, Water Surface Profile Plot and water
surface elevation plots generated for 5year, 10year, 50year
and 100year return period for the entire Lower Usuma
River channel in Gwagwalada as shown in figure 8.
~ 25 ~
World Wide Journal of Multidisciplinary Research and Development
Fig. 8: Lower Usuma River Geometry
Source: HEC-RAS Analysis
It was observed from the figure above that the water
surface elevation gradually rises with increase in return
period, from 5year to 100year return period. Anywhere the
valley width and the channel increase, the width of the
flood area increased and water expanded in wider area.
Conversely, anywhere the valleys and channel width are
narrow, the width of flood area reduced in the same
proportion and also the depth of flood levels increased.
This is similar to the findings of [21].
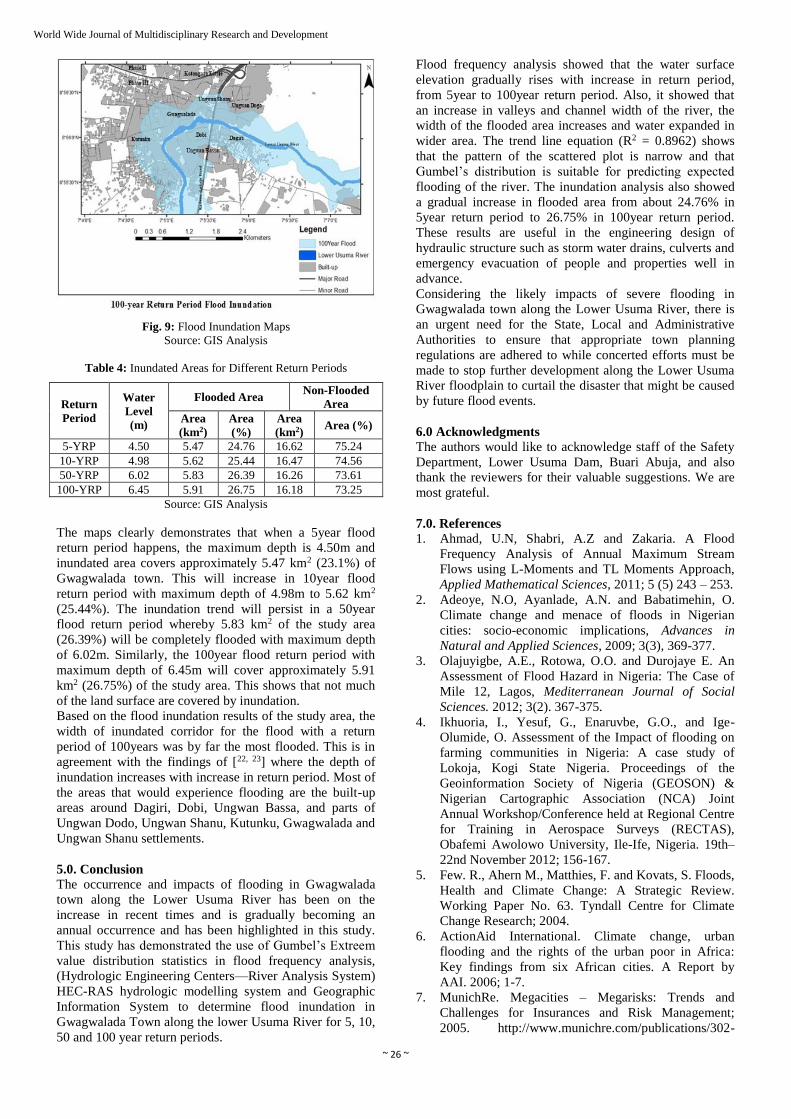
4.3. Flood Inundation Mapping
The flood inundation mapping accomplished in the
ArcMap using HEC-GeoRAS extension was done for the
four model scenarios (5year, 10year, 50year and 100year
return period) and presented in Figure 9. The area and
proportional analysis of the spatial extent of inundation
within the study area were estimated and presented in Table
4 for each of the flood return period.
~ 26 ~
World Wide Journal of Multidisciplinary Research and Development
Fig. 9: Flood Inundation Maps
Source: GIS Analysis
Table 4: Inundated Areas for Different Return Periods
Return
Period
Water
Level
(m)
Flooded Area Non-Flooded
Area
Area
(km2)
Area
(%)
Area
(km2) Area (%)
5-YRP 4.50 5.47 24.76 16.62 75.24
10-YRP 4.98 5.62 25.44 16.47 74.56
50-YRP 6.02 5.83 26.39 16.26 73.61
100-YRP 6.45 5.91 26.75 16.18 73.25
Source: GIS Analysis
The maps clearly demonstrates that when a 5year flood
return period happens, the maximum depth is 4.50m and
inundated area covers approximately 5.47 km2 (23.1%) of
Gwagwalada town. This will increase in 10year flood
return period with maximum depth of 4.98m to 5.62 km2
(25.44%). The inundation trend will persist in a 50year
flood return period whereby 5.83 km2 of the study area
(26.39%) will be completely flooded with maximum depth
of 6.02m. Similarly, the 100year flood return period with
maximum depth of 6.45m will cover approximately 5.91
km2 (26.75%) of the study area. This shows that not much
of the land surface are covered by inundation.
Based on the flood inundation results of the study area, the
width of inundated corridor for the flood with a return
period of 100years was by far the most flooded. This is in
agreement with the findings of [22, 23] where the depth of
inundation increases with increase in return period. Most of
the areas that would experience flooding are the built-up
areas around Dagiri, Dobi, Ungwan Bassa, and parts of
Ungwan Dodo, Ungwan Shanu, Kutunku, Gwagwalada and
Ungwan Shanu settlements.
5.0. Conclusion The occurrence and impacts of flooding in Gwagwalada
town along the Lower Usuma River has been on the
increase in recent times and is gradually becoming an
annual occurrence and has been highlighted in this study.
This study has demonstrated the use of Gumbel’s Extreem
value distribution statistics in flood frequency analysis,
(Hydrologic Engineering Centers—River Analysis System)
HEC-RAS hydrologic modelling system and Geographic
Information System to determine flood inundation in
Gwagwalada Town along the lower Usuma River for 5, 10,
50 and 100 year return periods.
Flood frequency analysis showed that the water surface
elevation gradually rises with increase in return period,
from 5year to 100year return period. Also, it showed that
an increase in valleys and channel width of the river, the
width of the flooded area increases and water expanded in
wider area. The trend line equation (R2 = 0.8962) shows
that the pattern of the scattered plot is narrow and that
Gumbel’s distribution is suitable for predicting expected
flooding of the river. The inundation analysis also showed
a gradual increase in flooded area from about 24.76% in
5year return period to 26.75% in 100year return period.
These results are useful in the engineering design of
hydraulic structure such as storm water drains, culverts and
emergency evacuation of people and properties well in
advance.
Considering the likely impacts of severe flooding in
Gwagwalada town along the Lower Usuma River, there is
an urgent need for the State, Local and Administrative
Authorities to ensure that appropriate town planning
regulations are adhered to while concerted efforts must be
made to stop further development along the Lower Usuma
River floodplain to curtail the disaster that might be caused
by future flood events.
6.0 Acknowledgments
The authors would like to acknowledge staff of the Safety
Department, Lower Usuma Dam, Buari Abuja, and also
thank the reviewers for their valuable suggestions. We are
most grateful.
7.0. References
1. Ahmad, U.N, Shabri, A.Z and Zakaria. A Flood
Frequency Analysis of Annual Maximum Stream
Flows using L-Moments and TL Moments Approach,
Applied Mathematical Sciences, 2011; 5 (5) 243 – 253.
2. Adeoye, N.O, Ayanlade, A.N. and Babatimehin, O.
Climate change and menace of floods in Nigerian
cities: socio-economic implications, Advances in
Natural and Applied Sciences, 2009; 3(3), 369-377.
3. Olajuyigbe, A.E., Rotowa, O.O. and Durojaye E. An
Assessment of Flood Hazard in Nigeria: The Case of
Mile 12, Lagos, Mediterranean Journal of Social
Sciences. 2012; 3(2). 367-375.
4. Ikhuoria, I., Yesuf, G., Enaruvbe, G.O., and Ige-
Olumide, O. Assessment of the Impact of flooding on
farming communities in Nigeria: A case study of
Lokoja, Kogi State Nigeria. Proceedings of the
Geoinformation Society of Nigeria (GEOSON) &
Nigerian Cartographic Association (NCA) Joint
Annual Workshop/Conference held at Regional Centre
for Training in Aerospace Surveys (RECTAS),
Obafemi Awolowo University, Ile-Ife, Nigeria. 19th–
22nd November 2012; 156-167.
5. Few. R., Ahern M., Matthies, F. and Kovats, S. Floods,
Health and Climate Change: A Strategic Review.
Working Paper No. 63. Tyndall Centre for Climate
Change Research; 2004.
6. ActionAid International. Climate change, urban
flooding and the rights of the urban poor in Africa:
Key findings from six African cities. A Report by
AAI. 2006; 1-7.
7. MunichRe. Megacities – Megarisks: Trends and
Challenges for Insurances and Risk Management;
2005. http://www.munichre.com/publications/302-
~ 27 ~
World Wide Journal of Multidisciplinary Research and Development
04271_en.pdf. Retrieved May 20, 2017.
8. Olusegun, E.O. Disaster and Sustainable Development:
Some Reflections and African Perspective. In the
Proceedings of the Directors and Heads of Disasters
Management Organization in Nigeria National
Conference. 2004; 159 – 170.
9. Rakhecha, P.R. and Singh, V.P. Applied
Hydrometeorology. Heidelberg: Springer; 2009.
10. Watson, D. and Adams, M. Design for Flooding,
Canada: John Wiley and Sons; 2010.
11. Oyatayo, K. T, Uwazuruonye, J., Ndabula, C., Abaje,
I.B., Tata, H., Jidauna, G., Abimiku, E.S., and Shaba,
H.A. An Assessment of Buildup Expansion on an
Urban Floodplain: for Sustainable Growth and
Development of Gwagwalada F.C.T. Nigeria. Journal
of Environmental Sciences and Policy Evaluation,
2013; 3(2), 22-30.
12. World Bank. Building a sustainable future, the African
region environment strategy, World Bank. Washington
D.C; 2002.
13. Ayeni, B. and Ojo, E.O. eds. Proceedings of the
National Conference of Directors and Heads of
Disaster Management Organization in Nigeria held at
Le Meridien, Tafawa Balewa way, Garki, Abuja; 2004.
NEMA.
14. The Sun online 2009, Fresh Deluge of Fears. Last
accessed August 15, 2014.
15. Balogun, O. The Federal Capital Territory of Nigeria:
A Geography of Its Development. University of Ibadan
Press Limited; 2001.
16. Olugboye, M.O. Report on the Preliminary Hydro-
geological Investigation of FCT Abuja, Federal
Department of water Resources No.4; 1977.
17. Offodile, M. E. An Approach to Groundwater Study
and Development in Nigeria. Mecon Services Ltd. Jos,
1992; 224-227.
18. Ackerman, C.T. HEC-GeoRAS; GIS Tools for support
of HEC-RAS using ArcGIS. Redlands: ESRI. 2005;
204.
19. Odunuga, S. and Raji S.A. Flood Frequency Analysis
and Inundation Mapping of Lower Ogun River Basin.
Journal of Water Resource and Hydraulic
Engineering. 2014; 3(3), 48-59.
20. Okonofua S, and Ogbeifun, P. Flood Frequency
Analysis of Osse River Using Gumbel’s Distribution.
Civil and Environmental Research, 2013; 3(10), 55-60.
21. Somaiyeh, K, Mehran, M, Sorayya, K. Integrated
application of HEC-RAS and GIS and RS for flood
risk assessment in Lighvan Chai River. International
Journal of Engineering Science Invention, 2015; 4(4).
38-45
22. Jeb, D.N. Application of Geo-information Science in
Flood Risk Analysis in Kaduna Metropolis, Kaduna,
Kaduna State; 2014. Unpublished PhD Thesis,
Geography Department, A.B.U., Zaria.
23. Ghanim, A.A. Simulation of Flood Inundation of a
Low Lying Area of Ma'abar Town in Yemen Using
Remote Sensing and GIS. Journal of Engineering and
Applied Science. 2012; 3(59), 247-264.
Recommended


