
Seediscussions,stats,andauthorprofilesforthispublicationat:https://www.researchgate.net/publication/259512276
Fluid-flownumericalexperimentsoffaultedporouscarbonates,NorthwestSicily(Italy)
ARTICLEinMARINEANDPETROLEUMGEOLOGY·JANUARY2013
ImpactFactor:2.64·DOI:10.1016/j.marpetgeo.2013.12.003
CITATIONS
3
READS
148
5AUTHORS,INCLUDING:
MarcoAntonellini
UniversityofBologna
103PUBLICATIONS1,665CITATIONS
SEEPROFILE
AntoninoCilona
StanfordUniversity
25PUBLICATIONS87CITATIONS
SEEPROFILE
MillerZambrano
UniversityofCamerino
5PUBLICATIONS3CITATIONS
SEEPROFILE
FabrizioAgosta
UniversitàdegliStudidellaBasilicata
82PUBLICATIONS529CITATIONS
SEEPROFILE
Availablefrom:AntoninoCilona
Retrievedon:03February2016

lable at ScienceDirect
Marine and Petroleum Geology xxx (2013) 1e16
Contents lists avai
Marine and Petroleum Geology
journal homepage: www.elsevier .com/locate/marpetgeo
Fluid flow numerical experiments of faulted porous carbonates,Northwest Sicily (Italy)
Marco Antonellini a,*, Antonino Cilona b, Emanuele Tondi c, Miller Zambrano c,Fabrizio Agosta d
aDepartment of Biological, Geological and Environmental Sciences, University of Bologna e CIRSA, via San Alberto 163, 48123 Ravenna, RA, ItalybDepartment of Geological and Environmental Sciences, Stanford University, CA, USAc School of Environmental Sciences, University of Camerino, ItalydDepartment of Sciences, University of Basilicata, Potenza, Italy
a r t i c l e i n f o
Article history:Received 25 July 2013Received in revised form8 November 2013Accepted 9 December 2013Available online xxx
Keywords:Strike-slip faultsDeformation bandsSub-seismic resolution faultsField analogueNumerical modelingDiscrete fracture network
* Corresponding author. Tel.: þ39 339 4978001.E-mail address: [email protected] (M. Antone
0264-8172/$ e see front matter � 2013 Elsevier Ltd.http://dx.doi.org/10.1016/j.marpetgeo.2013.12.003
Please cite this article in press as: AntonellinMarine and Petroleum Geology (2013), http
a b s t r a c t
A methodology to assess the effects of structural heterogeneities below seismic resolution in porouscarbonate grainstones on reservoir performance during production is developed by integrating structuralanalysis, power law distributions, up-scaling, and numerical techniques. The novelty of the methodologyconsists of accounting for the buffering effects on permeability caused by compactive and cataclasticdeformation bands. By using this methodology, a 3D deterministic field analogue and a 3D DiscreteFracture Network (DFN) representations of the reservoir/aquifer were built first, and then single-phase,steady-state fluid flow numerical experiments in an equivalent porous medium framework were per-formed. The field analogue is located along the Northwestern coast of Sicily (Italy) where Lower Pleis-tocene porous carbonate grainstones are crosscut by a strike-slip fault system. This fault system is madeup of two conjugate sets of strike-slip shear structures recognized as single compactive shear bands(CSB), zones of compactive shear bands (ZB) and well-developed faults (DF), with discrete slip surfacesand cataclastic material. The permeability of these structures is up to three orders of magnitude less thanthe surrounding porous carbonate rocks. The fluid flow numerical experiments have been performed onthe two aforementioned reservoir/aquifer descriptions to assess the effect of Sub-Seismic ResolutionsFaults (SSRF), such as those observed in the outcrops, on fluid flow during production from a well, in-jection production in Enhanced Oil Recovery (EOR), and up-scaling to large cell size for regional flowsimulation. Comparison of draw-down modeling in the DFN and the deterministic models show thatresults are similar with the exception of wells located in areas of intense strain localization with ZB andDF. The use of the DFN model is therefore an acceptable representation of the heterogeneities induced bySSRF in a reservoir/aquifer. Results of numerical computations show that, in structurally complex areas,SSRF-related ZB and DF might represent a drilling risk because they can enhance draw-down duringproduction and EOR activities.
� 2013 Elsevier Ltd. All rights reserved.
1. Introduction
Sub-Seismic Resolution Faults (SSRF), also called sub-seismicfaults, are small offset faults that cannot be imaged on seismicreflection profiles processed with standard and enhanced tech-niques (Childs et al., 1990; Walsh et al., 1998). The maximum ver-tical resolution obtained nowadays by seismic line processing is inthe order of 5e10 m (Hustoft et al., 2007). Despite their elusivecharacteristics, SSRF may have a strong impact on fluid flow and
llini).
All rights reserved.
i, M., et al., Fluid flow numeri://dx.doi.org/10.1016/j.marpe
sealing within a reservoir due to their geometry, high density, andconnectivity (Agosta et al., 2010; Ambrose et al., 2008; Ballas et al.,2013; Cello et al., 2001; Damsleth et al., 1998; Esposito et al., 2010;Maerten et al., 2006; Manzocchi et al., 2008; Walsh et al., 1998;Yielding et al., 1992). According to kinematics, amount of offset,deformation mechanisms, burial conditions and diagenetic evolu-tion that characterize these features, SSRF may enhance (whenassociated to predominant dilational fracturing), buffer (cataclasis)or prevent (clay smearing, compaction) fluid flow in a reservoir(Agosta et al., 2012; Antonellini and Aydin, 1995; Ballas et al., 2013;Fachri et al., 2013; Faerseth et al., 2007; Fossen and Bale, 2007;Yielding et al., 1997; Manzocchi et al., 2008; Morris et al., 2012;Rotevatn et al., 2009; Tondi, 2007; Walsh et al., 1998). Different
cal experiments of faulted porous carbonates, Northwest Sicily (Italy),tgeo.2013.12.003

M. Antonellini et al. / Marine and Petroleum Geology xxx (2013) 1e162
strategies have been adopted to image SSRF from seismic data; theyinclude the use of seismic attributes such as coherency or curvature(Astratti et al., 2012; Lohr et al., 2008; Pearce et al., 2011), analysis ofamplitude variations in 3D seismic models (Lohr et al., 2008), theuse of stochastic techniques to extrapolate the SSRF from seismicresolution faults (Marrett and Allmendinger, 1992), and interpre-tation of the fault traces from seismic profiles and logs (Lohr et al.,2008). Non-geophysical techniques employed to image SSRF arebased on paleo-stress analysis, structural restoration, studies ofoutcropping analogues and fractal/stochastic analysis of fault at-tributes (Agosta et al., 2010; Cello et al., 2000, 2003; Kattenhornand Pollard, 2001; Maerten et al., 2002; Maerten and Maerten,2006; Maerten et al., 2006; Roberts, 2007; Saillet and Wibberley,2013; Schultz et al., 2008, 2013; Shipton et al., 2002). Since thelate 90s, a large number of studies on SSRF have been producedafter analysis of, mainly, sandstone and siliciclastic rocks (Fossenand Bale, 2007; Morris et al., 2012 and references therein). Somestudies have also been presented for carbonate rocks (Farran et al.,2005; Morris et al., 2009; Penney et al., 2005; Putz-Perrier andSanderson, 2010), and for the effects of fault geometry, damagezones and SSRF on fluid flow (Matthäi et al., 1998; Fossen and Bale,2007; Rotevatn et al., 2009; Fossen et al., 2010).
Besides the inherent risk or advantages that SSRF cause duringoil exploration in terms of migration, fault sealing, top-sealbreaching, and reservoir quality enhancement/degradation(Manzocchi et al., 2008; Walsh et al., 1998), SSRF may play animportant role during the phase of oil production, Enhanced OilRecovery (EOR), and geologic CO2 sequestration (Ambrose et al.,2008; Damsleth et al., 1998; Esposito et al., 2010). Antonelliniet al. (1999) have shown that deformation bands faults in the oilfield of Arroyo Grande (California, USA) were controlling the effi-ciency of the steam injection production scheme employed for EOR.Structural heterogeneities and SSRF have also been shown to affectthe water circulation in aquifers within siliciclastic (Haneberg,1995; Rawling et al., 2000) and carbonate rocks (Celico et al., 2006).
Focusing on deformation bands, characteristic structural fea-tures of porous rocks that deform like granular media (Aydin et al.,2006), they have been a matter of interest due to their pronouncedcontrol on fluid flow in reservoir rocks (Nelson, 2001). The litera-ture characterizing the petrophysical properties of deformationbands in siliciclastic rocks is rather extensive (Antonellini andAydin, 1994; Faulkner et al., 2010; Flodin et al., 2001, 2004;Fossen and Bale, 2007; Fowles and Burley, 1994; Lothe et al.,2002; Main et al., 2000; Ngwenya et al., 2003; Shipton et al.,2002; Sternlof et al., 2004; Taylor and Pollard, 2000). Conversely,only in recent times some work has been done for deformationbands in carbonate rocks (Cilona et al., 2012; Micarelli et al., 2006;Rath et al., 2011; Rustichelli et al., 2012; Tondi et al., 2006b, 2012;Tondi, 2007). Field, numerical, and theoretical studies investi-gated how deformation bands may affect the subsurface fluid flow,and at what scale their effect is most influential (Ahmadov et al.,2007; Antonellini and Aydin, 1994, 1995; Jourde et al., 2002;Manzocchi et al., 1999; Sternlof et al., 2004; Manzocchi et al.,2008; Matthäi et al., 1998).
In siliciclastic rocks, the permeability values of deformationbands measured normal to the plane of the band range from lessthan 0.1 mD to a few tens of mD (Antonellini and Aydin, 1994;Fossen and Bale, 2007). The aforementioned values are consistentwith the deformation bands decreasing the host rock permeabilityby one to four orders of magnitude. In carbonate rocks, Rath et al.(2011) documented that permeability is reduced as much as threeorders of magnitude in the direction normal to the band withrespect to the host rock. Slip surfaces associated to thick zones ofdeformation bands are discontinuities in the rock that may act, in away, similarly to an open fracture enhancing the permeability in
Please cite this article in press as: Antonellini, M., et al., Fluid flow numeriMarine and Petroleum Geology (2013), http://dx.doi.org/10.1016/j.marpe
the direction parallel to its plane (Antonellini and Aydin, 1994,1995).
Excellent rock exposures located along the Northwest Sicilyshoreline provide a unique opportunity to study in detail the fluidflow properties of a high porosity, Pleistocene carbonate grainstonerock crosscut by a strike-slip faults system (Fig. 1). The outcropsallow investigating the effects of small offset sub-vertical faults onan aquifer/reservoir-scale permeability analogue during productionby designing accurate numerical experiments for single-phase fluidflow. The strike-slip faults nucleated from compactive shear bands(sensu Aydin et al., 2006). Single compactive shear bands representthe incipient stage of faulting in porous rock (Aydin, 1978; Aydinand Johnson, 1978; Aydin et al., 2006). These structures evolveforming zones of compactive shear bands, which have offsets<0.5 m, well below the limit of seismic resolution. Eventually at anoffset larger than 0.5 m, according to fault/rock type, lithologiccharacteristics, and stress state (Aydin et al., 2006), zones of com-pactive shear bands become well-developed faults (sensu strictu)containing discrete slip surfaces along which cataclasis occurs. Itfollows that many faults formed by the aforementioned process fallbelow the limit of seismic resolution in the outcrops of NorthwestSicily (Tondi, 2007; Tondi et al., 2012).
The objectives of this paper are the following. (1) Characterize inthe field the sub-seismic resolution strike-slip fault network bymeans of structural mapping, scan lines/areas surveys and mini-permeametry. (2) Define methodologies to up-scale and/or elabo-rate the structural and permeability properties measured in thefield, so that they can be imported in a standard single-phase fluidflow simulator (i.e. MODFLOW 2005) used in ground watermodeling under an equivalent porous medium approach. (3)Compare two methodologies, one based on a deterministic fullydescriptive approach (field maps), the other one on a DiscreteFracture Network (DFN) obtained with a stochastic approach(MOVE�), to describe both structural and petrophysical propertiesof the network of structures (i.e. compactive shear bands, zones ofcompactive shear bands, and faults). The comparison will be doneby testing the same field area with the two aforementionedmethods and using simple boundary conditions in the fluid flownumerical experiments. (4) Evaluate the importance of the sub-seismic resolution strike-slip fault networks on single-phase flowduring well production at a reservoir-scale.
2. Study area
The studied outcrops, located in Northwest Sicily (San Vito loCapo peninsula and Favignana Island) are roughly oriented northesouth (see Fig. 1 for location). The northwestern corner of Sicilyrepresents the most external sector of the Sicilian orogenic belt,which is mainly comprised of south-verging, Neogene fold-thrusttectonic elements (Giunta et al., 2000). The most recent faultsoutcropping in the area form a system comprised of high-angle,strike-slip structures oriented either WeNW or NeNE (Abateet al., 1993, 1997; Giunta et al., 2004; Nigro et al., 2000; Tondiet al., 2006a). The former faults are characterized by a right-lateral kinematics, the latter by a left-lateral one. The kinematicsof such a fault system is compatible to the current regional stressfield, which is made up of an NWeSE oriented principal horizontalcompression direction (Giunta et al., 2009).
In the study area, deformed Triassic to Miocene platform car-bonates, which pass upwards into deep-water marls and lime-stones, are the basement units underlying Plio-Pleistocene marinedeposits comprised of Upper Pliocene shales overlain by 20e30 mthick, Lower Pleistocene carbonate grainstones (Abate et al., 1993,1997). The latter rocks include beds, characterized by a thicknessranging between 20 cm and 100 cm, made up of eroded carbonate
cal experiments of faulted porous carbonates, Northwest Sicily (Italy),tgeo.2013.12.003

Figure 1. (a) Location of the study area; (b) photograph and relative detailed map of small- to medium-offset strike-slip CSB, ZB, and DF exposed in a 200 m long outcrop locatedalong the coast of Piana di Castelluzzo (San Vito Lo Capo). The images were digitally acquired by helicopter flying at an altitude of about 50 m above sea level; and (c) orientationdata.
M. Antonellini et al. / Marine and Petroleum Geology xxx (2013) 1e16 3
and marl fragments with bioclasts (i.e. Vermetus, Serpula, lamelli-branches, echinoids, algae and corals) spanning in size from sub-millimeter to a centimetres. Erosional unconformities commonlyseparate adjacent carbonate beds. The maximum burial depththese rocks experienced is estimated up to 30m (Abate et al., 1997).Thin-section observations are consistent with the presence of bothintergranular and intragranular porosities (Tondi et al., 2012).Generally, well-developed intergranular pores form a connectednetwork in 2D; both shapes and sizes of these pores change withthe grain size and sorting. Intergranular pores can reach a few mmin diameter in the very coarse-grained lithofacies. The overall hostrock porosity measured by both image analysis (2D) and laboratorymeasurements of representative cylindrical cores (3D) ranges be-tween 25% and 45% (Tondi et al., 2012). Even if in small amounts,microsparry cement is always present at the grain contacts and/orwithin intragranular pores. In addition, syntaxial overgrowthcement might be present around echinoid plates and spines.
3. Methodology
3.1. Structural setting
At San Vito Lo Capo peninsula and Favignana Island, the EarlyPleistocene carbonate grainstones are crosscut by several smalloffset strike-slip shear structures that include: (i) single compactiveshear bands (CSB), (ii) zones of compactive shear bands (ZB) and (iii)well-developed faults (DF), with slip surfaces and fault rocks. CSBandZBarepresentwithin fault-bounded rockvolumes. The evolvinggrowth processes of these faults, as well as their dimensional pa-rameters, are documented in Tondi (2007) and Tondi et al. (2012).
The aforementioned structures form a network made up of adominant set trending ESEeWSW and two subordinate setstrending roughly NWeSE and NeS (Fig. 2a and b). Markers repre-sented by the geometry of the step-over zones and bedding/olderstructures offsets indicate a right-lateral strike-slip character for
Please cite this article in press as: Antonellini, M., et al., Fluid flow numeriMarine and Petroleum Geology (2013), http://dx.doi.org/10.1016/j.marpe
the ESE-striking set, left-lateral strike-slip kinematics for the N-striking set and oblique-slip normal kinematics for the NW-trending one (Figs. 2a and 3a). The three aforementioned sets, allsub-vertical, showmutual crosscutting relationships which suggestthey developed, more or less, contemporaneously (Figs. 2a and 3a).
Tondi (2007) documented three different tabular zones (zones I,II and III) within the outcropping faults (Fig. 2b). Zone I representsthe inner part, which includes the slip surfaces and is characterizedby a well-developed, continuous zone of grain size and porosityreduction. Zone II, which bounds on both sides zone I, is a com-pacted grain zone with stylolites localized at the grain contacts;generally, in terms of thickness it is one half of zone I. Zone IIIrepresents a thicker volume, surrounding both zones I and II, inwhich porosity reduction is due to precipitation of calcite cements.
Aiming at gathering enough data to build up two differentmodels of the fracture network, one based on a deterministic fullydescriptive fieldmap, the other one on a Discrete Fracture Network,we investigated two different outcrops. One of these is located atSan Vito Lo Capo Peninsula, along the marine flat surface of thePiana di Castelluzzo, the other one at Favignana Island within theinactive quarry of Cala San Nicola (see Fig. 1 for location). At SanVito lo Capo Peninsula, we integrated the detailed map (at a 1:25scale) first published by Tondi (2007) with new results of a detailedstructural and permeability (using a TinyPerm II Portable Air Per-meameter, Balsamo et al., 2010) survey of the outcropping struc-tural features (Figs. 3 and 4). At Favignana, we computed thedimensional parameters (i.e. length, thickness and displacement) ofstrike-slip structures cropping out at Cala San Nicola (Tondi et al.,2012) after scan line measurements and detailed structural map-ping (at a 1:1 scale). The Favignana outcrop was chosen to developthe power law distributions that were also used in the models forSan Vito Lo Capo for two reasons: (1) the structure sets orientationsand their distributions are similar at San Vito Lo Capo and Favig-nana, (2) the length of the outcrops in Favignana allowed for betterdata collection to construct the power law distributions.
cal experiments of faulted porous carbonates, Northwest Sicily (Italy),tgeo.2013.12.003

Figure 2. (a) The conjugate strike-slip compactive shear bands exposed in the studied outcrops, the field mini-permeameter is also recognizable. (b) Detail of a strike-slipcompactive shear band, the zones I, II and III composing the structure are shown.
M. Antonellini et al. / Marine and Petroleum Geology xxx (2013) 1e164
3.2. Fault permeability
Permeability measurements were carried out in the field oncarbonate grainstone host rock, as well as on diagenetic/struc-tural zones I, II, and III associated with single compactive shearbands (CSB), zones of compactive shear bands (ZB), and well-developed faults (DF), with slip surface and cataclasis (seeFigs. 3 and 4). A total of 56 measurements was collected in thedifferent domains: 33 measurements in the host rock, 12 mea-surements in zone III, and 11 measurements in zones I and II ofthe structures (as for definition, zone I is present only in well-developed faults).
Measurements were performed by using the TinyPerm IIPortable Air Permeameter (mini-permeameter) manufactured by
Figure 3. (a) Map of strike-slip faults in porous grainstone at San Vito Lo Capo that wapermeability was measured in the field with a portable permeameter. (b) Detail of the mapreferred to the web version of this article.)
Please cite this article in press as: Antonellini, M., et al., Fluid flow numeriMarine and Petroleum Geology (2013), http://dx.doi.org/10.1016/j.marpe
New England Research. The employed permeameter providesreliable permeability values from 10�4 to 101 Darcy. Sampling siteswere carefully scraped with a putty knife to remove weatheringeffects, and gently brushed to take off dust that could likely influ-ence the permeability measurements. A silicon ring (5 mm ofdiameter) was used to avoid air leaking from the mini-permeameter nozzle, which is smaller than most ZB widths andof the same order of magnitude of CSB in coarse grainstones.Despite the permeability has been measured in the single zones(zones I, II and III), due to the diameter size of nozzle, it was notpossible to distinguish between permeability measurements car-ried out in zones I and II. For this reason, all measurements per-taining to those zones are grouped together in the general class“zones IeII”.
s used to build the reservoir/aquifer model, showing points (red circles) where thein (a). (For interpretation of the references to color in this figure legend, the reader is
cal experiments of faulted porous carbonates, Northwest Sicily (Italy),tgeo.2013.12.003

Figure 4. Summary of permeability measurements with the field permeameter at SanVito Lo Capo. 33 measurements in the host rock, 11 measurements in zones IeII and 12measurements in zone III. In zone III five measurements were done normal to the faultand 7 measurements were done parallel to the fault. The graph reports also thearithmetic, geometric, and arithmetic mean.
M. Antonellini et al. / Marine and Petroleum Geology xxx (2013) 1e16 5
3.3. Stochastic analysis
Figure 5 (modified from Tondi et al., 2012) shows the scalingrelationships (a) and the cumulative frequency distribution (b) ofthe dimensional parameters (i.e., length, thickness, and displace-ment) of the studied structures. The structures are subdivided intothree groups: one for each evolutionary stages (CSB, ZB and DF).Single groups are represented with different colors (Fig. 5).Figure 5a presents the relations of thickness vs. displacement,thickness vs. length and displacement vs. length. The cumulativefrequency distributions of the three aforementioned dimensionalparameters shown in Figure 5b are best fitted by negative powerlaw (Mandelbrot, 1983):
Nð�SÞ ¼ aS�D (1)
where N is the number of features having a size greater than orequal to S (e.g. the fault length), a is a measurement of the samplesize, and the power law exponent D represents the slope of the bestfit line, which some authors interpreted as the fractal dimension(Childs et al., 1990).
The data shown in Figure 5b nicely describe the evolving growthprocess of shear structures within the porous carbonate grain-stones: from single compactive shear bands, to zones of compactiveshear bands and, eventually, to well-developed faults (Tondi et al.,2012). Tondi et al. (2012) demonstrated that the slope of the powerlaw distributions of the dimensional parameters is very similar forCSB and ZB but varies significantly in DF, because of the presence ofdiscrete slip surfaces. The authors claimed that the switch fromzones of bands to well-developed faults occurs at about 10 cm ofthickness, 10 cm of displacement and 8 m of length. Indeed theaforementioned values, can be treated as the threshold values forthe transition from banding to slip surfaces and cataclasis and,consequently the final stage of fault development.
3.4. Up-scaling and elaboration of structural and permeability data
One of the critical issues in fluid flow modeling and in theequivalent porous medium description of a fractured/faulted sys-tem is the choice of the cell size that is needed for the discretizationof the numerical model. A small cell size may allow describing withaccuracy the geologic and structural characteristics of the reservoir/aquifer but it will require a long computation time during solutionof the flow equations. On the other hand, a large cell size will keep
Please cite this article in press as: Antonellini, M., et al., Fluid flow numeriMarine and Petroleum Geology (2013), http://dx.doi.org/10.1016/j.marpe
down the computation time but it will strongly limit the structuraland lithologic detail that may be implemented in the reservoir/aquifer model as well as the possibility of describing the small-scaleflow field. In a flow model, the hydraulic properties of the rock aredefined at each cell (or node), and include the permeability tensor kand the effective porosity of the rock ne. The cell size, in this work,has been kept small (0.2 m) to allow for a good description of thereservoir/aquifer structural characteristics. The zones I, II and IIIpertaining to the structures studied in outcrops have a thicknessthat ranges from one mm to a few centimeters. The portable mini-permeameter can sample a small volume of rock (1e2 cm3), and themeasured permeability values are representative only for such asmall volume. It is therefore important to up-scale the permeabilitymeasured in the field to the cell size of the volume. A proceduresimilar to that presented by Antonellini and Aydin (1994, 1995) andFossen and Bale (2007) has been used in this paper.
The first step in the up-scaling procedure and construction ofthe equivalent porous medium is to obtain the permeabilitymeasured normal (kr_ndb) and parallel (kr_pdb) to the CSB, ZB and DFpertaining to a given set r from the field permeameter. This can bedone by performing permeability measurements within structuralfeatures not containing any lens of host rock. The following step isto compute the up-scaled permeability of the cell in the directionnormal (kr_ncell) and parallel (kr_pcell) to the aforementioned fea-tures. The up-scaled permeability will depend on the thickness(Tr_db) and the number (Nr_db) of CSB in the cell and the perme-ability of the matrix (km), so that
kr_ncell ¼ dcellTr_dbNr_db
kr_ndbþ�dcell�Tr_dbNr_db
�km
(2)
and
kr_pcell ¼Nr_dbTr_dbkr_pdb þ
�dcell � Nr_dbTr_db
�km
dcell(3)
where dcell is the width of the cell.If the zone of compactive shear bands is larger than the cell,
Nr_db can be computed by multiplying the density of compactiveshear bands in the zone (Dr zdb) for dcell.
The permeability tensor for a zone of compactive shear bandsðk0zdb
ij Þ in the local reference system (where x0 is the plunge line, y0
is the strike line, and z0 is the line normal to the plane of thecompactive shear bands) and within a single cell of the model isgiven by
k0zdbij ¼
24kr_pcell 0 0
0 kr_pcell 00 0 kr_ncell
35 (4)
This matrix needs to be rotated from the local reference systemof the fault to the reference system of the numerical model that isusually set up in geographic UTM coordinates: the x-axis is for theeastings, the y-axis is for the northings, and the z-axis is for thevertical direction. If the orientation of the compactive shear bandsplane has been taken according to the convention of the dip azi-muth (a) and plunge (f), the matrix of director cosines relating thetwo reference systems is
aij ¼24sin acos f cos acos f �sin f�cos a sin a 0
sin asin f cos asin f cos f
35 (5)
The permeability tensor for a ZB in the geographic referencesystem of the model (UTM) is, according to the transformation ofcoordinates relationship,
cal experiments of faulted porous carbonates, Northwest Sicily (Italy),tgeo.2013.12.003

M. Antonellini et al. / Marine and Petroleum Geology xxx (2013) 1e166
kzdbij ¼ aTijk
0zdbij aij (6)
where aTij is the transpose of the matrix of director cosines.As the formulation above may be complete for structures in
porous rocks just containing cataclastic material and no apparentdiagenetic zonation, it should be re-formulated for cases wherediagenesis affects differently the areas next to the shear structures.A form of the above equations for the studied carbonate rocksshould include the different diagenetic zones (I, II, and III) in a waythat a complete formulation for the up-scaled permeability in thecell would be:
kr_ncell ¼ dcellTrdbzone 1Nrdbzone 1
krndbzone 1þ Trdbzone 2Nrdbzone 2
krndbzone 2þ Trdbzone 3Nrdbzone 3
krndbzone 3
þ dcellðdcell�Trdbzone 1Nrdbzone 1�Trdbzone 2Nrdbzone 2�Trdbzone 3Nrdbzone 3Þ
km
(7)and
kr_pcell ¼Trdbzone 1Nrdbzone 1krpdbzone 1 þ Trdbzone 2Nrdbzone 2krpdbzone 2
dcellþ Trdbzone 3Nrdbzone 3krpdbzone 3
dcell
þ�dcell � Trdbzone 1Nrdbzone 1 � Trdbzone 2Nrdbzone 2 � Trdbzone 3Nrdbzone 3
�km
dcell(8)
Where Trdbzone 1, Trdbzone 2 and Trdbzone 3 are the thicknesses of thedifferent zones described by Tondi (2007).Nrdbzone 1, Nrdbzone 2, andNrdbzone 3 are the numbers of zones in the cell, krndbzone 1, krndbzone 2,and krndbzone 3 are the permeability normal and krpdbzone 1, krpdbzone 2,and krpdbzone 3 are the permeabilities parallel to the zones asmentioned above.
The permeability tensor for a ZB with associated diageneticzones ðk0zdbdiag
ij Þ in the local reference system and within a single cellof the model is given by
k0zdbdiagij ¼
24kr_pcell 0 0
0 kr_pcell 00 0 kr_ncell
35 (9)
The permeability tensor in the geographic reference system ofthe model (UTM) is according to the transformation of coordinatesrelationship
kzd bdiag
ij ¼ aTijk0zd bdiag
ij aij (10)
By using the properties of the tensors, we can add r permeabilitytensors (where r ¼ 1, 2, 3,...n) obtained from r ZB (with or withoutassociated slip surfaces) having different orientations and hydraulicattributes (thickness, opening of the slip surface, diagenetic zones,etc.) to obtain the total up-scaled permeability tensor of a singlecell.
kcellij ¼ kzd bdiagr¼1
ij þ kzd bdiagr¼2ij þ kzd bdiagr¼3
ij þ. (11)
This procedure allows to up-scale the permeability measuredwith the field permeameter to the cell of the numerical model inMODFLOW 2005. A few remarks need to be added. One of the mostdifficult parameters to measure in the field is the opening in
Please cite this article in press as: Antonellini, M., et al., Fluid flow numeriMarine and Petroleum Geology (2013), http://dx.doi.org/10.1016/j.marpe
between slip surfaces. In this work, we have assumed that the slipsurfaces permeability is included in the measurements made inzone I with the field permeameter. The permeability of the struc-tures has been measured in the different zones (zones I, II, and III)and implemented according to the following rules: (1) If the faultcontains a slip surface (DF), the permeability of the fault has beencomputed according to a harmonic mean of zones I and II for thedirection normal to the bands and an arithmetic mean of zones Iand II for the direction parallel to the fault. (2) If the shear structuredid not contain slip surfaces (CSB or ZB), the permeability of thestructure was computed according to a harmonic mean of zones IIand III for the direction normal to the bands and an arithmeticmean of zones II and III for the direction parallel to the bands.
3.5. DFN model construction
The DFN model was built using the Fracture Modeling modulewithin the commercial MOVE� software package from MidlandValley Exploration Ltd. Like many other commercial packages usedto generate DFN models, MOVE� is designed for tight rocks
(negligible matrix porosity) where porosity and permeability areprovided only by the fractures. The software assigns null values ofporosity to those portions of the volume that are not crosscut byany structure (i.e. the host rock). It then computes the porosity of agiven cell as the ratio of total fracture volume in a cell per cellvolume. The volume of an individual fracture polygon is equal to itssurface area multiplied by its aperture size. In the study rocks, bothhost rock porosity and permeability are not negligible. Thus we didnot apply a standard workflow to obtain a porosity/permeabilitymap but we defined a workaround, which provided us with thestochastic representation of the structures within the geo-cellularvolume.
A rectangular surface of the same size of the map shown inFigure 3a (45m easting and 32m northing) was generated and geo-referenced. The surface was then converted into a geo-cellularvolume with a thickness (height) of 1 m. Squared (map view)cells with 0.2 m side (total number 7.2 � 104) made up the geo-cellular volume. Two 0.5-m thick layers were present in the verti-cal dimension of the volume. The generated geo-cellular volumewas then populated with six different sets of structures: right-lateral DF, left-lateral DF, right-lateral ZB, left-lateral ZB, right-lateral CSB, and left-lateral CSB. Specific parameters wereassigned to each set of structures: intensity (P32), length, orienta-tion (dip azimuth, angle of dip, and Fisher K value), and aspect ratio(length over height). The P32 represents fracture area per unitvolume expressed in units per meter [m2/m3]. The Fisher K is astatistical parameter used to define if a data cloud is clustered ornot (Fisher et al., 1987). Some of these parameters were obtainedfrom literature: orientation-related information was taken fromTondi (2007; Fig. 1c), and the length of the structures was definedusing the power laws distributions shown in Figure 5b. The in-tensity (P32) we assigned to each set of structures was calculatedusing the workflow proposed by Golder Associates Ltd. (2009). The
cal experiments of faulted porous carbonates, Northwest Sicily (Italy),tgeo.2013.12.003

Figure 5. (a) Scaling properties and (b) cumulative frequency distributions for thickness, displacement, and length computed for single CSB (in blue), ZB (in red) and DF (in green).After Tondi et al. (2012). (For interpretation of the references to color in this figure legend, the reader is referred to the web version of this article.)
M. Antonellini et al. / Marine and Petroleum Geology xxx (2013) 1e16 7
workflow recommends to generate a scatter plot of P32 versus P10values, eventually the linear interpolation of the plot can be used toobtain P32 as a function of P10. In order to generate the aforemen-tioned scatter plot three preliminary (non-calibrated in terms ofintensity) DFN models were built using increasing P32 values. Theother parameters (i.e. orientation and length) of the modeledstructures were kept equal in all the DFN models. Then six pseudo-wells (scan lines oriented NEeSW and ENEeWSW) were drilledhorizontally through each model to compute the intersections withdifferent structures. The number of intersections subdivided by thelength of the wells gave a P10 value as output. Figure 6 shows thescatter plots of P32 versus P10. Every pseudo-well has three differentdata points for each fracture type (i.e. CSB in Fig. 6a, ZB in Fig. 6b,and DF in Fig. 6c). A linear intercept of the data points was calcu-lated to obtain a function in this form:
P32 ¼ mP10 þ c (12)
where m is the slope of the linear intercept and c the intersectionwith the ordinate axis.
Please cite this article in press as: Antonellini, M., et al., Fluid flow numeriMarine and Petroleum Geology (2013), http://dx.doi.org/10.1016/j.marpe
The following step was to calculate the P32 values representativeof the real intensity of structures in the study area. Digital scanlines, located in the same position of the six pseudo-wells, wereperformed on the study map to obtain the P10 values of CSB, ZB, andDF in the study map (Table 1). The computed P10 values weresubstituted in the Eq. (11) to obtain the P32 (Table 2), the arithmeticaverage of the calculated intensities was used to build the definitiveDFN model (Fig. 7). The generated surfaces (representing differentstructures) were converted into point clouds with a samplingdensity lower than 0.2 m (size of the cells). To imprint the positionof each structure on the volume, we assigned an attribute to eachpoint cloud according to the rules reported in Table 3. After thisoperation, if a cell was intersected by one or more structures theattribute would be associated to its coordinates. Cells with nullvalues represented the host rock. The cells intersected by differentstructures are shown in Figure 8.
The stochastic-generated fault network created in MOVE� wasimported into ModelMuse (Winston, 2009) via an ASCII text file.The ASCII file contains the spatial coordinates of each cell makingup the geo-cellular volume and the attributes of the intersectingstructures. Once the ASCII file has been imported in ModelMuse,
cal experiments of faulted porous carbonates, Northwest Sicily (Italy),tgeo.2013.12.003

Figure 6. Calibration scatter plot showing P32 as a function of P10 obtained for the three types of structures. (a) CSB; (b) ZB; and (c) DF. The equations of the linear interpolation havebeen used to calculate the P32 values used for the model.
Table 1Results of digital scan lines from the map in Figure 3a.
Structure Number
S1 S2 S3 S4 S5 S6
M. Antonellini et al. / Marine and Petroleum Geology xxx (2013) 1e168
the cells of MODFLOW 2005 were assigned the K’s derived from thenumber and type of structures intersecting the volume cells. Thepermeability values were then up-scaled to the cell size from thefield permeameter measurements (see Section 3.4).
CSB 6 1 4 2 3 3ZB 18 7 5 6 6 7DF 11 9 4 4 7 6Scan line length 48.5 50.5 37 32.5 42 17
P10 [n/m]CSB 0.1237 0.0198 0.1081 0.0615 0.0714 0.1764ZB 0.3711 0.1386 0.1351 0.1846 0.1429 0.4118DF 0.2268 0.1782 0.1081 0.1231 0.1666 0.3529
3.6. Deterministic field analogue model construction
The field map (Fig. 3a) of the strike-slip structures (CSB, ZB andDF) has been integrated with both density and permeability ofzones I, II, and III to construct a completely deterministic model. Ageo-referenced map of the outcrop has been created in ArcGis�.
Please cite this article in press as: Antonellini, M., et al., Fluid flow numerical experiments of faulted porous carbonates, Northwest Sicily (Italy),Marine and Petroleum Geology (2013), http://dx.doi.org/10.1016/j.marpetgeo.2013.12.003
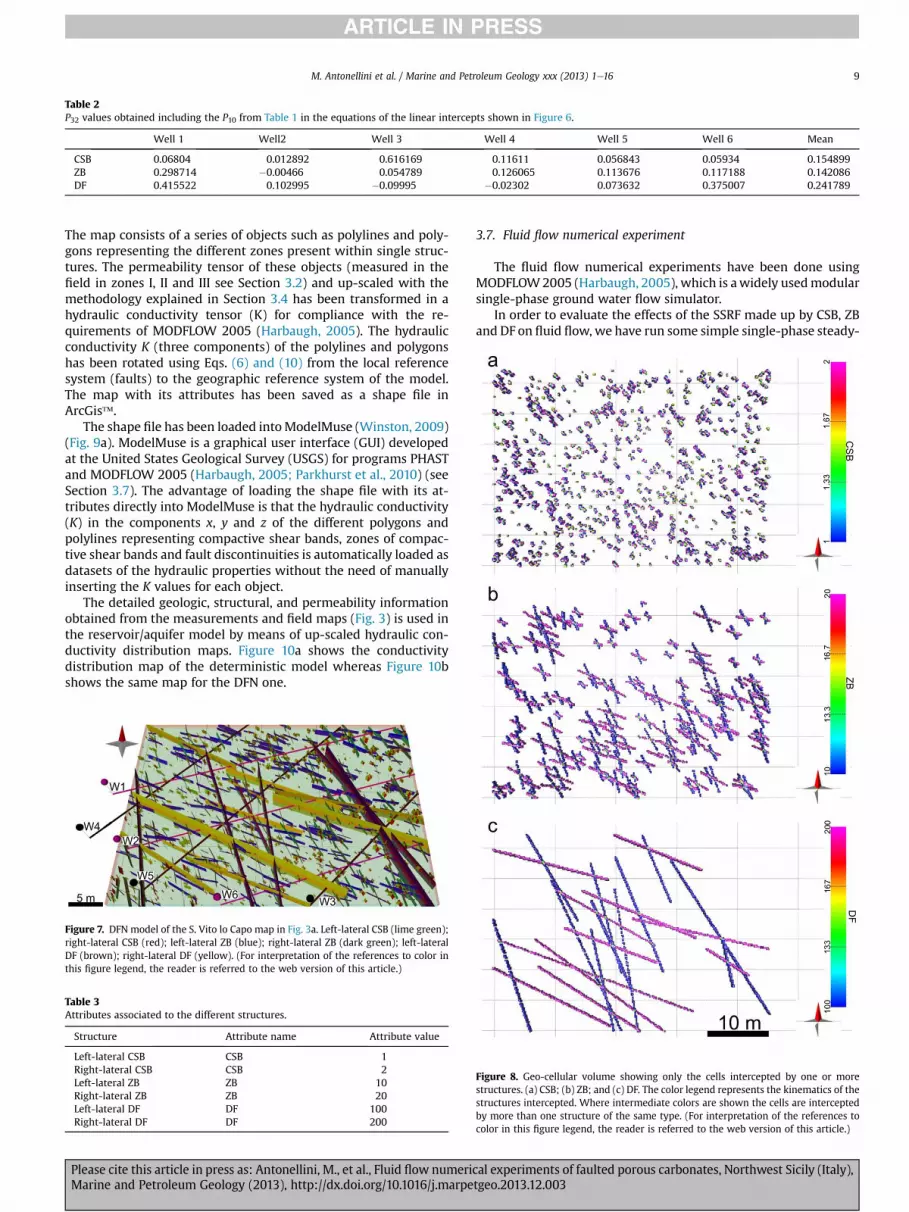
Table 2P32 values obtained including the P10 from Table 1 in the equations of the linear intercepts shown in Figure 6.
Well 1 Well2 Well 3 Well 4 Well 5 Well 6 Mean
CSB 0.06804 0.012892 0.616169 0.11611 0.056843 0.05934 0.154899ZB 0.298714 �0.00466 0.054789 0.126065 0.113676 0.117188 0.142086DF 0.415522 0.102995 �0.09995 �0.02302 0.073632 0.375007 0.241789
M. Antonellini et al. / Marine and Petroleum Geology xxx (2013) 1e16 9
The map consists of a series of objects such as polylines and poly-gons representing the different zones present within single struc-tures. The permeability tensor of these objects (measured in thefield in zones I, II and III see Section 3.2) and up-scaled with themethodology explained in Section 3.4 has been transformed in ahydraulic conductivity tensor (K) for compliance with the re-quirements of MODFLOW 2005 (Harbaugh, 2005). The hydraulicconductivity K (three components) of the polylines and polygonshas been rotated using Eqs. (6) and (10) from the local referencesystem (faults) to the geographic reference system of the model.The map with its attributes has been saved as a shape file inArcGis�.
The shape file has been loaded intoModelMuse (Winston, 2009)(Fig. 9a). ModelMuse is a graphical user interface (GUI) developedat the United States Geological Survey (USGS) for programs PHASTand MODFLOW 2005 (Harbaugh, 2005; Parkhurst et al., 2010) (seeSection 3.7). The advantage of loading the shape file with its at-tributes directly into ModelMuse is that the hydraulic conductivity(K) in the components x, y and z of the different polygons andpolylines representing compactive shear bands, zones of compac-tive shear bands and fault discontinuities is automatically loaded asdatasets of the hydraulic properties without the need of manuallyinserting the K values for each object.
The detailed geologic, structural, and permeability informationobtained from the measurements and field maps (Fig. 3) is used inthe reservoir/aquifer model by means of up-scaled hydraulic con-ductivity distribution maps. Figure 10a shows the conductivitydistribution map of the deterministic model whereas Figure 10bshows the same map for the DFN one.
Figure 7. DFN model of the S. Vito lo Capo map in Fig. 3a. Left-lateral CSB (lime green);right-lateral CSB (red); left-lateral ZB (blue); right-lateral ZB (dark green); left-lateralDF (brown); right-lateral DF (yellow). (For interpretation of the references to color inthis figure legend, the reader is referred to the web version of this article.)
Table 3Attributes associated to the different structures.
Structure Attribute name Attribute value
Left-lateral CSB CSB 1Right-lateral CSB CSB 2Left-lateral ZB ZB 10Right-lateral ZB ZB 20Left-lateral DF DF 100Right-lateral DF DF 200
Please cite this article in press as: Antonellini, M., et al., Fluid flow numeriMarine and Petroleum Geology (2013), http://dx.doi.org/10.1016/j.marpe
3.7. Fluid flow numerical experiment
The fluid flow numerical experiments have been done usingMODFLOW2005 (Harbaugh, 2005), which is awidely usedmodularsingle-phase ground water flow simulator.
In order to evaluate the effects of the SSRF made up by CSB, ZBand DF on fluid flow, we have run some simple single-phase steady-
Figure 8. Geo-cellular volume showing only the cells intercepted by one or morestructures. (a) CSB; (b) ZB; and (c) DF. The color legend represents the kinematics of thestructures intercepted. Where intermediate colors are shown the cells are interceptedby more than one structure of the same type. (For interpretation of the references tocolor in this figure legend, the reader is referred to the web version of this article.)
cal experiments of faulted porous carbonates, Northwest Sicily (Italy),tgeo.2013.12.003

Figure 9. Deterministic model. (a) Shape file with the location of the wells and of the injector-producer pairs used to compute the draw-down during production of geofluids. (b)Three-dimensional hydraulic conductivity distribution in the deterministic model of the reservoir/aquifer at San Vito Lo Capo; aquifer thickness is 1 m. Rulers are in meters.
M. Antonellini et al. / Marine and Petroleum Geology xxx (2013) 1e1610
state numerical experiments that have also been useful to comparethe fluid flow model obtained from the deterministic representa-tion of the structures observed in the field with the fluid flowmodel obtained from the stochastic representation of the struc-tures in the same outcrop. Given that the strike-slip shear
Figure 10. Three-component hydraulic conductivity representation (m/d) by means of contoZB in the DFN model with respect to the deterministic model.
Please cite this article in press as: Antonellini, M., et al., Fluid flow numeriMarine and Petroleum Geology (2013), http://dx.doi.org/10.1016/j.marpe
structures in the high porosity carbonate rocks described in thiswork are SSRF and may be of special concern during the phase ofproduction of a reservoir/aquifer (Manzocchi et al., 2008), we havedevised two classes of experiments. In the first class of experimentssteady-state draw-down from a production well is simulated
ur lines in the deterministic (a) and DFN (b) model of San Vito Lo Capo. Note the thinner
cal experiments of faulted porous carbonates, Northwest Sicily (Italy),tgeo.2013.12.003

M. Antonellini et al. / Marine and Petroleum Geology xxx (2013) 1e16 11
(Fig. 11aeb and 12), in the second class of experiments the flowfield and the draw-down resulting from a pair of injector-producerwells has been examined (Fig.13). This latter is a representation of atypical Enhanced Oil Recovery technique. The boundary conditionsare fixed at a constant head along the borders of the model (headequal to 10 m) and steady injection (Q ¼ 10 m3/d) and production(Q ¼ �20 m3/d) rates are imposed at the wells within the model(Figs. 12 and 13). The thickness of the layer containing the faults hasbeen set to 1 m and two impermeable layers have been imposed atthe top and at the bottom of the model to simulate a confinedreservoir/aquifer. The locations of the wells used in the differentnumerical experiments are shown in Figures 9a and 14a. In allclasses of experiments a reference state (Figs. 11a, 12a and 13a) isgiven inwhich no structures are present and the draw-down occursin an homogenous porous medium with the hydraulic character-istics of the un-deformed carbonate rock (K matrix). In single welldraw-down and in the injector-producer pair experiments allboundary conditions are the same and only the well position isvaried within the model.
Figure 11. Draw-down (h0� h) during production of a well (Q is the flow rate in m3/day). h0 is initial head (or pressure); h is the head (or pressure) at steady-state con-ditions during pumping. (a) Draw-down for a reservoir/aquifer without compactiveshear bands (CSB). (b) Draw-down for a reservoir/aquifer with CSB.
Please cite this article in press as: Antonellini, M., et al., Fluid flow numeriMarine and Petroleum Geology (2013), http://dx.doi.org/10.1016/j.marpe
4. Results and discussion
4.1. Permeability
The air permeability values obtained with the field per-meameter for the outcrop of San Vito Lo Capo at the positionsshown in Figure 3a and b are summarized in Figure 4. Thepermeability difference between the host rock and the zones IeII,and III associated to the single structures is in the order of 3e4orders of magnitude. The 33 air permeability measurements madein the host rock range from 0.18 to 87.9 Darcy with a 2.67 Darcyharmonic mean. The 12 air permeability measurements made inzone III of the faults (in a direction normal to the fault plane) rangefrom 0.033 to 0.803 Darcy with a 0.1 Darcy harmonic mean. In thesame zone, the air permeability measurements carried out parallelto the fault plane range from 0.053 to 0.104 Darcy with a0.087 Darcy harmonic mean (0.225 Darcy arithmetic mean). The 11parallel to the fault plane air permeability measurements of zonesIeII show values ranging from 0.024 to 1.863 Darcy, with a0.091 Darcy harmonic mean (1.07 Darcy arithmetic mean). Thehydraulic conductivity difference drops down to 1e2 orders ofmagnitude (Fig. 10) after up-scaling to a cell size of 0.2 m. Thereduction in permeability measured from the host rock to the CSBand ZB is less pronounced (one order of magnitude) than whatmeasured in deformation bands within porous carbonate by Rathet al. (2011) or in siliciclastic rocks (Antonellini and Aydin, 1994,1995; Fossen and Bale, 2007).
4.2. Numerical experiments
A summary for the single-phase steady-state numerical exper-iments performed is given in Table 4 for the deterministic modeland in Table 5 for the DFN model; these tables allow for easycomparison of the well draw-downs in the different experimentalsetups. In the deterministic models, the results of the single wellexperiments show that the draw-down varies from 10.66 m (in theun-deformed reference state) to 38.43 m (Table 4 and Fig. 12). Thedraw-down in the deformed grainstone with shear structures canincrease up to a factor of 4 with respect to the un-deformed case;furthermore the draw-down cone in the deformed grainstone canbe rather anisotropic (Figs. 11b and 12c) with respect to the un-deformed situation (Figs. 11a and 12a). In the injector-producerpair experiment, the draw-down varies from �4.37 (in the un-deformed reference state) to �7.18 at the injector (negative signis for a rise in hydraulic head) and from 8.87 (in the un-deformedreference state) to 14.4 for the producer well. The variation indraw-down is obtained by swapping the position of the producerand of the injector (Table 4 and Fig. 13). The largest absolute draw-down values (16.02 and 38.43 m) are observed where the well isplaced within a DF or in a small, shear structures-boundedcompartment (Table 4 and Fig. 12cef). In the DFN models, the re-sults of the single well experiments show that the draw-downvaries from 10.01 m (in the un-deformed reference state) to14.15 m (Table 5 and Fig. 15). In the injector-producer pair experi-ment, the draw-down varies from �4.37 (in the un-deformedreference state) to �4.92 m at the injector (negative sign is for arise in hydraulic head) and from 9.41 (in the un-deformed referencestate) to 9.91 m for the producer well (Table 5).
In the models with the deterministic description of the reser-voir/aquifer (Fig. 12), the draw-down may increase in a compart-ment among shear structures 15e20% (Fig. 12e and f) and in a ZB orDF up to 400% (Fig. 12c and d) with respect to the reference (un-deformed host rock; Fig. 12a). In the fluid flowmodels based on thestochastic DFN description of the reservoir/aquifer the results aresimilar to what obtained in the deterministic fluid flow models
cal experiments of faulted porous carbonates, Northwest Sicily (Italy),tgeo.2013.12.003

Figure 12. Single well steady-state draw-down numerical experiments with MODFLOW 2005 on a model with constant head (20 m) on the boundaries. (a) Draw-down shown bythe equipotential lines around a single producer well (�20 m3/day) in homogenous grainstone. (b) Single producer well draw-down in the model of San Vito Lo Capo containing thestrike-slip faults. Note the refraction of the equipotential lines at the fault lines. (c) Single producer well draw-down where the well is located in a ZB. Note the strong reduction inarea of the cone with respect to (a) and (b). (d) Same situation as in (c) but showing the Kx hydraulic conductivities (legend in Fig. 9b). (e) Single producer well draw-down wherethe well is located at a fault junction (DF and ZB). (f) Single producer well draw-downwhere the well is located in a compartment in between zones of compactive shear bands (ZB).
M. Antonellini et al. / Marine and Petroleum Geology xxx (2013) 1e1612
with the exception for the draw-down of the wells located withinthe structures (see comparison in Table 6 and Fig. 14). The averagedraw-down from a shear structure in a DFNmodel is more than 50%less than in a deterministic model (Table 6). The structures (andspecifically the ZB and DF) in the DFN model (Fig. 14) tend to bethinner than in the deterministic model (Fig. 9). This is due to theinability of the DFN model to mimic the phenomenon of strainlocalization causing the development of ZB.
4.3. Up-scaling
Table 7 shows the results of up-scaling the hydraulic conduc-tivity to a cell size including the whole outcrop (45 � 32 � 1 m);this has been done by using the program MODPATH (Pollock,1994) and a lagrangian approach based on tracking fluid particlevelocities and inverting for hydraulic conductivities under a uni-form gradient in the x, y, and z directions both in the deterministicand DFN models. It is interesting to note that the effect of the SSRFon Kx and Ky within this large block is small (Table 7). The Kx
Please cite this article in press as: Antonellini, M., et al., Fluid flow numeriMarine and Petroleum Geology (2013), http://dx.doi.org/10.1016/j.marpe
computed from the deterministic model decreases to 79% and theKy to 93% of the K in the un-deformed matrix. The Kx computedfrom the DFN model decreases to 90% and the Ky to 89% of the K inthe un-deformed matrix. The Kz is basically unaffected by the SSRFin both models at this scale, because the faults are vertical. It isalso interesting to note that the up-scaled hydraulic conductivitiesobtained from the deterministic and the DFN models are similar;they differ at most by 15%. In this situation, when up-scaling to alarge cell size for fluid flow simulation, the use of a DFN-derivedup-scaled hydraulic conductivity is as good as the deterministicanalogue-derived hydraulic conductivity. At this scale, however,the effect of the SSRF is almost negligible and this is in accordancewith what reported in the literature. Walsh et al. (1998) examinedthe effects of SSRF on the bulk permeabilities of reservoir se-quences at a 3 km � 3 km scale and concluded that the signif-icance of these structures on fluid flow is strongly dependent onthe fault transmissivities that need to be very low to significantlyaffect the hydraulic properties of the reservoir. These conclusions,in view of our experiments, seem to apply to large-scale fluid flow
cal experiments of faulted porous carbonates, Northwest Sicily (Italy),tgeo.2013.12.003

Figure 13. Injector-producer pair steady-state draw-down numerical experimentswith MODFLOW 2005 on a model with constant head (20 m) on the boundaries. (a)Draw-down shown by the equipotential lines for an Injector-producer pair in ho-mogenous grainstone. Producer (�20 m3/day) on the left and injector (10 m3/day).Flow lines from the injector to the producer are also indicated. (b) Same setup as in (a)but for the model of San Vito Lo Capo containing the strike-slip faults. Note that theproducer is in a zone of deformation bands and the injector is in un-deformed hostrock. (c) Same situation as in (b) but with a swap of the positions of injector andproducer.
M. Antonellini et al. / Marine and Petroleum Geology xxx (2013) 1e16 13
as we showed by up-scaling the hydraulic conductivity to the largecell size but not to the local flow in proximity to boreholes.Rotevatn and Fossen (2011) simulated the effects of low perme-ability SSRF in a siliciclastic reservoir analogue using a10 m � 10 m � 5 m cell size and they conclude that, during pro-duction, low permeability faults such as the compactive shearbands may cause pressure compartmentalization and may
Please cite this article in press as: Antonellini, M., et al., Fluid flow numeriMarine and Petroleum Geology (2013), http://dx.doi.org/10.1016/j.marpe
increase flow tortuosity. This result is similar to what obtained byMatthäi et al. (1998) for seismically detectable faults in highporosity sandstones where faults are associated to thick zones ofcompactive shear bands but they cannot be extended to SSRF ingeneral. Fossen and Bale (2007), on the other hand, show somefield observations and mathematical calculations suggesting thatthe effect of compactive shear bands during reservoir productionis small or negligible in most cases and fluid flow is only gentlyaffected by compactive shear bands. The contradictory resultsprobably stem from the scale of the problem that is tackled inthese different studies.
5. Conclusions
Sub-seismic resolution strike-slip shear structures in Pleisto-cene porous grainstones of Northwest Sicily, have been recognizedas single compactive shear bands (CSB), zones of compactive shearbands (ZB), and faults with discrete slip surfaces and cataclasticmaterial (DF). The permeability of these structures (0.01e1 Darcy)is less than the permeability of the host rock (2e18 Darcy). Inparticular, the ZB permeability measured normal and parallel totheir planes ranges from 0.1 to 0.37 Darcies, while the DF perme-ability measured parallel to their planes ranges from 0.09 to1.07 Darcies. The aforementioned structures, hence, have the po-tential to pronouncedly affect fluid flow in porous carbonate rocksas they have been demonstrated to do in siliciclastic rocks.
A new methodology aimed at incorporating and up-scaling thepermeability reduction effects of CSB, ZB, and DF structural ele-ments on fluid flow in a standard open source numerical simulationsoftware has been developed in this study. This methodology isdifferent from the procedure commonly used in most commercialsoftware packages, which deal with open fractures and theirpermeability enhancing effects on fluid flow and neglect the flowbuffering effects of cataclastic shear structures.
The large draw-downs (up to 38 m; four times as much as in theun-deformed reference state) observed during the numerical ex-periments (especially in correspondence of thick ZB) show that, atthe scale of the wellbore (a few tens of cm) and during production,SSRF made up of CSB, ZB and DF have an influence on the efficientdrainage and sweep of the reservoir. Specifically, these structuralelements may cause water up-coning, and diminish the recoveryrate. To the best of our knowledge, for the first time in deformedporous carbonate rocks, our results show that well placement (un-deformed host rock, shear structures or structure-bounded com-partments) is critical for well draw-down control.
Comparison of the draw-down numerical experiments in theDFN and the deterministic models show that results are similarwith the exception of wells located within the ZB. The wells locatedin areas of strain localization with thick ZB and DF, in fact, have adraw-down that is underestimated, up to an order of magnitude, bythe DFN with respect to the deterministic model. This needs to bekept in mind where dealing with complex structural settings,because in areas of intense strain localization, due to fault prox-imity or curvature, a flow model deriving from a DFN reservoir/aquifer description might not well represent the “drilling risk” (justthe bad lack to put a well right into a thick zone of bands). SSRFassociatedwith thick ZB and DF in structurally complex areas mightrepresent a drilling risk, because they can enhance draw-downduring production and EOR activities. In other instances, howev-er, the use of the DFN model, is an acceptable representation of theheterogeneities induced by SSRF in a reservoir.
The single-phase fluid flow experiments that have been per-formed may not capture well the effects that the type of SSRFstudied have on multiphase flow during production of an oil/gasreservoir, because of the capillary effects that arise in the cataclastic
cal experiments of faulted porous carbonates, Northwest Sicily (Italy),tgeo.2013.12.003

Figure 14. Stochastic DFN model. (a) Hydraulic conductivity representation in the x direction (Kx) obtained by importing the DFN model in MODFLOW 2005 showing the locationsof the wells and of the injector-producer pairs used to compute the draw-down during production of geofluids. (b) Three-dimensional hydraulic conductivity distribution (Kx) in theDFN model of the reservoir/aquifer at San Vito Lo Capo; aquifer thickness is 1 m. Rulers are in meters.
Table 5
M. Antonellini et al. / Marine and Petroleum Geology xxx (2013) 1e1614
material of the shear structures. These phenomena may result infurther decrease of oil relative permeability during production andEOR.
The up-scaling procedure and the choice of the cell size arecritical for the fluid flow numerical experiments and for correctlysolving the problem at hand. In this study, we used a very fine gridand cell size to tackle a small-scale fluid flow problem and showthat CSB, ZB, and DFmay contribute substantially either to boreholedrilling risk or to the success of EOR operations. Fluid flow at aregional scale, however, modeled with large cell sizes, is only
Table 4Draw-down analysis e deterministic model.
Draw-down analysis e deterministic model
Single wellposition
x (m) y (m) h (m) Draw-downh0� h (m)
Q, m3/s Notes
0 reference 22.5 �15 �0.01 10.01 �20 Homogenousporous medium
0 22.5 �15 �0.66 10.66 �20 Porous mediumwith CSB
1 38 �17.25 �0.45 10.45 �202 2.75 �11.8 �0.87 10.87 �203 25.25 �9 �0.39 10.39 �204 16 �23 �0.46 10.46 �205 7.1 �25 �28.43 38.43 �20 In ZB6 �8 �6.02 �6.02 16.02 �20 In ZB7 22.5 �15 �1.08 11.08 �20 In compartmentInjector
A reference40 �15 14.37 �4.37 10 Homogenous
porous mediumProducer
B reference5 �15 1.13 8.87 �20 Homogenous
porous mediumInjector B 5 �15 17.18 �7.18 10 In ZBProducer A 40 �15 0.96 9.04 �20Injector A 40 �15 14.48 �4.48 10Producer B 5 �15 �4.4 14.4 �20 In ZB
Please cite this article in press as: Antonellini, M., et al., Fluid flow numeriMarine and Petroleum Geology (2013), http://dx.doi.org/10.1016/j.marpe
marginally affected by the SSRF as recognized by previous authorsand also shown in this work. In this latter case, in fact, heteroge-neities deriving from diagenetic, stratigraphic, and sedimentaryprocesses may generate contrasts in permeabilities larger thanseven orders ofmagnitude. In any case, the effects of SSRF should beconsidered for more realistic dynamic reservoir modeling duringappraisal.
Draw-down analysis e DFN model.
Draw-down analysis e DFN model
Single wellposition
x (m) y (m) h (m) Draw-downh0� h (m)
Q, m3/s Notes
0 homogenousmedium
22.5 �16 �0.01 10.01 �20 Homogenousporous medium
0 22.5 �16 �1.1 11.1 �20 Porous mediumwith CSB
1 38 �17.25 �1.18 11.18 �20 Porous mediumwith CSB
2 30.94 �10.74 0.16 9.84 �20 Porous mediumwith CSB
3 25.25 �9 0.28 9.72 �20 Porous mediumwith CSB
4 16 �23 �2.8 12.8 �20 In ZB5 37.69 �20.48 �2.36 12.36 �20 In ZB6 20.10 �20.88 �1.77 11.77 �20 In compartment7 20.44 �20.74 �2.20 12.2 �20 In ZB8 18.95 �14 �4.15 14.15 �20 In ZBInjector
A reference40 �16 14.37 �4.37 10 Homogenous
porous mediumProducer
B reference5 �16 1.13 8.87 �20 Homogenous
porous mediumInjector B 5 �16 14.92 �4.92 10Producer A 40 �16 0.59 9.41 �20Injector A 40 �16 14.67 �4.67 10Producer B 5 �16 0.09 9.91 �20
cal experiments of faulted porous carbonates, Northwest Sicily (Italy),tgeo.2013.12.003

Table 6Draw-down comparison in the two models.
Single well draw-down (m)
Deterministicmodel
DFNmodel
Location Difference %
Reference Well 0(central)
10.01 10.01 Homogenousporous medium
0.0
Well 0 (central) 10.66 11.1 Porous mediumwith CSB
�4.1
Well 1 10.45 11.18 Porous mediumwith CSB
�7.0
Well 3 10.39 9.72 Porous mediumwith CSB
6.4
Well 4 10.46 12.8 In ZB �22.4Average draw-down 10.57 10.46 Porous medium
with CSB1.0
Average draw-down 27.23 12.88 In ZB 52.7Average draw-down 11.08 11.77 In compartment �6.2
Table 7K up-scaled at map size (45 � 32 � 1 m).
K (Host) 2.02 m/dne 0.25
D %Kx (DFN) 1.82 m/d 89.96Ky (DFN) 1.80 m/d 89.25Kz (DFN) 1.99 m/d 98.02
Kx (map) 1.59 m/d 78.74Ky (map) 1.87 m/d 92.70Kz (map) 1.99 m/d 98.02
Figure 15. Single producer well draw-down in the DFN model of San Vito Lo Capocontaining the strike-slip faults. Draw-down shown by the equipotential lines around asingle producer well (�20 m3/day). Kx distribution on the background. Note thesmaller refraction of the equipotential lines at the shear structure traces with respectto Fig. 12.
M. Antonellini et al. / Marine and Petroleum Geology xxx (2013) 1e16 15
Acknowledgments
Funding from PRIN 2009 of the Italian Ministry of Research toEmanuele Tondi and the Reservoir Characterization Project (RCP,www.rechproject.com) is acknowledged; we thank Midland ValleyExploration Ltd. for providing MOVE� academic license, FabrizioStorti and Fabrizio Balsamo for lending the TinyPerm II Portable AirPermeameter. Two reviews of this paper one by Luca Micarelli and
Please cite this article in press as: Antonellini, M., et al., Fluid flow numeriMarine and Petroleum Geology (2013), http://dx.doi.org/10.1016/j.marpe
one by an anonymous have greatly improved the quality of themanuscript.
References
Abate, B., Di Maggio, C., Incandela, A., Renda, P., 1993. Carta Geologica dei Monti diCapo San Vito. Department of Geology and Geodesy, University of Palermo,Italy.
Abate, B., Incandela, A., Renda, P., 1997. Carta Geologica delle Isole di Favignana eLevanzo. Department of Geology, University of Palermo.
Agosta, F., Alessandroni, M., Tondi, E., Giorgioni, M., 2010. From fractures to flow: afield-based quantitative analysis of an outcropping carbonate reservoir. Tecto-nophysics 490, 197e213.
Agosta, F., Ruano, P., Rustichelli, A., Tondi, E., Galindo-Zaldívar, J., Sanz deGaldeano, C., 2012. Inner structure and deformation mechanisms of normalfaults in conglomerates and carbonate grainstones (Granada Basin, BeticCordillera, Spain): inferences on fault permeability. J. Struct. Geol. 45, 4e20.
Ahmadov, R.S., Aydin, A., Karimi-Fard,M., Durlofsky, L.J., 2007. Permeability upscalingof fault zones in the Aztec Sandstone, Valley of Fire State Park, Nevada, with afocus on slip surfaces and slip bands. Hydrogeol. J. 15, 1239e1250.
Ambrose, W.A., Lakshminarasimhan, S., Holtz, M.H., Nunez-Lopez, V., Hovorka, S.D.,Duncan, I., 2008. Geologic factors controlling CO2 storage capacity andpermanence: case studies based on experience with heterogeneity in oil andgas reservoirs applied to CO2 storage. Environ. Geol. 54, 1619e1633.
Antonellini, M.A., Aydin, A., 1994. Effect of faulting on fluid flow in porous sand-stones: petrophysical properties. AAPG Bull. 78, 355e377.
Antonellini, M.A., Aydin, A., 1995. Effect of faulting on fluid flow in porous sand-stones: geometry and spatial distribution. AAPG Bull. 79, 642e671.
Antonellini, M., Aydin, A., Orr, L., 1999. Outcrop-aided characterization of a faultedhydrocarbon reservoir: Arroyo Grande Oil Field, California, USA. In:Haneberg, W.C., Mozley, P.S., Moore, J.C., Goodwin, L.B. (Eds.), Faults and Sub-surface Fluid Flow in the Shallow Crust, Geophysical Monograph Series, vol. 113.AGU, Washington, D. C., pp. 7e26.
Astratti, D., Aarre,V., Vejbaek,O.V.,White,G., 2012.Detailed seismicmapping and time-lapse analysis of a fault network in the Chalk. Search Discov. 1e4. Article #120035.
Aydin, A., 1978. Small faults formed as deformation bands in sandstone. Pure Appl.Geophys. 116, 913e930.
Aydin, A., Johnson, A.M., 1978. Development of faults as zones of deformation bandsand as slip surfaces in sandstone. Pure Appl. Geophys. 116, 931e942.
Aydin, A., Borja, R.I., Eichhubl, P., 2006. Geological and mathematical framework forfailure modes in granular rock. J. Struct. Geol. 28, 83e98.
Ballas, G., Soliva, R., Sizun, J.P., Fossen, H., Benedicto, A., Skurtveit, E., 2013. Shear-enhanced compaction bands formed at shallow burial conditions; implicationsfor fluid flow (Provence, France). J. Struct. Geol. 47, 3e15.
Balsamo, F., Storti, F., Salvini, F., Silva, A.T., Lima, C.C., 2010. Structural and pet-rophysical evolution of extensional fault zones in low-porosity, poorly lithi-fied sandstones of the Barreiras Formation, NE Brazil. J. Struct. Geol. 32,1806e1826.
Cello, G., Gambini, R., Mazzoli, S., Read, A., Tondi, E., Zucconi, V., 2000. Fault zonecharacteristics and scaling properties of the Val d’Agri Fault System (SouthernApennines, Italy). J. Geodyn. 29, 293e307.
Cello, G., Tondi, E., Micarelli, L., Invernizzi, C., 2001. Fault zone fabrics and geofluidproperties as indicators of rock deformation modes. J. Geodyn. 32, 543e565.
Cello, G., Tondi, E., Van Dijk, J.P., Mattioni, L., Micarelli, L., Pinti, S., 2003. Geometry,kinematics and scaling properties of faults and fractures as tools for modelinggeofluid reservoirs: examples from the Apennines, Italy. In: Geological Societyof London, Special Publications, vol. 212, pp. 7e22.
Celico, F., Petrella, E., Celico, P., 2006. Hydrogeological behavior of some fault zonesin a carbonate aquifer of Southern Italy: an experimentally based model. TerraNova 18, 308e313.
Childs, C., Walsh, J.J., Watterson, J., 1990. A method for estimation of the density offault displacements below the limits of seismic resolution in reservoir forma-tions. In: Buller, A.T., Berg, E., Hjelmeland, O., Kleppe, J., Torsæter, O., Aasen, J.O.(Eds.), North Sea Oil and Gas Reservoirs II. Graham & Trotman, London, pp. 193e203.
Cilona, A., Baud, P., Tondi, E., Agosta, F., Vinciguerra, S., Rustichelli, A., Spiers, C.J.,2012. Deformation bands in porous carbonate grainstones: field and laboratoryobservations. J. Struct. Geol. 45, 137e157.
Damsleth, E., Sangolt, V., Aamodt, G., 1998. Subseismic faults can seriously affectfluid flow in the Njord field off western Norway e a stochastic fault modelingcase study. SPE Paper 49024. In: Society of Petroleum Engineers Annual Tech-nical Conference and Exhibition, New Orleans, p. 10.
Esposito, R.A., Pashin, J.C., Hills, D.J., Walsh, P.M., 2010. Geologic assessment andinjection design for a pilot CO2-enhanced oil recovery and sequestrationdemonstration in a heterogeneous oil reservoir: Citronelle Field, Alabama, USA.Environ. Earth. Sci. 60, 431e444.
Fachri,M., Rotevatn,A., Tveranger, J., 2013. Fluidflowin relayzonesrevisited: towards animproved representation of small-scale structural heterogeneities in flow models.Mar. Petrol. Geol. 46, 144e164. http://dx.doi.org/10.1016/j.marpetgeo.2013.05.016.
Færseth, R.B., Johnsen, E., Sperrevik, S., 2007. Methodology for risking fault sealcapacity: implications of fault zone architecture. AAPG Bull. 91, 1231e1246.
Farran, H., Harris, J., Al Jabri, S., Jackson, R.R., Al Khayari, S., Thomas, T., 2005. Anintegrated approach for evaluating and characterising horizontal well inflow
cal experiments of faulted porous carbonates, Northwest Sicily (Italy),tgeo.2013.12.003

M. Antonellini et al. / Marine and Petroleum Geology xxx (2013) 1e1616
and productivity in heterogeneous carbonate reservoirs. In: Society of Petro-leum Engineers, International Petroleum Technology Conference, 21e23November 2005, Doha, Qatar, p. 23. http://dx.doi.org/10.2523/10492-MS.
Faulkner, D.R., Jackson, C.A.L., Lunn, R.J., Schlische, R.W., Shipton, Z.K.,Wibberley, C.A.J., Withjack, M.O., 2010. A review of recent developments con-cerning the structure, mechanics and fluid flow properties of fault zones.J. Struct. Geol. 32, 1557e1575.
Fisher, N.I., Lewis, T., Embleton, B.J.J., 1987. Statistical Analysis of Spherical Data.Cambridge University Press.
Flodin, E., Aydin, A., Durlofsky, L., Yeten, B., 2001. Representation of Fault ZonePermeability in Reservoir Flow Models. SPE Paper 71671. SPE, Houston, TX, USA.
Flodin, E., Durlofsky, L., Aydin, A., 2004. Upscaled models of flow and transport infaulted sandstone: boundary condition effects and explicit fracture modeling.Petrol. Geosci. 10, 173e181.
Fossen, H., Bale, A., 2007. Deformation bands and their influence on fluid flow.AAPG Bull. 91, 1685e1700.
Fossen, H., Schultz, R.A., Rundhovde, E., Rotevatn, A., Buckley, S.J., 2010. Fault linkageand graben stepovers in the Canyonlands (Utah) and the North Sea VikingGraben, with implications for hydrocarbon migration and accumulation. AAPGBull. 94, 597e613.
Fowles, J., Burley, S., 1994. Textural and permeability characteristics of faulted, highporosity sandstones. Mar. Petrol. Geol. 11, 608e623.
Giunta,G., Nigro, F.,Renda,P.,Giorgianni,A., 2000. TheSicilian-MaghrebidesTyrrhenianmargin: a neotectonic evolutionary model. Boll. Soc. Geol. Ital. 119, 553e565.
Giunta, G., Luzio, D., Tondi, E., De Luca, L., Giorgianni, A., D’Anna, G., Renda, P.,Cello, G., Nigro, F., Vitale, M., 2004. The Palermo (Sicily) seismic cluster ofSeptember 2002, in the seismotectonic framework of the Tyrrhenian Sea-Sicilyborder area. Ann. Geophys. 47 (6), 1755e1770.
Giunta, G., Luzio, D., Agosta, F., Calò, M., Di Trapani, F., Giorgianni, A., Oliveri, E.,Orioli, S., Perniciaro, M., Vitale, M., Chiodi, M., Adelfio, Giada, 2009. An inte-grated approach to investigate the seismotectonics of northern Sicily andsouthern Tyrrhenian. Tectonophysics 476, 13e21.
Golder Associates Ltd., 2009. Derivation of Basic Fracture Properties. Golder Asso-ciates Ltd., Portland, USA.
Haneberg, W.C., 1995. Steady state groundwater flow across idealized faults. WaterResour. Res. 31, 1815e1820.
Harbaugh, A.W., 2005. MODFLOW-2005, the U.S. Geological Survey ModularGround-water Model e The Ground-water Flow Process. U.S. Geological SurveyTechniques and Methods 6-A16, p. 253.
Hustoft, S., Mienert, J., Bunz, S., Nouze, H., 2007. High-resolution 3D-seismic dataindicate focussed fluid migration pathways above polygonal fault systems ofthe mid-Norwegian margin. Mar. Geol. 245, 89e106.
Jourde, H., Flodin, E., Aydin, A., Durlofsky, L., Wen, X., 2002. Computing permeabilityof fault zones in eolian sandstone from outcrop measurements. AAPG Bull. 86,1187e1200.
Kattenhorn, S.A., Pollard, D.D., 2001. Integrating 3-D seismic data, field analogs,and mechanical models in the analysis of segmented normal faults in theWytch Farm oil field, southern England, United Kingdom. AAPG Bull. 85,1183e1210.
Lohr, T., Krawczyk, C.M., Tanner, D.C., Samiee, R., Endres, H., Thierer, P.O., Oncken, O.,Trappe, H., Bachmann, R., Kukla, P.A., 2008. Prediction of subseismic faults andfractures: integration of three-dimensional seismic data, three-dimensionalretro deformation, and well data on an example of deformation around aninverted fault. AAPG Bull. 92, 473e485.
Lothe, A.E., Gabrielsen, R.H., Bjornevoll-Hagen, N., Larsen, B.T., 2002. An experi-mental study of the texture of deformation bands: effects on the porosity andpermeability of sandstones. Petrol. Geosci. 8, 195e207.
Maerten, L., Gillepsie, P., Pollard, D.D., 2002. Effect of local stress perturbation onsecondary fault development. J. Struct. Geol. 24, 145e153.
Maerten, L., Maerten, F., 2006. Chronologic modeling of faulted and fractured res-ervoirs using geomechanically based restoration: technique and industry ap-plications. AAPG Bull. 90, 1201e1226.
Maerten, L., Gillespie, P., Daniel, J.M., 2006. Three-dimensional geomechanicalmodeling for constraint of sub-seismic fault simulation. AAPGBull. 90,1337e1358.
Main, I.G., Kwon, O., Ngwenya, B.T., Elphick, S.C., 2000. Fault sealing duringdeformation-band growth in porous sandstone. Geology 28, 1131e1134.
Mandelbrot, B.B., 1983. The Fractal Geometry of Nature. W. H. Freeman, SanFrancisco.
Manzocchi, T., Walsh, J., Nell, P., Yielding, G., 1999. Fault transmissibility multipliersfor flow simulations models. Petrol. Geosci. 5, 53e63.
Manzocchi, T., Heath, A.E., Palananthakumar, B., Childs, C., Walsh, J.J., 2008. Faults inconventional flow simulation models: a consideration of representational as-sumptions and geological uncertainties. Petrol. Geosci. 14, 91e110.
Marrett, R., Allmendinger, R.W., 1992. Amount of extension on “small” faults: anexample from the Viking graben. Geology 20, 47e50.
Matthäi, S., Aydin, A., Pollard, D., Roberts, S., 1998. Numerical simulation of de-viations from radial drawdown in a faulted sandstone reservoir with joints andzones of deformation bands. In: Jones, G., Fisher, Q., Knipe, R. (Eds.), Faulting,Fault Sealing and Fluid Flow in Hydrocarbon Reservoirs, Geological Society ofLondon, Special Publication, vol. 147, pp. 157e191.
Micarelli, L., Benedicto, A., Wibberley, C.A.J., 2006. Structural evolution andpermeability of normal fault zones in highly porous carbonate rocks. J. Struct.Geol. 28, 1214e1227.
Morris, A.P., Ferrill, D.A., McGinnis, R.N., 2009. Mechanical stratigraphy and faultingin cretaceous carbonates. AAPG Bull. 93, 1459e1470.
Please cite this article in press as: Antonellini, M., et al., Fluid flow numeriMarine and Petroleum Geology (2013), http://dx.doi.org/10.1016/j.marpe
Morris, A.P., Smart, K.J., Ferrill, D.A., Reish, N.E., Cowell, P.F., 2012. Production-induced fault compartmentalization at Elk Hills field, California. AAPG Bull. 96,1001e1015.
Nigro, F., Renda, P., Arisco, G., 2000. Tettonica recente nella Sicilia nord-occidentalee nelle Isole Egadi. Boll. Soc. Geol. Ital 119, 307e319.
Nelson, R.A., 2001. Geological Analysis of Naturally Fractured Reservoirs. The GulfPublishing Company, Houston.
Ngwenya, B.T., Kwon, O., Elphick, S.C., Main, I.G., 2003. Permeability evolutionduring progressive development of deformation bands in porous sandstones.J. Geophys. Res. 108 (B7), 2343. http://dx.doi.org/10.1029/2002JB001854.
Parkhurst, D.L., Kipp, K.L., Charlton, S.R., 2010. PHAST Version 2 e A Program forSimulating Groundwater Flow, Solute Transport, and Multicomponent Geochem-ical Reactions. U.S. Geological Survey Techniques and Methods 6-A35, p. 235.
Pearce, M.A., Jones, R.R., Smith, S.A.F., McCaffrey, K.J.W., 2011. Quantification of foldcurvature and fracturing using terrestrial laser scanning. AAPGBull. 95, 771e794.
Penney, R., Moosa, R., Shahin, G., Hadhrami, F., Kok, A., Engen, G., van Ravesteijn, O.,Rawnsley, K., Kharusi, B., 2005. Steam injection in fractured carbonate reser-voirs: starting a new trend in EOR. In: International Petroleum TechnologyConference, 21e23 November 2005, Doha, Qatar. http://dx.doi.org/10.2523/10727-MS.
Pollock, D.W., 1994. User’s Guide for MODPATH/MODPATH-PLOT, Version 3: a Par-ticle Tracking Post-processing Package for MODFLOW, the U. S. GeologicalSurvey Finite-difference Ground-water Flow Model. U. S. Geological Survey.Open-File Report 94-464, 249 pp.
Putz-Perrier, M.W., Sanderson, D.J., 2010. Distribution of faults and extensional strainin fractured carbonates of the North Malta Graben. AAPG Bull. 94, 435e456.
Rath, A., Exner, U., Tschegg, C., Grasemann, B., Laner, R., Draganits, E., 2011. Diage-netic control of deformation mechanisms in deformation bands in a carbonategrainstone. AAPG Bull. 95, 1369e1381.
Rawling, G.C., Goodwin, L.B., Wilson, J.L., 2000. Internal architecture, permeabilitystructure, and hydrologic significance of contrasting fault-zone types. Geology29, 43e46.
Roberts, G.P., 2007. Fault orientation variations along the strike of active normalfault systems in Italy and Greece: implications for predicting the orienta-tions of subseismic-resolution faults in hydrocarbon reservoirs. AAPG Bull.91, 1e20.
Rotevatn, A., Buckley, S.J., Howell, J.A., Fossen, H., 2009. Overlapping faults and theireffect on fluid flow in different reservoir types: a LIDAR-based outcropmodeling and flow simulation study. AAPG Bull. 93, 407e427.
Rotevatn, A., Fossen, H., 2011. Simulating the effect of subseismic fault tails andprocess zones in a siliciclastic reservoir analogue: implications for aquifersupport and trap definition. Mar. Petrol. Geol. 28, 1648e1662.
Rustichelli, A., Tondi, E., Agosta, F., Cilona, A., Giorgioni, M., 2012. Development anddistribution of bed-parallel compaction bands and pressure solution seams inthe Bolognano Formation carbonates (Majella Mountain, Italy). J. Struct. Geol.37, 181e199.
Saillet, E., Wibberley, C.A.J., 2013. Permeability and flow impact of faults anddeformation bands in high-porosity sand reservoirs: Southeast Basin, France,analog. AAPG Bull. 97, 437e464.
Schultz, R.A., Soliva, R., Fossen, H., Okubo, C.H., Reeves, D.M., 2008. Dependence ofdisplacementelength scaling relations for fractures and deformation bands onthe volumetric changes across them. J. Struct. Geol. 30, 1405e1411.
Schultz, R.A., Klimczak, C., Fossen, H., Olson, J.E., Exner, U., Reeves, D.M., Soliva, R.,2013. Statistical tests of scaling relationships for geologic structures. J. Struct.Geol. 48, 85e94.
Shipton, Z., Evans, J., Robeson, K., Forster, C., Snelgrove, S., 2002. Structural het-erogeneity and permeability in faulted eolian sandstone: implications forsubsurface modeling of faults. AAPG Bull. 86, 863e883.
Sternlof, K., Chapin, J., Pollard, D., Durlofsky, L., 2004. Permeability effects ofdeformation band arrays in sandstone. AAPG Bull. 88, 1315e1329.
Taylor,W.L., Pollard,D.D., 2000. Estimationof in situpermeability of deformationbandsin porous sandstone, Valley of Fire, Nevada. Water Resour. Res. 36, 2595e2606.
Tondi, E., Zampieri, D., Giunta, G., Renda, P., Unti, M., Giorgianni, A., Cello, G., 2006a.Active faults and inferred seismic sources in the San Vito lo Capo peninsula,north-western Sicily, Italy. In: Geological Society of London, Special Publica-tions, vol. 262, pp. 365e377.
Tondi, E., Antonellini, M., Aydin, A., Marchegiani, L., Cello, G., 2006b. Interactionbetween deformation bands and stylolites in fault development in carbonategrainstones of Majella Mountain, Italy. J. Struct. Geol 28, 376e391.
Tondi, E., 2007. Nucleation, development and petrophysical properties of faults incarbonate grainstones: evidence from the San Vito Lo Capo peninsula (Sicily,Italy). J. Struct. Geol. 29, 614e628.
Tondi, E., Cilona, A., Agosta, F., Aydin, A., Rustichelli, A., Renda, P., Giunta, G., 2012.Growth processes, dimensional parameters and scaling relationships of twoconjugate sets of compactive shear bands in porous carbonate grainstones,Favignana Island, Italy. J. Struct. Geol. 37, 53e64.
Walsh, J.J., Watterson, J., Heath, A., Gillepsie, P.A., Childs, C., 1998. Assessment of theeffects of sub-seismic faults on bulk permeabilities of reservoir sequences. In:Geological Society of London, Special Publications, vol. 127, pp. 99e114.
Winston, R.W., 2009. ModelMuse e A Graphical User Interface for MODFLOW-2005and PHAST. U.S. Geological Survey, Techniques and Methods 6-A29, p. 59.
Yielding, G., Freeman, B., Needham, D.T., 1997. Quantitative fault seal prediction.AAPG Bull. 81, 897e917.
Yielding, G., Walsh, J.J., Watterson, J., 1992. The prediction of small-scale faulting inreservoirs. First Break 10, 449e460.
cal experiments of faulted porous carbonates, Northwest Sicily (Italy),tgeo.2013.12.003
Recommended


