ww.sciencedirect.com
i n t e r n a t i o n a l j o u r n a l o f h y d r o g e n en e r g y 3 7 ( 2 0 1 2 ) 3 4 1 5e3 4 2 4
Available online at w
journal homepage: www.elsevier .com/locate/he
Durability of different carbon nanomaterial supportswith PtRu catalyst in a direct methanol fuel cell
Annukka Santasalo-Aarnio a, Maryam Borghei b, Ilya V. Anoshkin b, Albert G. Nasibulin b,Esko I. Kauppinen b, Virginia Ruiz b,c, Tanja Kallio a,*aResearch Group of Fuel Cells, Department of Chemistry, Aalto University, P.O. Box 16100, 00076 Aalto, FinlandbNanomaterials Group, Department of Applied Physics, Aalto University, P.O. Box 16100, 00076 Aalto, FinlandcCIDETEC-IK4 (Centre for Electrochemical Technologies), Paseo Miramon 196, 20009 Donostia-San Sebastian, Spain
a r t i c l e i n f o
Article history:
Received 4 July 2011
Received in revised form
11 October 2011
Accepted 1 November 2011
Available online 9 December 2011
Keywords:
Carbon nanotubes
Carbon nanofibers
Methanol oxidation
Direct methanol fuel cell (DMFC)
* Corresponding author. Tel.: þ358 9470 2258E-mail address: [email protected] (T. Kal
0360-3199/$ e see front matter Copyright ªdoi:10.1016/j.ijhydene.2011.11.009
a b s t r a c t
PtRu catalysts with similar particle size and composition were deposited on three different
carbon supports: Vulcan, graphitized carbon nanofibers (GNF) and few-walled carbon
nanotubes (FWCNT) and their performance for methanol oxidation was studied in an
electrochemical cell and in a single cell DMFC. The electrochemical results indicate that
with PtRu/GNF and PtRu/FWCNT higher current densities are obtained and oxidation
intermediates deactivate the surface less compared to the same catalyst on Vulcan
support. Conversely, PtRu/Vulcan provided the highest open circuit voltage OCV and
current densities in DMFC experiments due to a well-optimized electrode layer structure.
Because stability is a key requirement for fuel cell commercialization, 6-day-long fuel cell
stability tests were carried out, showing that PtRu/Vulcan degraded significantly. This was
due to the collapse of the secondary structure of the electrode layer revealed by post
characterization of the membrane electrode assembly (MEA) with SEM and TEM. PtRu/GNF
exhibited slightly poorer initial performance but better stability because the structure of
the anode layer was maintained. PtRu/FWCNT showed the worst initial performance and
long-term stability. The good stability of non-optimized PtRu/GNF MEAs shows the
potential of these novel nanocarbon supported catalysts as stable fuel cell components
after proper MEA optimization.
Copyright ª 2011, Hydrogen Energy Publications, LLC. Published by Elsevier Ltd. All rights
reserved.
1. Introduction With the aim of reducing costs associated with the precious
Fuel cells running on liquid fuels such as direct methanol fuel
cells (DMFCs) are very promising energy sources for low power
electronic applications but improvements in performance and
design, as well as cost reduction are still necessary [1]. In
particular, developing more efficient and durable electro-
catalysts for methanol oxidation is crucial for achieving
enhanced performance and increasing the lifetime of DMFCs.
3; fax: þ358 9470 22580.lio).2011, Hydrogen Energy P
metal, nanosized mono and bimetallic catalysts deposited on
conducting carbons with high surface area are typically used.
Along with the nature of the catalysts, the search for better
andmore stable anodematerial has comprised evaluating the
influence of the carbon support on the catalytic activity. A
good catalyst support should have high surface area and
conductivity, exhibit good permeability to reactants and have
electrochemical stability under fuel cell operating conditions.
ublications, LLC. Published by Elsevier Ltd. All rights reserved.
i n t e rn a t i o n a l j o u r n a l o f h y d r o g e n en e r g y 3 7 ( 2 0 1 2 ) 3 4 1 5e3 4 2 43416
In this regard, many types of carbon nanostructures have
been investigated as supports for anode electrocatalysts in
DMFCs such as single-walled carbon nanotubes (SWCNTs),
multi-walled carbon nanotubes (MWCNTs), graphitized car-
bon nanofibers (GNFs), fullerenes and carbon nanohorns, due
to their appealing properties such as high surface area, elec-
tronic conductivity as well as chemical and mechanical
stability [2e16]. Most reports have demonstrated the superior
performance of highly porous tubular nanocarbons and
compared them to carbon black in terms of catalyst utilization
and dispersion. Thus, 2-fold enhancements of the catalytic
activity have been observed for MWCNT-supported Pt [6] or
PtRu [7,8] and for SWCNT-supported PtRu [9] and up to a 4-fold
increase for GNF-supported Pt [10,11] with respect to the
carbon black-supported catalysts. PtRu colloids on GNFs also
have 64%higher activities than the unsupported catalysts [17].
On the other hand, there are comparatively few systematic
studies where the performance of electrocatalysts deposited
in the same fashion on several carbon supports and from
various commercial sources is compared [17e20]. These
studies revealed notable differences in the activity trends as
well as in the enhancement factors (with respect to carbon
black) for the different carbon supports, with CNT-supported
catalysts either outperforming [18,21] or exhibiting poorer/
comparable activity [19,22,23] to carbon black. These con-
trasting results highlight the importance of conducting
further studies to gain more insight into the role of the cata-
lyst support. Furthermore, most of the reports on the impr-
oved activities of CNT or GNF-supported catalysts do not
address the crucial issue of the long-term stability and when
they do, conclusions on the stability of novel catalyst supports
are inferred from chronoamperometry or voltammetry tests
in electrochemical cells [8,10,19e21,23]. However, the catalyst
environment in the DMFC membrane electrode assembly
(MEA) differs considerably from that in a half-cell electro-
chemical set-up, which has motivated the current study
where activity and stability of PtRu catalysts on different
carbon supports have been compared in both scenarios.
Specifically, we have investigated both the catalytic
activity and long-term stability of PtRu catalysts deposited
following the same protocol on a series of carbon supports,
namely GNFs, few-walled CNTs (FWCNTs) and Vulcan. Metal
loadings, MEA preparation and DMFC testing were compa-
rable for the different electrocatalysts. In other reports where
the influence of the catalyst support was evaluated, catalyst
particle differed considerably for each support [17], which
makes more difficult to assess separately the effect of the
support. Here special effort has been done to achieve
comparable catalyst size and composition on the different
carbon supports to minimize differences arising from the
catalyst.Wewill show that the stability trends for catalysts on
different supports observed in chronoamperometry do not
necessarily correlate with long-term stability tests in DMFC
MEAs. Activities from chronoamperometric tests decrease in
the trend FWCNTs > GNFs > Vulcan, whereas the activities
observed in DMFC tests followed the opposite trend:
Vulcan>GNFs> FWCNTs. Therefore, caution is advisedwhen
attributing enhanced catalytic performance to novel electro-
catalysts based solely on electrochemical measurements.
Moreover, this also addresses the question of different MEA
preparation methods that need to be optimized also for the
high surface area catalyst supports.
2. Experimental methods
2.1. Catalyst material preparation
Vapour grown carbon nanofibres were kindly supplied by
Showa Denko (product reference VGNF). These are highly
graphitized nanofibers with a diameter of w150 nm and
a length of w10 mm. Prior to catalyst deposition, GNFs were
subject to oxidative surface functionalization by refluxing
them in a 1:1 (vol/vol%) mixture of HNO3 2 M and H2SO4 1 M at
120 �C for 6 h. Few-walled carbon nanotubes (FWCNT) with
2e5 walls (<6 nm diameter, w 1 mm length) were obtained by
catalytic pyrolysis of CH4 diluted with 80% H2 at 950 �Caccording to a method reported elsewhere [24]. The catalyst is
a mixture of CoeMo oxides (5 at.%) supported on MgO. After
the synthesis, residual catalyst was removed (<1% w.) from
the FWCNTs by washing in HCl, followed by rinsing with
deionized water and drying in vacuum. Prior to PtRu deposi-
tion, FWCNTs were acid treated to introduce surface func-
tional groups by refluxing them in a 1:1 mixture of HNO3 2 M
and H2SO4 1 M at 120 �C for 4 h. Vulcan XC72R powdered
carbon black with 96.11 kg m�3 bulk density (Cabot Corpora-
tion) was used as received for catalyst deposition.
2.2. Deposition of PtRu on Vulcan, FWCNTs and GNFs
Ru-Pt catalysts (w25% total metallic loading, Pt:Ru 1:1 atomic
ratio) were deposited on the different carbon supports by
reduction of the corresponding metal precursors, RuCl3 and
K2PtCl6, with NaBH4 according to a previously reported
procedure [25]. Briefly, the carbon supports were ultra-
sonicated in a solution containing ethylene glycol and water
for 20 min and then the required amount of the metal
precursors (with Pt:Ru atomic ratio of 1:1 and PtRu:C weight
ratio of 1:3) was added and ultrasonicated for 20 min. After
that, a solution of 0.04 M NaBH4 and 0.4 M NaOH was added
dropwise and the resulting suspension was kept under ultra-
sonication at 60 �C for 2 h for complete reduction. Finally the
suspension was filtered and the solid product was collected,
washed thoroughly with water and acetone and dried in
vacuum at 60 �C overnight.
2.3. Physical characterization of the materials
Scanning electron microscopy (SEM) was performed on a JEOL
JSM-7500FA field emission scanning electron microscope
equipped with an energy-dispersive X-rays spectrometer
(EDXS) for evaluation of catalyst metal loadings. For cross-
section imaging, MEAs were frozen in liquid nitrogen and
cut. Transmission electron microscopy (TEM) was done with
a Tecnai 12 Bio Twin transmission electron microscope with
LaB6 gun at 120 kV. As-prepared pristine catalyst powder and
degraded catalysts, scratched from the MEA anode, were
dispersed in isopropanol by short ultasonication and a drop
cast on TEM grids. Powder X-ray diffraction spectra were ob-
tained by a Bruker D8 Advance X-ray diffractometer using Cu
i n t e r n a t i o n a l j o u r n a l o f h y d r o g e n en e r g y 3 7 ( 2 0 1 2 ) 3 4 1 5e3 4 2 4 3417
Ka radiation and a Lynx Eye fast detector with scan conditions
of 2s/0.03�. The BET surface area was determined with N2
adsorption/desorption at 77 K temperature with a FlowSorb
2300 II instrument byMicromeritics. A four-probemethodwas
used for measuring the electrical conductivities of the MEA
anodes.
2.4. Electrochemical characterization of the materials
The aim of the electrochemical characterization was to
reproduce the conditions in a fuel cell anode as closely as
possible and therefore, a similar ink as used for fuel cell MEA
was prepared with 5 mg of the studied catalyst material,
Nafion� solution (5 wt % Aldrich) and isopropanol (Merck,
p.a.). The ink was mixed carefully with a magnetic stirrer and
an ultrasonic bath. 5-ml droplet of the ink was placed onto
a glassy carbon electrode which was cleaned and polished
with alumina solution and an ultrasonic bath. The ink was
dried in air over night. An electrochemical cell was assembled
with this glassy carbon electrode as a working, a platinum coil
as a counter electrode and standard calomel electrode (SCE) as
a reference; nevertheless, all the potentials mentioned are
referred to the reversible hydrogen electrode (RHE). All the
glassware was carefully boiled in MQ water (0.04 mS cm�1,
Millipore) and rinsed various times prior to the measure-
ments. 0.1 M HClO4 (Merck, 70 wt %) was freshly prepared and
used as an electrolyte in order to ensure that no significant
anion adsorption from the electrolyte occurs on the PtRu
surface [26].
The surface potential of the working electrode was
controlled all the time when the electrode was in the elec-
trolyte that was de-aerated prior to the experiments. The
experiments were performed with a potentiostat/galvanostat
PGSTAT100 Autolab system. Firstly, a cyclic voltammogram
(20 mV s�1) was obtained to ensure that the electrode prepa-
ration had succeeded. The catalyst surface cleaning was done
with CO adsorption/oxidationmethod because cycling to high
potentials would have caused ruthenium dissolution [27]. The
electrolyte was purged with CO gas (99.99%) for 2 h while the
electrode was kept in 0.1 V vs. RHE potential and rotated at
300 rpm to ensure easy diffusion to the catalyst surface.While
the potential was still held the gas was changed to N2 and
purged for 30 min to remove the CO from the electrolyte.
Subsequently, a cyclic voltammogram with three scans was
obtained at 10 mV s�1 to show the CO oxidation peak behav-
iour. After this cleaning cycle voltammograms of the catalyst
surface were performed at 20 mV s�1. In this report, all the
currents are presented normalized by the catalyst loading on
the working electrode and all voltammograms refer to the
features in the third cycle, where steady-state response was
attained.
After the measurements in pure electrolyte, the solution
was changed to one containing the same electrolyte and 1 M
methanol. To prevent changes inmethanol concentration, the
gas inlet was first directed into a bubbler bottle containing the
same solution as the cell and methanol saturated gas was
directed to the experimental cell. Cyclic voltammogramswere
recorded with a rotating disc electrode (RDE) at 10 mV s�1 rate
with and without 1800 rpm rotation (Pine instruments). To
further study the catalyst poisoning additional
chronoamperometric measurements for 1 h were obtained at
0.7 V vs. RHE potential.
2.5. Fuel cell experiments
Prior to the fuel cell experiments a membrane electrode
assembly (MEA) with each of the studied catalyst materials
was made. The catalyst ink was prepared as a mixture of
catalyst (60 wt % of Pt on Vulcan (Alfa Aesar) for cathode and
the investigated PtRu catalyst for anode), Nafion� solution and
isopropanol solvent. The ink was first stirred with a magnetic
stirrer for several hours and the Vulcan catalyst was sonicated
with an ultrasonic bath. The slurry was painted onto the
membrane materials with an airbrush and dried in a vacuum
oven for 2 h. The metal loading of the cathode was
2� 0.2mg cm�2 and for the anode 1� 0.2mg cm�2. The reason
for using cathodes with higher catalyst loading and same
Nafion loading at the anode was to ensure that the differences
seen in the fuel cell results were purely dependent on the
anode catalyst supporting material. When both electrodes
were painted onto the membrane, the MEA was heat pressed
at 130 �C, with 50 kN pressure for 120 s. The fuel cell was
assembled with Teflon insulators, gas diffusion layers (carbon
cloths) and a MEA, closed and tightened evenly with 10 kN
force.
The fuel cell experiments were performed in a single cell
DMFC with surface area of 7.29 cm2. 1 M methanol (Merck,
p.a.) fuel was fed to the anodewith 1.5mlmin�1 rate and dried
oxygen gas (5.0 Aga) to the cathode at 300 ml min�1. The
temperature of the cell was controlled to be 70 �C � 1 �C. Thecell was stabilized over night with the studied methanol fuel
(0.2 ml min�1) and oxygen with 30 ml min�1 and normalized
2 h prior to the polarization experiments with higher flow
rates. The polarization curves were measured with a PGSTAT
20 instrument with an Ecochemie 10 A current booster
BSTR10A and a GPES software from the open circuit voltage
(OCV) to 0.05 V at the rate of 0.5 mV s�1. In addition, long-term
stability test for the MEAs at 70 � 1 �C was performed after
measuring the polarisation curves. The flow rates of the fuels
were lowered to 0.5 ml/min for the methanol and 90 ml min�1
for oxygen and stabilized for 2 h. The potential control was
applied and kept at constant 0.4 V for 137 h while the current
was observed as a function of time. After the measurement
the polarisation curve was obtained by the same method
described above. Finally, the degraded MEAs were removed
from the cell and the cross-sections were imaged with SEM
and catalyst material scratched from the MEA anode was
analysed by TEM.
3. Results and discussion
3.1. Structural characterization of the materials
As indicated above, special effort has been devoted to
obtaining catalysts with comparable metal loading, Pt:Ru
atomic ratio and particle size (Table 1) on the different carbon
supports with clearly different BET surface areas increasing in
order GNF < Vulcan < FWCNT. Metallic content and Pt:Ru
atomic ratios are determined from the pristine catalyst
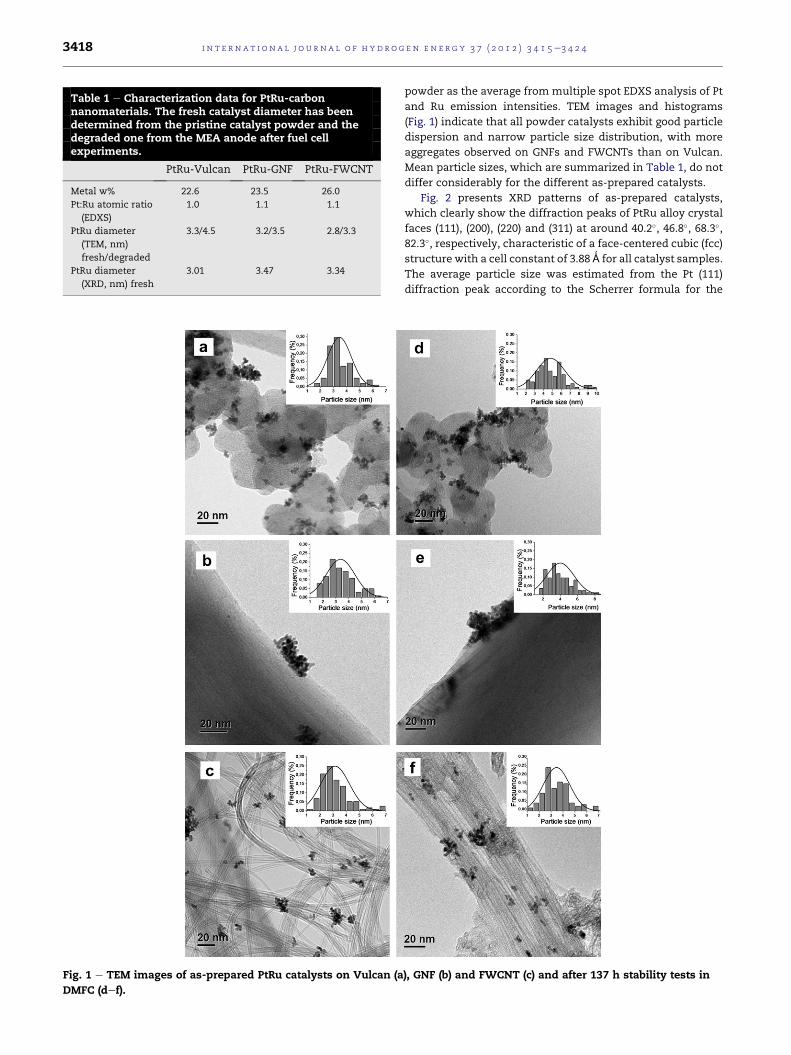
Table 1 e Characterization data for PtRu-carbonnanomaterials. The fresh catalyst diameter has beendetermined from the pristine catalyst powder and thedegraded one from the MEA anode after fuel cellexperiments.
PtRu-Vulcan PtRu-GNF PtRu-FWCNT
Metal w% 22.6 23.5 26.0
Pt:Ru atomic ratio
(EDXS)
1.0 1.1 1.1
PtRu diameter
(TEM, nm)
fresh/degraded
3.3/4.5 3.2/3.5 2.8/3.3
PtRu diameter
(XRD, nm) fresh
3.01 3.47 3.34
Fig. 1 e TEM images of as-prepared PtRu catalysts on Vulcan (a
DMFC (def).
i n t e rn a t i o n a l j o u r n a l o f h y d r o g e n en e r g y 3 7 ( 2 0 1 2 ) 3 4 1 5e3 4 2 43418
powder as the average from multiple spot EDXS analysis of Pt
and Ru emission intensities. TEM images and histograms
(Fig. 1) indicate that all powder catalysts exhibit good particle
dispersion and narrow particle size distribution, with more
aggregates observed on GNFs and FWCNTs than on Vulcan.
Mean particle sizes, which are summarized in Table 1, do not
differ considerably for the different as-prepared catalysts.
Fig. 2 presents XRD patterns of as-prepared catalysts,
which clearly show the diffraction peaks of PtRu alloy crystal
faces (111), (200), (220) and (311) at around 40.2�, 46.8�, 68.3�,82.3�, respectively, characteristic of a face-centered cubic (fcc)
structure with a cell constant of 3.88 Ǻ for all catalyst samples.
The average particle size was estimated from the Pt (111)
diffraction peak according to the Scherrer formula for the
), GNF (b) and FWCNT (c) and after 137 h stability tests in
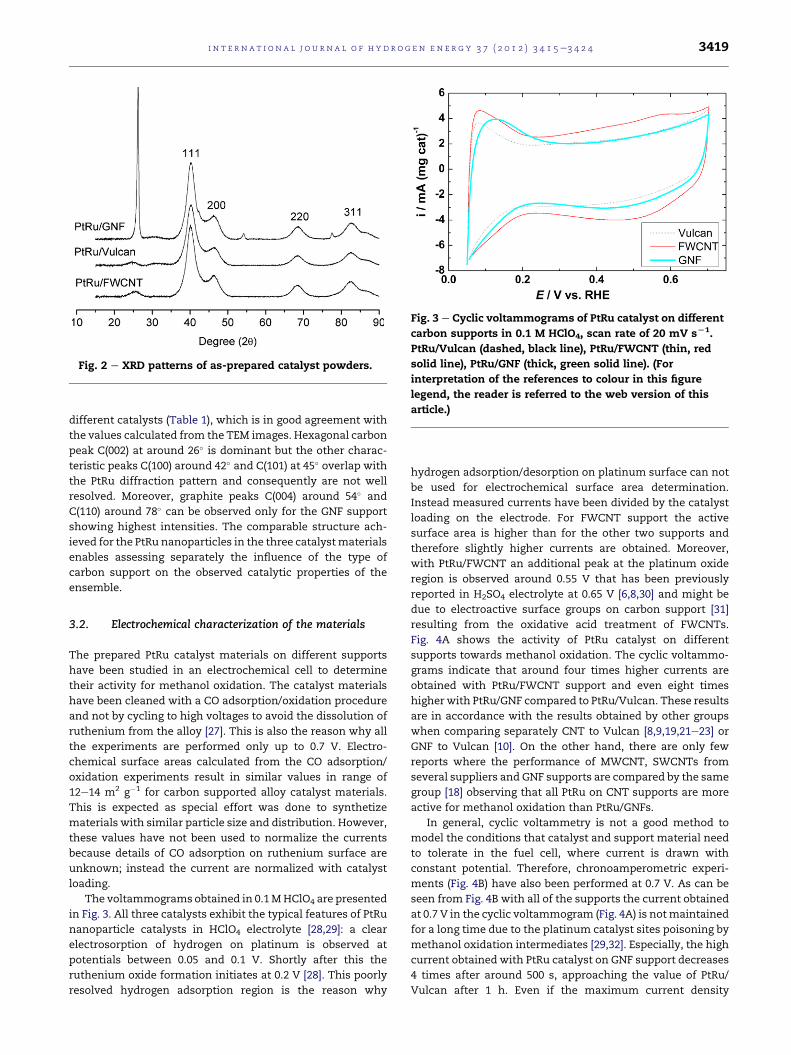
Fig. 2 e XRD patterns of as-prepared catalyst powders.
Fig. 3 e Cyclic voltammograms of PtRu catalyst on different
carbon supports in 0.1 M HClO4, scan rate of 20 mV sL1.
PtRu/Vulcan (dashed, black line), PtRu/FWCNT (thin, red
solid line), PtRu/GNF (thick, green solid line). (For
interpretation of the references to colour in this figure
legend, the reader is referred to the web version of this
article.)
i n t e r n a t i o n a l j o u r n a l o f h y d r o g e n en e r g y 3 7 ( 2 0 1 2 ) 3 4 1 5e3 4 2 4 3419
different catalysts (Table 1), which is in good agreement with
the values calculated from the TEM images. Hexagonal carbon
peak C(002) at around 26� is dominant but the other charac-
teristic peaks C(100) around 42� and C(101) at 45� overlap with
the PtRu diffraction pattern and consequently are not well
resolved. Moreover, graphite peaks C(004) around 54� and
C(110) around 78� can be observed only for the GNF support
showing highest intensities. The comparable structure ach-
ieved for the PtRu nanoparticles in the three catalystmaterials
enables assessing separately the influence of the type of
carbon support on the observed catalytic properties of the
ensemble.
3.2. Electrochemical characterization of the materials
The prepared PtRu catalyst materials on different supports
have been studied in an electrochemical cell to determine
their activity for methanol oxidation. The catalyst materials
have been cleaned with a CO adsorption/oxidation procedure
and not by cycling to high voltages to avoid the dissolution of
ruthenium from the alloy [27]. This is also the reason why all
the experiments are performed only up to 0.7 V. Electro-
chemical surface areas calculated from the CO adsorption/
oxidation experiments result in similar values in range of
12e14 m2 g�1 for carbon supported alloy catalyst materials.
This is expected as special effort was done to synthetize
materials with similar particle size and distribution. However,
these values have not been used to normalize the currents
because details of CO adsorption on ruthenium surface are
unknown; instead the current are normalized with catalyst
loading.
The voltammograms obtained in 0.1MHClO4 are presented
in Fig. 3. All three catalysts exhibit the typical features of PtRu
nanoparticle catalysts in HClO4 electrolyte [28,29]: a clear
electrosorption of hydrogen on platinum is observed at
potentials between 0.05 and 0.1 V. Shortly after this the
ruthenium oxide formation initiates at 0.2 V [28]. This poorly
resolved hydrogen adsorption region is the reason why
hydrogen adsorption/desorption on platinum surface can not
be used for electrochemical surface area determination.
Instead measured currents have been divided by the catalyst
loading on the electrode. For FWCNT support the active
surface area is higher than for the other two supports and
therefore slightly higher currents are obtained. Moreover,
with PtRu/FWCNT an additional peak at the platinum oxide
region is observed around 0.55 V that has been previously
reported in H2SO4 electrolyte at 0.65 V [6,8,30] and might be
due to electroactive surface groups on carbon support [31]
resulting from the oxidative acid treatment of FWCNTs.
Fig. 4A shows the activity of PtRu catalyst on different
supports towards methanol oxidation. The cyclic voltammo-
grams indicate that around four times higher currents are
obtained with PtRu/FWCNT support and even eight times
higherwith PtRu/GNF compared to PtRu/Vulcan. These results
are in accordance with the results obtained by other groups
when comparing separately CNT to Vulcan [8,9,19,21e23] or
GNF to Vulcan [10]. On the other hand, there are only few
reports where the performance of MWCNT, SWCNTs from
several suppliers and GNF supports are compared by the same
group [18] observing that all PtRu on CNT supports are more
active for methanol oxidation than PtRu/GNFs.
In general, cyclic voltammetry is not a good method to
model the conditions that catalyst and support material need
to tolerate in the fuel cell, where current is drawn with
constant potential. Therefore, chronoamperometric experi-
ments (Fig. 4B) have also been performed at 0.7 V. As can be
seen from Fig. 4B with all of the supports the current obtained
at 0.7 V in the cyclic voltammogram (Fig. 4A) is notmaintained
for a long time due to the platinum catalyst sites poisoning by
methanol oxidation intermediates [29,32]. Especially, the high
current obtained with PtRu catalyst on GNF support decreases
4 times after around 500 s, approaching the value of PtRu/
Vulcan after 1 h. Even if the maximum current density
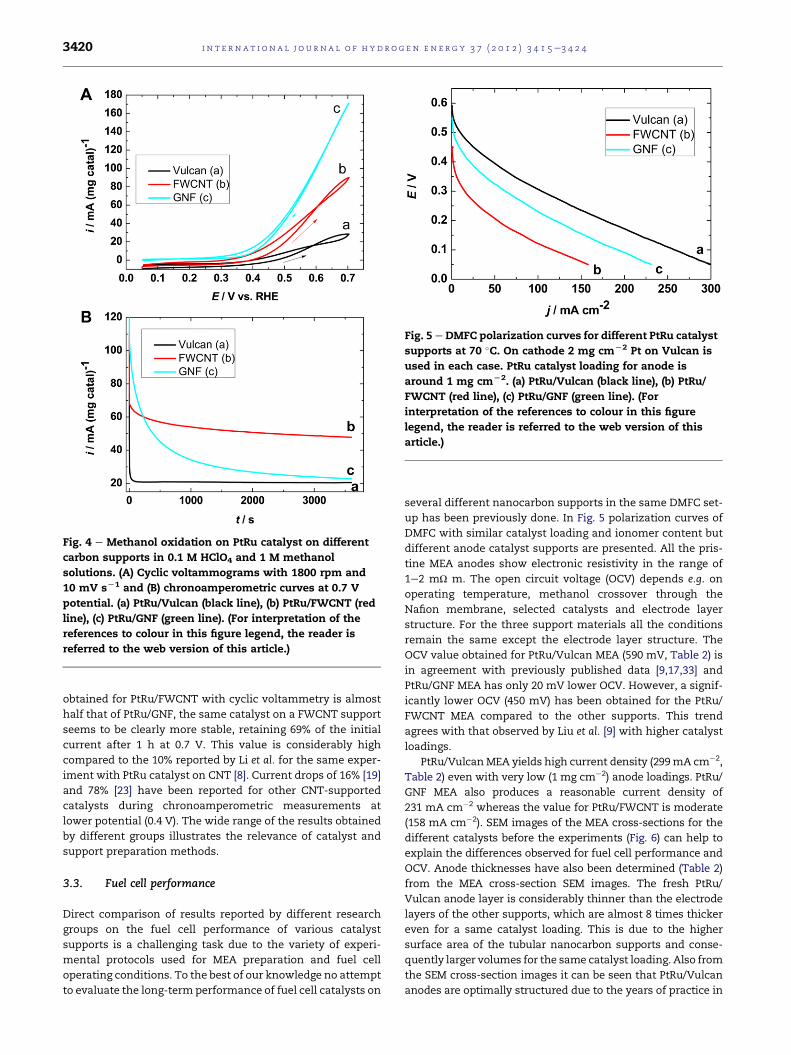
Fig. 4 e Methanol oxidation on PtRu catalyst on different
carbon supports in 0.1 M HClO4 and 1 M methanol
solutions. (A) Cyclic voltammograms with 1800 rpm and
10 mV sL1 and (B) chronoamperometric curves at 0.7 V
potential. (a) PtRu/Vulcan (black line), (b) PtRu/FWCNT (red
line), (c) PtRu/GNF (green line). (For interpretation of the
references to colour in this figure legend, the reader is
referred to the web version of this article.)
Fig. 5 e DMFC polarization curves for different PtRu catalyst
supports at 70 �C. On cathode 2 mg cmL2 Pt on Vulcan is
used in each case. PtRu catalyst loading for anode is
around 1 mg cmL2. (a) PtRu/Vulcan (black line), (b) PtRu/
FWCNT (red line), (c) PtRu/GNF (green line). (For
interpretation of the references to colour in this figure
legend, the reader is referred to the web version of this
article.)
i n t e rn a t i o n a l j o u r n a l o f h y d r o g e n en e r g y 3 7 ( 2 0 1 2 ) 3 4 1 5e3 4 2 43420
obtained for PtRu/FWCNT with cyclic voltammetry is almost
half that of PtRu/GNF, the same catalyst on a FWCNT support
seems to be clearly more stable, retaining 69% of the initial
current after 1 h at 0.7 V. This value is considerably high
compared to the 10% reported by Li et al. for the same exper-
iment with PtRu catalyst on CNT [8]. Current drops of 16% [19]
and 78% [23] have been reported for other CNT-supported
catalysts during chronoamperometric measurements at
lower potential (0.4 V). The wide range of the results obtained
by different groups illustrates the relevance of catalyst and
support preparation methods.
3.3. Fuel cell performance
Direct comparison of results reported by different research
groups on the fuel cell performance of various catalyst
supports is a challenging task due to the variety of experi-
mental protocols used for MEA preparation and fuel cell
operating conditions. To the best of our knowledge no attempt
to evaluate the long-term performance of fuel cell catalysts on
several different nanocarbon supports in the same DMFC set-
up has been previously done. In Fig. 5 polarization curves of
DMFC with similar catalyst loading and ionomer content but
different anode catalyst supports are presented. All the pris-
tine MEA anodes show electronic resistivity in the range of
1e2 mU m. The open circuit voltage (OCV) depends e.g. on
operating temperature, methanol crossover through the
Nafion membrane, selected catalysts and electrode layer
structure. For the three support materials all the conditions
remain the same except the electrode layer structure. The
OCV value obtained for PtRu/Vulcan MEA (590 mV, Table 2) is
in agreement with previously published data [9,17,33] and
PtRu/GNF MEA has only 20 mV lower OCV. However, a signif-
icantly lower OCV (450 mV) has been obtained for the PtRu/
FWCNT MEA compared to the other supports. This trend
agrees with that observed by Liu et al. [9] with higher catalyst
loadings.
PtRu/VulcanMEA yields high current density (299mA cm�2,
Table 2) even with very low (1 mg cm�2) anode loadings. PtRu/
GNF MEA also produces a reasonable current density of
231 mA cm�2 whereas the value for PtRu/FWCNT is moderate
(158 mA cm�2). SEM images of the MEA cross-sections for the
different catalysts before the experiments (Fig. 6) can help to
explain the differences observed for fuel cell performance and
OCV. Anode thicknesses have also been determined (Table 2)
from the MEA cross-section SEM images. The fresh PtRu/
Vulcan anode layer is considerably thinner than the electrode
layers of the other supports, which are almost 8 times thicker
even for a same catalyst loading. This is due to the higher
surface area of the tubular nanocarbon supports and conse-
quently larger volumes for the same catalyst loading. Also from
the SEM cross-section images it can be seen that PtRu/Vulcan
anodes are optimally structured due to the years of practice in
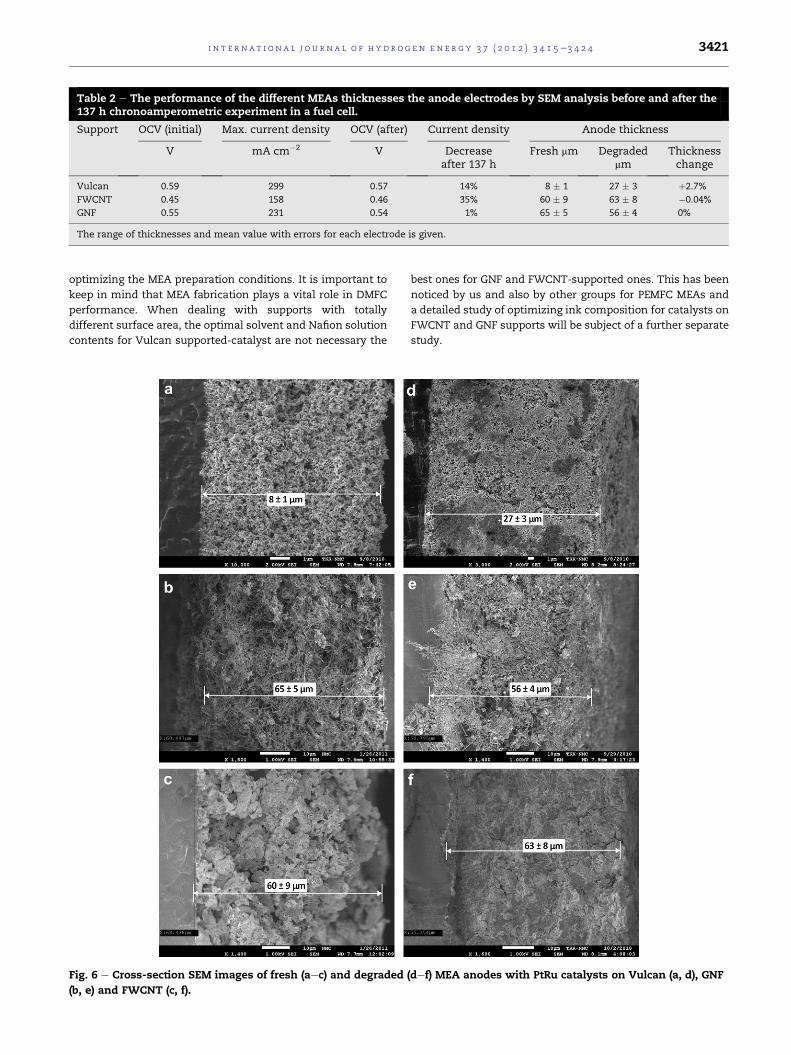
Table 2 e The performance of the different MEAs thicknesses the anode electrodes by SEM analysis before and after the137 h chronoamperometric experiment in a fuel cell.
Support OCV (initial) Max. current density OCV (after) Current density Anode thickness
V mA cm�2 V Decreaseafter 137 h
Fresh mm Degradedmm
Thicknesschange
Vulcan 0.59 299 0.57 14% 8 � 1 27 � 3 þ2.7%
FWCNT 0.45 158 0.46 35% 60 � 9 63 � 8 �0.04%
GNF 0.55 231 0.54 1% 65 � 5 56 � 4 0%
The range of thicknesses and mean value with errors for each electrode is given.
i n t e r n a t i o n a l j o u r n a l o f h y d r o g e n en e r g y 3 7 ( 2 0 1 2 ) 3 4 1 5e3 4 2 4 3421
optimizing the MEA preparation conditions. It is important to
keep in mind that MEA fabrication plays a vital role in DMFC
performance. When dealing with supports with totally
different surface area, the optimal solvent and Nafion solution
contents for Vulcan supported-catalyst are not necessary the
Fig. 6 e Cross-section SEM images of fresh (aec) and degraded
(b, e) and FWCNT (c, f).
best ones for GNF and FWCNT-supported ones. This has been
noticed by us and also by other groups for PEMFC MEAs and
a detailed study of optimizing ink composition for catalysts on
FWCNT and GNF supports will be subject of a further separate
study.
(def) MEA anodes with PtRu catalysts on Vulcan (a, d), GNF
i n t e rn a t i o n a l j o u r n a l o f h y d r o g e n en e r g y 3 7 ( 2 0 1 2 ) 3 4 1 5e3 4 2 43422
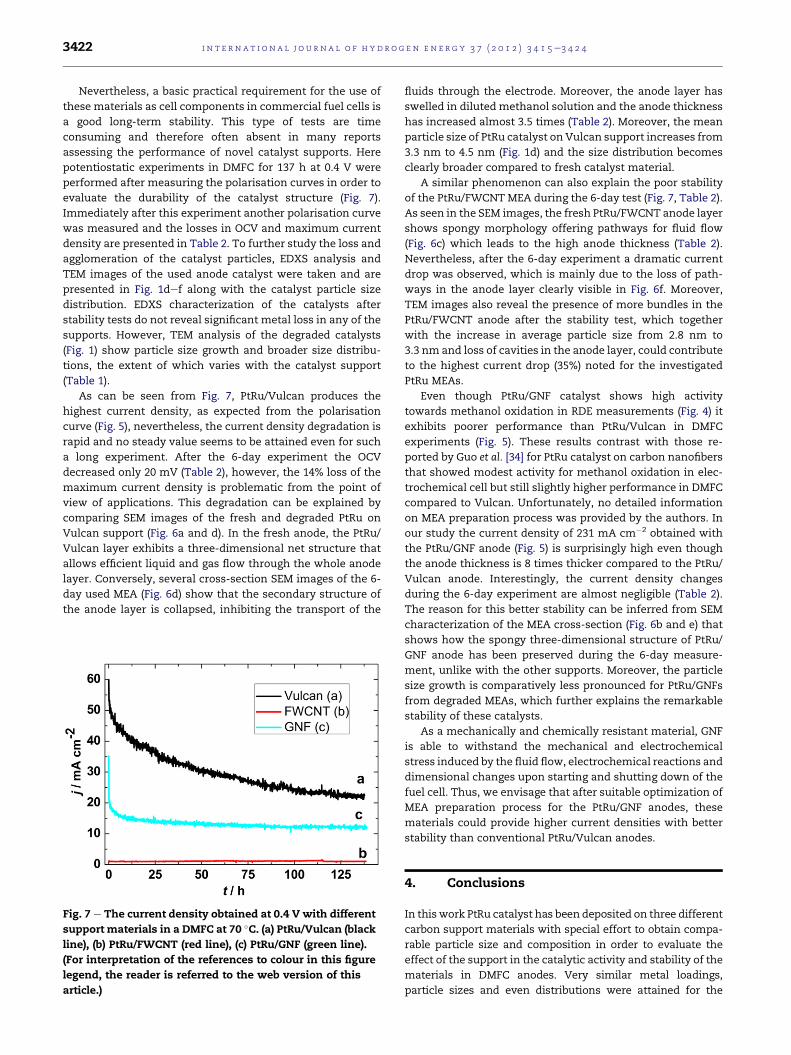
Nevertheless, a basic practical requirement for the use of
these materials as cell components in commercial fuel cells is
a good long-term stability. This type of tests are time
consuming and therefore often absent in many reports
assessing the performance of novel catalyst supports. Here
potentiostatic experiments in DMFC for 137 h at 0.4 V were
performed after measuring the polarisation curves in order to
evaluate the durability of the catalyst structure (Fig. 7).
Immediately after this experiment another polarisation curve
was measured and the losses in OCV and maximum current
density are presented in Table 2. To further study the loss and
agglomeration of the catalyst particles, EDXS analysis and
TEM images of the used anode catalyst were taken and are
presented in Fig. 1def along with the catalyst particle size
distribution. EDXS characterization of the catalysts after
stability tests do not reveal significant metal loss in any of the
supports. However, TEM analysis of the degraded catalysts
(Fig. 1) show particle size growth and broader size distribu-
tions, the extent of which varies with the catalyst support
(Table 1).
As can be seen from Fig. 7, PtRu/Vulcan produces the
highest current density, as expected from the polarisation
curve (Fig. 5), nevertheless, the current density degradation is
rapid and no steady value seems to be attained even for such
a long experiment. After the 6-day experiment the OCV
decreased only 20 mV (Table 2), however, the 14% loss of the
maximum current density is problematic from the point of
view of applications. This degradation can be explained by
comparing SEM images of the fresh and degraded PtRu on
Vulcan support (Fig. 6a and d). In the fresh anode, the PtRu/
Vulcan layer exhibits a three-dimensional net structure that
allows efficient liquid and gas flow through the whole anode
layer. Conversely, several cross-section SEM images of the 6-
day used MEA (Fig. 6d) show that the secondary structure of
the anode layer is collapsed, inhibiting the transport of the
Fig. 7 e The current density obtained at 0.4 V with different
support materials in a DMFC at 70 �C. (a) PtRu/Vulcan (black
line), (b) PtRu/FWCNT (red line), (c) PtRu/GNF (green line).
(For interpretation of the references to colour in this figure
legend, the reader is referred to the web version of this
article.)
fluids through the electrode. Moreover, the anode layer has
swelled in diluted methanol solution and the anode thickness
has increased almost 3.5 times (Table 2). Moreover, the mean
particle size of PtRu catalyst on Vulcan support increases from
3.3 nm to 4.5 nm (Fig. 1d) and the size distribution becomes
clearly broader compared to fresh catalyst material.
A similar phenomenon can also explain the poor stability
of the PtRu/FWCNT MEA during the 6-day test (Fig. 7, Table 2).
As seen in the SEM images, the fresh PtRu/FWCNT anode layer
shows spongy morphology offering pathways for fluid flow
(Fig. 6c) which leads to the high anode thickness (Table 2).
Nevertheless, after the 6-day experiment a dramatic current
drop was observed, which is mainly due to the loss of path-
ways in the anode layer clearly visible in Fig. 6f. Moreover,
TEM images also reveal the presence of more bundles in the
PtRu/FWCNT anode after the stability test, which together
with the increase in average particle size from 2.8 nm to
3.3 nm and loss of cavities in the anode layer, could contribute
to the highest current drop (35%) noted for the investigated
PtRu MEAs.
Even though PtRu/GNF catalyst shows high activity
towards methanol oxidation in RDE measurements (Fig. 4) it
exhibits poorer performance than PtRu/Vulcan in DMFC
experiments (Fig. 5). These results contrast with those re-
ported by Guo et al. [34] for PtRu catalyst on carbon nanofibers
that showed modest activity for methanol oxidation in elec-
trochemical cell but still slightly higher performance in DMFC
compared to Vulcan. Unfortunately, no detailed information
on MEA preparation process was provided by the authors. In
our study the current density of 231 mA cm�2 obtained with
the PtRu/GNF anode (Fig. 5) is surprisingly high even though
the anode thickness is 8 times thicker compared to the PtRu/
Vulcan anode. Interestingly, the current density changes
during the 6-day experiment are almost negligible (Table 2).
The reason for this better stability can be inferred from SEM
characterization of the MEA cross-section (Fig. 6b and e) that
shows how the spongy three-dimensional structure of PtRu/
GNF anode has been preserved during the 6-day measure-
ment, unlike with the other supports. Moreover, the particle
size growth is comparatively less pronounced for PtRu/GNFs
from degraded MEAs, which further explains the remarkable
stability of these catalysts.
As a mechanically and chemically resistant material, GNF
is able to withstand the mechanical and electrochemical
stress induced by the fluid flow, electrochemical reactions and
dimensional changes upon starting and shutting down of the
fuel cell. Thus, we envisage that after suitable optimization of
MEA preparation process for the PtRu/GNF anodes, these
materials could provide higher current densities with better
stability than conventional PtRu/Vulcan anodes.
4. Conclusions
In thiswork PtRu catalyst has been deposited on three different
carbon support materials with special effort to obtain compa-
rable particle size and composition in order to evaluate the
effect of the support in the catalytic activity and stability of the
materials in DMFC anodes. Very similar metal loadings,
particle sizes and even distributions were attained for the
i n t e r n a t i o n a l j o u r n a l o f h y d r o g e n en e r g y 3 7 ( 2 0 1 2 ) 3 4 1 5e3 4 2 4 3423
catalysts on the different carbon supports. Electrochemical
experiments show that the highest currents are reached with
PtRu catalyst on GNF support whereas PtRu/FWCNT seems to
be more tolerant to methanol oxidation intermediates. Never-
theless, catalysts on both tubular supports exhibit clearly
higher activity towards methanol oxidation and better toler-
ance for COads poisoning than the same catalyst on Vulcan
support. When the same catalysts are compared in a DMFC
anode an inverse trend is observed, with PtRu/Vulcan exhibit-
ing the highest OCV and current densities. However, when
subject to the long-term chronoamperometry experiments this
catalyst degrades fast, the three-dimensional layer structure of
the Vulcan anode is lost, resulting in a gradual decrease of
current density that is problematic from the application point
of view. PtRu/FWCNT produced moderate current densities
and suffered more pronounced current density losses and
anode layer structural changes. On the other hand, although
PtRu/GNF provided slightly lower initial current density than
PtRu/Vulcan, negligible current loss was detected during the 6-
day experiment, indicating a more stable nature of the anode
layer structure. Overall, further optimization of MEA prepara-
tion for the novel catalyst supports in view of the MEA struc-
tural characterization after the long-term stability tests shall
lead to enhanced performance as DMFC anode catalyst layers.
Acknowledgements
The Academy of Finland (T.K., V.R., M.B. and A.G.N., Academy
Research Fellowship) and the Spanish Ministry of Science and
Innovation (V.R., Prog. Ramon y Cajal) are acknowledged for
financial support. We also thank Dr. Iratxe de Meatza for
helpful discussions and Kati Vilonen for help with the BET-
area determination.
r e f e r e n c e s
[1] Borup R, Meyers J, Pivovar B, Kim YS, Mukundan R,Garland N, et al. Scientific aspects of polymer electrolyte fuelcell durability and design. Chem Rev 2007;107:3904e51.
[2] Lee K, Zhang J, Wang H, Wilkinson DP. Progress in thesynthesis of carbon nanotube- and nanofiber-supported Ptelectrocatalysts for PEM fuel cell catalysis. J ApplElectrochem 2006;36:507e22.
[3] Antolini E. Carbon supports for low-temperature fuel cellcatalysts. Appl Catal B Environ 2009;88:1e24.
[4] Kosaka M, Kuroshima S, Kobayashi K, Sekino S, Ichihashi T,Nakamura S, et al. Single-wall carbon nanohorns supportingPt catalyst in direct methanol fuel cells. J Phys Chem C 2009;113:8660e7.
[5] Vinodgopal K, Haria M, Meisel D, Kamat P. Fullerene-basedcarbon nanostructures for methanol oxidation. Nano Lett2004;4:415e8.
[6] Saha MS, Li R, Sun X. High loading and monodispersed Ptnanoparticles on multiwalled carbon nanotubes for highperformance proton exchange membrane fuel cell. J PowerSources 2008;177:314e22.
[7] Chien C-C, Jeng K- T. Effective preparation of carbonnanotube-supported Pt-Ru electrocatalysts. Mater ChemPhys 2006;99:80e7.
[8] Li L, Xing Y. Pt-Ru nanoparticles supported on carbonnanotubes as methanol fuel cell catalysts. J Phys Chem C2007;111:2803e8.
[9] Liu Z, Ling XY, Guo B, Hong L, Lee JY. Pt and PtRunanoparticles deposited on single-wall carbon nanotubes formethanol electro-oxidation. J Power Sources 2007;167:272e80.
[10] Ma Y, Jiang S, Jian G, Tao H, Yu L, Wang X, et al. CNx
nanofibers converted from polypyrrole nanowires asplatinum support for methanol oxidation. Energy Environ Sci2009;2:224e9.
[11] Bessel CA, Laubernds K, Rodriguez NM, Baker RTK. Graphitenanofibers as an electrode for fuel cell applications. J PhysChem B 2001;105:1115e8.
[12] Li W, Wang X, Chen Z, Waje M, Yan Y. Pt-Ru supported ondouble-walled carbon nanotubes as high-performance anodecatalyst for direct methanol fuel cells. J Phys Chem B 2006;110:15353e8.
[13] Wang X, Li W, Chen Z,Waje M, Yan Y. Durability investigationof carbon nanotube as catalyst support for proton exchangemembrane fuel cell. J Power Sources 2006;158:154e9.
[14] Ahmadi R, Amini MK. Synthesis and characterization of Ptnanoparticles on sulfur-modified carbon nanotubes formethanol oxidation. Int J Hydrogen Energy 2011;36:7275e83.
[15] Chem Y, Zhang G, Ma J, Zhou Y, Tang Y, Lu T. Electro-oxidation of methanol at the different carbon materialssupported Pt nano-particles. Int J Hydrogen Energy 2010;35:10109e17.
[16] Tsai M-C, Yeh T-K, Tsai C- H. Methanol oxidation on carbon-nanotube-supported platinum and platinum-rutheniumnanoparticles prepared by pulsed electrodeposition. Int JHydrogen Energy 2011;36:8261e6.
[17] Steigerwalt ES, Deluga GA, Lukehart CM. Pt-Ru/carbon fibernanocomposites: synthesis, characterization, andperformance as anode catalysts of direct methanol fuel cells.A search for exceptional performance. J Phys Chem B 2002;106:760e6.
[18] Girishkumar G, Hall TD, Vinodgopal K, Kamat PV. Single wallcarbon nanotube supports for portable direct methanol fuelcells. J Phys Chem B 2006;110:107e14.
[19] Chetty R, Kundu S, Xia W, Bron M, Schuhmann W, Chirila V,et al. PtRu nanoparticles supported on nitrogen-dopedmultiwalled carbon nanotubes as catalyst for methanolelectrooxidation. Electrochim Acta 2009;54:4208e15.
[20] Selvaraj V, Alagar M. Pt and Pt-Ru nanoparticles decoratedpolypyrrole/multiwalled carbon nanotubes and theircatalytic activity towards methanol oxidation. ElectrochemCommun 2007;9:1145e53.
[21] Jiang S, Zhu L, Ma Y, Wang X, Liu J, Zhu J, et al. Directimmobilization of Pt-Ru alloy nanoparticles on nitrogen-doped carbon nanotubes with superior electrocatalyticperformance. J Power Sources 2010;195:7578e82.
[22] Gan L, Lv R, Du H, Li B, Kang F. High loading of Pt-Runanocatalysts by pentagon defects introduced in a bamboo-shaped carbon nanotubes support for high performanceanode of direct methanol fuel cells. Electrochem Commun2009;11:355e8.
[23] Liu Z, Lee JY, Chen W, Han M, Gan LM. Physical andelectrochemical characterization of microwave-assistedpolyol preparation of carbon-supported PtRu nanoparticles.Langmuir 2004;20:181e7.
[24] Rakov EG, Grishin DA, Gavrilov YV, Rakova EV, Nasibulin AG,Jiang H, et al. The morphology of pyrolytic carbon nanotubeswith a small number of walls. Russ J Phys Chem 2004;78:2222e7.
[25] Huang T, Liu J, Li R, Cai W, Yu A. A novel route forpreparation of PtRuMe (Me ¼ Fe, Co, Ni) and their catalyticperformance for methanol electrooxidation. ElectrochemCommun 2009;11:643e6.

i n t e rn a t i o n a l j o u r n a l o f h y d r o g e n en e r g y 3 7 ( 2 0 1 2 ) 3 4 1 5e3 4 2 43424
[26] Lai SCS, Koper MTM. Electro-oxidation of ethanol andacetaldehyde on platinum single-crystal electrodes. FaradayDiscuss 2008;140:399e416.
[27] Arico AS, Srinivasan S, Antonucci V. DMFCs: fromfundamental aspects to technology development. Fuel Cells2001;1:133e61.
[28] Gojkovic SL, Vidakovic TR, Durovic DR. Kinetic study ofmethanol oxidation on carbon-supported PtRuelectrocatalyst. Electrochim Acta 2003;48:3607e14.
[29] Lin WF, Iwasita T, Vielstich W. Catalysis of COelectrooxidation at Pt, Ru, and PtRu alloy. An in situ FTIRstudy. J Phys Chem B 1999;103:3250e7.
[30] Lin Y, Cui X, Yen CH, Wai CM. PtRu/carbon nanotubenanocomposite synthesized in supercritical fluid: a novel
electrocatalyst for direct methanol fuel cell. Langmuir 2005;21:11474e9.
[31] Wang J, Yin G, Shao Y, Zhang S, Wang Z, Gao Y. Effect ofcarbon black support corrosion on the durability of Pt/Ccatalyst. J Power Sources 2007;171:331e9.
[32] Liu P, Logadottir A, Norskov JK. Modeling the electro-oxidation of CO and H2/CO on Pt, Ru, PtRu and Pt3Sn.Electrochim Acta 2003;48:3731e42.
[33] Santasalo A, Kallio T, Kontturi K. Performance of liquid fuelsin a platinum-ruthenium-catalysed polymer electrolyte fuelcell. Platinum Metals Rev 2009;53:58e66.
[34] Guo J, Sun G, Wang Q, Wang G, Zhou Z, Tang S, et al. Carbonnanofibers supported Pt-Ru electrocatalysts for directmethanol fuel cells. Carbon 2006;44:152e7.
Recommended


