Astronomy & Astrophysics manuscript no. gamma˙jet˙v3 c© ESO 2011February 3, 2011
γ-rays in flat-spectrum AGN: Revisiting the fast jet hypothesis withthe CJF sample
M. Karouzos1,?, S. Britzen1, A. Witzel1, J.A. Zensus1,2, and A. Eckart2,1
1 Max-Planck-Institut fur Radioastronomie, Auf dem Hugel 69, 53121 Bonn, Germanye-mail: [email protected]
2 I.Physikalisches Institut, Universitat zu Koln, Zulpicher Str. 77, 50937 Koln, Germany
Received / Accepted
ABSTRACT
Context. The recent release of the First Fermi-LAT Source Catalog solidified the predominant association of extragalactic γ-rayemitters to active galaxies, in particular blazars. A tight connection between AGN jet kinematics and γ-ray properties has been arguedfor, attributing the energetic emission from active galaxies to their highly relativistic outflows.Aims. We investigate the Caltech-Jodrell Bank flat-spectrum (CJF) sample to study the connection between AGN jet kinematics andtheir γ-ray properties. The high number of sources included in the sample, in addition to the excellent kinematic data available, allowsus to investigate the origin of γ-ray emission in AGN.Methods. We identify the CJF sources detected in γ-rays (by Fermi-LAT and EGRET). We use γ-ray luminosities and the availableVLBI kinematic data to look for correlations between γ-ray and kinematic properties, as well as for differences between AGN classes(quasars, BL Lacs, radio galaxies). We also check the kinematics of the TeV sources in the CJF.Results. 21.8% of the CJF has been detected in the γ-ray regime. We find the detectability of BL Lacs significantly higher comparedto quasars. γ-detected sources show a wider apparent jet velocity distribution compared to the non-detected ones, but the maxima ofboth distributions are at similar values. No strong link between γ-ray detectability and fast apparent jet speeds is found. A tentativecorrelation is found between γ-ray luminosity and maximum apparent jet speeds, stronger for BL Lac and γ-variable sources. We findnon-radial jet motions to be important to γ-ray emission. We suggest two-zone, spine-sheath, models as a possible explanation to ourresults. We find 2 out of 4 CJF TeV sources show superluminal jet speeds, in contrast to previous studies.
Key words. Galaxies: statistics - Galaxies: active - Galaxies: nuclei - Galaxies: jets - Gamma rays: galaxies
1. Introduction
Active galactic nuclei (AGN) are known for their emission overa broad range of the electromagnetic spectrum, reaching up toenergy scales of 1012eV (e.g., Punch et al. 1992; Neshpor et al.1998). This high energy end of the AGN spectrum is most prob-ably created by inverse Compton scattering (either of the in-cident synchrotron photon field, self-scattering (SSC), of pho-tons arising from the accretion disk, or of cosmic microwavebackground) from a population of relativistic electrons in theAGN jets (e.g., Blandford & Icke 1978; Ghisellini et al. 1985;Maraschi et al. 1992; Sikora et al. 1994). Acceleration mech-anisms, including acceleration from electric fields and acceler-ation in shocks, can boost the energy of the electron popula-tion enough so that γ-ray emission can be efficiently producedthrough inverse Compton scattering. The variability observed atthese short wavelengths adds a further layer of complexity (e.g.,Hoyle 1966) and might require special geometrical and physicalconfigurations to be explained (e.g., Georganopoulos et al. 2005;Tavecchio & Ghisellini 2008).
Most γ-ray radiation is shielded away from us by the Earth’satmosphere, except for very high energy (TeV) photons thatproduce atmospheric particle showers that can be detected andanalyzed by Cherenkov telescopes. The launch of γ-ray satel-lites like the Compton γ-ray Observatory satellite (Gehrels
? Member of the International Max Planck Research School (IMPRS)for Astronomy and Astrophysics at the Universities of Bonn andCologne
et al. 1993; carrying the Energetic Gamma Ray ExperimentTelescope, EGRET; Kanbach et al. 1988), the AGILE satel-lite (Tavani et al. 2008), and the Fermi γ-ray Space Telescope(Atwood et al. 2009) allows a detailed study of the γ-ray sky. Inparticular, the Fermi telescope offers the possibility of a contin-uous all-sky monitoring (using the Large Area Telescope, LAT)at much higher resolution and sensitivity than those of previousinstruments. There are 1451 sources included in the first sourcecatalog of the Fermi-LAT (Abdo et al. 2010a), 687 of which areidentified/associated with active galaxies. Of these, 671 Fermi-LAT detected sources at high galactic latitudes (|b| > 10) areincluded in the first catalog of active galactic nuclei (Abdoet al. 2010b), associated with 709 AGN (multiple associationsfor some sources), comprising 300 BL Lac objects, 296 flat-spectrum radio quasars, 41 AGN of other type, and 72 of un-known class.
Of particular interest is the connection between the γ-ray andradio properties of AGN and the possibly common Doppler fac-tor for both the radio and γ-ray emitting particles. The distribu-tion of radio spectral indices of the Fermi-LAT detected AGN isconsistent with a flat spectrum, although a minor tail of steeperspectrum sources exists (see Fig. 28 in Abdo et al. 2010b), indi-cating the dominance of core-dominated sources as γ-ray emit-ters and reflecting the importance of the beaming effect for theproduction of this high-energy emission. The existence of a pop-ulation of steeper spectrum sources, also detected by the Fermi-LAT, implies a more complex link between the γ and radio prop-erties of AGN.
1
arX
iv:1
010.
4882
v2 [
astr
o-ph
.CO
] 2
Feb
201
1
M. Karouzos et al.: γ-rays in flat-spectrum AGN: Revisiting the fast jet hypothesis with the CJF sample
Lister et al. (2009b) study the kinematic properties of the3-month Fermi-LAT detected sources of the MOJAVE sample.The authors find that γ-detected quasars show on average fasterjets than their non-detected counterparts, in agreement with pre-vious studies of EGRET-detected sources showing γ-detectedsources to have preferentially higher Doppler beaming factors(e.g., Jorstad et al. 2001; Kellermann et al. 2004). They also notethat BL Lac sources show on average lower apparent speeds butare nevertheless preferentially detected by Fermi-LAT. They at-tribute this behavior to the spectral shape of BL Lacs and thepossibility that BL Lacs have a higher intrinsic γ-ray to radioluminosity ratio than flat-spectrum QSOs, concluding that theseresults merit further investigation.
We use the Caltech-Jodrell Bank flat-spectrum (CJF; Tayloret al. 1996) sample of radio-loud AGN to test the putative con-nection between the γ-ray properties of AGN and their jet kine-matics, in light of the recent release of the first Fermi-LAT AGNsource catalog (Abdo et al. 2010b) and in the context of the stud-ies mentioned above. The paper is organized as follows: in Sect.2 we describe the CJF sample, in Sect. 3 we present the availabledata, in Sect. 4 the data is analyzed and our results are presented,in Sect. 5 we discuss our results in the context of previous sim-ilar investigations, and we finally offer a summary and our con-clusions in Sect. 6. Throughout the paper, we assume the cos-mological parameters (from the first-year WMAP observations;Spergel et al. 2003) H0 = 71 km s−1 Mpc−1, ΩM = 0.27, andΩΛ = 0.73.
2. The CJF Sample
The CJF sample (Taylor et al. 1996) consists of 293 sourcesselected (see Table 1) from three different samples (for detailssee, Britzen et al. 2007b). The sources span a large redshiftrange (see Fig. 1 in Britzen et al. 2008), with the furthest ob-ject being at a redshift z = 3.889 (1745+624; Hook et al. 1995)and the closest one at z = 0.0108 (1146+596; de Vaucouleurs1991). The average redshift of the sample is zavg = 1.254, withzBLLac,avg = 0.546, zRG,avg = 0.554, and zQS O,avg = 1.489 for BLLac objects, radio galaxies, and quasars, respectively. All the ob-jects have been observed with the VLBA and/or the global VLBInetwork. Each source has at least 3 epochs of observations andhas been imaged and studied kinematically (Britzen et al. 1999;Britzen et al. 2007b; Britzen et al. 2008). The X-ray propertieshave also been studied and correlated with their VLBI properties(Britzen et al. 2007a). Finally, Karouzos et al. (2010) conduct amulti-wavelength study of the CJF in the context of the merger-driven evolution of galaxies.
Table 1. The CJF sample and its properties.
Frequency(MHz) 4850Flux lower limit @5GHz 350mJySpectral Index α4850
1400 ≥ −0.5Declination δ ≥ 35Galactic latitude |b| ≥ 10# Quasars 198# BL Lac 32# Radio Galaxies 52# Unclassified 11# Total 293
The CJF offers an excellent tool to study the kinematics,given its large number of sources and the detailed investigationof the jet kinematics of all these sources. In light of the findingsof Lister et al. (2009b), we are interested in investigating theputative connection between the γ-ray properties of the AGNin our sample and their jet kinematics, utilizing the extensivedatabase of information already at our disposal (Britzen et al.2007b; Britzen et al. 2008; Karouzos et al. 2010c, in prep.). Wewant to disentangle the different effects that might contribute indefining the γ-ray properties of an AGN and assess their relativeimportance. In particular, we want to test whether γ-detectedAGN indeed show faster jets than their non-detected counter-parts. We will also investigate the jet ridge line properties of theγ-detected sources, in relation to those of the non-detected ones(a detailed treatment of the CJF jet ridge lines will be presentedin a separate paper).
3. Data
The CJF sample is a statistically complete sample, under theselection criteria described in Sect. 2. Radio data is thereforeavailable for all the CJF sources, both single dish (at severalfrequencies) and interferometric. In addition, all CJF sourceshave been observed by ROSAT (see Britzen et al. 2007b fordetails). Finally, a substantial number of CJF sources has beenrecently detected in the γ-ray regime by the Fermi-LAT instru-ment. Below we describe the radio and γ-ray data available.
3.1. Radio emission
The CJF sample (Table 1) has been most extensively studied inthe radio regime (e.g., Taylor et al. 1996; Pearson et al. 1998;Britzen et al. 1999; Vermeulen et al. 2003; Pollack et al. 2003;Lowe et al. 2007; Britzen et al. 2007b; Britzen et al. 2007a;Britzen et al. 2008). Britzen et al. (2008) develop a localizedmethod for calculating the bending of the jet associated with in-dividual components. The maximum of the distribution of localangles is at zero degrees, although a substantial fraction showssome bending (0 − 40 degrees). A few sources exhibit sharpbends of the order of > 50 degrees (see Fig. 13 in Britzen et al.2008).
Britzen et al. (2008) present an extensive analysis of the CJFjet kinematics, uniformly analyzing interferometric data for eachCJF source, identifying individual components at each epoch,and studying their kinematic behavior. Although the CJF sampleconsists mostly of blazars, presumably highly beamed sources,the kinematical study of the sample shows a large number ofsources having stationary, subluminal, or, at best, mildly superlu-minal outward velocities (e.g., see Fig. 15 in Britzen et al. 2008).Combined with a number of sources exhibiting inward mov-ing components (e.g., 0600+422, 1751+441, 1543+517, Britzenet al. 2007b), these sources do not fit into the regular paradigm ofoutward, superluminaly moving components in blazar jets. Suchpeculiar kinematic behaviors can be readily explained by geo-metric effects, usually assuming a helical motion pattern com-bined with projection effects (e.g., Zensus et al. 1995; Steffenet al. 1995b; Steffen et al. 1995a; Lobanov & Roland 2005;Roland et al. 2008). Most of the CJF sources exhibit flux vari-ability at different timescales, with several showing indicationsfor quasi-periodicities in their radio lightcurves (see Karouzoset al. 2010 for details).
2
M. Karouzos et al.: γ-rays in flat-spectrum AGN: Revisiting the fast jet hypothesis with the CJF sample
3.2. γ-ray emission
EGRET detected 14 CJF sources and provided an upper limitfor 50 more (Fichtel et al. 1994; Hartman et al. 1999). We notethat, unlike for the radio and the X-rays, the γ-ray study of thissample is not complete since EGRET only did targeted obser-vations of some of the CJF sources. Fermi-LAT (the renamedGLAST; Atwood et al. 2009) will provide a complete study ofthese sources through its all-sky survey. 61 CJF sources are in-cluded in the first catalog of AGN by the Fermi-LAT, after elevenmonths of observation (Abdo et al. 2010b). Three additionalsources are included in the third EGRET catalog (Hartman et al.1999) but have not, as of yet, been detected by Fermi (0804+499,2346+385, and 2351+456).
In total, we find 64 sources (21.8% of the sample) being de-tected in the γ-ray regime, while for 40 (13.6% of the sample)only an upper limit is reported from EGRET. Breaking downthe number of detections, of the 64 γ-detected sources, 24 areclassified as BL Lacs, 32 as quasars, and 5 radio galaxies. One γ-detected source remains unclassified. We mention here that thereare 7 CJF sources detected by Fermi-LAT that have been clas-sified differently by the Fermi-LAT team (see Table A.1). Threeof these sources do not have kinematic data and therefore do notinfluence our result. For the remaining four, we retain the classi-fication of Britzen et al. (2007a). Six CJF sources belong to thegroup of few sources that have been detected in the TeV regime(Table 3).
Of the 61 CJF sources already detected by Fermi-LAT (TableA.1) we note that half of them are found to be γ-variable. In total,31 sources (10.6%) have been detected to be variable. We notefor the following analysis we only use real detections, excludingupper limits information.
It should be noted that both the inclusion of a source in theLAT catalog, as well as a source being flagged as variable, de-pends on a number of factors, the combination of which makethe catalog incomplete. The flux of a source (both in radio and γ-rays), its spectral shape, and its position on the sky (e.g., near thegalactic plane) influence its possible association with an AGN.Moreover, as has already been noted in Abdo et al. (2010b), inorder for a source to be classified as variable it needs to have suf-ficiently high γ-flux. Subsequent catalogs will surely improveupon the current associations and consequentially increase thenumber of γ-bright AGN.
4. Analysis
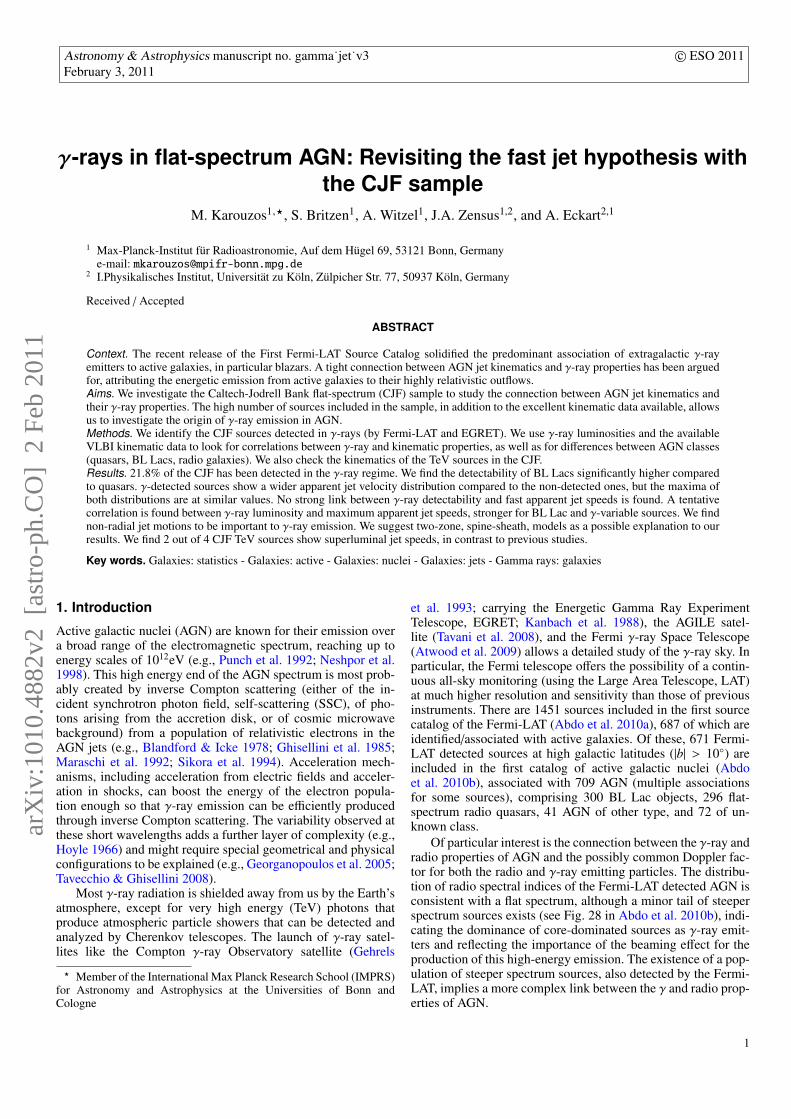
As we described in the previous sections, we are interested ininvestigating a possible link between jet kinematics and γ-rayproperties in the CJF sample. There are a couple of points thatshould be addressed before we do that. A first effect concernsthe redshift distribution of our sources. Quasars show a redshiftdistribution peaking around z=1.3, while BL Lacs maximum isaround z=0.2. In Fig. 1 we show the redshift distribution of theCJF sources detected in γ-rays. The distribution follows the dis-tribution of the sample, with the highest γ-detected source atredshift z = 3.044. Secondly, the CJF sample contains predomi-nantly quasars, with only a few percent of the sample being BLLac objects and radio galaxies. This is a result of the selectioncriteria of the sample. 75% of the CJF BL Lacs have been de-tected by Fermi-LAT, while only 17% of the QSOs and 9.6% ofthe RGs are included in the first year AGN catalog of the tele-scope (Abdo et al. 2010b). Taking into account the number ofQSOs at z < 1 (56 sources), we get a γ-ray detectability of 16%
for the CJF quasars, as expected, significantly lower than BLLacs.
0 0.7 1.4 2.1 2.8 3.5z
0
4
8
12
16
N
Radio GalaxiesQuasarsBL Lacs
Fig. 1. Redshift distribution of the Fermi-LAT detected (1stCatalog; Abdo et al. 2010b) CJF sources. The three differ-ent classes of AGN are shown: BL Lacs (dashed empty line),quasars (continuous empty line), and radio galaxies (continuousfilled line).
4.1. γ-ray luminosities
γ-ray observations are based on photon counts per energy bin,unit surface, and unit time for each source. We are interestedin translating the photon fluxes (at the energy interval of 1-100 GeV) to luminosities, in order to account for the distancedependence. We follow Thompson et al. (1996) to calculate γ-ray luminosities as follows: assuming an energy range (E1, E2),then the integral photon flux is described as,
F(∆E) =
∫ E2
E1
AE−αdE,
where A is a normalization constant that can be expressed interms of the integral flux F and α is the spectral index. For theFermi-LAT instrument, a nominal value of 1-100 GeV is usedfor the energy range probed. Then, the energy flux is calculatedfrom the following formula:
S (∆E) =1 − α2 − α
·E2−α
2 − E2−α1
E1−α2 − E1−α
1
F,
where F is the photon flux, the directly observed quantity (mea-sured in photon counts per unit surface and time), and S is theenergy flux (measured in ergs per unit surface and time). We usethe median photon indices given in Abdo et al. (2010b) for eachsource. It should be noted that, within this energy range, a breakin the spectrum might exist. This would lead to an overestima-tion of the luminosity, especially for the QSO sub-sample (e.g.,Abdo et al. 2010c).
Having calculated the sources luminosities, we can calculateaverage and median values for our sample (shown in Table 2. Itshould be noted that comparison of average and median valuesfor non-Gaussian distributions is problematic. For the sake ofcontinuation and uniformity with previous studies of the sametopic we calculate both average and median values, although it
3
M. Karouzos et al.: γ-rays in flat-spectrum AGN: Revisiting the fast jet hypothesis with the CJF sample
should be seen as only indicative and interpreted in tandem withresults from statistical tests like the K-S or Student’s test.
Taking into account only QSOs at redshifts smaller than z=1,we can calculate the average and median values (assuming a nor-mal distribution for the samples studied here, the uncertainty forthe median values is calculated as 1.253 of the standard error ofthe mean) for this sub-sample (47.09±0.11 and 47.19±0.14erg,respectively; the values are given in the log (νLν) form). It canbe seen that QSOs are consistently more luminous than the BLLacs.
Table 2. Characteristic statistic values concerning the γ-ray lu-minosity (in logarithmic scale, measured in erg/s) of the CJFsources detected in the γ-ray regime by Fermi-LAT.
log (νLν)γ All QSO BL Var Non-VarAll z < 1
# 51 31 9 14 30 21Average 47.26 47.45 46.09 46.32 47.41 46.83Error 0.07 0.09 0.11 0.13 0.09 0.09Median 46.63 46.91 47.19 45.44 46.73 46.60Error 0.09 0.11 0.14 0.16 0.11 0.11Max 48.58 48.58 47.50 47.15 48.58 47.64Min 43.67 45.33 45.33 43.67 43.89 43.67
Notes. We use the flux between 1 and 100 GeV to calculate the γ-rayluminosity. We give average and values with uncertainties, maximum,and minimum values for the whole sub-sample, QSOs, QSOs at z < 1,BL Lacs, variable, and non-variable sources. Given the small numberof RGs (5 sources) detected, we do not calculate separate statistics forthat sub-sample.
The luminosity of a source at longer wavelengths might playa role in deciding its γ-ray properties. To that end, we com-pare the luminosities of the γ-detected and non-detected QSOs atz < 1, at 5 and 30 GHz (single dish), at optical (V band), and inthe soft X-rays data from Britzen et al. 2007b, Taylor et al. 1996,and references therein). The γ-detected sources are consistentlymore luminous in the radio and optical regime, but are fainter inthe X-rays. As was described previously, up to soft X-rays theemission is thought to be produced by the synchrotron mech-anism and therefore γ-detected sources show a stronger syn-chrotron component than their non-detected counterparts. Thismight in turn be linked to the putative inverse Compton processusually employed to explain the production of γ-ray emission inAGN jets. Conversely, γ-ray detection of a source implies thatthe inverse Compton hump of its SED is shifted towards higherenergies, compared to non-detected sources. It is therefore to beexpected that γ-detected sources are actually weaker in the softX-rays than their non-detected counterparts. A larger sample ofγ-detected sources, along with a closely matched (in terms ofluminosity and redshift) control sample is required to test thisscenario.
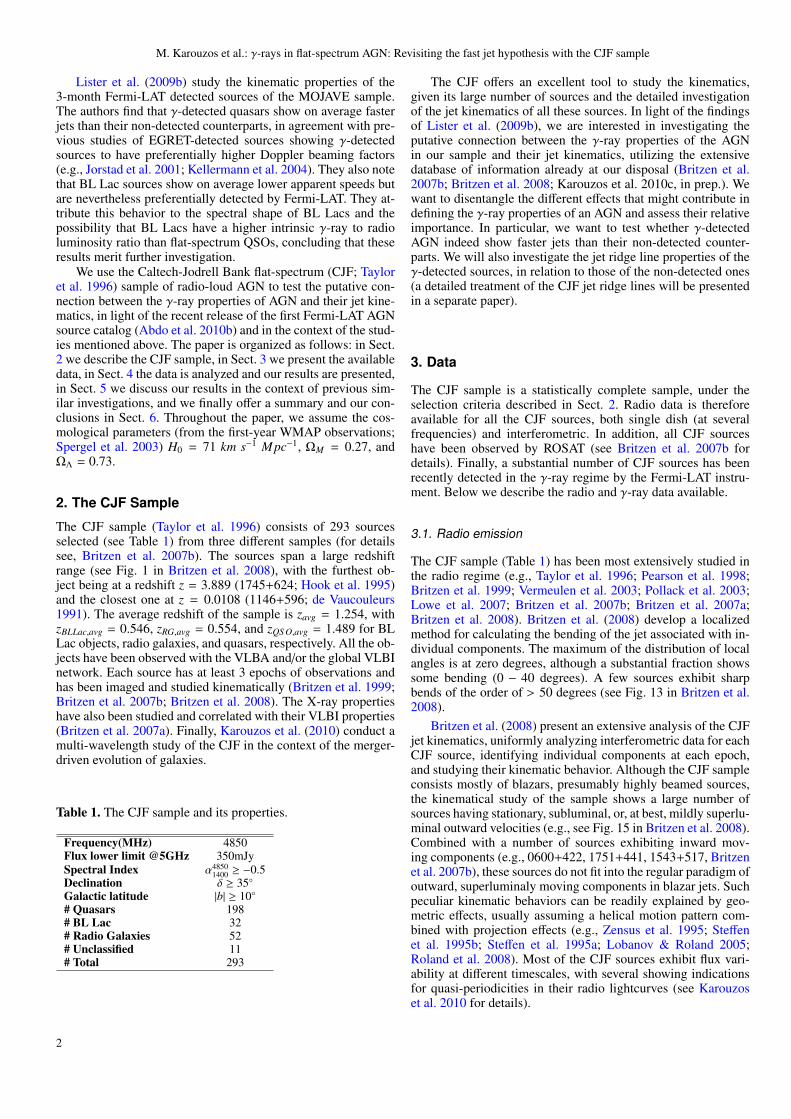
Concerning the relative importance of the synchrotron andinverse Compton components, we calculate the γ-to-radio lumi-nosity ratio for the γ-detected CJF sources (see Fig. 2).
In Fig. 2 we show the distribution of this ratio for quasarsand BL Lacs (including both variable and non-variable sources).It can be seen that BL Lacs show marginally higher γ-to-radioratios than quasars, with the BL Lac distribution peaking around1.075 compared to the quasar one peaking around 1.055. Thefact that we include both variable and non-variable sources
1.04 1.05 1.06 1.07 1.08 1.09
logLγ /logL5GHz
0
1
2
3
4
5
6
7
8
N
QuasarsBL Lacs
Fig. 2. Histogram comparing the distributions of γ-to-radio lu-minosity ratios for BL Lacs and QSOs. We use γ-ray luminosi-ties derived from the Fermi-LAT photon fluxes given in the firstFermi-LAT source catalog (Abdo et al. 2010a) and radio lumi-nosities at 5 GHz derived from single dish energy fluxes fromTaylor et al. (1996).
might influence our results. Given the observational bias thatsources classified as γ-variable are on average brighter than thenon-variable ones and that there are more variable BL Lacs thannon-variable ones, the effect observed in Fig. 2 might in part bedue to the same observational bias discussed previously. A twosample K-S test for BL Lacs and quasars is inconclusive at towhether their γ-to-radio radio distributions are drawn from dif-ferent parent distributions. An obvious caveat of this comparisonis that γ and radio observations are not contemporaneous.
4.2. Apparent VLBI Jet Component Velocities and γ-rayemission
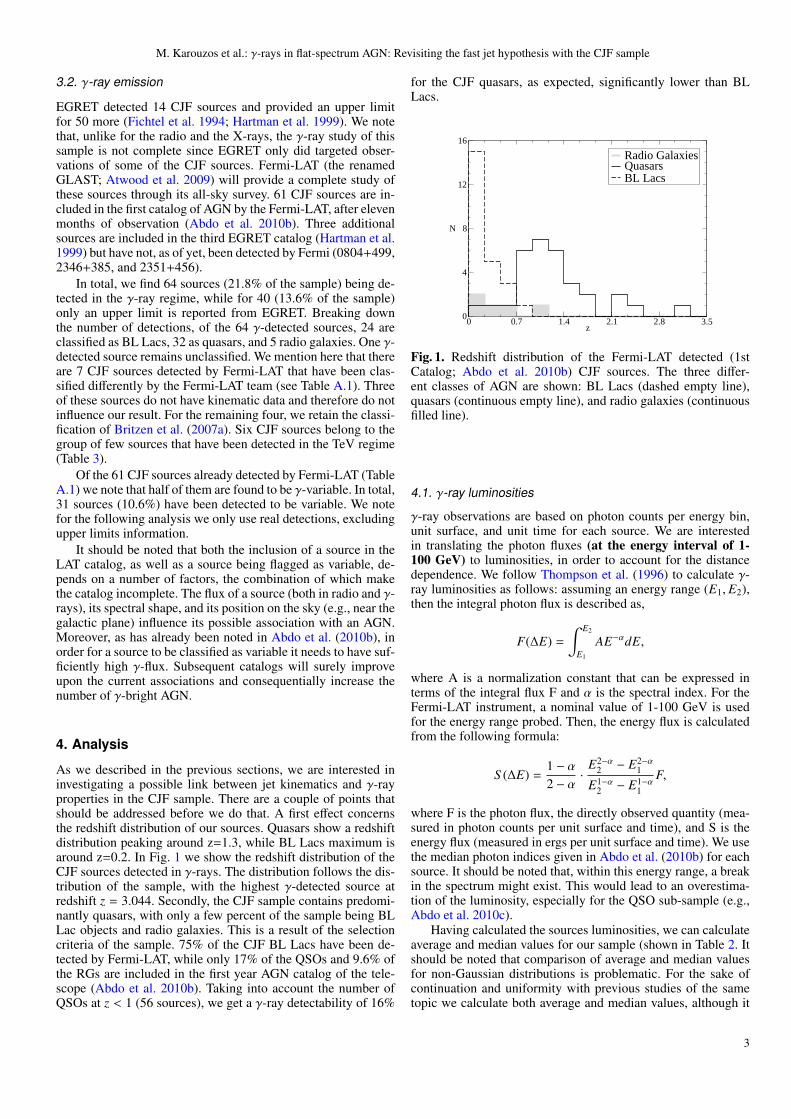
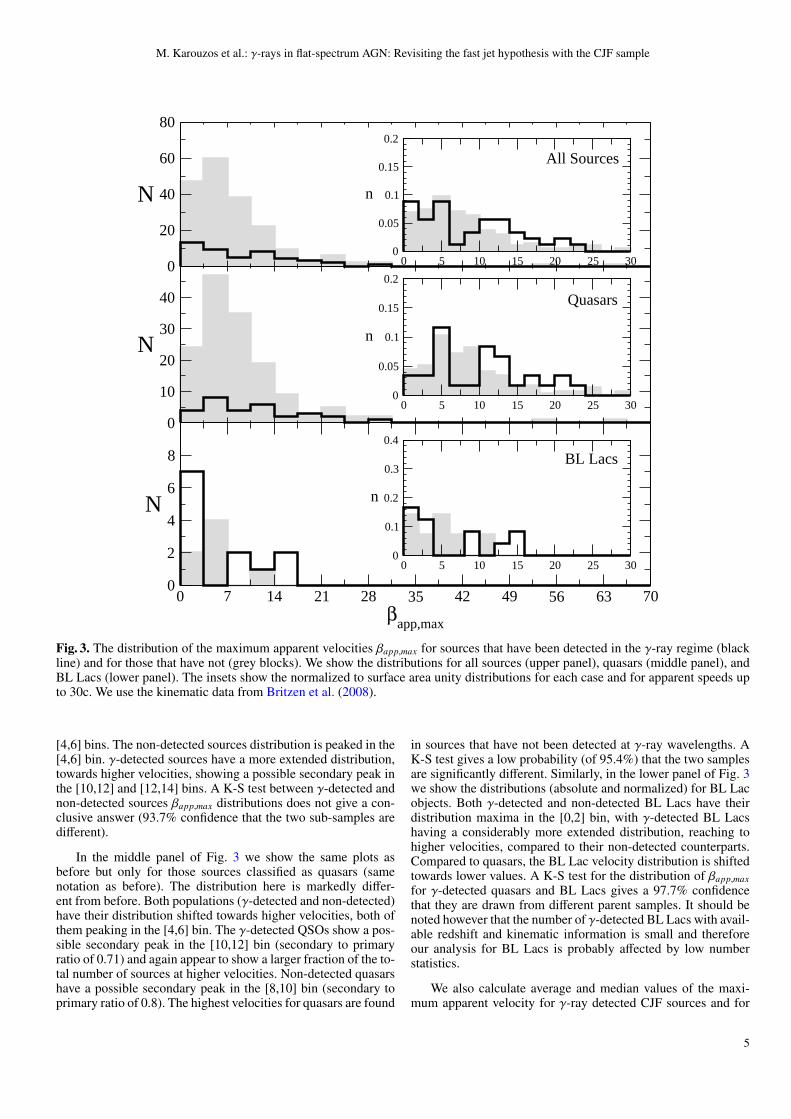
We characterize the kinematics of the CJF sources by the max-imum observed component velocity, βapp,max, of each source.This maximum component velocity depends on both the orien-tation of the source (viewing angle) and the intrinsic propertiesof the jet itself. We investigate whether the distribution of maxi-mum apparent component speeds differs between γ-detected andnon-detected sources. For all CJF sources with available redshift,Britzen et al. (2008) have calculated the apparent total compo-nent velocities for all the identified components in their VLBIjets. We identify the component with the maximum apparentspeed in each source and we plot the distribution of these max-imum apparent speeds in Fig. 3, for γ-detected sources (blackline) and non-detected ones (grey blocks).
In the upper panel of Fig. 3, we plot the distribution of themaximum apparent velocities for the 191 CJF sources that havenot been detected at γ-ray wavelengths (grey blocks) and the 45sources that have (black line). The maximum of the distributionfor the non-detections is found in the [3.5,7] bin. For the detec-tions the maximum lies in the [0,3.5] bin. As can be seen in theinset of the upper panel (inset plots are normalized to surfacearea one, as we are interested in the relative distributions of thetwo sub-samples), assuming smaller bins, the maximum of theγ-detected sources breaks down to two maxima in the [0,2] and
4
M. Karouzos et al.: γ-rays in flat-spectrum AGN: Revisiting the fast jet hypothesis with the CJF sample
0
20
40
60
80
N
0
10
20
30
40
N
0 5 10 15 20 25 300
0.05
0.1
0.15
0.2
n
0 5 10 15 20 25 300
0.05
0.1
0.15
0.2
n
0 7 14 21 28 35 42 49 56 63 70β
app,max
0
2
4
6
8
N
0 5 10 15 20 25 300
0.1
0.2
0.3
0.4
n
All Sources
Quasars
BL Lacs
Fig. 3. The distribution of the maximum apparent velocities βapp,max for sources that have been detected in the γ-ray regime (blackline) and for those that have not (grey blocks). We show the distributions for all sources (upper panel), quasars (middle panel), andBL Lacs (lower panel). The insets show the normalized to surface area unity distributions for each case and for apparent speeds upto 30c. We use the kinematic data from Britzen et al. (2008).
[4,6] bins. The non-detected sources distribution is peaked in the[4,6] bin. γ-detected sources have a more extended distribution,towards higher velocities, showing a possible secondary peak inthe [10,12] and [12,14] bins. A K-S test between γ-detected andnon-detected sources βapp,max distributions does not give a con-clusive answer (93.7% confidence that the two sub-samples aredifferent).
In the middle panel of Fig. 3 we show the same plots asbefore but only for those sources classified as quasars (samenotation as before). The distribution here is markedly differ-ent from before. Both populations (γ-detected and non-detected)have their distribution shifted towards higher velocities, both ofthem peaking in the [4,6] bin. The γ-detected QSOs show a pos-sible secondary peak in the [10,12] bin (secondary to primaryratio of 0.71) and again appear to show a larger fraction of the to-tal number of sources at higher velocities. Non-detected quasarshave a possible secondary peak in the [8,10] bin (secondary toprimary ratio of 0.8). The highest velocities for quasars are found
in sources that have not been detected at γ-ray wavelengths. AK-S test gives a low probability (of 95.4%) that the two samplesare significantly different. Similarly, in the lower panel of Fig. 3we show the distributions (absolute and normalized) for BL Lacobjects. Both γ-detected and non-detected BL Lacs have theirdistribution maxima in the [0,2] bin, with γ-detected BL Lacshaving a considerably more extended distribution, reaching tohigher velocities, compared to their non-detected counterparts.Compared to quasars, the BL Lac velocity distribution is shiftedtowards lower values. A K-S test for the distribution of βapp,maxfor γ-detected quasars and BL Lacs gives a 97.7% confidencethat they are drawn from different parent samples. It should benoted however that the number of γ-detected BL Lacs with avail-able redshift and kinematic information is small and thereforeour analysis for BL Lacs is probably affected by low numberstatistics.
We also calculate average and median values of the maxi-mum apparent velocity for γ-ray detected CJF sources and for
5
M. Karouzos et al.: γ-rays in flat-spectrum AGN: Revisiting the fast jet hypothesis with the CJF sample
those not detected (9.0±0.8 and 8.8±1.0, compared to 8.1±0.4and 6.4 ± 0.5, respectively). A Student’s t-test is inconclusive(49% for the null hypothesis). A further note concerns the red-shift distribution of the two sub-samples. The γ-detected sourceshave a lower average redshift (0.967) compared to their non-detected counterparts (1.175). It is known that there appearsto be a dependence between apparent velocity and redshift (asnoted by Cohen et al. 2007; Britzen et al. 2008; Lister et al.2009a; Karouzos et al. 2010c, in prep.). This effect reinforcesthe difference in average and median values seen between γ-detected and non-detected sources and implies that γ-detectedsources indeed have higher maximum apparent velocities.
Finally, for the γ-ray detected sources, we distinguish be-tween quasars and BL Lac objects. We find that quasars exhibitconsiderably higher average and median maximum apparent ve-locities (10.8 ± 1.0 and 10.2 ± 1.2, respectively, compared to6.1 ± 1.5 and 2.9 ± 1.9). Redshift effects might again be influ-encing our results. We select those QSOs at redshifts lower than1 and calculate βapp,max average and median values. We find thatthe sub-sample of local QSOs shows, within the statistical errors,the same average values as the BL Lacs (6.9± 1.2) but consider-ably higher median value (6.1 ± 1.5).
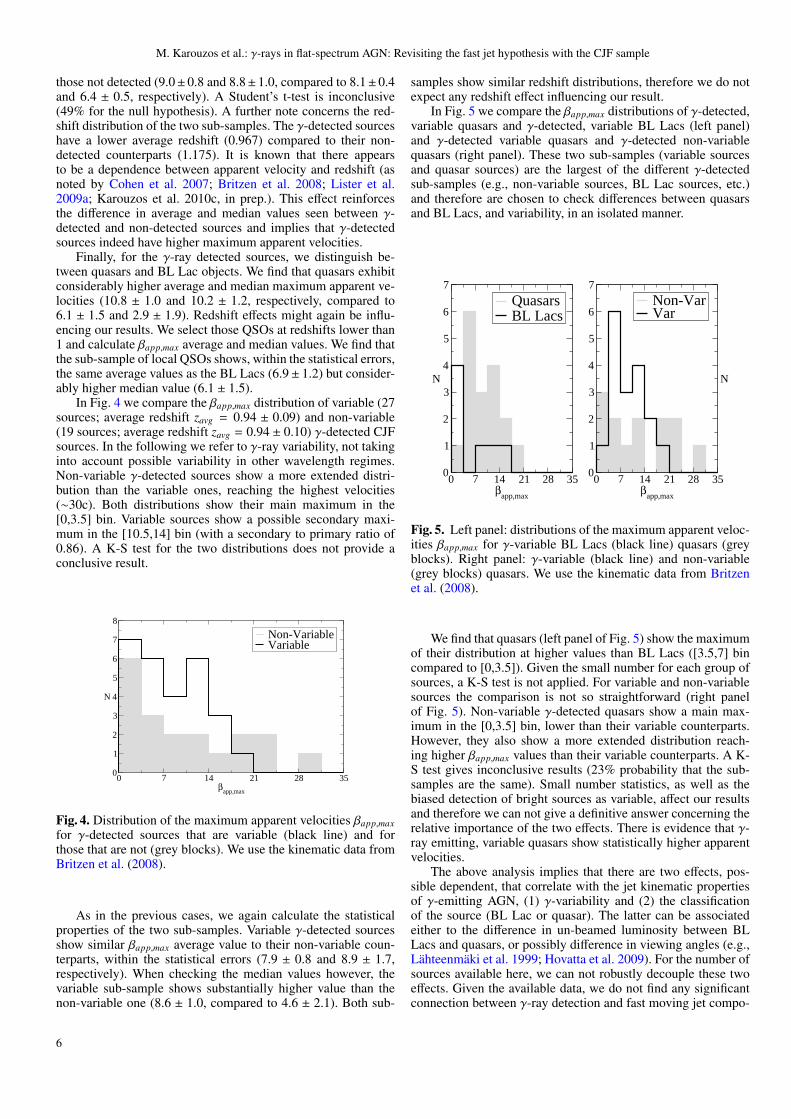
In Fig. 4 we compare the βapp,max distribution of variable (27sources; average redshift zavg = 0.94 ± 0.09) and non-variable(19 sources; average redshift zavg = 0.94 ± 0.10) γ-detected CJFsources. In the following we refer to γ-ray variability, not takinginto account possible variability in other wavelength regimes.Non-variable γ-detected sources show a more extended distri-bution than the variable ones, reaching the highest velocities(∼30c). Both distributions show their main maximum in the[0,3.5] bin. Variable sources show a possible secondary maxi-mum in the [10.5,14] bin (with a secondary to primary ratio of0.86). A K-S test for the two distributions does not provide aconclusive result.
0 7 14 21 28 35β
app,max
0
1
2
3
4
5
6
7
8
N
Non-VariableVariable
Fig. 4. Distribution of the maximum apparent velocities βapp,maxfor γ-detected sources that are variable (black line) and forthose that are not (grey blocks). We use the kinematic data fromBritzen et al. (2008).
As in the previous cases, we again calculate the statisticalproperties of the two sub-samples. Variable γ-detected sourcesshow similar βapp,max average value to their non-variable coun-terparts, within the statistical errors (7.9 ± 0.8 and 8.9 ± 1.7,respectively). When checking the median values however, thevariable sub-sample shows substantially higher value than thenon-variable one (8.6 ± 1.0, compared to 4.6 ± 2.1). Both sub-
samples show similar redshift distributions, therefore we do notexpect any redshift effect influencing our result.
In Fig. 5 we compare the βapp,max distributions of γ-detected,variable quasars and γ-detected, variable BL Lacs (left panel)and γ-detected variable quasars and γ-detected non-variablequasars (right panel). These two sub-samples (variable sourcesand quasar sources) are the largest of the different γ-detectedsub-samples (e.g., non-variable sources, BL Lac sources, etc.)and therefore are chosen to check differences between quasarsand BL Lacs, and variability, in an isolated manner.
0 7 14 21 28 35β
app,max
0
1
2
3
4
5
6
7
N
QuasarsBL Lacs
0 7 14 21 28 35β
app,max
0
1
2
3
4
5
6
7
N
Non-VarVar
Fig. 5. Left panel: distributions of the maximum apparent veloc-ities βapp,max for γ-variable BL Lacs (black line) quasars (greyblocks). Right panel: γ-variable (black line) and non-variable(grey blocks) quasars. We use the kinematic data from Britzenet al. (2008).
We find that quasars (left panel of Fig. 5) show the maximumof their distribution at higher values than BL Lacs ([3.5,7] bincompared to [0,3.5]). Given the small number for each group ofsources, a K-S test is not applied. For variable and non-variablesources the comparison is not so straightforward (right panelof Fig. 5). Non-variable γ-detected quasars show a main max-imum in the [0,3.5] bin, lower than their variable counterparts.However, they also show a more extended distribution reach-ing higher βapp,max values than their variable counterparts. A K-S test gives inconclusive results (23% probability that the sub-samples are the same). Small number statistics, as well as thebiased detection of bright sources as variable, affect our resultsand therefore we can not give a definitive answer concerning therelative importance of the two effects. There is evidence that γ-ray emitting, variable quasars show statistically higher apparentvelocities.
The above analysis implies that there are two effects, pos-sible dependent, that correlate with the jet kinematic propertiesof γ-emitting AGN, (1) γ-variability and (2) the classificationof the source (BL Lac or quasar). The latter can be associatedeither to the difference in un-beamed luminosity between BLLacs and quasars, or possibly difference in viewing angles (e.g.,Lahteenmaki et al. 1999; Hovatta et al. 2009). For the number ofsources available here, we can not robustly decouple these twoeffects. Given the available data, we do not find any significantconnection between γ-ray detection and fast moving jet compo-
6
M. Karouzos et al.: γ-rays in flat-spectrum AGN: Revisiting the fast jet hypothesis with the CJF sample
nents, as has been argued by other authors. We rather see thatthe βapp,max distribution is more strongly dependent on the typeof object, i.e., BL Lac or quasar classification (see Sect. 5 for adiscussion on this).
4.3. γ-ray Luminosities and Apparent Jet ComponentVelocities
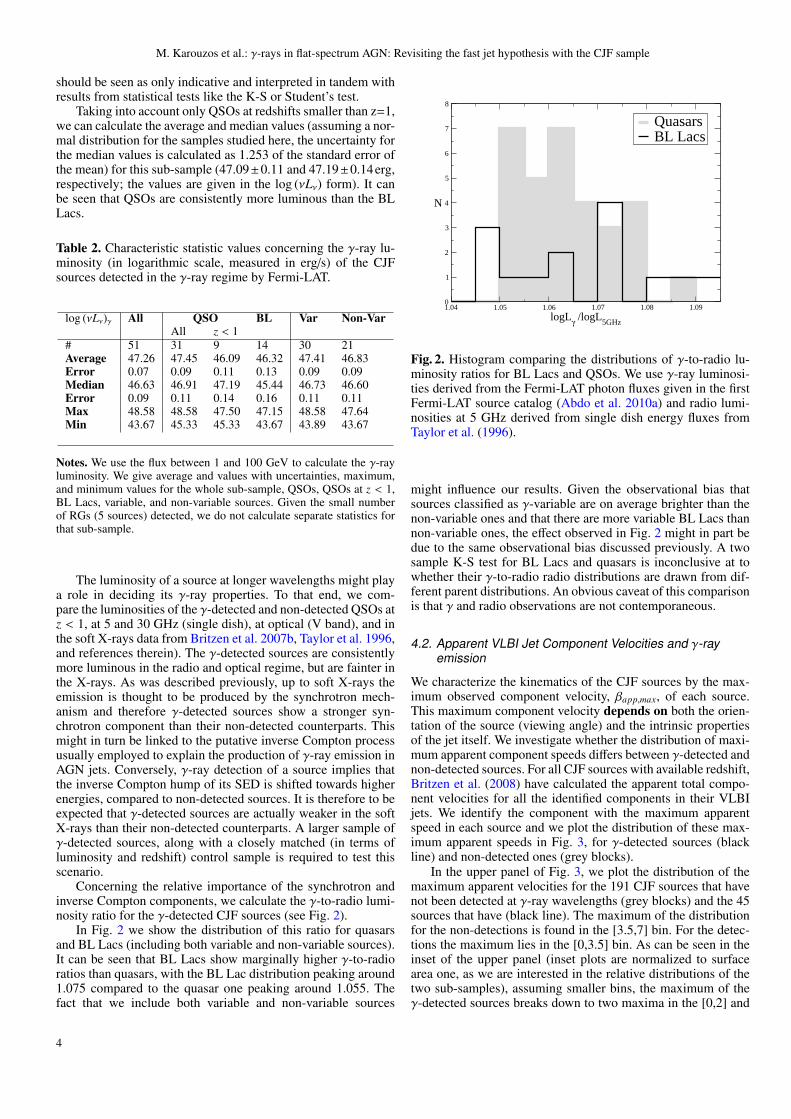
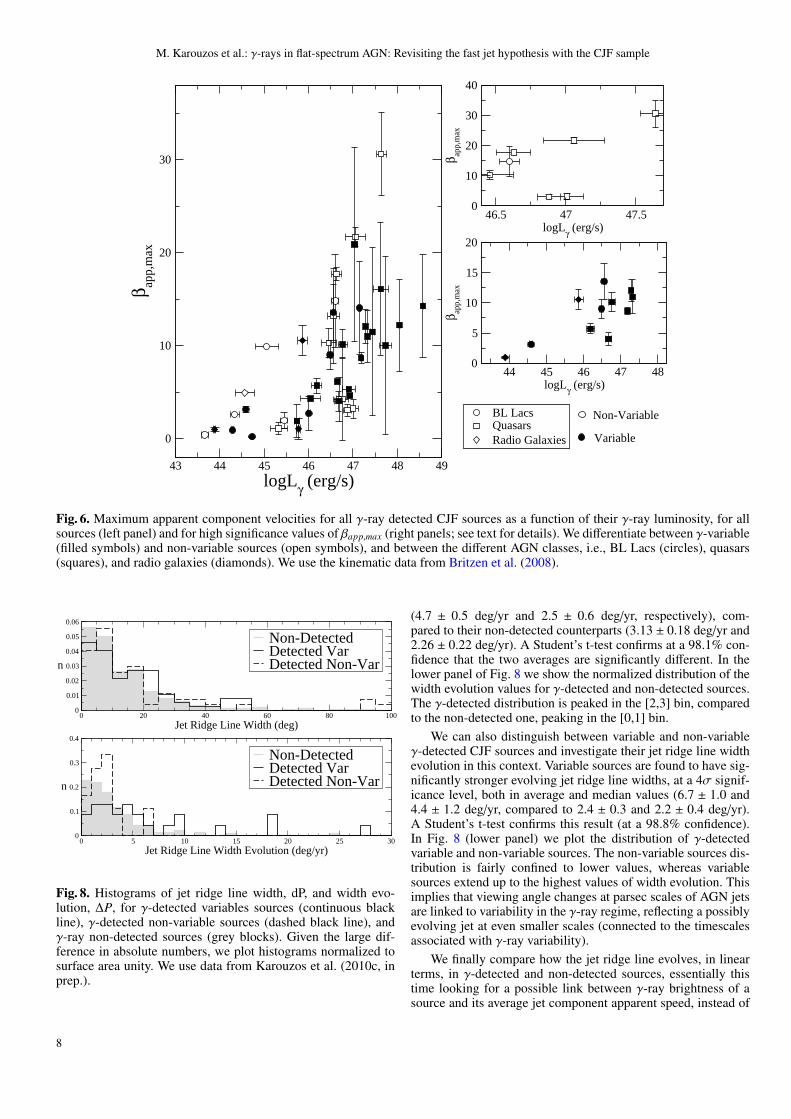
In the previous section we probed the putative connection be-tween the apparent brightness of γ-rays and the jet kinematics-i.e., the beaming mechanism-, as reflected in the differences be-tween the βapp,max distribution of quasars and BL Lacs. Anotherway to approach this is by looking for a possible direct correla-tion between the apparent velocities measured in the AGN jetsand their γ-ray luminosity. This is shown in Fig. 6.
As can be seen in Fig. 6, there appears to exist a correla-tion between the βapp,max of a source and its γ-ray luminosity.Variable sources appear to cluster closer to the implied trend,with non-variable QSOs deviating the most. We find Spearmancorrelation coefficients of 0.68 and 0.77 (both at a significanceof > 99.999%), respectively. Given the mutual dependence ofluminosity and jet component apparent velocity to the redshiftof a source, we also calculate the Pearson product moment par-tial correlation coefficients r(Lγ βapp,max,z)1. While for the wholesample we get a relatively low partial correlation coefficient(0.43 at a significance of 99.8%), the correlation for variablesources persists (0.68 at a significance of > 99.9%). Given theexpected degree of scatter in the data, the correlation coefficientscombined with the calculated significance imply that the trendseen in Fig. 6 is indeed true. We note that some of the appar-ent velocities show relatively large errors, therefore, in the rightpanels of Fig. 6, we plot only sources for which βapp,max ≥ 3σ.We also separate variable sources from non-variable ones. It be-comes clear that the non-variable sources show the most scatter.For the variable sources, we calculate a Spearman correlationcoefficient of 0.69 (at a 99.1% significance level), lower thanthe coefficient we got when fitting all the sources. Calculatingthe partial correlation coefficient for the same sub-sample givesa smaller correlation coefficient (0.61 at a 98.1% significance).We also investigate the same correlation for individual classes ofobjects. The strongest correlations are seen for both γ-variableBL Lacs (partial correlation coefficient of 0.68 at 95.1% sig-nificance) and quasars (partial correlation coefficient of 0.69 at99.9% significance). The differences seen between the differentclasses of AGN, as well as between variable and non-variablesources reveal a complicated picture. We shall discuss the ro-bustness and implications of our results more extensively in Sect.5.
4.4. γ-ray and jet ridge line properties
The currently accepted paradigm for the jet kinematics of flat-spectrum sources (i.e., core-dominated AGN) includes superlu-minaly outward moving components, usually interpreted in thecontext of a specific projected geometry combined with relativis-tic effects, due to the intrinsically high speeds of the bulk flow.Recent detailed kinematic studies of the parsec-scale jets of BLLac objects (e.g., 1803+784, Britzen et al. 2010a; 0716+714,Britzen et al. 2009; 0735+178, Britzen et al. 2010b) have how-
1 For this we use the Web tool: Wessa P., (2008), PartialCorrelation (v1.0.4) in Free Statistics Software (v1.1.23-r6), Office for Research Development and Education, URLhttp://www.wessa.net/rwasp partialcorrelation.wasp/.
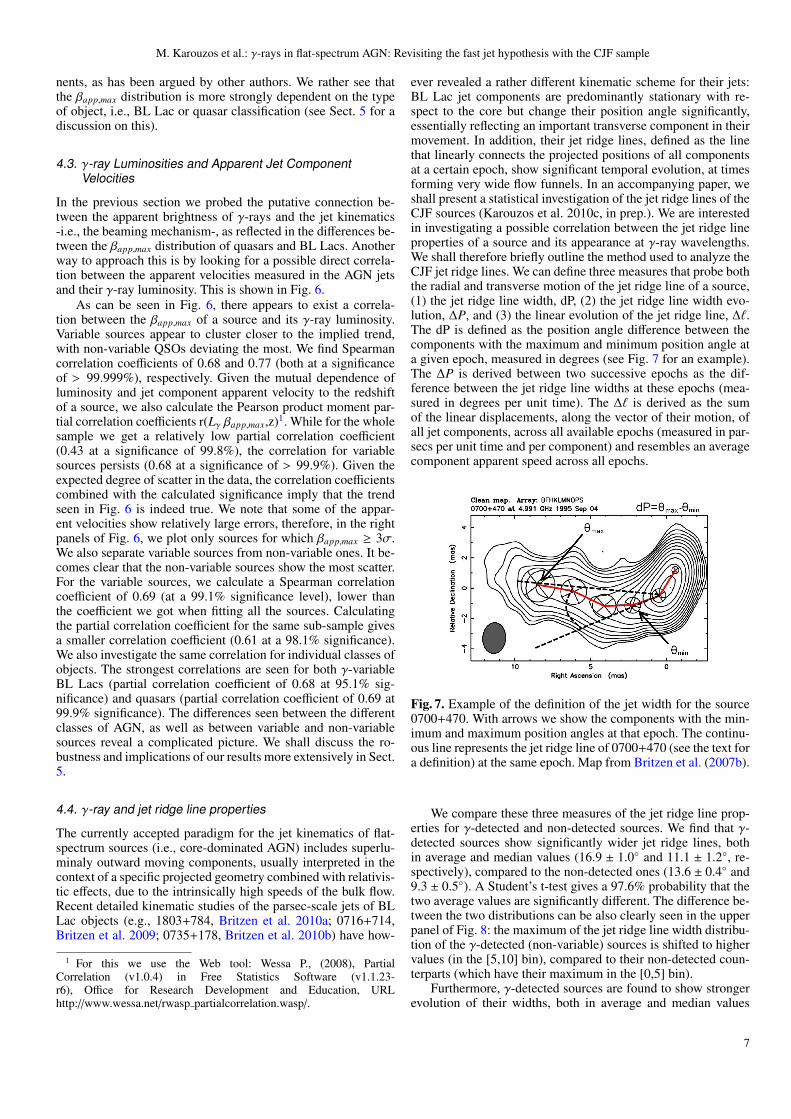
ever revealed a rather different kinematic scheme for their jets:BL Lac jet components are predominantly stationary with re-spect to the core but change their position angle significantly,essentially reflecting an important transverse component in theirmovement. In addition, their jet ridge lines, defined as the linethat linearly connects the projected positions of all componentsat a certain epoch, show significant temporal evolution, at timesforming very wide flow funnels. In an accompanying paper, weshall present a statistical investigation of the jet ridge lines of theCJF sources (Karouzos et al. 2010c, in prep.). We are interestedin investigating a possible correlation between the jet ridge lineproperties of a source and its appearance at γ-ray wavelengths.We shall therefore briefly outline the method used to analyze theCJF jet ridge lines. We can define three measures that probe boththe radial and transverse motion of the jet ridge line of a source,(1) the jet ridge line width, dP, (2) the jet ridge line width evo-lution, ∆P, and (3) the linear evolution of the jet ridge line, ∆`.The dP is defined as the position angle difference between thecomponents with the maximum and minimum position angle ata given epoch, measured in degrees (see Fig. 7 for an example).The ∆P is derived between two successive epochs as the dif-ference between the jet ridge line widths at these epochs (mea-sured in degrees per unit time). The ∆` is derived as the sumof the linear displacements, along the vector of their motion, ofall jet components, across all available epochs (measured in par-secs per unit time and per component) and resembles an averagecomponent apparent speed across all epochs.
Fig. 7. Example of the definition of the jet width for the source0700+470. With arrows we show the components with the min-imum and maximum position angles at that epoch. The continu-ous line represents the jet ridge line of 0700+470 (see the text fora definition) at the same epoch. Map from Britzen et al. (2007b).
We compare these three measures of the jet ridge line prop-erties for γ-detected and non-detected sources. We find that γ-detected sources show significantly wider jet ridge lines, bothin average and median values (16.9 ± 1.0 and 11.1 ± 1.2, re-spectively), compared to the non-detected ones (13.6 ± 0.4 and9.3 ± 0.5). A Student’s t-test gives a 97.6% probability that thetwo average values are significantly different. The difference be-tween the two distributions can be also clearly seen in the upperpanel of Fig. 8: the maximum of the jet ridge line width distribu-tion of the γ-detected (non-variable) sources is shifted to highervalues (in the [5,10] bin), compared to their non-detected coun-terparts (which have their maximum in the [0,5] bin).
Furthermore, γ-detected sources are found to show strongerevolution of their widths, both in average and median values
7
M. Karouzos et al.: γ-rays in flat-spectrum AGN: Revisiting the fast jet hypothesis with the CJF sample
43 44 45 46 47 48 49
logLγ (erg/s)
0
10
20
30
β app,
max
BL LacsQuasarsRadio Galaxies
46.5 47 47.5logLγ (erg/s)
0
10
20
30
40
β app,
max
44 45 46 47 48logLγ (erg/s)
0
5
10
15
20
β app,
max
Non-Variable
Variable
Fig. 6. Maximum apparent component velocities for all γ-ray detected CJF sources as a function of their γ-ray luminosity, for allsources (left panel) and for high significance values of βapp,max (right panels; see text for details). We differentiate between γ-variable(filled symbols) and non-variable sources (open symbols), and between the different AGN classes, i.e., BL Lacs (circles), quasars(squares), and radio galaxies (diamonds). We use the kinematic data from Britzen et al. (2008).
0 20 40 60 80 100
Jet Ridge Line Width (deg)
0
0.01
0.02
0.03
0.04
0.05
0.06
n
Non-DetectedDetected VarDetected Non-Var
0 5 10 15 20 25 30
Jet Ridge Line Width Evolution (deg/yr)
0
0.1
0.2
0.3
0.4
n
Non-DetectedDetected VarDetected Non-Var
Fig. 8. Histograms of jet ridge line width, dP, and width evo-lution, ∆P, for γ-detected variables sources (continuous blackline), γ-detected non-variable sources (dashed black line), andγ-ray non-detected sources (grey blocks). Given the large dif-ference in absolute numbers, we plot histograms normalized tosurface area unity. We use data from Karouzos et al. (2010c, inprep.).
(4.7 ± 0.5 deg/yr and 2.5 ± 0.6 deg/yr, respectively), com-pared to their non-detected counterparts (3.13 ± 0.18 deg/yr and2.26 ± 0.22 deg/yr). A Student’s t-test confirms at a 98.1% con-fidence that the two averages are significantly different. In thelower panel of Fig. 8 we show the normalized distribution of thewidth evolution values for γ-detected and non-detected sources.The γ-detected distribution is peaked in the [2,3] bin, comparedto the non-detected one, peaking in the [0,1] bin.
We can also distinguish between variable and non-variableγ-detected CJF sources and investigate their jet ridge line widthevolution in this context. Variable sources are found to have sig-nificantly stronger evolving jet ridge line widths, at a 4σ signif-icance level, both in average and median values (6.7 ± 1.0 and4.4 ± 1.2 deg/yr, compared to 2.4 ± 0.3 and 2.2 ± 0.4 deg/yr).A Student’s t-test confirms this result (at a 98.8% confidence).In Fig. 8 (lower panel) we plot the distribution of γ-detectedvariable and non-variable sources. The non-variable sources dis-tribution is fairly confined to lower values, whereas variablesources extend up to the highest values of width evolution. Thisimplies that viewing angle changes at parsec scales of AGN jetsare linked to variability in the γ-ray regime, reflecting a possiblyevolving jet at even smaller scales (connected to the timescalesassociated with γ-ray variability).
We finally compare how the jet ridge line evolves, in linearterms, in γ-detected and non-detected sources, essentially thistime looking for a possible link between γ-ray brightness of asource and its average jet component apparent speed, instead of
8
M. Karouzos et al.: γ-rays in flat-spectrum AGN: Revisiting the fast jet hypothesis with the CJF sample
the maximum apparent speed. As we already discussed previ-ously, the redshift distributions of the two sub-samples are fairlysimilar. We do not expect therefore any redshift-induced effects,related to linear distances, to influence our results. We find thatboth in average and median values, the two sub-samples showsimilar values of linear evolution (0.47 ± 0.03 and 0.40 ± 0.04pc/yr/comp, respectively, for the γ-detected sources, comparedto 0.440 ± 0.020 and 0.377 ± 0.025 pc/yr/comp for the non-detected ones).
The same behavior is seen when comparing between γ-detected variable and non-variable sources. It should be notedhowever, that the median value for γ-detected variable sources isfairly higher than the one for non-variable sources (0.43 ± 0.04pc/yr/comp compared to 0.291±0.025 pc/yr/comp, respectively).This discrepancy between average and median values implies alarge scattering within our data that might be posing some limi-tations to the robustness of our results. Aside from that, we con-firm our finding from before, i.e., that the link between fast ap-parent jet speeds and the γ-ray detectability of a source is ques-tionable. It appears that, although there are certainly indicationsthat higher speed sources are preferentially γ-ray emitters, someother effect might play a more important role in defining theγ-ray properties of a source. Our results concerning the widthand width evolution comparison between γ-detected and non-detected sources imply that non-radial motion -i.e., motion trans-verse to the jet symmetry axis- is important with regard to γ-rayproduction. This is probably tightly connected to the viewing an-gle effect, also presumably reflected in the kinematic differencesbetween different AGN types.
4.5. TeV sources
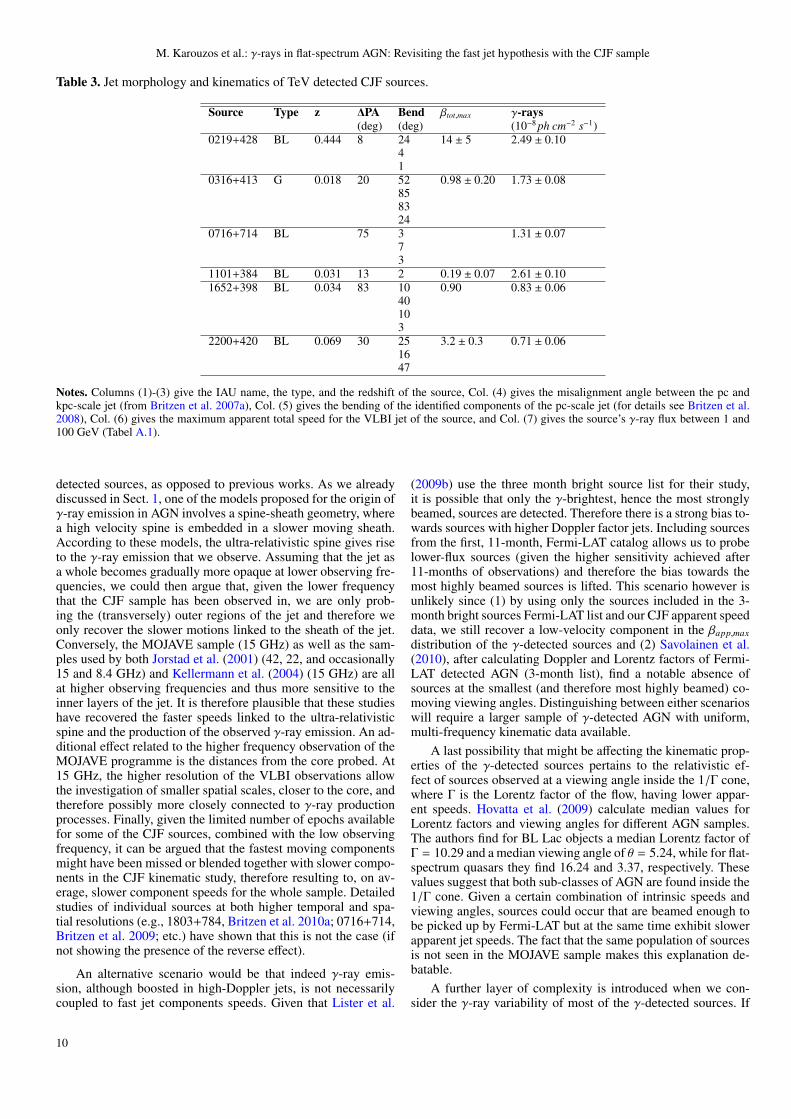
28 extragalactic sources have been identified to be emitters in theTeV regime (for an updated list of these sources and references,see http://tevcat.uchicago.edu/). Six CJF sources (5 BL Lac ob-jects, 1 radio galaxy) are observed and detected in TeV. All arevariable in γ-rays and optical, five in the infrared, while five ofthem are variable in radio and four in the X-rays.
Extremely high energetic photons coming from AGN (TeVsources, see Table A.1) can be a result of several different mech-anisms, some of them taking place in the AGN jets (for a dis-cussion on high energy γ-ray emission from AGN see e.g., vonMontigny et al. 1995). We check the kinematics of the TeVsources in the CJF (Table 3; data from Britzen et al. 2008). Wegive the misalignment angle between the parsec and the kilo-parsec scale (as calculated by Britzen et al. 2007a). We alsolist the bending of the parsec scale jet (as calculated by Britzenet al. 2008) for all identified components. Finally we give themaximum apparent total jet component speed, βapp,max. We findno apparent correlation between the bending of the jet and theγ-ray flux. 2 out of 5 sources exhibit superluminal motion intheir VLBI jets. Previous studies of TeV emitting high-frequencypeaked BL Lacs exhibit slow jet speeds (e.g., Piner et al. 2008;Britzen et al. 2009). 0219+428 and 2200+420 do not belong tothat category of objects.
5. Discussion
It is interesting to compare our results with similar studies usingdifferent samples of AGN. As we already mentioned in Sect. 1,a number of authors have claimed a close connection betweenγ-ray bright AGN and large βapp,max (e.g., Jorstad et al. 2001;Kellermann et al. 2004; Lister et al. 2009b). Lister et al. (2009b),in particular, examine the kinematic properties of the MOJAVE
sources (Lister et al. 2009a) in light of the, then recently, pub-lished 3-month bright AGN Fermi-LAT list. In short, they findthat (1) the γ-detected MOJAVE quasars have the peak of theirβapp,max distribution around 10-15c, quite a higher value com-pared to the non-detected ones (∼5c). They also find that (2) γ-variable sources show higher apparent speeds. Finally, althoughBL Lacs in their sample have lower redshifts and slow medianjet speeds (6c), (3) they are preferentially detected by Fermi-LAT. Similarly to Lister et al. (2009b), Jorstad et al. (2001) andKellermann et al. (2004) also conclude that γ-detected AGNhave significantly higher apparent speeds than their non-detectedcounterparts.
The results presented here are somewhat different. Althoughwe do find a possible secondary maximum around 10-15c for theγ-detected sources, the primary maximum of both distributionsappears to be around 5c, with γ-detected sources actually show-ing a double maximum in the [0,2] and [4,6] bins. The βapp,maxdistribution of the sources is more strongly dependent on theclassification of the source as a quasar or a BL Lac, and whetherthe source appears variable, rather than it being detected at γ-ray wavelengths. Given the larger number of sources in the CJF,unlike Lister et al. (2009a), we can treat the different AGN pop-ulation separately. In particular, as we showed in the previoussection, quasars show higher apparent jet speeds than BL Lacs,regardless of their γ-ray properties. A common feature for γ-detected sources is that their βapp,max distribution appears moreextended, with larger percentage of the sources at higher speeds,compared to those of non-detected sources. Coming to point (2)-i.e., that γ-variable sources show higher apparent jet speeds-our results agree, as we showed for the case of variable andnon-variable γ-detected quasars. However this does not comeas a surprise in light of our recent findings from the statisticalanalysis of the CJF jet ridge lines. In short, we find that vari-able sources (throughout the electromagnetic spectrum) showstronger linear evolution of their jet ridge lines, a measure essen-tially reflecting their apparent jet speeds (Karouzos et al. 2010,in prep.). Therefore, the higher apparent speeds of γ-detectedvariable sources can probably be linked to the variability, ratherthan to the γ-ray brightness itself.
Finally, concerning point (3), we also find that BL Lac ob-jects are preferentially detected by Fermi-LAT, even after cor-recting for the different redshift distribution of quasars and BLLacs. Lister et al. (2009b) argue that BL Lacs might be preferen-tially detected by Fermi-LAT because of their flatter spectrum,i.e., their higher γ-to-radio ratio, compared to quasars. As wasshown in Sect. 4.1, this is indeed true.
A further point of interest, that has not so far been inves-tigated, concerns the apparent correlation seen between the γ-ray luminosity of a source and its maximum apparent jet speed.As we showed in Fig. 6 such a correlation exists, with vari-able sources falling closer to the implied trend. We need to con-template whether the inclusion of more sources with potentiallylower γ-ray luminosities would destroy this correlation. Lookingat the CJF sources not yet detected by Fermi-LAT, 35 of themshow significant (> 3σ) apparent speeds above 10c, while only10 show speeds larger than 20c. Of these 10 sources only 3 areclassified as high quality component fits (see Britzen et al. 2008for details). Together with the high median redshift of the high-speed γ non-detected CJF sources, the above suggest that thecorrelation seen in Fig. 6 is robust.
Although our results are generally in agreement with previ-ous studies, there are some differences that merit further inter-pretation. Of particular interest is the fact that we do not finda strong connection between fast moving components and γ-
9
M. Karouzos et al.: γ-rays in flat-spectrum AGN: Revisiting the fast jet hypothesis with the CJF sample
Table 3. Jet morphology and kinematics of TeV detected CJF sources.
Source Type z ∆PA Bend βtot,max γ-rays(deg) (deg) (10−8 ph cm−2 s−1)
0219+428 BL 0.444 8 24 14 ± 5 2.49 ± 0.1041
0316+413 G 0.018 20 52 0.98 ± 0.20 1.73 ± 0.08858324
0716+714 BL 75 3 1.31 ± 0.0773
1101+384 BL 0.031 13 2 0.19 ± 0.07 2.61 ± 0.101652+398 BL 0.034 83 10 0.90 0.83 ± 0.06
40103
2200+420 BL 0.069 30 25 3.2 ± 0.3 0.71 ± 0.061647
Notes. Columns (1)-(3) give the IAU name, the type, and the redshift of the source, Col. (4) gives the misalignment angle between the pc andkpc-scale jet (from Britzen et al. 2007a), Col. (5) gives the bending of the identified components of the pc-scale jet (for details see Britzen et al.2008), Col. (6) gives the maximum apparent total speed for the VLBI jet of the source, and Col. (7) gives the source’s γ-ray flux between 1 and100 GeV (Tabel A.1).
detected sources, as opposed to previous works. As we alreadydiscussed in Sect. 1, one of the models proposed for the origin ofγ-ray emission in AGN involves a spine-sheath geometry, wherea high velocity spine is embedded in a slower moving sheath.According to these models, the ultra-relativistic spine gives riseto the γ-ray emission that we observe. Assuming that the jet asa whole becomes gradually more opaque at lower observing fre-quencies, we could then argue that, given the lower frequencythat the CJF sample has been observed in, we are only prob-ing the (transversely) outer regions of the jet and therefore weonly recover the slower motions linked to the sheath of the jet.Conversely, the MOJAVE sample (15 GHz) as well as the sam-ples used by both Jorstad et al. (2001) (42, 22, and occasionally15 and 8.4 GHz) and Kellermann et al. (2004) (15 GHz) are allat higher observing frequencies and thus more sensitive to theinner layers of the jet. It is therefore plausible that these studieshave recovered the faster speeds linked to the ultra-relativisticspine and the production of the observed γ-ray emission. An ad-ditional effect related to the higher frequency observation of theMOJAVE programme is the distances from the core probed. At15 GHz, the higher resolution of the VLBI observations allowthe investigation of smaller spatial scales, closer to the core, andtherefore possibly more closely connected to γ-ray productionprocesses. Finally, given the limited number of epochs availablefor some of the CJF sources, combined with the low observingfrequency, it can be argued that the fastest moving componentsmight have been missed or blended together with slower compo-nents in the CJF kinematic study, therefore resulting to, on av-erage, slower component speeds for the whole sample. Detailedstudies of individual sources at both higher temporal and spa-tial resolutions (e.g., 1803+784, Britzen et al. 2010a; 0716+714,Britzen et al. 2009; etc.) have shown that this is not the case (ifnot showing the presence of the reverse effect).
An alternative scenario would be that indeed γ-ray emis-sion, although boosted in high-Doppler jets, is not necessarilycoupled to fast jet components speeds. Given that Lister et al.
(2009b) use the three month bright source list for their study,it is possible that only the γ-brightest, hence the most stronglybeamed, sources are detected. Therefore there is a strong bias to-wards sources with higher Doppler factor jets. Including sourcesfrom the first, 11-month, Fermi-LAT catalog allows us to probelower-flux sources (given the higher sensitivity achieved after11-months of observations) and therefore the bias towards themost highly beamed sources is lifted. This scenario however isunlikely since (1) by using only the sources included in the 3-month bright sources Fermi-LAT list and our CJF apparent speeddata, we still recover a low-velocity component in the βapp,maxdistribution of the γ-detected sources and (2) Savolainen et al.(2010), after calculating Doppler and Lorentz factors of Fermi-LAT detected AGN (3-month list), find a notable absence ofsources at the smallest (and therefore most highly beamed) co-moving viewing angles. Distinguishing between either scenarioswill require a larger sample of γ-detected AGN with uniform,multi-frequency kinematic data available.
A last possibility that might be affecting the kinematic prop-erties of the γ-detected sources pertains to the relativistic ef-fect of sources observed at a viewing angle inside the 1/Γ cone,where Γ is the Lorentz factor of the flow, having lower appar-ent speeds. Hovatta et al. (2009) calculate median values forLorentz factors and viewing angles for different AGN samples.The authors find for BL Lac objects a median Lorentz factor ofΓ = 10.29 and a median viewing angle of θ = 5.24, while for flat-spectrum quasars they find 16.24 and 3.37, respectively. Thesevalues suggest that both sub-classes of AGN are found inside the1/Γ cone. Given a certain combination of intrinsic speeds andviewing angles, sources could occur that are beamed enough tobe picked up by Fermi-LAT but at the same time exhibit slowerapparent jet speeds. The fact that the same population of sourcesis not seen in the MOJAVE sample makes this explanation de-batable.
A further layer of complexity is introduced when we con-sider the γ-ray variability of most of the γ-detected sources. If
10

M. Karouzos et al.: γ-rays in flat-spectrum AGN: Revisiting the fast jet hypothesis with the CJF sample
the γ-ray emission from AGN is of transient nature, related toa relativistic shock propagating down the pc-scale jet, this im-plies that many sources are missed from such an investigation,simply because they are observed during their quiescent state. Inaddition to this, the non-contemporaneity of the kinematic andγ-ray data introduces further noise to plots like Figs. 3 and 6. Atpresent we can not sidestep these two caveats.
The last point that needs to be discussed concerns the con-nection between the jet ridge line width to the γ-ray propertiesof a source. Pushkarev et al. (2009) study the jet opening an-gles of the MOJAVE sample again in the context of the 3-monthbright source list of the Fermi-LAT. The authors find that γ-bright sources have larger apparent opening angles, but in theirco-moving frame both γ-bright and faint sources show similaropening angle distributions. This is in turn interpreted as evi-dence that γ-detected sources are seen at smaller viewing anglesthan the non-detected ones. Our results agree with these findings,as we find that γ-detected sources exhibit wider jet ridge linescompared to their non-detected counterparts. It should howeverbe noted that preferential detection of BL Lacs at γ-ray wave-lengths combined with our results from the statistical analysis ofthe CJF jet ridge lines (i.e., that BL Lacs have apparently widerjet ridge lines; Karouzos et al. 2010c, in prep.) might introducea spurious effect in such an analysis. It is also interesting to notethat, according to our findings from Sect. 4, γ-detected sourcesalso exhibit large changes in their jet ridge line widths, largerthan the non-detected ones. That would introduce a noise factorwhen comparing the width distributions of γ-detected and non-detected sources. This in turn implies that γ-detected sourcesmight in reality be even wider than inferred by the distributionshown in Fig. 8.
It is interesting to contemplate on how a two-zone modelmight accommodate for the apparently important non-radialcomponent of the component trajectories, as implied by thesignificantly larger jet ridge line width evolution shown by γ-detected sources. A helical structure of AGN jets combined withthe smaller viewing angles expected for γ-bright sources mightoffer a plausible explanation. Such a geometry has been used toexplain non-ballistic trajectories for a number of AGN jets (e.g.,3C345, Steffen et al. 1995b; 1803+784, Steffen et al. 1995a;1633+382, Liu et al. 2010). One could speculate that a heli-cally structured sheath, enclosing an ultra-relativistic (straight)spine flow, could give rise to the kinematic behavior observed inthe CJF sources, while explaining the γ-ray properties of thesesources. Given the still small number of available CJF sourcesdetected by Fermi-LAT, it is, for the time being, not possible todecouple and assess the individual importance of these effects.
6. Conclusions
In the previous sections we have investigated the connection ofthe γ-ray properties of the CJF sources to the morphologic andkinematic properties of their jets. In summary we find:
– 21.8% of the CJF sample is detected at γ-ray wavelengths(either from EGRET or the Fermi-LAT; three EGRET asso-ciations not included in the 11 month catalog)
– BL Lacs appear to be preferentially detected in the γ-rayregime. Taking into account the difference of the redshift dis-tributions of QSOs and BL Lacs in our sample, we still getfairly different detection ratios between the two classes (16%and 75%, respectively).
– after calculating the γ-ray luminosities of both QSOs and BLLacs, and taking into account the redshift effects of our flux-
limited sample, we find that QSOs appear more luminous atγ-ray wavelengths than BL Lacs.
– γ-detected sources (regardless of classification) show thepeak of their βapp,max distribution at similar values as theirnon-detected counterparts but show a more extended distri-bution towards higher jet component speeds. A K-S test re-sults in an inconclusive answer, giving a 93.7% confidencethat the two sub-samples are significantly different.
– when considering QSOs and BL Lacs separately, we still findthat γ-detected and non-detected sources show fairly simi-lar distributions, with γ-detected sources showing more ex-tended distributions towards higher values.
– comparing between γ-detected QSOs and BL Lacs, after ac-counting for redshift effects, both sub-samples show on av-erage and within statistical errors the same apparent speeds.
– we find a tentative correlation between βapp,max and γ-ray lu-minosity. The correlation is stronger for BL Lac objects andfor γ-variable sources, with non-variable QSOs deviating themost from the implied trend.
– we find that γ-detected sources have significantly wider jetridge lines than their non-detected counterparts. We also findthat γ-detected sources show stronger jet ridge line widthevolution than non-detected ones.
– we find no significant difference in terms of linear evolutionof the jet ridge lines between γ-detected and non-detectedsources.
– we find no direct link between highly bent jets and TeV emis-sion. Furthermore, we note that 2 out of 4 TeV CJF sourceswith βapp,max information show superluminal speeds, unlikeprevious studies.
From our analysis it becomes clear that there is a numberof factors influencing whether a source is luminous in the γ-rayregime or not. Although it is tempting to think in terms of γ-loudand quiet objects, the picture is surely more complicated. As hasbeen recently demonstrated for the radio divide (radio-loud andradio-quiet objects) there is a number of sources that actuallyseem to populate an intermediate space, implying a rather con-tinuous distribution. It is possible that with more sensitive γ-raytelescopes a greater number of γ-ray emitting sources will be re-covered. Of course the question still remains as to what it is thatdifferentiates the γ-quiet (or -faint) sources from those alreadydetected by the Fermi-LAT and EGRET missions. Our analysis,combined with previous studies on this question, indicates thatthe viewing angle and γ-variability are what make some sourcesto be γ-ray luminous and others not. However, as has been shownby Savolainen et al. (2010), the picture may be more complicatedthan that. Given the relatively weak link between jet apparentspeeds and γ-detected sources that we find in this work, as wellas the different picture arising at higher observing frequencies,a spine-sheath configuration scenario could offer a plausible ex-planation, where the most energetic emission - coming from anultra-relativistic flow- originates in the spine of the AGN outflowand is therefore partly or fully obscured at lower observing fre-quencies. Finally, the link between the width and width evolutionof the jet ridge lines of our sources to their γ-ray properties im-plies that transverse, non-radial, motions in the jet might be im-portant in this context, probably also related to the γ-variabilitydetected for almost half of the γ-detected AGN in our sample.It is obvious that a larger sample of γ-detected AGN with com-plete, multi-frequency kinematic data will allow us to investi-gate the above effects in a more robust manner. Furthermore,the investigation of both individual objects and statistical sam-ples (like the CJF and the MOJAVE, e.g., Chang et al. 2010;
11

M. Karouzos et al.: γ-rays in flat-spectrum AGN: Revisiting the fast jet hypothesis with the CJF sample
Chang et al. 2010, in prep.) with detailed modeling of their SEDswill surely shed light to the actual processes producing the γ-rayemission.
Acknowledgements. M. Karouzos was supported for this research through astipend from the International Max Planck Research School (IMPRS) forAstronomy and Astrophysics. The authors thank the anonymous referee forhelpful suggestions that have improved this paper. M.K. wants to also thankTuomas Savolainen and Mar Mezcua for insightful discussions and commentsthat significantly improved this manuscript. This research has made use ofthe NASA/IPAC Extragalactic Database (NED) which is operated by the JetPropulsion Laboratory, California Institute of Technology, under contract withthe National Aeronautics and Space Administration. This research has made useof NASA’s Astrophysics Data System Bibliographic Services.
ReferencesAbdo, A. A., Ackermann, M., Ajello, M., et al. 2010a, ApJ, 715, 429Abdo, A. A., Ackermann, M., Ajello, M., et al. 2010b, ApJ, 715, 429Abdo, A. A., Ackermann, M., Ajello, M., et al. 2010c, ApJ, 710, 1271Atwood, W. B., Abdo, A. A., Ackermann, M., et al. 2009, ApJ, 697, 1071Blandford, R. D. & Icke, V. 1978, MNRAS, 185, 527Britzen, S., Brinkmann, W., Campbell, R. M., et al. 2007a, A&A, 476, 759Britzen, S., Kam, V. A., Witzel, A., et al. 2009, A&A, 508, 1205Britzen, S., Kudryavtseva, N. A., Witzel, A., et al. 2010a, A&A, 511, A57+Britzen, S., Vermeulen, R. C., Campbell, R. M., et al. 2008, A&A, 484, 119Britzen, S., Vermeulen, R. C., Taylor, G. B., et al. 2007b, A&A, 472, 763Britzen, S., Vermeulen, R. C., Taylor, G. B., et al. 1999, in Astronomical Society
of the Pacific Conference Series, Vol. 159, BL Lac Phenomenon, ed. L. O.Takalo & A. Sillanpaa, 431–+
Britzen, S., Witzel, A., Gong, B. P., et al. 2010b, ArXiv e-printsChang, C. S., Ros, E., Kadler, M., et al. 2010, ArXiv e-printsCohen, M. H., Lister, M. L., Homan, D. C., et al. 2007, ApJ, 658, 232de Vaucouleurs, G. 1991, Science, 254, 1667Fichtel, C. E., Bertsch, D. L., Chiang, J., et al. 1994, ApJS, 94, 551Gehrels, N., Chipman, E., & Kniffen, D. A. 1993, A&AS, 97, 5Georganopoulos, M., Perlman, E. S., & Kazanas, D. 2005, ApJ, 634, L33Ghisellini, G., Maraschi, L., & Treves, A. 1985, A&A, 146, 204Hartman, R. C., Bertsch, D. L., Bloom, S. D., et al. 1999, ApJS, 123, 79Hook, I. M., McMahon, R. G., Patnaik, A. R., et al. 1995, MNRAS, 273, L63+Hovatta, T., Valtaoja, E., Tornikoski, M., & Lahteenmaki, A. 2009, A&A, 494,
527Hoyle, F. 1966, Nature, 209, 751Jorstad, S. G., Marscher, A. P., Mattox, J. R., et al. 2001, ApJ, 556, 738Kanbach, G., Bertsch, D. L., Fichtel, C. E., et al. 1988, Space Science Reviews,
49, 69Karouzos, M., Britzen, S., Eckart, A., Witzel, A., & Zensus, A. 2010, ArXiv
e-printsKellermann, K. I., Lister, M. L., Homan, D. C., et al. 2004, ApJ, 609, 539Lahteenmaki, A., Valtaoja, E., & Wiik, K. 1999, ApJ, 511, 112Lister, M. L., Aller, H. D., Aller, M. F., et al. 2009a, AJ, 137, 3718Lister, M. L., Homan, D. C., Kadler, M., et al. 2009b, ApJ, 696, L22Liu, Y., Jiang, D. R., & Shen, Z. 2010, ArXiv e-printsLobanov, A. P. & Roland, J. 2005, A&A, 431, 831Lowe, S. R., Gawronski, M. P., Wilkinson, P. N., et al. 2007, A&A, 474, 1093Maraschi, L., Ghisellini, G., & Celotti, A. 1992, ApJ, 397, L5Neshpor, Y. I., Stepanyan, A. A., Kalekin, O. P., et al. 1998, Astronomy Letters,
24, 134Pearson, T. J., Browne, I. W. A., Henstock, D. R., et al. 1998, in Astronomical
Society of the Pacific Conference Series, Vol. 144, IAU Colloq. 164: RadioEmission from Galactic and Extragalactic Compact Sources, ed. J. A. Zensus,G. B. Taylor, & J. M. Wrobel, 17–+
Piner, B. G., Pant, N., & Edwards, P. G. 2008, ApJ, 678, 64Pollack, L. K., Taylor, G. B., & Zavala, R. T. 2003, ApJ, 589, 733Punch, M., Akerlof, C. W., Cawley, M. F., et al. 1992, Nature, 358, 477Pushkarev, A. B., Kovalev, Y. Y., Lister, M. L., & Savolainen, T. 2009, A&A,
507, L33Roland, J., Britzen, S., Kudryavtseva, N. A., Witzel, A., & Karouzos, M. 2008,
A&A, 483, 125Savolainen, T., Homan, D. C., Hovatta, T., et al. 2010, A&A, 512, A24+Sikora, M., Begelman, M. C., & Rees, M. J. 1994, ApJ, 421, 153Spergel, D. N., Verde, L., Peiris, H. V., et al. 2003, ApJS, 148, 175Steffen, W., Krichbaum, T. P., Britzen, S., & Witzel, A. 1995a, in The
XXVIIth Young European Radio Astronomers Conference, ed. D. A. Green& W. Steffen, 29–+
Steffen, W., Zensus, J. A., Krichbaum, T. P., Witzel, A., & Qian, S. J. 1995b,A&A, 302, 335
Tavani, M., Barbiellini, G., Argan, A., et al. 2008, Nuclear Instruments andMethods in Physics Research A, 588, 52
Tavecchio, F. & Ghisellini, G. 2008, ArXiv e-printsTaylor, G. B., Vermeulen, R. C., Readhead, A. C. S., et al. 1996, ApJS, 107, 37Thompson, D. J., Bertsch, D. L., Dingus, B. L., et al. 1996, ApJS, 107, 227Vermeulen, R. C., Britzen, S., Taylor, G. B., et al. 2003, in Astronomical Society
of the Pacific Conference Series, Vol. 300, Radio Astronomy at the Fringe,ed. J. A. Zensus, M. H. Cohen, & E. Ros, 43–+
von Montigny, C., Bertsch, D. L., Chiang, J., et al. 1995, ApJ, 440, 525Zensus, J. A., Cohen, M. H., & Unwin, S. C. 1995, ApJ, 443, 35
12
M. Karouzos et al.: γ-rays in flat-spectrum AGN: Revisiting the fast jet hypothesis with the CJF sample
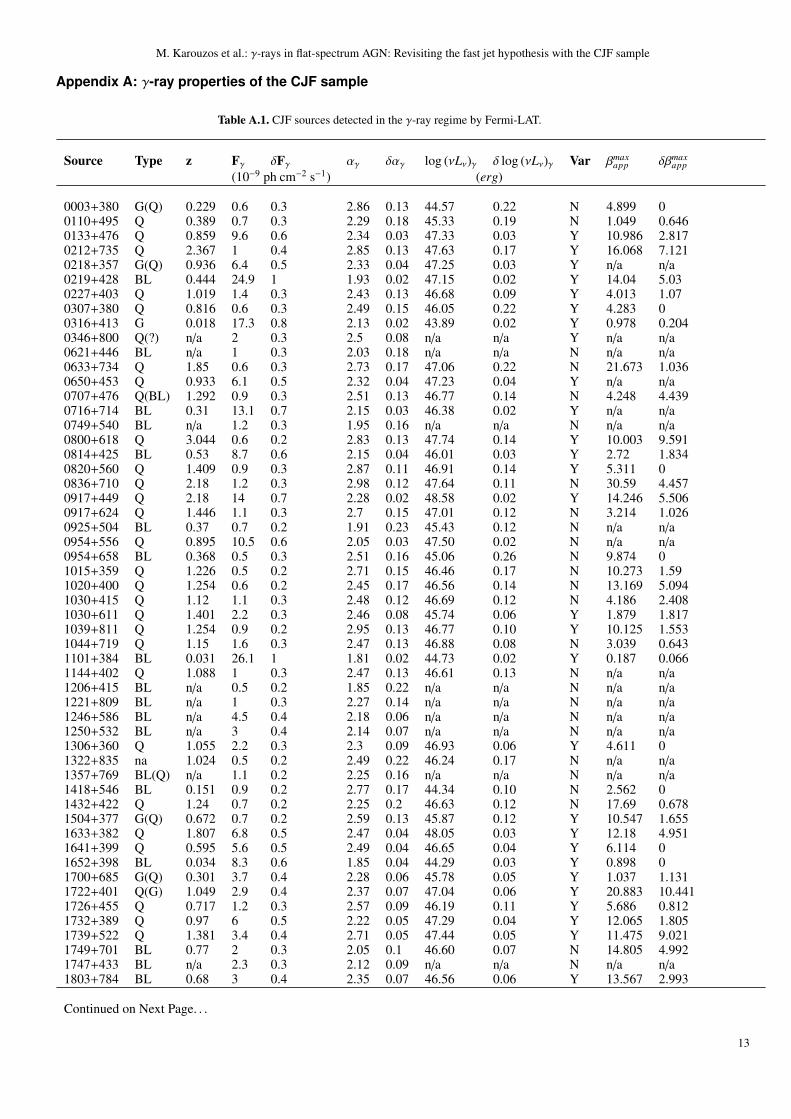
Appendix A: γ-ray properties of the CJF sample
Table A.1. CJF sources detected in the γ-ray regime by Fermi-LAT.
Source Type z Fγ δFγ αγ δαγ log (νLν)γ δ log (νLν)γ Var βmaxapp δβmax
app(10−9 ph cm−2 s−1) (erg)
0003+380 G(Q) 0.229 0.6 0.3 2.86 0.13 44.57 0.22 N 4.899 00110+495 Q 0.389 0.7 0.3 2.29 0.18 45.33 0.19 N 1.049 0.6460133+476 Q 0.859 9.6 0.6 2.34 0.03 47.33 0.03 Y 10.986 2.8170212+735 Q 2.367 1 0.4 2.85 0.13 47.63 0.17 Y 16.068 7.1210218+357 G(Q) 0.936 6.4 0.5 2.33 0.04 47.25 0.03 Y n/a n/a0219+428 BL 0.444 24.9 1 1.93 0.02 47.15 0.02 Y 14.04 5.030227+403 Q 1.019 1.4 0.3 2.43 0.13 46.68 0.09 Y 4.013 1.070307+380 Q 0.816 0.6 0.3 2.49 0.15 46.05 0.22 Y 4.283 00316+413 G 0.018 17.3 0.8 2.13 0.02 43.89 0.02 Y 0.978 0.2040346+800 Q(?) n/a 2 0.3 2.5 0.08 n/a n/a Y n/a n/a0621+446 BL n/a 1 0.3 2.03 0.18 n/a n/a N n/a n/a0633+734 Q 1.85 0.6 0.3 2.73 0.17 47.06 0.22 N 21.673 1.0360650+453 Q 0.933 6.1 0.5 2.32 0.04 47.23 0.04 Y n/a n/a0707+476 Q(BL) 1.292 0.9 0.3 2.51 0.13 46.77 0.14 N 4.248 4.4390716+714 BL 0.31 13.1 0.7 2.15 0.03 46.38 0.02 Y n/a n/a0749+540 BL n/a 1.2 0.3 1.95 0.16 n/a n/a N n/a n/a0800+618 Q 3.044 0.6 0.2 2.83 0.13 47.74 0.14 Y 10.003 9.5910814+425 BL 0.53 8.7 0.6 2.15 0.04 46.01 0.03 Y 2.72 1.8340820+560 Q 1.409 0.9 0.3 2.87 0.11 46.91 0.14 Y 5.311 00836+710 Q 2.18 1.2 0.3 2.98 0.12 47.64 0.11 N 30.59 4.4570917+449 Q 2.18 14 0.7 2.28 0.02 48.58 0.02 Y 14.246 5.5060917+624 Q 1.446 1.1 0.3 2.7 0.15 47.01 0.12 N 3.214 1.0260925+504 BL 0.37 0.7 0.2 1.91 0.23 45.43 0.12 N n/a n/a0954+556 Q 0.895 10.5 0.6 2.05 0.03 47.50 0.02 N n/a n/a0954+658 BL 0.368 0.5 0.3 2.51 0.16 45.06 0.26 N 9.874 01015+359 Q 1.226 0.5 0.2 2.71 0.15 46.46 0.17 N 10.273 1.591020+400 Q 1.254 0.6 0.2 2.45 0.17 46.56 0.14 N 13.169 5.0941030+415 Q 1.12 1.1 0.3 2.48 0.12 46.69 0.12 N 4.186 2.4081030+611 Q 1.401 2.2 0.3 2.46 0.08 45.74 0.06 Y 1.879 1.8171039+811 Q 1.254 0.9 0.2 2.95 0.13 46.77 0.10 Y 10.125 1.5531044+719 Q 1.15 1.6 0.3 2.47 0.13 46.88 0.08 N 3.039 0.6431101+384 BL 0.031 26.1 1 1.81 0.02 44.73 0.02 Y 0.187 0.0661144+402 Q 1.088 1 0.3 2.47 0.13 46.61 0.13 N n/a n/a1206+415 BL n/a 0.5 0.2 1.85 0.22 n/a n/a N n/a n/a1221+809 BL n/a 1 0.3 2.27 0.14 n/a n/a N n/a n/a1246+586 BL n/a 4.5 0.4 2.18 0.06 n/a n/a N n/a n/a1250+532 BL n/a 3 0.4 2.14 0.07 n/a n/a N n/a n/a1306+360 Q 1.055 2.2 0.3 2.3 0.09 46.93 0.06 Y 4.611 01322+835 na 1.024 0.5 0.2 2.49 0.22 46.24 0.17 N n/a n/a1357+769 BL(Q) n/a 1.1 0.2 2.25 0.16 n/a n/a N n/a n/a1418+546 BL 0.151 0.9 0.2 2.77 0.17 44.34 0.10 N 2.562 01432+422 Q 1.24 0.7 0.2 2.25 0.2 46.63 0.12 N 17.69 0.6781504+377 G(Q) 0.672 0.7 0.2 2.59 0.13 45.87 0.12 Y 10.547 1.6551633+382 Q 1.807 6.8 0.5 2.47 0.04 48.05 0.03 Y 12.18 4.9511641+399 Q 0.595 5.6 0.5 2.49 0.04 46.65 0.04 Y 6.114 01652+398 BL 0.034 8.3 0.6 1.85 0.04 44.29 0.03 Y 0.898 01700+685 G(Q) 0.301 3.7 0.4 2.28 0.06 45.78 0.05 Y 1.037 1.1311722+401 Q(G) 1.049 2.9 0.4 2.37 0.07 47.04 0.06 Y 20.883 10.4411726+455 Q 0.717 1.2 0.3 2.57 0.09 46.19 0.11 Y 5.686 0.8121732+389 Q 0.97 6 0.5 2.22 0.05 47.29 0.04 Y 12.065 1.8051739+522 Q 1.381 3.4 0.4 2.71 0.05 47.44 0.05 Y 11.475 9.0211749+701 BL 0.77 2 0.3 2.05 0.1 46.60 0.07 N 14.805 4.9921747+433 BL n/a 2.3 0.3 2.12 0.09 n/a n/a N n/a n/a1803+784 BL 0.68 3 0.4 2.35 0.07 46.56 0.06 Y 13.567 2.993
Continued on Next Page. . .
13
M. Karouzos et al.: γ-rays in flat-spectrum AGN: Revisiting the fast jet hypothesis with the CJF sample
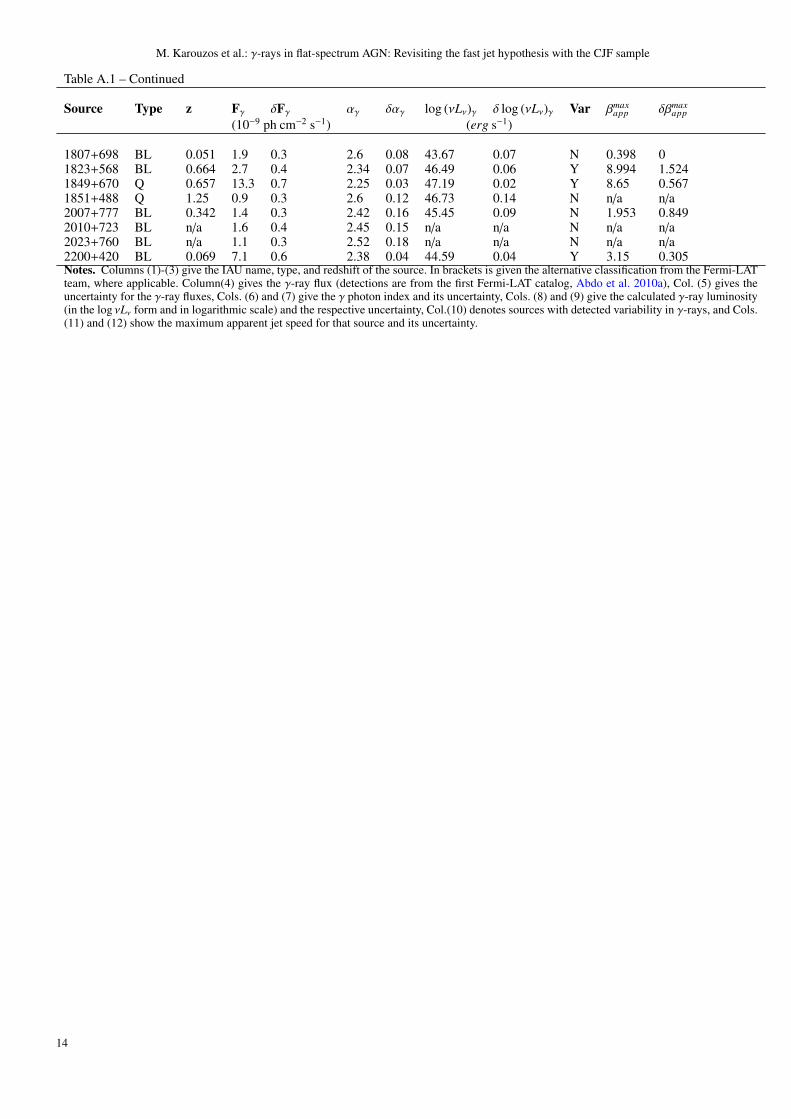
Table A.1 – Continued
Source Type z Fγ δFγ αγ δαγ log (νLν)γ δ log (νLν)γ Var βmaxapp δβmax
app(10−9 ph cm−2 s−1) (erg s−1)
1807+698 BL 0.051 1.9 0.3 2.6 0.08 43.67 0.07 N 0.398 01823+568 BL 0.664 2.7 0.4 2.34 0.07 46.49 0.06 Y 8.994 1.5241849+670 Q 0.657 13.3 0.7 2.25 0.03 47.19 0.02 Y 8.65 0.5671851+488 Q 1.25 0.9 0.3 2.6 0.12 46.73 0.14 N n/a n/a2007+777 BL 0.342 1.4 0.3 2.42 0.16 45.45 0.09 N 1.953 0.8492010+723 BL n/a 1.6 0.4 2.45 0.15 n/a n/a N n/a n/a2023+760 BL n/a 1.1 0.3 2.52 0.18 n/a n/a N n/a n/a2200+420 BL 0.069 7.1 0.6 2.38 0.04 44.59 0.04 Y 3.15 0.305Notes. Columns (1)-(3) give the IAU name, type, and redshift of the source. In brackets is given the alternative classification from the Fermi-LATteam, where applicable. Column(4) gives the γ-ray flux (detections are from the first Fermi-LAT catalog, Abdo et al. 2010a), Col. (5) gives theuncertainty for the γ-ray fluxes, Cols. (6) and (7) give the γ photon index and its uncertainty, Cols. (8) and (9) give the calculated γ-ray luminosity(in the log νLν form and in logarithmic scale) and the respective uncertainty, Col.(10) denotes sources with detected variability in γ-rays, and Cols.(11) and (12) show the maximum apparent jet speed for that source and its uncertainty.
14
Recommended


