Identifying Dementia Subtypes with Electronic Health Records
SAYANTAN KUMAR, Department of Computer Science and Engineering, Washington University in St. Louis,USAZACHARY ABRAMS, Institute for Informatics, Washington University School of Medicine, USASUZANNE E. SCHINDLER, Department of Neurology, Washington University School of Medicine, USANUPUR GHOSHAL, Department of Neurology, Washington University School of Medicine, USAPHILIP R. O. PAYNE, Institute for Informatics, Washington University School of Medicine, USA
Dementia is characterized by a decline in memory and thinking that is significant enough to impair function in activities ofdaily living. Patients seen in dementia specialty clinics are highly heterogeneous with a variety of different symptoms thatprogress at different rates. In this work, we used an unsupervised data-driven K-Means clustering approach on the componentscores of the Clinical Dementia Rating (CDR®) score to identify dementia subtypes and used the gap-statistic to identifythe optimal number of clusters. Our goal was to characterize the identified dementia subtypes in terms of their cognitiveperformance and analyze how patient transitions between subtypes relate to disease progression. Our results indicate bothinter-subtype variability, which indicates the variability amongst dementia subtypes for a particular component score evenwith the same CDR and (ii) intra-subtype variability, which indicates the variation in the 6 component scores within aparticular dementia subtype. We observed that dementia subtypes that represented individuals with very mild dementia (CDR0.5) had widely varying rates of transition to other subtypes. Future work includes testing the generalizability of our proposedpipeline on additional datasets, and using a larger volume of EHR data to estimate probabilistic estimates of the variabilitybetween dementia subtypes both in terms of cognitive profile and disease progression.
Additional Key Words and Phrases: Dementia, electronic health records, heterogeneity, clustering, patient subtypes, inter-pretability, disease progression
ACM Reference Format:Sayantan Kumar, Zachary Abrams, Suzanne E. Schindler, Nupur Ghoshal, and Philip R. O. Payne. 2022. Identifying DementiaSubtypes with Electronic Health Records. In . ACM, New York, NY, USA, 13 pages. https://doi.org/10.1145/nnnnnnn.nnnnnnn
1 INTRODUCTIONDementia is defined by a decline in memory and thinking that is significant enough to impair function in activitiesof daily living. Dementia has numerous causes, including reversible causes, such as medication-induced cognitivedysfunction, as well as irreversible causes, such as progressive neuro-degenerative disorders [3]. AlzheimerDisease (AD) is the most common cause of dementia in older adults, but many other disorders can cause orcontribute to dementia, including cerebrovascular disease and diseases associated with Lewy bodies, tau tangles,or TARDNA-binding protein43 (TDP-43) [27]. Patients present with a variety of different symptoms and progressat different rates, which may be related to the underlying brain pathologies, variation in baseline cognitive ability,genetic background, medical comorbidities, and social determinants of health [18]. Hence, patients seen in adementia clinic are highly heterogeneous and represent many different types of dementia. Better characterizing
Permission to make digital or hard copies of all or part of this work for personal or classroom use is granted without fee provided thatcopies are not made or distributed for profit or commercial advantage and that copies bear this notice and the full citation on the firstpage. Copyrights for components of this work owned by others than ACM must be honored. Abstracting with credit is permitted. To copyotherwise, or republish, to post on servers or to redistribute to lists, requires prior specific permission and/or a fee. Request permissions [email protected], August 07–10, 2022, Chicago, IL© 2022 Association for Computing Machinery.ACM ISBN 978-x-xxxx-xxxx-x/YY/MM. . . $15.00https://doi.org/10.1145/nnnnnnn.nnnnnnn
1
arX
iv:2
202.
0000
9v2
[cs
.LG
] 2
4 M
ay 2
022
BCB, August 07–10, 2022, Chicago, IL Kumar et al.
Results
Methods
Data & Features
Study participants• WUSM EHR• Memory clinic (MDC)• Eligibility criteria : CDR
Feature Selection• Cognitive scores• CDR components
K-Means Clustering• Identify subtypes• Optimal number of clusters
(gap statistics)
Interpreting subtypes• Cognitive profile• Comorbidity profile
Subtype transitions • Disease progression
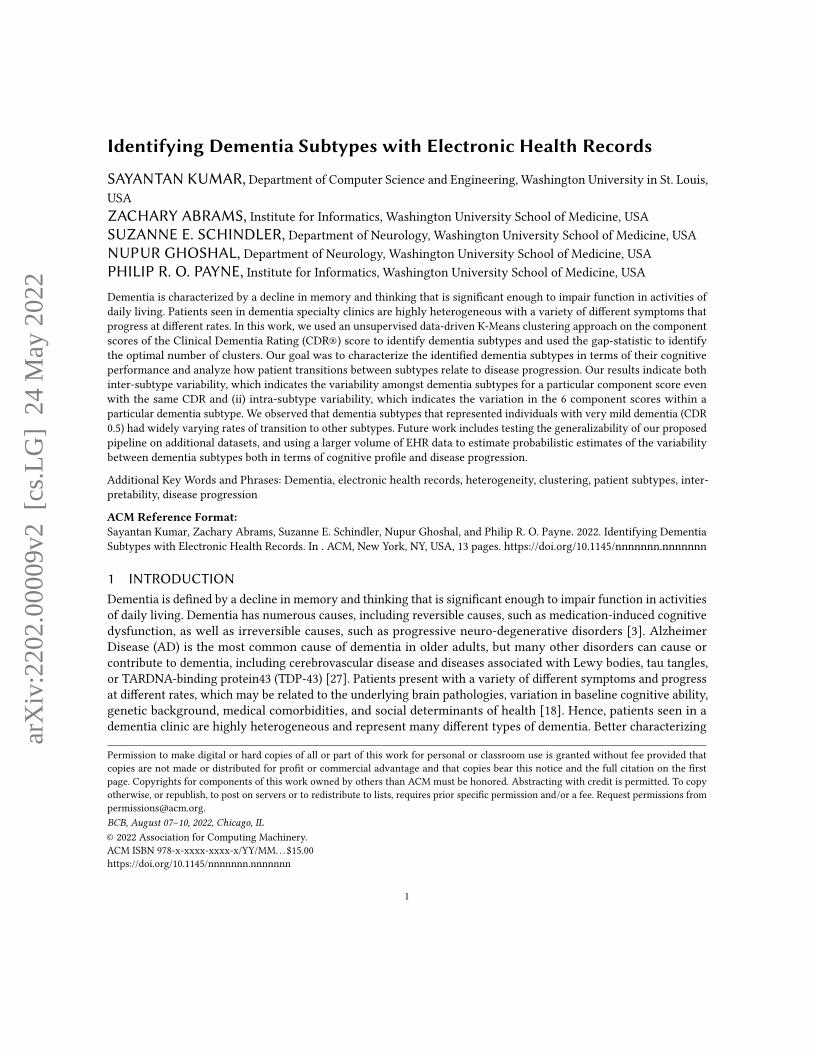
Fig. 1. High-level workflow of our proposed approach. First, we identified outpatient office visits from the Electronic HealthRecords data and included patients whose visits record a Clinical Dementia Rating (CDR) score. For feature variables, weextracted the cognitive assessment scores and the CDR component scores of patients. The K-Means clustering algorithm wasapplied to find the subtypes and the optimal number of clusters was determined by the gap-statistics algorithm. Next, wecharacterize the identified dementia subtypes in terms of their cognitive performance and analyze how patient transitionsbetween subtypes relate to disease progression. Keys: WUSM - Washington University School of Medicine, EHR - ElectronicHealth Records, MDC - Memory Diagnostic Center, CDR - Clinical Dementia Rating.
the clinical heterogeneity of dementia could improve dementia diagnosis and improve the ability of clinicians toprovide an appropriate prognosis to patients and their families [5].
Previous studies have used a priori-defined neuropathological categories to identify subtypes within a clinicaldementia population [6, 8, 13]. However, these approaches define subtypes of pathologies based on clinicaldiagnosis, which rely on a "clinical intuition" instead of unbiased data-driven approaches [14, 15]. More recently,the increasing availability of Electronic Health Records (EHR) data combined with complex machine learningalgorithms have encouraged data-driven approaches to identify patterns in clinical data [7]. These new datasources and methods may offer new insights into the underlying heterogeneity of dementia. For example,clustering algorithms can stratify dementia patients into subtypes based on key features recorded in the EHRthat can enhance predictive ability compared to analyzing the entire cohort as a single homogeneous group [24].There has been significant research which uses clustering techniques on EHR data to identify dementia
subtypes. In [26], hierarchical clustering was applied on clinical data from a multi-speciality urban medicalcentre to identify multiple sub-phenotypes of Alzheimer Disease and related dementia. Another study applied arepresentation learning model on Mount Sinai Health system data and identified subtypes with variable degreeof dementia symptoms [9]. Other studies focusing on dementia subtyping used 2 categories of structured clinicaldata sources as key features : brain atrophy patterns as measured by structural MRI [2, 4, 11, 16, 23] and cognitiveimpairment as measured by performance on cognitive tasks [1, 17, 19, 20, 25]. While most of these studies focuson identifying subtypes within a dementia cohort, little research has been done on interpreting the cognitivecharacteristics of the identified subtypes and how they are related to disease progression.
In this work, we use an unsupervised data-driven clustering approach to identify dementia subtypes. Our goalis to analyze if the identified subtypes have a logical relationship to each other based on our clinical understandingand knowledge. In contrary to prior work, our work focuses on both the interpretation of the identified subtypesbased on domain knowledge and analyzing how the subtypes play a role in the longitudinal progression trajectory
2
Identifying Dementia Subtypes with Electronic Health Records BCB, August 07–10, 2022, Chicago, IL
of the disease. Understanding the cognitive profile of the subtypes can lead to effective clinical decision-makingand precision diagnostics tailored to each subtype. Our contributions can be summarized as follows (visualrepresentation of the pipeline shown in Figure 1):
• Applying unsupervised clustering techniques on cognitive assessment scores to identify subtypes within aclinical dementia cohort.
• Interpretation of the identified subtypes in terms of their cognitive characteristics.• analyze transitions between the different subtypes and how they are related to disease progression.
Table 1. Demographic characteristics of our selected cohort (N = 1845 patients). All feature variables were calculated at thebaseline visit of each patient.
Feature variables (baseline)
Age (mean, SD) 73.2 years (11.9 years)Female (n, %) 1038 (57%)
Race (n, %)-White-Black or African American-Asian
1605 (88.9%)181 (10%)20 (1.2%)
Clinical Dementia Rating (Median, IQR)-Memory-Orientation-Judgement and Problem Solving-Community Affairs-Home and Hobbies-Personal Care
1 (0.5, 1)0.5 (0, 1)0.5 (0, 1)0.5 (0, 1)0.5 (0, 1)0 (0, 1)
Cognitive Characteristics (Median, IQR)-Mini-Mental State Exam-Boston Naming Test-Short Blessed-Verbal Fluency-Word List Recall-Word List Memory Task
23 (19, 27)14 (12, 15)10 (2, 16)12 (9, 16)2 (1, 5)13 (10, 16)
Most Common Diagnoses (n, %)-Memory Loss-Alzheimer Disease-Parkinsonism-Major Depressive Disorder-Obstructive Sleep Apnea
1010 (19.6%)1075 (9.8%)66 (0.7%)466 (2.9%)374 (2.6%)
3
BCB, August 07–10, 2022, Chicago, IL Kumar et al.
2 METHODS
2.1 Data sources and study participantsClinical data corresponding to office visits were extracted from the Electronic Health Records (EHR) of patientstreated between June 2012 and May 2018 at the Memory Diagnostic Centre (MDC) at the Washington UniversitySchool of Medicine in St. Louis, a large, academic, tertiary-care referral centre. All patients seen in the clinic werepresented for evaluation of memory and/or thinking concerns. Patients underwent a comprehensive history,neurological examination, brief cognitive testing, and if indicated, laboratory testing and brain imaging. Patientswere evaluated using the well-validated and widely used Clinical Dementia Rating (CDR®) at each visit, a five-point scale to characterize six different domains of cognitive and functional performance: memory, orientation,judgement and problem solving, home and hobbies, community affairs, and personal care [12]. For both the CDRglobal score and component scores, 0 denotes cognitively normal, 0.5 very mild dementia, 1 mild dementia, 2moderate dementia and 3 severe dementia. Longitudinal data from 1,845 patients with 2,737 visits were eligiblefor inclusion, where each visit had a CDR score. Table 1 represents the baseline demographic characteristics ofthe selected cohort. This study was approved by the Washington University in St. Louis Institutional ReviewBoard.
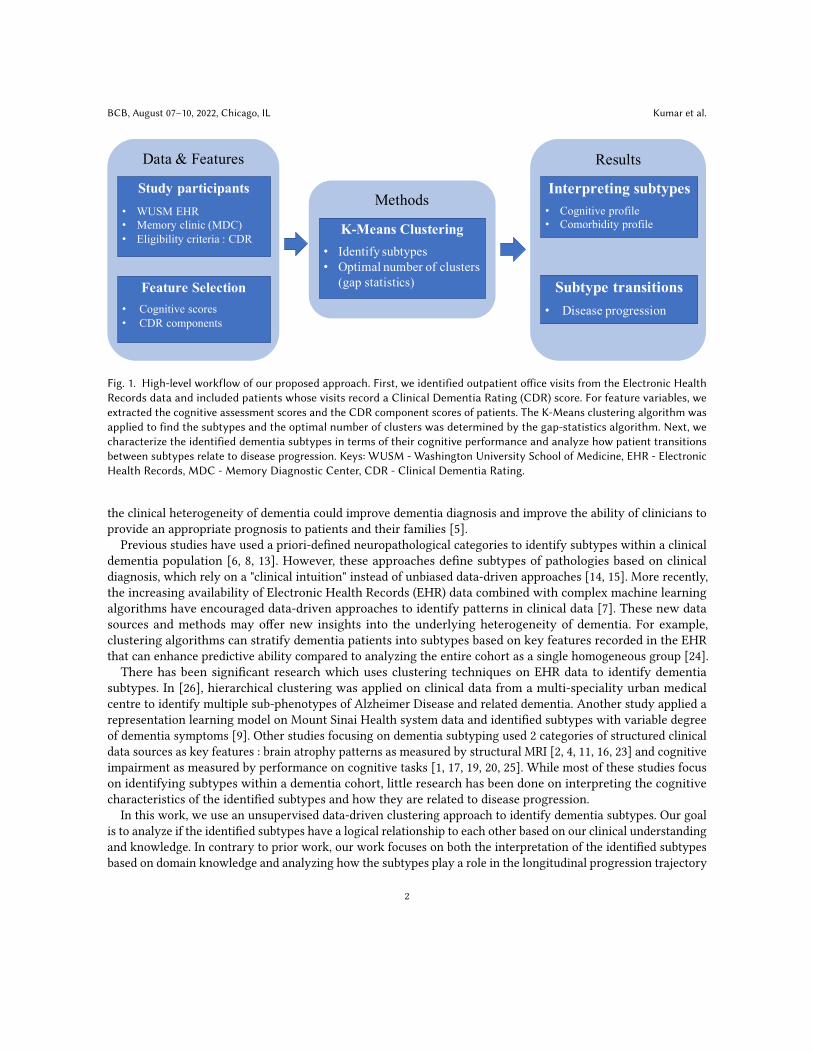
Fig. 2. The 2D T-SNE representations of the data for each of the 2 feature categories: cognitive scores only as features (left)and CDR components only as features (right). Each points represents a visit with the colour indicating the Global CDR score.
2.2 Feature selection for clustering analysisOur initial set of feature variables consisted of cognitive assessment scores, indicating performance on a stan-dardized battery of cognitive tasks to assess the severity of dementia. Compared to expensive and/or invasiveprocedures like neuroimaging biomarkers, these scores are standard metrics in dementia research and is recordedfor all patients in the memory clinic. Next, we performed feature selection to determine the optimal set of featuresfor clustering. We started with two sets of features as follows: (i) Cognitive assessment scores: Boston NamingTest, Mini-Mental State Exam, Short Blessed, Verbal Fluency, Word List Memory Task and Word List Recall,(ii) six components of CDR score: Memory, Orientation, Judgment and Problem Solving, Community Affairs,Home and Hobbies, and Personal Care. The motivation behind choosing the individual CDR component asfeatures compared to the aggregate Global CDR score is the fact that for patients having the same CDR score, theindividual components might be different from one another, allowing us a more granular approach of studyingthe sub-phenotyping of patients.
4
Identifying Dementia Subtypes with Electronic Health Records BCB, August 07–10, 2022, Chicago, IL
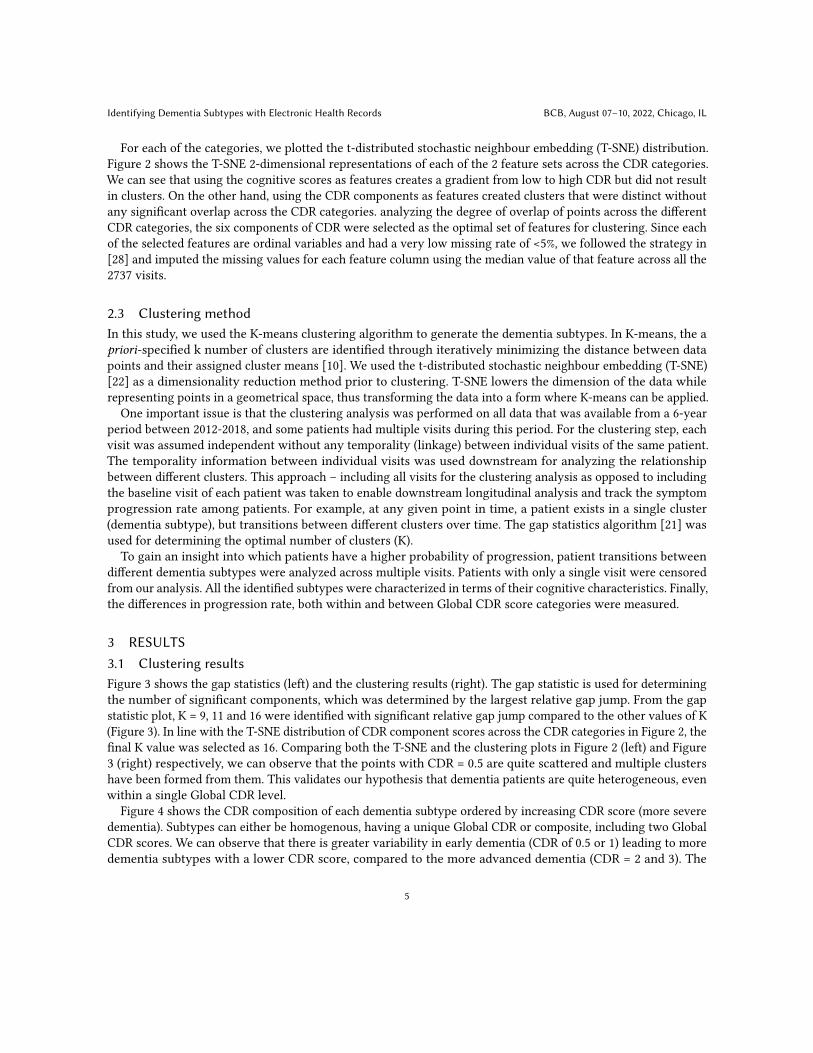
For each of the categories, we plotted the t-distributed stochastic neighbour embedding (T-SNE) distribution.Figure 2 shows the T-SNE 2-dimensional representations of each of the 2 feature sets across the CDR categories.We can see that using the cognitive scores as features creates a gradient from low to high CDR but did not resultin clusters. On the other hand, using the CDR components as features created clusters that were distinct withoutany significant overlap across the CDR categories. analyzing the degree of overlap of points across the differentCDR categories, the six components of CDR were selected as the optimal set of features for clustering. Since eachof the selected features are ordinal variables and had a very low missing rate of <5%, we followed the strategy in[28] and imputed the missing values for each feature column using the median value of that feature across all the2737 visits.
2.3 Clustering methodIn this study, we used the K-means clustering algorithm to generate the dementia subtypes. In K-means, the apriori-specified k number of clusters are identified through iteratively minimizing the distance between datapoints and their assigned cluster means [10]. We used the t-distributed stochastic neighbour embedding (T-SNE)[22] as a dimensionality reduction method prior to clustering. T-SNE lowers the dimension of the data whilerepresenting points in a geometrical space, thus transforming the data into a form where K-means can be applied.
One important issue is that the clustering analysis was performed on all data that was available from a 6-yearperiod between 2012-2018, and some patients had multiple visits during this period. For the clustering step, eachvisit was assumed independent without any temporality (linkage) between individual visits of the same patient.The temporality information between individual visits was used downstream for analyzing the relationshipbetween different clusters. This approach – including all visits for the clustering analysis as opposed to includingthe baseline visit of each patient was taken to enable downstream longitudinal analysis and track the symptomprogression rate among patients. For example, at any given point in time, a patient exists in a single cluster(dementia subtype), but transitions between different clusters over time. The gap statistics algorithm [21] wasused for determining the optimal number of clusters (K).To gain an insight into which patients have a higher probability of progression, patient transitions between
different dementia subtypes were analyzed across multiple visits. Patients with only a single visit were censoredfrom our analysis. All the identified subtypes were characterized in terms of their cognitive characteristics. Finally,the differences in progression rate, both within and between Global CDR score categories were measured.
3 RESULTS
3.1 Clustering resultsFigure 3 shows the gap statistics (left) and the clustering results (right). The gap statistic is used for determiningthe number of significant components, which was determined by the largest relative gap jump. From the gapstatistic plot, K = 9, 11 and 16 were identified with significant relative gap jump compared to the other values of K(Figure 3). In line with the T-SNE distribution of CDR component scores across the CDR categories in Figure 2, thefinal K value was selected as 16. Comparing both the T-SNE and the clustering plots in Figure 2 (left) and Figure3 (right) respectively, we can observe that the points with CDR = 0.5 are quite scattered and multiple clustershave been formed from them. This validates our hypothesis that dementia patients are quite heterogeneous, evenwithin a single Global CDR level.
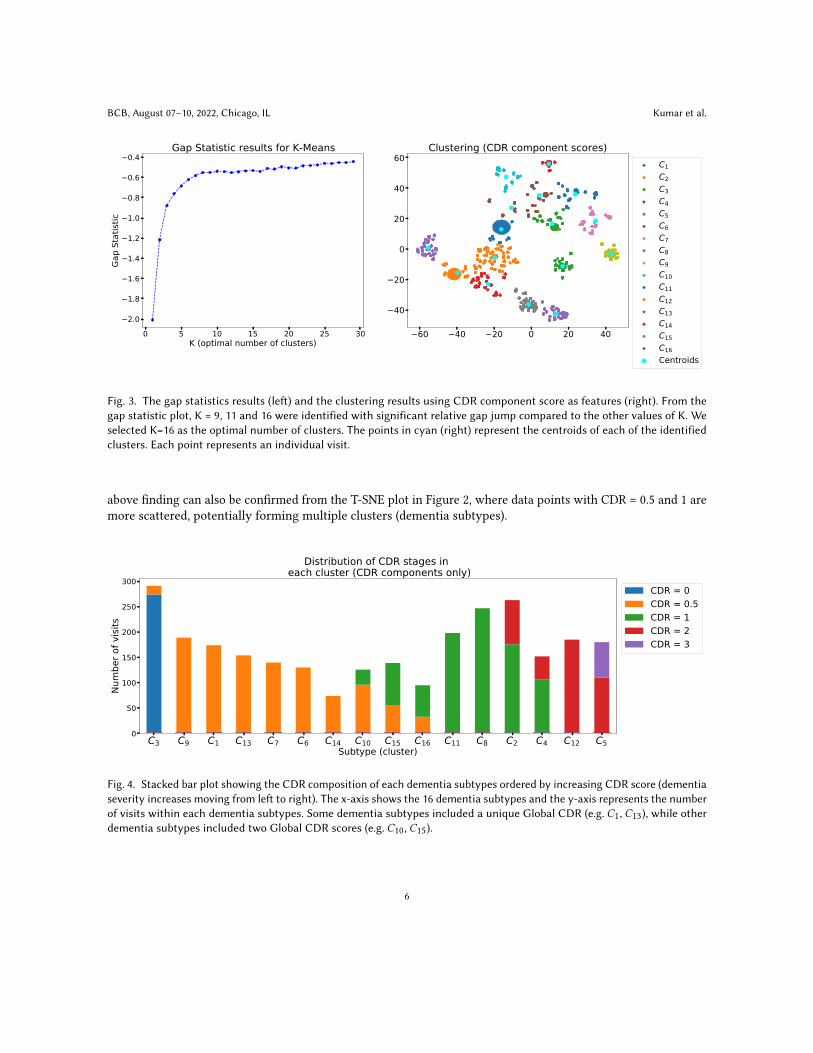
Figure 4 shows the CDR composition of each dementia subtype ordered by increasing CDR score (more severedementia). Subtypes can either be homogenous, having a unique Global CDR or composite, including two GlobalCDR scores. We can observe that there is greater variability in early dementia (CDR of 0.5 or 1) leading to moredementia subtypes with a lower CDR score, compared to the more advanced dementia (CDR = 2 and 3). The
5
BCB, August 07–10, 2022, Chicago, IL Kumar et al.
0 5 10 15 20 25 30K (optimal number of clusters)
2.0
1.8
1.6
1.4
1.2
1.0
0.8
0.6
0.4
Gap
Stat
istic
Gap Statistic results for K-Means
60 40 20 0 20 40
40
20
0
20
40
60Clustering (CDR component scores)
C1C2C3C4C5C6C7C8C9C10C11C12C13C14C15C16Centroids
Fig. 3. The gap statistics results (left) and the clustering results using CDR component score as features (right). From thegap statistic plot, K = 9, 11 and 16 were identified with significant relative gap jump compared to the other values of K. Weselected K=16 as the optimal number of clusters. The points in cyan (right) represent the centroids of each of the identifiedclusters. Each point represents an individual visit.
above finding can also be confirmed from the T-SNE plot in Figure 2, where data points with CDR = 0.5 and 1 aremore scattered, potentially forming multiple clusters (dementia subtypes).
C3 C9 C1 C13 C7 C6 C14 C10 C15 C16 C11 C8 C2 C4 C12 C5Subtype (cluster)
0
50
100
150
200
250
300
Num
ber o
f visi
ts
Distribution of CDR stages in each cluster (CDR components only)
CDR = 0CDR = 0.5CDR = 1CDR = 2CDR = 3
Fig. 4. Stacked bar plot showing the CDR composition of each dementia subtypes ordered by increasing CDR score (dementiaseverity increases moving from left to right). The x-axis shows the 16 dementia subtypes and the y-axis represents the numberof visits within each dementia subtypes. Some dementia subtypes included a unique Global CDR (e.g. 𝐶1, 𝐶13), while otherdementia subtypes included two Global CDR scores (e.g. 𝐶10, 𝐶15).
6
Identifying Dementia Subtypes with Electronic Health Records BCB, August 07–10, 2022, Chicago, IL
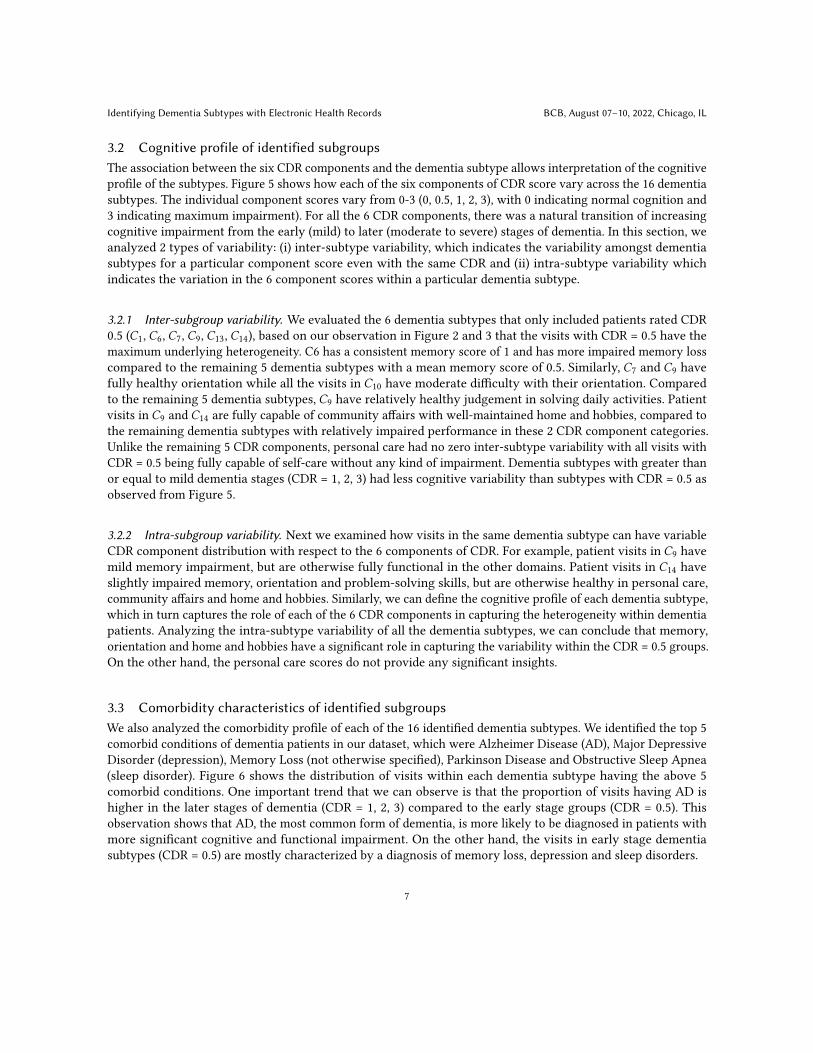
3.2 Cognitive profile of identified subgroupsThe association between the six CDR components and the dementia subtype allows interpretation of the cognitiveprofile of the subtypes. Figure 5 shows how each of the six components of CDR score vary across the 16 dementiasubtypes. The individual component scores vary from 0-3 (0, 0.5, 1, 2, 3), with 0 indicating normal cognition and3 indicating maximum impairment). For all the 6 CDR components, there was a natural transition of increasingcognitive impairment from the early (mild) to later (moderate to severe) stages of dementia. In this section, weanalyzed 2 types of variability: (i) inter-subtype variability, which indicates the variability amongst dementiasubtypes for a particular component score even with the same CDR and (ii) intra-subtype variability whichindicates the variation in the 6 component scores within a particular dementia subtype.
3.2.1 Inter-subgroup variability. We evaluated the 6 dementia subtypes that only included patients rated CDR0.5 (𝐶1, 𝐶6, 𝐶7, 𝐶9, 𝐶13, 𝐶14), based on our observation in Figure 2 and 3 that the visits with CDR = 0.5 have themaximum underlying heterogeneity. C6 has a consistent memory score of 1 and has more impaired memory losscompared to the remaining 5 dementia subtypes with a mean memory score of 0.5. Similarly, 𝐶7 and 𝐶9 havefully healthy orientation while all the visits in 𝐶10 have moderate difficulty with their orientation. Comparedto the remaining 5 dementia subtypes, 𝐶9 have relatively healthy judgement in solving daily activities. Patientvisits in 𝐶9 and 𝐶14 are fully capable of community affairs with well-maintained home and hobbies, compared tothe remaining dementia subtypes with relatively impaired performance in these 2 CDR component categories.Unlike the remaining 5 CDR components, personal care had no zero inter-subtype variability with all visits withCDR = 0.5 being fully capable of self-care without any kind of impairment. Dementia subtypes with greater thanor equal to mild dementia stages (CDR = 1, 2, 3) had less cognitive variability than subtypes with CDR = 0.5 asobserved from Figure 5.
3.2.2 Intra-subgroup variability. Next we examined how visits in the same dementia subtype can have variableCDR component distribution with respect to the 6 components of CDR. For example, patient visits in 𝐶9 havemild memory impairment, but are otherwise fully functional in the other domains. Patient visits in 𝐶14 haveslightly impaired memory, orientation and problem-solving skills, but are otherwise healthy in personal care,community affairs and home and hobbies. Similarly, we can define the cognitive profile of each dementia subtype,which in turn captures the role of each of the 6 CDR components in capturing the heterogeneity within dementiapatients. Analyzing the intra-subtype variability of all the dementia subtypes, we can conclude that memory,orientation and home and hobbies have a significant role in capturing the variability within the CDR = 0.5 groups.On the other hand, the personal care scores do not provide any significant insights.
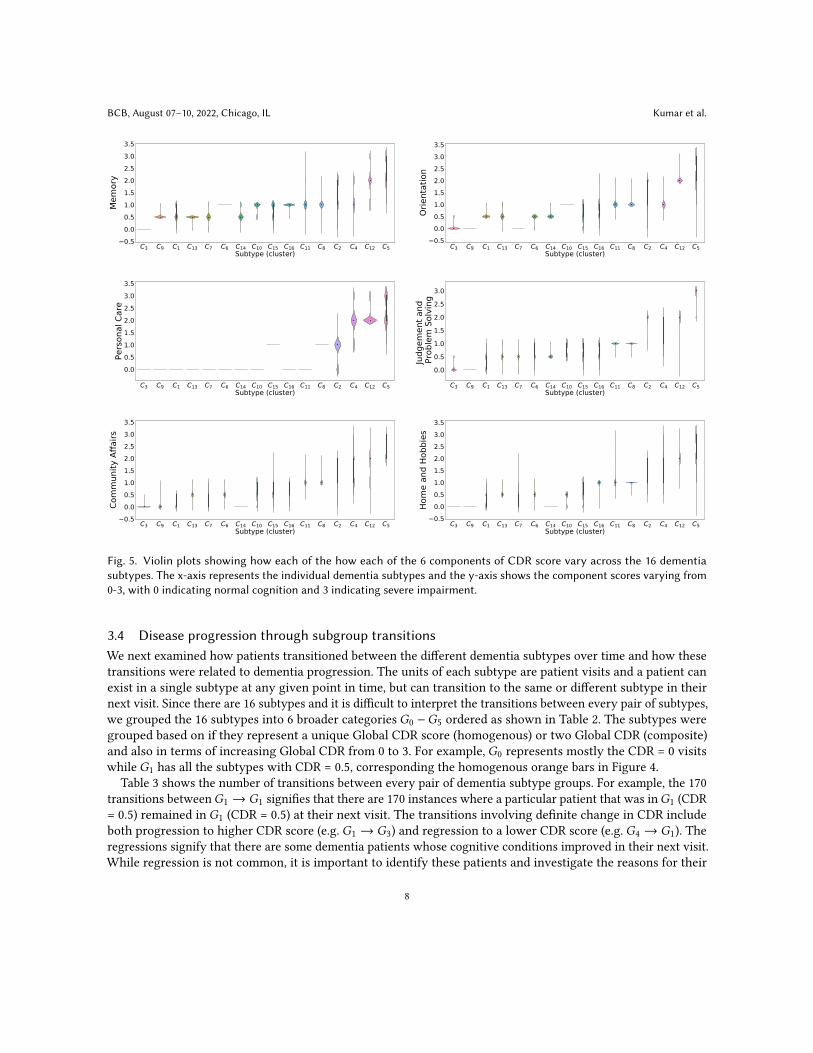
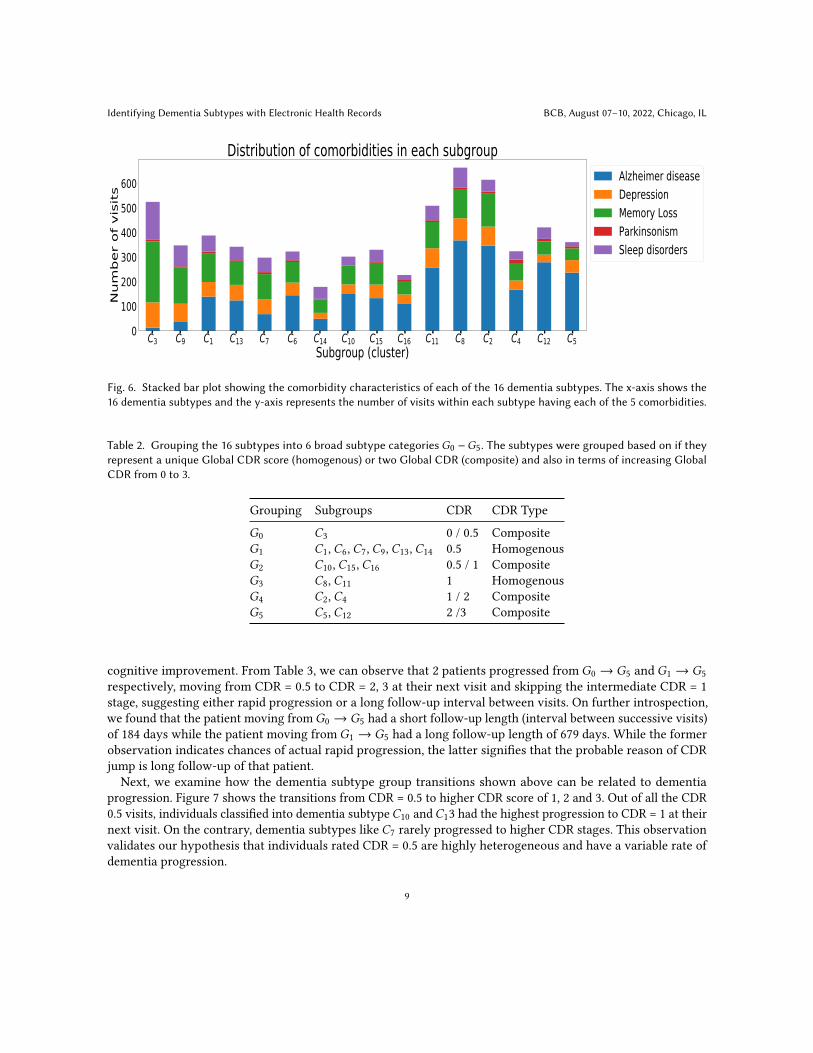
3.3 Comorbidity characteristics of identified subgroupsWe also analyzed the comorbidity profile of each of the 16 identified dementia subtypes. We identified the top 5comorbid conditions of dementia patients in our dataset, which were Alzheimer Disease (AD), Major DepressiveDisorder (depression), Memory Loss (not otherwise specified), Parkinson Disease and Obstructive Sleep Apnea(sleep disorder). Figure 6 shows the distribution of visits within each dementia subtype having the above 5comorbid conditions. One important trend that we can observe is that the proportion of visits having AD ishigher in the later stages of dementia (CDR = 1, 2, 3) compared to the early stage groups (CDR = 0.5). Thisobservation shows that AD, the most common form of dementia, is more likely to be diagnosed in patients withmore significant cognitive and functional impairment. On the other hand, the visits in early stage dementiasubtypes (CDR = 0.5) are mostly characterized by a diagnosis of memory loss, depression and sleep disorders.
7
BCB, August 07–10, 2022, Chicago, IL Kumar et al.
C3 C9 C1 C13 C7 C6 C14 C10 C15 C16 C11 C8 C2 C4 C12 C5Subtype (cluster)
0.50.00.51.01.52.02.53.03.5
Mem
ory
C3 C9 C1 C13 C7 C6 C14 C10 C15 C16 C11 C8 C2 C4 C12 C5Subtype (cluster)
0.50.00.51.01.52.02.53.03.5
Orie
ntat
ion
C3 C9 C1 C13 C7 C6 C14 C10 C15 C16 C11 C8 C2 C4 C12 C5Subtype (cluster)
0.00.51.01.52.02.53.03.5
Pers
onal
Car
e
C3 C9 C1 C13 C7 C6 C14 C10 C15 C16 C11 C8 C2 C4 C12 C5Subtype (cluster)
0.00.51.01.52.02.53.0
Judg
emen
t and
P
robl
em S
olvi
ng
C3 C9 C1 C13 C7 C6 C14 C10 C15 C16 C11 C8 C2 C4 C12 C5Subtype (cluster)
0.50.00.51.01.52.02.53.03.5
Com
mun
ity A
ffairs
C3 C9 C1 C13 C7 C6 C14 C10 C15 C16 C11 C8 C2 C4 C12 C5Subtype (cluster)
0.50.00.51.01.52.02.53.03.5
Hom
e an
d Ho
bbie
s
Fig. 5. Violin plots showing how each of the how each of the 6 components of CDR score vary across the 16 dementiasubtypes. The x-axis represents the individual dementia subtypes and the y-axis shows the component scores varying from0-3, with 0 indicating normal cognition and 3 indicating severe impairment.
3.4 Disease progression through subgroup transitionsWe next examined how patients transitioned between the different dementia subtypes over time and how thesetransitions were related to dementia progression. The units of each subtype are patient visits and a patient canexist in a single subtype at any given point in time, but can transition to the same or different subtype in theirnext visit. Since there are 16 subtypes and it is difficult to interpret the transitions between every pair of subtypes,we grouped the 16 subtypes into 6 broader categories𝐺0 −𝐺5 ordered as shown in Table 2. The subtypes weregrouped based on if they represent a unique Global CDR score (homogenous) or two Global CDR (composite)and also in terms of increasing Global CDR from 0 to 3. For example, 𝐺0 represents mostly the CDR = 0 visitswhile 𝐺1 has all the subtypes with CDR = 0.5, corresponding the homogenous orange bars in Figure 4.
Table 3 shows the number of transitions between every pair of dementia subtype groups. For example, the 170transitions between𝐺1 → 𝐺1 signifies that there are 170 instances where a particular patient that was in𝐺1 (CDR= 0.5) remained in 𝐺1 (CDR = 0.5) at their next visit. The transitions involving definite change in CDR includeboth progression to higher CDR score (e.g. 𝐺1 → 𝐺3) and regression to a lower CDR score (e.g.𝐺4 → 𝐺1). Theregressions signify that there are some dementia patients whose cognitive conditions improved in their next visit.While regression is not common, it is important to identify these patients and investigate the reasons for their
8
Identifying Dementia Subtypes with Electronic Health Records BCB, August 07–10, 2022, Chicago, IL
C3 C9 C1 C13 C7 C6 C14 C10 C15 C16 C11 C8 C2 C4 C12 C5Subgroup (cluster)
0100200300400500600
Num
ber
of
visi
ts
Distribution of comorbidities in each subgroupAlzheimer diseaseDepressionMemory LossParkinsonismSleep disorders
Fig. 6. Stacked bar plot showing the comorbidity characteristics of each of the 16 dementia subtypes. The x-axis shows the16 dementia subtypes and the y-axis represents the number of visits within each subtype having each of the 5 comorbidities.
Table 2. Grouping the 16 subtypes into 6 broad subtype categories𝐺0 −𝐺5. The subtypes were grouped based on if theyrepresent a unique Global CDR score (homogenous) or two Global CDR (composite) and also in terms of increasing GlobalCDR from 0 to 3.
Grouping Subgroups CDR CDR Type
𝐺0 𝐶3 0 / 0.5 Composite𝐺1 𝐶1, 𝐶6, 𝐶7, 𝐶9, 𝐶13, 𝐶14 0.5 Homogenous𝐺2 𝐶10, 𝐶15, 𝐶16 0.5 / 1 Composite𝐺3 𝐶8, 𝐶11 1 Homogenous𝐺4 𝐶2, 𝐶4 1 / 2 Composite𝐺5 𝐶5, 𝐶12 2 /3 Composite
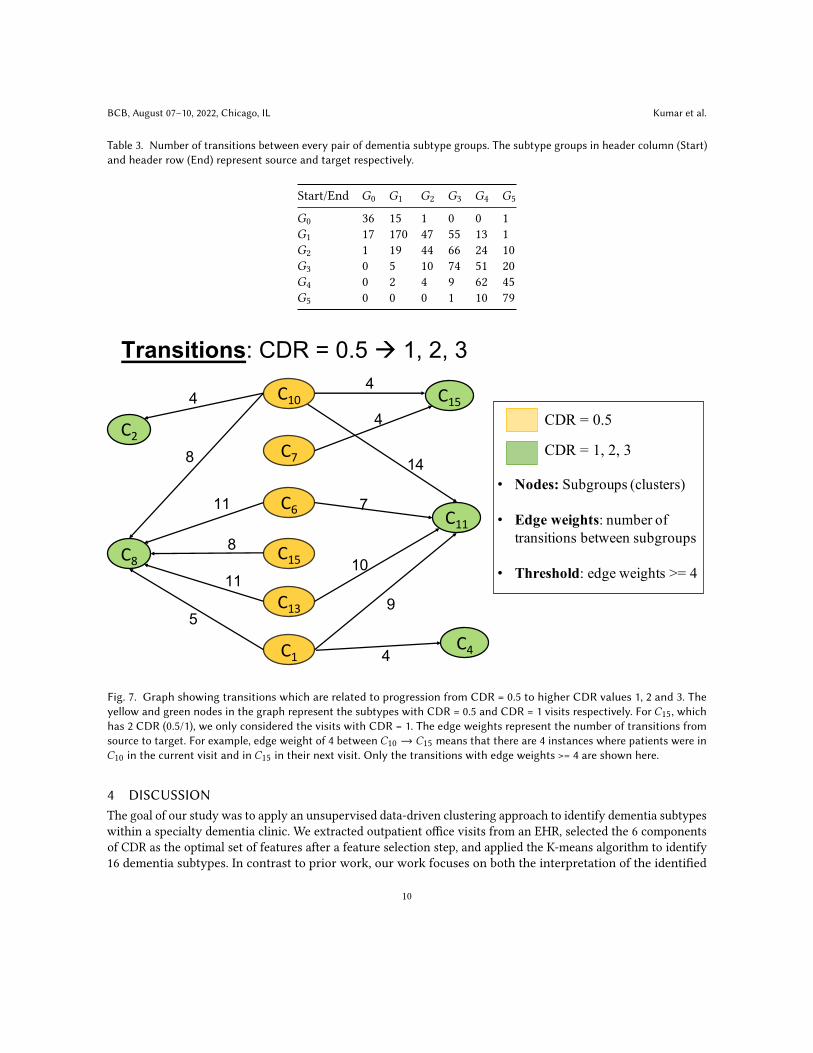
cognitive improvement. From Table 3, we can observe that 2 patients progressed from𝐺0 → 𝐺5 and 𝐺1 → 𝐺5respectively, moving from CDR = 0.5 to CDR = 2, 3 at their next visit and skipping the intermediate CDR = 1stage, suggesting either rapid progression or a long follow-up interval between visits. On further introspection,we found that the patient moving from𝐺0 → 𝐺5 had a short follow-up length (interval between successive visits)of 184 days while the patient moving from 𝐺1 → 𝐺5 had a long follow-up length of 679 days. While the formerobservation indicates chances of actual rapid progression, the latter signifies that the probable reason of CDRjump is long follow-up of that patient.Next, we examine how the dementia subtype group transitions shown above can be related to dementia
progression. Figure 7 shows the transitions from CDR = 0.5 to higher CDR score of 1, 2 and 3. Out of all the CDR0.5 visits, individuals classified into dementia subtype𝐶10 and𝐶13 had the highest progression to CDR = 1 at theirnext visit. On the contrary, dementia subtypes like 𝐶7 rarely progressed to higher CDR stages. This observationvalidates our hypothesis that individuals rated CDR = 0.5 are highly heterogeneous and have a variable rate ofdementia progression.
9
BCB, August 07–10, 2022, Chicago, IL Kumar et al.
Table 3. Number of transitions between every pair of dementia subtype groups. The subtype groups in header column (Start)and header row (End) represent source and target respectively.
Start/End 𝐺0 𝐺1 𝐺2 𝐺3 𝐺4 𝐺5
𝐺0 36 15 1 0 0 1𝐺1 17 170 47 55 13 1𝐺2 1 19 44 66 24 10𝐺3 0 5 10 74 51 20𝐺4 0 2 4 9 62 45𝐺5 0 0 0 1 10 79
C4
C7
C1
C15C2
C10
C8
C6
C15
C13
Transitions: CDR = 0.5 à 1, 2, 3
C11
4
14
4
7
10
9
4
5
11
8
11
8
4CDR = 0.5
CDR = 1, 2, 3
• Nodes: Subgroups (clusters)
• Edge weights: number of transitions between subgroups
• Threshold: edge weights >= 4
Fig. 7. Graph showing transitions which are related to progression from CDR = 0.5 to higher CDR values 1, 2 and 3. Theyellow and green nodes in the graph represent the subtypes with CDR = 0.5 and CDR = 1 visits respectively. For 𝐶15, whichhas 2 CDR (0.5/1), we only considered the visits with CDR = 1. The edge weights represent the number of transitions fromsource to target. For example, edge weight of 4 between 𝐶10 → 𝐶15 means that there are 4 instances where patients were in𝐶10 in the current visit and in 𝐶15 in their next visit. Only the transitions with edge weights >= 4 are shown here.
4 DISCUSSIONThe goal of our study was to apply an unsupervised data-driven clustering approach to identify dementia subtypeswithin a specialty dementia clinic. We extracted outpatient office visits from an EHR, selected the 6 componentsof CDR as the optimal set of features after a feature selection step, and applied the K-means algorithm to identify16 dementia subtypes. In contrast to prior work, our work focuses on both the interpretation of the identified
10
Identifying Dementia Subtypes with Electronic Health Records BCB, August 07–10, 2022, Chicago, IL
subtypes based on their cognitive characteristics and analyzing how the subtypes play a role in the longitudinalprogression trajectory of the disease.
4.1 Clustering on individual visitsIn this work, the unsupervised clustering analysis was performed with data from individual visits, rather thaneach patient, which assumed that each visit of the same patient is independent without any longitudinal relationsbetween the consecutive visit. Our goal was to blind ourselves to the temporality (linkages) between visits,and later utilize the temporal aspect to investigate the relationship between the clusters (dementia subtypes).First, dementia often progresses over a decade, whereas our window of EHR data is a maximum of six years.Rigorous analysis of longitudinal data is only possible when information about all the visits of a particulardementia patient is available, and in this dataset, we are evaluating a cross-section of data from patients thatencompasses different windows of their clinical care (e.g. some may have been seen in 2006-2014, others from2016-2022). Since we had EHR data from 2012-2018 only, we decided to perform the clustering at the visit level.This approach also helps in increasing the volume of data available for clustering, since we had only 1845 patientsin our dataset who satisfied the eligibility criteria. Since the units of each dementia subtype are individual visitsand not patients, a patient can have the first visit in one dementia subtype and the next visit in the same ora different subtype. This approach not only allows us to analyze the relationship between dementia subtypesbut also the differential progression trajectory of dementia patients. Although our experimental analyzes havebeen demonstrated in terms of dementia subtypes, our findings could be made more granular by focusing onthe heterogeneity of individual patients. For example, when we say a particular dementia subtype with CDR= 0.5 has a higher chance of progression to CDR = 1, 2, 3 compared to the other subtypes, we can investigatethe patients who have visits in that particular subtype and track their remaining visits across all subtypes. Webelieve that this visit-level approach is more robust and generalizable in terms of investigating heterogeneity anddisease progression compared to the patient-level approach of clustering using only the baseline information ofeach dementia patient.
4.2 Prioritizing early stage dementia subgroups for precision diagnosticsIn our analysis, we focused our attention on the visits with CDR = 0.5 to investigate the level of heterogeneity.From our observation in Figures 2-5, we can conclude very mild dementia (CDR = 0.5) is much more heterogeneousthan more severe dementia. We defined the cognitive profile of each dementia subtype and examined both theinter-subtype and intra-subtype variability. For example, individuals in the same dementia subtype can havedifferent scores in memory, orientation, judgement and problem solving and community affairs (intra-subtypevariability). We also evaluated the variability amongst dementia subtypes in their performance on the individualcomponent tasks for CDR. In Figure 5, we can see that the dementia subtypes with more severe dementia (CDR= 1, 2, 3) have worse performance on CDR component tasks with lower variability. Improved classification ofindividuals with very mild dementia may enable more accurate diagnosis and prognosis, which may also behelpful in weighing the potential benefits of certain treatments. For example, if a patient is very likely to progressto more severe dementia, a treatment with significant risks may have greater justification.
4.3 Variability in CDR progressionIn Table 3, we observed two interesting patterns in terms of CDR progression: (i) regression in CDR global score,signifying that some patients improve and (ii) skipping CDR stages during progression, where a patient can skipa CDR stage during progression (e.g. move directly from CDR = 0.5 to 2 in their next visit). The regression in CDRscore could be related to treatment of conditions that can cause or worsen dementia symptoms. For example,dementia specialists often discontinue medications that impair cognition, and patients often improve after these
11
BCB, August 07–10, 2022, Chicago, IL Kumar et al.
changes are made. Skipping CDR stages during progression could be related to actual rapid progression or a longinterval between adjacent visits. Events like a stroke or a fall can significantly worsen the cognitive abilities of apatient, increasing the apparent rate of progression. Changes in the collateral source (caregiver, family member)who accompanies the patient in his/her follow-up visit and informs the clinician of the patient’s condition canaffect the CDR. This reflects a potential bias in the clinical rating of dementia.
4.4 Limitations and scope for future workOne of the limitations is the fact that we have tested our approach on a single EHR dataset. As part of future work,we plan to test the generalizability of our pipeline on additional datasets. Another limitation is the relativelysmall sample size of our dataset which restricts our ability to perform rigorous statistical analyzes on the variablerate of progression of dementia subtypes. The main motivation behind our analysis was to analyze the initialpatterns of heterogeneity seen within a dementia cohort and possible solution of parsing the heterogeneity bycharacterizing the dementia subtypes. Applying this pipeline to a larger EHR dataset can allow us to estimateprobabilistic estimates of disease progression, backed by rigorous statistical analysis.
5 CONCLUSIONIn this research, we applied an unsupervised data-driven clustering approach to EHR data from a dementiaspecialty clinic to identify dementia subtypes based on CDR component scores. Our goal was to characterize thecognitive profile of the dementia subtypes and analyze how the subtypes change over time. We observed thatdementia subtypes that represented individuals with very mild dementia (CDR 0.5) had widely varying ratesof transition to other subtypes. Future work includes testing the generalizability of our proposed pipeline onadditional datasets, and using a larger volume of EHR data to estimate probabilistic estimates of the variabilitybetween dementia subtypes both in terms of cognitive profile and disease progression.
REFERENCES[1] Julie E Davidson, Michael C Irizarry, Bethany C Bray, Sally Wetten, Nicholas Galwey, Rachel Gibson, Michael Borrie, Richard Delisle,
Howard H Feldman, Ging-Yuek Hsiung, et al. 2010. An exploration of cognitive subgroups in Alzheimer’s disease. Journal of theInternational Neuropsychological Society 16, 2 (2010), 233–243.
[2] Aoyan Dong, Nicolas Honnorat, Bilwaj Gaonkar, and Christos Davatzikos. 2015. CHIMERA: clustering of heterogeneous disease effectsvia distribution matching of imaging patterns. IEEE transactions on medical imaging 35, 2 (2015), 612–621.
[3] Cleusa P Ferri, Martin Prince, Carol Brayne, Henry Brodaty, Laura Fratiglioni, Mary Ganguli, Kathleen Hall, Kazuo Hasegawa, HughHendrie, Yueqin Huang, et al. 2005. Global prevalence of dementia: a Delphi consensus study. The lancet 366, 9503 (2005), 2112–2117.
[4] H Förstl, R Levy, A Burns, P Luthert, and N Cairns. 1994. Pathways and patterns of cell loss in verified Alzheimer’s disease: a factor andcluster analysis of clinico-pathological subgroups. Behavioural neurology 7, 3-4 (1994), 175–180.
[5] Devendra Goyal, Donna Tjandra, Raymond Q Migrino, Bruno Giordani, Zeeshan Syed, Jenna Wiens, Alzheimer’s Disease NeuroimagingInitiative, et al. 2018. Characterizing heterogeneity in the progression of Alzheimer’s disease using longitudinal clinical and neuroimagingbiomarkers. Alzheimer’s & Dementia: Diagnosis, Assessment & Disease Monitoring 10 (2018), 629–637.
[6] Clifford R Jack Jr, Heather J Wiste, Stephen D Weigand, David S Knopman, Michelle M Mielke, Prashanthi Vemuri, Val Lowe, Matthew LSenjem, Jeffrey L Gunter, Denise Reyes, et al. 2015. Different definitions of neurodegeneration produce similar amyloid/neurodegenerationbiomarker group findings. Brain 138, 12 (2015), 3747–3759.
[7] Sayantan Kumar, Inez Oh, Suzanne Schindler, Albert M Lai, Philip RO Payne, and Aditi Gupta. 2021. Machine learning for modeling theprogression of Alzheimer disease dementia using clinical data: a systematic literature review. JAMIA open 4, 3 (2021), ooab052.
[8] Benjamin Lam, Mario Masellis, Morris Freedman, Donald T Stuss, and Sandra E Black. 2013. Clinical, imaging, and pathologicalheterogeneity of the Alzheimer’s disease syndrome. Alzheimer’s research & therapy 5, 1 (2013), 1–14.
[9] Isotta Landi, Benjamin S Glicksberg, Hao-Chih Lee, Sarah Cherng, Giulia Landi, Matteo Danieletto, Joel T Dudley, Cesare Furlanello,and Riccardo Miotto. 2020. Deep representation learning of electronic health records to unlock patient stratification at scale. NPJ digitalmedicine 3, 1 (2020), 1–11.
[10] Aristidis Likas, Nikos Vlassis, and Jakob J Verbeek. 2003. The global k-means clustering algorithm. Pattern recognition 36, 2 (2003),451–461.
12
Identifying Dementia Subtypes with Electronic Health Records BCB, August 07–10, 2022, Chicago, IL
[11] Charles B Malpas. 2016. Structural neuroimaging correlates of cognitive status in older adults: a person-oriented approach. Journal ofClinical Neuroscience 30 (2016), 77–82.
[12] John C Morris. 1991. The clinical dementia rating (cdr): Current version and. Young 41 (1991), 1588–1592.[13] Melissa E Murray, Neill R Graff-Radford, Owen A Ross, Ronald C Petersen, Ranjan Duara, and Dennis W Dickson. 2011. Neuropatholog-
ically defined subtypes of Alzheimer’s disease with distinct clinical characteristics: a retrospective study. The Lancet Neurology 10, 9(2011), 785–796.
[14] Jasmine Nettiksimmons, Charles DeCarli, Susan Landau, Laurel Beckett, Alzheimer’s Disease Neuroimaging Initiative, et al. 2014.Biological heterogeneity in ADNI amnestic mild cognitive impairment. Alzheimer’s & Dementia 10, 5 (2014), 511–521.
[15] Young Noh, Seun Jeon, Jong Min Lee, SangWon Seo, Geon Ha Kim, Hanna Cho, Byoung Seok Ye, CindyW Yoon, Hee Jin Kim, Juhee Chin,et al. 2014. Anatomical heterogeneity of Alzheimer disease: based on cortical thickness on MRIs. Neurology 83, 21 (2014), 1936–1944.
[16] Konstantinos Poulakis, Joana B Pereira, Patrizia Mecocci, Bruno Vellas, Magda Tsolaki, Iwona Kłoszewska, Hilkka Soininen, SimonLovestone, Andrew Simmons, Lars-Olof Wahlund, et al. 2018. Heterogeneous patterns of brain atrophy in Alzheimer’s disease.Neurobiology of aging 65 (2018), 98–108.
[17] Catherine C Price, Jared J Tanner, Ilona M Schmalfuss, Babette Brumback, Kenneth M Heilman, and David J Libon. 2015. Dissociatingstatistically-determined Alzheimer’s disease/vascular dementia neuropsychological syndromes using white and gray neuroradiologicalparameters. Journal of Alzheimer’s Disease 48, 3 (2015), 833–847.
[18] Joanne Ryan, Peter Fransquet, Jo Wrigglesworth, and Paul Lacaze. 2018. Phenotypic heterogeneity in dementia: a challenge forepidemiology and biomarker studies. Frontiers in public health 6 (2018), 181.
[19] Nienke ME Scheltens, Francisca Galindo-Garre, Yolande AL Pijnenburg, Annelies E van der Vlies, Lieke L Smits, Teddy Koene, Charlotte ETeunissen, Frederik Barkhof, Mike P Wattjes, Philip Scheltens, et al. 2016. The identification of cognitive subtypes in Alzheimer’s diseasedementia using latent class analysis. Journal of Neurology, Neurosurgery & Psychiatry 87, 3 (2016), 235–243.
[20] Nienke ME Scheltens, Betty M Tijms, Teddy Koene, Frederik Barkhof, Charlotte E Teunissen, Steffen Wolfsgruber, Michael Wagner,Johannes Kornhuber, Oliver Peters, Brendan I Cohn-Sheehy, et al. 2017. Cognitive subtypes of probable Alzheimer’s disease robustlyidentified in four cohorts. Alzheimer’s & Dementia 13, 11 (2017), 1226–1236.
[21] Robert Tibshirani, Guenther Walther, and Trevor Hastie. 2001. Estimating the number of clusters in a data set via the gap statistic.Journal of the Royal Statistical Society: Series B (Statistical Methodology) 63, 2 (2001), 411–423.
[22] Laurens Van der Maaten and Geoffrey Hinton. 2008. Visualizing data using t-SNE. Journal of machine learning research 9, 11 (2008).[23] Erdem Varol, Aristeidis Sotiras, Christos Davatzikos, Alzheimer’s Disease Neuroimaging Initiative, et al. 2017. HYDRA: Revealing
heterogeneity of imaging and genetic patterns through a multiple max-margin discriminative analysis framework. Neuroimage 145(2017), 346–364.
[24] Wolfgang Vogt and Dorothea Nagel. 1992. Cluster analysis in diagnosis. Clinical Chemistry 38, 2 (1992), 182–198.[25] Åsa K Wallin, Carina Wattmo, and Lennart Minthon. 2011. Galantamine treatment in Alzheimer’s disease: response and long-term
outcome in a routine clinical setting. Neuropsychiatric disease and treatment 7 (2011), 565.[26] Jie Xu, Fei Wang, Zhenxing Xu, Prakash Adekkanattu, Pascal Brandt, Guoqian Jiang, Richard C Kiefer, Yuan Luo, Chengsheng Mao,
Jennifer A Pacheco, et al. 2020. Data-driven discovery of probable Alzheimer’s disease and related dementia subphenotypes usingelectronic health records. Learning Health Systems 4, 4 (2020), e10246.
[27] Mariella Zanetti, Claudia Ballabio, Carlo Abbate, Chiara Cutaia, Carlo Vergani, and Luigi Bergamaschini. 2006. Mild cognitive impairmentsubtypes and vascular dementia in community-dwelling elderly people: a 3-year follow-up study. Journal of the American GeriatricsSociety 54, 4 (2006), 580–586.
[28] Yi-Hui Zhou and Ehsan Saghapour. 2021. ImputEHR: a visualization tool of imputation for the prediction of biomedical data. Frontiersin Genetics 12 (2021).
13
Recommended


