
Indian Banking
& Financials Sector
Retail Therapy: Time to Reboot

Institutional Equities
This page has been intentionally left blank
Institutional Equities
Sec
tor
Rep
ort
Banking & Financials Sector
Retail Therapy: Time To Reboot
We believe that the outlook on a long-term secular uptick in small-ticket (‘retail’) lending in India is still significantly favourable as: (1) Despite the retail lending ‘boom’ that ensued in recent years, India remains an economy that is grossly under-penetrated on the retail credit side from an over-arching ‘30,000-feet’ view. (2) Specific small-ticket loan segments are egregiously under-penetrated. (3) There is significant government support in addressing small-ticket credit supply gap. At the same time, we stress that our list of beneficiaries from this trend (which we have enumerated below) are driven primarily by idiosyncratic stock-specific factors first and then have a secondary macro overlaying tailwind to benefit from.
Despite retail lending ‘boom’, India remains grossly under-penetrated on the retail credit side: PFCE (Private Final Consumption Expenditure), which is the portion of the economy relevant from a retail credit perspective, has always been a major contributor to India’s GDP and its share has inched up from 56.2% in FY12 to 58.9% in FY18E. Importantly, specified retail credit as a proportion of relevant portion of GDP (PFCE) stands at 28.8% as of FY18E whereas specified wholesale credit as a proportion of relevant portion of GDP (GDP less PFCE) stands at 64.1%, indicating significantly lower generic leverage for the former.
Specific loan segments including small-ticket housing, micro and small enterprise lending, microfinance and gold loans are egregiously under-penetrated: According to the MoHUPA, 95% of urban housing shortfall in India falls under EWS/LIG sections. Similarly, the NSSO Survey states that 96% of micro and small enterprises in India do not have access to formal lending. Further, 75% of rural Indian households have their highest earning member making less than Rs5,000 a month, making loans to them potential ‘qualifying assets’ from a microfinance perspective. Also, the potential addressable size of the gold loan market is derived from as much as ~20,000tn of Indian household gold holdings, of which only ~10% is being used as collateral and, further, of this, the share of formal lenders is just one-fourth.
Central government is whole-heartedly focused on addressing credit supply gap in small-ticket lending: The Pradhan Mantri Awas Yojna aims to address low house ownership in India lower down the income pyramid by way of targeted credit subsidy for EWS/LIG and MIG consumers. Similarly, the Pradhan Mantri Mudra Yojna aims to create employment lower down the pyramid by way of supporting credit supply to micro and small enterprises via a refinancing reservoir. In fact, the government is hugely supportive of the MSME segment across the board (not just micro enterprises) and a raft of measures augment the opportunity size of formal lending to the MSME segment. Also, importantly, the Indian government remains focused on social and rural spending, regardless of political affiliation, a trend that may accelerate going into an election year.
Our list of potential beneficiaries are driven primarily by idiosyncratic stock-specific factors and aided further by the macro overlaying tailwind: Our list of beneficiaries include highly retailised mid-cap banks (DCB Bank, City Union Bank); mid-cap banks that are quoting at unjustified distressed valuations (South Indian Bank, Karnataka Bank) and a mid-cap bank with unconstrained DNA (RBL Bank), all three of which are re-orienting their loan book towards retail; a mid-cap bank with a balanced strategy (Federal Bank); housing finance companies with inherent small-ticket lending strength (CanFin Homes, Repco Home Finance) and unconstrained strategy (PNB Housing Finance); a small finance bank to benefit from business model transformation (Ujjivan Financial Services); gold loan NBFCs emerging from back-to-back crises (Manappuram Finance, Muthoot Finance) and an MSME-focused NBFC that is engaging in a highly synergistic merger with IDFC Bank (Capital First). We initiate coverage on all of them with a Buy Rating, barring Capital First, on which we have assigned an Accumulate rating.
View: Positive
Shivaji Thapliyal Research Analyst
+91-22-6273 8068 Shreesh Chandra Research Associate [email protected] +91-22-6273 8028
26 March 2018
Institutional Equities
Banking & Financials Sector 4
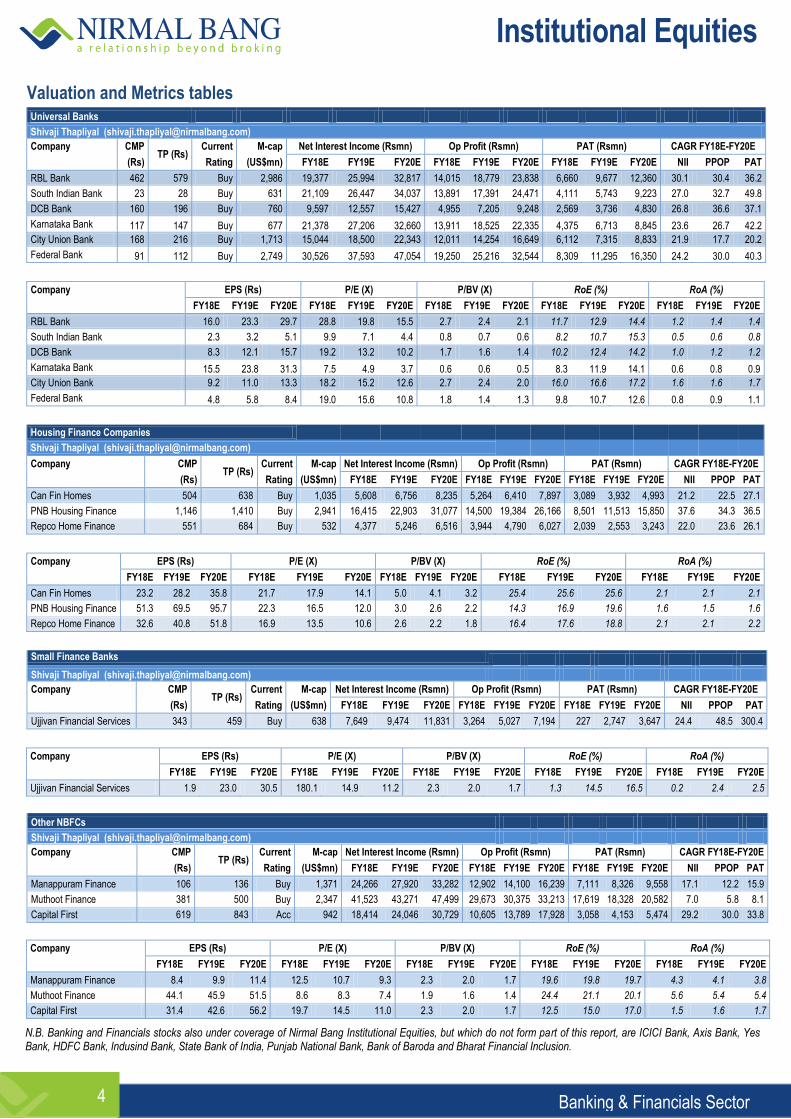
Valuation and Metrics tables Universal Banks
Shivaji Thapliyal ([email protected])
Company CMP TP (Rs)
Current M-cap Net Interest Income (Rsmn) Op Profit (Rsmn) PAT (Rsmn) CAGR FY18E-FY20E
(Rs) Rating (US$mn) FY18E FY19E FY20E FY18E FY19E FY20E FY18E FY19E FY20E NII PPOP PAT
RBL Bank 462 579 Buy 2,986 19,377 25,994 32,817 14,015 18,779 23,838 6,660 9,677 12,360 30.1 30.4 36.2
South Indian Bank 23 28 Buy 631 21,109 26,447 34,037 13,891 17,391 24,471 4,111 5,743 9,223 27.0 32.7 49.8
DCB Bank 160 196 Buy 760 9,597 12,557 15,427 4,955 7,205 9,248 2,569 3,736 4,830 26.8 36.6 37.1
Karnataka Bank 117 147 Buy 677 21,378 27,206 32,660 13,911 18,525 22,335 4,375 6,713 8,845 23.6 26.7 42.2
City Union Bank 168 216 Buy 1,713 15,044 18,500 22,343 12,011 14,254 16,649 6,112 7,315 8,833 21.9 17.7 20.2
Federal Bank 91 112 Buy 2,749 30,526 37,593 47,054 19,250 25,216 32,544 8,309 11,295 16,350 24.2 30.0 40.3
Company EPS (Rs) P/E (X) P/BV (X) RoE (%) RoA (%)
FY18E FY19E FY20E FY18E FY19E FY20E FY18E FY19E FY20E FY18E FY19E FY20E FY18E FY19E FY20E
RBL Bank 16.0 23.3 29.7 28.8 19.8 15.5 2.7 2.4 2.1 11.7 12.9 14.4 1.2 1.4 1.4
South Indian Bank 2.3 3.2 5.1 9.9 7.1 4.4 0.8 0.7 0.6 8.2 10.7 15.3 0.5 0.6 0.8
DCB Bank 8.3 12.1 15.7 19.2 13.2 10.2 1.7 1.6 1.4 10.2 12.4 14.2 1.0 1.2 1.2
Karnataka Bank 15.5 23.8 31.3 7.5 4.9 3.7 0.6 0.6 0.5 8.3 11.9 14.1 0.6 0.8 0.9
City Union Bank 9.2 11.0 13.3 18.2 15.2 12.6 2.7 2.4 2.0 16.0 16.6 17.2 1.6 1.6 1.7
Federal Bank 4.8 5.8 8.4 19.0 15.6 10.8 1.8 1.4 1.3 9.8 10.7 12.6 0.8 0.9 1.1
Housing Finance Companies
Shivaji Thapliyal ([email protected])
Company CMP TP (Rs)
Current M-cap Net Interest Income (Rsmn) Op Profit (Rsmn) PAT (Rsmn) CAGR FY18E-FY20E
(Rs) Rating (US$mn) FY18E FY19E FY20E FY18E FY19E FY20E FY18E FY19E FY20E NII PPOP PAT
Can Fin Homes 504 638 Buy 1,035 5,608 6,756 8,235 5,264 6,410 7,897 3,089 3,932 4,993 21.2 22.5 27.1
PNB Housing Finance 1,146 1,410 Buy 2,941 16,415 22,903 31,077 14,500 19,384 26,166 8,501 11,513 15,850 37.6 34.3 36.5
Repco Home Finance 551 684 Buy 532 4,377 5,246 6,516 3,944 4,790 6,027 2,039 2,553 3,243 22.0 23.6 26.1
Company EPS (Rs) P/E (X) P/BV (X) RoE (%) RoA (%)
FY18E FY19E FY20E FY18E FY19E FY20E FY18E FY19E FY20E FY18E FY19E FY20E FY18E FY19E FY20E
Can Fin Homes 23.2 28.2 35.8 21.7 17.9 14.1 5.0 4.1 3.2 25.4 25.6 25.6 2.1 2.1 2.1
PNB Housing Finance 51.3 69.5 95.7 22.3 16.5 12.0 3.0 2.6 2.2 14.3 16.9 19.6 1.6 1.5 1.6
Repco Home Finance 32.6 40.8 51.8 16.9 13.5 10.6 2.6 2.2 1.8 16.4 17.6 18.8 2.1 2.1 2.2
Small Finance Banks
Shivaji Thapliyal ([email protected])
Company CMP TP (Rs)
Current M-cap Net Interest Income (Rsmn) Op Profit (Rsmn) PAT (Rsmn) CAGR FY18E-FY20E
(Rs) Rating (US$mn) FY18E FY19E FY20E FY18E FY19E FY20E FY18E FY19E FY20E NII PPOP PAT
Ujjivan Financial Services 343 459 Buy 638 7,649 9,474 11,831 3,264 5,027 7,194 227 2,747 3,647 24.4 48.5 300.4
Company EPS (Rs) P/E (X) P/BV (X) RoE (%) RoA (%)
FY18E FY19E FY20E FY18E FY19E FY20E FY18E FY19E FY20E FY18E FY19E FY20E FY18E FY19E FY20E
Ujjivan Financial Services 1.9 23.0 30.5 180.1 14.9 11.2 2.3 2.0 1.7 1.3 14.5 16.5 0.2 2.4 2.5
Other NBFCs
Shivaji Thapliyal ([email protected])
Company CMP TP (Rs)
Current M-cap Net Interest Income (Rsmn) Op Profit (Rsmn) PAT (Rsmn) CAGR FY18E-FY20E
(Rs) Rating (US$mn) FY18E FY19E FY20E FY18E FY19E FY20E FY18E FY19E FY20E NII PPOP PAT
Manappuram Finance 106 136 Buy 1,371 24,266 27,920 33,282 12,902 14,100 16,239 7,111 8,326 9,558 17.1 12.2 15.9
Muthoot Finance 381 500 Buy 2,347 41,523 43,271 47,499 29,673 30,375 33,213 17,619 18,328 20,582 7.0 5.8 8.1
Capital First 619 843 Acc 942 18,414 24,046 30,729 10,605 13,789 17,928 3,058 4,153 5,474 29.2 30.0 33.8
Company EPS (Rs) P/E (X) P/BV (X) RoE (%) RoA (%)
FY18E FY19E FY20E FY18E FY19E FY20E FY18E FY19E FY20E FY18E FY19E FY20E FY18E FY19E FY20E
Manappuram Finance 8.4 9.9 11.4 12.5 10.7 9.3 2.3 2.0 1.7 19.6 19.8 19.7 4.3 4.1 3.8
Muthoot Finance 44.1 45.9 51.5 8.6 8.3 7.4 1.9 1.6 1.4 24.4 21.1 20.1 5.6 5.4 5.4
Capital First 31.4 42.6 56.2 19.7 14.5 11.0 2.3 2.0 1.7 12.5 15.0 17.0 1.5 1.6 1.7
N.B. Banking and Financials stocks also under coverage of Nirmal Bang Institutional Equities, but which do not form part of this report, are ICICI Bank, Axis Bank, Yes Bank, HDFC Bank, Indusind Bank, State Bank of India, Punjab National Bank, Bank of Baroda and Bharat Financial Inclusion.
Institutional Equities
Banking & Financials Sector 5
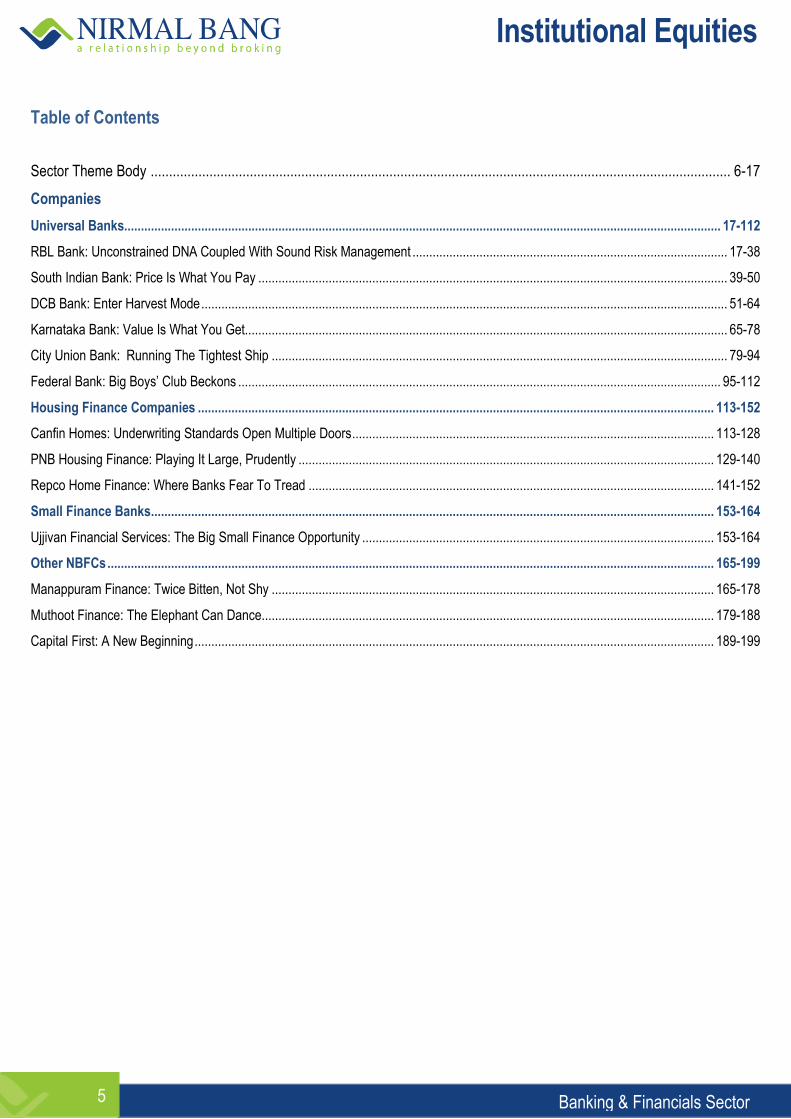
Table of Contents
Sector Theme Body .............................................................................................................................................................. 6-17
Companies
Universal Banks.................................................................................................................................................................................. 17-112
RBL Bank: Unconstrained DNA Coupled With Sound Risk Management .............................................................................................. 17-38
South Indian Bank: Price Is What You Pay ............................................................................................................................................ 39-50
DCB Bank: Enter Harvest Mode ............................................................................................................................................................. 51-64
Karnataka Bank: Value Is What You Get................................................................................................................................................ 65-78
City Union Bank: Running The Tightest Ship ........................................................................................................................................ 79-94
Federal Bank: Big Boys’ Club Beckons ................................................................................................................................................ 95-112
Housing Finance Companies .......................................................................................................................................................... 113-152
Canfin Homes: Underwriting Standards Open Multiple Doors ............................................................................................................ 113-128
PNB Housing Finance: Playing It Large, Prudently ............................................................................................................................ 129-140
Repco Home Finance: Where Banks Fear To Tread ......................................................................................................................... 141-152
Small Finance Banks ........................................................................................................................................................................ 153-164
Ujjivan Financial Services: The Big Small Finance Opportunity ......................................................................................................... 153-164
Other NBFCs ..................................................................................................................................................................................... 165-199
Manappuram Finance: Twice Bitten, Not Shy .................................................................................................................................... 165-178
Muthoot Finance: The Elephant Can Dance....................................................................................................................................... 179-188
Capital First: A New Beginning ........................................................................................................................................................... 189-199
Institutional Equities
Banking & Financials Sector 6
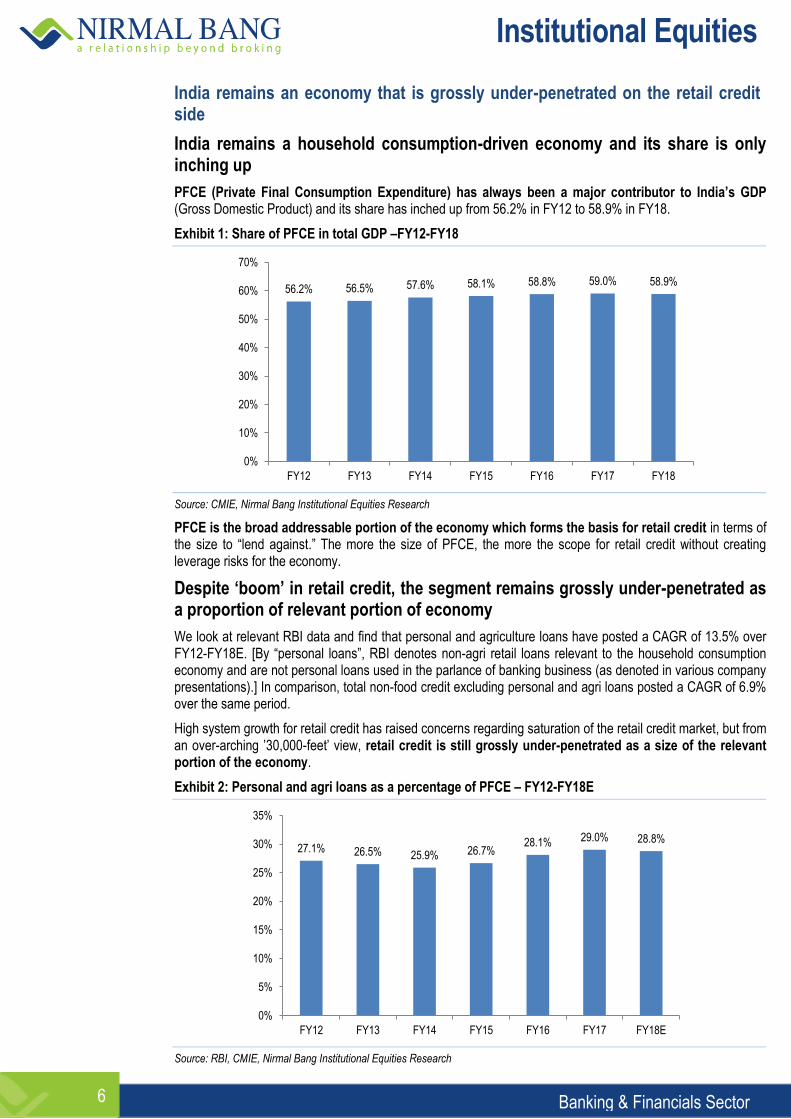
India remains an economy that is grossly under-penetrated on the retail credit side
India remains a household consumption-driven economy and its share is only inching up
PFCE (Private Final Consumption Expenditure) has always been a major contributor to India’s GDP (Gross Domestic Product) and its share has inched up from 56.2% in FY12 to 58.9% in FY18.
Exhibit 1: Share of PFCE in total GDP –FY12-FY18
Source: CMIE, Nirmal Bang Institutional Equities Research
PFCE is the broad addressable portion of the economy which forms the basis for retail credit in terms of the size to “lend against.” The more the size of PFCE, the more the scope for retail credit without creating leverage risks for the economy.
Despite ‘boom’ in retail credit, the segment remains grossly under-penetrated as a proportion of relevant portion of economy
We look at relevant RBI data and find that personal and agriculture loans have posted a CAGR of 13.5% over FY12-FY18E. [By “personal loans”, RBI denotes non-agri retail loans relevant to the household consumption economy and are not personal loans used in the parlance of banking business (as denoted in various company presentations).] In comparison, total non-food credit excluding personal and agri loans posted a CAGR of 6.9% over the same period.
High system growth for retail credit has raised concerns regarding saturation of the retail credit market, but from an over-arching ’30,000-feet’ view, retail credit is still grossly under-penetrated as a size of the relevant portion of the economy.
Exhibit 2: Personal and agri loans as a percentage of PFCE – FY12-FY18E
Source: RBI, CMIE, Nirmal Bang Institutional Equities Research
56.2% 56.5% 57.6% 58.1% 58.8% 59.0% 58.9%
0%
10%
20%
30%
40%
50%
60%
70%
FY12 FY13 FY14 FY15 FY16 FY17 FY18
27.1% 26.5% 25.9% 26.7% 28.1% 29.0% 28.8%
0%
5%
10%
15%
20%
25%
30%
35%
FY12 FY13 FY14 FY15 FY16 FY17 FY18E
Institutional Equities
Banking & Financials Sector 7
It may noted that there are small-ticket loans (‘retail credit’) other than personal and agri loans viz. trade loans and micro and small industrial loans but these have not been considered in the numerator in Exhibit 2 as they are not relevant to the denominator, PFCE. Also, not all agri loans would be retail in nature but this approximation only makes our number (retail and agri loans as a percentage of PFCE) more conservative.
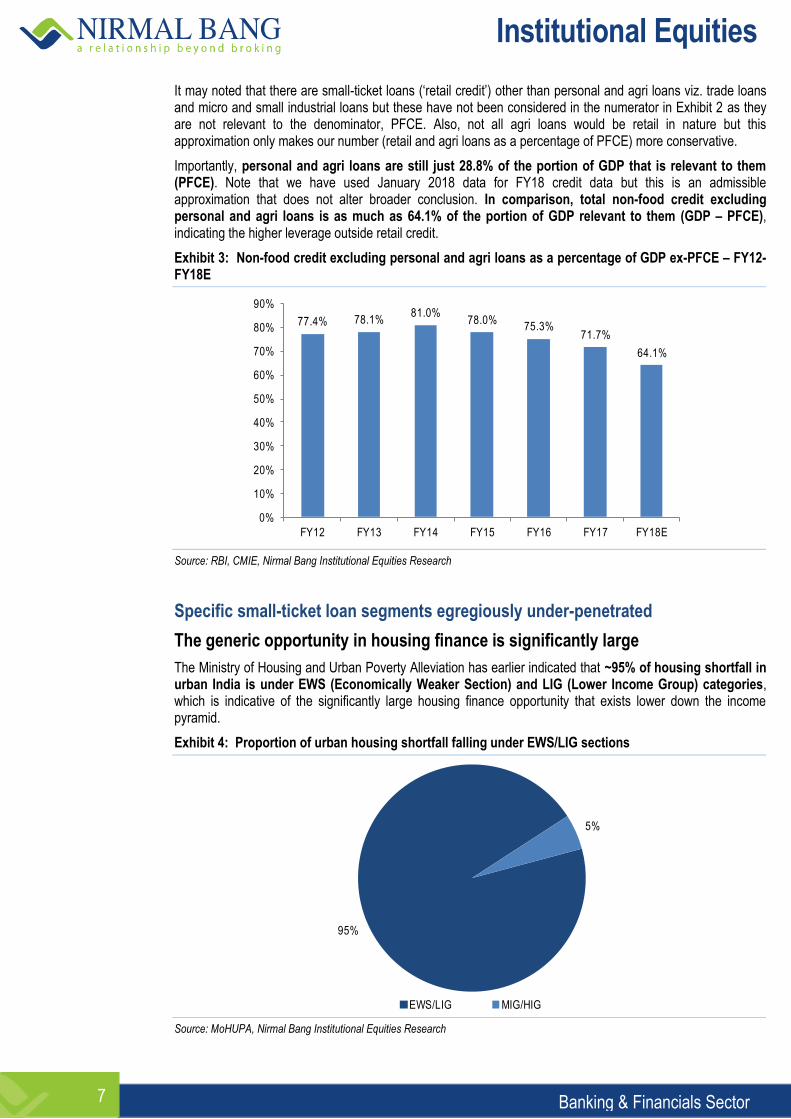
Importantly, personal and agri loans are still just 28.8% of the portion of GDP that is relevant to them (PFCE). Note that we have used January 2018 data for FY18 credit data but this is an admissible approximation that does not alter broader conclusion. In comparison, total non-food credit excluding personal and agri loans is as much as 64.1% of the portion of GDP relevant to them (GDP – PFCE), indicating the higher leverage outside retail credit.
Exhibit 3: Non-food credit excluding personal and agri loans as a percentage of GDP ex-PFCE – FY12-FY18E
Source: RBI, CMIE, Nirmal Bang Institutional Equities Research
Specific small-ticket loan segments egregiously under-penetrated
The generic opportunity in housing finance is significantly large
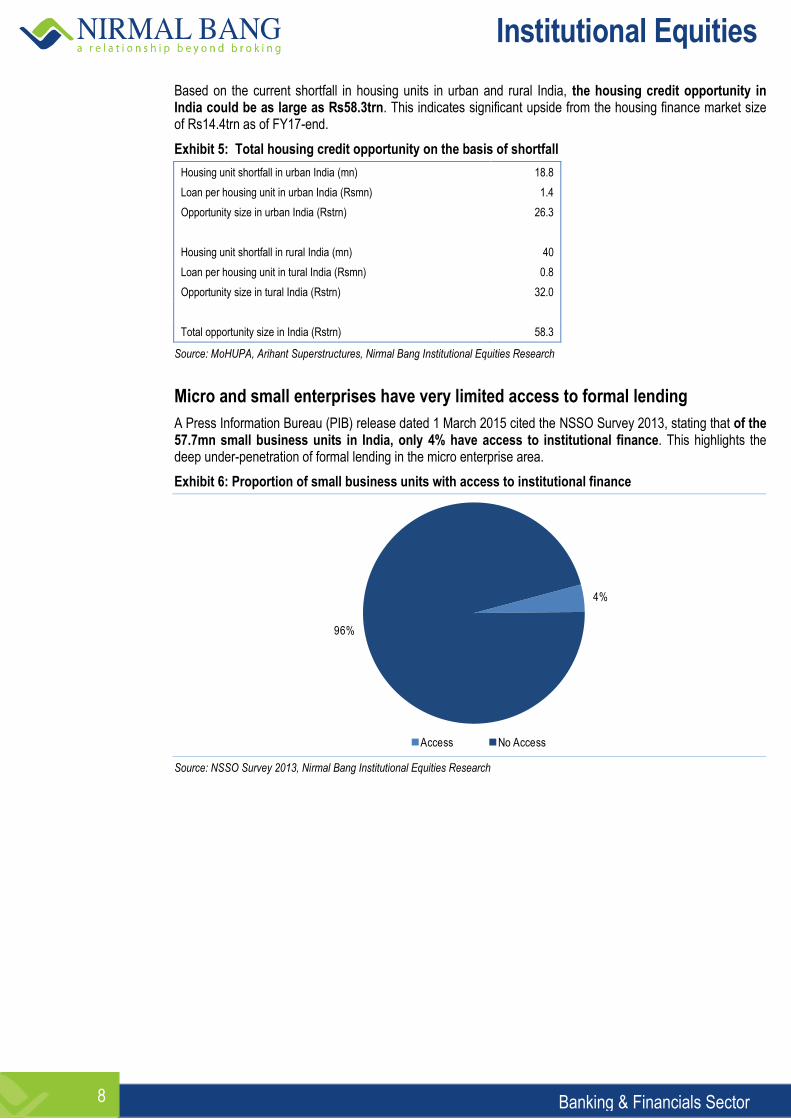
The Ministry of Housing and Urban Poverty Alleviation has earlier indicated that ~95% of housing shortfall in urban India is under EWS (Economically Weaker Section) and LIG (Lower Income Group) categories, which is indicative of the significantly large housing finance opportunity that exists lower down the income pyramid.
Exhibit 4: Proportion of urban housing shortfall falling under EWS/LIG sections
Source: MoHUPA, Nirmal Bang Institutional Equities Research
77.4% 78.1%81.0%
78.0%75.3%
71.7%
64.1%
0%
10%
20%
30%
40%
50%
60%
70%
80%
90%
FY12 FY13 FY14 FY15 FY16 FY17 FY18E
95%
5%
EWS/LIG MIG/HIG
Institutional Equities
Banking & Financials Sector 8
Based on the current shortfall in housing units in urban and rural India, the housing credit opportunity in India could be as large as Rs58.3trn. This indicates significant upside from the housing finance market size of Rs14.4trn as of FY17-end.
Exhibit 5: Total housing credit opportunity on the basis of shortfall
Housing unit shortfall in urban India (mn) 18.8
Loan per housing unit in urban India (Rsmn) 1.4
Opportunity size in urban India (Rstrn) 26.3
Housing unit shortfall in rural India (mn) 40
Loan per housing unit in tural India (Rsmn) 0.8
Opportunity size in tural India (Rstrn) 32.0
Total opportunity size in India (Rstrn) 58.3
Source: MoHUPA, Arihant Superstructures, Nirmal Bang Institutional Equities Research
Micro and small enterprises have very limited access to formal lending
A Press Information Bureau (PIB) release dated 1 March 2015 cited the NSSO Survey 2013, stating that of the 57.7mn small business units in India, only 4% have access to institutional finance. This highlights the deep under-penetration of formal lending in the micro enterprise area.
Exhibit 6: Proportion of small business units with access to institutional finance
Source: NSSO Survey 2013, Nirmal Bang Institutional Equities Research
4%
96%
Access No Access
Institutional Equities
Banking & Financials Sector 9
Contrary to some commentary, microfinance is still an under-penetrated area
There is an understanding that has emerged in some quarters that, since microfinance penetration in some key states has reached figures that are close to the proportion of poor people in those states, microfinance as a loan segment has, therefore, reached a saturation level. This concern is unfounded as only the officially poor cannot be said to be the sole target client set for microfinance lending.
The latest definition of poverty in India is as per the C. Rangarajan panel that set Rs32 and Rs47 spending per day as the thresholds, in rural and urban India, that define the poverty line. These thresholds imply a monthly spending of Rs910 and Rs1,410, respectively. As per this poverty line definition, 29.5% of Indians are living below the poverty line. As the penetration level of microfinance has reached figures similar to this (29.5%) in some key states (it is 14% on pan-India basis), it led to concerns regarding market saturation.
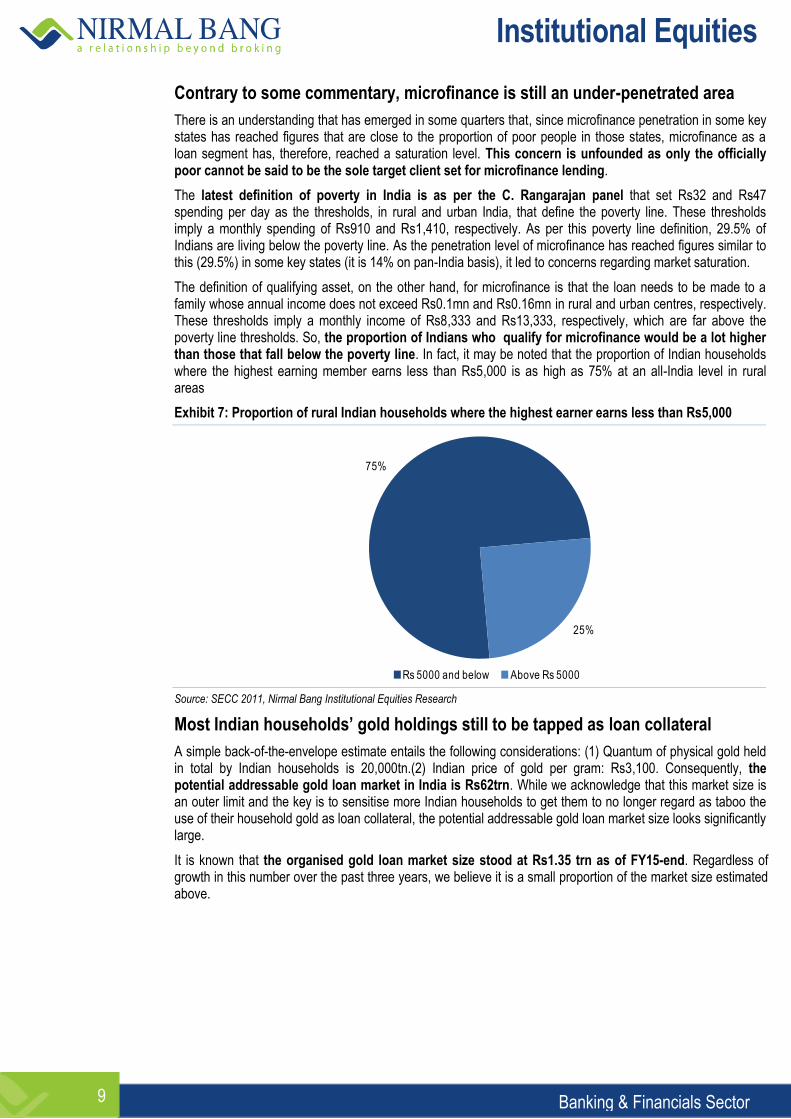
The definition of qualifying asset, on the other hand, for microfinance is that the loan needs to be made to a family whose annual income does not exceed Rs0.1mn and Rs0.16mn in rural and urban centres, respectively. These thresholds imply a monthly income of Rs8,333 and Rs13,333, respectively, which are far above the poverty line thresholds. So, the proportion of Indians who qualify for microfinance would be a lot higher than those that fall below the poverty line. In fact, it may be noted that the proportion of Indian households where the highest earning member earns less than Rs5,000 is as high as 75% at an all-India level in rural areas
Exhibit 7: Proportion of rural Indian households where the highest earner earns less than Rs5,000
Source: SECC 2011, Nirmal Bang Institutional Equities Research
Most Indian households’ gold holdings still to be tapped as loan collateral
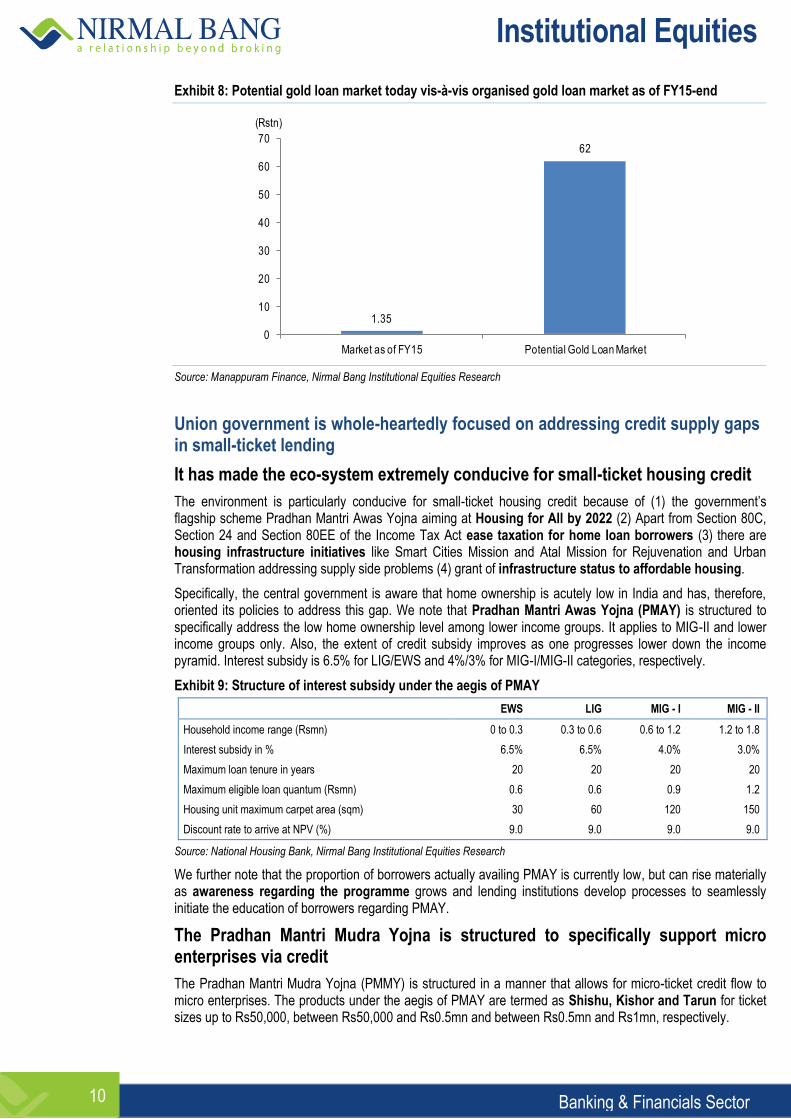
A simple back-of-the-envelope estimate entails the following considerations: (1) Quantum of physical gold held in total by Indian households is 20,000tn.(2) Indian price of gold per gram: Rs3,100. Consequently, the potential addressable gold loan market in India is Rs62trn. While we acknowledge that this market size is an outer limit and the key is to sensitise more Indian households to get them to no longer regard as taboo the use of their household gold as loan collateral, the potential addressable gold loan market size looks significantly large.
It is known that the organised gold loan market size stood at Rs1.35 trn as of FY15-end. Regardless of growth in this number over the past three years, we believe it is a small proportion of the market size estimated above.
75%
25%
Rs 5000 and below Above Rs 5000
Institutional Equities
Banking & Financials Sector 10
Exhibit 8: Potential gold loan market today vis-à-vis organised gold loan market as of FY15-end
Source: Manappuram Finance, Nirmal Bang Institutional Equities Research
Union government is whole-heartedly focused on addressing credit supply gaps in small-ticket lending
It has made the eco-system extremely conducive for small-ticket housing credit
The environment is particularly conducive for small-ticket housing credit because of (1) the government’s flagship scheme Pradhan Mantri Awas Yojna aiming at Housing for All by 2022 (2) Apart from Section 80C, Section 24 and Section 80EE of the Income Tax Act ease taxation for home loan borrowers (3) there are housing infrastructure initiatives like Smart Cities Mission and Atal Mission for Rejuvenation and Urban Transformation addressing supply side problems (4) grant of infrastructure status to affordable housing.
Specifically, the central government is aware that home ownership is acutely low in India and has, therefore, oriented its policies to address this gap. We note that Pradhan Mantri Awas Yojna (PMAY) is structured to specifically address the low home ownership level among lower income groups. It applies to MIG-II and lower income groups only. Also, the extent of credit subsidy improves as one progresses lower down the income pyramid. Interest subsidy is 6.5% for LIG/EWS and 4%/3% for MIG-I/MIG-II categories, respectively.
Exhibit 9: Structure of interest subsidy under the aegis of PMAY
EWS LIG MIG - I MIG - II
Household income range (Rsmn) 0 to 0.3 0.3 to 0.6 0.6 to 1.2 1.2 to 1.8
Interest subsidy in % 6.5% 6.5% 4.0% 3.0%
Maximum loan tenure in years 20 20 20 20
Maximum eligible loan quantum (Rsmn) 0.6 0.6 0.9 1.2
Housing unit maximum carpet area (sqm) 30 60 120 150
Discount rate to arrive at NPV (%) 9.0 9.0 9.0 9.0
Source: National Housing Bank, Nirmal Bang Institutional Equities Research
We further note that the proportion of borrowers actually availing PMAY is currently low, but can rise materially as awareness regarding the programme grows and lending institutions develop processes to seamlessly initiate the education of borrowers regarding PMAY.
The Pradhan Mantri Mudra Yojna is structured to specifically support micro enterprises via credit
The Pradhan Mantri Mudra Yojna (PMMY) is structured in a manner that allows for micro-ticket credit flow to micro enterprises. The products under the aegis of PMAY are termed as Shishu, Kishor and Tarun for ticket sizes up to Rs50,000, between Rs50,000 and Rs0.5mn and between Rs0.5mn and Rs1mn, respectively.
1.35
62
0
10
20
30
40
50
60
70
Market as of FY15 Potential Gold Loan Market
(Rstn)
Institutional Equities
Banking & Financials Sector 11
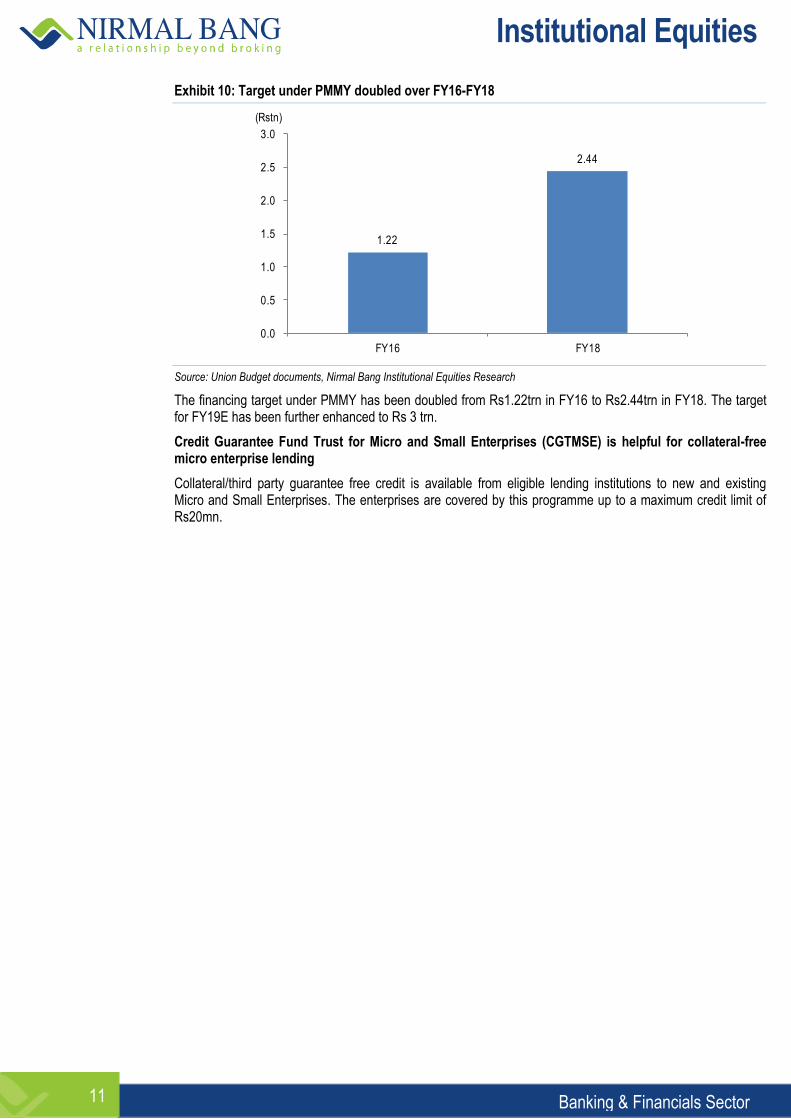
Exhibit 10: Target under PMMY doubled over FY16-FY18
Source: Union Budget documents, Nirmal Bang Institutional Equities Research
The financing target under PMMY has been doubled from Rs1.22trn in FY16 to Rs2.44trn in FY18. The target for FY19E has been further enhanced to Rs 3 trn.
Credit Guarantee Fund Trust for Micro and Small Enterprises (CGTMSE) is helpful for collateral-free micro enterprise lending
Collateral/third party guarantee free credit is available from eligible lending institutions to new and existing Micro and Small Enterprises. The enterprises are covered by this programme up to a maximum credit limit of Rs20mn.
1.22
2.44
0.0
0.5
1.0
1.5
2.0
2.5
3.0
FY16 FY18
(Rstn)
Institutional Equities
Banking & Financials Sector 12
Formal bottom-of-the pyramid lending to get tremendous fillip from Aadhaar coverage
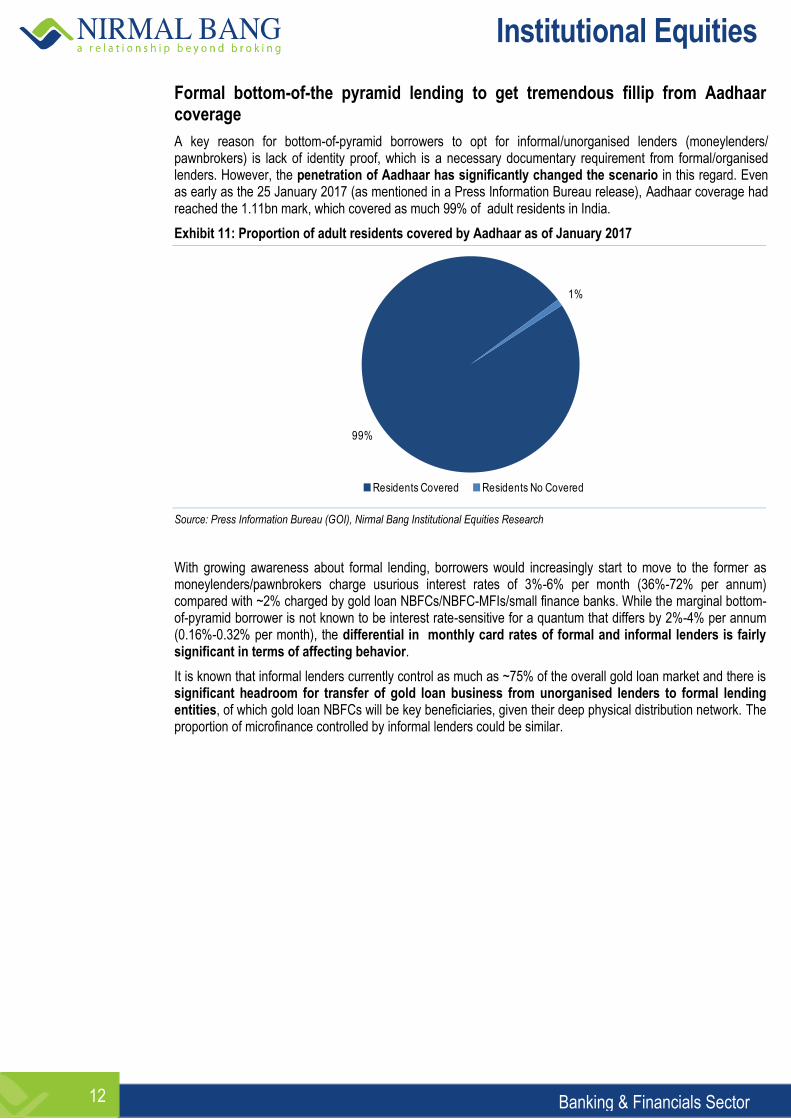
A key reason for bottom-of-pyramid borrowers to opt for informal/unorganised lenders (moneylenders/ pawnbrokers) is lack of identity proof, which is a necessary documentary requirement from formal/organised lenders. However, the penetration of Aadhaar has significantly changed the scenario in this regard. Even as early as the 25 January 2017 (as mentioned in a Press Information Bureau release), Aadhaar coverage had reached the 1.11bn mark, which covered as much 99% of adult residents in India.
Exhibit 11: Proportion of adult residents covered by Aadhaar as of January 2017
Source: Press Information Bureau (GOI), Nirmal Bang Institutional Equities Research
With growing awareness about formal lending, borrowers would increasingly start to move to the former as moneylenders/pawnbrokers charge usurious interest rates of 3%-6% per month (36%-72% per annum) compared with ~2% charged by gold loan NBFCs/NBFC-MFIs/small finance banks. While the marginal bottom-of-pyramid borrower is not known to be interest rate-sensitive for a quantum that differs by 2%-4% per annum (0.16%-0.32% per month), the differential in monthly card rates of formal and informal lenders is fairly significant in terms of affecting behavior.
It is known that informal lenders currently control as much as ~75% of the overall gold loan market and there is significant headroom for transfer of gold loan business from unorganised lenders to formal lending entities, of which gold loan NBFCs will be key beneficiaries, given their deep physical distribution network. The proportion of microfinance controlled by informal lenders could be similar.
99%
1%
Residents Covered Residents No Covered
Institutional Equities
Banking & Financials Sector 13
Regulatory regime providing significant incremental fillip for bank lending to broader MSME segment
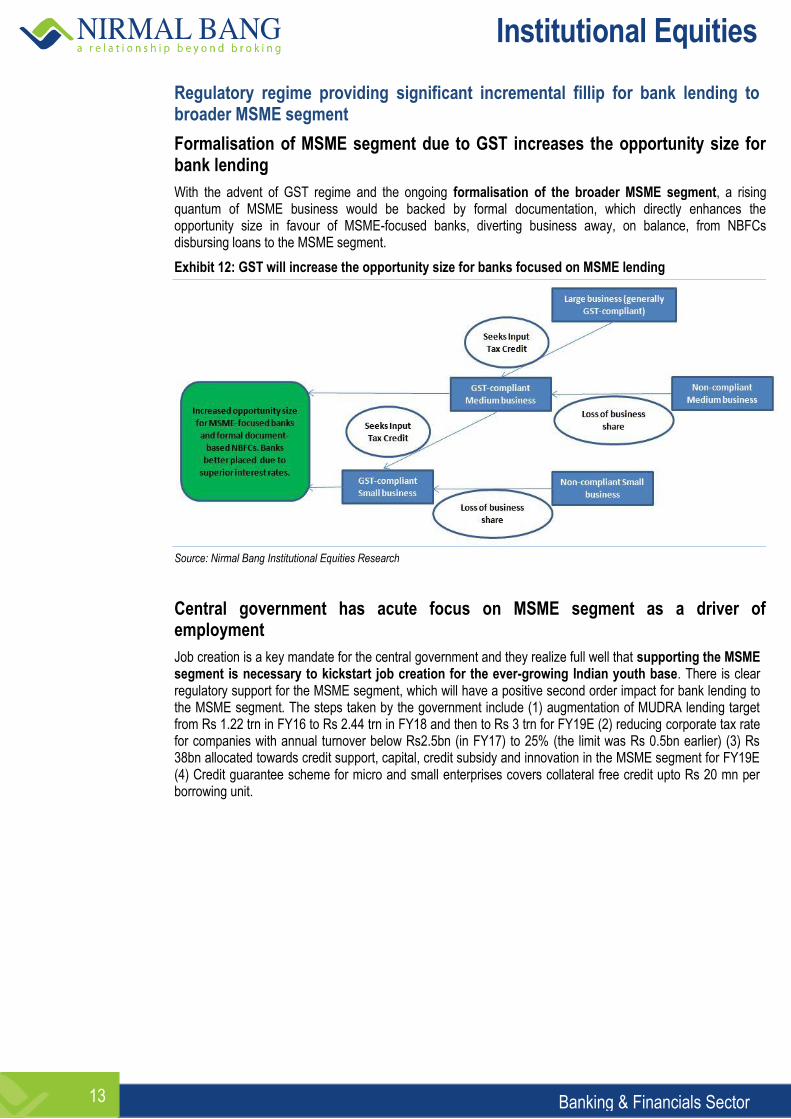
Formalisation of MSME segment due to GST increases the opportunity size for bank lending
With the advent of GST regime and the ongoing formalisation of the broader MSME segment, a rising quantum of MSME business would be backed by formal documentation, which directly enhances the opportunity size in favour of MSME-focused banks, diverting business away, on balance, from NBFCs disbursing loans to the MSME segment.
Exhibit 12: GST will increase the opportunity size for banks focused on MSME lending
Source: Nirmal Bang Institutional Equities Research
Central government has acute focus on MSME segment as a driver of employment
Job creation is a key mandate for the central government and they realize full well that supporting the MSME segment is necessary to kickstart job creation for the ever-growing Indian youth base. There is clear regulatory support for the MSME segment, which will have a positive second order impact for bank lending to the MSME segment. The steps taken by the government include (1) augmentation of MUDRA lending target from Rs 1.22 trn in FY16 to Rs 2.44 trn in FY18 and then to Rs 3 trn for FY19E (2) reducing corporate tax rate for companies with annual turnover below Rs2.5bn (in FY17) to 25% (the limit was Rs 0.5bn earlier) (3) Rs 38bn allocated towards credit support, capital, credit subsidy and innovation in the MSME segment for FY19E (4) Credit guarantee scheme for micro and small enterprises covers collateral free credit upto Rs 20 mn per borrowing unit.
Institutional Equities
Banking & Financials Sector 14
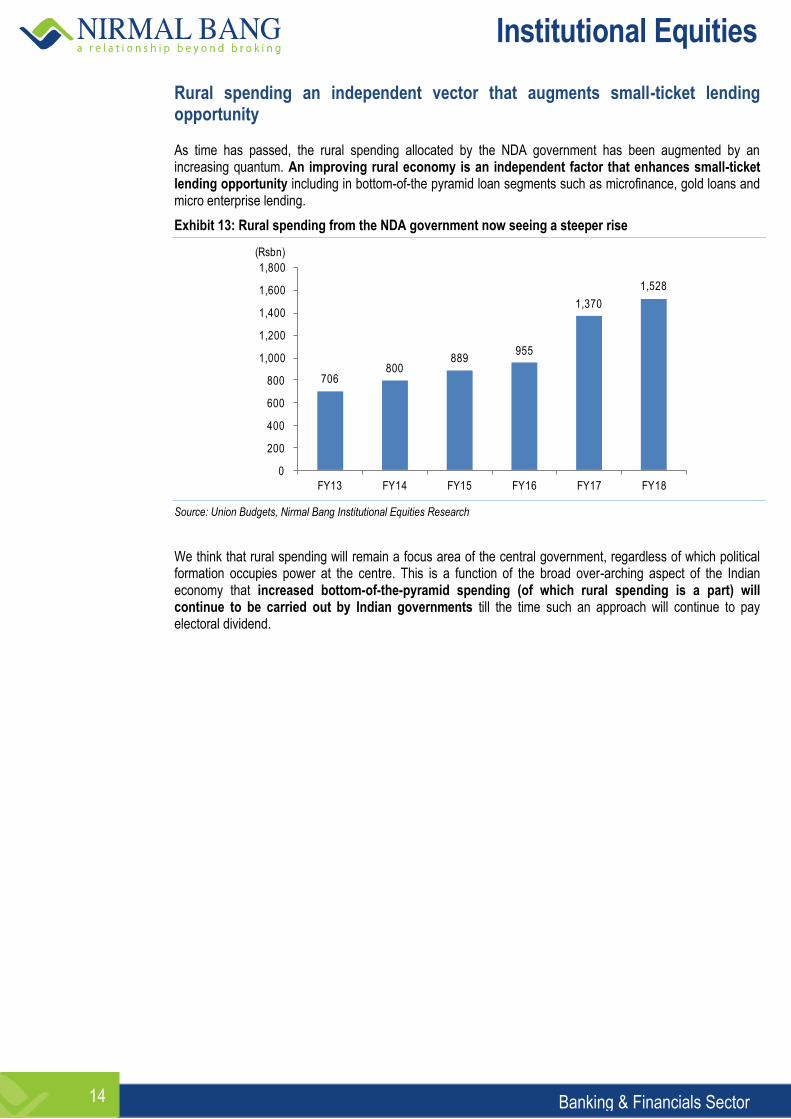
Rural spending an independent vector that augments small-ticket lending opportunity As time has passed, the rural spending allocated by the NDA government has been augmented by an increasing quantum. An improving rural economy is an independent factor that enhances small-ticket lending opportunity including in bottom-of-the pyramid loan segments such as microfinance, gold loans and micro enterprise lending.
Exhibit 13: Rural spending from the NDA government now seeing a steeper rise
Source: Union Budgets, Nirmal Bang Institutional Equities Research
We think that rural spending will remain a focus area of the central government, regardless of which political formation occupies power at the centre. This is a function of the broad over-arching aspect of the Indian economy that increased bottom-of-the-pyramid spending (of which rural spending is a part) will continue to be carried out by Indian governments till the time such an approach will continue to pay electoral dividend.
706800
889955
1,370
1,528
0
200
400
600
800
1,000
1,200
1,400
1,600
1,800
FY13 FY14 FY15 FY16 FY17 FY18
(Rsbn)

Institutional Equities
Banking & Financials Sector 15
This page has been intentionally left blank
Institutional Equities
Banking & Financials Sector 16
Company Section
Institutional Equities
Initi
atin
g C
over
age
Reuters: RATB.NS; Bloomberg: RBK IN
RBL Bank
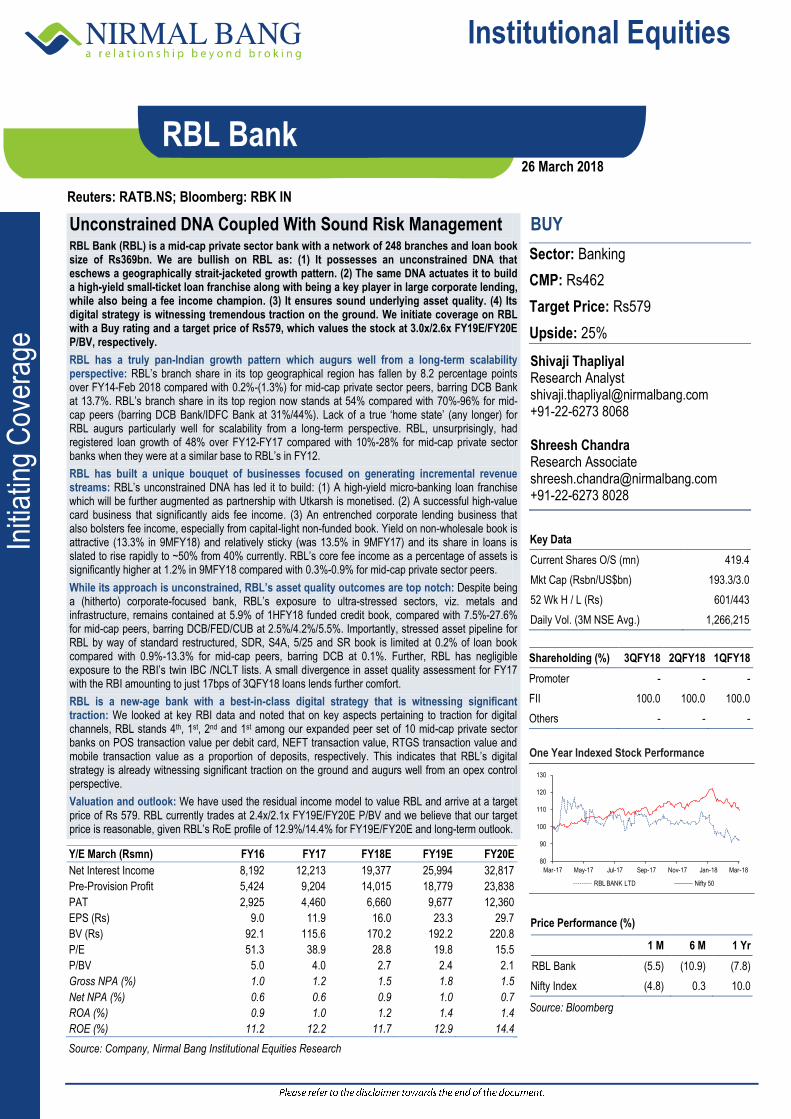
Unconstrained DNA Coupled With Sound Risk Management RBL Bank (RBL) is a mid-cap private sector bank with a network of 248 branches and loan book size of Rs369bn. We are bullish on RBL as: (1) It possesses an unconstrained DNA that eschews a geographically strait-jacketed growth pattern. (2) The same DNA actuates it to build a high-yield small-ticket loan franchise along with being a key player in large corporate lending, while also being a fee income champion. (3) It ensures sound underlying asset quality. (4) Its digital strategy is witnessing tremendous traction on the ground. We initiate coverage on RBL with a Buy rating and a target price of Rs579, which values the stock at 3.0x/2.6x FY19E/FY20E P/BV, respectively.
RBL has a truly pan-Indian growth pattern which augurs well from a long-term scalability perspective: RBL’s branch share in its top geographical region has fallen by 8.2 percentage points over FY14-Feb 2018 compared with 0.2%-(1.3%) for mid-cap private sector peers, barring DCB Bank at 13.7%. RBL’s branch share in its top region now stands at 54% compared with 70%-96% for mid-cap peers (barring DCB Bank/IDFC Bank at 31%/44%). Lack of a true ‘home state’ (any longer) for RBL augurs particularly well for scalability from a long-term perspective. RBL, unsurprisingly, had registered loan growth of 48% over FY12-FY17 compared with 10%-28% for mid-cap private sector banks when they were at a similar base to RBL’s in FY12.
RBL has built a unique bouquet of businesses focused on generating incremental revenue streams: RBL’s unconstrained DNA has led it to build: (1) A high-yield micro-banking loan franchise which will be further augmented as partnership with Utkarsh is monetised. (2) A successful high-value card business that significantly aids fee income. (3) An entrenched corporate lending business that also bolsters fee income, especially from capital-light non-funded book. Yield on non-wholesale book is attractive (13.3% in 9MFY18) and relatively sticky (was 13.5% in 9MFY17) and its share in loans is slated to rise rapidly to ~50% from 40% currently. RBL’s core fee income as a percentage of assets is significantly higher at 1.2% in 9MFY18 compared with 0.3%-0.9% for mid-cap private sector peers.
While its approach is unconstrained, RBL’s asset quality outcomes are top notch: Despite being a (hitherto) corporate-focused bank, RBL’s exposure to ultra-stressed sectors, viz. metals and infrastructure, remains contained at 5.9% of 1HFY18 funded credit book, compared with 7.5%-27.6% for mid-cap peers, barring DCB/FED/CUB at 2.5%/4.2%/5.5%. Importantly, stressed asset pipeline for RBL by way of standard restructured, SDR, S4A, 5/25 and SR book is limited at 0.2% of loan book compared with 0.9%-13.3% for mid-cap peers, barring DCB at 0.1%. Further, RBL has negligible exposure to the RBI’s twin IBC /NCLT lists. A small divergence in asset quality assessment for FY17 with the RBI amounting to just 17bps of 3QFY18 loans lends further comfort.
RBL is a new-age bank with a best-in-class digital strategy that is witnessing significant traction: We looked at key RBI data and noted that on key aspects pertaining to traction for digital channels, RBL stands 4th, 1st, 2nd and 1st among our expanded peer set of 10 mid-cap private sector banks on POS transaction value per debit card, NEFT transaction value, RTGS transaction value and mobile transaction value as a proportion of deposits, respectively. This indicates that RBL’s digital strategy is already witnessing significant traction on the ground and augurs well from an opex control perspective.
Valuation and outlook: We have used the residual income model to value RBL and arrive at a target price of Rs 579. RBL currently trades at 2.4x/2.1x FY19E/FY20E P/BV and we believe that our target price is reasonable, given RBL’s RoE profile of 12.9%/14.4% for FY19E/FY20E and long-term outlook.
BUY
Sector: Banking
CMP: Rs462
Target Price: Rs579
Upside: 25%
Shivaji Thapliyal Research Analyst [email protected] +91-22-6273 8068 Shreesh Chandra Research Associate [email protected] +91-22-6273 8028
Key Data
Current Shares O/S (mn) 419.4
Mkt Cap (Rsbn/US$bn) 193.3/3.0
52 Wk H / L (Rs) 601/443
Daily Vol. (3M NSE Avg.) 1,266,215
Shareholding (%) 3QFY18 2QFY18 1QFY18
Promoter - - -
FII 100.0 100.0 100.0
Others - - -
One Year Indexed Stock Performance
Price Performance (%)
1 M 6 M 1 Yr
RBL Bank (5.5) (10.9) (7.8)
Nifty Index (4.8) 0.3 10.0
Source: Bloomberg
Y/E March (Rsmn) FY16 FY17 FY18E FY19E FY20E
Net Interest Income 8,192 12,213 19,377 25,994 32,817
Pre-Provision Profit 5,424 9,204 14,015 18,779 23,838
PAT 2,925 4,460 6,660 9,677 12,360
EPS (Rs) 9.0 11.9 16.0 23.3 29.7
BV (Rs) 92.1 115.6 170.2 192.2 220.8
P/E 51.3 38.9 28.8 19.8 15.5
P/BV 5.0 4.0 2.7 2.4 2.1
Gross NPA (%) 1.0 1.2 1.5 1.8 1.5
Net NPA (%) 0.6 0.6 0.9 1.0 0.7
ROA (%) 0.9 1.0 1.2 1.4 1.4
ROE (%) 11.2 12.2 11.7 12.9 14.4
Source: Company, Nirmal Bang Institutional Equities Research
80
90
100
110
120
130
Mar-17 May-17 Jul-17 Sep-17 Nov-17 Jan-18 Mar-18
RBL BANK LTD Nifty 50
26 March 2018
Institutional Equities
RBL Bank 18
RBL possesses a significantly differentiated growth DNA compared with mid-cap peers
It is important, we believe, to understand the differentiated DNA of RBL to adequately appreciate its long-term potential. It is a bank, we stress, that possesses a truly unconstrained strategy that is focused on: (1) Maximizing the number of revenue streams. (2) Maximising the revenues from a given income stream. The bank is able to execute its strategy without unduly diluting risk management practices.
Its unconstrained approach is typified by: (1) Rapid geographical diversification. (2) Presence in loan products across the ticket size curve. (3) A highly robust fee income engine.
Intent and ability to become a truly pan-India bank brand augurs well for RBL from a scalability perspective
When RBL’s previous avatar of Ratnakar Bank witnessed management change (current CEO Mr. Vishwavir Ahuja joined in July 2010), the latter was a regional bank of limited ambition. The acquisition was a watershed moment as it effectively gave the new management a carte blanche to execute a strategy that was not held back by legacy and rather started off with a new slate in what was effectively a greenfield endeavour.
Several mid-cap banks have a regional flavour to their operations and the same is reflected in the composition of staff, both junior and senior, and in a geographically contiguous growth pattern. Such banks lack the ambition of becoming a truly pan-India bank brand, but RBL has done away with such legacy and this augurs well for it from a scalability perspective.
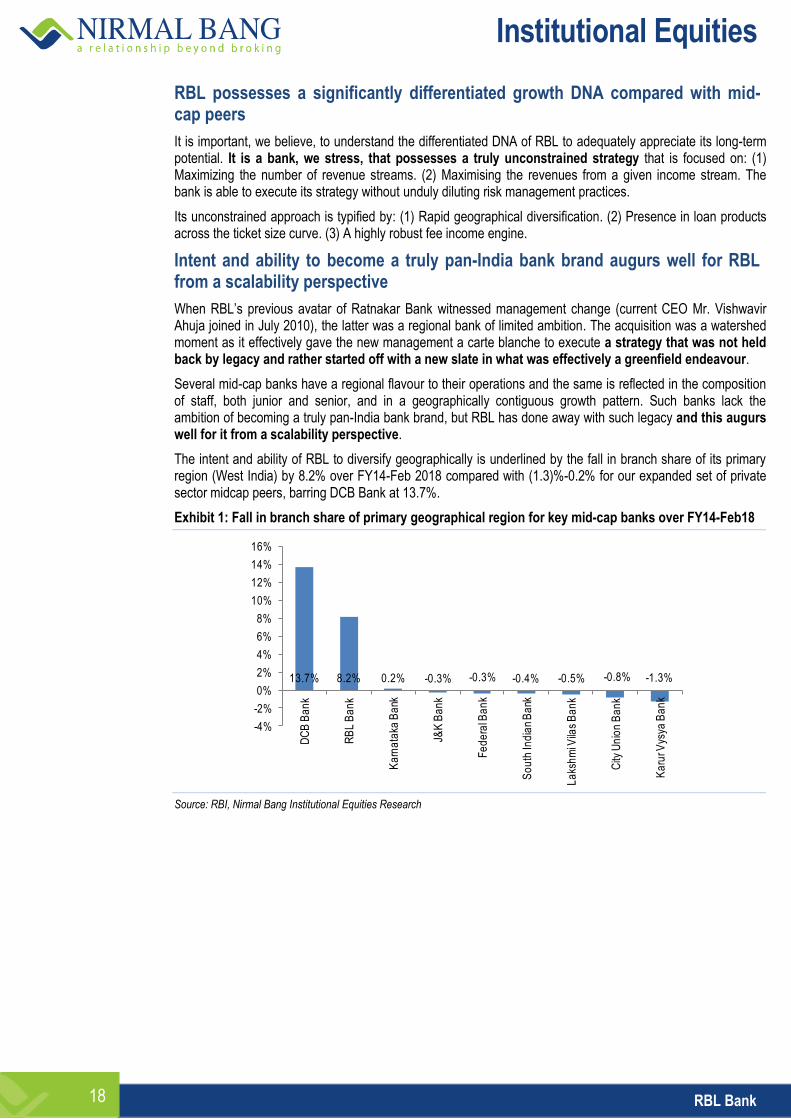
The intent and ability of RBL to diversify geographically is underlined by the fall in branch share of its primary region (West India) by 8.2% over FY14-Feb 2018 compared with (1.3)%-0.2% for our expanded set of private sector midcap peers, barring DCB Bank at 13.7%.
Exhibit 1: Fall in branch share of primary geographical region for key mid-cap banks over FY14-Feb18
Source: RBI, Nirmal Bang Institutional Equities Research
13.7% 8.2% 0.2% -0.3% -0.3% -0.4% -0.5% -0.8% -1.3%
-4%
-2%
0%
2%
4%
6%
8%
10%
12%
14%
16%
DC
B B
an
k
RB
L B
an
k
Ka
rna
taka
Ba
nk
J&K
Ba
nk
Fe
de
ral B
an
k
So
uth
Ind
ian
Ba
nk
La
ksh
mi V
ilas
Ba
nk
City
Un
ion
Ba
nk
Ka
rur V
ysya
Ba
nk
Institutional Equities
RBL Bank 19
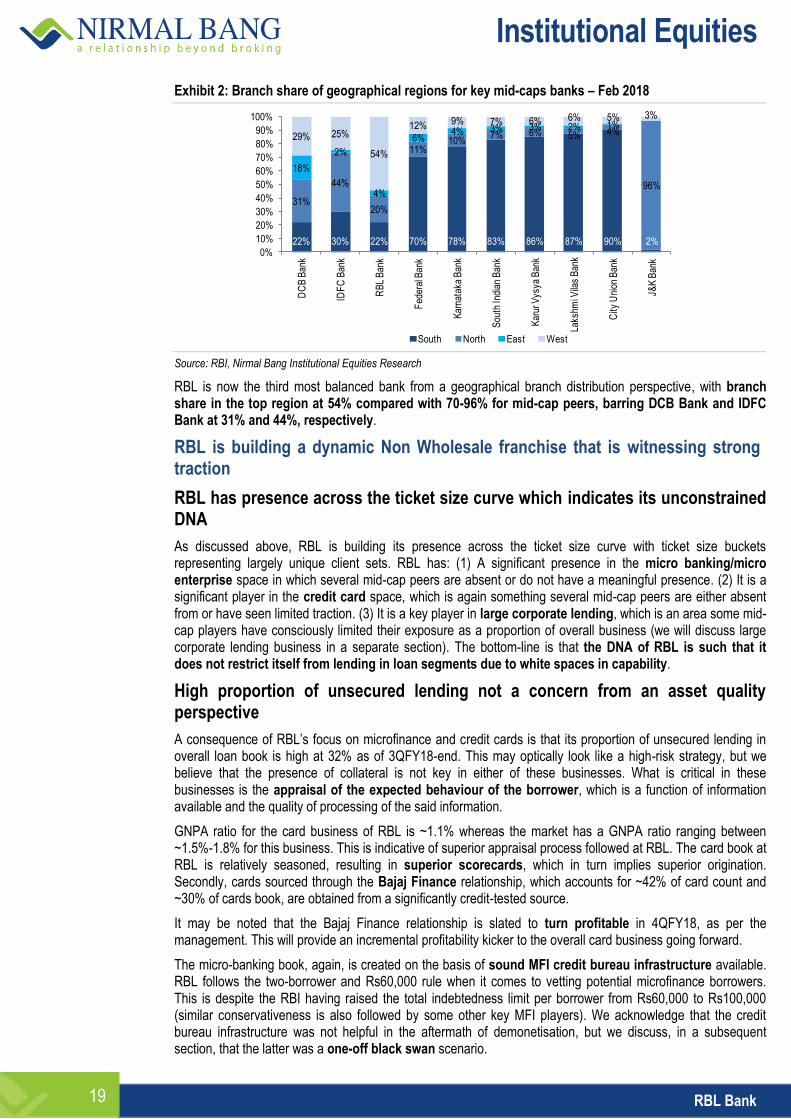
Exhibit 2: Branch share of geographical regions for key mid-caps banks – Feb 2018
Source: RBI, Nirmal Bang Institutional Equities Research
RBL is now the third most balanced bank from a geographical branch distribution perspective, with branch share in the top region at 54% compared with 70-96% for mid-cap peers, barring DCB Bank and IDFC Bank at 31% and 44%, respectively.
RBL is building a dynamic Non Wholesale franchise that is witnessing strong traction
RBL has presence across the ticket size curve which indicates its unconstrained DNA
As discussed above, RBL is building its presence across the ticket size curve with ticket size buckets representing largely unique client sets. RBL has: (1) A significant presence in the micro banking/micro enterprise space in which several mid-cap peers are absent or do not have a meaningful presence. (2) It is a significant player in the credit card space, which is again something several mid-cap peers are either absent from or have seen limited traction. (3) It is a key player in large corporate lending, which is an area some mid-cap players have consciously limited their exposure as a proportion of overall business (we will discuss large corporate lending business in a separate section). The bottom-line is that the DNA of RBL is such that it does not restrict itself from lending in loan segments due to white spaces in capability.
High proportion of unsecured lending not a concern from an asset quality perspective
A consequence of RBL’s focus on microfinance and credit cards is that its proportion of unsecured lending in overall loan book is high at 32% as of 3QFY18-end. This may optically look like a high-risk strategy, but we believe that the presence of collateral is not key in either of these businesses. What is critical in these businesses is the appraisal of the expected behaviour of the borrower, which is a function of information available and the quality of processing of the said information.
GNPA ratio for the card business of RBL is ~1.1% whereas the market has a GNPA ratio ranging between ~1.5%-1.8% for this business. This is indicative of superior appraisal process followed at RBL. The card book at RBL is relatively seasoned, resulting in superior scorecards, which in turn implies superior origination. Secondly, cards sourced through the Bajaj Finance relationship, which accounts for ~42% of card count and ~30% of cards book, are obtained from a significantly credit-tested source.
It may be noted that the Bajaj Finance relationship is slated to turn profitable in 4QFY18, as per the management. This will provide an incremental profitability kicker to the overall card business going forward.
The micro-banking book, again, is created on the basis of sound MFI credit bureau infrastructure available. RBL follows the two-borrower and Rs60,000 rule when it comes to vetting potential microfinance borrowers. This is despite the RBI having raised the total indebtedness limit per borrower from Rs60,000 to Rs100,000 (similar conservativeness is also followed by some other key MFI players). We acknowledge that the credit bureau infrastructure was not helpful in the aftermath of demonetisation, but we discuss, in a subsequent section, that the latter was a one-off black swan scenario.
22% 30% 22% 70% 78% 83% 86% 87% 90% 2%
31%
44%
20%
11%10%
7% 6% 5% 4%
96%
18%
2%
4%
6%4% 3% 3% 2% 1%
29% 25%
54%
12% 9% 7% 6% 6% 5% 3%
0%
10%
20%
30%
40%
50%
60%
70%
80%
90%
100%
DC
B B
ank
IDF
C B
ank
RB
L B
ank
Fed
eral
Ban
k
Kar
nata
ka B
ank
Sou
th In
dian
Ban
k
Kar
ur V
ysya
Ban
k
Laks
hmi V
ilas
Ban
k
City
Uni
on B
ank
J&K
Ban
k
South North East West
Institutional Equities
RBL Bank 20
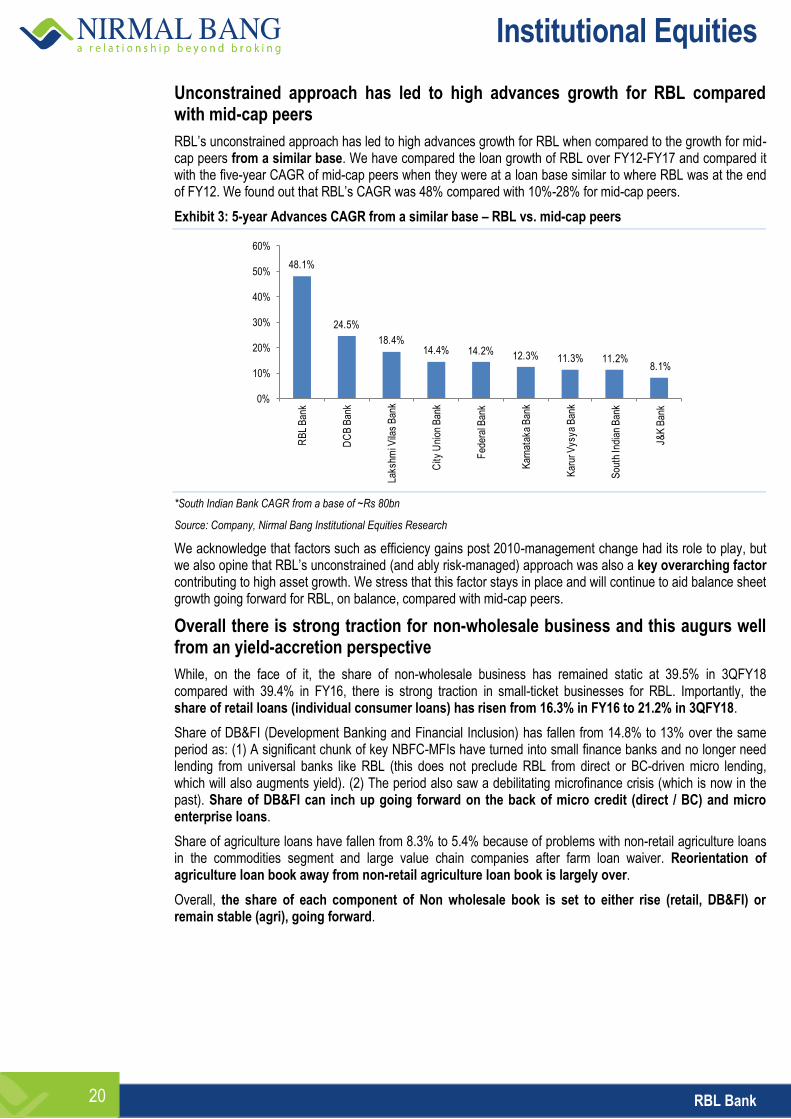
Unconstrained approach has led to high advances growth for RBL compared with mid-cap peers
RBL’s unconstrained approach has led to high advances growth for RBL when compared to the growth for mid-cap peers from a similar base. We have compared the loan growth of RBL over FY12-FY17 and compared it with the five-year CAGR of mid-cap peers when they were at a loan base similar to where RBL was at the end of FY12. We found out that RBL’s CAGR was 48% compared with 10%-28% for mid-cap peers.
Exhibit 3: 5-year Advances CAGR from a similar base – RBL vs. mid-cap peers
*South Indian Bank CAGR from a base of ~Rs 80bn
Source: Company, Nirmal Bang Institutional Equities Research
We acknowledge that factors such as efficiency gains post 2010-management change had its role to play, but we also opine that RBL’s unconstrained (and ably risk-managed) approach was also a key overarching factor contributing to high asset growth. We stress that this factor stays in place and will continue to aid balance sheet growth going forward for RBL, on balance, compared with mid-cap peers.
Overall there is strong traction for non-wholesale business and this augurs well from an yield-accretion perspective
While, on the face of it, the share of non-wholesale business has remained static at 39.5% in 3QFY18 compared with 39.4% in FY16, there is strong traction in small-ticket businesses for RBL. Importantly, the share of retail loans (individual consumer loans) has risen from 16.3% in FY16 to 21.2% in 3QFY18.
Share of DB&FI (Development Banking and Financial Inclusion) has fallen from 14.8% to 13% over the same period as: (1) A significant chunk of key NBFC-MFIs have turned into small finance banks and no longer need lending from universal banks like RBL (this does not preclude RBL from direct or BC-driven micro lending, which will also augments yield). (2) The period also saw a debilitating microfinance crisis (which is now in the past). Share of DB&FI can inch up going forward on the back of micro credit (direct / BC) and micro enterprise loans.
Share of agriculture loans have fallen from 8.3% to 5.4% because of problems with non-retail agriculture loans in the commodities segment and large value chain companies after farm loan waiver. Reorientation of agriculture loan book away from non-retail agriculture loan book is largely over.
Overall, the share of each component of Non wholesale book is set to either rise (retail, DB&FI) or remain stable (agri), going forward.
48.1%
24.5%
18.4%14.4% 14.2% 12.3% 11.3% 11.2%
8.1%
0%
10%
20%
30%
40%
50%
60%
RB
L B
ank
DC
B B
ank
Laks
hmi V
ilas
Ban
k
City
Uni
on B
ank
Fed
eral
Ban
k
Kar
nata
ka B
ank
Kar
ur V
ysya
Ban
k
Sou
th In
dian
Ban
k
J&K
Ban
k
Institutional Equities
RBL Bank 21
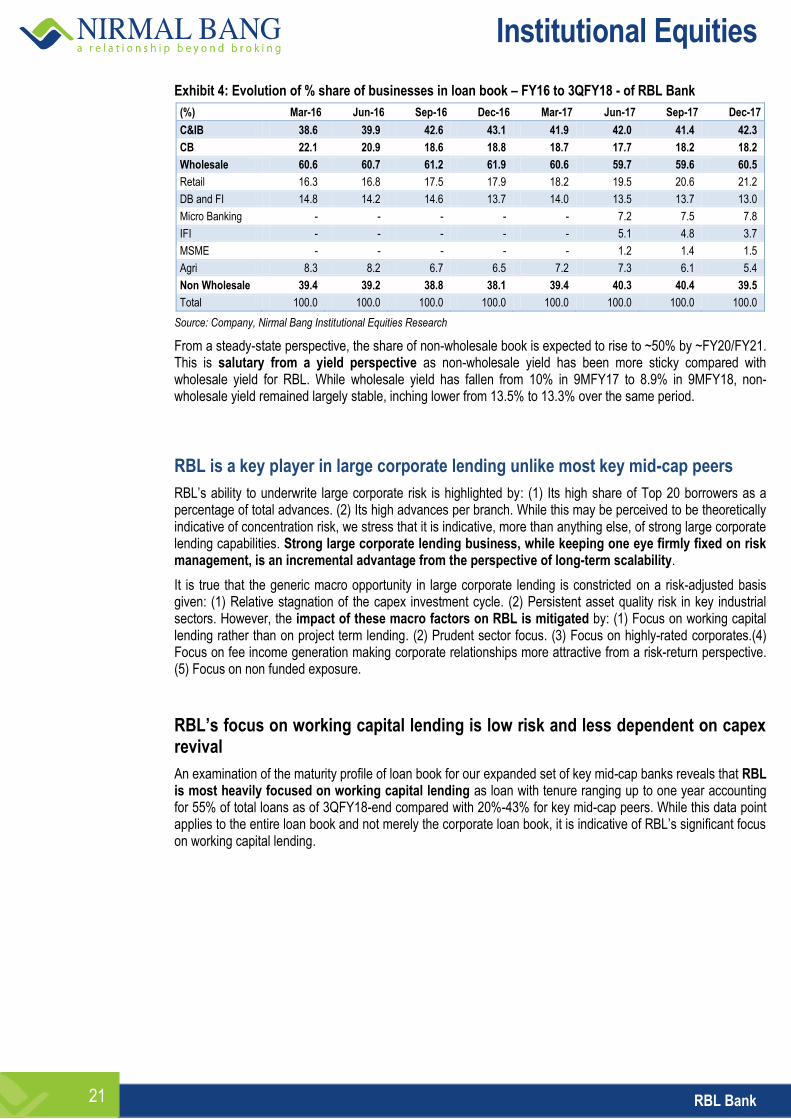
Exhibit 4: Evolution of % share of businesses in loan book – FY16 to 3QFY18 - of RBL Bank
(%) Mar-16 Jun-16 Sep-16 Dec-16 Mar-17 Jun-17 Sep-17 Dec-17
C&IB 38.6 39.9 42.6 43.1 41.9 42.0 41.4 42.3
CB 22.1 20.9 18.6 18.8 18.7 17.7 18.2 18.2
Wholesale 60.6 60.7 61.2 61.9 60.6 59.7 59.6 60.5
Retail 16.3 16.8 17.5 17.9 18.2 19.5 20.6 21.2
DB and FI 14.8 14.2 14.6 13.7 14.0 13.5 13.7 13.0
Micro Banking - - - - - 7.2 7.5 7.8
IFI - - - - - 5.1 4.8 3.7
MSME - - - - - 1.2 1.4 1.5
Agri 8.3 8.2 6.7 6.5 7.2 7.3 6.1 5.4
Non Wholesale 39.4 39.2 38.8 38.1 39.4 40.3 40.4 39.5
Total 100.0 100.0 100.0 100.0 100.0 100.0 100.0 100.0
Source: Company, Nirmal Bang Institutional Equities Research
From a steady-state perspective, the share of non-wholesale book is expected to rise to ~50% by ~FY20/FY21. This is salutary from a yield perspective as non-wholesale yield has been more sticky compared with wholesale yield for RBL. While wholesale yield has fallen from 10% in 9MFY17 to 8.9% in 9MFY18, non-wholesale yield remained largely stable, inching lower from 13.5% to 13.3% over the same period.
RBL is a key player in large corporate lending unlike most key mid-cap peers
RBL’s ability to underwrite large corporate risk is highlighted by: (1) Its high share of Top 20 borrowers as a percentage of total advances. (2) Its high advances per branch. While this may be perceived to be theoretically indicative of concentration risk, we stress that it is indicative, more than anything else, of strong large corporate lending capabilities. Strong large corporate lending business, while keeping one eye firmly fixed on risk management, is an incremental advantage from the perspective of long-term scalability.
It is true that the generic macro opportunity in large corporate lending is constricted on a risk-adjusted basis given: (1) Relative stagnation of the capex investment cycle. (2) Persistent asset quality risk in key industrial sectors. However, the impact of these macro factors on RBL is mitigated by: (1) Focus on working capital lending rather than on project term lending. (2) Prudent sector focus. (3) Focus on highly-rated corporates.(4) Focus on fee income generation making corporate relationships more attractive from a risk-return perspective. (5) Focus on non funded exposure.
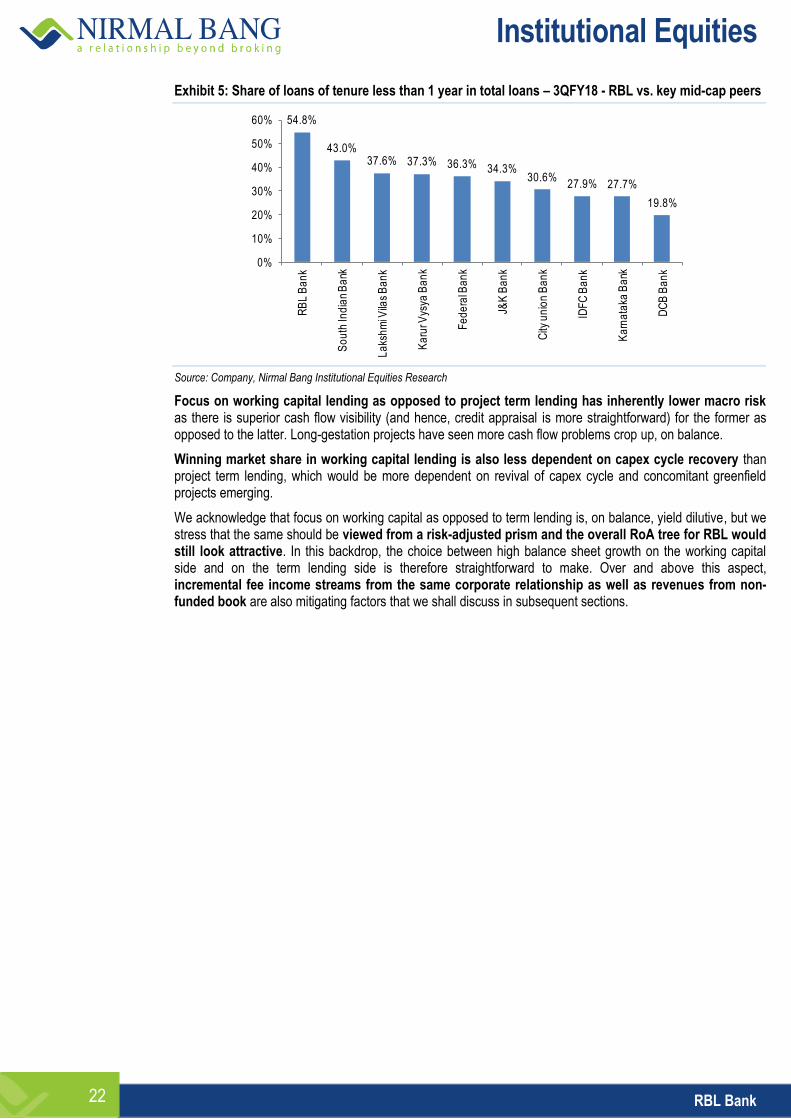
RBL’s focus on working capital lending is low risk and less dependent on capex revival
An examination of the maturity profile of loan book for our expanded set of key mid-cap banks reveals that RBL is most heavily focused on working capital lending as loan with tenure ranging up to one year accounting for 55% of total loans as of 3QFY18-end compared with 20%-43% for key mid-cap peers. While this data point applies to the entire loan book and not merely the corporate loan book, it is indicative of RBL’s significant focus on working capital lending.
Institutional Equities
RBL Bank 22
Exhibit 5: Share of loans of tenure less than 1 year in total loans – 3QFY18 - RBL vs. key mid-cap peers
Source: Company, Nirmal Bang Institutional Equities Research
Focus on working capital lending as opposed to project term lending has inherently lower macro risk as there is superior cash flow visibility (and hence, credit appraisal is more straightforward) for the former as opposed to the latter. Long-gestation projects have seen more cash flow problems crop up, on balance.
Winning market share in working capital lending is also less dependent on capex cycle recovery than project term lending, which would be more dependent on revival of capex cycle and concomitant greenfield projects emerging.
We acknowledge that focus on working capital as opposed to term lending is, on balance, yield dilutive, but we stress that the same should be viewed from a risk-adjusted prism and the overall RoA tree for RBL would still look attractive. In this backdrop, the choice between high balance sheet growth on the working capital side and on the term lending side is therefore straightforward to make. Over and above this aspect, incremental fee income streams from the same corporate relationship as well as revenues from non- funded book are also mitigating factors that we shall discuss in subsequent sections.
54.8%
43.0%37.6% 37.3% 36.3% 34.3%
30.6%27.9% 27.7%
19.8%
0%
10%
20%
30%
40%
50%
60%
RB
L B
an
k
So
uth
Ind
ian
Ba
nk
La
ksh
mi V
ilas
Ba
nk
Ka
rur V
ysya
Ba
nk
Fe
de
ral B
an
k
J&K
Ba
nk
City
un
ion
Ba
nk
IDF
C B
an
k
Ka
rna
taka
Ba
nk
DC
B B
an
k
Institutional Equities
RBL Bank 23
RBL’s risk management practices ensure underlying asset quality risk is under control
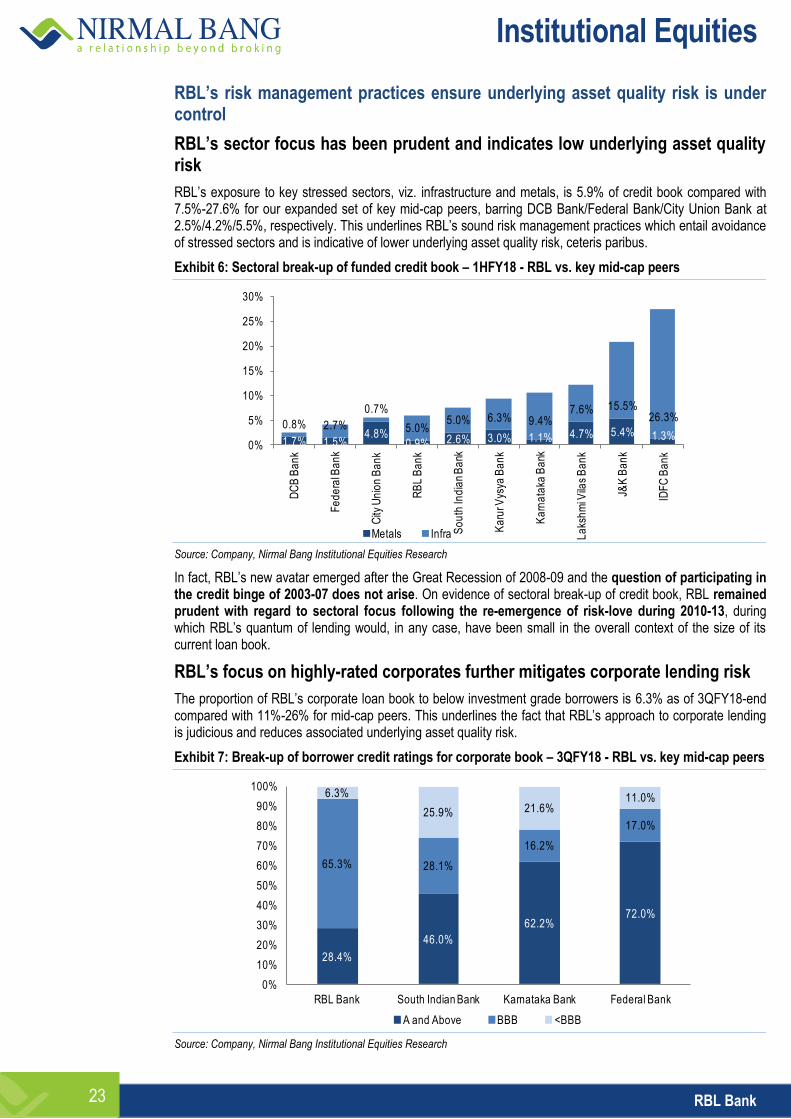
RBL’s sector focus has been prudent and indicates low underlying asset quality risk
RBL’s exposure to key stressed sectors, viz. infrastructure and metals, is 5.9% of credit book compared with 7.5%-27.6% for our expanded set of key mid-cap peers, barring DCB Bank/Federal Bank/City Union Bank at 2.5%/4.2%/5.5%, respectively. This underlines RBL’s sound risk management practices which entail avoidance of stressed sectors and is indicative of lower underlying asset quality risk, ceteris paribus.
Exhibit 6: Sectoral break-up of funded credit book – 1HFY18 - RBL vs. key mid-cap peers
Source: Company, Nirmal Bang Institutional Equities Research
In fact, RBL’s new avatar emerged after the Great Recession of 2008-09 and the question of participating in the credit binge of 2003-07 does not arise. On evidence of sectoral break-up of credit book, RBL remained prudent with regard to sectoral focus following the re-emergence of risk-love during 2010-13, during which RBL’s quantum of lending would, in any case, have been small in the overall context of the size of its current loan book.
RBL’s focus on highly-rated corporates further mitigates corporate lending risk
The proportion of RBL’s corporate loan book to below investment grade borrowers is 6.3% as of 3QFY18-end compared with 11%-26% for mid-cap peers. This underlines the fact that RBL’s approach to corporate lending is judicious and reduces associated underlying asset quality risk.
Exhibit 7: Break-up of borrower credit ratings for corporate book – 3QFY18 - RBL vs. key mid-cap peers
Source: Company, Nirmal Bang Institutional Equities Research
1.7% 1.5%4.8%
0.9% 2.6% 3.0% 1.1% 4.7% 5.4% 1.3%0.8% 2.7%
0.7%
5.0%5.0% 6.3% 9.4%
7.6% 15.5%26.3%
0%
5%
10%
15%
20%
25%
30%D
CB
Ba
nk
Fe
de
ral B
an
k
City
Un
ion
Ba
nk
RB
L B
an
k
So
uth
Ind
ian
Ba
nk
Ka
rur V
ysya
Ba
nk
Ka
rna
taka
Ba
nk
La
ksh
mi V
ilas
Ba
nk
J&K
Ba
nk
IDF
C B
an
k
Metals Infra
28.4%
46.0%
62.2%72.0%
65.3% 28.1%
16.2%
17.0%
6.3%
25.9% 21.6%11.0%
0%
10%
20%
30%
40%
50%
60%
70%
80%
90%
100%
RBL Bank South Indian Bank Karnataka Bank Federal Bank
A and Above BBB <BBB
Institutional Equities
RBL Bank 24
RBL’s stressed asset pipeline is minimal which is also indicative of sound underlying asset quality
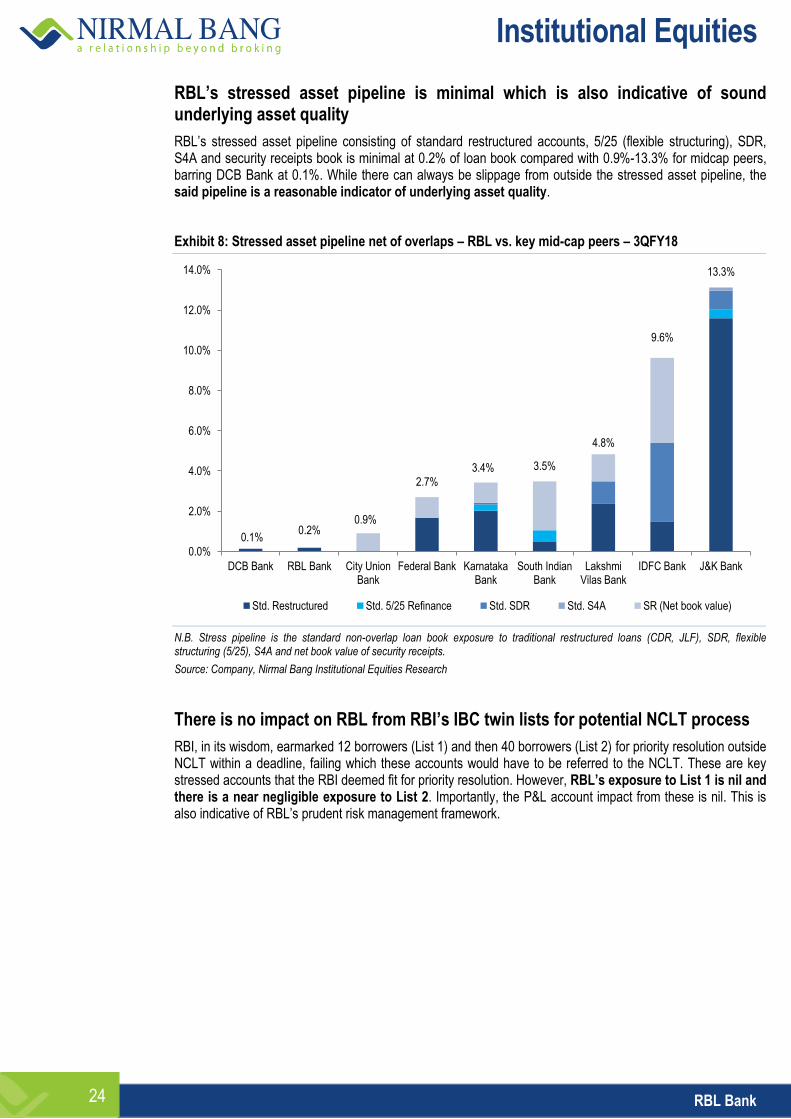
RBL’s stressed asset pipeline consisting of standard restructured accounts, 5/25 (flexible structuring), SDR, S4A and security receipts book is minimal at 0.2% of loan book compared with 0.9%-13.3% for midcap peers, barring DCB Bank at 0.1%. While there can always be slippage from outside the stressed asset pipeline, the said pipeline is a reasonable indicator of underlying asset quality.
Exhibit 8: Stressed asset pipeline net of overlaps – RBL vs. key mid-cap peers – 3QFY18
N.B. Stress pipeline is the standard non-overlap loan book exposure to traditional restructured loans (CDR, JLF), SDR, flexible structuring (5/25), S4A and net book value of security receipts.
Source: Company, Nirmal Bang Institutional Equities Research
There is no impact on RBL from RBI’s IBC twin lists for potential NCLT process
RBI, in its wisdom, earmarked 12 borrowers (List 1) and then 40 borrowers (List 2) for priority resolution outside NCLT within a deadline, failing which these accounts would have to be referred to the NCLT. These are key stressed accounts that the RBI deemed fit for priority resolution. However, RBL’s exposure to List 1 is nil and there is a near negligible exposure to List 2. Importantly, the P&L account impact from these is nil. This is also indicative of RBL’s prudent risk management framework.
0.1% 0.2%
0.9%
2.7%
3.4% 3.5%
4.8%
9.6%
13.3%
0.0%
2.0%
4.0%
6.0%
8.0%
10.0%
12.0%
14.0%
DCB Bank RBL Bank City Union Bank
Federal Bank Karnataka Bank
South Indian Bank
Lakshmi Vilas Bank
IDFC Bank J&K Bank
Std. Restructured Std. 5/25 Refinance Std. SDR Std. S4A SR (Net book value)
Institutional Equities
RBL Bank 25
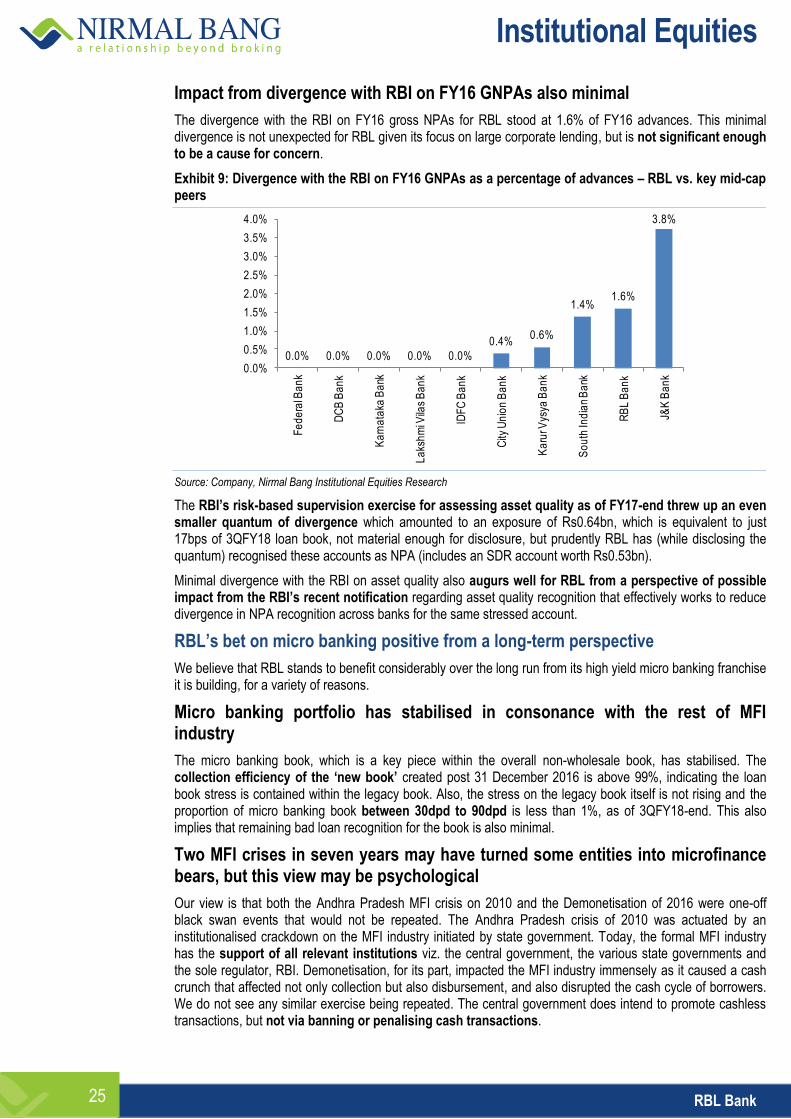
Impact from divergence with RBI on FY16 GNPAs also minimal
The divergence with the RBI on FY16 gross NPAs for RBL stood at 1.6% of FY16 advances. This minimal divergence is not unexpected for RBL given its focus on large corporate lending, but is not significant enough to be a cause for concern.
Exhibit 9: Divergence with the RBI on FY16 GNPAs as a percentage of advances – RBL vs. key mid-cap peers
Source: Company, Nirmal Bang Institutional Equities Research
The RBI’s risk-based supervision exercise for assessing asset quality as of FY17-end threw up an even smaller quantum of divergence which amounted to an exposure of Rs0.64bn, which is equivalent to just 17bps of 3QFY18 loan book, not material enough for disclosure, but prudently RBL has (while disclosing the quantum) recognised these accounts as NPA (includes an SDR account worth Rs0.53bn).
Minimal divergence with the RBI on asset quality also augurs well for RBL from a perspective of possible impact from the RBI’s recent notification regarding asset quality recognition that effectively works to reduce divergence in NPA recognition across banks for the same stressed account.
RBL’s bet on micro banking positive from a long-term perspective
We believe that RBL stands to benefit considerably over the long run from its high yield micro banking franchise it is building, for a variety of reasons.
Micro banking portfolio has stabilised in consonance with the rest of MFI industry
The micro banking book, which is a key piece within the overall non-wholesale book, has stabilised. The collection efficiency of the ‘new book’ created post 31 December 2016 is above 99%, indicating the loan book stress is contained within the legacy book. Also, the stress on the legacy book itself is not rising and the proportion of micro banking book between 30dpd to 90dpd is less than 1%, as of 3QFY18-end. This also implies that remaining bad loan recognition for the book is also minimal.
Two MFI crises in seven years may have turned some entities into microfinance bears, but this view may be psychological
Our view is that both the Andhra Pradesh MFI crisis on 2010 and the Demonetisation of 2016 were one-off black swan events that would not be repeated. The Andhra Pradesh crisis of 2010 was actuated by an institutionalised crackdown on the MFI industry initiated by state government. Today, the formal MFI industry has the support of all relevant institutions viz. the central government, the various state governments and the sole regulator, RBI. Demonetisation, for its part, impacted the MFI industry immensely as it caused a cash crunch that affected not only collection but also disbursement, and also disrupted the cash cycle of borrowers. We do not see any similar exercise being repeated. The central government does intend to promote cashless transactions, but not via banning or penalising cash transactions.
0.0% 0.0% 0.0% 0.0% 0.0%
0.4%0.6%
1.4%1.6%
3.8%
0.0%
0.5%
1.0%
1.5%
2.0%
2.5%
3.0%
3.5%
4.0%
Fe
de
ral B
an
k
DC
B B
an
k
Ka
rna
taka
Ba
nk
La
ksh
mi V
ilas
Ba
nk
IDF
C B
an
k
City
Un
ion
Ba
nk
Ka
rur V
ysya
Ba
nk
So
uth
Ind
ian
Ba
nk
RB
L B
an
k
J&K
Ba
nk
Institutional Equities
RBL Bank 26
One key listed NBFC-MFI turned small finance bank, Equitas Holdings, has consciously decided to prune its microfinance book by turning away renewal customers. We believe this decision may have been taken because of psychological exhaustion from the collateral damage suffered from both MFI crises (Equitas had a significant exposure to Andhra Pradesh during 2010). Another key listed NBFC-MFI turned small finance bank, Ujjivan Financial Services (under our coverage) does not share Equitas’ view and will not consciously prune its microfinance exposure.
Universal banks with a focused approach for microfinance to benefit from reduced competitive intensity
The Demonetisation event had a two-fold impact that served to reduce competitive intensity in the formal micro lending industry: (1) Weak microfinance institutions that lack adequate capital (all in the unlisted space) have either ceased operations or significantly withdrawn from the micro lending industry (2) Key erstwhile NBFC-MFIs which have successfully obtained small finance bank licences have scaled back growth aspirations in the microfinance segment as the transformation into a bank entails: (a) Egregiously high opex for building bank franchise and infrastructure (b) Allocation of capital into areas other than microfinance.
This leaves universal banks with a focused approach, i.e. those which have actively built reach either directly or through partnerships, and standalone NBFC-MFIs to benefit from the significantly reduced competitive intensity. It would be in order to mention here that while NBFC-MFIs would be beneficiaries from a growth perspective, universal banks would be even better off since constraining regulations such as margin cap are not applicable to the latter.
RBL will finally get to utilise Utkarsh Microfinance’s distribution network to provide incremental fillip to micro-banking business
An incremental kicker for the micro banking book will come from joint services that are on the anvil with an associate company, Utkarsh Microfinance. RBL holds 9.99% stake in Utkarsh Microfinance but so far Utkarsh has not even acted as a BC for RBL as the former was preoccupied with dealing with Demonetisation. Now, over the next six months or so, some joint services are expected with Utkarsh on the micro-banking front.
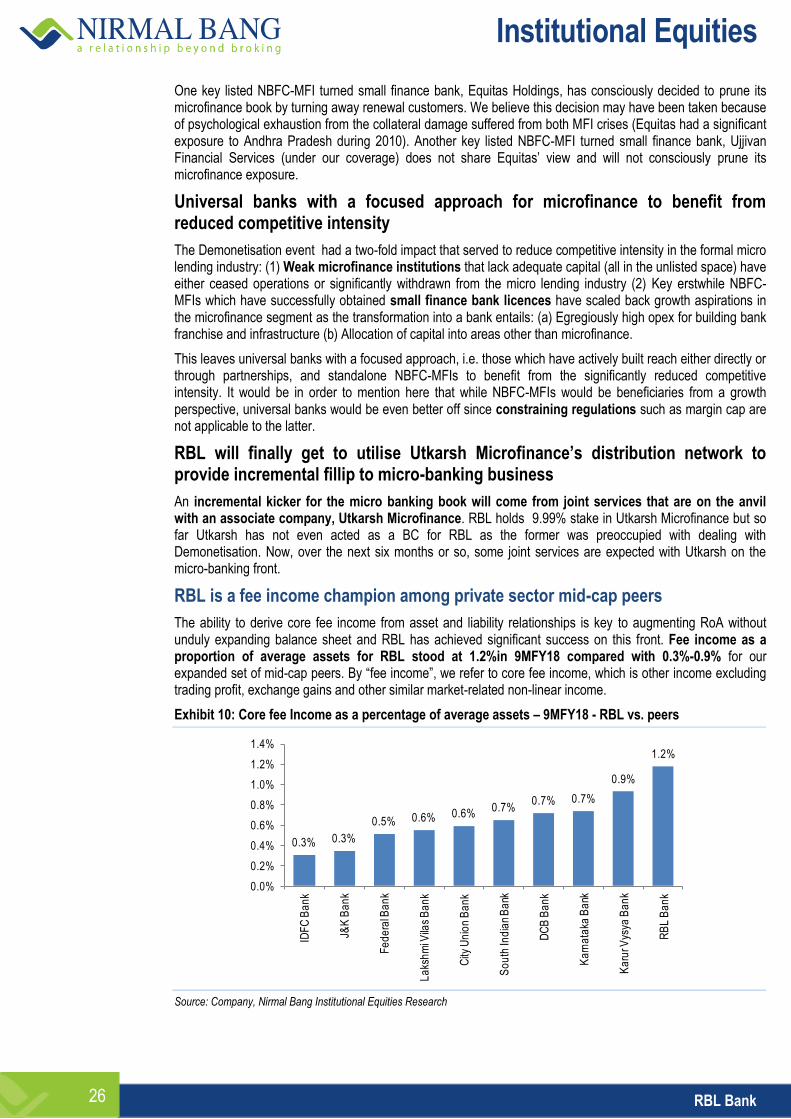
RBL is a fee income champion among private sector mid-cap peers
The ability to derive core fee income from asset and liability relationships is key to augmenting RoA without unduly expanding balance sheet and RBL has achieved significant success on this front. Fee income as a proportion of average assets for RBL stood at 1.2%in 9MFY18 compared with 0.3%-0.9% for our expanded set of mid-cap peers. By “fee income”, we refer to core fee income, which is other income excluding trading profit, exchange gains and other similar market-related non-linear income.
Exhibit 10: Core fee Income as a percentage of average assets – 9MFY18 - RBL vs. peers
Source: Company, Nirmal Bang Institutional Equities Research
0.3% 0.3%
0.5% 0.6% 0.6%0.7%
0.7% 0.7%
0.9%
1.2%
0.0%
0.2%
0.4%
0.6%
0.8%
1.0%
1.2%
1.4%
IDF
C B
an
k
J&K
Ba
nk
Fe
de
ral B
an
k
La
ksh
mi V
ilas
Ba
nk
City
Un
ion
Ba
nk
So
uth
Ind
ian
Ba
nk
DC
B B
an
k
Ka
rna
taka
Ba
nk
Ka
rur V
ysya
Ba
nk
RB
L B
an
k
Institutional Equities
RBL Bank 27
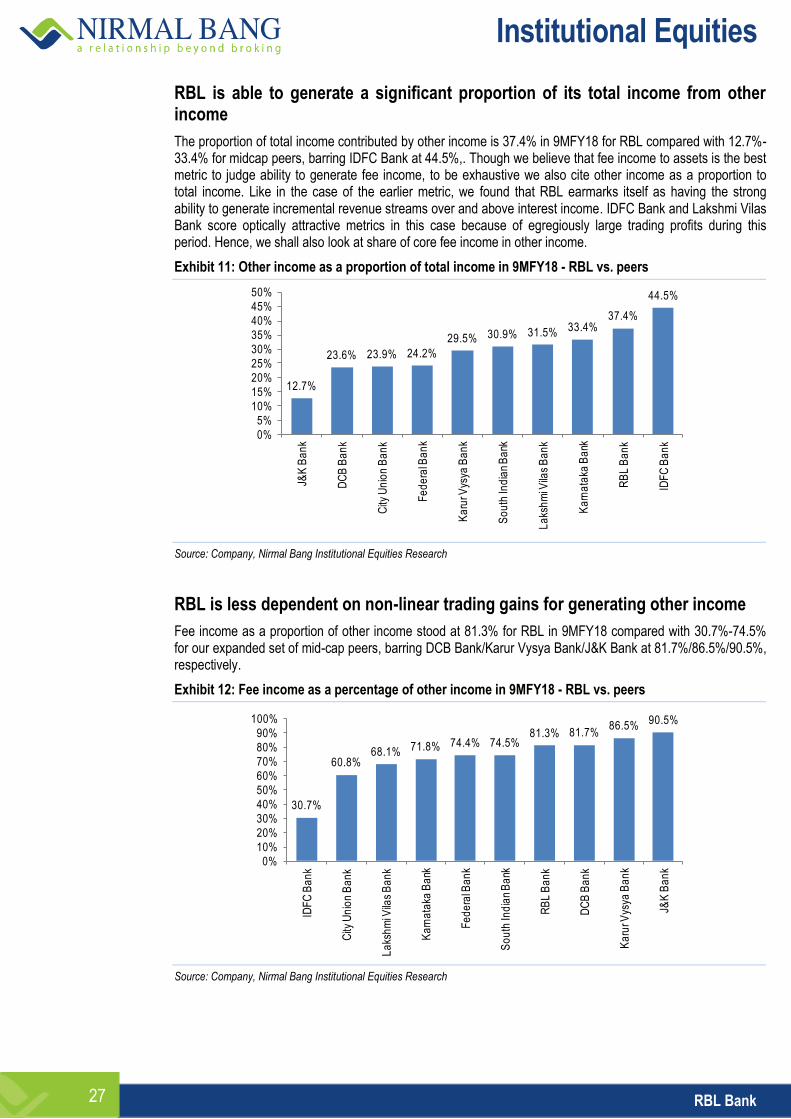
RBL is able to generate a significant proportion of its total income from other income
The proportion of total income contributed by other income is 37.4% in 9MFY18 for RBL compared with 12.7%-33.4% for midcap peers, barring IDFC Bank at 44.5%,. Though we believe that fee income to assets is the best metric to judge ability to generate fee income, to be exhaustive we also cite other income as a proportion to total income. Like in the case of the earlier metric, we found that RBL earmarks itself as having the strong ability to generate incremental revenue streams over and above interest income. IDFC Bank and Lakshmi Vilas Bank score optically attractive metrics in this case because of egregiously large trading profits during this period. Hence, we shall also look at share of core fee income in other income.
Exhibit 11: Other income as a proportion of total income in 9MFY18 - RBL vs. peers
Source: Company, Nirmal Bang Institutional Equities Research
RBL is less dependent on non-linear trading gains for generating other income
Fee income as a proportion of other income stood at 81.3% for RBL in 9MFY18 compared with 30.7%-74.5% for our expanded set of mid-cap peers, barring DCB Bank/Karur Vysya Bank/J&K Bank at 81.7%/86.5%/90.5%, respectively.
Exhibit 12: Fee income as a percentage of other income in 9MFY18 - RBL vs. peers
Source: Company, Nirmal Bang Institutional Equities Research
12.7%
23.6% 23.9% 24.2%
29.5% 30.9% 31.5% 33.4%37.4%
44.5%
0%
5%
10%
15%
20%
25%
30%
35%
40%
45%
50%J&
K B
an
k
DC
B B
an
k
City
Un
ion
Ba
nk
Fe
de
ral B
an
k
Ka
rur V
ysya
Ba
nk
So
uth
Ind
ian
Ba
nk
La
ksh
mi V
ilas
Ba
nk
Ka
rna
taka
Ba
nk
RB
L B
an
k
IDF
C B
an
k
30.7%
60.8%68.1% 71.8% 74.4% 74.5%
81.3% 81.7%86.5% 90.5%
0%
10%
20%
30%
40%
50%
60%
70%
80%
90%
100%
IDF
C B
an
k
City
Un
ion
Ba
nk
La
ksh
mi V
ilas
Ba
nk
Ka
rna
taka
Ba
nk
Fe
de
ral B
an
k
So
uth
Ind
ian
Ba
nk
RB
L B
an
k
DC
B B
an
k
Ka
rur V
ysya
Ba
nk
J&K
Ba
nk
Institutional Equities
RBL Bank 28
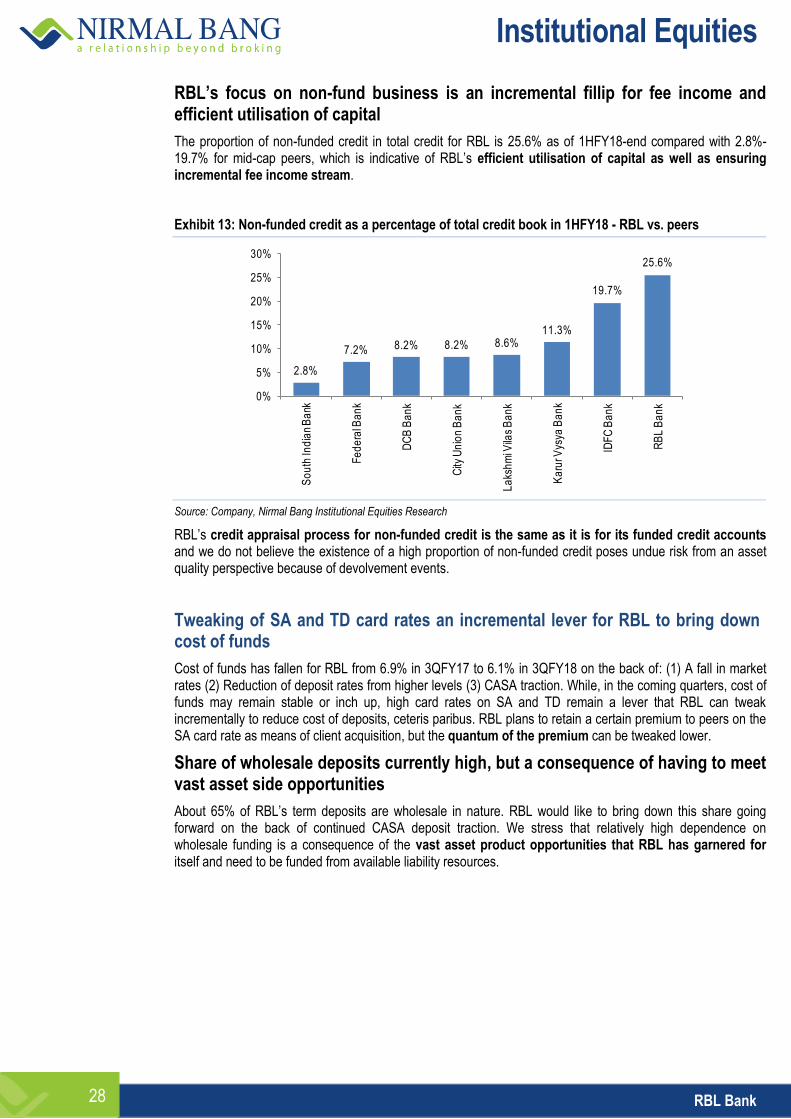
RBL’s focus on non-fund business is an incremental fillip for fee income and efficient utilisation of capital
The proportion of non-funded credit in total credit for RBL is 25.6% as of 1HFY18-end compared with 2.8%-19.7% for mid-cap peers, which is indicative of RBL’s efficient utilisation of capital as well as ensuring incremental fee income stream.
Exhibit 13: Non-funded credit as a percentage of total credit book in 1HFY18 - RBL vs. peers
Source: Company, Nirmal Bang Institutional Equities Research
RBL’s credit appraisal process for non-funded credit is the same as it is for its funded credit accounts and we do not believe the existence of a high proportion of non-funded credit poses undue risk from an asset quality perspective because of devolvement events.
Tweaking of SA and TD card rates an incremental lever for RBL to bring down cost of funds
Cost of funds has fallen for RBL from 6.9% in 3QFY17 to 6.1% in 3QFY18 on the back of: (1) A fall in market rates (2) Reduction of deposit rates from higher levels (3) CASA traction. While, in the coming quarters, cost of funds may remain stable or inch up, high card rates on SA and TD remain a lever that RBL can tweak incrementally to reduce cost of deposits, ceteris paribus. RBL plans to retain a certain premium to peers on the SA card rate as means of client acquisition, but the quantum of the premium can be tweaked lower.
Share of wholesale deposits currently high, but a consequence of having to meet vast asset side opportunities
About 65% of RBL’s term deposits are wholesale in nature. RBL would like to bring down this share going forward on the back of continued CASA deposit traction. We stress that relatively high dependence on wholesale funding is a consequence of the vast asset product opportunities that RBL has garnered for itself and need to be funded from available liability resources.
2.8%
7.2% 8.2% 8.2% 8.6%11.3%
19.7%
25.6%
0%
5%
10%
15%
20%
25%
30%
So
uth
Ind
ian
Ba
nk
Fe
de
ral B
an
k
DC
B B
an
k
City
Un
ion
Ba
nk
La
ksh
mi V
ilas
Ba
nk
Ka
rur V
ysya
Ba
nk
IDF
C B
an
k
RB
L B
an
k
Institutional Equities
RBL Bank 29
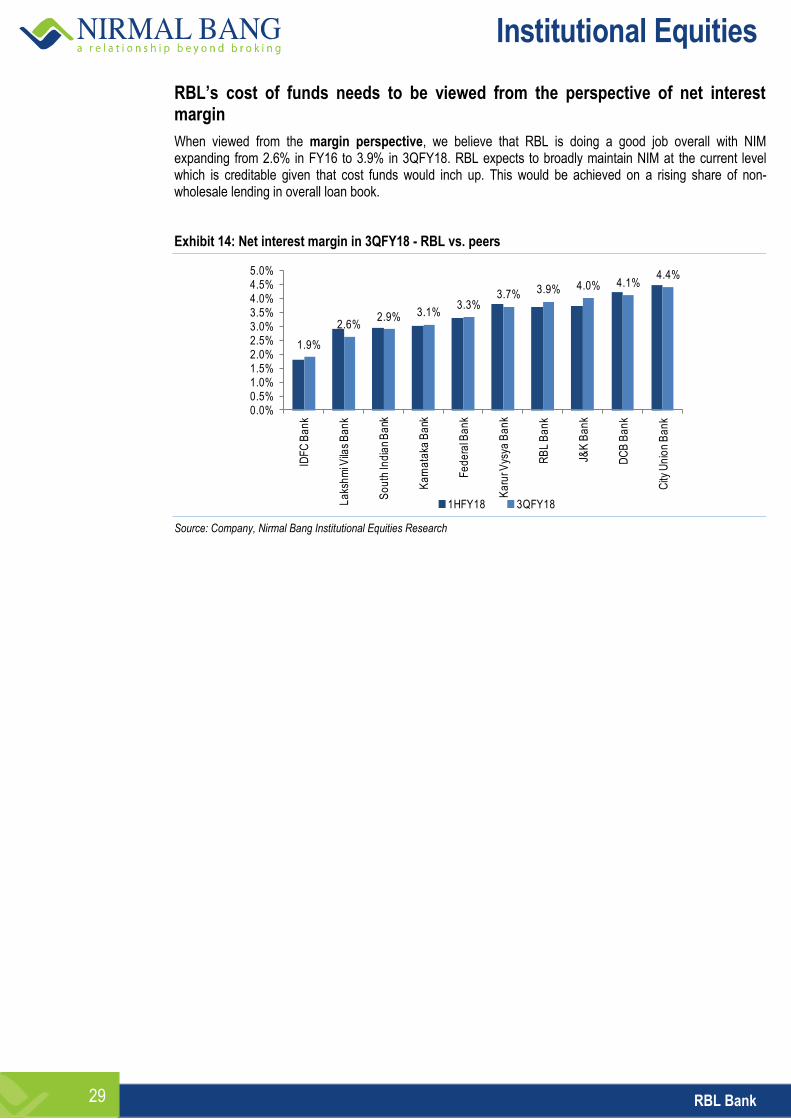
RBL’s cost of funds needs to be viewed from the perspective of net interest margin
When viewed from the margin perspective, we believe that RBL is doing a good job overall with NIM expanding from 2.6% in FY16 to 3.9% in 3QFY18. RBL expects to broadly maintain NIM at the current level which is creditable given that cost funds would inch up. This would be achieved on a rising share of non-wholesale lending in overall loan book.
Exhibit 14: Net interest margin in 3QFY18 - RBL vs. peers
Source: Company, Nirmal Bang Institutional Equities Research
1.9%
2.6%2.9% 3.1%
3.3%3.7% 3.9% 4.0% 4.1%
4.4%
0.0%0.5%1.0%1.5%2.0%2.5%3.0%3.5%4.0%4.5%5.0%
IDF
C B
an
k
La
ksh
mi V
ilas
Ba
nk
So
uth
Ind
ian
Ba
nk
Ka
rna
taka
Ba
nk
Fe
de
ral B
an
k
Ka
rur V
ysya
Ba
nk
RB
L B
an
k
J&K
Ba
nk
DC
B B
an
k
City
Un
ion
Ba
nk
1HFY18 3QFY18
Institutional Equities
RBL Bank 30
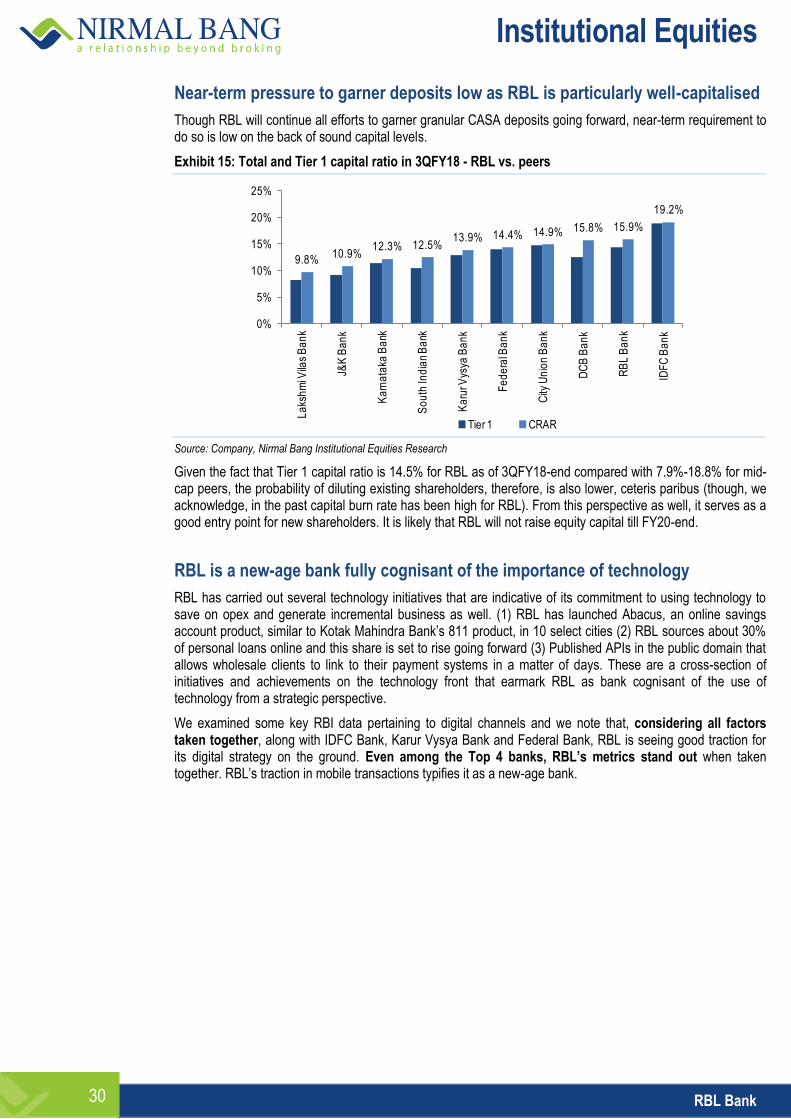
Near-term pressure to garner deposits low as RBL is particularly well-capitalised
Though RBL will continue all efforts to garner granular CASA deposits going forward, near-term requirement to do so is low on the back of sound capital levels.
Exhibit 15: Total and Tier 1 capital ratio in 3QFY18 - RBL vs. peers
Source: Company, Nirmal Bang Institutional Equities Research
Given the fact that Tier 1 capital ratio is 14.5% for RBL as of 3QFY18-end compared with 7.9%-18.8% for mid-cap peers, the probability of diluting existing shareholders, therefore, is also lower, ceteris paribus (though, we acknowledge, in the past capital burn rate has been high for RBL). From this perspective as well, it serves as a good entry point for new shareholders. It is likely that RBL will not raise equity capital till FY20-end.
RBL is a new-age bank fully cognisant of the importance of technology
RBL has carried out several technology initiatives that are indicative of its commitment to using technology to save on opex and generate incremental business as well. (1) RBL has launched Abacus, an online savings account product, similar to Kotak Mahindra Bank’s 811 product, in 10 select cities (2) RBL sources about 30% of personal loans online and this share is set to rise going forward (3) Published APIs in the public domain that allows wholesale clients to link to their payment systems in a matter of days. These are a cross-section of initiatives and achievements on the technology front that earmark RBL as bank cognisant of the use of technology from a strategic perspective.
We examined some key RBI data pertaining to digital channels and we note that, considering all factors taken together, along with IDFC Bank, Karur Vysya Bank and Federal Bank, RBL is seeing good traction for its digital strategy on the ground. Even among the Top 4 banks, RBL’s metrics stand out when taken together. RBL’s traction in mobile transactions typifies it as a new-age bank.
9.8%10.9%
12.3% 12.5%13.9% 14.4% 14.9% 15.8% 15.9%
19.2%
0%
5%
10%
15%
20%
25%
La
ksh
mi V
ilas
Ba
nk
J&K
Ba
nk
Ka
rna
taka
Ba
nk
So
uth
Ind
ian
Ba
nk
Ka
rur V
ysya
Ba
nk
Fe
de
ral B
an
k
City
Un
ion
Ba
nk
DC
B B
an
k
RB
L B
an
k
IDF
C B
an
k
Tier 1 CRAR
Institutional Equities
RBL Bank 31
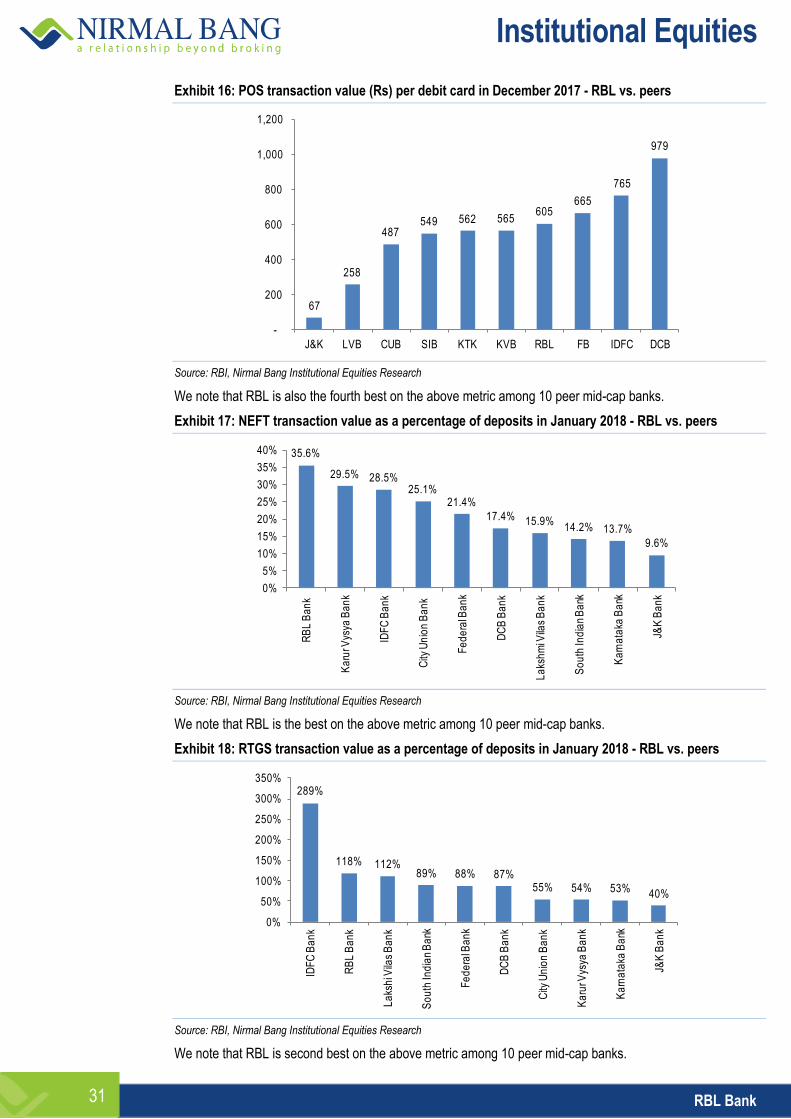
Exhibit 16: POS transaction value (Rs) per debit card in December 2017 - RBL vs. peers
Source: RBI, Nirmal Bang Institutional Equities Research
We note that RBL is also the fourth best on the above metric among 10 peer mid-cap banks.
Exhibit 17: NEFT transaction value as a percentage of deposits in January 2018 - RBL vs. peers
Source: RBI, Nirmal Bang Institutional Equities Research
We note that RBL is the best on the above metric among 10 peer mid-cap banks.
Exhibit 18: RTGS transaction value as a percentage of deposits in January 2018 - RBL vs. peers
Source: RBI, Nirmal Bang Institutional Equities Research
We note that RBL is second best on the above metric among 10 peer mid-cap banks.
67
258
487549 562 565
605665
765
979
-
200
400
600
800
1,000
1,200
J&K LVB CUB SIB KTK KVB RBL FB IDFC DCB
35.6%
29.5% 28.5%25.1%
21.4%
17.4% 15.9%14.2% 13.7%
9.6%
0%
5%
10%
15%
20%
25%
30%
35%
40%
RB
L B
an
k
Ka
rur V
ysya
Ba
nk
IDF
C B
an
k
City
Un
ion
Ba
nk
Fe
de
ral B
an
k
DC
B B
an
k
La
ksh
mi V
ilas
Ba
nk
So
uth
Ind
ian
Ba
nk
Ka
rna
taka
Ba
nk
J&K
Ba
nk
289%
118% 112%89% 88% 87%
55% 54% 53% 40%
0%
50%
100%
150%
200%
250%
300%
350%
IDF
C B
an
k
RB
L B
an
k
La
ksh
i Vila
s B
an
k
So
uth
Ind
ian
Ba
nk
Fe
de
ral B
an
k
DC
B B
an
k
City
Un
ion
Ba
nk
Ka
rur V
ysya
Ba
nk
Ka
rna
taka
Ba
nk
J&K
Ba
nk
Institutional Equities
RBL Bank 32
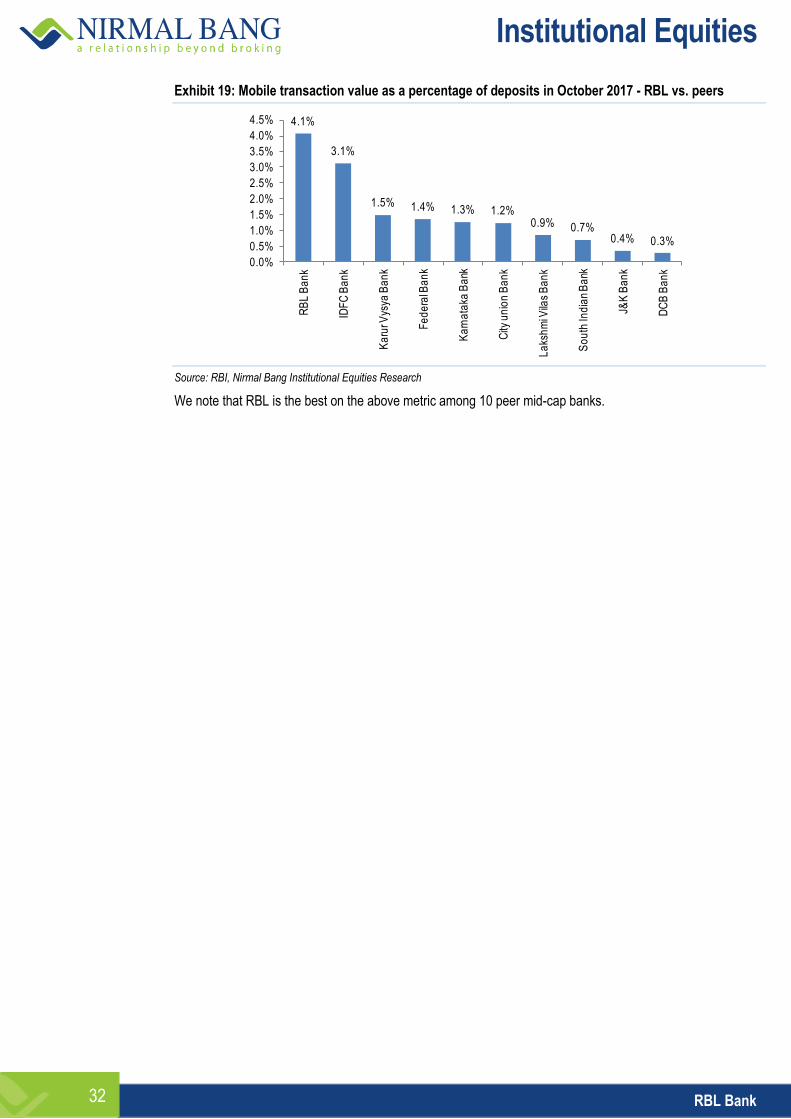
Exhibit 19: Mobile transaction value as a percentage of deposits in October 2017 - RBL vs. peers
Source: RBI, Nirmal Bang Institutional Equities Research
We note that RBL is the best on the above metric among 10 peer mid-cap banks.
4.1%
3.1%
1.5% 1.4% 1.3% 1.2%0.9% 0.7%
0.4% 0.3%
0.0%
0.5%
1.0%
1.5%
2.0%
2.5%
3.0%
3.5%
4.0%
4.5%
RB
L B
an
k
IDF
C B
an
k
Ka
rur V
ysya
Ba
nk
Fe
de
ral B
an
k
Ka
rna
taka
Ba
nk
City
un
ion
Ba
nk
La
ksh
mi V
ilas
Ba
nk
So
uth
Ind
ian
Ba
nk
J&K
Ba
nk
DC
B B
an
k
Institutional Equities
RBL Bank 33
Valuation and Outlook
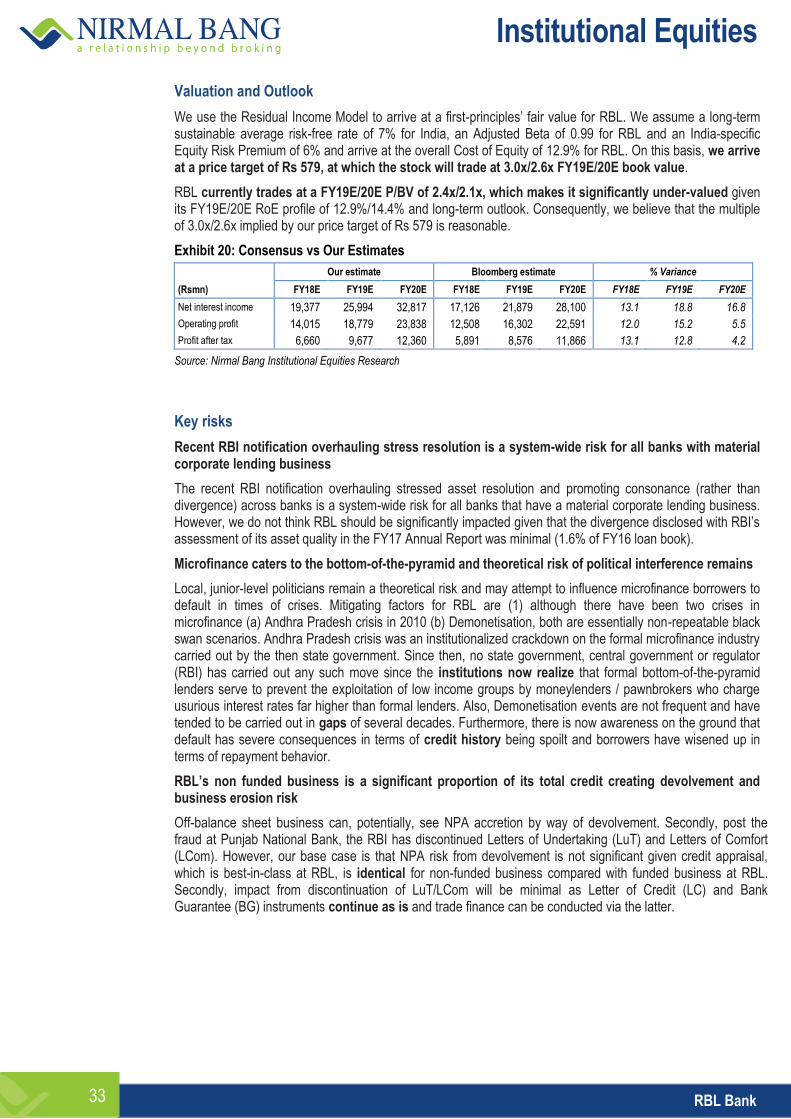
We use the Residual Income Model to arrive at a first-principles’ fair value for RBL. We assume a long-term sustainable average risk-free rate of 7% for India, an Adjusted Beta of 0.99 for RBL and an India-specific Equity Risk Premium of 6% and arrive at the overall Cost of Equity of 12.9% for RBL. On this basis, we arrive at a price target of Rs 579, at which the stock will trade at 3.0x/2.6x FY19E/20E book value.
RBL currently trades at a FY19E/20E P/BV of 2.4x/2.1x, which makes it significantly under-valued given its FY19E/20E RoE profile of 12.9%/14.4% and long-term outlook. Consequently, we believe that the multiple of 3.0x/2.6x implied by our price target of Rs 579 is reasonable.
Exhibit 20: Consensus vs Our Estimates
Our estimate Bloomberg estimate % Variance
(Rsmn) FY18E FY19E FY20E FY18E FY19E FY20E FY18E FY19E FY20E
Net interest income 19,377 25,994 32,817 17,126 21,879 28,100 13.1 18.8 16.8
Operating profit 14,015 18,779 23,838 12,508 16,302 22,591 12.0 15.2 5.5
Profit after tax 6,660 9,677 12,360 5,891 8,576 11,866 13.1 12.8 4.2
Source: Nirmal Bang Institutional Equities Research
Key risks
Recent RBI notification overhauling stress resolution is a system-wide risk for all banks with material corporate lending business
The recent RBI notification overhauling stressed asset resolution and promoting consonance (rather than divergence) across banks is a system-wide risk for all banks that have a material corporate lending business. However, we do not think RBL should be significantly impacted given that the divergence disclosed with RBI’s assessment of its asset quality in the FY17 Annual Report was minimal (1.6% of FY16 loan book).
Microfinance caters to the bottom-of-the-pyramid and theoretical risk of political interference remains
Local, junior-level politicians remain a theoretical risk and may attempt to influence microfinance borrowers to default in times of crises. Mitigating factors for RBL are (1) although there have been two crises in microfinance (a) Andhra Pradesh crisis in 2010 (b) Demonetisation, both are essentially non-repeatable black swan scenarios. Andhra Pradesh crisis was an institutionalized crackdown on the formal microfinance industry carried out by the then state government. Since then, no state government, central government or regulator (RBI) has carried out any such move since the institutions now realize that formal bottom-of-the-pyramid lenders serve to prevent the exploitation of low income groups by moneylenders / pawnbrokers who charge usurious interest rates far higher than formal lenders. Also, Demonetisation events are not frequent and have tended to be carried out in gaps of several decades. Furthermore, there is now awareness on the ground that default has severe consequences in terms of credit history being spoilt and borrowers have wisened up in terms of repayment behavior.
RBL’s non funded business is a significant proportion of its total credit creating devolvement and business erosion risk
Off-balance sheet business can, potentially, see NPA accretion by way of devolvement. Secondly, post the fraud at Punjab National Bank, the RBI has discontinued Letters of Undertaking (LuT) and Letters of Comfort (LCom). However, our base case is that NPA risk from devolvement is not significant given credit appraisal, which is best-in-class at RBL, is identical for non-funded business compared with funded business at RBL. Secondly, impact from discontinuation of LuT/LCom will be minimal as Letter of Credit (LC) and Bank Guarantee (BG) instruments continue as is and trade finance can be conducted via the latter.
Institutional Equities
RBL Bank 34
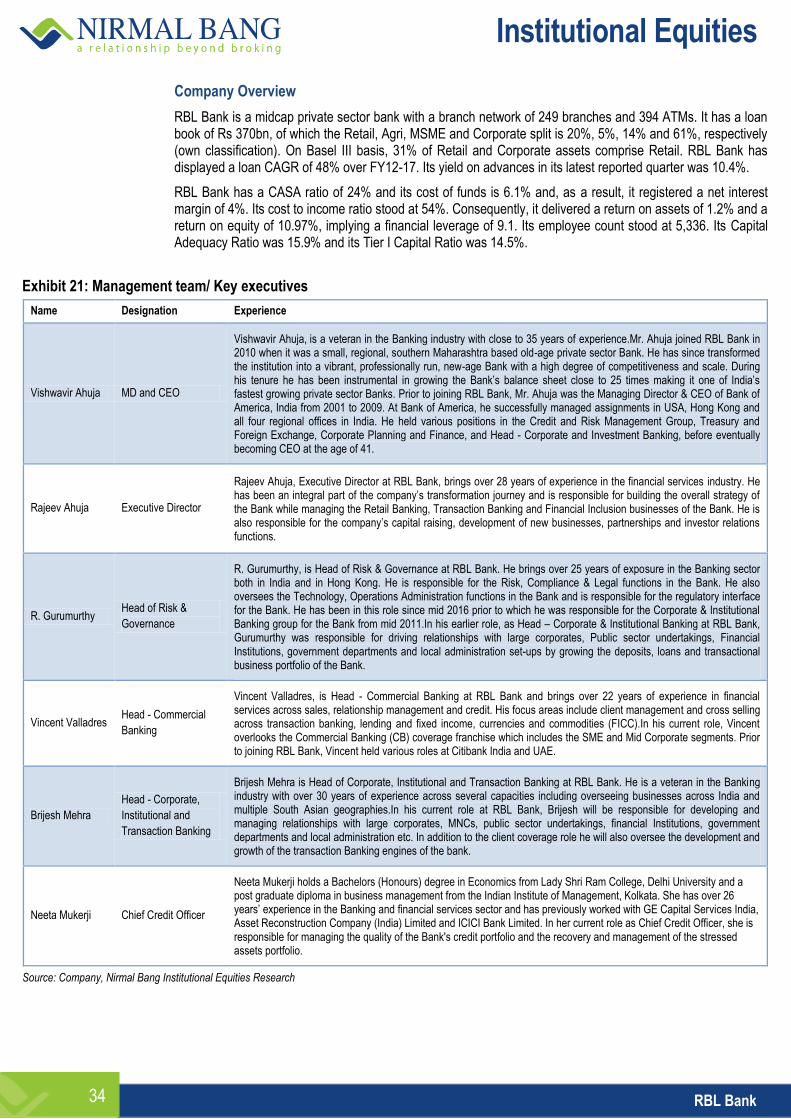
Company Overview
RBL Bank is a midcap private sector bank with a branch network of 249 branches and 394 ATMs. It has a loan book of Rs 370bn, of which the Retail, Agri, MSME and Corporate split is 20%, 5%, 14% and 61%, respectively (own classification). On Basel III basis, 31% of Retail and Corporate assets comprise Retail. RBL Bank has displayed a loan CAGR of 48% over FY12-17. Its yield on advances in its latest reported quarter was 10.4%.
RBL Bank has a CASA ratio of 24% and its cost of funds is 6.1% and, as a result, it registered a net interest margin of 4%. Its cost to income ratio stood at 54%. Consequently, it delivered a return on assets of 1.2% and a return on equity of 10.97%, implying a financial leverage of 9.1. Its employee count stood at 5,336. Its Capital Adequacy Ratio was 15.9% and its Tier I Capital Ratio was 14.5%.
Exhibit 21: Management team/ Key executives
Name Designation Experience
Vishwavir Ahuja MD and CEO
Vishwavir Ahuja, is a veteran in the Banking industry with close to 35 years of experience.Mr. Ahuja joined RBL Bank in 2010 when it was a small, regional, southern Maharashtra based old-age private sector Bank. He has since transformed the institution into a vibrant, professionally run, new-age Bank with a high degree of competitiveness and scale. During his tenure he has been instrumental in growing the Bank’s balance sheet close to 25 times making it one of India’s fastest growing private sector Banks. Prior to joining RBL Bank, Mr. Ahuja was the Managing Director & CEO of Bank of America, India from 2001 to 2009. At Bank of America, he successfully managed assignments in USA, Hong Kong and all four regional offices in India. He held various positions in the Credit and Risk Management Group, Treasury and Foreign Exchange, Corporate Planning and Finance, and Head - Corporate and Investment Banking, before eventually becoming CEO at the age of 41.
Rajeev Ahuja Executive Director
Rajeev Ahuja, Executive Director at RBL Bank, brings over 28 years of experience in the financial services industry. He has been an integral part of the company’s transformation journey and is responsible for building the overall strategy of the Bank while managing the Retail Banking, Transaction Banking and Financial Inclusion businesses of the Bank. He is also responsible for the company’s capital raising, development of new businesses, partnerships and investor relations functions.
R. Gurumurthy Head of Risk &
Governance
R. Gurumurthy, is Head of Risk & Governance at RBL Bank. He brings over 25 years of exposure in the Banking sector both in India and in Hong Kong. He is responsible for the Risk, Compliance & Legal functions in the Bank. He also oversees the Technology, Operations Administration functions in the Bank and is responsible for the regulatory interface for the Bank. He has been in this role since mid 2016 prior to which he was responsible for the Corporate & Institutional Banking group for the Bank from mid 2011.In his earlier role, as Head – Corporate & Institutional Banking at RBL Bank, Gurumurthy was responsible for driving relationships with large corporates, Public sector undertakings, Financial Institutions, government departments and local administration set-ups by growing the deposits, loans and transactional business portfolio of the Bank.
Vincent Valladres Head - Commercial
Banking
Vincent Valladres, is Head - Commercial Banking at RBL Bank and brings over 22 years of experience in financial services across sales, relationship management and credit. His focus areas include client management and cross selling across transaction banking, lending and fixed income, currencies and commodities (FICC).In his current role, Vincent overlooks the Commercial Banking (CB) coverage franchise which includes the SME and Mid Corporate segments. Prior to joining RBL Bank, Vincent held various roles at Citibank India and UAE.
Brijesh Mehra
Head - Corporate,
Institutional and
Transaction Banking
Brijesh Mehra is Head of Corporate, Institutional and Transaction Banking at RBL Bank. He is a veteran in the Banking industry with over 30 years of experience across several capacities including overseeing businesses across India and multiple South Asian geographies.In his current role at RBL Bank, Brijesh will be responsible for developing and managing relationships with large corporates, MNCs, public sector undertakings, financial Institutions, government departments and local administration etc. In addition to the client coverage role he will also oversee the development and growth of the transaction Banking engines of the bank.
Neeta Mukerji Chief Credit Officer
Neeta Mukerji holds a Bachelors (Honours) degree in Economics from Lady Shri Ram College, Delhi University and a post graduate diploma in business management from the Indian Institute of Management, Kolkata. She has over 26 years’ experience in the Banking and financial services sector and has previously worked with GE Capital Services India, Asset Reconstruction Company (India) Limited and ICICI Bank Limited. In her current role as Chief Credit Officer, she is responsible for managing the quality of the Bank's credit portfolio and the recovery and management of the stressed assets portfolio.
Source: Company, Nirmal Bang Institutional Equities Research
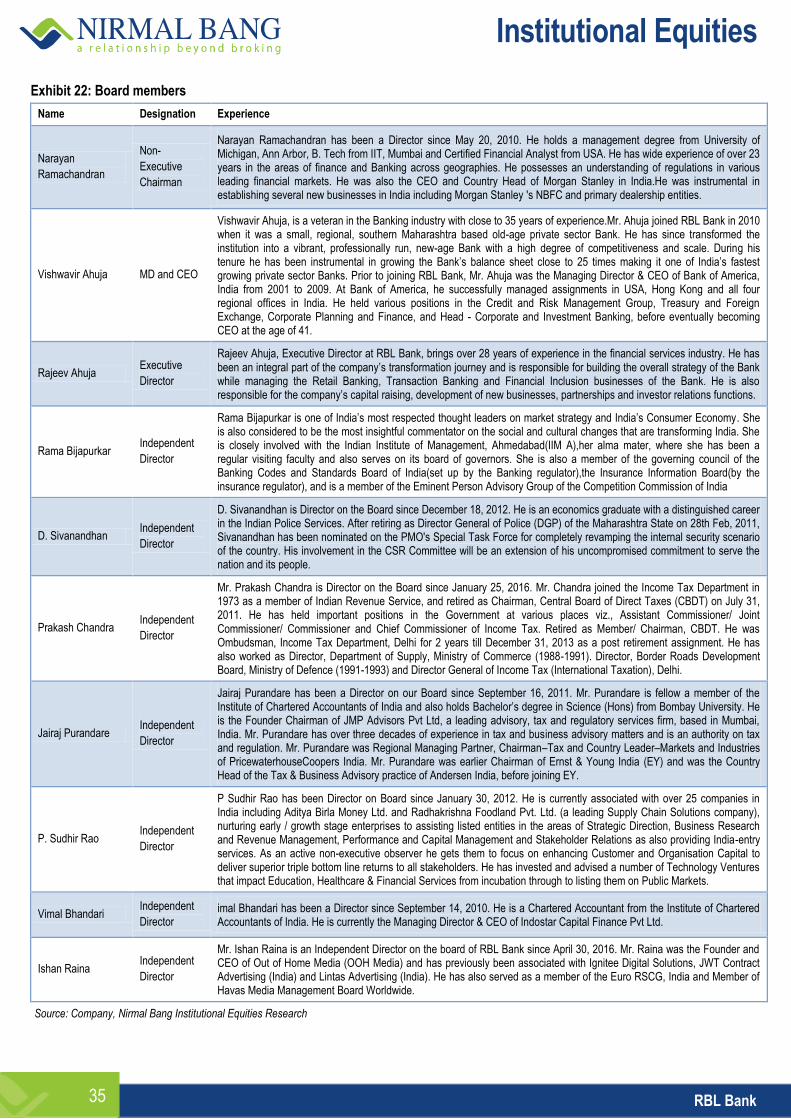
Institutional Equities
RBL Bank 35
Exhibit 22: Board members
Name Designation Experience
Narayan
Ramachandran
Non-
Executive
Chairman
Narayan Ramachandran has been a Director since May 20, 2010. He holds a management degree from University of Michigan, Ann Arbor, B. Tech from IIT, Mumbai and Certified Financial Analyst from USA. He has wide experience of over 23 years in the areas of finance and Banking across geographies. He possesses an understanding of regulations in various leading financial markets. He was also the CEO and Country Head of Morgan Stanley in India.He was instrumental in establishing several new businesses in India including Morgan Stanley 's NBFC and primary dealership entities.
Vishwavir Ahuja MD and CEO
Vishwavir Ahuja, is a veteran in the Banking industry with close to 35 years of experience.Mr. Ahuja joined RBL Bank in 2010 when it was a small, regional, southern Maharashtra based old-age private sector Bank. He has since transformed the institution into a vibrant, professionally run, new-age Bank with a high degree of competitiveness and scale. During his tenure he has been instrumental in growing the Bank’s balance sheet close to 25 times making it one of India’s fastest growing private sector Banks. Prior to joining RBL Bank, Mr. Ahuja was the Managing Director & CEO of Bank of America, India from 2001 to 2009. At Bank of America, he successfully managed assignments in USA, Hong Kong and all four regional offices in India. He held various positions in the Credit and Risk Management Group, Treasury and Foreign Exchange, Corporate Planning and Finance, and Head - Corporate and Investment Banking, before eventually becoming CEO at the age of 41.
Rajeev Ahuja Executive
Director
Rajeev Ahuja, Executive Director at RBL Bank, brings over 28 years of experience in the financial services industry. He has been an integral part of the company’s transformation journey and is responsible for building the overall strategy of the Bank while managing the Retail Banking, Transaction Banking and Financial Inclusion businesses of the Bank. He is also responsible for the company’s capital raising, development of new businesses, partnerships and investor relations functions.
Rama Bijapurkar Independent
Director
Rama Bijapurkar is one of India’s most respected thought leaders on market strategy and India’s Consumer Economy. She is also considered to be the most insightful commentator on the social and cultural changes that are transforming India. She is closely involved with the Indian Institute of Management, Ahmedabad(IIM A),her alma mater, where she has been a regular visiting faculty and also serves on its board of governors. She is also a member of the governing council of the Banking Codes and Standards Board of India(set up by the Banking regulator),the Insurance Information Board(by the insurance regulator), and is a member of the Eminent Person Advisory Group of the Competition Commission of India
D. Sivanandhan Independent
Director
D. Sivanandhan is Director on the Board since December 18, 2012. He is an economics graduate with a distinguished career in the Indian Police Services. After retiring as Director General of Police (DGP) of the Maharashtra State on 28th Feb, 2011, Sivanandhan has been nominated on the PMO's Special Task Force for completely revamping the internal security scenario of the country. His involvement in the CSR Committee will be an extension of his uncompromised commitment to serve the nation and its people.
Prakash Chandra Independent
Director
Mr. Prakash Chandra is Director on the Board since January 25, 2016. Mr. Chandra joined the Income Tax Department in 1973 as a member of Indian Revenue Service, and retired as Chairman, Central Board of Direct Taxes (CBDT) on July 31, 2011. He has held important positions in the Government at various places viz., Assistant Commissioner/ Joint Commissioner/ Commissioner and Chief Commissioner of Income Tax. Retired as Member/ Chairman, CBDT. He was Ombudsman, Income Tax Department, Delhi for 2 years till December 31, 2013 as a post retirement assignment. He has also worked as Director, Department of Supply, Ministry of Commerce (1988-1991). Director, Border Roads Development Board, Ministry of Defence (1991-1993) and Director General of Income Tax (International Taxation), Delhi.
Jairaj Purandare Independent
Director
Jairaj Purandare has been a Director on our Board since September 16, 2011. Mr. Purandare is fellow a member of the Institute of Chartered Accountants of India and also holds Bachelor’s degree in Science (Hons) from Bombay University. He is the Founder Chairman of JMP Advisors Pvt Ltd, a leading advisory, tax and regulatory services firm, based in Mumbai, India. Mr. Purandare has over three decades of experience in tax and business advisory matters and is an authority on tax and regulation. Mr. Purandare was Regional Managing Partner, Chairman–Tax and Country Leader–Markets and Industries of PricewaterhouseCoopers India. Mr. Purandare was earlier Chairman of Ernst & Young India (EY) and was the Country Head of the Tax & Business Advisory practice of Andersen India, before joining EY.
P. Sudhir Rao Independent
Director
P Sudhir Rao has been Director on Board since January 30, 2012. He is currently associated with over 25 companies in India including Aditya Birla Money Ltd. and Radhakrishna Foodland Pvt. Ltd. (a leading Supply Chain Solutions company), nurturing early / growth stage enterprises to assisting listed entities in the areas of Strategic Direction, Business Research and Revenue Management, Performance and Capital Management and Stakeholder Relations as also providing India-entry services. As an active non-executive observer he gets them to focus on enhancing Customer and Organisation Capital to deliver superior triple bottom line returns to all stakeholders. He has invested and advised a number of Technology Ventures that impact Education, Healthcare & Financial Services from incubation through to listing them on Public Markets.
Vimal Bhandari Independent
Director imal Bhandari has been a Director since September 14, 2010. He is a Chartered Accountant from the Institute of Chartered Accountants of India. He is currently the Managing Director & CEO of Indostar Capital Finance Pvt Ltd.
Ishan Raina Independent
Director
Mr. Ishan Raina is an Independent Director on the board of RBL Bank since April 30, 2016. Mr. Raina was the Founder and CEO of Out of Home Media (OOH Media) and has previously been associated with Ignitee Digital Solutions, JWT Contract Advertising (India) and Lintas Advertising (India). He has also served as a member of the Euro RSCG, India and Member of Havas Media Management Board Worldwide.
Source: Company, Nirmal Bang Institutional Equities Research
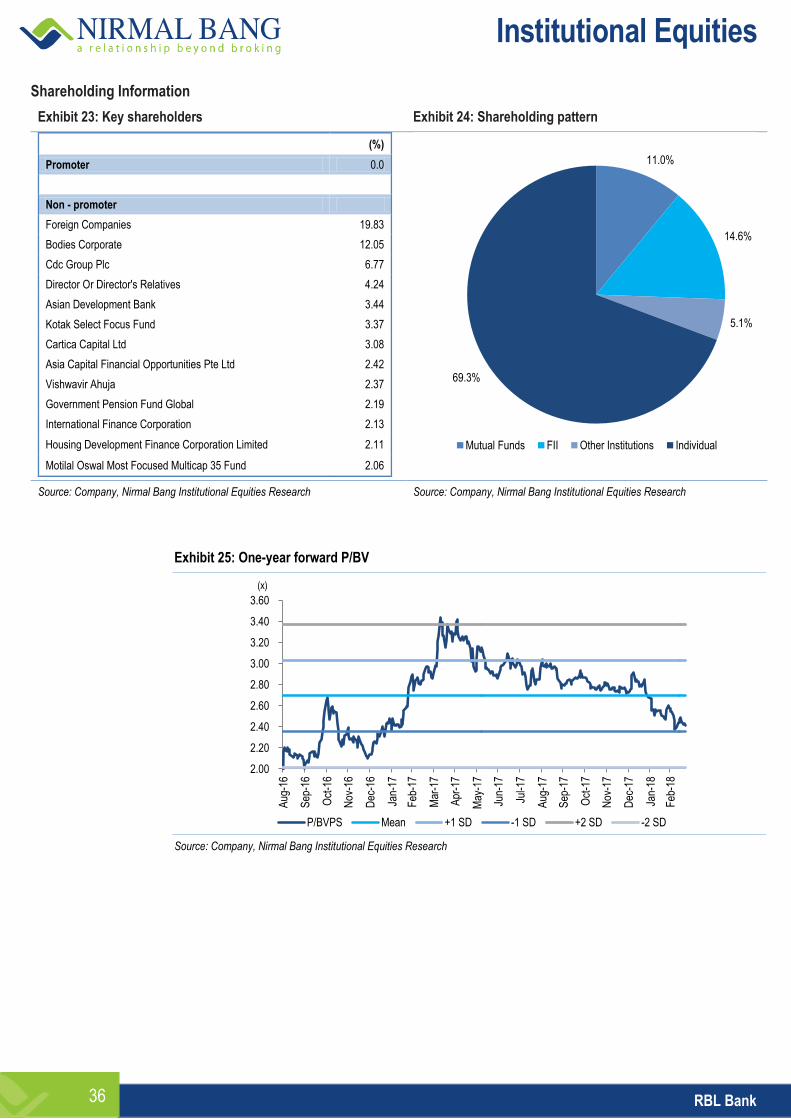
Institutional Equities
RBL Bank 36
Shareholding Information
Exhibit 23: Key shareholders Exhibit 24: Shareholding pattern
(%)
Promoter 0.0
Non - promoter
Foreign Companies 19.83
Bodies Corporate 12.05
Cdc Group Plc 6.77
Director Or Director's Relatives 4.24
Asian Development Bank 3.44
Kotak Select Focus Fund 3.37
Cartica Capital Ltd 3.08
Asia Capital Financial Opportunities Pte Ltd 2.42
Vishwavir Ahuja 2.37
Government Pension Fund Global 2.19
International Finance Corporation 2.13
Housing Development Finance Corporation Limited 2.11
Motilal Oswal Most Focused Multicap 35 Fund 2.06
Source: Company, Nirmal Bang Institutional Equities Research Source: Company, Nirmal Bang Institutional Equities Research
Exhibit 25: One-year forward P/BV
Source: Company, Nirmal Bang Institutional Equities Research
11.0%
14.6%
5.1%
69.3%
Mutual Funds FII Other Institutions Individual
2.00
2.20
2.40
2.60
2.80
3.00
3.20
3.40
3.60
Aug
-16
Sep
-16
Oct
-16
Nov
-16
Dec
-16
Jan-
17
Feb
-17
Mar
-17
Apr
-17
May
-17
Jun-
17
Jul-1
7
Aug
-17
Sep
-17
Oct
-17
Nov
-17
Dec
-17
Jan-
18
Feb
-18
P/BVPS Mean +1 SD -1 SD +2 SD -2 SD
(x)
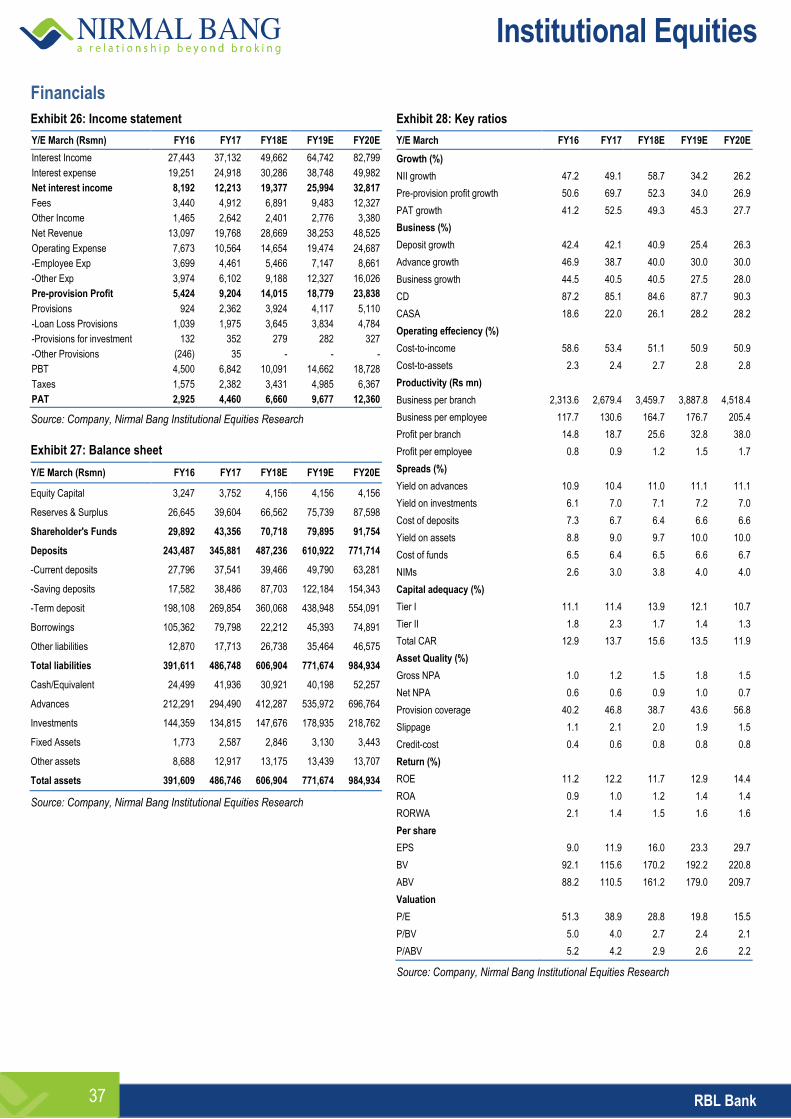
Institutional Equities
RBL Bank 37
Financials
Exhibit 26: Income statement
Y/E March (Rsmn) FY16 FY17 FY18E FY19E FY20E
Interest Income 27,443 37,132 49,662 64,742 82,799
Interest expense 19,251 24,918 30,286 38,748 49,982
Net interest income 8,192 12,213 19,377 25,994 32,817
Fees 3,440 4,912 6,891 9,483 12,327
Other Income 1,465 2,642 2,401 2,776 3,380
Net Revenue 13,097 19,768 28,669 38,253 48,525
Operating Expense 7,673 10,564 14,654 19,474 24,687
-Employee Exp 3,699 4,461 5,466 7,147 8,661
-Other Exp 3,974 6,102 9,188 12,327 16,026
Pre-provision Profit 5,424 9,204 14,015 18,779 23,838
Provisions 924 2,362 3,924 4,117 5,110
-Loan Loss Provisions 1,039 1,975 3,645 3,834 4,784
-Provisions for investment 132 352 279 282 327
-Other Provisions (246) 35 - - -
PBT 4,500 6,842 10,091 14,662 18,728
Taxes 1,575 2,382 3,431 4,985 6,367
PAT 2,925 4,460 6,660 9,677 12,360
Source: Company, Nirmal Bang Institutional Equities Research
Exhibit 27: Balance sheet
Y/E March (Rsmn) FY16 FY17 FY18E FY19E FY20E
Equity Capital 3,247 3,752 4,156 4,156 4,156
Reserves & Surplus 26,645 39,604 66,562 75,739 87,598
Shareholder's Funds 29,892 43,356 70,718 79,895 91,754
Deposits 243,487 345,881 487,236 610,922 771,714
-Current deposits 27,796 37,541 39,466 49,790 63,281
-Saving deposits 17,582 38,486 87,703 122,184 154,343
-Term deposit 198,108 269,854 360,068 438,948 554,091
Borrowings 105,362 79,798 22,212 45,393 74,891
Other liabilities 12,870 17,713 26,738 35,464 46,575
Total liabilities 391,611 486,748 606,904 771,674 984,934
Cash/Equivalent 24,499 41,936 30,921 40,198 52,257
Advances 212,291 294,490 412,287 535,972 696,764
Investments 144,359 134,815 147,676 178,935 218,762
Fixed Assets 1,773 2,587 2,846 3,130 3,443
Other assets 8,688 12,917 13,175 13,439 13,707
Total assets 391,609 486,746 606,904 771,674 984,934
Source: Company, Nirmal Bang Institutional Equities Research
Exhibit 28: Key ratios
Y/E March FY16 FY17 FY18E FY19E FY20E
Growth (%)
NII growth 47.2 49.1 58.7 34.2 26.2
Pre-provision profit growth 50.6 69.7 52.3 34.0 26.9
PAT growth 41.2 52.5 49.3 45.3 27.7
Business (%)
Deposit growth 42.4 42.1 40.9 25.4 26.3
Advance growth 46.9 38.7 40.0 30.0 30.0
Business growth 44.5 40.5 40.5 27.5 28.0
CD 87.2 85.1 84.6 87.7 90.3
CASA 18.6 22.0 26.1 28.2 28.2
Operating effeciency (%)
Cost-to-income 58.6 53.4 51.1 50.9 50.9
Cost-to-assets 2.3 2.4 2.7 2.8 2.8
Productivity (Rs mn)
Business per branch 2,313.6 2,679.4 3,459.7 3,887.8 4,518.4
Business per employee 117.7 130.6 164.7 176.7 205.4
Profit per branch 14.8 18.7 25.6 32.8 38.0
Profit per employee 0.8 0.9 1.2 1.5 1.7
Spreads (%)
Yield on advances 10.9 10.4 11.0 11.1 11.1
Yield on investments 6.1 7.0 7.1 7.2 7.0
Cost of deposits 7.3 6.7 6.4 6.6 6.6
Yield on assets 8.8 9.0 9.7 10.0 10.0
Cost of funds 6.5 6.4 6.5 6.6 6.7
NIMs 2.6 3.0 3.8 4.0 4.0
Capital adequacy (%)
Tier I 11.1 11.4 13.9 12.1 10.7
Tier II 1.8 2.3 1.7 1.4 1.3
Total CAR 12.9 13.7 15.6 13.5 11.9
Asset Quality (%)
Gross NPA 1.0 1.2 1.5 1.8 1.5
Net NPA 0.6 0.6 0.9 1.0 0.7
Provision coverage 40.2 46.8 38.7 43.6 56.8
Slippage 1.1 2.1 2.0 1.9 1.5
Credit-cost 0.4 0.6 0.8 0.8 0.8
Return (%)
ROE 11.2 12.2 11.7 12.9 14.4
ROA 0.9 1.0 1.2 1.4 1.4
RORWA 2.1 1.4 1.5 1.6 1.6
Per share
EPS 9.0 11.9 16.0 23.3 29.7
BV 92.1 115.6 170.2 192.2 220.8
ABV 88.2 110.5 161.2 179.0 209.7
Valuation
P/E 51.3 38.9 28.8 19.8 15.5
P/BV 5.0 4.0 2.7 2.4 2.1
P/ABV 5.2 4.2 2.9 2.6 2.2
Source: Company, Nirmal Bang Institutional Equities Research

Institutional Equities
RBL Bank 38
This page has been intentionally left blank
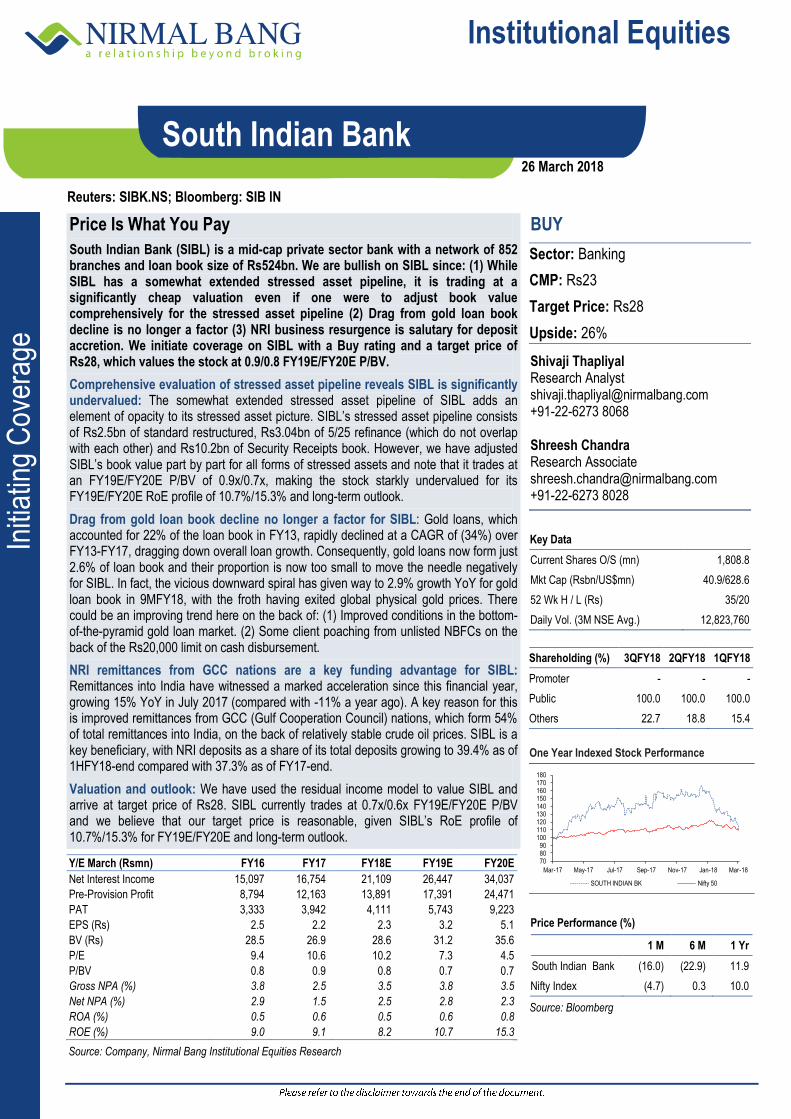
Institutional Equities
Initi
atin
g C
over
age
Reuters: SIBK.NS; Bloomberg: SIB IN
South Indian Bank
Price Is What You Pay
South Indian Bank (SIBL) is a mid-cap private sector bank with a network of 852 branches and loan book size of Rs524bn. We are bullish on SIBL since: (1) While SIBL has a somewhat extended stressed asset pipeline, it is trading at a significantly cheap valuation even if one were to adjust book value comprehensively for the stressed asset pipeline (2) Drag from gold loan book decline is no longer a factor (3) NRI business resurgence is salutary for deposit accretion. We initiate coverage on SIBL with a Buy rating and a target price of Rs28, which values the stock at 0.9/0.8 FY19E/FY20E P/BV.
Comprehensive evaluation of stressed asset pipeline reveals SIBL is significantly undervalued: The somewhat extended stressed asset pipeline of SIBL adds an element of opacity to its stressed asset picture. SIBL’s stressed asset pipeline consists of Rs2.5bn of standard restructured, Rs3.04bn of 5/25 refinance (which do not overlap with each other) and Rs10.2bn of Security Receipts book. However, we have adjusted SIBL’s book value part by part for all forms of stressed assets and note that it trades at an FY19E/FY20E P/BV of 0.9x/0.7x, making the stock starkly undervalued for its FY19E/FY20E RoE profile of 10.7%/15.3% and long-term outlook.
Drag from gold loan book decline no longer a factor for SIBL: Gold loans, which accounted for 22% of the loan book in FY13, rapidly declined at a CAGR of (34%) over FY13-FY17, dragging down overall loan growth. Consequently, gold loans now form just 2.6% of loan book and their proportion is now too small to move the needle negatively for SIBL. In fact, the vicious downward spiral has given way to 2.9% growth YoY for gold loan book in 9MFY18, with the froth having exited global physical gold prices. There could be an improving trend here on the back of: (1) Improved conditions in the bottom-of-the-pyramid gold loan market. (2) Some client poaching from unlisted NBFCs on the back of the Rs20,000 limit on cash disbursement.
NRI remittances from GCC nations are a key funding advantage for SIBL: Remittances into India have witnessed a marked acceleration since this financial year, growing 15% YoY in July 2017 (compared with -11% a year ago). A key reason for this is improved remittances from GCC (Gulf Cooperation Council) nations, which form 54% of total remittances into India, on the back of relatively stable crude oil prices. SIBL is a key beneficiary, with NRI deposits as a share of its total deposits growing to 39.4% as of 1HFY18-end compared with 37.3% as of FY17-end.
Valuation and outlook: We have used the residual income model to value SIBL and arrive at target price of Rs28. SIBL currently trades at 0.7x/0.6x FY19E/FY20E P/BV and we believe that our target price is reasonable, given SIBL’s RoE profile of 10.7%/15.3% for FY19E/FY20E and long-term outlook.
BUY
Sector: Banking
CMP: Rs23
Target Price: Rs28
Upside: 26%
Shivaji Thapliyal Research Analyst [email protected] +91-22-6273 8068 Shreesh Chandra Research Associate [email protected] +91-22-6273 8028
Key Data
Current Shares O/S (mn) 1,808.8
Mkt Cap (Rsbn/US$mn) 40.9/628.6
52 Wk H / L (Rs) 35/20
Daily Vol. (3M NSE Avg.) 12,823,760
Shareholding (%) 3QFY18 2QFY18 1QFY18
Promoter - - -
Public 100.0 100.0 100.0
Others 22.7 18.8 15.4
One Year Indexed Stock Performance
Price Performance (%)
1 M 6 M 1 Yr
South Indian Bank (16.0) (22.9) 11.9
Nifty Index (4.7) 0.3 10.0
Source: Bloomberg
Y/E March (Rsmn) FY16 FY17 FY18E FY19E FY20E
Net Interest Income 15,097 16,754 21,109 26,447 34,037
Pre-Provision Profit 8,794 12,163 13,891 17,391 24,471
PAT 3,333 3,942 4,111 5,743 9,223
EPS (Rs) 2.5 2.2 2.3 3.2 5.1
BV (Rs) 28.5 26.9 28.6 31.2 35.6
P/E 9.4 10.6 10.2 7.3 4.5
P/BV 0.8 0.9 0.8 0.7 0.7
Gross NPA (%) 3.8 2.5 3.5 3.8 3.5
Net NPA (%) 2.9 1.5 2.5 2.8 2.3
ROA (%) 0.5 0.6 0.5 0.6 0.8
ROE (%) 9.0 9.1 8.2 10.7 15.3
Source: Company, Nirmal Bang Institutional Equities Research
708090
100110120130140150160170180
Mar-17 May-17 Jul-17 Sep-17 Nov-17 Jan-18 Mar-18
SOUTH INDIAN BK Nifty 50
26 March 2018
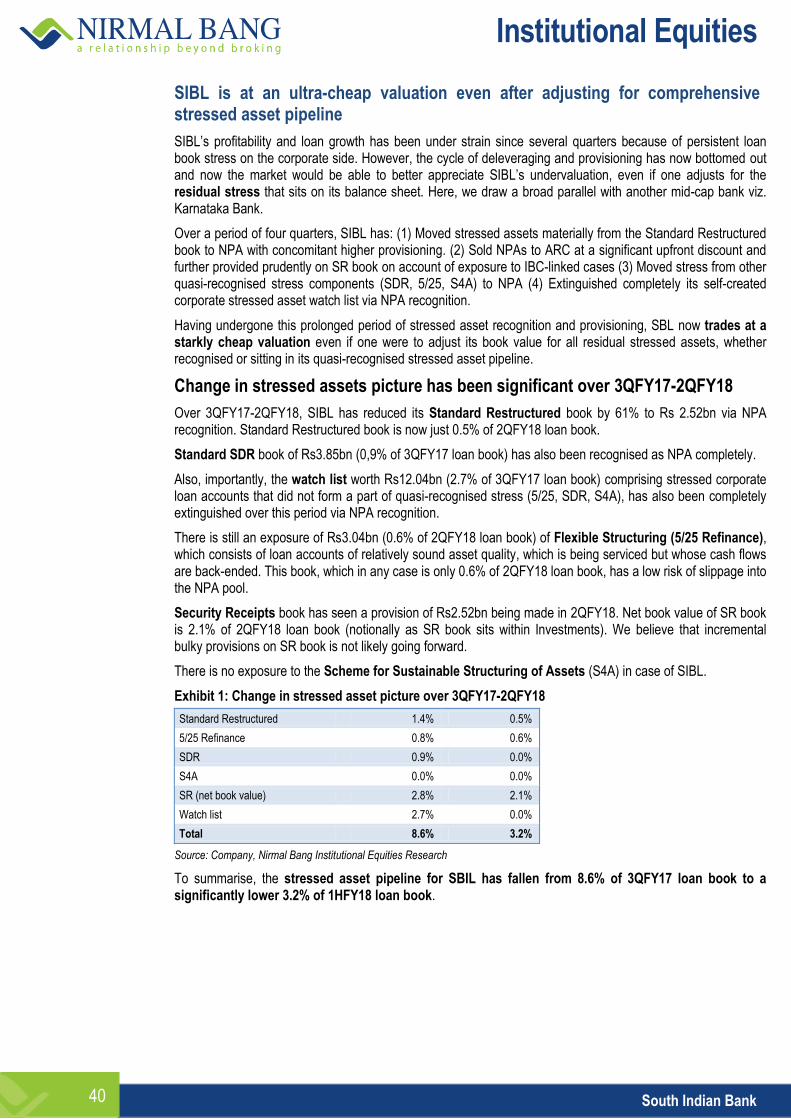
Institutional Equities
South Indian Bank 40
SIBL is at an ultra-cheap valuation even after adjusting for comprehensive stressed asset pipeline
SIBL’s profitability and loan growth has been under strain since several quarters because of persistent loan book stress on the corporate side. However, the cycle of deleveraging and provisioning has now bottomed out and now the market would be able to better appreciate SIBL’s undervaluation, even if one adjusts for the residual stress that sits on its balance sheet. Here, we draw a broad parallel with another mid-cap bank viz. Karnataka Bank.
Over a period of four quarters, SIBL has: (1) Moved stressed assets materially from the Standard Restructured book to NPA with concomitant higher provisioning. (2) Sold NPAs to ARC at a significant upfront discount and further provided prudently on SR book on account of exposure to IBC-linked cases (3) Moved stress from other quasi-recognised stress components (SDR, 5/25, S4A) to NPA (4) Extinguished completely its self-created corporate stressed asset watch list via NPA recognition.
Having undergone this prolonged period of stressed asset recognition and provisioning, SBL now trades at a starkly cheap valuation even if one were to adjust its book value for all residual stressed assets, whether recognised or sitting in its quasi-recognised stressed asset pipeline.
Change in stressed assets picture has been significant over 3QFY17-2QFY18
Over 3QFY17-2QFY18, SIBL has reduced its Standard Restructured book by 61% to Rs 2.52bn via NPA recognition. Standard Restructured book is now just 0.5% of 2QFY18 loan book.
Standard SDR book of Rs3.85bn (0,9% of 3QFY17 loan book) has also been recognised as NPA completely.
Also, importantly, the watch list worth Rs12.04bn (2.7% of 3QFY17 loan book) comprising stressed corporate loan accounts that did not form a part of quasi-recognised stress (5/25, SDR, S4A), has also been completely extinguished over this period via NPA recognition.
There is still an exposure of Rs3.04bn (0.6% of 2QFY18 loan book) of Flexible Structuring (5/25 Refinance), which consists of loan accounts of relatively sound asset quality, which is being serviced but whose cash flows are back-ended. This book, which in any case is only 0.6% of 2QFY18 loan book, has a low risk of slippage into the NPA pool.
Security Receipts book has seen a provision of Rs2.52bn being made in 2QFY18. Net book value of SR book is 2.1% of 2QFY18 loan book (notionally as SR book sits within Investments). We believe that incremental bulky provisions on SR book is not likely going forward.
There is no exposure to the Scheme for Sustainable Structuring of Assets (S4A) in case of SIBL.
Exhibit 1: Change in stressed asset picture over 3QFY17-2QFY18
Standard Restructured 1.4% 0.5%
5/25 Refinance 0.8% 0.6%
SDR 0.9% 0.0%
S4A 0.0% 0.0%
SR (net book value) 2.8% 2.1%
Watch list 2.7% 0.0%
Total 8.6% 3.2%
Source: Company, Nirmal Bang Institutional Equities Research
To summarise, the stressed asset pipeline for SBIL has fallen from 8.6% of 3QFY17 loan book to a significantly lower 3.2% of 1HFY18 loan book.
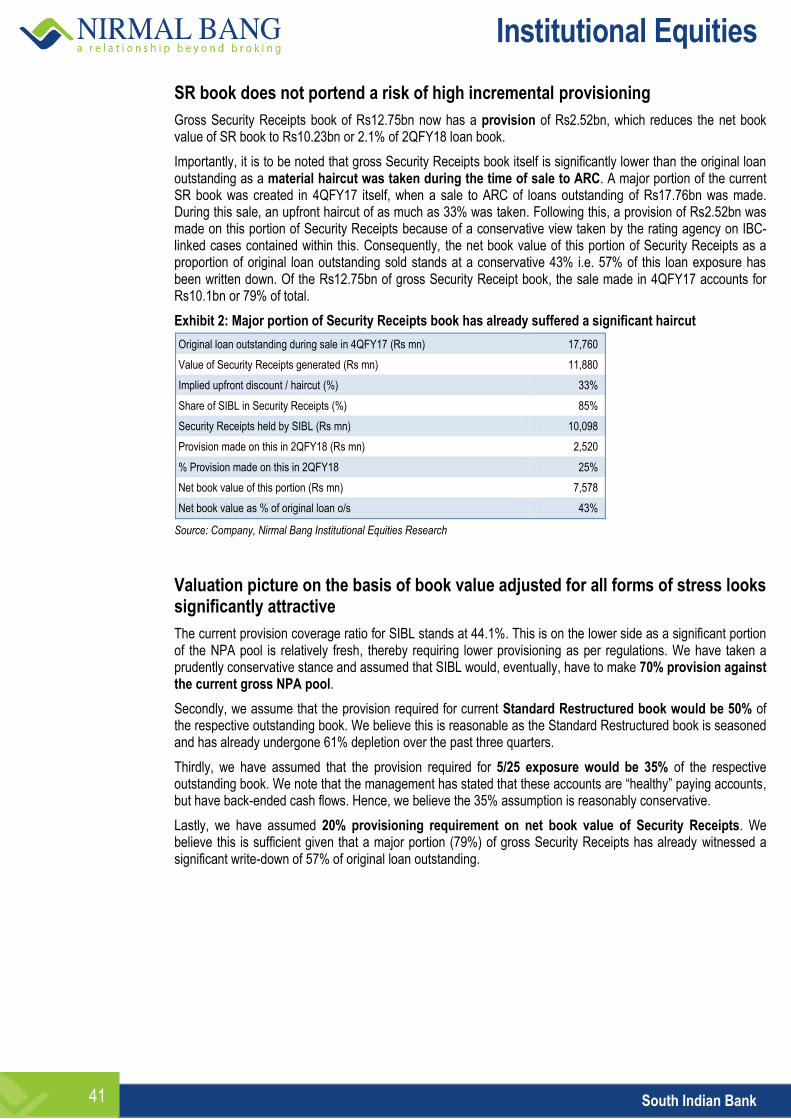
Institutional Equities
South Indian Bank 41
SR book does not portend a risk of high incremental provisioning
Gross Security Receipts book of Rs12.75bn now has a provision of Rs2.52bn, which reduces the net book value of SR book to Rs10.23bn or 2.1% of 2QFY18 loan book.
Importantly, it is to be noted that gross Security Receipts book itself is significantly lower than the original loan outstanding as a material haircut was taken during the time of sale to ARC. A major portion of the current SR book was created in 4QFY17 itself, when a sale to ARC of loans outstanding of Rs17.76bn was made. During this sale, an upfront haircut of as much as 33% was taken. Following this, a provision of Rs2.52bn was made on this portion of Security Receipts because of a conservative view taken by the rating agency on IBC-linked cases contained within this. Consequently, the net book value of this portion of Security Receipts as a proportion of original loan outstanding sold stands at a conservative 43% i.e. 57% of this loan exposure has been written down. Of the Rs12.75bn of gross Security Receipt book, the sale made in 4QFY17 accounts for Rs10.1bn or 79% of total.
Exhibit 2: Major portion of Security Receipts book has already suffered a significant haircut
Original loan outstanding during sale in 4QFY17 (Rs mn) 17,760
Value of Security Receipts generated (Rs mn) 11,880
Implied upfront discount / haircut (%) 33%
Share of SIBL in Security Receipts (%) 85%
Security Receipts held by SIBL (Rs mn) 10,098
Provision made on this in 2QFY18 (Rs mn) 2,520
% Provision made on this in 2QFY18 25%
Net book value of this portion (Rs mn) 7,578
Net book value as % of original loan o/s 43%
Source: Company, Nirmal Bang Institutional Equities Research
Valuation picture on the basis of book value adjusted for all forms of stress looks significantly attractive
The current provision coverage ratio for SIBL stands at 44.1%. This is on the lower side as a significant portion of the NPA pool is relatively fresh, thereby requiring lower provisioning as per regulations. We have taken a prudently conservative stance and assumed that SIBL would, eventually, have to make 70% provision against the current gross NPA pool.
Secondly, we assume that the provision required for current Standard Restructured book would be 50% of the respective outstanding book. We believe this is reasonable as the Standard Restructured book is seasoned and has already undergone 61% depletion over the past three quarters.
Thirdly, we have assumed that the provision required for 5/25 exposure would be 35% of the respective outstanding book. We note that the management has stated that these accounts are “healthy” paying accounts, but have back-ended cash flows. Hence, we believe the 35% assumption is reasonably conservative.
Lastly, we have assumed 20% provisioning requirement on net book value of Security Receipts. We believe this is sufficient given that a major portion (79%) of gross Security Receipts has already witnessed a significant write-down of 57% of original loan outstanding.
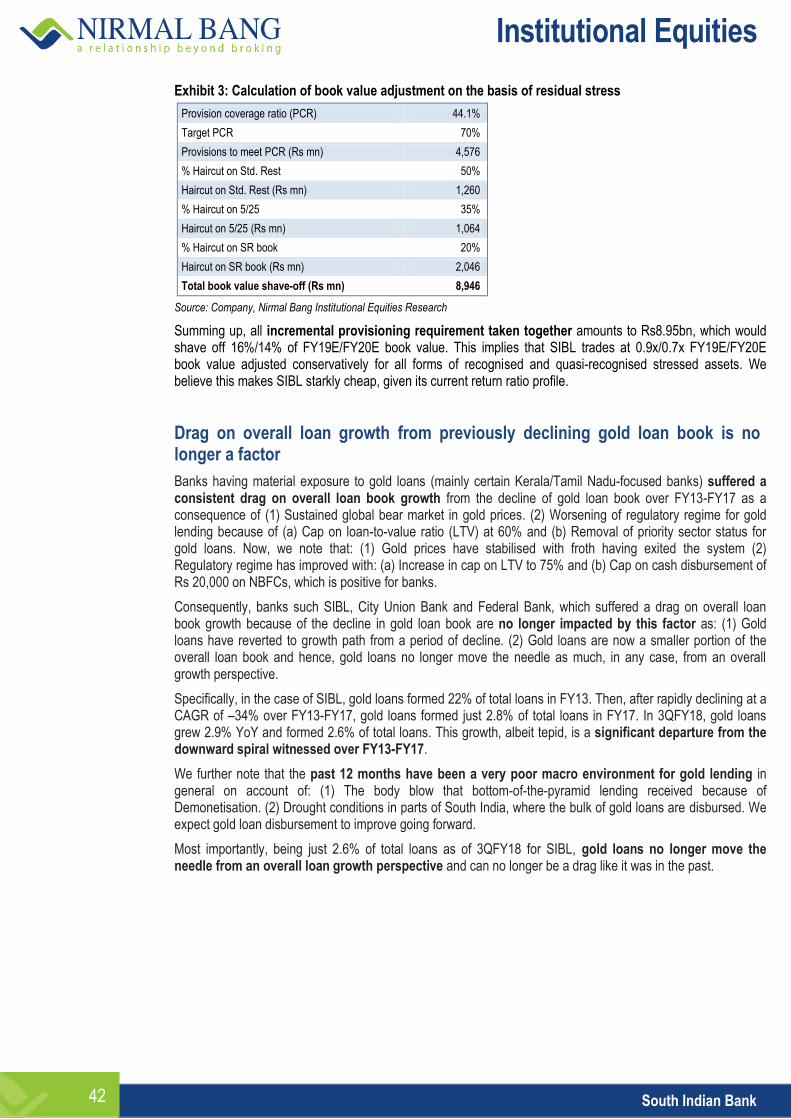
Institutional Equities
South Indian Bank 42
Exhibit 3: Calculation of book value adjustment on the basis of residual stress
Provision coverage ratio (PCR) 44.1%
Target PCR 70%
Provisions to meet PCR (Rs mn) 4,576
% Haircut on Std. Rest 50%
Haircut on Std. Rest (Rs mn) 1,260
% Haircut on 5/25 35%
Haircut on 5/25 (Rs mn) 1,064
% Haircut on SR book 20%
Haircut on SR book (Rs mn) 2,046
Total book value shave-off (Rs mn) 8,946
Source: Company, Nirmal Bang Institutional Equities Research
Summing up, all incremental provisioning requirement taken together amounts to Rs8.95bn, which would shave off 16%/14% of FY19E/FY20E book value. This implies that SIBL trades at 0.9x/0.7x FY19E/FY20E book value adjusted conservatively for all forms of recognised and quasi-recognised stressed assets. We believe this makes SIBL starkly cheap, given its current return ratio profile.
Drag on overall loan growth from previously declining gold loan book is no longer a factor
Banks having material exposure to gold loans (mainly certain Kerala/Tamil Nadu-focused banks) suffered a consistent drag on overall loan book growth from the decline of gold loan book over FY13-FY17 as a consequence of (1) Sustained global bear market in gold prices. (2) Worsening of regulatory regime for gold lending because of (a) Cap on loan-to-value ratio (LTV) at 60% and (b) Removal of priority sector status for gold loans. Now, we note that: (1) Gold prices have stabilised with froth having exited the system (2) Regulatory regime has improved with: (a) Increase in cap on LTV to 75% and (b) Cap on cash disbursement of Rs 20,000 on NBFCs, which is positive for banks.
Consequently, banks such SIBL, City Union Bank and Federal Bank, which suffered a drag on overall loan book growth because of the decline in gold loan book are no longer impacted by this factor as: (1) Gold loans have reverted to growth path from a period of decline. (2) Gold loans are now a smaller portion of the overall loan book and hence, gold loans no longer move the needle as much, in any case, from an overall growth perspective.
Specifically, in the case of SIBL, gold loans formed 22% of total loans in FY13. Then, after rapidly declining at a CAGR of –34% over FY13-FY17, gold loans formed just 2.8% of total loans in FY17. In 3QFY18, gold loans grew 2.9% YoY and formed 2.6% of total loans. This growth, albeit tepid, is a significant departure from the downward spiral witnessed over FY13-FY17.
We further note that the past 12 months have been a very poor macro environment for gold lending in general on account of: (1) The body blow that bottom-of-the-pyramid lending received because of Demonetisation. (2) Drought conditions in parts of South India, where the bulk of gold loans are disbursed. We expect gold loan disbursement to improve going forward.
Most importantly, being just 2.6% of total loans as of 3QFY18 for SIBL, gold loans no longer move the needle from an overall loan growth perspective and can no longer be a drag like it was in the past.
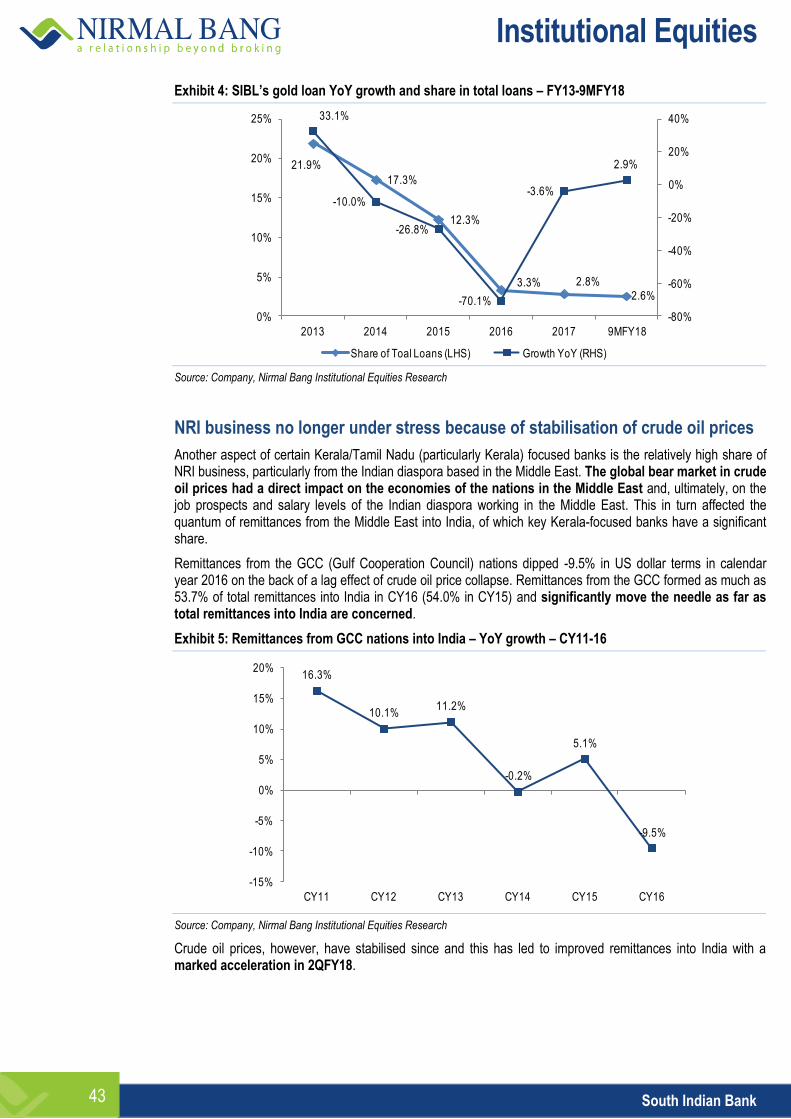
Institutional Equities
South Indian Bank 43
Exhibit 4: SIBL’s gold loan YoY growth and share in total loans – FY13-9MFY18
Source: Company, Nirmal Bang Institutional Equities Research
NRI business no longer under stress because of stabilisation of crude oil prices
Another aspect of certain Kerala/Tamil Nadu (particularly Kerala) focused banks is the relatively high share of NRI business, particularly from the Indian diaspora based in the Middle East. The global bear market in crude oil prices had a direct impact on the economies of the nations in the Middle East and, ultimately, on the job prospects and salary levels of the Indian diaspora working in the Middle East. This in turn affected the quantum of remittances from the Middle East into India, of which key Kerala-focused banks have a significant share.
Remittances from the GCC (Gulf Cooperation Council) nations dipped -9.5% in US dollar terms in calendar year 2016 on the back of a lag effect of crude oil price collapse. Remittances from the GCC formed as much as 53.7% of total remittances into India in CY16 (54.0% in CY15) and significantly move the needle as far as total remittances into India are concerned.
Exhibit 5: Remittances from GCC nations into India – YoY growth – CY11-16
Source: Company, Nirmal Bang Institutional Equities Research
Crude oil prices, however, have stabilised since and this has led to improved remittances into India with a marked acceleration in 2QFY18.
21.9%
17.3%
12.3%
3.3% 2.8%
2.6%
33.1%
-10.0%
-26.8%
-70.1%
-3.6%
2.9%
-80%
-60%
-40%
-20%
0%
20%
40%
0%
5%
10%
15%
20%
25%
2013 2014 2015 2016 2017 9MFY18
Share of Toal Loans (LHS) Growth YoY (RHS)
16.3%
10.1%11.2%
-0.2%
5.1%
-9.5%
-15%
-10%
-5%
0%
5%
10%
15%
20%
CY11 CY12 CY13 CY14 CY15 CY16
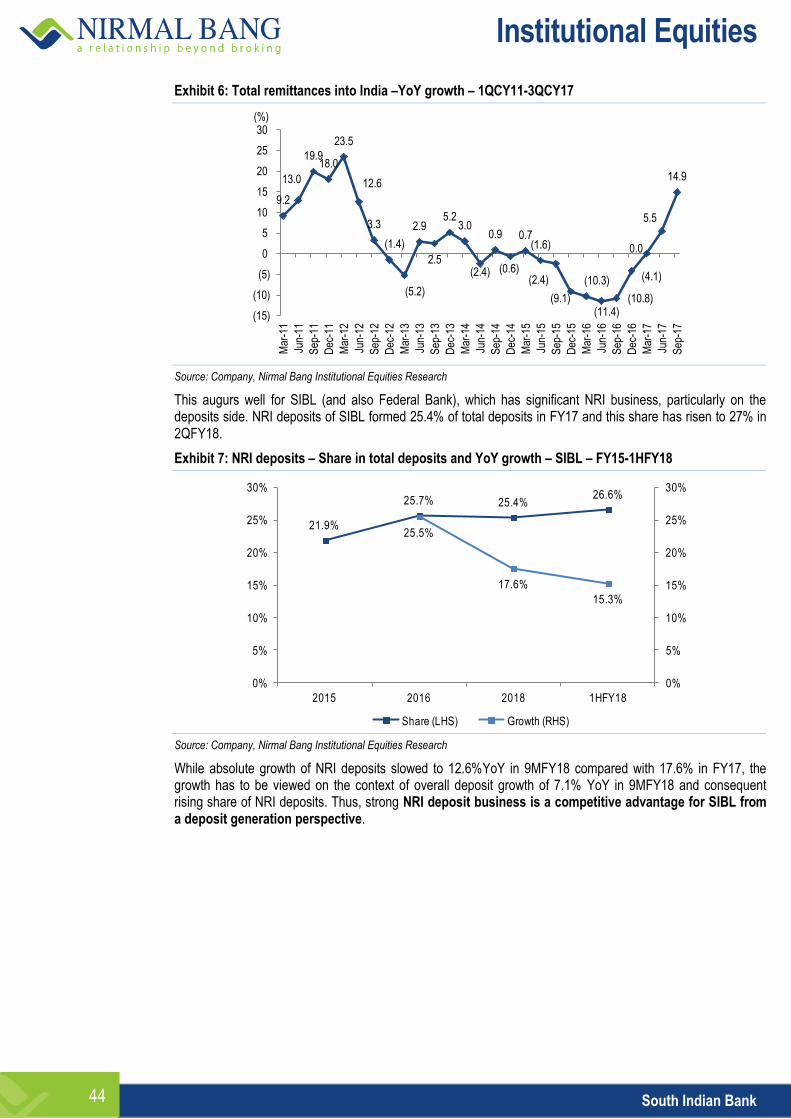
Institutional Equities
South Indian Bank 44
Exhibit 6: Total remittances into India –YoY growth – 1QCY11-3QCY17
Source: Company, Nirmal Bang Institutional Equities Research
This augurs well for SIBL (and also Federal Bank), which has significant NRI business, particularly on the deposits side. NRI deposits of SIBL formed 25.4% of total deposits in FY17 and this share has risen to 27% in 2QFY18.
Exhibit 7: NRI deposits – Share in total deposits and YoY growth – SIBL – FY15-1HFY18
Source: Company, Nirmal Bang Institutional Equities Research
While absolute growth of NRI deposits slowed to 12.6%YoY in 9MFY18 compared with 17.6% in FY17, the growth has to be viewed on the context of overall deposit growth of 7.1% YoY in 9MFY18 and consequent rising share of NRI deposits. Thus, strong NRI deposit business is a competitive advantage for SIBL from a deposit generation perspective.
9.2
13.0
19.9 18.0
23.5
12.6
3.3
(1.4)
(5.2)
2.9
2.5
5.2 3.0
(2.4)
0.9
(0.6)
0.7 (1.6)
(2.4)
(9.1)
(10.3)
(11.4) (10.8)
(4.1)
0.0
5.5
14.9
(15)
(10)
(5)
0
5
10
15
20
25
30
Mar
-11
Jun-
11
Sep
-11
Dec
-11
Mar
-12
Jun-
12
Sep
-12
Dec
-12
Mar
-13
Jun-
13
Sep
-13
Dec
-13
Mar
-14
Jun-
14
Sep
-14
Dec
-14
Mar
-15
Jun-
15
Sep
-15
Dec
-15
Mar
-16
Jun-
16
Sep
-16
Dec
-16
Mar
-17
Jun-
17
Sep
-17
(%)
21.9%
25.7% 25.4%26.6%
25.5%
17.6%
15.3%
0%
5%
10%
15%
20%
25%
30%
0%
5%
10%
15%
20%
25%
30%
2015 2016 2018 1HFY18
Share (LHS) Growth (RHS)
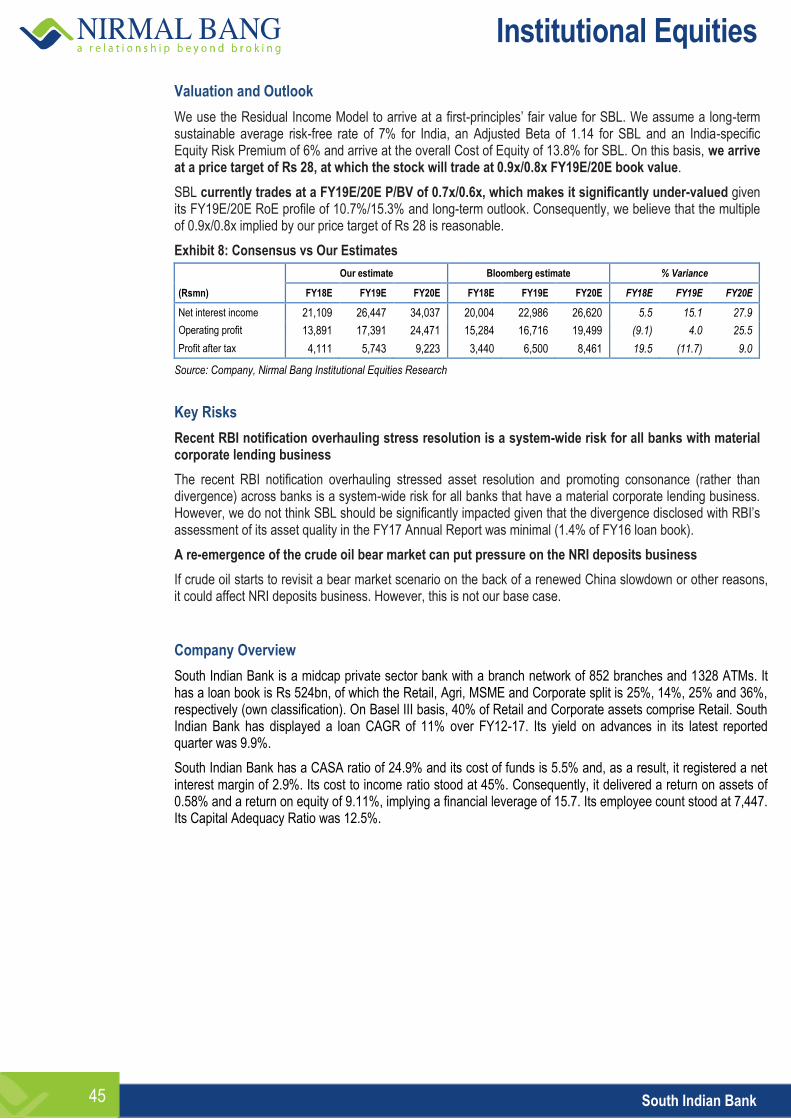
Institutional Equities
South Indian Bank 45
Valuation and Outlook
We use the Residual Income Model to arrive at a first-principles’ fair value for SBL. We assume a long-term sustainable average risk-free rate of 7% for India, an Adjusted Beta of 1.14 for SBL and an India-specific Equity Risk Premium of 6% and arrive at the overall Cost of Equity of 13.8% for SBL. On this basis, we arrive at a price target of Rs 28, at which the stock will trade at 0.9x/0.8x FY19E/20E book value.
SBL currently trades at a FY19E/20E P/BV of 0.7x/0.6x, which makes it significantly under-valued given its FY19E/20E RoE profile of 10.7%/15.3% and long-term outlook. Consequently, we believe that the multiple of 0.9x/0.8x implied by our price target of Rs 28 is reasonable.
Exhibit 8: Consensus vs Our Estimates
Our estimate Bloomberg estimate % Variance
(Rsmn) FY18E FY19E FY20E FY18E FY19E FY20E FY18E FY19E FY20E
Net interest income 21,109 26,447 34,037 20,004 22,986 26,620 5.5 15.1 27.9
Operating profit 13,891 17,391 24,471 15,284 16,716 19,499 (9.1) 4.0 25.5
Profit after tax 4,111 5,743 9,223 3,440 6,500 8,461 19.5 (11.7) 9.0
Source: Company, Nirmal Bang Institutional Equities Research
Key Risks
Recent RBI notification overhauling stress resolution is a system-wide risk for all banks with material corporate lending business
The recent RBI notification overhauling stressed asset resolution and promoting consonance (rather than divergence) across banks is a system-wide risk for all banks that have a material corporate lending business. However, we do not think SBL should be significantly impacted given that the divergence disclosed with RBI’s assessment of its asset quality in the FY17 Annual Report was minimal (1.4% of FY16 loan book).
A re-emergence of the crude oil bear market can put pressure on the NRI deposits business
If crude oil starts to revisit a bear market scenario on the back of a renewed China slowdown or other reasons, it could affect NRI deposits business. However, this is not our base case.
Company Overview
South Indian Bank is a midcap private sector bank with a branch network of 852 branches and 1328 ATMs. It has a loan book is Rs 524bn, of which the Retail, Agri, MSME and Corporate split is 25%, 14%, 25% and 36%, respectively (own classification). On Basel III basis, 40% of Retail and Corporate assets comprise Retail. South Indian Bank has displayed a loan CAGR of 11% over FY12-17. Its yield on advances in its latest reported quarter was 9.9%.
South Indian Bank has a CASA ratio of 24.9% and its cost of funds is 5.5% and, as a result, it registered a net interest margin of 2.9%. Its cost to income ratio stood at 45%. Consequently, it delivered a return on assets of 0.58% and a return on equity of 9.11%, implying a financial leverage of 15.7. Its employee count stood at 7,447. Its Capital Adequacy Ratio was 12.5%.
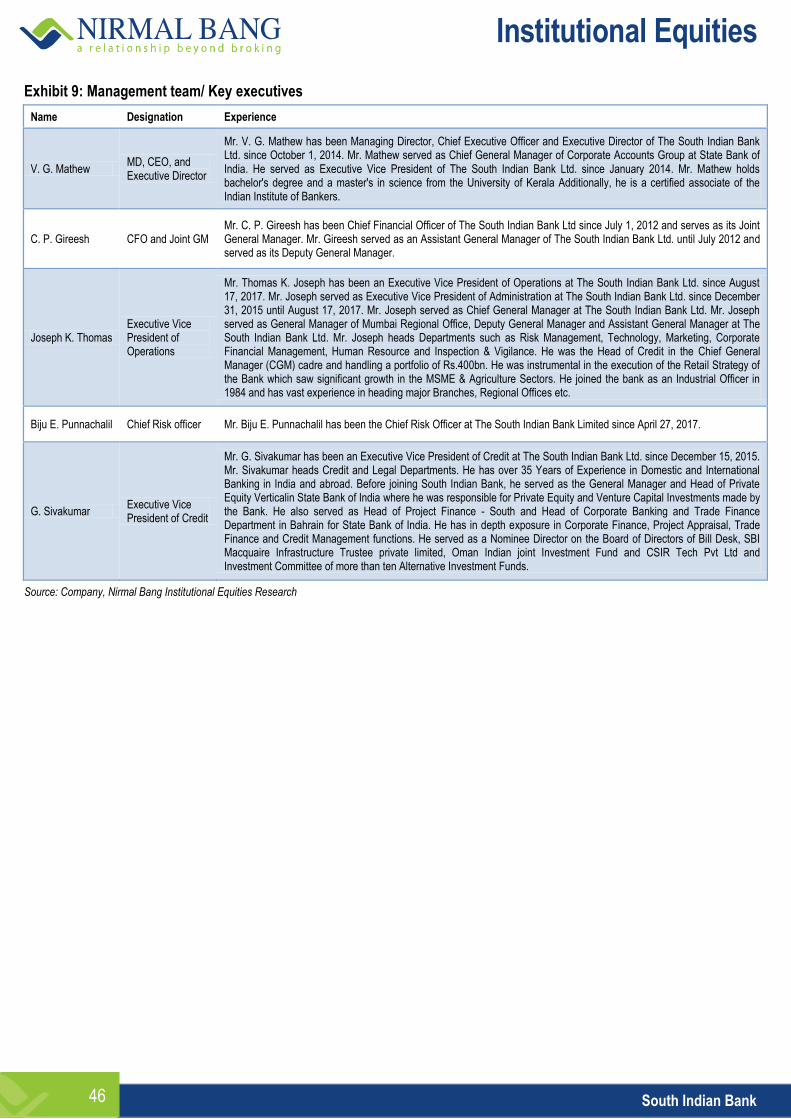
Institutional Equities
South Indian Bank 46
Exhibit 9: Management team/ Key executives
Name Designation Experience
V. G. Mathew MD, CEO, and Executive Director
Mr. V. G. Mathew has been Managing Director, Chief Executive Officer and Executive Director of The South Indian Bank Ltd. since October 1, 2014. Mr. Mathew served as Chief General Manager of Corporate Accounts Group at State Bank of India. He served as Executive Vice President of The South Indian Bank Ltd. since January 2014. Mr. Mathew holds bachelor's degree and a master's in science from the University of Kerala Additionally, he is a certified associate of the Indian Institute of Bankers.
C. P. Gireesh CFO and Joint GM Mr. C. P. Gireesh has been Chief Financial Officer of The South Indian Bank Ltd since July 1, 2012 and serves as its Joint General Manager. Mr. Gireesh served as an Assistant General Manager of The South Indian Bank Ltd. until July 2012 and served as its Deputy General Manager.
Joseph K. Thomas Executive Vice President of Operations
Mr. Thomas K. Joseph has been an Executive Vice President of Operations at The South Indian Bank Ltd. since August 17, 2017. Mr. Joseph served as Executive Vice President of Administration at The South Indian Bank Ltd. since December 31, 2015 until August 17, 2017. Mr. Joseph served as Chief General Manager at The South Indian Bank Ltd. Mr. Joseph served as General Manager of Mumbai Regional Office, Deputy General Manager and Assistant General Manager at The South Indian Bank Ltd. Mr. Joseph heads Departments such as Risk Management, Technology, Marketing, Corporate Financial Management, Human Resource and Inspection & Vigilance. He was the Head of Credit in the Chief General Manager (CGM) cadre and handling a portfolio of Rs.400bn. He was instrumental in the execution of the Retail Strategy of the Bank which saw significant growth in the MSME & Agriculture Sectors. He joined the bank as an Industrial Officer in 1984 and has vast experience in heading major Branches, Regional Offices etc.
Biju E. Punnachalil Chief Risk officer Mr. Biju E. Punnachalil has been the Chief Risk Officer at The South Indian Bank Limited since April 27, 2017.
G. Sivakumar Executive Vice President of Credit
Mr. G. Sivakumar has been an Executive Vice President of Credit at The South Indian Bank Ltd. since December 15, 2015. Mr. Sivakumar heads Credit and Legal Departments. He has over 35 Years of Experience in Domestic and International Banking in India and abroad. Before joining South Indian Bank, he served as the General Manager and Head of Private Equity Verticalin State Bank of India where he was responsible for Private Equity and Venture Capital Investments made by the Bank. He also served as Head of Project Finance - South and Head of Corporate Banking and Trade Finance Department in Bahrain for State Bank of India. He has in depth exposure in Corporate Finance, Project Appraisal, Trade Finance and Credit Management functions. He served as a Nominee Director on the Board of Directors of Bill Desk, SBI Macquaire Infrastructure Trustee private limited, Oman Indian joint Investment Fund and CSIR Tech Pvt Ltd and Investment Committee of more than ten Alternative Investment Funds.
Source: Company, Nirmal Bang Institutional Equities Research
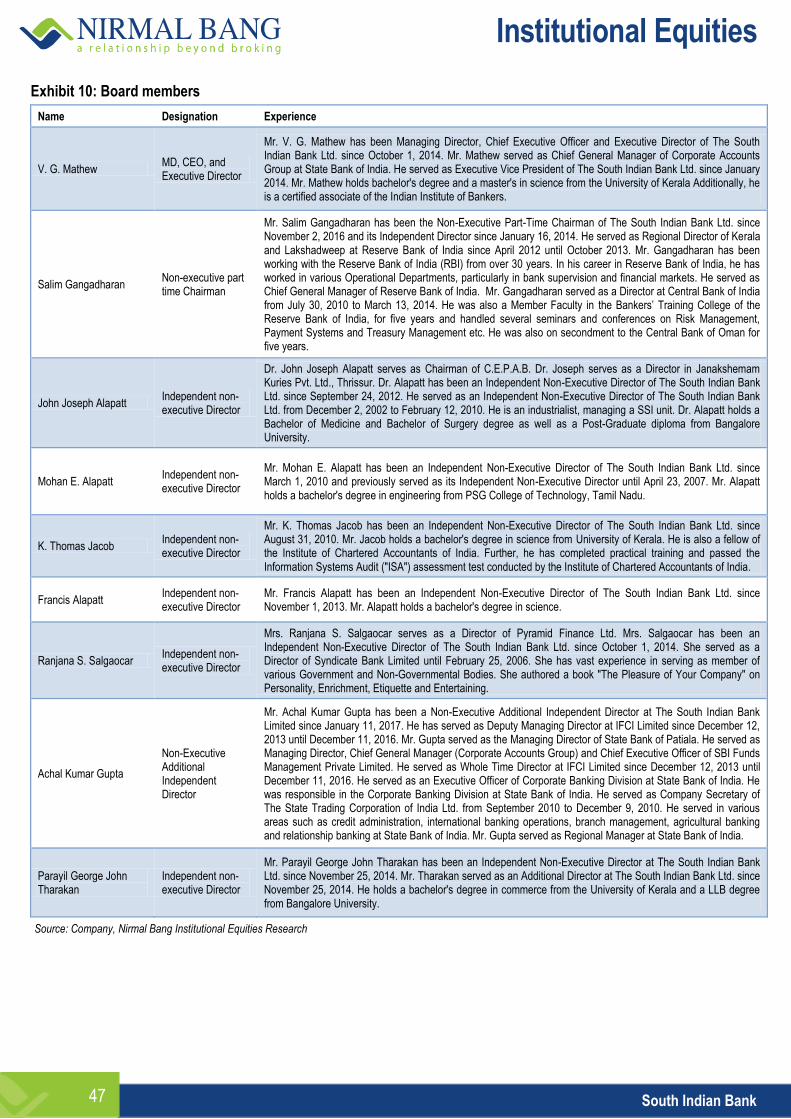
Institutional Equities
South Indian Bank 47
Exhibit 10: Board members
Name Designation Experience
V. G. Mathew MD, CEO, and Executive Director
Mr. V. G. Mathew has been Managing Director, Chief Executive Officer and Executive Director of The South Indian Bank Ltd. since October 1, 2014. Mr. Mathew served as Chief General Manager of Corporate Accounts Group at State Bank of India. He served as Executive Vice President of The South Indian Bank Ltd. since January 2014. Mr. Mathew holds bachelor's degree and a master's in science from the University of Kerala Additionally, he is a certified associate of the Indian Institute of Bankers.
Salim Gangadharan Non-executive part time Chairman
Mr. Salim Gangadharan has been the Non-Executive Part-Time Chairman of The South Indian Bank Ltd. since November 2, 2016 and its Independent Director since January 16, 2014. He served as Regional Director of Kerala and Lakshadweep at Reserve Bank of India since April 2012 until October 2013. Mr. Gangadharan has been working with the Reserve Bank of India (RBI) from over 30 years. In his career in Reserve Bank of India, he has worked in various Operational Departments, particularly in bank supervision and financial markets. He served as Chief General Manager of Reserve Bank of India. Mr. Gangadharan served as a Director at Central Bank of India from July 30, 2010 to March 13, 2014. He was also a Member Faculty in the Bankers’ Training College of the Reserve Bank of India, for five years and handled several seminars and conferences on Risk Management, Payment Systems and Treasury Management etc. He was also on secondment to the Central Bank of Oman for five years.
John Joseph Alapatt Independent non-executive Director
Dr. John Joseph Alapatt serves as Chairman of C.E.P.A.B. Dr. Joseph serves as a Director in Janakshemam Kuries Pvt. Ltd., Thrissur. Dr. Alapatt has been an Independent Non-Executive Director of The South Indian Bank Ltd. since September 24, 2012. He served as an Independent Non-Executive Director of The South Indian Bank Ltd. from December 2, 2002 to February 12, 2010. He is an industrialist, managing a SSI unit. Dr. Alapatt holds a Bachelor of Medicine and Bachelor of Surgery degree as well as a Post-Graduate diploma from Bangalore University.
Mohan E. Alapatt Independent non-executive Director
Mr. Mohan E. Alapatt has been an Independent Non-Executive Director of The South Indian Bank Ltd. since March 1, 2010 and previously served as its Independent Non-Executive Director until April 23, 2007. Mr. Alapatt holds a bachelor's degree in engineering from PSG College of Technology, Tamil Nadu.
K. Thomas Jacob Independent non-executive Director
Mr. K. Thomas Jacob has been an Independent Non-Executive Director of The South Indian Bank Ltd. since August 31, 2010. Mr. Jacob holds a bachelor's degree in science from University of Kerala. He is also a fellow of the Institute of Chartered Accountants of India. Further, he has completed practical training and passed the Information Systems Audit ("ISA") assessment test conducted by the Institute of Chartered Accountants of India.
Francis Alapatt Independent non-executive Director
Mr. Francis Alapatt has been an Independent Non-Executive Director of The South Indian Bank Ltd. since November 1, 2013. Mr. Alapatt holds a bachelor's degree in science.
Ranjana S. Salgaocar Independent non-executive Director
Mrs. Ranjana S. Salgaocar serves as a Director of Pyramid Finance Ltd. Mrs. Salgaocar has been an Independent Non-Executive Director of The South Indian Bank Ltd. since October 1, 2014. She served as a Director of Syndicate Bank Limited until February 25, 2006. She has vast experience in serving as member of various Government and Non-Governmental Bodies. She authored a book "The Pleasure of Your Company" on Personality, Enrichment, Etiquette and Entertaining.
Achal Kumar Gupta
Non-Executive Additional Independent Director
Mr. Achal Kumar Gupta has been a Non-Executive Additional Independent Director at The South Indian Bank Limited since January 11, 2017. He has served as Deputy Managing Director at IFCI Limited since December 12, 2013 until December 11, 2016. Mr. Gupta served as the Managing Director of State Bank of Patiala. He served as Managing Director, Chief General Manager (Corporate Accounts Group) and Chief Executive Officer of SBI Funds Management Private Limited. He served as Whole Time Director at IFCI Limited since December 12, 2013 until December 11, 2016. He served as an Executive Officer of Corporate Banking Division at State Bank of India. He was responsible in the Corporate Banking Division at State Bank of India. He served as Company Secretary of The State Trading Corporation of India Ltd. from September 2010 to December 9, 2010. He served in various areas such as credit administration, international banking operations, branch management, agricultural banking and relationship banking at State Bank of India. Mr. Gupta served as Regional Manager at State Bank of India.
Parayil George John Tharakan
Independent non-executive Director
Mr. Parayil George John Tharakan has been an Independent Non-Executive Director at The South Indian Bank Ltd. since November 25, 2014. Mr. Tharakan served as an Additional Director at The South Indian Bank Ltd. since November 25, 2014. He holds a bachelor's degree in commerce from the University of Kerala and a LLB degree from Bangalore University.
Source: Company, Nirmal Bang Institutional Equities Research
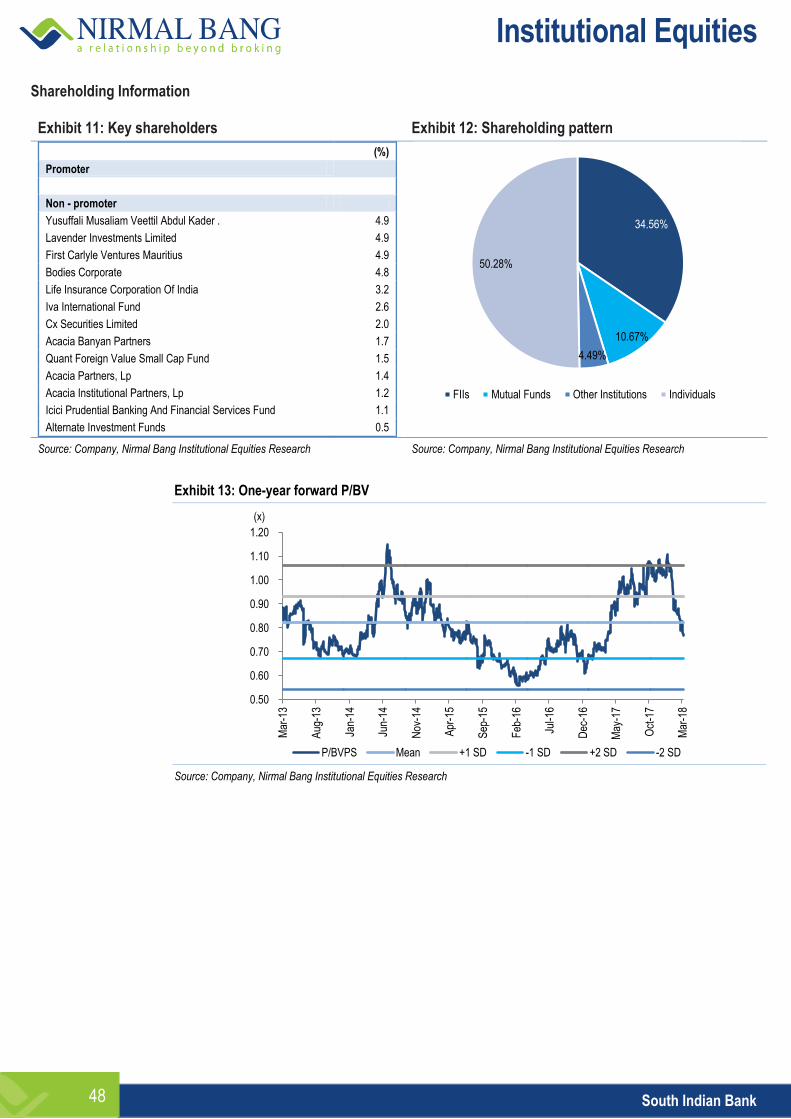
Institutional Equities
South Indian Bank 48
Shareholding Information Exhibit 11: Key shareholders Exhibit 12: Shareholding pattern
(%)
Promoter
Non - promoter
Yusuffali Musaliam Veettil Abdul Kader . 4.9
Lavender Investments Limited 4.9
First Carlyle Ventures Mauritius 4.9
Bodies Corporate 4.8
Life Insurance Corporation Of India 3.2
Iva International Fund 2.6
Cx Securities Limited 2.0
Acacia Banyan Partners 1.7
Quant Foreign Value Small Cap Fund 1.5
Acacia Partners, Lp 1.4
Acacia Institutional Partners, Lp 1.2
Icici Prudential Banking And Financial Services Fund 1.1
Alternate Investment Funds 0.5
Source: Company, Nirmal Bang Institutional Equities Research Source: Company, Nirmal Bang Institutional Equities Research
Exhibit 13: One-year forward P/BV
Source: Company, Nirmal Bang Institutional Equities Research
0.50
0.60
0.70
0.80
0.90
1.00
1.10
1.20
Mar
-13
Aug
-13
Jan-
14
Jun-
14
Nov
-14
Apr
-15
Sep
-15
Feb
-16
Jul-1
6
Dec
-16
May
-17
Oct
-17
Mar
-18
P/BVPS Mean +1 SD -1 SD +2 SD -2 SD
(x)
34.56%
10.67%
4.49%
50.28%
FIIs Mutual Funds Other Institutions Individuals
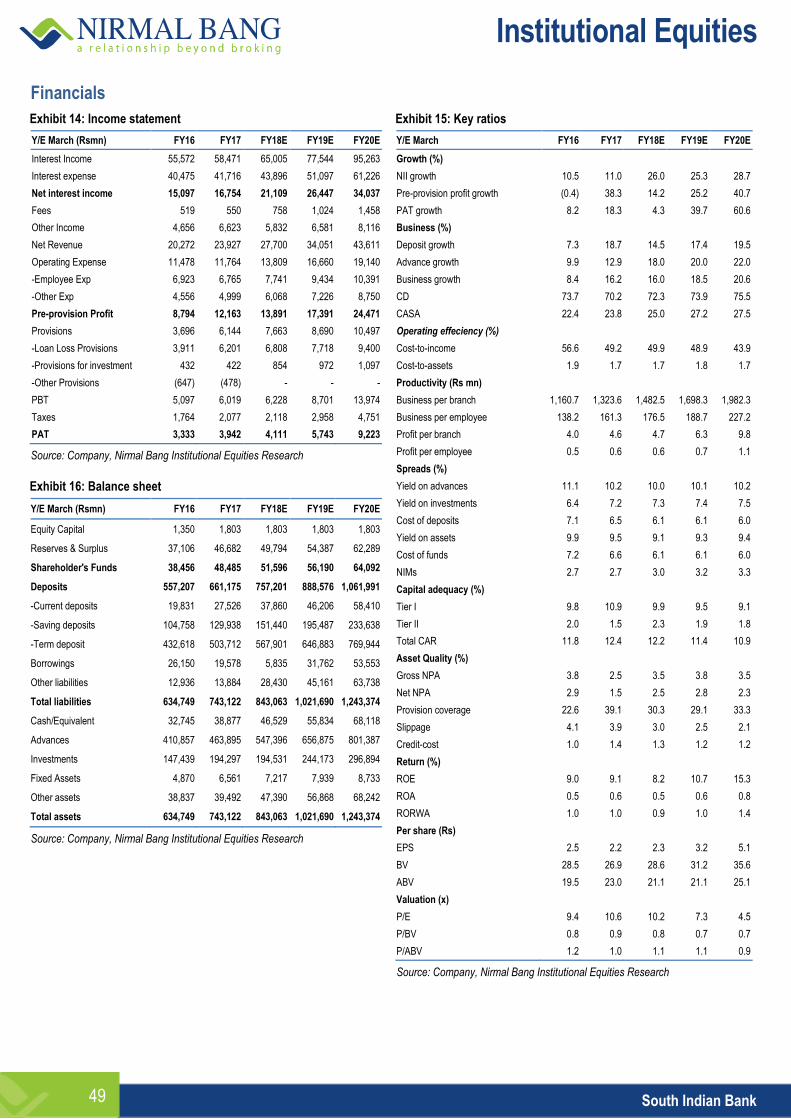
Institutional Equities
South Indian Bank 49
Financials
Exhibit 14: Income statement
Y/E March (Rsmn) FY16 FY17 FY18E FY19E FY20E
Interest Income 55,572 58,471 65,005 77,544 95,263
Interest expense 40,475 41,716 43,896 51,097 61,226
Net interest income 15,097 16,754 21,109 26,447 34,037
Fees 519 550 758 1,024 1,458
Other Income 4,656 6,623 5,832 6,581 8,116
Net Revenue 20,272 23,927 27,700 34,051 43,611
Operating Expense 11,478 11,764 13,809 16,660 19,140
-Employee Exp 6,923 6,765 7,741 9,434 10,391
-Other Exp 4,556 4,999 6,068 7,226 8,750
Pre-provision Profit 8,794 12,163 13,891 17,391 24,471
Provisions 3,696 6,144 7,663 8,690 10,497
-Loan Loss Provisions 3,911 6,201 6,808 7,718 9,400
-Provisions for investment 432 422 854 972 1,097
-Other Provisions (647) (478) - - -
PBT 5,097 6,019 6,228 8,701 13,974
Taxes 1,764 2,077 2,118 2,958 4,751
PAT 3,333 3,942 4,111 5,743 9,223
Source: Company, Nirmal Bang Institutional Equities Research
Exhibit 16: Balance sheet
Y/E March (Rsmn) FY16 FY17 FY18E FY19E FY20E
Equity Capital 1,350 1,803 1,803 1,803 1,803
Reserves & Surplus 37,106 46,682 49,794 54,387 62,289
Shareholder's Funds 38,456 48,485 51,596 56,190 64,092
Deposits 557,207 661,175 757,201 888,576 1,061,991
-Current deposits 19,831 27,526 37,860 46,206 58,410
-Saving deposits 104,758 129,938 151,440 195,487 233,638
-Term deposit 432,618 503,712 567,901 646,883 769,944
Borrowings 26,150 19,578 5,835 31,762 53,553
Other liabilities 12,936 13,884 28,430 45,161 63,738
Total liabilities 634,749 743,122 843,063 1,021,690 1,243,374
Cash/Equivalent 32,745 38,877 46,529 55,834 68,118
Advances 410,857 463,895 547,396 656,875 801,387
Investments 147,439 194,297 194,531 244,173 296,894
Fixed Assets 4,870 6,561 7,217 7,939 8,733
Other assets 38,837 39,492 47,390 56,868 68,242
Total assets 634,749 743,122 843,063 1,021,690 1,243,374
Source: Company, Nirmal Bang Institutional Equities Research
Exhibit 15: Key ratios
Y/E March FY16 FY17 FY18E FY19E FY20E
Growth (%)
NII growth 10.5 11.0 26.0 25.3 28.7
Pre-provision profit growth (0.4) 38.3 14.2 25.2 40.7
PAT growth 8.2 18.3 4.3 39.7 60.6
Business (%)
Deposit growth 7.3 18.7 14.5 17.4 19.5
Advance growth 9.9 12.9 18.0 20.0 22.0
Business growth 8.4 16.2 16.0 18.5 20.6
CD 73.7 70.2 72.3 73.9 75.5
CASA 22.4 23.8 25.0 27.2 27.5
Operating effeciency (%)
Cost-to-income 56.6 49.2 49.9 48.9 43.9
Cost-to-assets 1.9 1.7 1.7 1.8 1.7
Productivity (Rs mn)
Business per branch 1,160.7 1,323.6 1,482.5 1,698.3 1,982.3
Business per employee 138.2 161.3 176.5 188.7 227.2
Profit per branch 4.0 4.6 4.7 6.3 9.8
Profit per employee 0.5 0.6 0.6 0.7 1.1
Spreads (%)
Yield on advances 11.1 10.2 10.0 10.1 10.2
Yield on investments 6.4 7.2 7.3 7.4 7.5
Cost of deposits 7.1 6.5 6.1 6.1 6.0
Yield on assets 9.9 9.5 9.1 9.3 9.4
Cost of funds 7.2 6.6 6.1 6.1 6.0
NIMs 2.7 2.7 3.0 3.2 3.3
Capital adequacy (%)
Tier I 9.8 10.9 9.9 9.5 9.1
Tier II 2.0 1.5 2.3 1.9 1.8
Total CAR 11.8 12.4 12.2 11.4 10.9
Asset Quality (%)
Gross NPA 3.8 2.5 3.5 3.8 3.5
Net NPA 2.9 1.5 2.5 2.8 2.3
Provision coverage 22.6 39.1 30.3 29.1 33.3
Slippage 4.1 3.9 3.0 2.5 2.1
Credit-cost 1.0 1.4 1.3 1.2 1.2
Return (%)
ROE 9.0 9.1 8.2 10.7 15.3
ROA 0.5 0.6 0.5 0.6 0.8
RORWA 1.0 1.0 0.9 1.0 1.4
Per share (Rs)
EPS 2.5 2.2 2.3 3.2 5.1
BV 28.5 26.9 28.6 31.2 35.6
ABV 19.5 23.0 21.1 21.1 25.1
Valuation (x)
P/E 9.4 10.6 10.2 7.3 4.5
P/BV 0.8 0.9 0.8 0.7 0.7
P/ABV 1.2 1.0 1.1 1.1 0.9
Source: Company, Nirmal Bang Institutional Equities Research

Institutional Equities
South Indian Bank 50
This page has been intentionally left blank
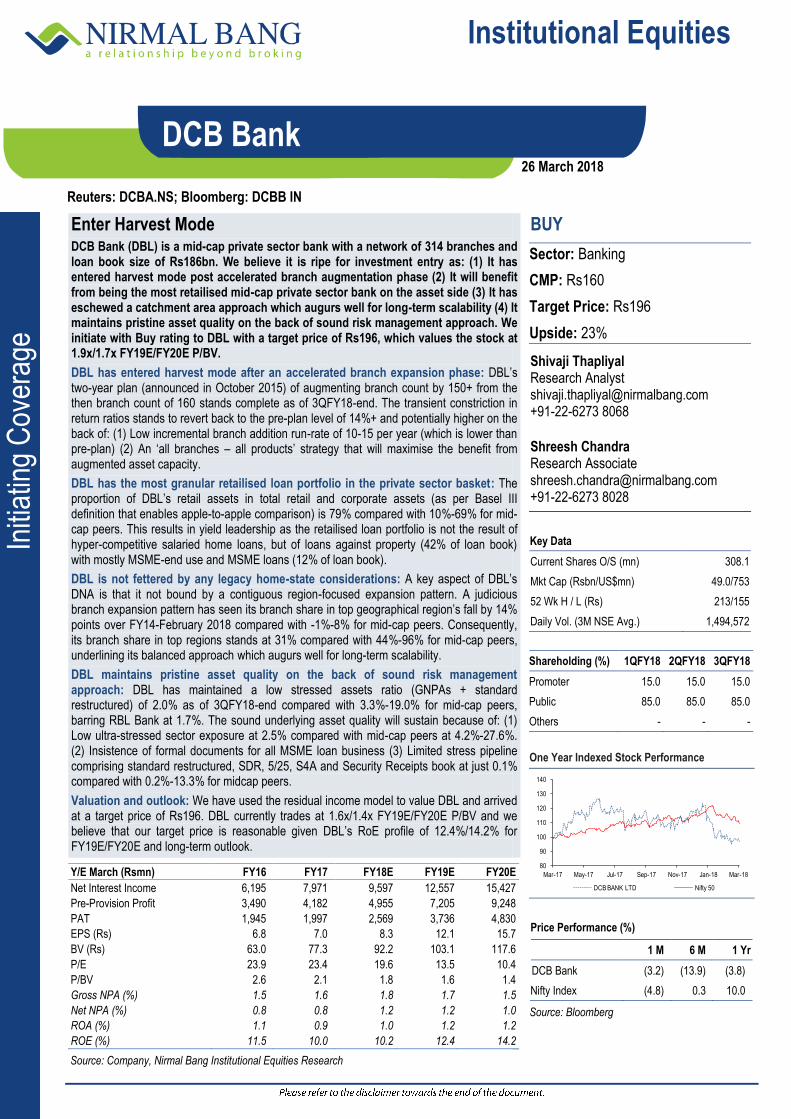
Institutional Equities
Initi
atin
g C
over
age
Reuters: DCBA.NS; Bloomberg: DCBB IN
DCB Bank
Enter Harvest Mode DCB Bank (DBL) is a mid-cap private sector bank with a network of 314 branches and loan book size of Rs186bn. We believe it is ripe for investment entry as: (1) It has entered harvest mode post accelerated branch augmentation phase (2) It will benefit from being the most retailised mid-cap private sector bank on the asset side (3) It has eschewed a catchment area approach which augurs well for long-term scalability (4) It maintains pristine asset quality on the back of sound risk management approach. We initiate with Buy rating to DBL with a target price of Rs196, which values the stock at 1.9x/1.7x FY19E/FY20E P/BV.
DBL has entered harvest mode after an accelerated branch expansion phase: DBL’s two-year plan (announced in October 2015) of augmenting branch count by 150+ from the then branch count of 160 stands complete as of 3QFY18-end. The transient constriction in return ratios stands to revert back to the pre-plan level of 14%+ and potentially higher on the back of: (1) Low incremental branch addition run-rate of 10-15 per year (which is lower than pre-plan) (2) An ‘all branches – all products’ strategy that will maximise the benefit from augmented asset capacity.
DBL has the most granular retailised loan portfolio in the private sector basket: The proportion of DBL’s retail assets in total retail and corporate assets (as per Basel III definition that enables apple-to-apple comparison) is 79% compared with 10%-69% for mid-cap peers. This results in yield leadership as the retailised loan portfolio is not the result of hyper-competitive salaried home loans, but of loans against property (42% of loan book) with mostly MSME-end use and MSME loans (12% of loan book).
DBL is not fettered by any legacy home-state considerations: A key aspect of DBL’s DNA is that it not bound by a contiguous region-focused expansion pattern. A judicious branch expansion pattern has seen its branch share in top geographical region’s fall by 14% points over FY14-February 2018 compared with -1%-8% for mid-cap peers. Consequently, its branch share in top regions stands at 31% compared with 44%-96% for mid-cap peers, underlining its balanced approach which augurs well for long-term scalability.
DBL maintains pristine asset quality on the back of sound risk management approach: DBL has maintained a low stressed assets ratio (GNPAs + standard restructured) of 2.0% as of 3QFY18-end compared with 3.3%-19.0% for mid-cap peers, barring RBL Bank at 1.7%. The sound underlying asset quality will sustain because of: (1) Low ultra-stressed sector exposure at 2.5% compared with mid-cap peers at 4.2%-27.6%. (2) Insistence of formal documents for all MSME loan business (3) Limited stress pipeline comprising standard restructured, SDR, 5/25, S4A and Security Receipts book at just 0.1% compared with 0.2%-13.3% for midcap peers.
Valuation and outlook: We have used the residual income model to value DBL and arrived at a target price of Rs196. DBL currently trades at 1.6x/1.4x FY19E/FY20E P/BV and we believe that our target price is reasonable given DBL’s RoE profile of 12.4%/14.2% for FY19E/FY20E and long-term outlook.
BUY
Sector: Banking
CMP: Rs160
Target Price: Rs196
Upside: 23%
Shivaji Thapliyal Research Analyst [email protected] +91-22-6273 8068 Shreesh Chandra Research Associate [email protected] +91-22-6273 8028
Key Data
Current Shares O/S (mn) 308.1
Mkt Cap (Rsbn/US$mn) 49.0/753
52 Wk H / L (Rs) 213/155
Daily Vol. (3M NSE Avg.) 1,494,572
Shareholding (%) 1QFY18 2QFY18 3QFY18
Promoter 15.0 15.0 15.0
Public 85.0 85.0 85.0
Others - - -
One Year Indexed Stock Performance
Price Performance (%)
1 M 6 M 1 Yr
DCB Bank (3.2) (13.9) (3.8)
Nifty Index (4.8) 0.3 10.0
Source: Bloomberg
Y/E March (Rsmn) FY16 FY17 FY18E FY19E FY20E
Net Interest Income 6,195 7,971 9,597 12,557 15,427
Pre-Provision Profit 3,490 4,182 4,955 7,205 9,248
PAT 1,945 1,997 2,569 3,736 4,830
EPS (Rs) 6.8 7.0 8.3 12.1 15.7
BV (Rs) 63.0 77.3 92.2 103.1 117.6
P/E 23.9 23.4 19.6 13.5 10.4
P/BV 2.6 2.1 1.8 1.6 1.4
Gross NPA (%) 1.5 1.6 1.8 1.7 1.5
Net NPA (%) 0.8 0.8 1.2 1.2 1.0
ROA (%) 1.1 0.9 1.0 1.2 1.2
ROE (%) 11.5 10.0 10.2 12.4 14.2
Source: Company, Nirmal Bang Institutional Equities Research
80
90
100
110
120
130
140
Mar-17 May-17 Jul-17 Sep-17 Nov-17 Jan-18 Mar-18
DCB BANK LTD Nifty 50
26 March 2018
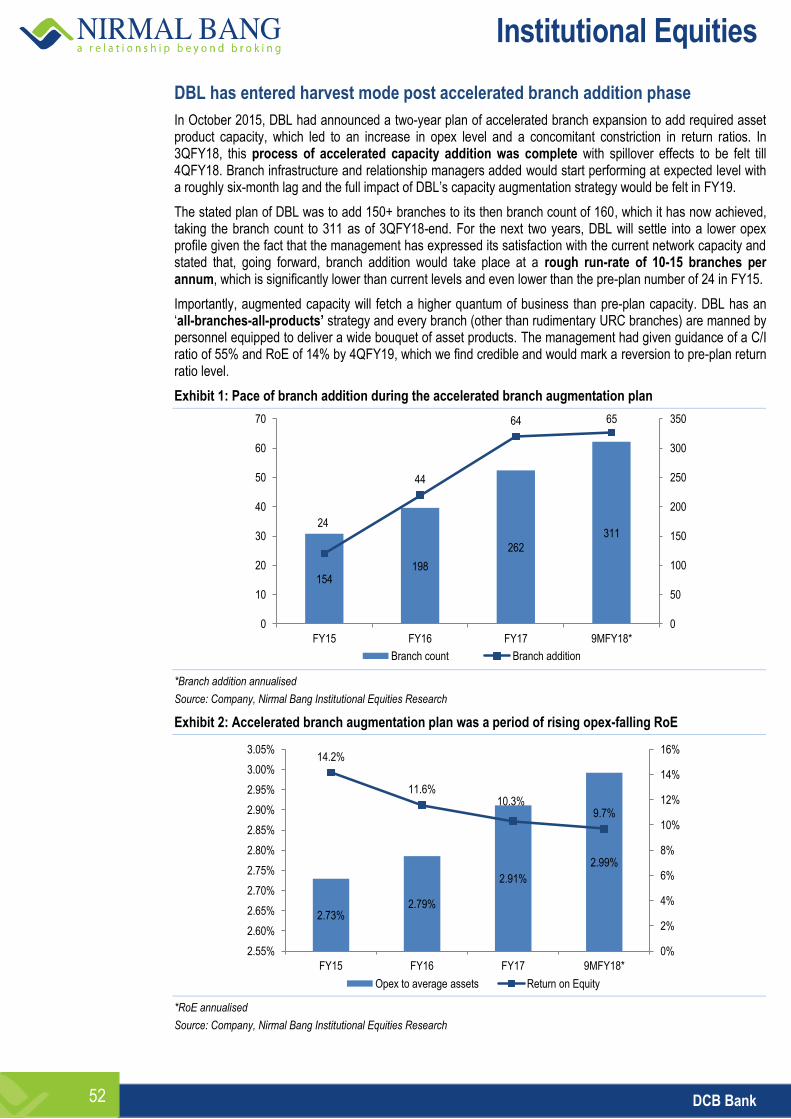
Institutional Equities
DCB Bank 52
DBL has entered harvest mode post accelerated branch addition phase
In October 2015, DBL had announced a two-year plan of accelerated branch expansion to add required asset product capacity, which led to an increase in opex level and a concomitant constriction in return ratios. In 3QFY18, this process of accelerated capacity addition was complete with spillover effects to be felt till 4QFY18. Branch infrastructure and relationship managers added would start performing at expected level with a roughly six-month lag and the full impact of DBL’s capacity augmentation strategy would be felt in FY19.
The stated plan of DBL was to add 150+ branches to its then branch count of 160, which it has now achieved, taking the branch count to 311 as of 3QFY18-end. For the next two years, DBL will settle into a lower opex profile given the fact that the management has expressed its satisfaction with the current network capacity and stated that, going forward, branch addition would take place at a rough run-rate of 10-15 branches per annum, which is significantly lower than current levels and even lower than the pre-plan number of 24 in FY15.
Importantly, augmented capacity will fetch a higher quantum of business than pre-plan capacity. DBL has an ‘all-branches-all-products’ strategy and every branch (other than rudimentary URC branches) are manned by personnel equipped to deliver a wide bouquet of asset products. The management had given guidance of a C/I ratio of 55% and RoE of 14% by 4QFY19, which we find credible and would mark a reversion to pre-plan return ratio level.
Exhibit 1: Pace of branch addition during the accelerated branch augmentation plan
*Branch addition annualised
Source: Company, Nirmal Bang Institutional Equities Research
Exhibit 2: Accelerated branch augmentation plan was a period of rising opex-falling RoE
*RoE annualised
Source: Company, Nirmal Bang Institutional Equities Research
154 198
262
311 24
44
64 65
0
50
100
150
200
250
300
350
0
10
20
30
40
50
60
70
FY15 FY16 FY17 9MFY18*
Branch count Branch addition
2.73% 2.79%
2.91%
2.99%
14.2%
11.6% 10.3%
9.7%
0%
2%
4%
6%
8%
10%
12%
14%
16%
2.55%
2.60%
2.65%
2.70%
2.75%
2.80%
2.85%
2.90%
2.95%
3.00%
3.05%
FY15 FY16 FY17 9MFY18*
Opex to average assets Return on Equity
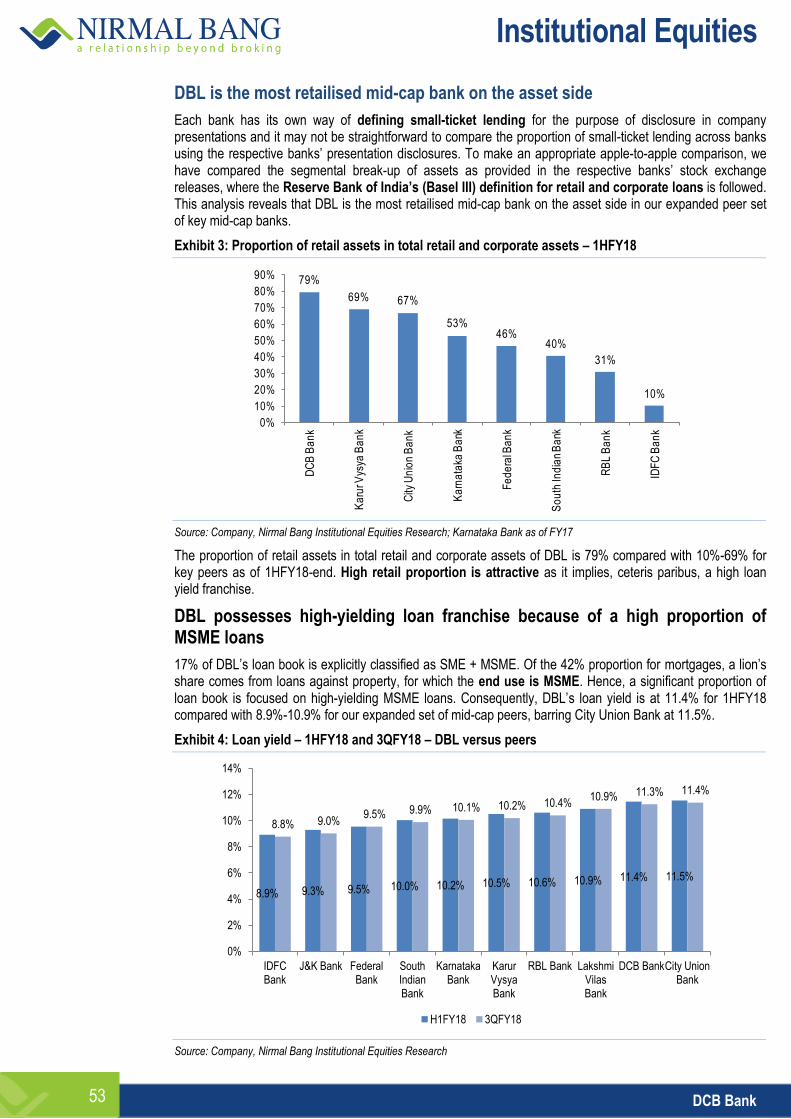
Institutional Equities
DCB Bank 53
DBL is the most retailised mid-cap bank on the asset side
Each bank has its own way of defining small-ticket lending for the purpose of disclosure in company presentations and it may not be straightforward to compare the proportion of small-ticket lending across banks using the respective banks’ presentation disclosures. To make an appropriate apple-to-apple comparison, we have compared the segmental break-up of assets as provided in the respective banks’ stock exchange releases, where the Reserve Bank of India’s (Basel III) definition for retail and corporate loans is followed. This analysis reveals that DBL is the most retailised mid-cap bank on the asset side in our expanded peer set of key mid-cap banks.
Exhibit 3: Proportion of retail assets in total retail and corporate assets – 1HFY18
Source: Company, Nirmal Bang Institutional Equities Research; Karnataka Bank as of FY17
The proportion of retail assets in total retail and corporate assets of DBL is 79% compared with 10%-69% for key peers as of 1HFY18-end. High retail proportion is attractive as it implies, ceteris paribus, a high loan yield franchise.
DBL possesses high-yielding loan franchise because of a high proportion of MSME loans
17% of DBL’s loan book is explicitly classified as SME + MSME. Of the 42% proportion for mortgages, a lion’s share comes from loans against property, for which the end use is MSME. Hence, a significant proportion of loan book is focused on high-yielding MSME loans. Consequently, DBL’s loan yield is at 11.4% for 1HFY18 compared with 8.9%-10.9% for our expanded set of mid-cap peers, barring City Union Bank at 11.5%.
Exhibit 4: Loan yield – 1HFY18 and 3QFY18 – DBL versus peers
Source: Company, Nirmal Bang Institutional Equities Research
79%
69% 67%
53%46%
40%
31%
10%
0%
10%
20%
30%
40%
50%
60%
70%
80%
90%
DC
B B
an
k
Ka
rur V
ysya
Ba
nk
City
Un
ion
Ba
nk
Ka
rna
taka
Ba
nk
Fe
de
ral B
an
k
So
uth
Ind
ian
Ba
nk
RB
L B
an
k
IDF
C B
an
k
8.9% 9.3% 9.5% 10.0% 10.2% 10.5% 10.6% 10.9% 11.4% 11.5%
8.8% 9.0% 9.5% 9.9% 10.1% 10.2% 10.4%
10.9% 11.3% 11.4%
0%
2%
4%
6%
8%
10%
12%
14%
IDFC Bank
J&K Bank Federal Bank
South Indian Bank
Karnataka Bank
Karur Vysya Bank
RBL Bank Lakshmi Vilas Bank
DCB Bank City Union Bank
H1FY18 3QFY18
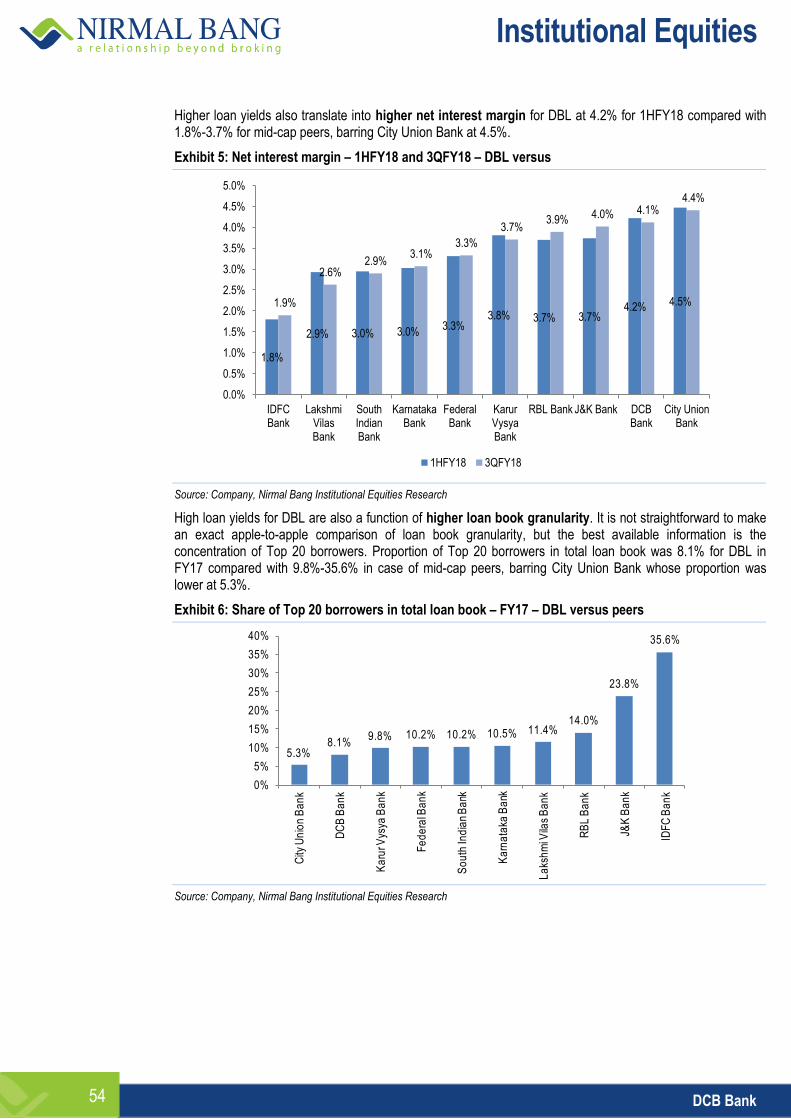
Institutional Equities
DCB Bank 54
Higher loan yields also translate into higher net interest margin for DBL at 4.2% for 1HFY18 compared with 1.8%-3.7% for mid-cap peers, barring City Union Bank at 4.5%.
Exhibit 5: Net interest margin – 1HFY18 and 3QFY18 – DBL versus
Source: Company, Nirmal Bang Institutional Equities Research
High loan yields for DBL are also a function of higher loan book granularity. It is not straightforward to make an exact apple-to-apple comparison of loan book granularity, but the best available information is the concentration of Top 20 borrowers. Proportion of Top 20 borrowers in total loan book was 8.1% for DBL in FY17 compared with 9.8%-35.6% in case of mid-cap peers, barring City Union Bank whose proportion was lower at 5.3%.
Exhibit 6: Share of Top 20 borrowers in total loan book – FY17 – DBL versus peers
Source: Company, Nirmal Bang Institutional Equities Research
1.8%
2.9% 3.0% 3.0% 3.3%
3.8% 3.7% 3.7% 4.2% 4.5% 1.9%
2.6% 2.9%
3.1% 3.3%
3.7% 3.9% 4.0% 4.1%
4.4%
0.0%
0.5%
1.0%
1.5%
2.0%
2.5%
3.0%
3.5%
4.0%
4.5%
5.0%
IDFC Bank
Lakshmi Vilas Bank
South Indian Bank
Karnataka Bank
Federal Bank
Karur Vysya Bank
RBL Bank J&K Bank DCB Bank
City Union Bank
1HFY18 3QFY18
5.3%8.1%
9.8% 10.2% 10.2% 10.5% 11.4%14.0%
23.8%
35.6%
0%
5%
10%
15%
20%
25%
30%
35%
40%
City
Un
ion
Ba
nk
DC
B B
an
k
Ka
rur V
ysya
Ba
nk
Fe
de
ral B
an
k
So
uth
Ind
ian
Ba
nk
Ka
rna
taka
Ba
nk
La
ksh
mi V
ilas
Ba
nk
RB
L B
an
k
J&K
Ba
nk
IDF
C B
an
k
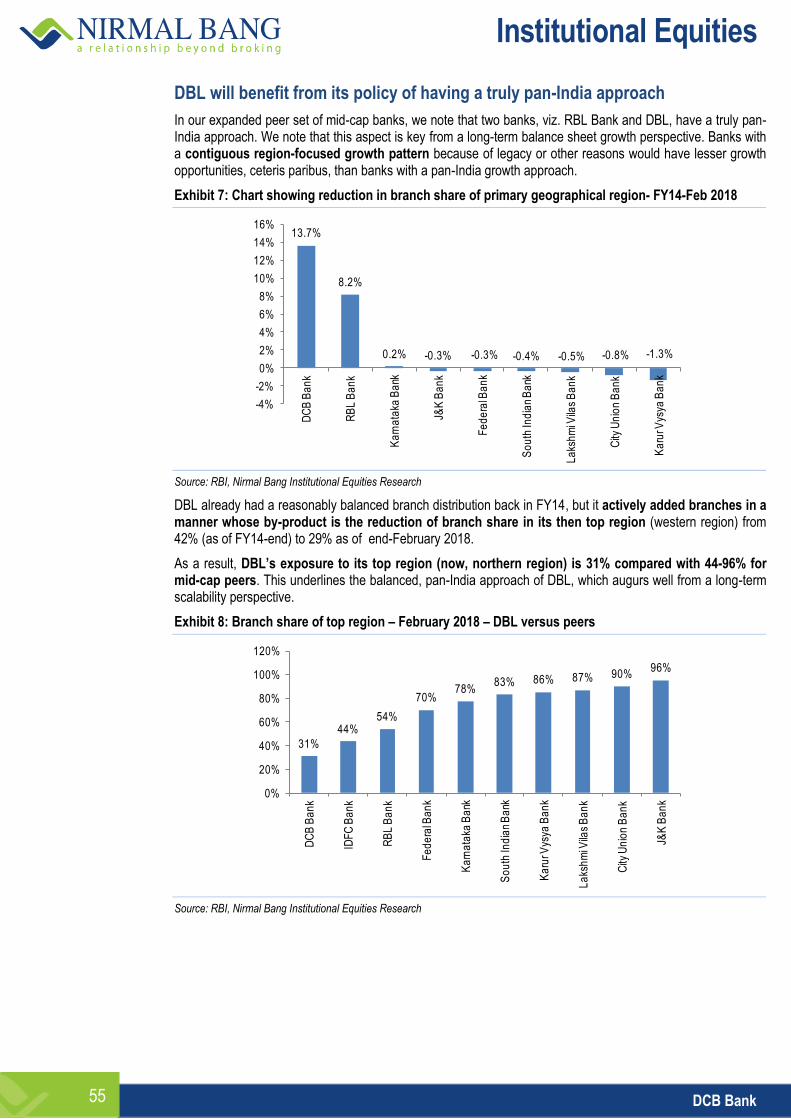
Institutional Equities
DCB Bank 55
DBL will benefit from its policy of having a truly pan-India approach
In our expanded peer set of mid-cap banks, we note that two banks, viz. RBL Bank and DBL, have a truly pan-India approach. We note that this aspect is key from a long-term balance sheet growth perspective. Banks with a contiguous region-focused growth pattern because of legacy or other reasons would have lesser growth opportunities, ceteris paribus, than banks with a pan-India growth approach.
Exhibit 7: Chart showing reduction in branch share of primary geographical region- FY14-Feb 2018
Source: RBI, Nirmal Bang Institutional Equities Research
DBL already had a reasonably balanced branch distribution back in FY14, but it actively added branches in a manner whose by-product is the reduction of branch share in its then top region (western region) from 42% (as of FY14-end) to 29% as of end-February 2018.
As a result, DBL’s exposure to its top region (now, northern region) is 31% compared with 44-96% for mid-cap peers. This underlines the balanced, pan-India approach of DBL, which augurs well from a long-term scalability perspective.
Exhibit 8: Branch share of top region – February 2018 – DBL versus peers
Source: RBI, Nirmal Bang Institutional Equities Research
13.7%
8.2%
0.2% -0.3% -0.3% -0.4% -0.5% -0.8% -1.3%
-4%
-2%
0%
2%
4%
6%
8%
10%
12%
14%
16%
DC
B B
an
k
RB
L B
an
k
Ka
rna
taka
Ba
nk
J&K
Ba
nk
Fe
de
ral B
an
k
So
uth
Ind
ian
Ba
nk
La
ksh
mi V
ilas
Ba
nk
City
Un
ion
Ba
nk
Ka
rur V
ysya
Ba
nk
31%
44%54%
70%78%
83% 86% 87% 90%96%
0%
20%
40%
60%
80%
100%
120%
DC
B B
an
k
IDF
C B
an
k
RB
L B
an
k
Fe
de
ral B
an
k
Ka
rna
taka
Ba
nk
So
uth
Ind
ian
Ba
nk
Ka
rur V
ysya
Ba
nk
La
ksh
mi V
ilas
Ba
nk
City
Un
ion
Ba
nk
J&K
Ba
nk
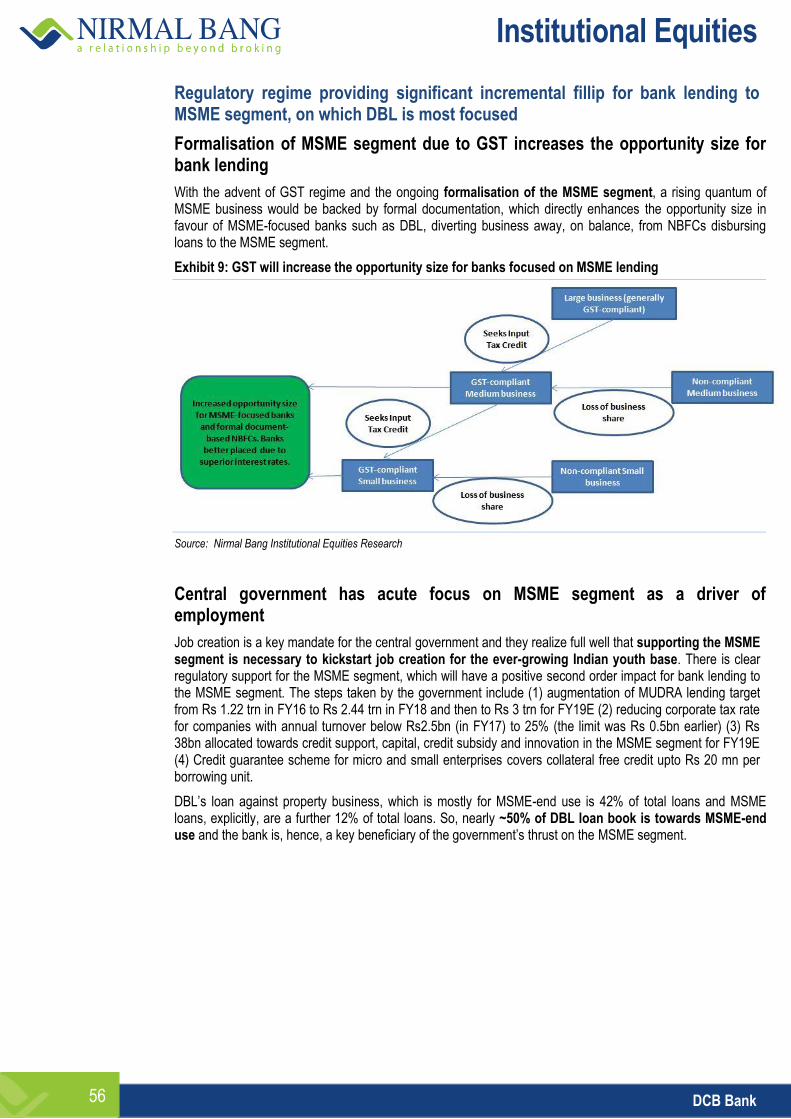
Institutional Equities
DCB Bank 56
Regulatory regime providing significant incremental fillip for bank lending to MSME segment, on which DBL is most focused
Formalisation of MSME segment due to GST increases the opportunity size for bank lending
With the advent of GST regime and the ongoing formalisation of the MSME segment, a rising quantum of MSME business would be backed by formal documentation, which directly enhances the opportunity size in favour of MSME-focused banks such as DBL, diverting business away, on balance, from NBFCs disbursing loans to the MSME segment.
Exhibit 9: GST will increase the opportunity size for banks focused on MSME lending
Source: Nirmal Bang Institutional Equities Research
Central government has acute focus on MSME segment as a driver of employment
Job creation is a key mandate for the central government and they realize full well that supporting the MSME segment is necessary to kickstart job creation for the ever-growing Indian youth base. There is clear regulatory support for the MSME segment, which will have a positive second order impact for bank lending to the MSME segment. The steps taken by the government include (1) augmentation of MUDRA lending target from Rs 1.22 trn in FY16 to Rs 2.44 trn in FY18 and then to Rs 3 trn for FY19E (2) reducing corporate tax rate for companies with annual turnover below Rs2.5bn (in FY17) to 25% (the limit was Rs 0.5bn earlier) (3) Rs 38bn allocated towards credit support, capital, credit subsidy and innovation in the MSME segment for FY19E (4) Credit guarantee scheme for micro and small enterprises covers collateral free credit upto Rs 20 mn per borrowing unit.
DBL’s loan against property business, which is mostly for MSME-end use is 42% of total loans and MSME loans, explicitly, are a further 12% of total loans. So, nearly ~50% of DBL loan book is towards MSME-end use and the bank is, hence, a key beneficiary of the government’s thrust on the MSME segment.
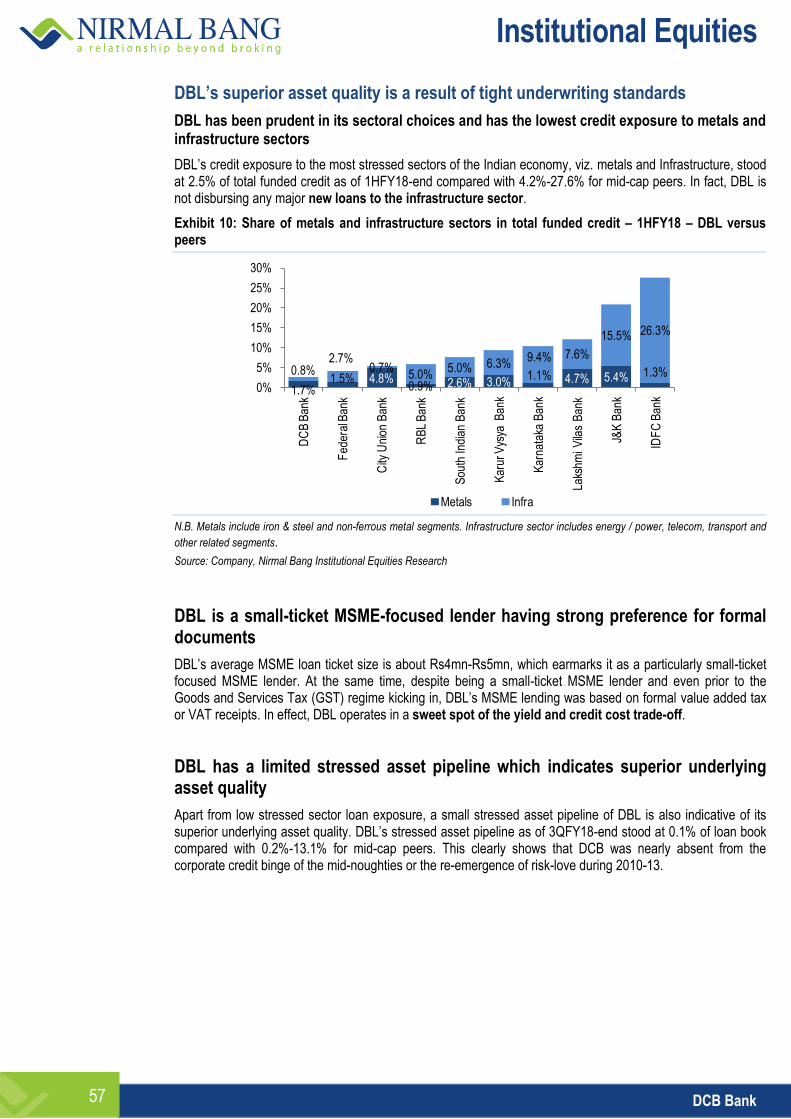
Institutional Equities
DCB Bank 57
DBL’s superior asset quality is a result of tight underwriting standards
DBL has been prudent in its sectoral choices and has the lowest credit exposure to metals and infrastructure sectors
DBL’s credit exposure to the most stressed sectors of the Indian economy, viz. metals and Infrastructure, stood at 2.5% of total funded credit as of 1HFY18-end compared with 4.2%-27.6% for mid-cap peers. In fact, DBL is not disbursing any major new loans to the infrastructure sector.
Exhibit 10: Share of metals and infrastructure sectors in total funded credit – 1HFY18 – DBL versus peers
N.B. Metals include iron & steel and non-ferrous metal segments. Infrastructure sector includes energy / power, telecom, transport and
other related segments.
Source: Company, Nirmal Bang Institutional Equities Research
DBL is a small-ticket MSME-focused lender having strong preference for formal documents
DBL’s average MSME loan ticket size is about Rs4mn-Rs5mn, which earmarks it as a particularly small-ticket focused MSME lender. At the same time, despite being a small-ticket MSME lender and even prior to the Goods and Services Tax (GST) regime kicking in, DBL’s MSME lending was based on formal value added tax or VAT receipts. In effect, DBL operates in a sweet spot of the yield and credit cost trade-off.
DBL has a limited stressed asset pipeline which indicates superior underlying asset quality
Apart from low stressed sector loan exposure, a small stressed asset pipeline of DBL is also indicative of its superior underlying asset quality. DBL’s stressed asset pipeline as of 3QFY18-end stood at 0.1% of loan book compared with 0.2%-13.1% for mid-cap peers. This clearly shows that DCB was nearly absent from the corporate credit binge of the mid-noughties or the re-emergence of risk-love during 2010-13.
1.7%1.5% 4.8%
0.9% 2.6% 3.0%1.1% 4.7% 5.4% 1.3%0.8%
2.7%0.7%
5.0%5.0% 6.3%
9.4% 7.6%
15.5% 26.3%
0%
5%
10%
15%
20%
25%
30%
DC
B B
ank
Fed
eral
Ban
k
City
Uni
on B
ank
RB
L B
ank
Sou
th In
dian
Ban
k
Kar
ur V
ysya
Ban
k
Kar
nata
ka B
ank
Laks
hmi V
ilas
Ban
k
J&K
Ban
k
IDF
C B
ank
Metals Infra
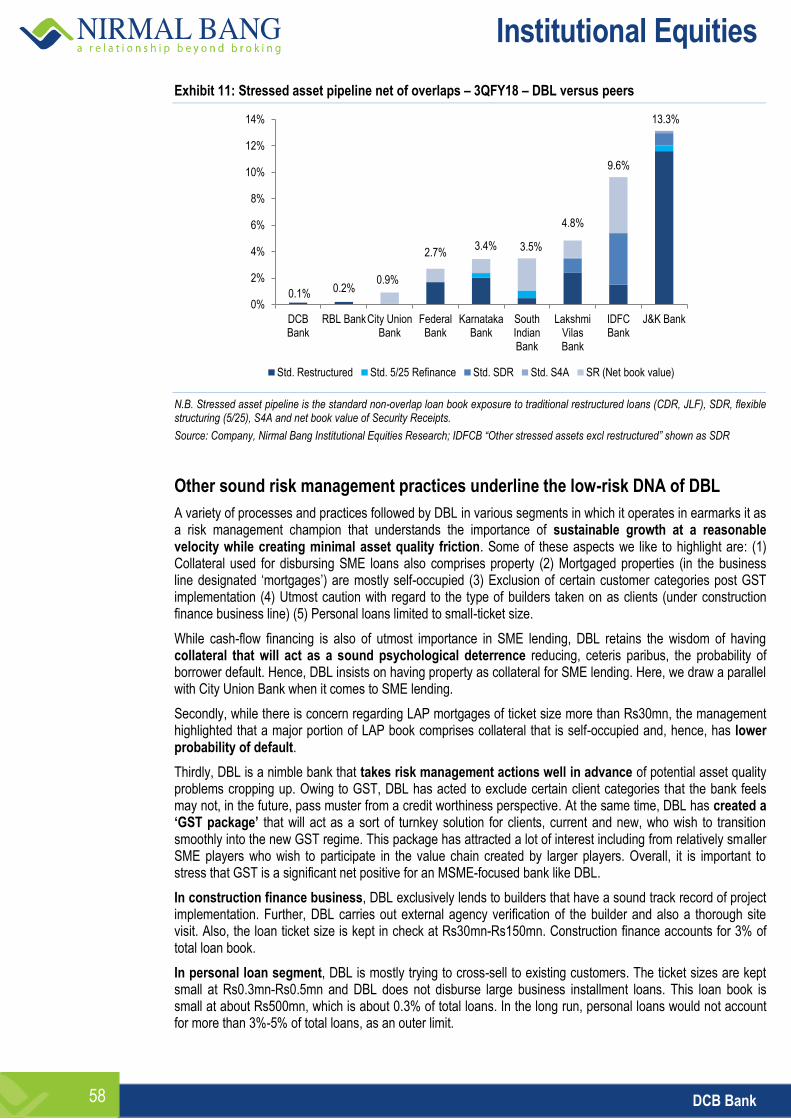
Institutional Equities
DCB Bank 58
Exhibit 11: Stressed asset pipeline net of overlaps – 3QFY18 – DBL versus peers
N.B. Stressed asset pipeline is the standard non-overlap loan book exposure to traditional restructured loans (CDR, JLF), SDR, flexible structuring (5/25), S4A and net book value of Security Receipts.
Source: Company, Nirmal Bang Institutional Equities Research; IDFCB “Other stressed assets excl restructured” shown as SDR
Other sound risk management practices underline the low-risk DNA of DBL
A variety of processes and practices followed by DBL in various segments in which it operates in earmarks it as a risk management champion that understands the importance of sustainable growth at a reasonable velocity while creating minimal asset quality friction. Some of these aspects we like to highlight are: (1) Collateral used for disbursing SME loans also comprises property (2) Mortgaged properties (in the business line designated ‘mortgages’) are mostly self-occupied (3) Exclusion of certain customer categories post GST implementation (4) Utmost caution with regard to the type of builders taken on as clients (under construction finance business line) (5) Personal loans limited to small-ticket size.
While cash-flow financing is also of utmost importance in SME lending, DBL retains the wisdom of having collateral that will act as a sound psychological deterrence reducing, ceteris paribus, the probability of borrower default. Hence, DBL insists on having property as collateral for SME lending. Here, we draw a parallel with City Union Bank when it comes to SME lending.
Secondly, while there is concern regarding LAP mortgages of ticket size more than Rs30mn, the management highlighted that a major portion of LAP book comprises collateral that is self-occupied and, hence, has lower probability of default.
Thirdly, DBL is a nimble bank that takes risk management actions well in advance of potential asset quality problems cropping up. Owing to GST, DBL has acted to exclude certain client categories that the bank feels may not, in the future, pass muster from a credit worthiness perspective. At the same time, DBL has created a ‘GST package’ that will act as a sort of turnkey solution for clients, current and new, who wish to transition smoothly into the new GST regime. This package has attracted a lot of interest including from relatively smaller SME players who wish to participate in the value chain created by larger players. Overall, it is important to stress that GST is a significant net positive for an MSME-focused bank like DBL.
In construction finance business, DBL exclusively lends to builders that have a sound track record of project implementation. Further, DBL carries out external agency verification of the builder and also a thorough site visit. Also, the loan ticket size is kept in check at Rs30mn-Rs150mn. Construction finance accounts for 3% of total loan book.
In personal loan segment, DBL is mostly trying to cross-sell to existing customers. The ticket sizes are kept small at Rs0.3mn-Rs0.5mn and DBL does not disburse large business installment loans. This loan book is small at about Rs500mn, which is about 0.3% of total loans. In the long run, personal loans would not account for more than 3%-5% of total loans, as an outer limit.
0.1% 0.2% 0.9%
2.7% 3.4% 3.5%
4.8%
9.6%
13.3%
0%
2%
4%
6%
8%
10%
12%
14%
DCB Bank
RBL Bank City Union Bank
Federal Bank
Karnataka Bank
South Indian Bank
Lakshmi Vilas Bank
IDFC Bank
J&K Bank
Std. Restructured Std. 5/25 Refinance Std. SDR Std. S4A SR (Net book value)
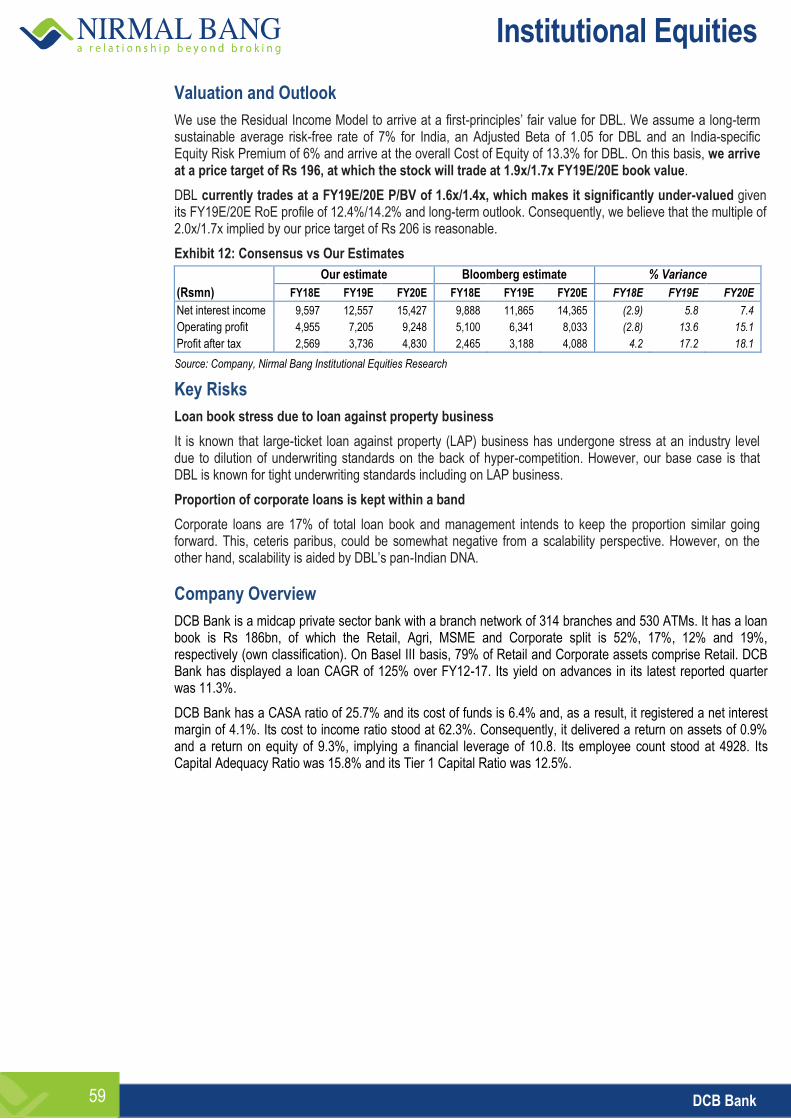
Institutional Equities
DCB Bank 59
Valuation and Outlook
We use the Residual Income Model to arrive at a first-principles’ fair value for DBL. We assume a long-term sustainable average risk-free rate of 7% for India, an Adjusted Beta of 1.05 for DBL and an India-specific Equity Risk Premium of 6% and arrive at the overall Cost of Equity of 13.3% for DBL. On this basis, we arrive at a price target of Rs 196, at which the stock will trade at 1.9x/1.7x FY19E/20E book value.
DBL currently trades at a FY19E/20E P/BV of 1.6x/1.4x, which makes it significantly under-valued given its FY19E/20E RoE profile of 12.4%/14.2% and long-term outlook. Consequently, we believe that the multiple of 2.0x/1.7x implied by our price target of Rs 206 is reasonable.
Exhibit 12: Consensus vs Our Estimates
Our estimate Bloomberg estimate % Variance
(Rsmn) FY18E FY19E FY20E FY18E FY19E FY20E FY18E FY19E FY20E
Net interest income 9,597 12,557 15,427 9,888 11,865 14,365 (2.9) 5.8 7.4
Operating profit 4,955 7,205 9,248 5,100 6,341 8,033 (2.8) 13.6 15.1
Profit after tax 2,569 3,736 4,830 2,465 3,188 4,088 4.2 17.2 18.1
Source: Company, Nirmal Bang Institutional Equities Research
Key Risks
Loan book stress due to loan against property business
It is known that large-ticket loan against property (LAP) business has undergone stress at an industry level due to dilution of underwriting standards on the back of hyper-competition. However, our base case is that DBL is known for tight underwriting standards including on LAP business.
Proportion of corporate loans is kept within a band
Corporate loans are 17% of total loan book and management intends to keep the proportion similar going forward. This, ceteris paribus, could be somewhat negative from a scalability perspective. However, on the other hand, scalability is aided by DBL’s pan-Indian DNA.
Company Overview
DCB Bank is a midcap private sector bank with a branch network of 314 branches and 530 ATMs. It has a loan book is Rs 186bn, of which the Retail, Agri, MSME and Corporate split is 52%, 17%, 12% and 19%, respectively (own classification). On Basel III basis, 79% of Retail and Corporate assets comprise Retail. DCB Bank has displayed a loan CAGR of 125% over FY12-17. Its yield on advances in its latest reported quarter was 11.3%.
DCB Bank has a CASA ratio of 25.7% and its cost of funds is 6.4% and, as a result, it registered a net interest margin of 4.1%. Its cost to income ratio stood at 62.3%. Consequently, it delivered a return on assets of 0.9% and a return on equity of 9.3%, implying a financial leverage of 10.8. Its employee count stood at 4928. Its Capital Adequacy Ratio was 15.8% and its Tier 1 Capital Ratio was 12.5%.
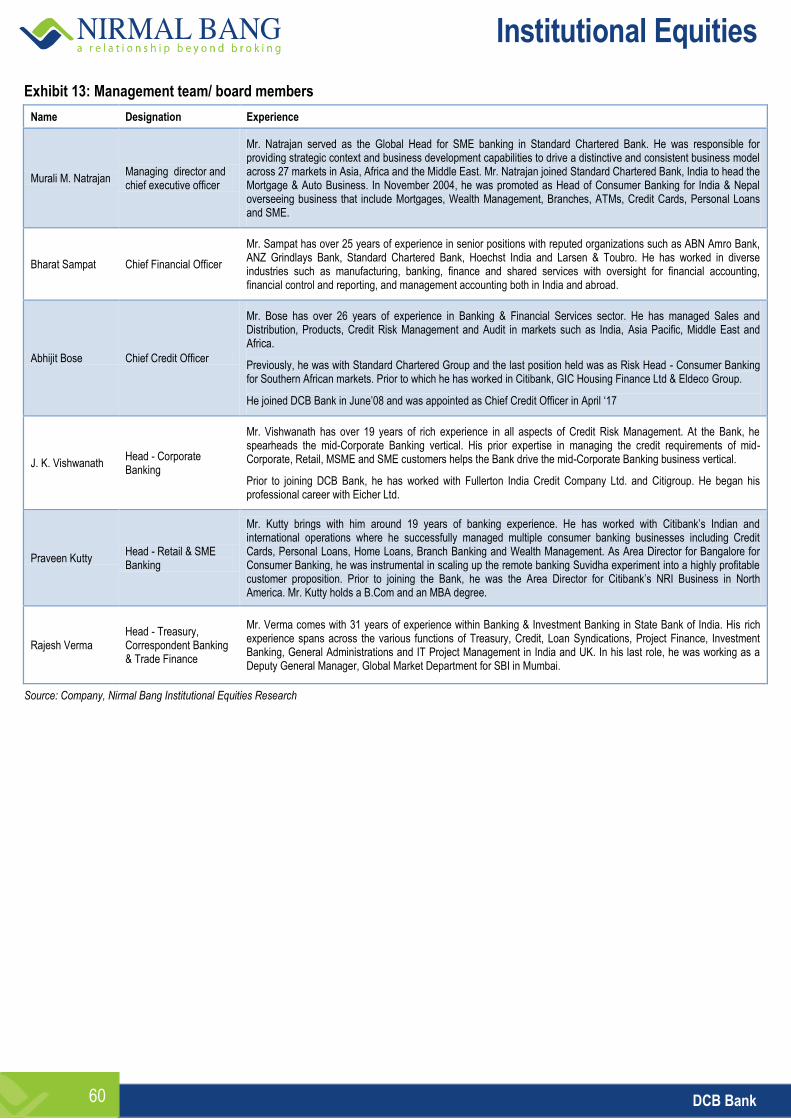
Institutional Equities
DCB Bank 60
Exhibit 13: Management team/ board members
Name Designation Experience
Murali M. Natrajan Managing director and chief executive officer
Mr. Natrajan served as the Global Head for SME banking in Standard Chartered Bank. He was responsible for providing strategic context and business development capabilities to drive a distinctive and consistent business model across 27 markets in Asia, Africa and the Middle East. Mr. Natrajan joined Standard Chartered Bank, India to head the Mortgage & Auto Business. In November 2004, he was promoted as Head of Consumer Banking for India & Nepal overseeing business that include Mortgages, Wealth Management, Branches, ATMs, Credit Cards, Personal Loans and SME.
Bharat Sampat Chief Financial Officer
Mr. Sampat has over 25 years of experience in senior positions with reputed organizations such as ABN Amro Bank, ANZ Grindlays Bank, Standard Chartered Bank, Hoechst India and Larsen & Toubro. He has worked in diverse industries such as manufacturing, banking, finance and shared services with oversight for financial accounting, financial control and reporting, and management accounting both in India and abroad.
Abhijit Bose Chief Credit Officer
Mr. Bose has over 26 years of experience in Banking & Financial Services sector. He has managed Sales and Distribution, Products, Credit Risk Management and Audit in markets such as India, Asia Pacific, Middle East and Africa.
Previously, he was with Standard Chartered Group and the last position held was as Risk Head - Consumer Banking for Southern African markets. Prior to which he has worked in Citibank, GIC Housing Finance Ltd & Eldeco Group.
He joined DCB Bank in June’08 and was appointed as Chief Credit Officer in April ‘17
J. K. Vishwanath Head - Corporate Banking
Mr. Vishwanath has over 19 years of rich experience in all aspects of Credit Risk Management. At the Bank, he spearheads the mid-Corporate Banking vertical. His prior expertise in managing the credit requirements of mid-Corporate, Retail, MSME and SME customers helps the Bank drive the mid-Corporate Banking business vertical.
Prior to joining DCB Bank, he has worked with Fullerton India Credit Company Ltd. and Citigroup. He began his professional career with Eicher Ltd.
Praveen Kutty Head - Retail & SME Banking
Mr. Kutty brings with him around 19 years of banking experience. He has worked with Citibank’s Indian and international operations where he successfully managed multiple consumer banking businesses including Credit Cards, Personal Loans, Home Loans, Branch Banking and Wealth Management. As Area Director for Bangalore for Consumer Banking, he was instrumental in scaling up the remote banking Suvidha experiment into a highly profitable customer proposition. Prior to joining the Bank, he was the Area Director for Citibank’s NRI Business in North America. Mr. Kutty holds a B.Com and an MBA degree.
Rajesh Verma Head - Treasury, Correspondent Banking & Trade Finance
Mr. Verma comes with 31 years of experience within Banking & Investment Banking in State Bank of India. His rich experience spans across the various functions of Treasury, Credit, Loan Syndications, Project Finance, Investment Banking, General Administrations and IT Project Management in India and UK. In his last role, he was working as a Deputy General Manager, Global Market Department for SBI in Mumbai.
Source: Company, Nirmal Bang Institutional Equities Research
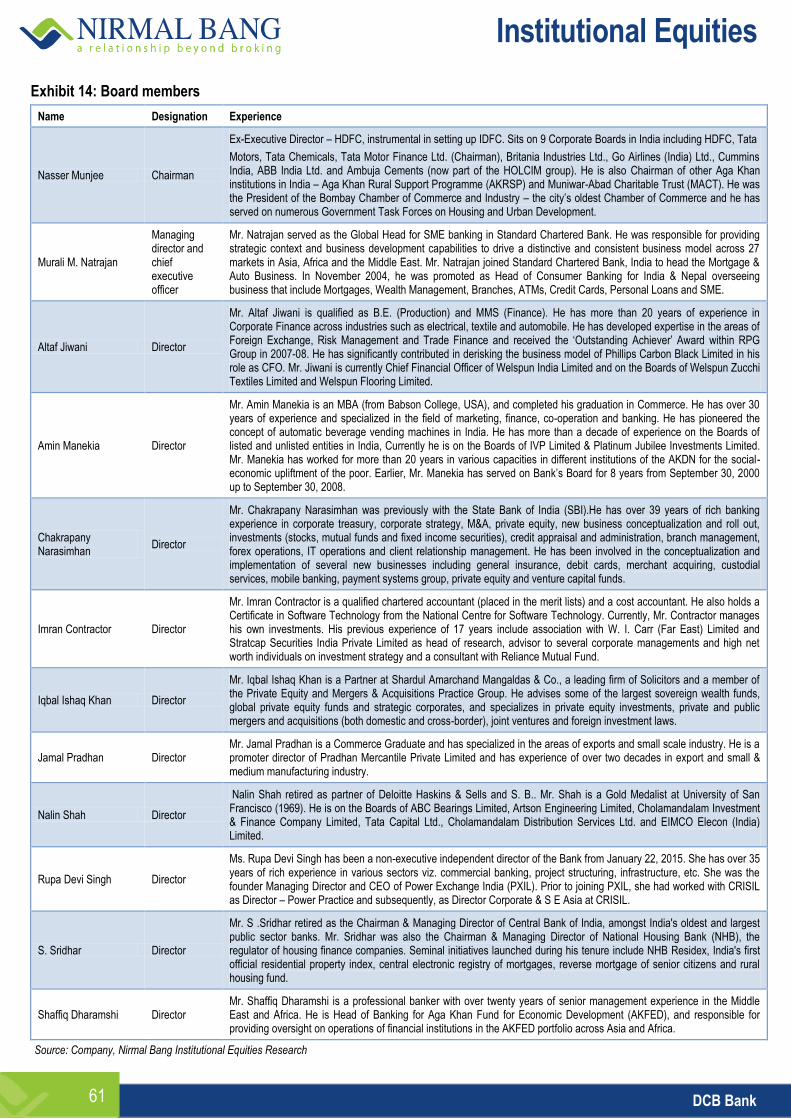
Institutional Equities
DCB Bank 61
Exhibit 14: Board members
Name Designation Experience
Nasser Munjee Chairman
Ex-Executive Director – HDFC, instrumental in setting up IDFC. Sits on 9 Corporate Boards in India including HDFC, Tata
Motors, Tata Chemicals, Tata Motor Finance Ltd. (Chairman), Britania Industries Ltd., Go Airlines (India) Ltd., Cummins India, ABB India Ltd. and Ambuja Cements (now part of the HOLCIM group). He is also Chairman of other Aga Khan institutions in India – Aga Khan Rural Support Programme (AKRSP) and Muniwar-Abad Charitable Trust (MACT). He was the President of the Bombay Chamber of Commerce and Industry – the city’s oldest Chamber of Commerce and he has served on numerous Government Task Forces on Housing and Urban Development.
Murali M. Natrajan
Managing director and chief executive officer
Mr. Natrajan served as the Global Head for SME banking in Standard Chartered Bank. He was responsible for providing strategic context and business development capabilities to drive a distinctive and consistent business model across 27 markets in Asia, Africa and the Middle East. Mr. Natrajan joined Standard Chartered Bank, India to head the Mortgage & Auto Business. In November 2004, he was promoted as Head of Consumer Banking for India & Nepal overseeing business that include Mortgages, Wealth Management, Branches, ATMs, Credit Cards, Personal Loans and SME.
Altaf Jiwani Director
Mr. Altaf Jiwani is qualified as B.E. (Production) and MMS (Finance). He has more than 20 years of experience in Corporate Finance across industries such as electrical, textile and automobile. He has developed expertise in the areas of Foreign Exchange, Risk Management and Trade Finance and received the ‘Outstanding Achiever’ Award within RPG Group in 2007-08. He has significantly contributed in derisking the business model of Phillips Carbon Black Limited in his role as CFO. Mr. Jiwani is currently Chief Financial Officer of Welspun India Limited and on the Boards of Welspun Zucchi Textiles Limited and Welspun Flooring Limited.
Amin Manekia Director
Mr. Amin Manekia is an MBA (from Babson College, USA), and completed his graduation in Commerce. He has over 30 years of experience and specialized in the field of marketing, finance, co-operation and banking. He has pioneered the concept of automatic beverage vending machines in India. He has more than a decade of experience on the Boards of listed and unlisted entities in India, Currently he is on the Boards of IVP Limited & Platinum Jubilee Investments Limited. Mr. Manekia has worked for more than 20 years in various capacities in different institutions of the AKDN for the social-economic upliftment of the poor. Earlier, Mr. Manekia has served on Bank’s Board for 8 years from September 30, 2000 up to September 30, 2008.
Chakrapany Narasimhan
Director
Mr. Chakrapany Narasimhan was previously with the State Bank of India (SBI).He has over 39 years of rich banking experience in corporate treasury, corporate strategy, M&A, private equity, new business conceptualization and roll out, investments (stocks, mutual funds and fixed income securities), credit appraisal and administration, branch management, forex operations, IT operations and client relationship management. He has been involved in the conceptualization and implementation of several new businesses including general insurance, debit cards, merchant acquiring, custodial services, mobile banking, payment systems group, private equity and venture capital funds.
Imran Contractor Director
Mr. Imran Contractor is a qualified chartered accountant (placed in the merit lists) and a cost accountant. He also holds a Certificate in Software Technology from the National Centre for Software Technology. Currently, Mr. Contractor manages his own investments. His previous experience of 17 years include association with W. I. Carr (Far East) Limited and Stratcap Securities India Private Limited as head of research, advisor to several corporate managements and high net worth individuals on investment strategy and a consultant with Reliance Mutual Fund.
Iqbal Ishaq Khan Director
Mr. Iqbal Ishaq Khan is a Partner at Shardul Amarchand Mangaldas & Co., a leading firm of Solicitors and a member of the Private Equity and Mergers & Acquisitions Practice Group. He advises some of the largest sovereign wealth funds, global private equity funds and strategic corporates, and specializes in private equity investments, private and public mergers and acquisitions (both domestic and cross-border), joint ventures and foreign investment laws.
Jamal Pradhan Director Mr. Jamal Pradhan is a Commerce Graduate and has specialized in the areas of exports and small scale industry. He is a promoter director of Pradhan Mercantile Private Limited and has experience of over two decades in export and small & medium manufacturing industry.
Nalin Shah Director
Nalin Shah retired as partner of Deloitte Haskins & Sells and S. B.. Mr. Shah is a Gold Medalist at University of San Francisco (1969). He is on the Boards of ABC Bearings Limited, Artson Engineering Limited, Cholamandalam Investment & Finance Company Limited, Tata Capital Ltd., Cholamandalam Distribution Services Ltd. and EIMCO Elecon (India) Limited.
Rupa Devi Singh Director
Ms. Rupa Devi Singh has been a non-executive independent director of the Bank from January 22, 2015. She has over 35 years of rich experience in various sectors viz. commercial banking, project structuring, infrastructure, etc. She was the founder Managing Director and CEO of Power Exchange India (PXIL). Prior to joining PXIL, she had worked with CRISIL as Director – Power Practice and subsequently, as Director Corporate & S E Asia at CRISIL.
S. Sridhar Director
Mr. S .Sridhar retired as the Chairman & Managing Director of Central Bank of India, amongst India's oldest and largest public sector banks. Mr. Sridhar was also the Chairman & Managing Director of National Housing Bank (NHB), the regulator of housing finance companies. Seminal initiatives launched during his tenure include NHB Residex, India's first official residential property index, central electronic registry of mortgages, reverse mortgage of senior citizens and rural housing fund.
Shaffiq Dharamshi Director Mr. Shaffiq Dharamshi is a professional banker with over twenty years of senior management experience in the Middle East and Africa. He is Head of Banking for Aga Khan Fund for Economic Development (AKFED), and responsible for providing oversight on operations of financial institutions in the AKFED portfolio across Asia and Africa.
Source: Company, Nirmal Bang Institutional Equities Research
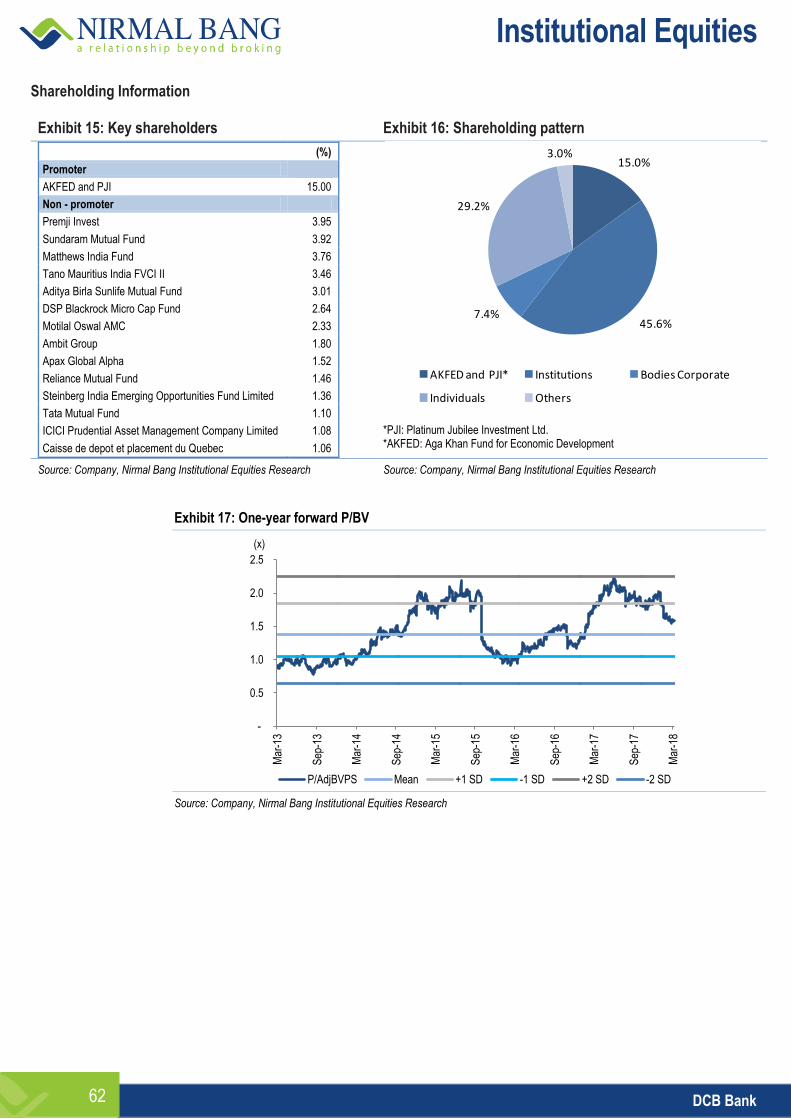
Institutional Equities
DCB Bank 62
Shareholding Information Exhibit 15: Key shareholders Exhibit 16: Shareholding pattern
(%)
Promoter
AKFED and PJI 15.00
Non - promoter
Premji Invest 3.95
Sundaram Mutual Fund 3.92
Matthews India Fund 3.76
Tano Mauritius India FVCI II 3.46
Aditya Birla Sunlife Mutual Fund 3.01
DSP Blackrock Micro Cap Fund 2.64
Motilal Oswal AMC 2.33
Ambit Group 1.80
Apax Global Alpha 1.52
Reliance Mutual Fund 1.46
Steinberg India Emerging Opportunities Fund Limited 1.36
Tata Mutual Fund 1.10
ICICI Prudential Asset Management Company Limited 1.08
Caisse de depot et placement du Quebec 1.06
*PJI: Platinum Jubilee Investment Ltd. *AKFED: Aga Khan Fund for Economic Development
Source: Company, Nirmal Bang Institutional Equities Research Source: Company, Nirmal Bang Institutional Equities Research
Exhibit 17: One-year forward P/BV
Source: Company, Nirmal Bang Institutional Equities Research
15.0%
45.6%7.4%
29.2%
3.0%
AKFED and PJI* Institutions Bodies Corporate
Individuals Others
-
0.5
1.0
1.5
2.0
2.5
Mar
-13
Sep
-13
Mar
-14
Sep
-14
Mar
-15
Sep
-15
Mar
-16
Sep
-16
Mar
-17
Sep
-17
Mar
-18
P/AdjBVPS Mean +1 SD -1 SD +2 SD -2 SD
(x)

Institutional Equities
DCB Bank 63
Financials
Exhibit 18: Income statement
Y/E March (Rsmn) FY16 FY17 FY18E FY19E FY20E
Interest Income 16,985 20,761 24,881 31,073 38,337
Interest expense 10,790 12,791 15,283 18,516 22,910
Net interest income 6,195 7,971 9,597 12,557 15,427
Fees 1,405 1,657 2,046 2,669 3,476
Other Income 799 838 852 1,252 1,494
Net Revenue 8,400 10,465 12,496 16,478 20,396
Operating Expense 4,909 6,283 7,541 9,273 11,149
-Employee Exp 2,451 3,080 3,804 4,379 5,032
-Other Exp 2,458 3,203 3,737 4,894 6,117
Pre-provision Profit 3,490 4,182 4,955 7,205 9,248
Provisions 879 1,115 1,062 1,545 1,929
-Loan Loss Provisions 652 944 1,052 1,532 1,915
-Provisions for investment 36 (1) 10 12 14
-Other Provisions 191 172 - - -
PBT 2,611 3,067 3,892 5,661 7,318
Taxes 666 1,070 1,323 1,925 2,488
PAT 1,945 1,997 2,569 3,736 4,830
Source: Company, Nirmal Bang Institutional Equities Research
Exhibit 20: Balance sheet
Y/E March (Rsmn) FY16 FY17 FY18E FY19E FY20E
Equity Capital 2,844 2,854 3,078 3,078 3,078
Reserves & Surplus 15,077 19,195 25,297 28,662 33,122
Shareholder's Funds 17,922 22,049 28,375 31,740 36,200
Deposits 149,260 192,892 236,391 285,821 347,608
-Current deposits 11,771 15,347 19,148 23,294 28,504
-Saving deposits 23,127 31,545 42,550 57,164 69,522
-Term deposit 114,361 146,000 174,693 205,362 249,583
Borrowings 11,479 12,758 7,079 15,557 25,976
Other liabilities 12,525 12,765 17,043 21,620 26,978
Total liabilities 191,185 240,464 288,888 354,738 436,763
Cash/Equivalent 8,916 11,925 14,829 18,536 23,170
Advances 129,214 158,176 197,720 247,151 308,938
Investments 43,333 58,179 63,521 75,547 90,407
Fixed Assets 2,480 4,886 5,374 5,912 6,503
Other assets 7,242 7,298 7,444 7,593 7,744
Total assets 191,185 240,464 288,888 354,738 436,763
Source: Company, Nirmal Bang Institutional Equities Research
Exhibit 19: Key ratios
Y/E March (Rsmn) FY16 FY17 FY18E FY19E FY20E
Growth (%)
NII growth 21.9 28.7 20.4 30.8 22.9
Pre-provision profit growth 25.8 19.8 18.5 45.4 28.3
PAT growth 1.7 2.6 28.7 45.4 29.3
Business (%)
Deposit growth 18.4 29.2 22.6 20.9 21.6
Advance growth 23.5 22.4 25.0 25.0 25.0
Business growth 20.7 26.1 23.7 22.8 23.2
CD 86.6 82.0 83.6 86.5 88.9
CASA 23.4 24.3 26.1 28.2 28.2
Operating effeciency (%)
Cost-to-income 58.4 60.0 60.3 56.3 54.7
Cost-to-assets 2.8 2.9 2.8 2.9 2.8
Productivity (Rs mn)
Business per branch 1,406.4 1,340.0 1,348.2 1,581.5 1,865.2
Business per employee 65.6 71.2 77.0 90.4 106.6
Profit per branch 9.8 7.6 8.0 11.1 13.7
Profit per employee 0.5 0.4 0.5 0.6 0.8
Spreads (%)
Yield on advances 11.6 11.5 11.3 11.4 11.4
Yield on investments 7.0 7.8 7.0 7.5 7.5
Cost of deposits 7.3 6.9 6.7 6.7 6.7
Yield on assets 10.5 10.6 10.3 10.5 10.5
Cost of funds 7.2 7.0 6.8 6.8 6.8
NIMs 3.8 4.1 4.0 4.3 4.2
Capital adequacy (%)
Tier I 12.8 11.9 12.6 11.8 10.5
Tier II 1.3 1.9 2.9 2.4 2.1
Total CAR 14.1 13.8 15.5 14.2 12.7
Asset Quality (%)
Gross NPA 1.5 1.6 1.8 1.7 1.5
Net NPA 0.8 0.8 1.2 1.2 1.0
Provision coverage 49.1 50.0 30.8 26.8 29.6
Slippage 1.9 1.8 2.0 1.8 1.5
Credit-cost 0.5 0.5 0.5 0.6 0.6
Return (%)
ROE 11.5 10.0 10.2 12.4 14.2
ROA 1.1 0.9 1.0 1.2 1.2
RORWA 1.6 1.3 1.4 1.7 1.7
Per share (Rs)
EPS 6.8 7.0 8.3 12.1 15.7
BV 63.0 77.3 92.2 103.1 117.6
ABV 59.5 72.8 84.2 93.1 107.3
Valuation (x)
P/E 23.9 23.4 19.6 13.5 10.4
P/BV 2.6 2.1 1.8 1.6 1.4
P/ABV 2.8 2.2 1.9 1.8 1.5
Source: Company, Nirmal Bang Institutional Equities Research

Institutional Equities
DCB Bank 64
This page has been intentionally left blank
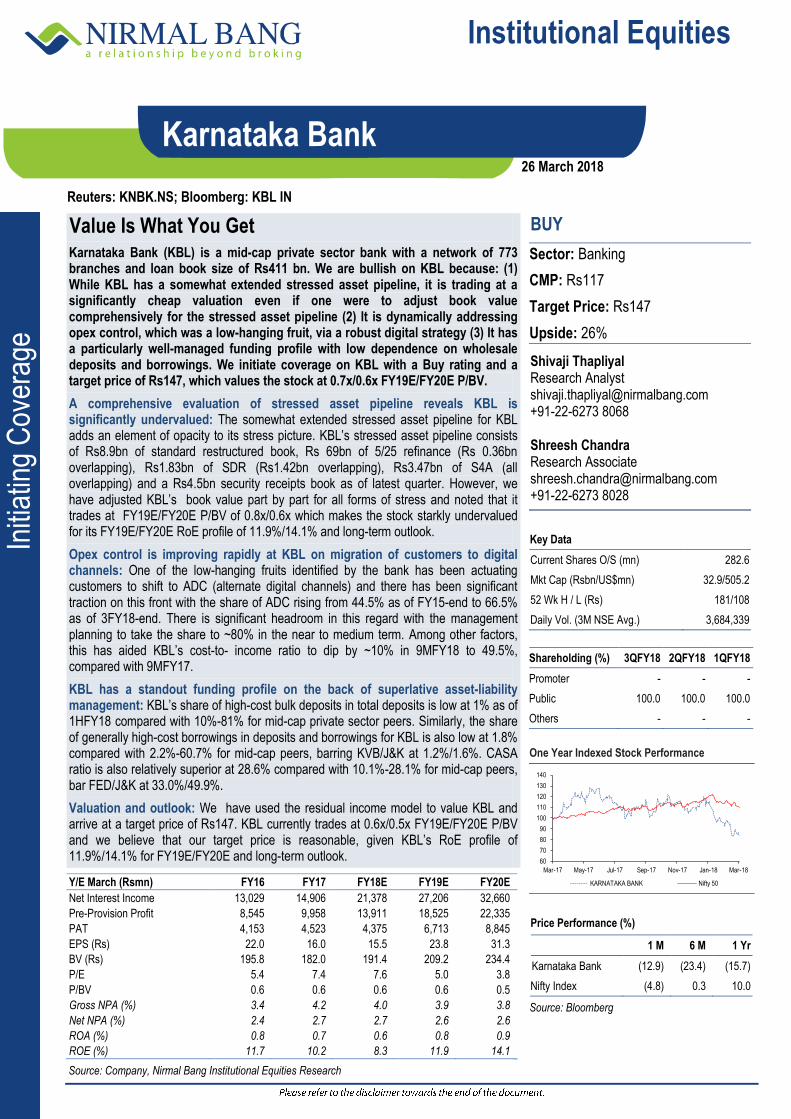
Institutional Equities
Initi
atin
g C
over
age
Reuters: KNBK.NS; Bloomberg: KBL IN
Karnataka Bank
Value Is What You Get Karnataka Bank (KBL) is a mid-cap private sector bank with a network of 773 branches and loan book size of Rs411 bn. We are bullish on KBL because: (1) While KBL has a somewhat extended stressed asset pipeline, it is trading at a significantly cheap valuation even if one were to adjust book value comprehensively for the stressed asset pipeline (2) It is dynamically addressing opex control, which was a low-hanging fruit, via a robust digital strategy (3) It has a particularly well-managed funding profile with low dependence on wholesale deposits and borrowings. We initiate coverage on KBL with a Buy rating and a target price of Rs147, which values the stock at 0.7x/0.6x FY19E/FY20E P/BV.
A comprehensive evaluation of stressed asset pipeline reveals KBL is significantly undervalued: The somewhat extended stressed asset pipeline for KBL adds an element of opacity to its stress picture. KBL’s stressed asset pipeline consists of Rs8.9bn of standard restructured book, Rs 69bn of 5/25 refinance (Rs 0.36bn overlapping), Rs1.83bn of SDR (Rs1.42bn overlapping), Rs3.47bn of S4A (all overlapping) and a Rs4.5bn security receipts book as of latest quarter. However, we have adjusted KBL’s book value part by part for all forms of stress and noted that it trades at FY19E/FY20E P/BV of 0.8x/0.6x which makes the stock starkly undervalued for its FY19E/FY20E RoE profile of 11.9%/14.1% and long-term outlook.
Opex control is improving rapidly at KBL on migration of customers to digital channels: One of the low-hanging fruits identified by the bank has been actuating customers to shift to ADC (alternate digital channels) and there has been significant traction on this front with the share of ADC rising from 44.5% as of FY15-end to 66.5% as of 3FY18-end. There is significant headroom in this regard with the management planning to take the share to ~80% in the near to medium term. Among other factors, this has aided KBL’s cost-to- income ratio to dip by ~10% in 9MFY18 to 49.5%, compared with 9MFY17.
KBL has a standout funding profile on the back of superlative asset-liability management: KBL’s share of high-cost bulk deposits in total deposits is low at 1% as of 1HFY18 compared with 10%-81% for mid-cap private sector peers. Similarly, the share of generally high-cost borrowings in deposits and borrowings for KBL is also low at 1.8% compared with 2.2%-60.7% for mid-cap peers, barring KVB/J&K at 1.2%/1.6%. CASA ratio is also relatively superior at 28.6% compared with 10.1%-28.1% for mid-cap peers, bar FED/J&K at 33.0%/49.9%.
Valuation and outlook: We have used the residual income model to value KBL and arrive at a target price of Rs147. KBL currently trades at 0.6x/0.5x FY19E/FY20E P/BV and we believe that our target price is reasonable, given KBL’s RoE profile of 11.9%/14.1% for FY19E/FY20E and long-term outlook.
BUY
Sector: Banking
CMP: Rs117
Target Price: Rs147
Upside: 26%
Shivaji Thapliyal Research Analyst [email protected] +91-22-6273 8068 Shreesh Chandra Research Associate [email protected] +91-22-6273 8028
Key Data
Current Shares O/S (mn) 282.6
Mkt Cap (Rsbn/US$mn) 32.9/505.2
52 Wk H / L (Rs) 181/108
Daily Vol. (3M NSE Avg.) 3,684,339
Shareholding (%) 3QFY18 2QFY18 1QFY18
Promoter - - -
Public 100.0 100.0 100.0
Others - - -
One Year Indexed Stock Performance
Price Performance (%)
1 M 6 M 1 Yr
Karnataka Bank (12.9) (23.4) (15.7)
Nifty Index (4.8) 0.3 10.0
Source: Bloomberg
Y/E March (Rsmn) FY16 FY17 FY18E FY19E FY20E
Net Interest Income 13,029 14,906 21,378 27,206 32,660
Pre-Provision Profit 8,545 9,958 13,911 18,525 22,335
PAT 4,153 4,523 4,375 6,713 8,845
EPS (Rs) 22.0 16.0 15.5 23.8 31.3
BV (Rs) 195.8 182.0 191.4 209.2 234.4
P/E 5.4 7.4 7.6 5.0 3.8
P/BV 0.6 0.6 0.6 0.6 0.5
Gross NPA (%) 3.4 4.2 4.0 3.9 3.8
Net NPA (%) 2.4 2.7 2.7 2.6 2.6
ROA (%) 0.8 0.7 0.6 0.8 0.9
ROE (%) 11.7 10.2 8.3 11.9 14.1
Source: Company, Nirmal Bang Institutional Equities Research
60
70
80
90
100
110
120
130
140
Mar-17 May-17 Jul-17 Sep-17 Nov-17 Jan-18 Mar-18
KARNATAKA BANK Nifty 50
26 March 2018
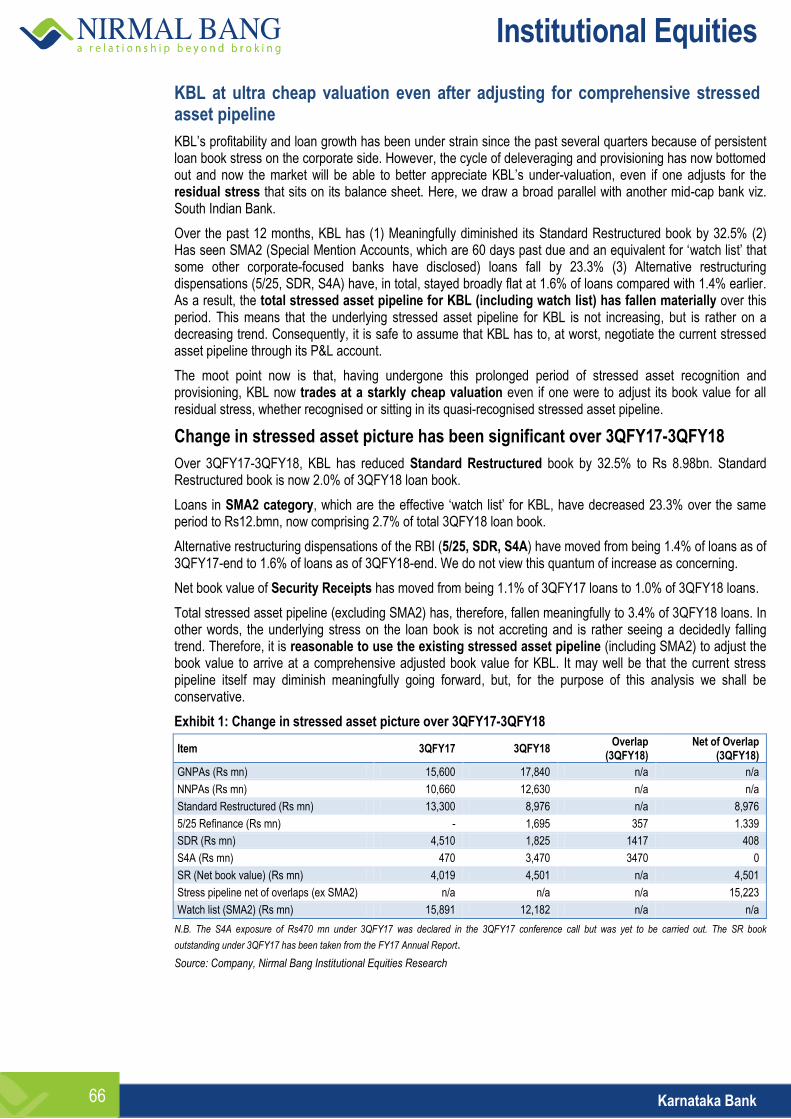
Institutional Equities
Karnataka Bank 66
KBL at ultra cheap valuation even after adjusting for comprehensive stressed asset pipeline
KBL’s profitability and loan growth has been under strain since the past several quarters because of persistent loan book stress on the corporate side. However, the cycle of deleveraging and provisioning has now bottomed out and now the market will be able to better appreciate KBL’s under-valuation, even if one adjusts for the residual stress that sits on its balance sheet. Here, we draw a broad parallel with another mid-cap bank viz. South Indian Bank.
Over the past 12 months, KBL has (1) Meaningfully diminished its Standard Restructured book by 32.5% (2) Has seen SMA2 (Special Mention Accounts, which are 60 days past due and an equivalent for ‘watch list’ that some other corporate-focused banks have disclosed) loans fall by 23.3% (3) Alternative restructuring dispensations (5/25, SDR, S4A) have, in total, stayed broadly flat at 1.6% of loans compared with 1.4% earlier. As a result, the total stressed asset pipeline for KBL (including watch list) has fallen materially over this period. This means that the underlying stressed asset pipeline for KBL is not increasing, but is rather on a decreasing trend. Consequently, it is safe to assume that KBL has to, at worst, negotiate the current stressed asset pipeline through its P&L account.
The moot point now is that, having undergone this prolonged period of stressed asset recognition and provisioning, KBL now trades at a starkly cheap valuation even if one were to adjust its book value for all residual stress, whether recognised or sitting in its quasi-recognised stressed asset pipeline.
Change in stressed asset picture has been significant over 3QFY17-3QFY18
Over 3QFY17-3QFY18, KBL has reduced Standard Restructured book by 32.5% to Rs 8.98bn. Standard Restructured book is now 2.0% of 3QFY18 loan book.
Loans in SMA2 category, which are the effective ‘watch list’ for KBL, have decreased 23.3% over the same period to Rs12.bmn, now comprising 2.7% of total 3QFY18 loan book.
Alternative restructuring dispensations of the RBI (5/25, SDR, S4A) have moved from being 1.4% of loans as of 3QFY17-end to 1.6% of loans as of 3QFY18-end. We do not view this quantum of increase as concerning.
Net book value of Security Receipts has moved from being 1.1% of 3QFY17 loans to 1.0% of 3QFY18 loans.
Total stressed asset pipeline (excluding SMA2) has, therefore, fallen meaningfully to 3.4% of 3QFY18 loans. In other words, the underlying stress on the loan book is not accreting and is rather seeing a decidedly falling trend. Therefore, it is reasonable to use the existing stressed asset pipeline (including SMA2) to adjust the book value to arrive at a comprehensive adjusted book value for KBL. It may well be that the current stress pipeline itself may diminish meaningfully going forward, but, for the purpose of this analysis we shall be conservative.
Exhibit 1: Change in stressed asset picture over 3QFY17-3QFY18
Item 3QFY17 3QFY18 Overlap
(3QFY18) Net of Overlap
(3QFY18)
GNPAs (Rs mn) 15,600 17,840 n/a n/a
NNPAs (Rs mn) 10,660 12,630 n/a n/a
Standard Restructured (Rs mn) 13,300 8,976 n/a 8,976
5/25 Refinance (Rs mn) - 1,695 357 1.339
SDR (Rs mn) 4,510 1,825 1417 408
S4A (Rs mn) 470 3,470 3470 0
SR (Net book value) (Rs mn) 4,019 4,501 n/a 4,501
Stress pipeline net of overlaps (ex SMA2) n/a n/a n/a 15,223
Watch list (SMA2) (Rs mn) 15,891 12,182 n/a n/a
N.B. The S4A exposure of Rs470 mn under 3QFY17 was declared in the 3QFY17 conference call but was yet to be carried out. The SR book
outstanding under 3QFY17 has been taken from the FY17 Annual Report.
Source: Company, Nirmal Bang Institutional Equities Research
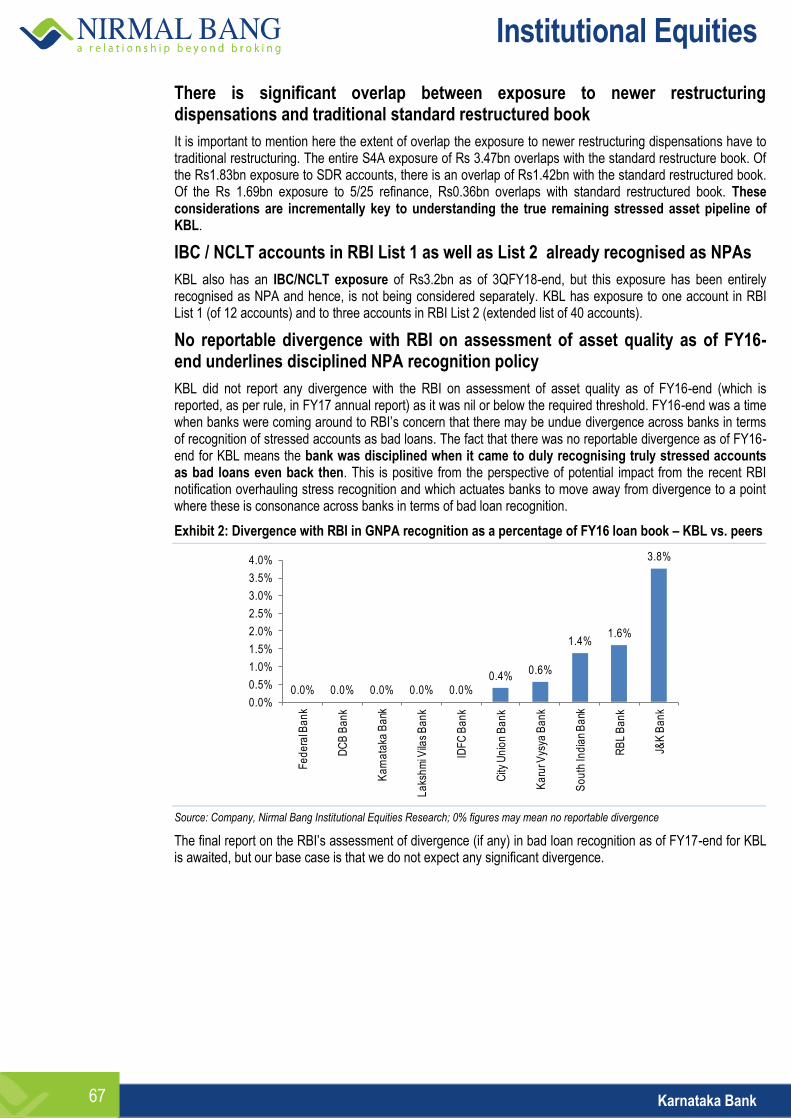
Institutional Equities
Karnataka Bank 67
There is significant overlap between exposure to newer restructuring dispensations and traditional standard restructured book
It is important to mention here the extent of overlap the exposure to newer restructuring dispensations have to traditional restructuring. The entire S4A exposure of Rs 3.47bn overlaps with the standard restructure book. Of the Rs1.83bn exposure to SDR accounts, there is an overlap of Rs1.42bn with the standard restructured book. Of the Rs 1.69bn exposure to 5/25 refinance, Rs0.36bn overlaps with standard restructured book. These considerations are incrementally key to understanding the true remaining stressed asset pipeline of KBL.
IBC / NCLT accounts in RBI List 1 as well as List 2 already recognised as NPAs
KBL also has an IBC/NCLT exposure of Rs3.2bn as of 3QFY18-end, but this exposure has been entirely recognised as NPA and hence, is not being considered separately. KBL has exposure to one account in RBI List 1 (of 12 accounts) and to three accounts in RBI List 2 (extended list of 40 accounts).
No reportable divergence with RBI on assessment of asset quality as of FY16-end underlines disciplined NPA recognition policy
KBL did not report any divergence with the RBI on assessment of asset quality as of FY16-end (which is reported, as per rule, in FY17 annual report) as it was nil or below the required threshold. FY16-end was a time when banks were coming around to RBI’s concern that there may be undue divergence across banks in terms of recognition of stressed accounts as bad loans. The fact that there was no reportable divergence as of FY16-end for KBL means the bank was disciplined when it came to duly recognising truly stressed accounts as bad loans even back then. This is positive from the perspective of potential impact from the recent RBI notification overhauling stress recognition and which actuates banks to move away from divergence to a point where these is consonance across banks in terms of bad loan recognition.
Exhibit 2: Divergence with RBI in GNPA recognition as a percentage of FY16 loan book – KBL vs. peers
Source: Company, Nirmal Bang Institutional Equities Research; 0% figures may mean no reportable divergence
The final report on the RBI’s assessment of divergence (if any) in bad loan recognition as of FY17-end for KBL is awaited, but our base case is that we do not expect any significant divergence.
0.0% 0.0% 0.0% 0.0% 0.0%0.4%
0.6%
1.4%1.6%
3.8%
0.0%
0.5%
1.0%
1.5%
2.0%
2.5%
3.0%
3.5%
4.0%
Fe
de
ral B
an
k
DC
B B
an
k
Ka
rna
taka
Ba
nk
La
ksh
mi V
ilas
Ba
nk
IDF
C B
an
k
City
Un
ion
Ba
nk
Ka
rur V
ysya
Ba
nk
So
uth
Ind
ian
Ba
nk
RB
L B
an
k
J&K
Ba
nk
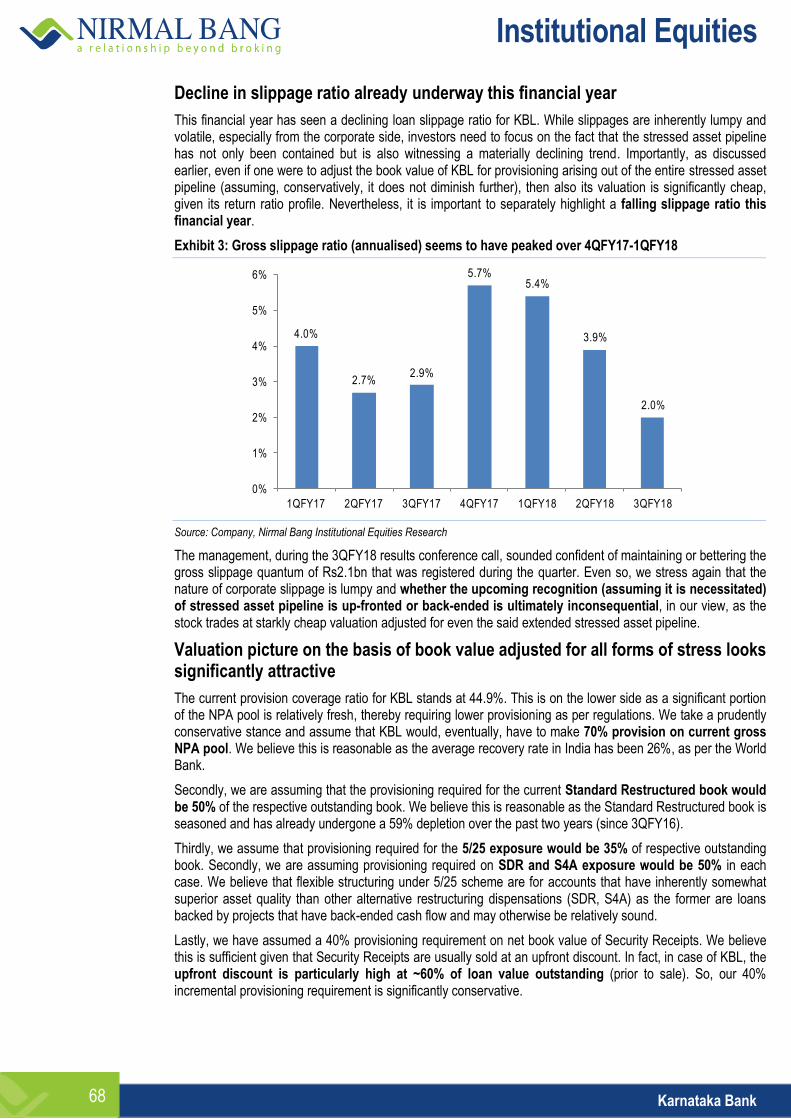
Institutional Equities
Karnataka Bank 68
Decline in slippage ratio already underway this financial year
This financial year has seen a declining loan slippage ratio for KBL. While slippages are inherently lumpy and volatile, especially from the corporate side, investors need to focus on the fact that the stressed asset pipeline has not only been contained but is also witnessing a materially declining trend. Importantly, as discussed earlier, even if one were to adjust the book value of KBL for provisioning arising out of the entire stressed asset pipeline (assuming, conservatively, it does not diminish further), then also its valuation is significantly cheap, given its return ratio profile. Nevertheless, it is important to separately highlight a falling slippage ratio this financial year.
Exhibit 3: Gross slippage ratio (annualised) seems to have peaked over 4QFY17-1QFY18
Source: Company, Nirmal Bang Institutional Equities Research
The management, during the 3QFY18 results conference call, sounded confident of maintaining or bettering the gross slippage quantum of Rs2.1bn that was registered during the quarter. Even so, we stress again that the nature of corporate slippage is lumpy and whether the upcoming recognition (assuming it is necessitated) of stressed asset pipeline is up-fronted or back-ended is ultimately inconsequential, in our view, as the stock trades at starkly cheap valuation adjusted for even the said extended stressed asset pipeline.
Valuation picture on the basis of book value adjusted for all forms of stress looks significantly attractive
The current provision coverage ratio for KBL stands at 44.9%. This is on the lower side as a significant portion of the NPA pool is relatively fresh, thereby requiring lower provisioning as per regulations. We take a prudently conservative stance and assume that KBL would, eventually, have to make 70% provision on current gross NPA pool. We believe this is reasonable as the average recovery rate in India has been 26%, as per the World Bank.
Secondly, we are assuming that the provisioning required for the current Standard Restructured book would be 50% of the respective outstanding book. We believe this is reasonable as the Standard Restructured book is seasoned and has already undergone a 59% depletion over the past two years (since 3QFY16).
Thirdly, we assume that provisioning required for the 5/25 exposure would be 35% of respective outstanding book. Secondly, we are assuming provisioning required on SDR and S4A exposure would be 50% in each case. We believe that flexible structuring under 5/25 scheme are for accounts that have inherently somewhat superior asset quality than other alternative restructuring dispensations (SDR, S4A) as the former are loans backed by projects that have back-ended cash flow and may otherwise be relatively sound.
Lastly, we have assumed a 40% provisioning requirement on net book value of Security Receipts. We believe this is sufficient given that Security Receipts are usually sold at an upfront discount. In fact, in case of KBL, the upfront discount is particularly high at ~60% of loan value outstanding (prior to sale). So, our 40% incremental provisioning requirement is significantly conservative.
4.0%
2.7%2.9%
5.7%5.4%
3.9%
2.0%
0%
1%
2%
3%
4%
5%
6%
1QFY17 2QFY17 3QFY17 4QFY17 1QFY18 2QFY18 3QFY18
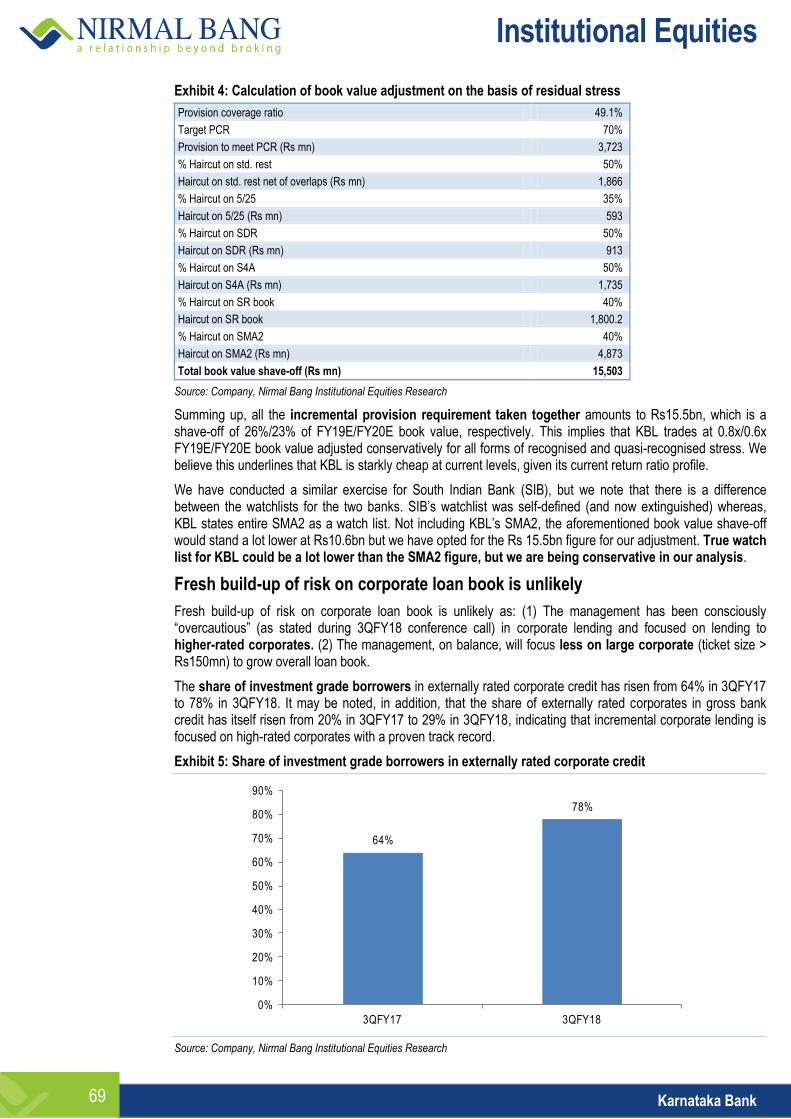
Institutional Equities
Karnataka Bank 69
Exhibit 4: Calculation of book value adjustment on the basis of residual stress
Provision coverage ratio 49.1%
Target PCR 70%
Provision to meet PCR (Rs mn) 3,723
% Haircut on std. rest 50%
Haircut on std. rest net of overlaps (Rs mn) 1,866
% Haircut on 5/25 35%
Haircut on 5/25 (Rs mn) 593
% Haircut on SDR 50%
Haircut on SDR (Rs mn) 913
% Haircut on S4A 50%
Haircut on S4A (Rs mn) 1,735
% Haircut on SR book 40%
Haircut on SR book 1,800.2
% Haircut on SMA2 40%
Haircut on SMA2 (Rs mn) 4,873
Total book value shave-off (Rs mn) 15,503
Source: Company, Nirmal Bang Institutional Equities Research
Summing up, all the incremental provision requirement taken together amounts to Rs15.5bn, which is a shave-off of 26%/23% of FY19E/FY20E book value, respectively. This implies that KBL trades at 0.8x/0.6x FY19E/FY20E book value adjusted conservatively for all forms of recognised and quasi-recognised stress. We believe this underlines that KBL is starkly cheap at current levels, given its current return ratio profile.
We have conducted a similar exercise for South Indian Bank (SIB), but we note that there is a difference between the watchlists for the two banks. SIB’s watchlist was self-defined (and now extinguished) whereas, KBL states entire SMA2 as a watch list. Not including KBL’s SMA2, the aforementioned book value shave-off would stand a lot lower at Rs10.6bn but we have opted for the Rs 15.5bn figure for our adjustment. True watch list for KBL could be a lot lower than the SMA2 figure, but we are being conservative in our analysis.
Fresh build-up of risk on corporate loan book is unlikely
Fresh build-up of risk on corporate loan book is unlikely as: (1) The management has been consciously “overcautious” (as stated during 3QFY18 conference call) in corporate lending and focused on lending to higher-rated corporates. (2) The management, on balance, will focus less on large corporate (ticket size > Rs150mn) to grow overall loan book.
The share of investment grade borrowers in externally rated corporate credit has risen from 64% in 3QFY17 to 78% in 3QFY18. It may be noted, in addition, that the share of externally rated corporates in gross bank credit has itself risen from 20% in 3QFY17 to 29% in 3QFY18, indicating that incremental corporate lending is focused on high-rated corporates with a proven track record.
Exhibit 5: Share of investment grade borrowers in externally rated corporate credit
Source: Company, Nirmal Bang Institutional Equities Research
64%
78%
0%
10%
20%
30%
40%
50%
60%
70%
80%
90%
3QFY17 3QFY18
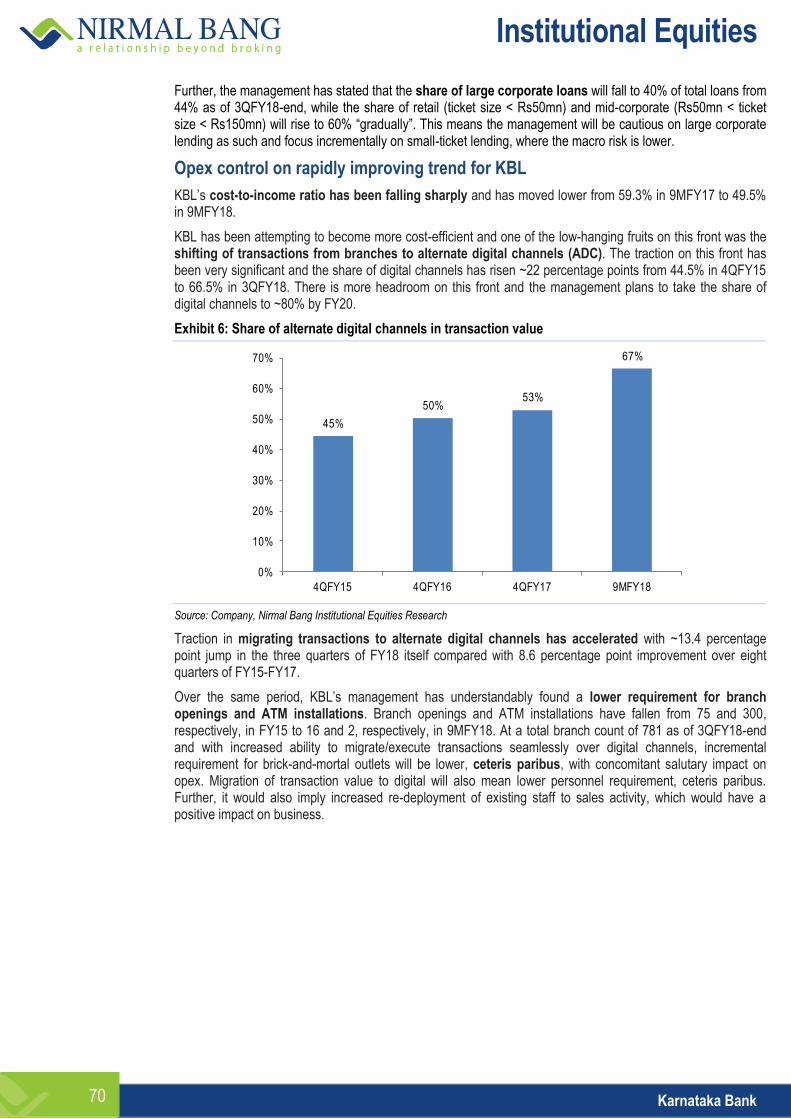
Institutional Equities
Karnataka Bank 70
Further, the management has stated that the share of large corporate loans will fall to 40% of total loans from 44% as of 3QFY18-end, while the share of retail (ticket size < Rs50mn) and mid-corporate (Rs50mn < ticket size < Rs150mn) will rise to 60% “gradually”. This means the management will be cautious on large corporate lending as such and focus incrementally on small-ticket lending, where the macro risk is lower.
Opex control on rapidly improving trend for KBL
KBL’s cost-to-income ratio has been falling sharply and has moved lower from 59.3% in 9MFY17 to 49.5% in 9MFY18.
KBL has been attempting to become more cost-efficient and one of the low-hanging fruits on this front was the shifting of transactions from branches to alternate digital channels (ADC). The traction on this front has been very significant and the share of digital channels has risen ~22 percentage points from 44.5% in 4QFY15 to 66.5% in 3QFY18. There is more headroom on this front and the management plans to take the share of digital channels to ~80% by FY20.
Exhibit 6: Share of alternate digital channels in transaction value
Source: Company, Nirmal Bang Institutional Equities Research
Traction in migrating transactions to alternate digital channels has accelerated with ~13.4 percentage point jump in the three quarters of FY18 itself compared with 8.6 percentage point improvement over eight quarters of FY15-FY17.
Over the same period, KBL’s management has understandably found a lower requirement for branch openings and ATM installations. Branch openings and ATM installations have fallen from 75 and 300, respectively, in FY15 to 16 and 2, respectively, in 9MFY18. At a total branch count of 781 as of 3QFY18-end and with increased ability to migrate/execute transactions seamlessly over digital channels, incremental requirement for brick-and-mortal outlets will be lower, ceteris paribus, with concomitant salutary impact on opex. Migration of transaction value to digital will also mean lower personnel requirement, ceteris paribus. Further, it would also imply increased re-deployment of existing staff to sales activity, which would have a positive impact on business.
45%
50%53%
67%
0%
10%
20%
30%
40%
50%
60%
70%
4QFY15 4QFY16 4QFY17 9MFY18
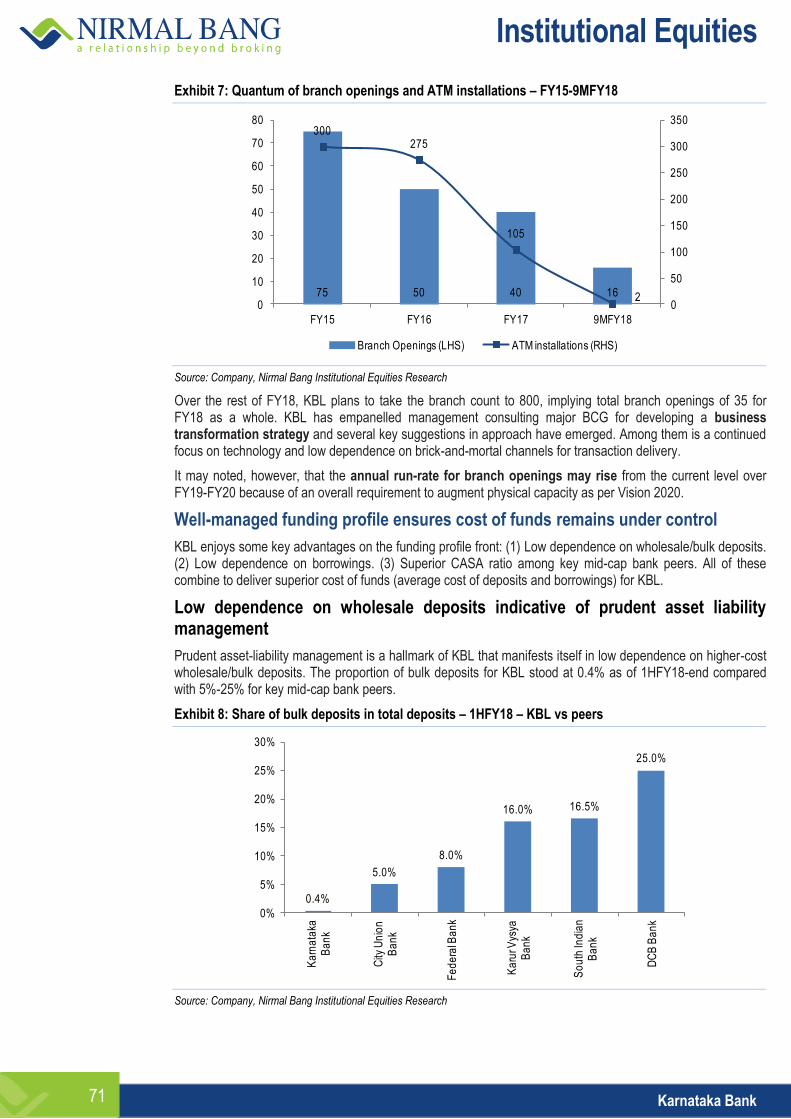
Institutional Equities
Karnataka Bank 71
Exhibit 7: Quantum of branch openings and ATM installations – FY15-9MFY18
Source: Company, Nirmal Bang Institutional Equities Research
Over the rest of FY18, KBL plans to take the branch count to 800, implying total branch openings of 35 for FY18 as a whole. KBL has empanelled management consulting major BCG for developing a business transformation strategy and several key suggestions in approach have emerged. Among them is a continued focus on technology and low dependence on brick-and-mortal channels for transaction delivery.
It may noted, however, that the annual run-rate for branch openings may rise from the current level over FY19-FY20 because of an overall requirement to augment physical capacity as per Vision 2020.
Well-managed funding profile ensures cost of funds remains under control
KBL enjoys some key advantages on the funding profile front: (1) Low dependence on wholesale/bulk deposits. (2) Low dependence on borrowings. (3) Superior CASA ratio among key mid-cap bank peers. All of these combine to deliver superior cost of funds (average cost of deposits and borrowings) for KBL.
Low dependence on wholesale deposits indicative of prudent asset liability management
Prudent asset-liability management is a hallmark of KBL that manifests itself in low dependence on higher-cost wholesale/bulk deposits. The proportion of bulk deposits for KBL stood at 0.4% as of 1HFY18-end compared with 5%-25% for key mid-cap bank peers.
Exhibit 8: Share of bulk deposits in total deposits – 1HFY18 – KBL vs peers
Source: Company, Nirmal Bang Institutional Equities Research
75 50 40 16
300275
105
20
50
100
150
200
250
300
350
0
10
20
30
40
50
60
70
80
FY15 FY16 FY17 9MFY18
Branch Openings (LHS) ATM installations (RHS)
0.4%
5.0%
8.0%
16.0% 16.5%
25.0%
0%
5%
10%
15%
20%
25%
30%
Ka
rna
taka
B
an
k
City
Un
ion
B
an
k
Fe
de
ral B
an
k
Ka
rur V
ysya
B
an
k
So
uth
Ind
ian
Ba
nk
DC
B B
an
k
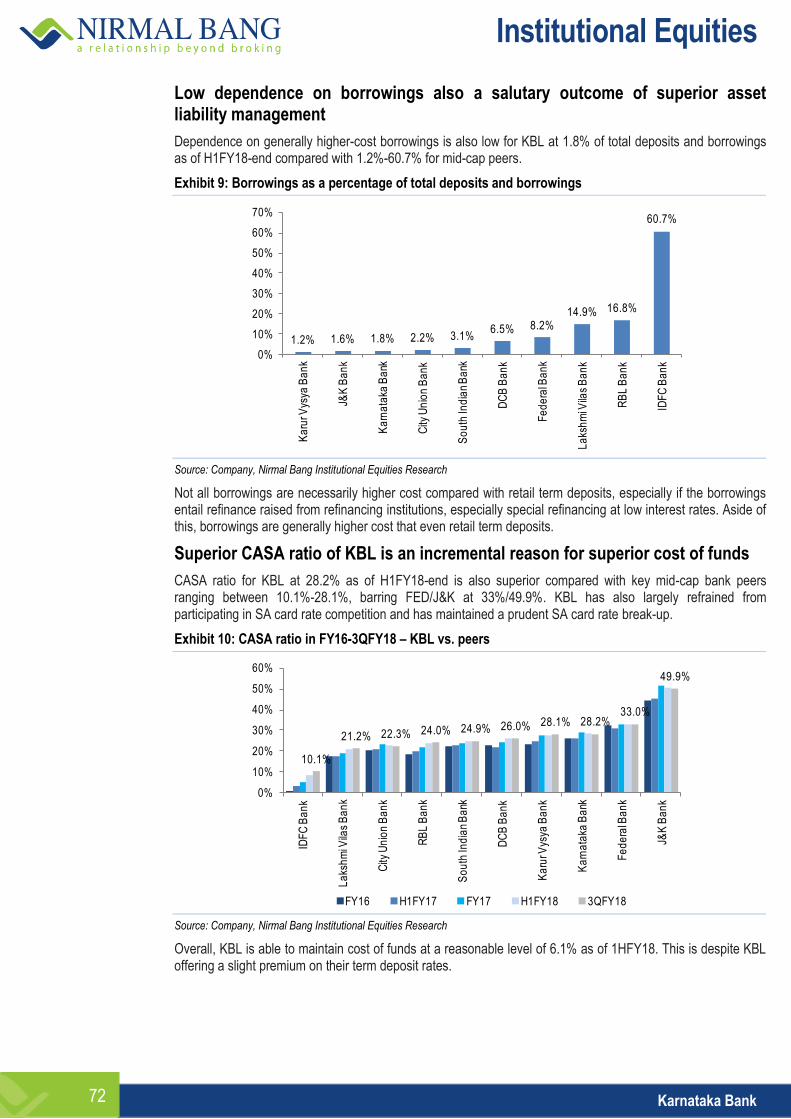
Institutional Equities
Karnataka Bank 72
Low dependence on borrowings also a salutary outcome of superior asset liability management
Dependence on generally higher-cost borrowings is also low for KBL at 1.8% of total deposits and borrowings as of H1FY18-end compared with 1.2%-60.7% for mid-cap peers.
Exhibit 9: Borrowings as a percentage of total deposits and borrowings
Source: Company, Nirmal Bang Institutional Equities Research
Not all borrowings are necessarily higher cost compared with retail term deposits, especially if the borrowings entail refinance raised from refinancing institutions, especially special refinancing at low interest rates. Aside of this, borrowings are generally higher cost that even retail term deposits.
Superior CASA ratio of KBL is an incremental reason for superior cost of funds
CASA ratio for KBL at 28.2% as of H1FY18-end is also superior compared with key mid-cap bank peers ranging between 10.1%-28.1%, barring FED/J&K at 33%/49.9%. KBL has also largely refrained from participating in SA card rate competition and has maintained a prudent SA card rate break-up.
Exhibit 10: CASA ratio in FY16-3QFY18 – KBL vs. peers
Source: Company, Nirmal Bang Institutional Equities Research
Overall, KBL is able to maintain cost of funds at a reasonable level of 6.1% as of 1HFY18. This is despite KBL offering a slight premium on their term deposit rates.
1.2% 1.6% 1.8% 2.2% 3.1%6.5% 8.2%
14.9% 16.8%
60.7%
0%
10%
20%
30%
40%
50%
60%
70%
Ka
rur V
ysya
Ba
nk
J&K
Ba
nk
Ka
rna
taka
Ba
nk
City
Un
ion
Ba
nk
So
uth
Ind
ian
Ba
nk
DC
B B
an
k
Fe
de
ral B
an
k
La
ksh
mi V
ilas
Ba
nk
RB
L B
an
k
IDF
C B
an
k
10.1%
21.2% 22.3% 24.0% 24.9% 26.0% 28.1% 28.2%33.0%
49.9%
0%
10%
20%
30%
40%
50%
60%
IDF
C B
an
k
La
ksh
mi V
ilas
Ba
nk
City
Un
ion
Ba
nk
RB
L B
an
k
So
uth
Ind
ian
Ba
nk
DC
B B
an
k
Ka
rur V
ysya
Ba
nk
Ka
rna
taka
Ba
nk
Fe
de
ral B
an
k
J&K
Ba
nk
FY16 H1FY17 FY17 H1FY18 3QFY18
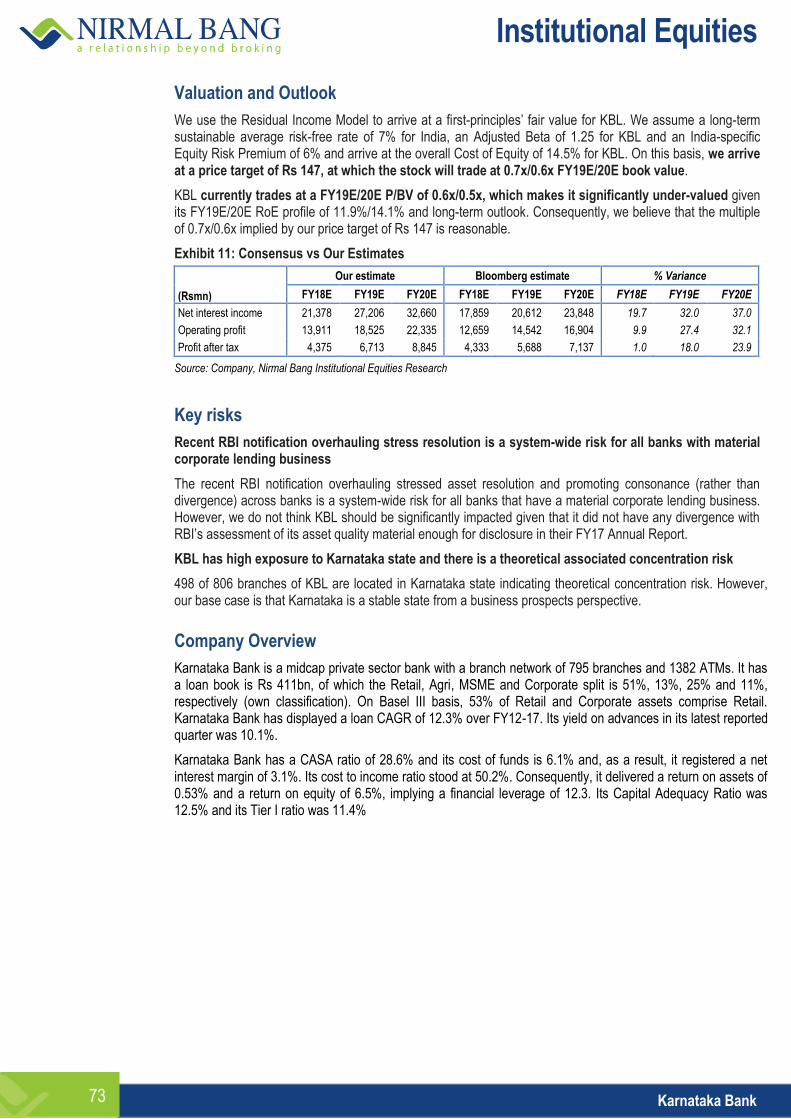
Institutional Equities
Karnataka Bank 73
Valuation and Outlook
We use the Residual Income Model to arrive at a first-principles’ fair value for KBL. We assume a long-term sustainable average risk-free rate of 7% for India, an Adjusted Beta of 1.25 for KBL and an India-specific Equity Risk Premium of 6% and arrive at the overall Cost of Equity of 14.5% for KBL. On this basis, we arrive at a price target of Rs 147, at which the stock will trade at 0.7x/0.6x FY19E/20E book value.
KBL currently trades at a FY19E/20E P/BV of 0.6x/0.5x, which makes it significantly under-valued given its FY19E/20E RoE profile of 11.9%/14.1% and long-term outlook. Consequently, we believe that the multiple of 0.7x/0.6x implied by our price target of Rs 147 is reasonable.
Exhibit 11: Consensus vs Our Estimates
Our estimate Bloomberg estimate % Variance
(Rsmn) FY18E FY19E FY20E FY18E FY19E FY20E FY18E FY19E FY20E
Net interest income 21,378 27,206 32,660 17,859 20,612 23,848 19.7 32.0 37.0
Operating profit 13,911 18,525 22,335 12,659 14,542 16,904 9.9 27.4 32.1
Profit after tax 4,375 6,713 8,845 4,333 5,688 7,137 1.0 18.0 23.9
Source: Company, Nirmal Bang Institutional Equities Research
Key risks
Recent RBI notification overhauling stress resolution is a system-wide risk for all banks with material corporate lending business
The recent RBI notification overhauling stressed asset resolution and promoting consonance (rather than divergence) across banks is a system-wide risk for all banks that have a material corporate lending business. However, we do not think KBL should be significantly impacted given that it did not have any divergence with RBI’s assessment of its asset quality material enough for disclosure in their FY17 Annual Report.
KBL has high exposure to Karnataka state and there is a theoretical associated concentration risk
498 of 806 branches of KBL are located in Karnataka state indicating theoretical concentration risk. However, our base case is that Karnataka is a stable state from a business prospects perspective.
Company Overview
Karnataka Bank is a midcap private sector bank with a branch network of 795 branches and 1382 ATMs. It has a loan book is Rs 411bn, of which the Retail, Agri, MSME and Corporate split is 51%, 13%, 25% and 11%, respectively (own classification). On Basel III basis, 53% of Retail and Corporate assets comprise Retail. Karnataka Bank has displayed a loan CAGR of 12.3% over FY12-17. Its yield on advances in its latest reported quarter was 10.1%.
Karnataka Bank has a CASA ratio of 28.6% and its cost of funds is 6.1% and, as a result, it registered a net interest margin of 3.1%. Its cost to income ratio stood at 50.2%. Consequently, it delivered a return on assets of 0.53% and a return on equity of 6.5%, implying a financial leverage of 12.3. Its Capital Adequacy Ratio was 12.5% and its Tier I ratio was 11.4%
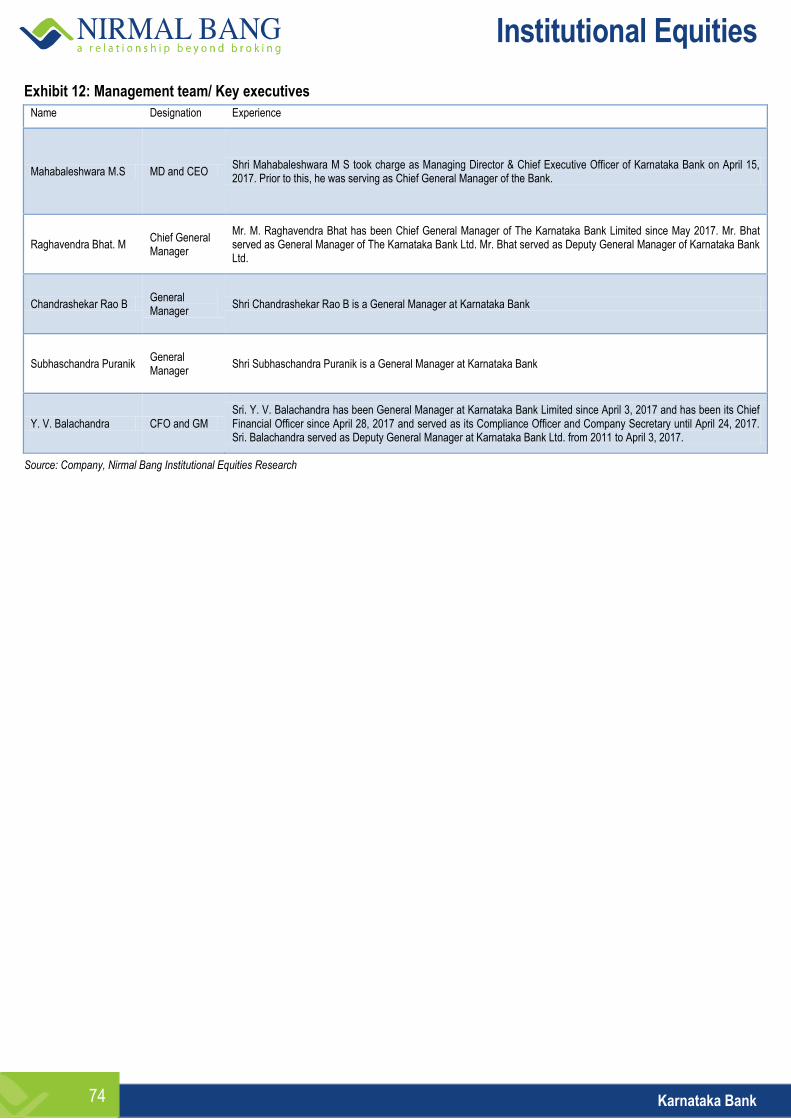
Institutional Equities
Karnataka Bank 74
Exhibit 12: Management team/ Key executives Name Designation Experience
Mahabaleshwara M.S MD and CEO Shri Mahabaleshwara M S took charge as Managing Director & Chief Executive Officer of Karnataka Bank on April 15, 2017. Prior to this, he was serving as Chief General Manager of the Bank.
Raghavendra Bhat. M Chief General Manager
Mr. M. Raghavendra Bhat has been Chief General Manager of The Karnataka Bank Limited since May 2017. Mr. Bhat served as General Manager of The Karnataka Bank Ltd. Mr. Bhat served as Deputy General Manager of Karnataka Bank Ltd.
Chandrashekar Rao B General Manager
Shri Chandrashekar Rao B is a General Manager at Karnataka Bank
Subhaschandra Puranik General Manager
Shri Subhaschandra Puranik is a General Manager at Karnataka Bank
Y. V. Balachandra CFO and GM Sri. Y. V. Balachandra has been General Manager at Karnataka Bank Limited since April 3, 2017 and has been its Chief Financial Officer since April 28, 2017 and served as its Compliance Officer and Company Secretary until April 24, 2017. Sri. Balachandra served as Deputy General Manager at Karnataka Bank Ltd. from 2011 to April 3, 2017.
Source: Company, Nirmal Bang Institutional Equities Research
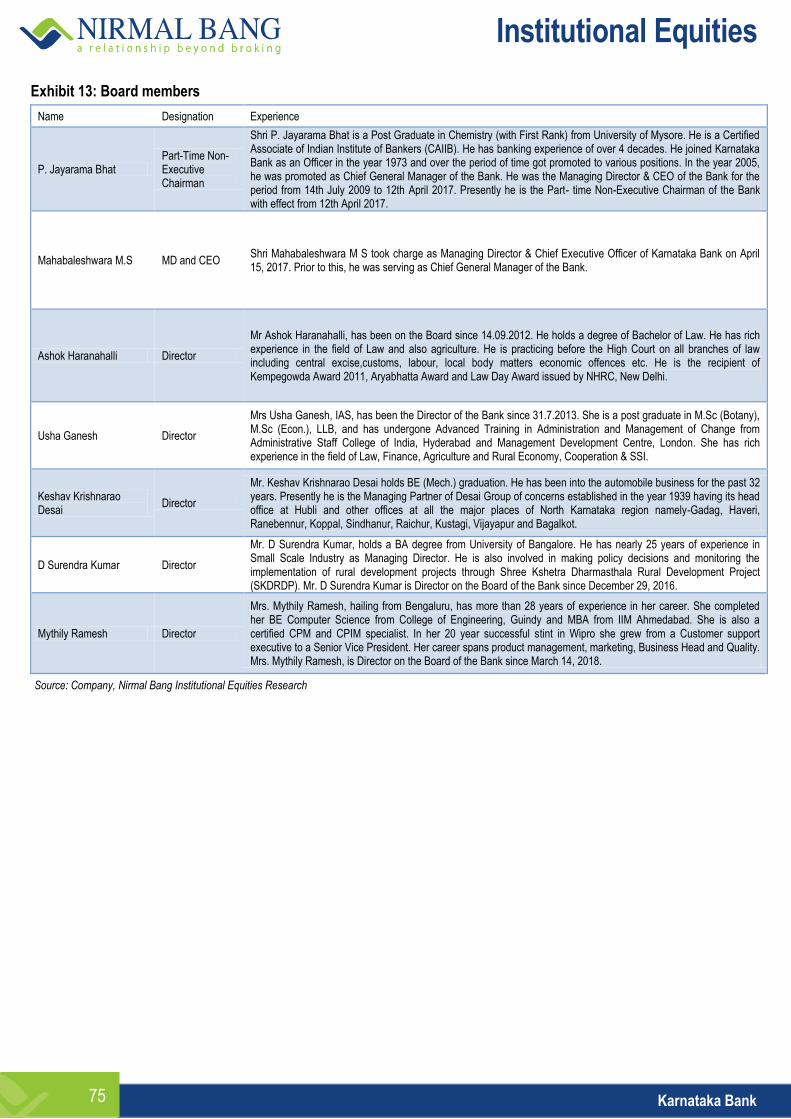
Institutional Equities
Karnataka Bank 75
Exhibit 13: Board members
Name Designation Experience
P. Jayarama Bhat Part-Time Non-Executive Chairman
Shri P. Jayarama Bhat is a Post Graduate in Chemistry (with First Rank) from University of Mysore. He is a Certified Associate of Indian Institute of Bankers (CAIIB). He has banking experience of over 4 decades. He joined Karnataka Bank as an Officer in the year 1973 and over the period of time got promoted to various positions. In the year 2005, he was promoted as Chief General Manager of the Bank. He was the Managing Director & CEO of the Bank for the period from 14th July 2009 to 12th April 2017. Presently he is the Part- time Non-Executive Chairman of the Bank with effect from 12th April 2017.
Mahabaleshwara M.S MD and CEO Shri Mahabaleshwara M S took charge as Managing Director & Chief Executive Officer of Karnataka Bank on April 15, 2017. Prior to this, he was serving as Chief General Manager of the Bank.
Ashok Haranahalli Director
Mr Ashok Haranahalli, has been on the Board since 14.09.2012. He holds a degree of Bachelor of Law. He has rich experience in the field of Law and also agriculture. He is practicing before the High Court on all branches of law including central excise,customs, labour, local body matters economic offences etc. He is the recipient of Kempegowda Award 2011, Aryabhatta Award and Law Day Award issued by NHRC, New Delhi.
Usha Ganesh Director
Mrs Usha Ganesh, IAS, has been the Director of the Bank since 31.7.2013. She is a post graduate in M.Sc (Botany), M.Sc (Econ.), LLB, and has undergone Advanced Training in Administration and Management of Change from Administrative Staff College of India, Hyderabad and Management Development Centre, London. She has rich experience in the field of Law, Finance, Agriculture and Rural Economy, Cooperation & SSI.
Keshav Krishnarao Desai
Director
Mr. Keshav Krishnarao Desai holds BE (Mech.) graduation. He has been into the automobile business for the past 32 years. Presently he is the Managing Partner of Desai Group of concerns established in the year 1939 having its head office at Hubli and other offices at all the major places of North Karnataka region namely-Gadag, Haveri, Ranebennur, Koppal, Sindhanur, Raichur, Kustagi, Vijayapur and Bagalkot.
D Surendra Kumar Director
Mr. D Surendra Kumar, holds a BA degree from University of Bangalore. He has nearly 25 years of experience in Small Scale Industry as Managing Director. He is also involved in making policy decisions and monitoring the implementation of rural development projects through Shree Kshetra Dharmasthala Rural Development Project (SKDRDP). Mr. D Surendra Kumar is Director on the Board of the Bank since December 29, 2016.
Mythily Ramesh Director
Mrs. Mythily Ramesh, hailing from Bengaluru, has more than 28 years of experience in her career. She completed her BE Computer Science from College of Engineering, Guindy and MBA from IIM Ahmedabad. She is also a certified CPM and CPIM specialist. In her 20 year successful stint in Wipro she grew from a Customer support executive to a Senior Vice President. Her career spans product management, marketing, Business Head and Quality. Mrs. Mythily Ramesh, is Director on the Board of the Bank since March 14, 2018.
Source: Company, Nirmal Bang Institutional Equities Research
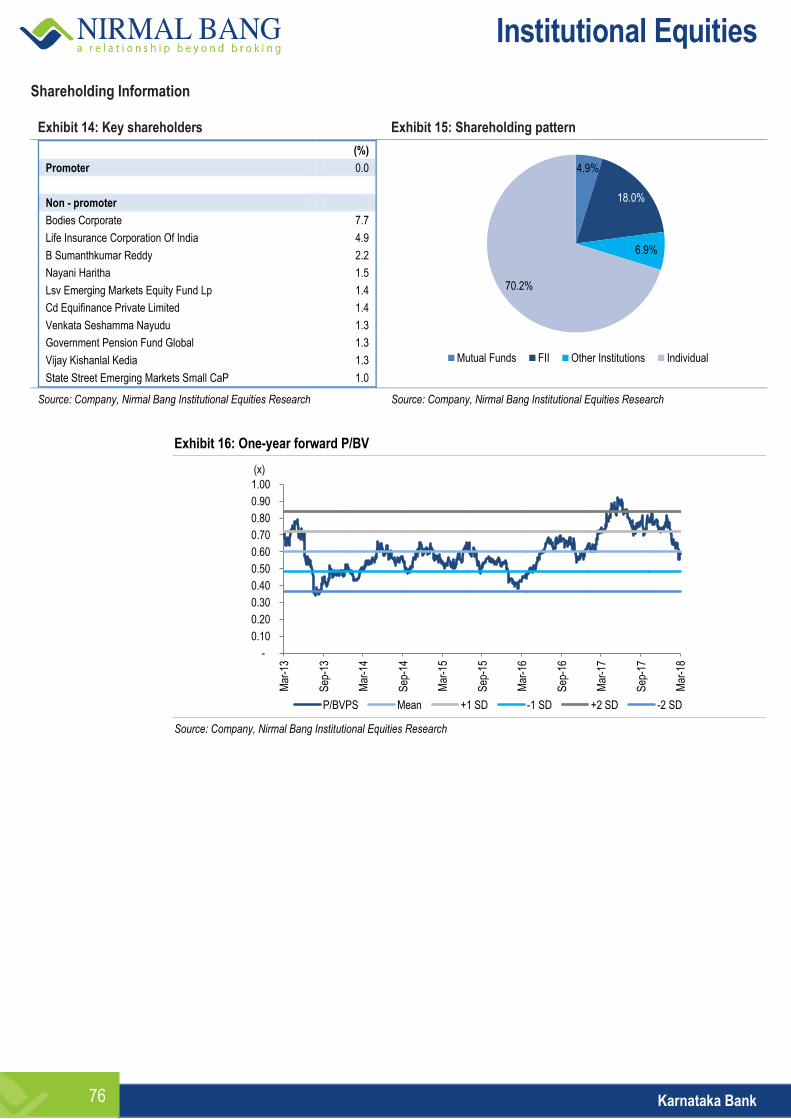
Institutional Equities
Karnataka Bank 76
Shareholding Information
Exhibit 14: Key shareholders Exhibit 15: Shareholding pattern
(%)
Promoter 0.0
Non - promoter
Bodies Corporate 7.7
Life Insurance Corporation Of India 4.9
B Sumanthkumar Reddy 2.2
Nayani Haritha 1.5
Lsv Emerging Markets Equity Fund Lp 1.4
Cd Equifinance Private Limited 1.4
Venkata Seshamma Nayudu 1.3
Government Pension Fund Global 1.3
Vijay Kishanlal Kedia 1.3
State Street Emerging Markets Small CaP 1.0
Source: Company, Nirmal Bang Institutional Equities Research Source: Company, Nirmal Bang Institutional Equities Research
Exhibit 16: One-year forward P/BV
Source: Company, Nirmal Bang Institutional Equities Research
4.9%
18.0%
6.9%
70.2%
Mutual Funds FII Other Institutions Individual
-
0.10
0.20
0.30
0.40
0.50
0.60
0.70
0.80
0.90
1.00
Mar
-13
Sep
-13
Mar
-14
Sep
-14
Mar
-15
Sep
-15
Mar
-16
Sep
-16
Mar
-17
Sep
-17
Mar
-18
P/BVPS Mean +1 SD -1 SD +2 SD -2 SD
(x)
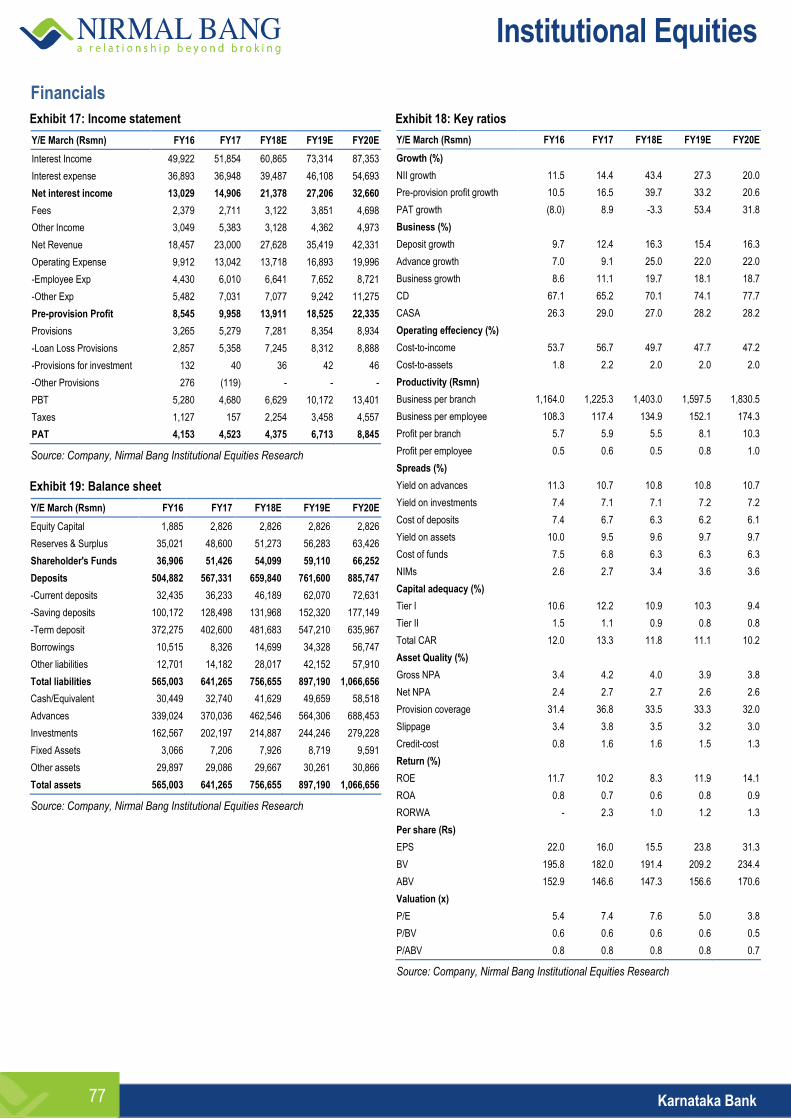
Institutional Equities
Karnataka Bank 77
Financials
Exhibit 17: Income statement
Y/E March (Rsmn) FY16 FY17 FY18E FY19E FY20E
Interest Income 49,922 51,854 60,865 73,314 87,353
Interest expense 36,893 36,948 39,487 46,108 54,693
Net interest income 13,029 14,906 21,378 27,206 32,660
Fees 2,379 2,711 3,122 3,851 4,698
Other Income 3,049 5,383 3,128 4,362 4,973
Net Revenue 18,457 23,000 27,628 35,419 42,331
Operating Expense 9,912 13,042 13,718 16,893 19,996
-Employee Exp 4,430 6,010 6,641 7,652 8,721
-Other Exp 5,482 7,031 7,077 9,242 11,275
Pre-provision Profit 8,545 9,958 13,911 18,525 22,335
Provisions 3,265 5,279 7,281 8,354 8,934
-Loan Loss Provisions 2,857 5,358 7,245 8,312 8,888
-Provisions for investment 132 40 36 42 46
-Other Provisions 276 (119) - - -
PBT 5,280 4,680 6,629 10,172 13,401
Taxes 1,127 157 2,254 3,458 4,557
PAT 4,153 4,523 4,375 6,713 8,845
Source: Company, Nirmal Bang Institutional Equities Research
Exhibit 19: Balance sheet
Y/E March (Rsmn) FY16 FY17 FY18E FY19E FY20E
Equity Capital 1,885 2,826 2,826 2,826 2,826
Reserves & Surplus 35,021 48,600 51,273 56,283 63,426
Shareholder's Funds 36,906 51,426 54,099 59,110 66,252
Deposits 504,882 567,331 659,840 761,600 885,747
-Current deposits 32,435 36,233 46,189 62,070 72,631
-Saving deposits 100,172 128,498 131,968 152,320 177,149
-Term deposit 372,275 402,600 481,683 547,210 635,967
Borrowings 10,515 8,326 14,699 34,328 56,747
Other liabilities 12,701 14,182 28,017 42,152 57,910
Total liabilities 565,003 641,265 756,655 897,190 1,066,656
Cash/Equivalent 30,449 32,740 41,629 49,659 58,518
Advances 339,024 370,036 462,546 564,306 688,453
Investments 162,567 202,197 214,887 244,246 279,228
Fixed Assets 3,066 7,206 7,926 8,719 9,591
Other assets 29,897 29,086 29,667 30,261 30,866
Total assets 565,003 641,265 756,655 897,190 1,066,656
Source: Company, Nirmal Bang Institutional Equities Research
Exhibit 18: Key ratios
Y/E March (Rsmn) FY16 FY17 FY18E FY19E FY20E
Growth (%)
NII growth 11.5 14.4 43.4 27.3 20.0
Pre-provision profit growth 10.5 16.5 39.7 33.2 20.6
PAT growth (8.0) 8.9 -3.3 53.4 31.8
Business (%)
Deposit growth 9.7 12.4 16.3 15.4 16.3
Advance growth 7.0 9.1 25.0 22.0 22.0
Business growth 8.6 11.1 19.7 18.1 18.7
CD 67.1 65.2 70.1 74.1 77.7
CASA 26.3 29.0 27.0 28.2 28.2
Operating effeciency (%)
Cost-to-income 53.7 56.7 49.7 47.7 47.2
Cost-to-assets 1.8 2.2 2.0 2.0 2.0
Productivity (Rsmn)
Business per branch 1,164.0 1,225.3 1,403.0 1,597.5 1,830.5
Business per employee 108.3 117.4 134.9 152.1 174.3
Profit per branch 5.7 5.9 5.5 8.1 10.3
Profit per employee 0.5 0.6 0.5 0.8 1.0
Spreads (%)
Yield on advances 11.3 10.7 10.8 10.8 10.7
Yield on investments 7.4 7.1 7.1 7.2 7.2
Cost of deposits 7.4 6.7 6.3 6.2 6.1
Yield on assets 10.0 9.5 9.6 9.7 9.7
Cost of funds 7.5 6.8 6.3 6.3 6.3
NIMs 2.6 2.7 3.4 3.6 3.6
Capital adequacy (%)
Tier I 10.6 12.2 10.9 10.3 9.4
Tier II 1.5 1.1 0.9 0.8 0.8
Total CAR 12.0 13.3 11.8 11.1 10.2
Asset Quality (%)
Gross NPA 3.4 4.2 4.0 3.9 3.8
Net NPA 2.4 2.7 2.7 2.6 2.6
Provision coverage 31.4 36.8 33.5 33.3 32.0
Slippage 3.4 3.8 3.5 3.2 3.0
Credit-cost 0.8 1.6 1.6 1.5 1.3
Return (%)
ROE 11.7 10.2 8.3 11.9 14.1
ROA 0.8 0.7 0.6 0.8 0.9
RORWA - 2.3 1.0 1.2 1.3
Per share (Rs)
EPS 22.0 16.0 15.5 23.8 31.3
BV 195.8 182.0 191.4 209.2 234.4
ABV 152.9 146.6 147.3 156.6 170.6
Valuation (x)
P/E 5.4 7.4 7.6 5.0 3.8
P/BV 0.6 0.6 0.6 0.6 0.5
P/ABV 0.8 0.8 0.8 0.8 0.7
Source: Company, Nirmal Bang Institutional Equities Research

Institutional Equities
Karnataka Bank 78
This page has been intentionally left blank
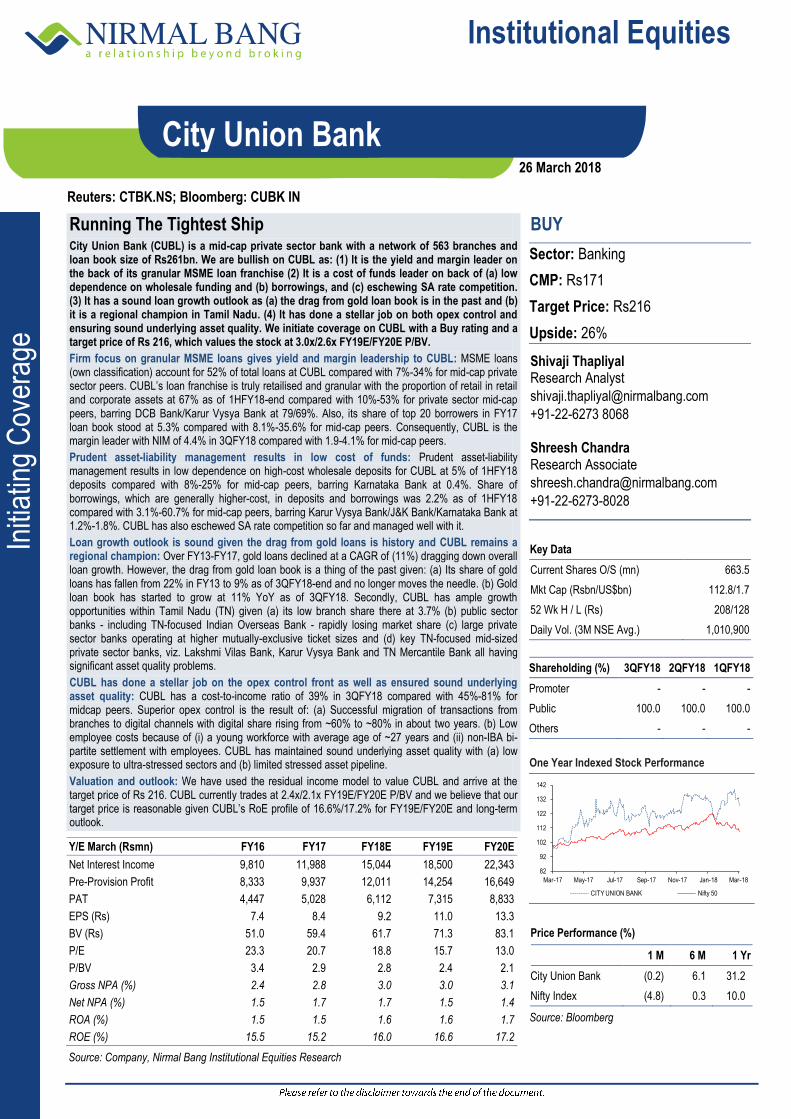
Institutional Equities
Initi
atin
g C
over
age
Reuters: CTBK.NS; Bloomberg: CUBK IN
City Union Bank
Running The Tightest Ship City Union Bank (CUBL) is a mid-cap private sector bank with a network of 563 branches and loan book size of Rs261bn. We are bullish on CUBL as: (1) It is the yield and margin leader on the back of its granular MSME loan franchise (2) It is a cost of funds leader on back of (a) low dependence on wholesale funding and (b) borrowings, and (c) eschewing SA rate competition. (3) It has a sound loan growth outlook as (a) the drag from gold loan book is in the past and (b) it is a regional champion in Tamil Nadu. (4) It has done a stellar job on both opex control and ensuring sound underlying asset quality. We initiate coverage on CUBL with a Buy rating and a target price of Rs 216, which values the stock at 3.0x/2.6x FY19E/FY20E P/BV.
Firm focus on granular MSME loans gives yield and margin leadership to CUBL: MSME loans (own classification) account for 52% of total loans at CUBL compared with 7%-34% for mid-cap private sector peers. CUBL’s loan franchise is truly retailised and granular with the proportion of retail in retail and corporate assets at 67% as of 1HFY18-end compared with 10%-53% for private sector mid-cap peers, barring DCB Bank/Karur Vysya Bank at 79/69%. Also, its share of top 20 borrowers in FY17 loan book stood at 5.3% compared with 8.1%-35.6% for mid-cap peers. Consequently, CUBL is the margin leader with NIM of 4.4% in 3QFY18 compared with 1.9-4.1% for mid-cap peers.
Prudent asset-liability management results in low cost of funds: Prudent asset-liability management results in low dependence on high-cost wholesale deposits for CUBL at 5% of 1HFY18 deposits compared with 8%-25% for mid-cap peers, barring Karnataka Bank at 0.4%. Share of borrowings, which are generally higher-cost, in deposits and borrowings was 2.2% as of 1HFY18 compared with 3.1%-60.7% for mid-cap peers, barring Karur Vysya Bank/J&K Bank/Karnataka Bank at 1.2%-1.8%. CUBL has also eschewed SA rate competition so far and managed well with it.
Loan growth outlook is sound given the drag from gold loans is history and CUBL remains a regional champion: Over FY13-FY17, gold loans declined at a CAGR of (11%) dragging down overall loan growth. However, the drag from gold loan book is a thing of the past given: (a) Its share of gold loans has fallen from 22% in FY13 to 9% as of 3QFY18-end and no longer moves the needle. (b) Gold loan book has started to grow at 11% YoY as of 3QFY18. Secondly, CUBL has ample growth opportunities within Tamil Nadu (TN) given (a) its low branch share there at 3.7% (b) public sector banks - including TN-focused Indian Overseas Bank - rapidly losing market share (c) large private sector banks operating at higher mutually-exclusive ticket sizes and (d) key TN-focused mid-sized private sector banks, viz. Lakshmi Vilas Bank, Karur Vysya Bank and TN Mercantile Bank all having significant asset quality problems.
CUBL has done a stellar job on the opex control front as well as ensured sound underlying asset quality: CUBL has a cost-to-income ratio of 39% in 3QFY18 compared with 45%-81% for midcap peers. Superior opex control is the result of: (a) Successful migration of transactions from branches to digital channels with digital share rising from ~60% to ~80% in about two years. (b) Low employee costs because of (i) a young workforce with average age of ~27 years and (ii) non-IBA bi-partite settlement with employees. CUBL has maintained sound underlying asset quality with (a) low exposure to ultra-stressed sectors and (b) limited stressed asset pipeline.
Valuation and outlook: We have used the residual income model to value CUBL and arrive at the target price of Rs 216. CUBL currently trades at 2.4x/2.1x FY19E/FY20E P/BV and we believe that our target price is reasonable given CUBL’s RoE profile of 16.6%/17.2% for FY19E/FY20E and long-term outlook.
BUY
Sector: Banking
CMP: Rs171
Target Price: Rs216
Upside: 26%
Shivaji Thapliyal Research Analyst
+91-22-6273 8068 Shreesh Chandra Research Associate
+91-22-6273-8028
Key Data
Current Shares O/S (mn) 663.5
Mkt Cap (Rsbn/US$bn) 112.8/1.7
52 Wk H / L (Rs) 208/128
Daily Vol. (3M NSE Avg.) 1,010,900
Shareholding (%) 3QFY18 2QFY18 1QFY18
Promoter - - -
Public 100.0 100.0 100.0
Others - - -
One Year Indexed Stock Performance
Price Performance (%)
1 M 6 M 1 Yr
City Union Bank (0.2) 6.1 31.2
Nifty Index (4.8) 0.3 10.0
Source: Bloomberg
Y/E March (Rsmn) FY16 FY17 FY18E FY19E FY20E
Net Interest Income 9,810 11,988 15,044 18,500 22,343
Pre-Provision Profit 8,333 9,937 12,011 14,254 16,649
PAT 4,447 5,028 6,112 7,315 8,833
EPS (Rs) 7.4 8.4 9.2 11.0 13.3
BV (Rs) 51.0 59.4 61.7 71.3 83.1
P/E 23.3 20.7 18.8 15.7 13.0
P/BV 3.4 2.9 2.8 2.4 2.1
Gross NPA (%) 2.4 2.8 3.0 3.0 3.1
Net NPA (%) 1.5 1.7 1.7 1.5 1.4
ROA (%) 1.5 1.5 1.6 1.6 1.7
ROE (%) 15.5 15.2 16.0 16.6 17.2
Source: Company, Nirmal Bang Institutional Equities Research
82
92
102
112
122
132
142
Mar-17 May-17 Jul-17 Sep-17 Nov-17 Jan-18 Mar-18
CITY UNION BANK Nifty 50
26 March 2018
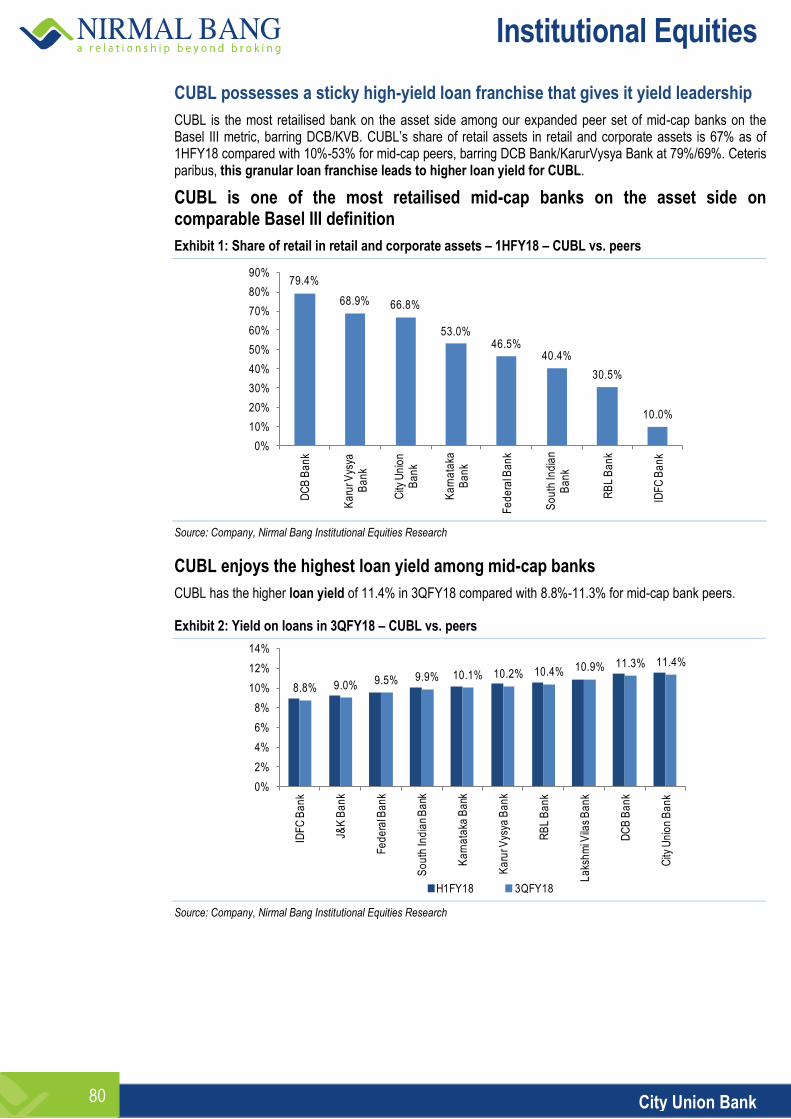
Institutional Equities
City Union Bank 80
CUBL possesses a sticky high-yield loan franchise that gives it yield leadership
CUBL is the most retailised bank on the asset side among our expanded peer set of mid-cap banks on the Basel III metric, barring DCB/KVB. CUBL’s share of retail assets in retail and corporate assets is 67% as of 1HFY18 compared with 10%-53% for mid-cap peers, barring DCB Bank/KarurVysya Bank at 79%/69%. Ceteris paribus, this granular loan franchise leads to higher loan yield for CUBL.
CUBL is one of the most retailised mid-cap banks on the asset side on comparable Basel III definition
Exhibit 1: Share of retail in retail and corporate assets – 1HFY18 – CUBL vs. peers
Source: Company, Nirmal Bang Institutional Equities Research
CUBL enjoys the highest loan yield among mid-cap banks
CUBL has the higher loan yield of 11.4% in 3QFY18 compared with 8.8%-11.3% for mid-cap bank peers.
Exhibit 2: Yield on loans in 3QFY18 – CUBL vs. peers
Source: Company, Nirmal Bang Institutional Equities Research
79.4%
68.9% 66.8%
53.0%46.5%
40.4%
30.5%
10.0%
0%
10%
20%
30%
40%
50%
60%
70%
80%
90%
DC
B B
an
k
Ka
rur V
ysya
B
an
k
City
Un
ion
B
an
k
Ka
rna
taka
B
an
k
Fe
de
ral B
an
k
So
uth
Ind
ian
Ba
nk
RB
L B
an
k
IDF
C B
an
k
8.8% 9.0% 9.5% 9.9% 10.1% 10.2% 10.4% 10.9% 11.3% 11.4%
0%
2%
4%
6%
8%
10%
12%
14%
IDF
C B
an
k
J&K
Ba
nk
Fe
de
ral B
an
k
So
uth
Ind
ian
Ba
nk
Ka
rna
taka
Ba
nk
Ka
rur V
ysya
Ba
nk
RB
L B
an
k
La
ksh
mi V
ilas
Ba
nk
DC
B B
an
k
City
Un
ion
Ba
nk
H1FY18 3QFY18
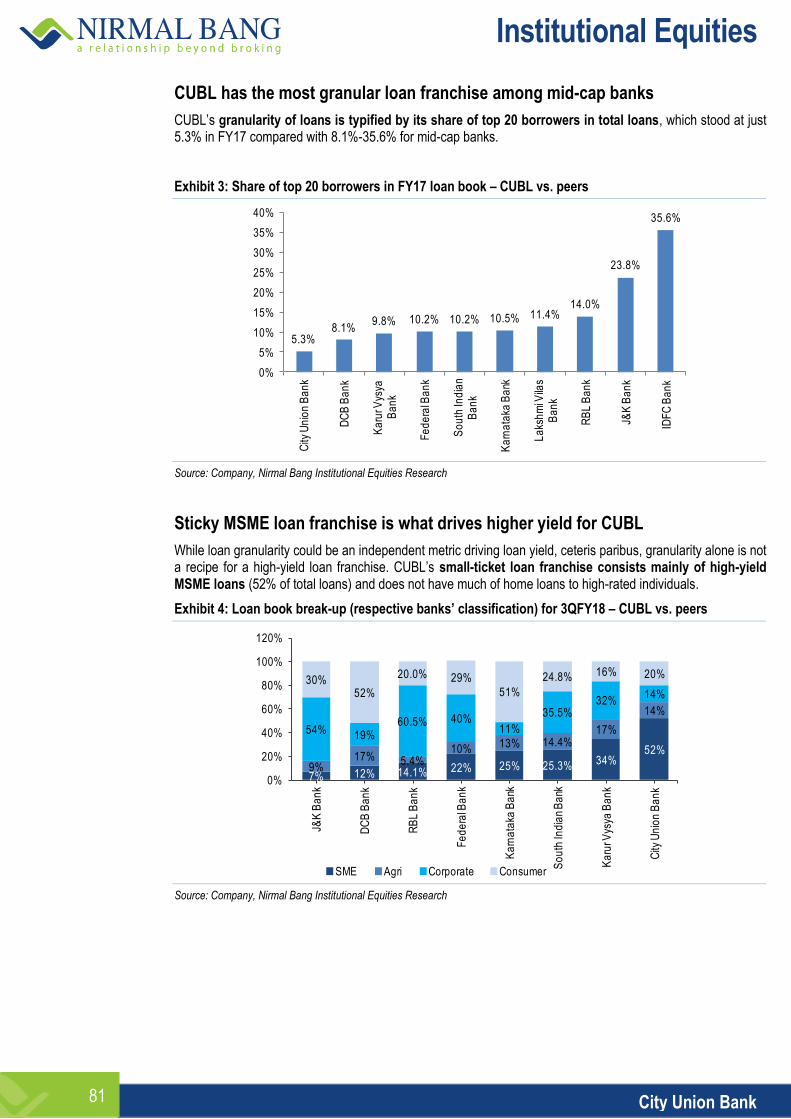
Institutional Equities
City Union Bank 81
CUBL has the most granular loan franchise among mid-cap banks
CUBL’s granularity of loans is typified by its share of top 20 borrowers in total loans, which stood at just 5.3% in FY17 compared with 8.1%-35.6% for mid-cap banks.
Exhibit 3: Share of top 20 borrowers in FY17 loan book – CUBL vs. peers
Source: Company, Nirmal Bang Institutional Equities Research
Sticky MSME loan franchise is what drives higher yield for CUBL
While loan granularity could be an independent metric driving loan yield, ceteris paribus, granularity alone is not a recipe for a high-yield loan franchise. CUBL’s small-ticket loan franchise consists mainly of high-yield MSME loans (52% of total loans) and does not have much of home loans to high-rated individuals.
Exhibit 4: Loan book break-up (respective banks’ classification) for 3QFY18 – CUBL vs. peers
Source: Company, Nirmal Bang Institutional Equities Research
5.3%8.1%
9.8% 10.2% 10.2% 10.5% 11.4%14.0%
23.8%
35.6%
0%
5%
10%
15%
20%
25%
30%
35%
40%
City
Un
ion
Ba
nk
DC
B B
an
k
Ka
rur V
ysya
B
an
k
Fe
de
ral B
an
k
So
uth
Ind
ian
Ba
nk
Ka
rna
taka
Ba
nk
La
ksh
mi V
ilas
Ba
nk
RB
L B
an
k
J&K
Ba
nk
IDF
C B
an
k
7% 12% 14.1% 22% 25% 25.3% 34%52%
9%17% 5.4%
10% 13% 14.4%17%
14%
54% 19%60.5% 40%
11%
35.5%32%
14%
30%52%
20.0% 29%
51%
24.8% 16% 20%
0%
20%
40%
60%
80%
100%
120%
J&K
Ba
nk
DC
B B
an
k
RB
L B
an
k
Fe
de
ral B
an
k
Ka
rna
taka
Ba
nk
So
uth
Ind
ian
Ba
nk
Ka
rur V
ysya
Ba
nk
City
Un
ion
Ba
nk
SME Agri Corporate Consumer
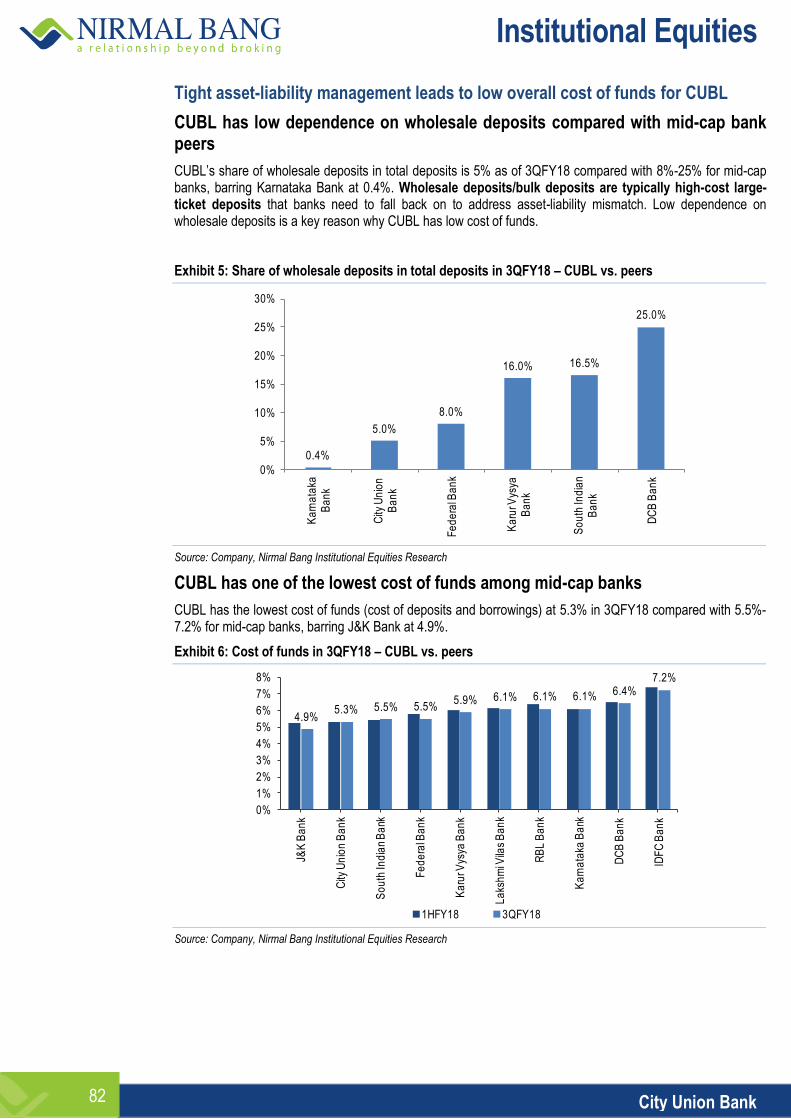
Institutional Equities
City Union Bank 82
Tight asset-liability management leads to low overall cost of funds for CUBL
CUBL has low dependence on wholesale deposits compared with mid-cap bank peers
CUBL’s share of wholesale deposits in total deposits is 5% as of 3QFY18 compared with 8%-25% for mid-cap banks, barring Karnataka Bank at 0.4%. Wholesale deposits/bulk deposits are typically high-cost large-ticket deposits that banks need to fall back on to address asset-liability mismatch. Low dependence on wholesale deposits is a key reason why CUBL has low cost of funds.
Exhibit 5: Share of wholesale deposits in total deposits in 3QFY18 – CUBL vs. peers
Source: Company, Nirmal Bang Institutional Equities Research
CUBL has one of the lowest cost of funds among mid-cap banks
CUBL has the lowest cost of funds (cost of deposits and borrowings) at 5.3% in 3QFY18 compared with 5.5%-7.2% for mid-cap banks, barring J&K Bank at 4.9%.
Exhibit 6: Cost of funds in 3QFY18 – CUBL vs. peers
Source: Company, Nirmal Bang Institutional Equities Research
0.4%
5.0%
8.0%
16.0% 16.5%
25.0%
0%
5%
10%
15%
20%
25%
30%K
arn
ata
ka
Ba
nk
City
Un
ion
B
an
k
Fe
de
ral B
an
k
Ka
rur V
ysya
B
an
k
So
uth
Ind
ian
Ba
nk
DC
B B
an
k
4.9%5.3% 5.5% 5.5%
5.9% 6.1% 6.1% 6.1% 6.4%7.2%
0%
1%
2%
3%
4%
5%
6%
7%
8%
J&K
Ba
nk
City
Un
ion
Ba
nk
So
uth
Ind
ian
Ba
nk
Fe
de
ral B
an
k
Ka
rur V
ysya
Ba
nk
La
ksh
mi V
ilas
Ba
nk
RB
L B
an
k
Ka
rna
taka
Ba
nk
DC
B B
an
k
IDF
C B
an
k
1HFY18 3QFY18
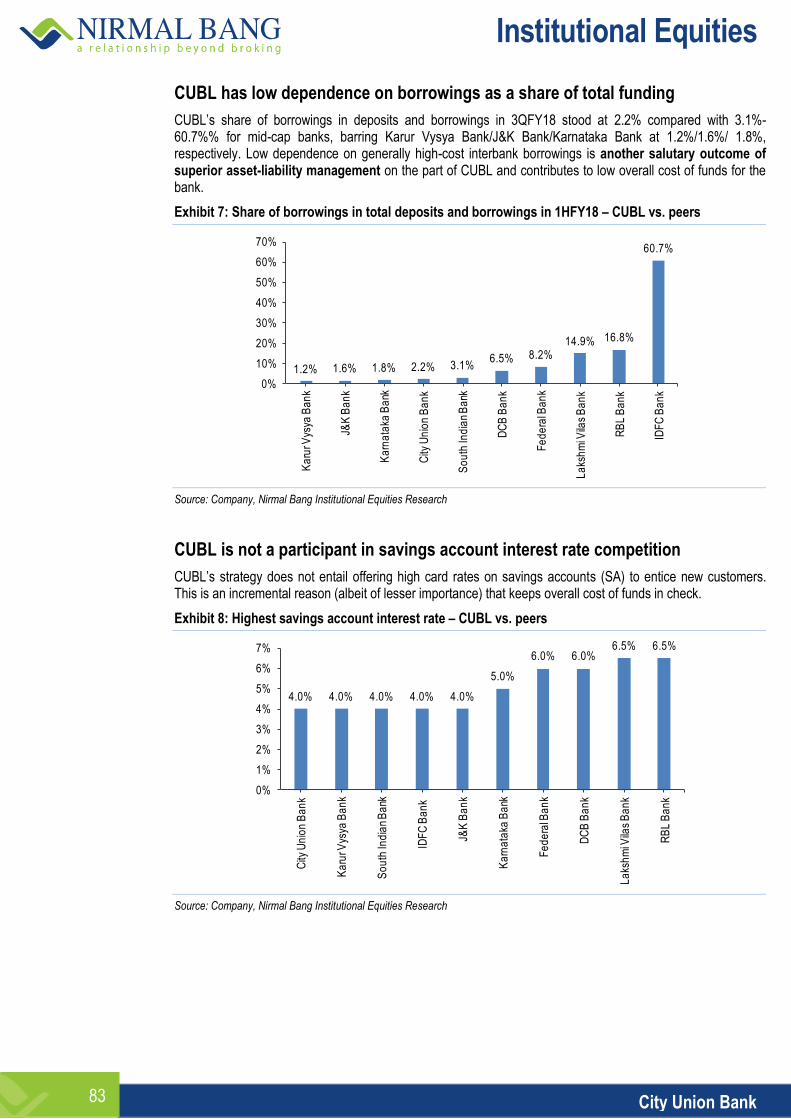
Institutional Equities
City Union Bank 83
CUBL has low dependence on borrowings as a share of total funding
CUBL’s share of borrowings in deposits and borrowings in 3QFY18 stood at 2.2% compared with 3.1%-60.7%% for mid-cap banks, barring Karur Vysya Bank/J&K Bank/Karnataka Bank at 1.2%/1.6%/ 1.8%, respectively. Low dependence on generally high-cost interbank borrowings is another salutary outcome of superior asset-liability management on the part of CUBL and contributes to low overall cost of funds for the bank.
Exhibit 7: Share of borrowings in total deposits and borrowings in 1HFY18 – CUBL vs. peers
Source: Company, Nirmal Bang Institutional Equities Research
CUBL is not a participant in savings account interest rate competition
CUBL’s strategy does not entail offering high card rates on savings accounts (SA) to entice new customers. This is an incremental reason (albeit of lesser importance) that keeps overall cost of funds in check.
Exhibit 8: Highest savings account interest rate – CUBL vs. peers
Source: Company, Nirmal Bang Institutional Equities Research
1.2% 1.6% 1.8% 2.2% 3.1%6.5% 8.2%
14.9% 16.8%
60.7%
0%
10%
20%
30%
40%
50%
60%
70%
Ka
rur V
ysya
Ba
nk
J&K
Ba
nk
Ka
rna
taka
Ba
nk
City
Un
ion
Ba
nk
So
uth
Ind
ian
Ba
nk
DC
B B
an
k
Fe
de
ral B
an
k
La
ksh
mi V
ilas
Ba
nk
RB
L B
an
k
IDF
C B
an
k
4.0% 4.0% 4.0% 4.0% 4.0%
5.0%
6.0% 6.0%6.5% 6.5%
0%
1%
2%
3%
4%
5%
6%
7%
City
Un
ion
Ba
nk
Ka
rur V
ysya
Ba
nk
So
uth
Ind
ian
Ba
nk
IDF
C B
an
k
J&K
Ba
nk
Ka
rna
taka
Ba
nk
Fe
de
ral B
an
k
DC
B B
an
k
La
ksh
mi V
ilas
Ba
nk
RB
L B
an
k
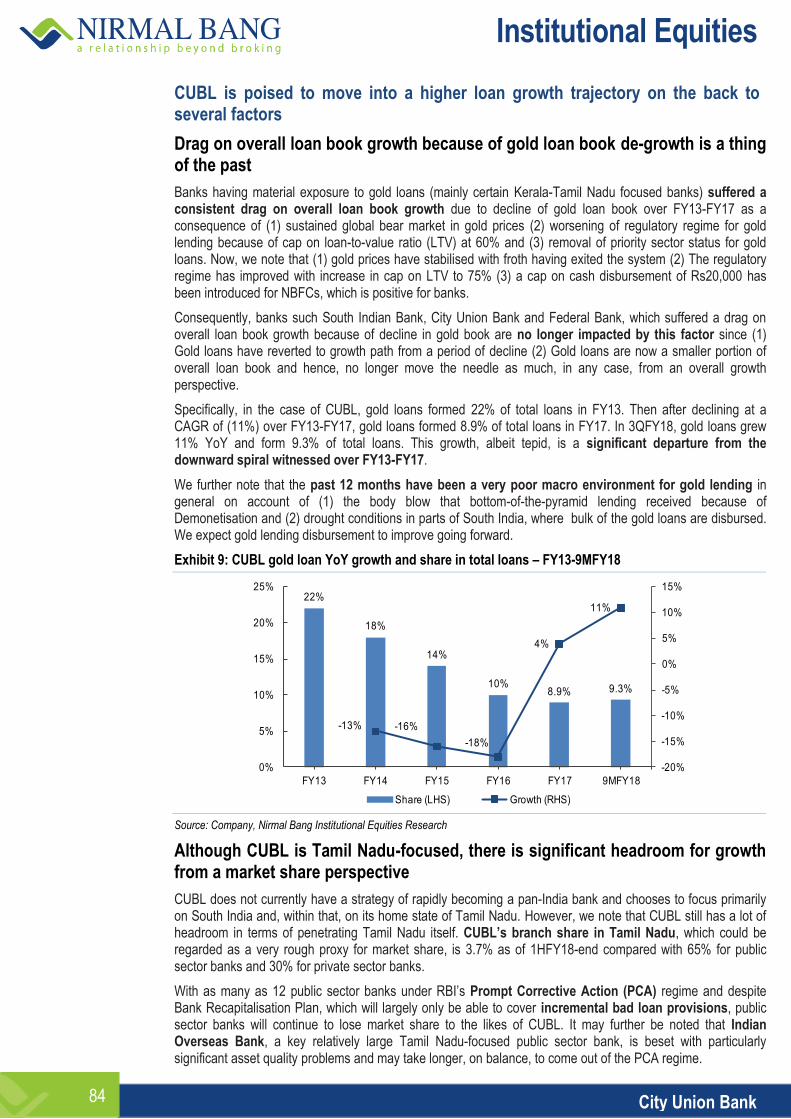
Institutional Equities
City Union Bank 84
CUBL is poised to move into a higher loan growth trajectory on the back to several factors
Drag on overall loan book growth because of gold loan book de-growth is a thing of the past
Banks having material exposure to gold loans (mainly certain Kerala-Tamil Nadu focused banks) suffered a consistent drag on overall loan book growth due to decline of gold loan book over FY13-FY17 as a consequence of (1) sustained global bear market in gold prices (2) worsening of regulatory regime for gold lending because of cap on loan-to-value ratio (LTV) at 60% and (3) removal of priority sector status for gold loans. Now, we note that (1) gold prices have stabilised with froth having exited the system (2) The regulatory regime has improved with increase in cap on LTV to 75% (3) a cap on cash disbursement of Rs20,000 has been introduced for NBFCs, which is positive for banks.
Consequently, banks such South Indian Bank, City Union Bank and Federal Bank, which suffered a drag on overall loan book growth because of decline in gold book are no longer impacted by this factor since (1) Gold loans have reverted to growth path from a period of decline (2) Gold loans are now a smaller portion of overall loan book and hence, no longer move the needle as much, in any case, from an overall growth perspective.
Specifically, in the case of CUBL, gold loans formed 22% of total loans in FY13. Then after declining at a CAGR of (11%) over FY13-FY17, gold loans formed 8.9% of total loans in FY17. In 3QFY18, gold loans grew 11% YoY and form 9.3% of total loans. This growth, albeit tepid, is a significant departure from the downward spiral witnessed over FY13-FY17.
We further note that the past 12 months have been a very poor macro environment for gold lending in general on account of (1) the body blow that bottom-of-the-pyramid lending received because of Demonetisation and (2) drought conditions in parts of South India, where bulk of the gold loans are disbursed. We expect gold lending disbursement to improve going forward.
Exhibit 9: CUBL gold loan YoY growth and share in total loans – FY13-9MFY18
Source: Company, Nirmal Bang Institutional Equities Research
Although CUBL is Tamil Nadu-focused, there is significant headroom for growth from a market share perspective
CUBL does not currently have a strategy of rapidly becoming a pan-India bank and chooses to focus primarily on South India and, within that, on its home state of Tamil Nadu. However, we note that CUBL still has a lot of headroom in terms of penetrating Tamil Nadu itself. CUBL’s branch share in Tamil Nadu, which could be regarded as a very rough proxy for market share, is 3.7% as of 1HFY18-end compared with 65% for public sector banks and 30% for private sector banks.
With as many as 12 public sector banks under RBI’s Prompt Corrective Action (PCA) regime and despite Bank Recapitalisation Plan, which will largely only be able to cover incremental bad loan provisions, public sector banks will continue to lose market share to the likes of CUBL. It may further be noted that Indian Overseas Bank, a key relatively large Tamil Nadu-focused public sector bank, is beset with particularly significant asset quality problems and may take longer, on balance, to come out of the PCA regime.
22%
18%
14%
10%8.9% 9.3%
-13% -16%
-18%
4%
11%
-20%
-15%
-10%
-5%
0%
5%
10%
15%
0%
5%
10%
15%
20%
25%
FY13 FY14 FY15 FY16 FY17 9MFY18
Share (LHS) Growth (RHS)
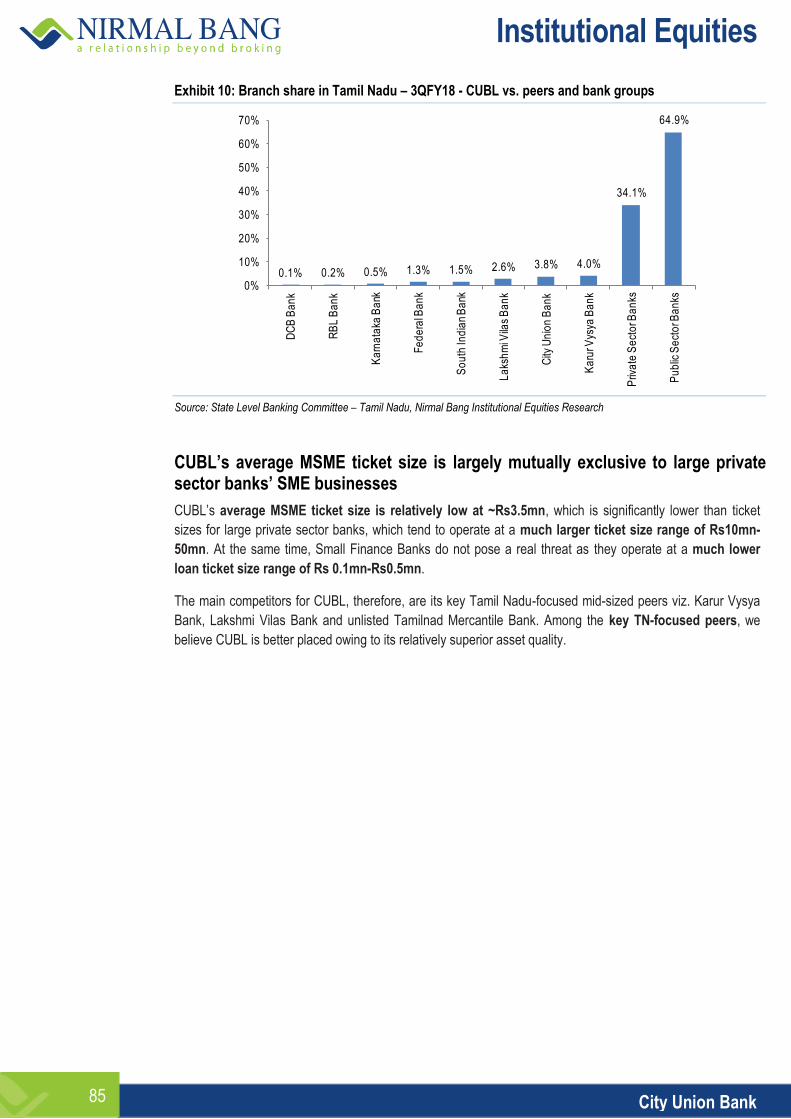
Institutional Equities
City Union Bank 85
Exhibit 10: Branch share in Tamil Nadu – 3QFY18 - CUBL vs. peers and bank groups
Source: State Level Banking Committee – Tamil Nadu, Nirmal Bang Institutional Equities Research
CUBL’s average MSME ticket size is largely mutually exclusive to large private sector banks’ SME businesses
CUBL’s average MSME ticket size is relatively low at ~Rs3.5mn, which is significantly lower than ticket
sizes for large private sector banks, which tend to operate at a much larger ticket size range of Rs10mn-
50mn. At the same time, Small Finance Banks do not pose a real threat as they operate at a much lower
loan ticket size range of Rs 0.1mn-Rs0.5mn.
The main competitors for CUBL, therefore, are its key Tamil Nadu-focused mid-sized peers viz. Karur Vysya
Bank, Lakshmi Vilas Bank and unlisted Tamilnad Mercantile Bank. Among the key TN-focused peers, we
believe CUBL is better placed owing to its relatively superior asset quality.
0.1% 0.2% 0.5% 1.3% 1.5% 2.6% 3.8% 4.0%
34.1%
64.9%
0%
10%
20%
30%
40%
50%
60%
70%
DC
B B
an
k
RB
L B
an
k
Ka
rna
taka
Ba
nk
Fe
de
ral B
an
k
So
uth
Ind
ian
Ba
nk
La
ksh
mi V
ilas
Ba
nk
City
Un
ion
Ba
nk
Ka
rur V
ysya
Ba
nk
Priv
ate
Se
cto
r Ba
nks
Pu
blic
Se
cto
r Ba
nks
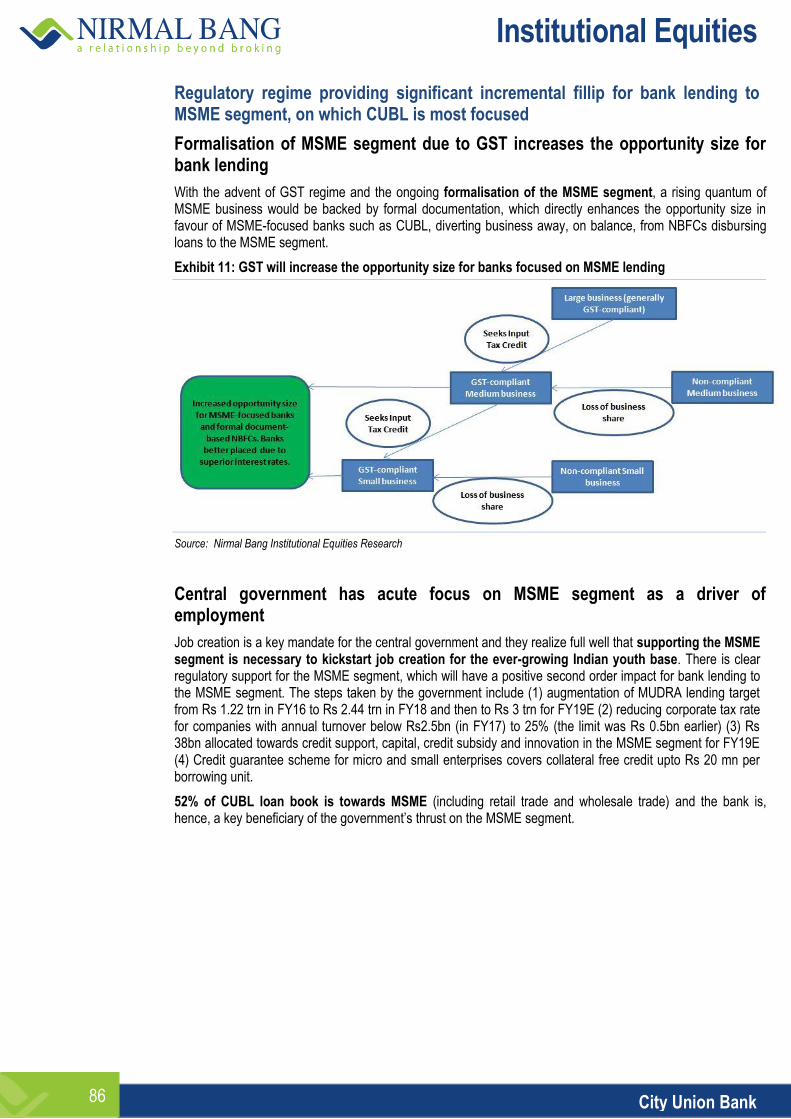
Institutional Equities
City Union Bank 86
Regulatory regime providing significant incremental fillip for bank lending to MSME segment, on which CUBL is most focused
Formalisation of MSME segment due to GST increases the opportunity size for bank lending
With the advent of GST regime and the ongoing formalisation of the MSME segment, a rising quantum of MSME business would be backed by formal documentation, which directly enhances the opportunity size in favour of MSME-focused banks such as CUBL, diverting business away, on balance, from NBFCs disbursing loans to the MSME segment.
Exhibit 11: GST will increase the opportunity size for banks focused on MSME lending
Source: Nirmal Bang Institutional Equities Research
Central government has acute focus on MSME segment as a driver of employment
Job creation is a key mandate for the central government and they realize full well that supporting the MSME segment is necessary to kickstart job creation for the ever-growing Indian youth base. There is clear regulatory support for the MSME segment, which will have a positive second order impact for bank lending to the MSME segment. The steps taken by the government include (1) augmentation of MUDRA lending target from Rs 1.22 trn in FY16 to Rs 2.44 trn in FY18 and then to Rs 3 trn for FY19E (2) reducing corporate tax rate for companies with annual turnover below Rs2.5bn (in FY17) to 25% (the limit was Rs 0.5bn earlier) (3) Rs 38bn allocated towards credit support, capital, credit subsidy and innovation in the MSME segment for FY19E (4) Credit guarantee scheme for micro and small enterprises covers collateral free credit upto Rs 20 mn per borrowing unit.
52% of CUBL loan book is towards MSME (including retail trade and wholesale trade) and the bank is, hence, a key beneficiary of the government’s thrust on the MSME segment.
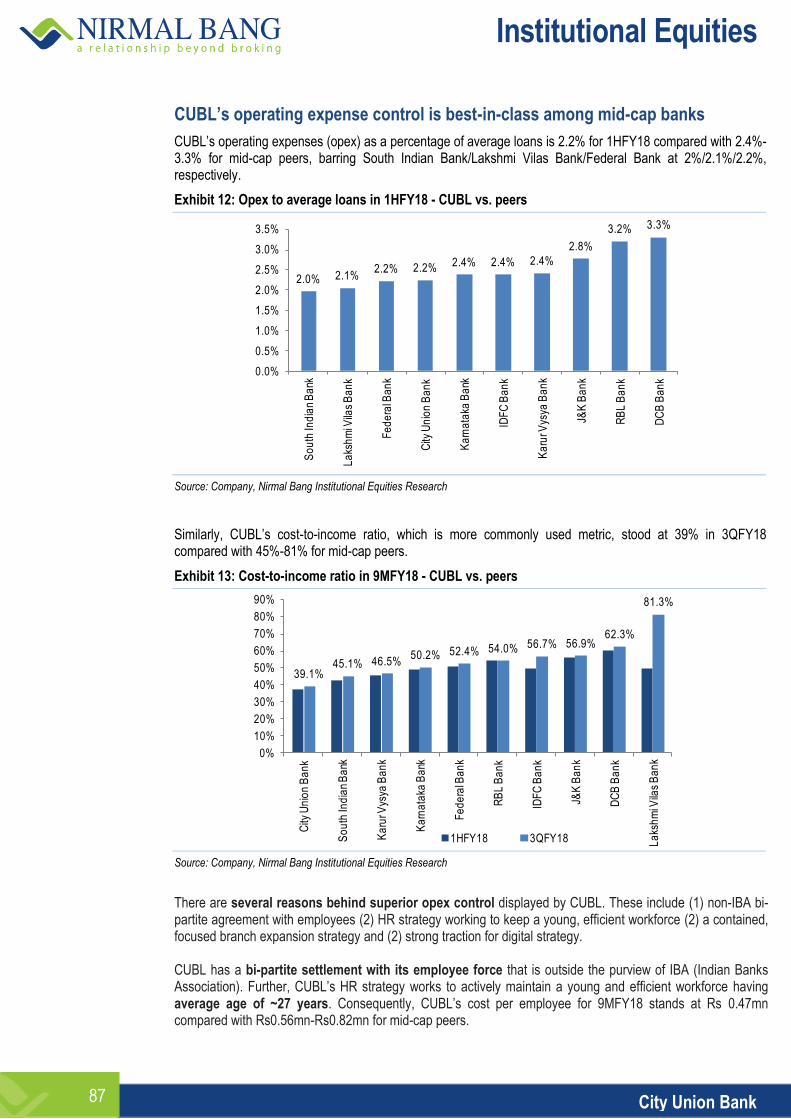
Institutional Equities
City Union Bank 87
CUBL’s operating expense control is best-in-class among mid-cap banks
CUBL’s operating expenses (opex) as a percentage of average loans is 2.2% for 1HFY18 compared with 2.4%-3.3% for mid-cap peers, barring South Indian Bank/Lakshmi Vilas Bank/Federal Bank at 2%/2.1%/2.2%, respectively.
Exhibit 12: Opex to average loans in 1HFY18 - CUBL vs. peers
Source: Company, Nirmal Bang Institutional Equities Research
Similarly, CUBL’s cost-to-income ratio, which is more commonly used metric, stood at 39% in 3QFY18 compared with 45%-81% for mid-cap peers.
Exhibit 13: Cost-to-income ratio in 9MFY18 - CUBL vs. peers
Source: Company, Nirmal Bang Institutional Equities Research
There are several reasons behind superior opex control displayed by CUBL. These include (1) non-IBA bi-partite agreement with employees (2) HR strategy working to keep a young, efficient workforce (2) a contained, focused branch expansion strategy and (2) strong traction for digital strategy. CUBL has a bi-partite settlement with its employee force that is outside the purview of IBA (Indian Banks Association). Further, CUBL’s HR strategy works to actively maintain a young and efficient workforce having average age of ~27 years. Consequently, CUBL’s cost per employee for 9MFY18 stands at Rs 0.47mn compared with Rs0.56mn-Rs0.82mn for mid-cap peers.
2.0% 2.1%2.2% 2.2% 2.4% 2.4% 2.4%
2.8%
3.2% 3.3%
0.0%
0.5%
1.0%
1.5%
2.0%
2.5%
3.0%
3.5%
So
uth
Ind
ian
Ba
nk
La
ksh
mi V
ilas
Ba
nk
Fe
de
ral B
an
k
City
Un
ion
Ba
nk
Ka
rna
taka
Ba
nk
IDF
C B
an
k
Ka
rur V
ysya
Ba
nk
J&K
Ba
nk
RB
L B
an
k
DC
B B
an
k
39.1%45.1% 46.5%
50.2% 52.4% 54.0% 56.7% 56.9%62.3%
81.3%
0%
10%
20%
30%
40%
50%
60%
70%
80%
90%
City
Un
ion
Ba
nk
So
uth
Ind
ian
Ba
nk
Ka
rur V
ysya
Ba
nk
Ka
rna
taka
Ba
nk
Fe
de
ral B
an
k
RB
L B
an
k
IDF
C B
an
k
J&K
Ba
nk
DC
B B
an
k
La
ksh
mi V
ilas
Ba
nk
1HFY18 3QFY18
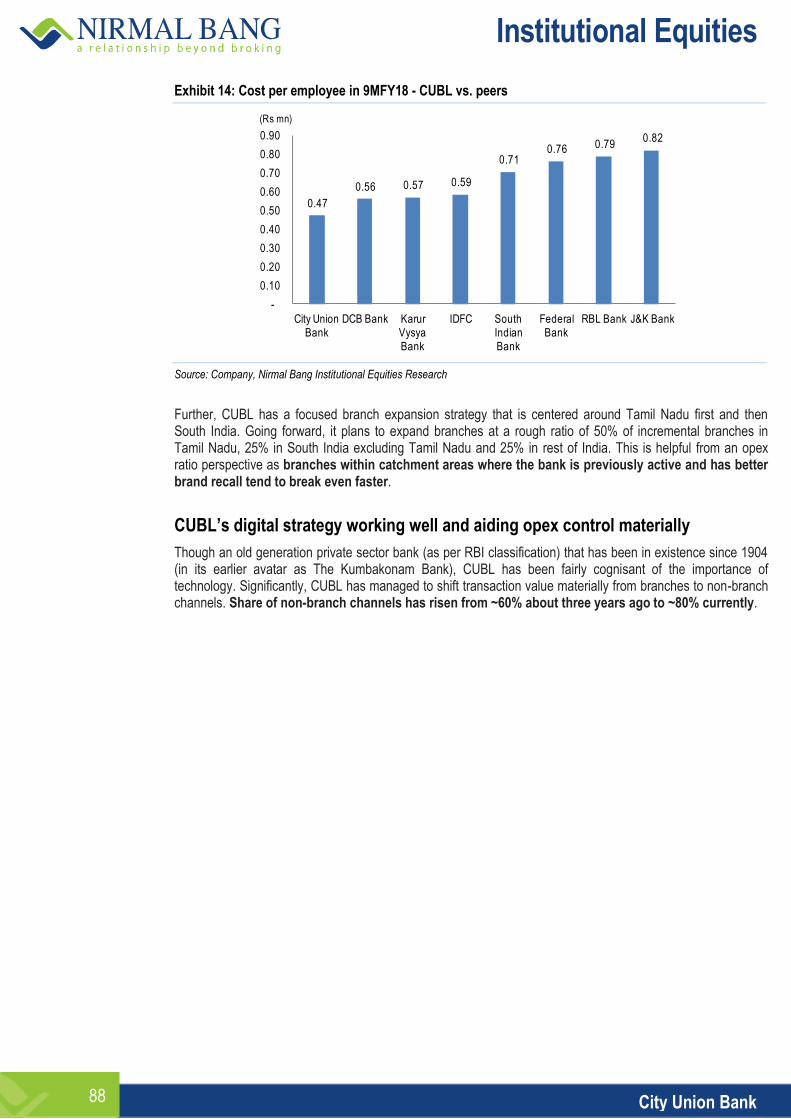
Institutional Equities
City Union Bank 88
Exhibit 14: Cost per employee in 9MFY18 - CUBL vs. peers
Source: Company, Nirmal Bang Institutional Equities Research
Further, CUBL has a focused branch expansion strategy that is centered around Tamil Nadu first and then South India. Going forward, it plans to expand branches at a rough ratio of 50% of incremental branches in Tamil Nadu, 25% in South India excluding Tamil Nadu and 25% in rest of India. This is helpful from an opex ratio perspective as branches within catchment areas where the bank is previously active and has better brand recall tend to break even faster.
CUBL’s digital strategy working well and aiding opex control materially
Though an old generation private sector bank (as per RBI classification) that has been in existence since 1904 (in its earlier avatar as The Kumbakonam Bank), CUBL has been fairly cognisant of the importance of technology. Significantly, CUBL has managed to shift transaction value materially from branches to non-branch channels. Share of non-branch channels has risen from ~60% about three years ago to ~80% currently.
0.47
0.56 0.57 0.59
0.71 0.76 0.79
0.82
-
0.10
0.20
0.30
0.40
0.50
0.60
0.70
0.80
0.90
City Union Bank
DCB Bank Karur Vysya Bank
IDFC South Indian Bank
Federal Bank
RBL Bank J&K Bank
(Rs mn)
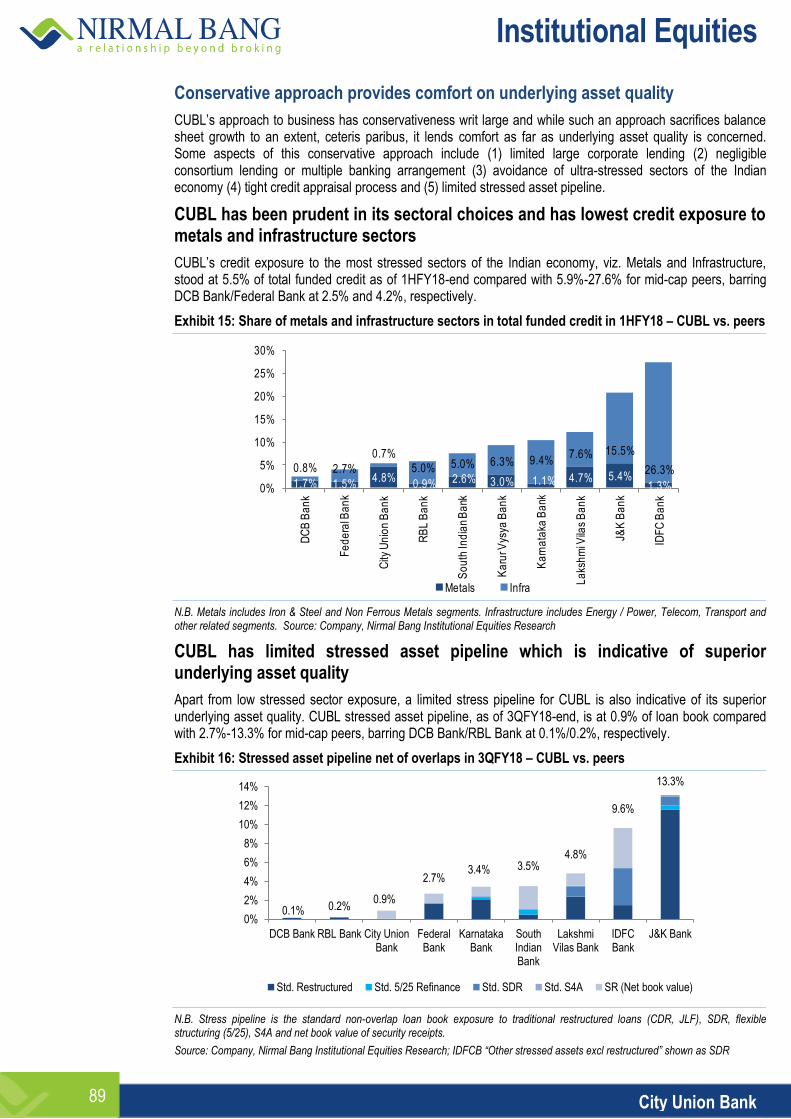
Institutional Equities
City Union Bank 89
Conservative approach provides comfort on underlying asset quality
CUBL’s approach to business has conservativeness writ large and while such an approach sacrifices balance sheet growth to an extent, ceteris paribus, it lends comfort as far as underlying asset quality is concerned. Some aspects of this conservative approach include (1) limited large corporate lending (2) negligible consortium lending or multiple banking arrangement (3) avoidance of ultra-stressed sectors of the Indian economy (4) tight credit appraisal process and (5) limited stressed asset pipeline.
CUBL has been prudent in its sectoral choices and has lowest credit exposure to metals and infrastructure sectors
CUBL’s credit exposure to the most stressed sectors of the Indian economy, viz. Metals and Infrastructure, stood at 5.5% of total funded credit as of 1HFY18-end compared with 5.9%-27.6% for mid-cap peers, barring DCB Bank/Federal Bank at 2.5% and 4.2%, respectively.
Exhibit 15: Share of metals and infrastructure sectors in total funded credit in 1HFY18 – CUBL vs. peers
N.B. Metals includes Iron & Steel and Non Ferrous Metals segments. Infrastructure includes Energy / Power, Telecom, Transport and other related segments. Source: Company, Nirmal Bang Institutional Equities Research
CUBL has limited stressed asset pipeline which is indicative of superior underlying asset quality
Apart from low stressed sector exposure, a limited stress pipeline for CUBL is also indicative of its superior underlying asset quality. CUBL stressed asset pipeline, as of 3QFY18-end, is at 0.9% of loan book compared with 2.7%-13.3% for mid-cap peers, barring DCB Bank/RBL Bank at 0.1%/0.2%, respectively.
Exhibit 16: Stressed asset pipeline net of overlaps in 3QFY18 – CUBL vs. peers
N.B. Stress pipeline is the standard non-overlap loan book exposure to traditional restructured loans (CDR, JLF), SDR, flexible structuring (5/25), S4A and net book value of security receipts.
Source: Company, Nirmal Bang Institutional Equities Research; IDFCB “Other stressed assets excl restructured” shown as SDR
1.7% 1.5%4.8%
0.9% 2.6% 3.0% 1.1% 4.7% 5.4%1.3%
0.8% 2.7%
0.7%
5.0% 5.0% 6.3% 9.4%7.6% 15.5%
26.3%
0%
5%
10%
15%
20%
25%
30%
DC
B B
an
k
Fe
de
ral B
an
k
City
Un
ion
Ba
nk
RB
L B
an
k
So
uth
Ind
ian
Ba
nk
Ka
rur V
ysya
Ba
nk
Ka
rna
taka
Ba
nk
La
ksh
mi V
ilas
Ba
nk
J&K
Ba
nk
IDF
C B
an
k
Metals Infra
0.1% 0.2% 0.9%
2.7% 3.4% 3.5%
4.8%
9.6%
13.3%
0%
2%
4%
6%
8%
10%
12%
14%
DCB Bank RBL Bank City Union Bank
Federal Bank
Karnataka Bank
South Indian Bank
Lakshmi Vilas Bank
IDFC Bank
J&K Bank
Std. Restructured Std. 5/25 Refinance Std. SDR Std. S4A SR (Net book value)
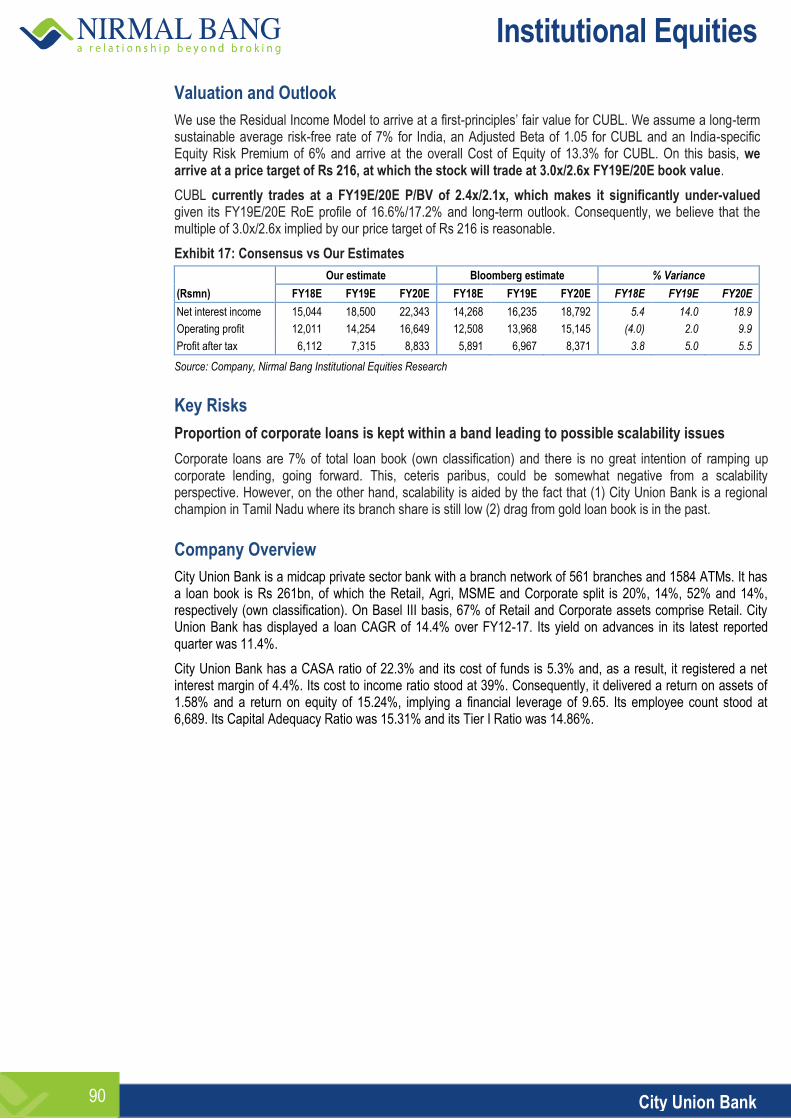
Institutional Equities
City Union Bank 90
Valuation and Outlook
We use the Residual Income Model to arrive at a first-principles’ fair value for CUBL. We assume a long-term sustainable average risk-free rate of 7% for India, an Adjusted Beta of 1.05 for CUBL and an India-specific Equity Risk Premium of 6% and arrive at the overall Cost of Equity of 13.3% for CUBL. On this basis, we arrive at a price target of Rs 216, at which the stock will trade at 3.0x/2.6x FY19E/20E book value.
CUBL currently trades at a FY19E/20E P/BV of 2.4x/2.1x, which makes it significantly under-valued given its FY19E/20E RoE profile of 16.6%/17.2% and long-term outlook. Consequently, we believe that the multiple of 3.0x/2.6x implied by our price target of Rs 216 is reasonable.
Exhibit 17: Consensus vs Our Estimates
Our estimate Bloomberg estimate % Variance
(Rsmn) FY18E FY19E FY20E FY18E FY19E FY20E FY18E FY19E FY20E
Net interest income 15,044 18,500 22,343 14,268 16,235 18,792 5.4 14.0 18.9
Operating profit 12,011 14,254 16,649 12,508 13,968 15,145 (4.0) 2.0 9.9
Profit after tax 6,112 7,315 8,833 5,891 6,967 8,371 3.8 5.0 5.5
Source: Company, Nirmal Bang Institutional Equities Research Key Risks
Proportion of corporate loans is kept within a band leading to possible scalability issues
Corporate loans are 7% of total loan book (own classification) and there is no great intention of ramping up corporate lending, going forward. This, ceteris paribus, could be somewhat negative from a scalability perspective. However, on the other hand, scalability is aided by the fact that (1) City Union Bank is a regional champion in Tamil Nadu where its branch share is still low (2) drag from gold loan book is in the past.
Company Overview
City Union Bank is a midcap private sector bank with a branch network of 561 branches and 1584 ATMs. It has a loan book is Rs 261bn, of which the Retail, Agri, MSME and Corporate split is 20%, 14%, 52% and 14%, respectively (own classification). On Basel III basis, 67% of Retail and Corporate assets comprise Retail. City Union Bank has displayed a loan CAGR of 14.4% over FY12-17. Its yield on advances in its latest reported quarter was 11.4%.
City Union Bank has a CASA ratio of 22.3% and its cost of funds is 5.3% and, as a result, it registered a net interest margin of 4.4%. Its cost to income ratio stood at 39%. Consequently, it delivered a return on assets of 1.58% and a return on equity of 15.24%, implying a financial leverage of 9.65. Its employee count stood at 6,689. Its Capital Adequacy Ratio was 15.31% and its Tier I Ratio was 14.86%.
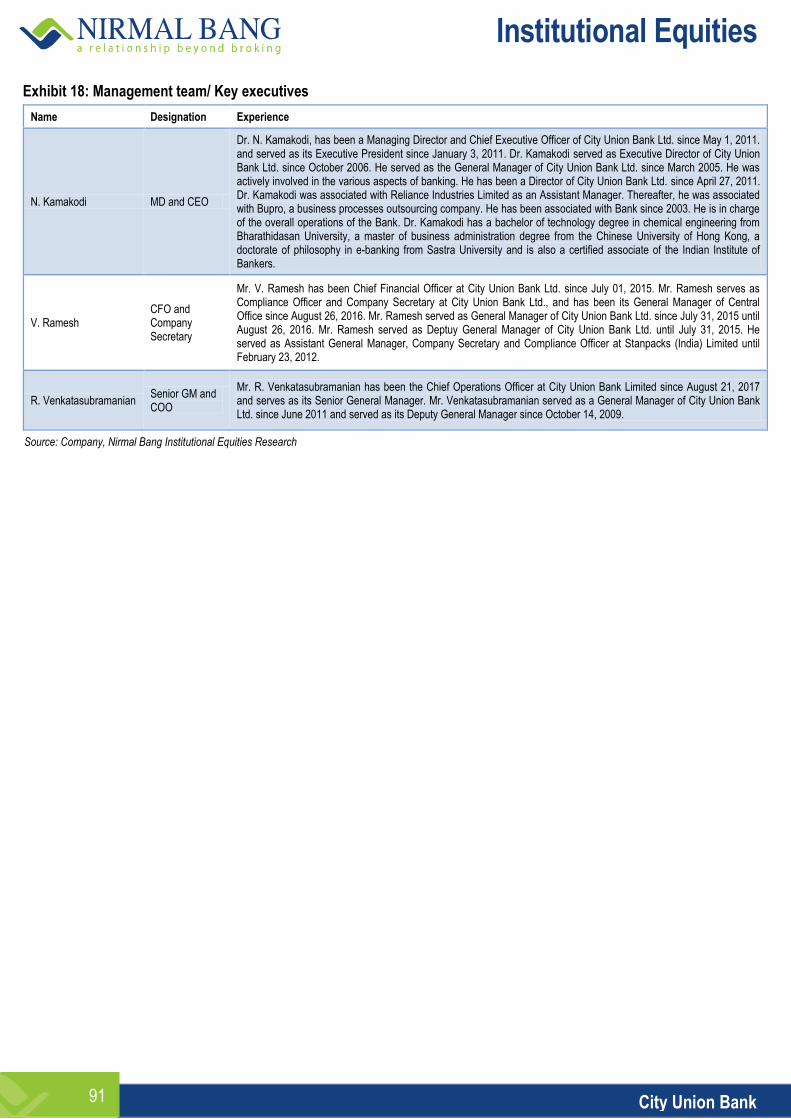
Institutional Equities
City Union Bank 91
Exhibit 18: Management team/ Key executives
Name Designation Experience
N. Kamakodi MD and CEO
Dr. N. Kamakodi, has been a Managing Director and Chief Executive Officer of City Union Bank Ltd. since May 1, 2011. and served as its Executive President since January 3, 2011. Dr. Kamakodi served as Executive Director of City Union Bank Ltd. since October 2006. He served as the General Manager of City Union Bank Ltd. since March 2005. He was actively involved in the various aspects of banking. He has been a Director of City Union Bank Ltd. since April 27, 2011. Dr. Kamakodi was associated with Reliance Industries Limited as an Assistant Manager. Thereafter, he was associated with Bupro, a business processes outsourcing company. He has been associated with Bank since 2003. He is in charge of the overall operations of the Bank. Dr. Kamakodi has a bachelor of technology degree in chemical engineering from Bharathidasan University, a master of business administration degree from the Chinese University of Hong Kong, a doctorate of philosophy in e-banking from Sastra University and is also a certified associate of the Indian Institute of Bankers.
V. Ramesh CFO and Company Secretary
Mr. V. Ramesh has been Chief Financial Officer at City Union Bank Ltd. since July 01, 2015. Mr. Ramesh serves as Compliance Officer and Company Secretary at City Union Bank Ltd., and has been its General Manager of Central Office since August 26, 2016. Mr. Ramesh served as General Manager of City Union Bank Ltd. since July 31, 2015 until August 26, 2016. Mr. Ramesh served as Deptuy General Manager of City Union Bank Ltd. until July 31, 2015. He served as Assistant General Manager, Company Secretary and Compliance Officer at Stanpacks (India) Limited until February 23, 2012.
R. Venkatasubramanian Senior GM and COO
Mr. R. Venkatasubramanian has been the Chief Operations Officer at City Union Bank Limited since August 21, 2017 and serves as its Senior General Manager. Mr. Venkatasubramanian served as a General Manager of City Union Bank Ltd. since June 2011 and served as its Deputy General Manager since October 14, 2009.
Source: Company, Nirmal Bang Institutional Equities Research
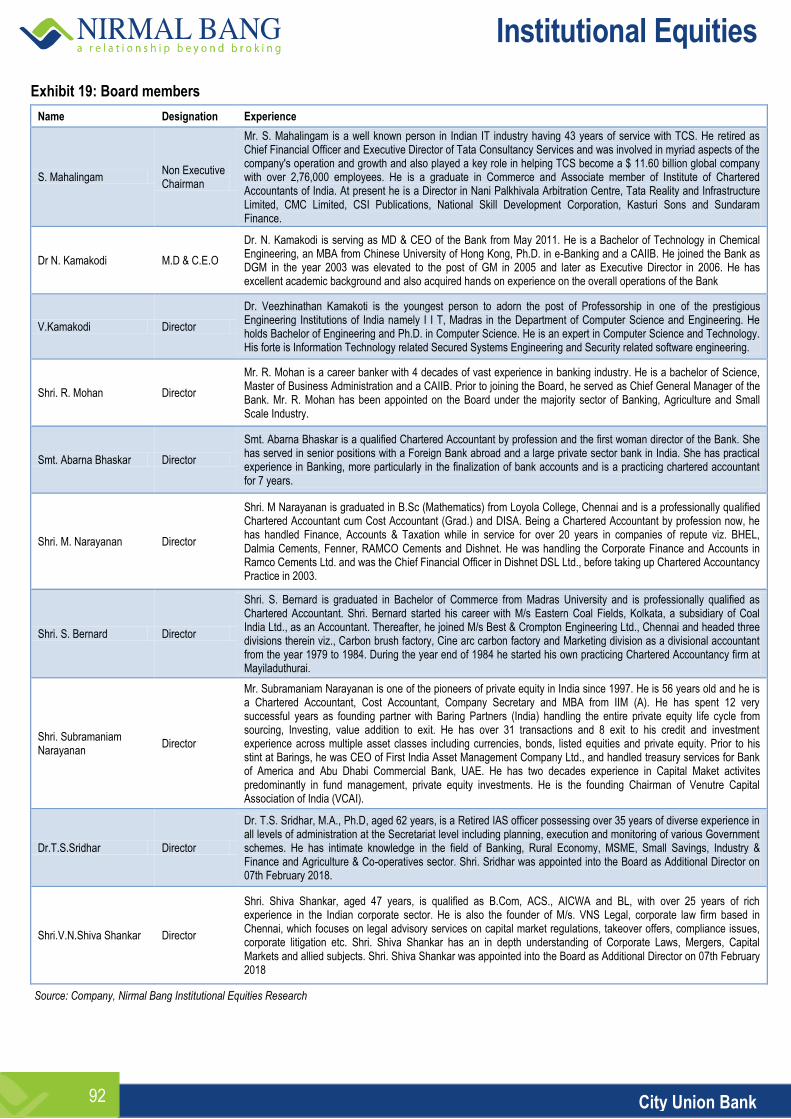
Institutional Equities
City Union Bank 92
Exhibit 19: Board members
Name Designation Experience
S. Mahalingam Non Executive Chairman
Mr. S. Mahalingam is a well known person in Indian IT industry having 43 years of service with TCS. He retired as Chief Financial Officer and Executive Director of Tata Consultancy Services and was involved in myriad aspects of the company's operation and growth and also played a key role in helping TCS become a $ 11.60 billion global company with over 2,76,000 employees. He is a graduate in Commerce and Associate member of Institute of Chartered Accountants of India. At present he is a Director in Nani Palkhivala Arbitration Centre, Tata Reality and Infrastructure Limited, CMC Limited, CSI Publications, National Skill Development Corporation, Kasturi Sons and Sundaram Finance.
Dr N. Kamakodi M.D & C.E.O
Dr. N. Kamakodi is serving as MD & CEO of the Bank from May 2011. He is a Bachelor of Technology in Chemical Engineering, an MBA from Chinese University of Hong Kong, Ph.D. in e-Banking and a CAIIB. He joined the Bank as DGM in the year 2003 was elevated to the post of GM in 2005 and later as Executive Director in 2006. He has excellent academic background and also acquired hands on experience on the overall operations of the Bank
V.Kamakodi Director
Dr. Veezhinathan Kamakoti is the youngest person to adorn the post of Professorship in one of the prestigious Engineering Institutions of India namely I I T, Madras in the Department of Computer Science and Engineering. He holds Bachelor of Engineering and Ph.D. in Computer Science. He is an expert in Computer Science and Technology. His forte is Information Technology related Secured Systems Engineering and Security related software engineering.
Shri. R. Mohan Director
Mr. R. Mohan is a career banker with 4 decades of vast experience in banking industry. He is a bachelor of Science, Master of Business Administration and a CAIIB. Prior to joining the Board, he served as Chief General Manager of the Bank. Mr. R. Mohan has been appointed on the Board under the majority sector of Banking, Agriculture and Small Scale Industry.
Smt. Abarna Bhaskar Director
Smt. Abarna Bhaskar is a qualified Chartered Accountant by profession and the first woman director of the Bank. She has served in senior positions with a Foreign Bank abroad and a large private sector bank in India. She has practical experience in Banking, more particularly in the finalization of bank accounts and is a practicing chartered accountant for 7 years.
Shri. M. Narayanan Director
Shri. M Narayanan is graduated in B.Sc (Mathematics) from Loyola College, Chennai and is a professionally qualified Chartered Accountant cum Cost Accountant (Grad.) and DISA. Being a Chartered Accountant by profession now, he has handled Finance, Accounts & Taxation while in service for over 20 years in companies of repute viz. BHEL, Dalmia Cements, Fenner, RAMCO Cements and Dishnet. He was handling the Corporate Finance and Accounts in Ramco Cements Ltd. and was the Chief Financial Officer in Dishnet DSL Ltd., before taking up Chartered Accountancy Practice in 2003.
Shri. S. Bernard Director
Shri. S. Bernard is graduated in Bachelor of Commerce from Madras University and is professionally qualified as Chartered Accountant. Shri. Bernard started his career with M/s Eastern Coal Fields, Kolkata, a subsidiary of Coal India Ltd., as an Accountant. Thereafter, he joined M/s Best & Crompton Engineering Ltd., Chennai and headed three divisions therein viz., Carbon brush factory, Cine arc carbon factory and Marketing division as a divisional accountant from the year 1979 to 1984. During the year end of 1984 he started his own practicing Chartered Accountancy firm at Mayiladuthurai.
Shri. Subramaniam Narayanan
Director
Mr. Subramaniam Narayanan is one of the pioneers of private equity in India since 1997. He is 56 years old and he is a Chartered Accountant, Cost Accountant, Company Secretary and MBA from IIM (A). He has spent 12 very successful years as founding partner with Baring Partners (India) handling the entire private equity life cycle from sourcing, Investing, value addition to exit. He has over 31 transactions and 8 exit to his credit and investment experience across multiple asset classes including currencies, bonds, listed equities and private equity. Prior to his stint at Barings, he was CEO of First India Asset Management Company Ltd., and handled treasury services for Bank of America and Abu Dhabi Commercial Bank, UAE. He has two decades experience in Capital Maket activites predominantly in fund management, private equity investments. He is the founding Chairman of Venutre Capital Association of India (VCAI).
Dr.T.S.Sridhar Director
Dr. T.S. Sridhar, M.A., Ph.D, aged 62 years, is a Retired IAS officer possessing over 35 years of diverse experience in all levels of administration at the Secretariat level including planning, execution and monitoring of various Government schemes. He has intimate knowledge in the field of Banking, Rural Economy, MSME, Small Savings, Industry & Finance and Agriculture & Co-operatives sector. Shri. Sridhar was appointed into the Board as Additional Director on 07th February 2018.
Shri.V.N.Shiva Shankar Director
Shri. Shiva Shankar, aged 47 years, is qualified as B.Com, ACS., AICWA and BL, with over 25 years of rich experience in the Indian corporate sector. He is also the founder of M/s. VNS Legal, corporate law firm based in Chennai, which focuses on legal advisory services on capital market regulations, takeover offers, compliance issues, corporate litigation etc. Shri. Shiva Shankar has an in depth understanding of Corporate Laws, Mergers, Capital Markets and allied subjects. Shri. Shiva Shankar was appointed into the Board as Additional Director on 07th February 2018
Source: Company, Nirmal Bang Institutional Equities Research
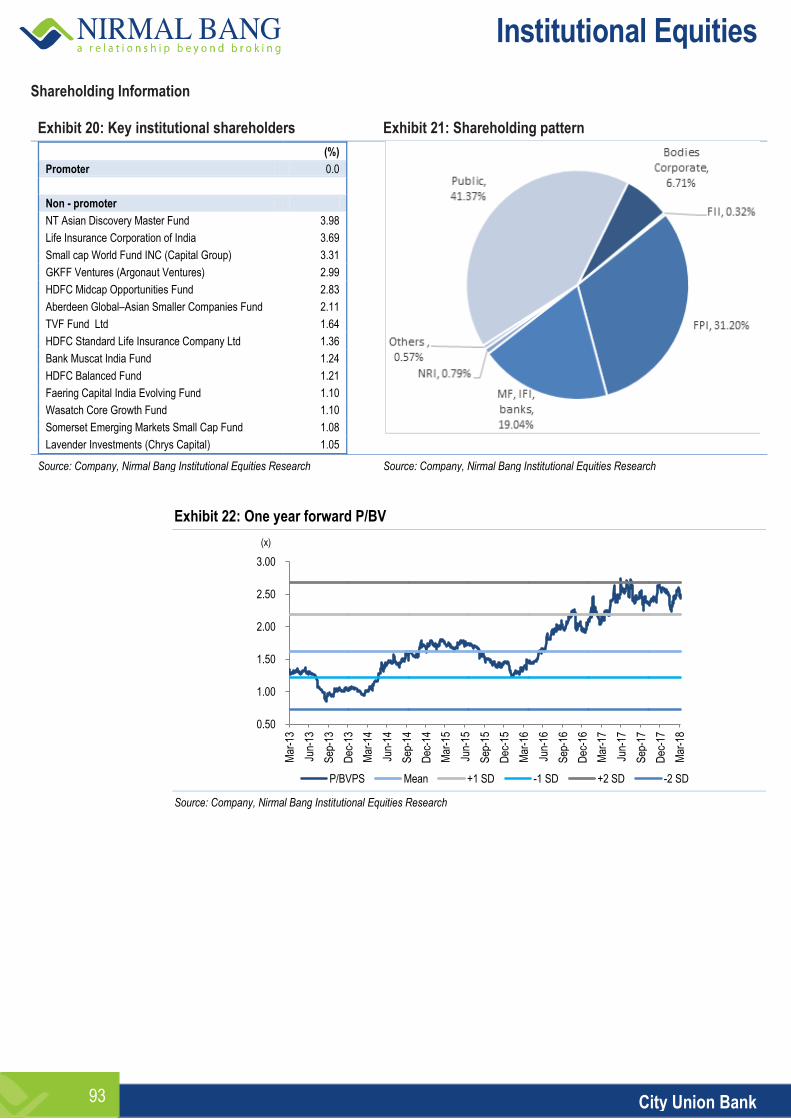
Institutional Equities
City Union Bank 93
Shareholding Information Exhibit 20: Key institutional shareholders Exhibit 21: Shareholding pattern
(%)
Promoter 0.0
Non - promoter
NT Asian Discovery Master Fund 3.98
Life Insurance Corporation of India 3.69
Small cap World Fund INC (Capital Group) 3.31
GKFF Ventures (Argonaut Ventures) 2.99
HDFC Midcap Opportunities Fund 2.83
Aberdeen Global–Asian Smaller Companies Fund 2.11
TVF Fund Ltd 1.64
HDFC Standard Life Insurance Company Ltd 1.36
Bank Muscat India Fund 1.24
HDFC Balanced Fund 1.21
Faering Capital India Evolving Fund 1.10
Wasatch Core Growth Fund 1.10
Somerset Emerging Markets Small Cap Fund 1.08
Lavender Investments (Chrys Capital) 1.05
Source: Company, Nirmal Bang Institutional Equities Research Source: Company, Nirmal Bang Institutional Equities Research
Exhibit 22: One year forward P/BV
Source: Company, Nirmal Bang Institutional Equities Research
0.50
1.00
1.50
2.00
2.50
3.00
Mar
-13
Jun-
13
Sep
-13
Dec
-13
Mar
-14
Jun-
14
Sep
-14
Dec
-14
Mar
-15
Jun-
15
Sep
-15
Dec
-15
Mar
-16
Jun-
16
Sep
-16
Dec
-16
Mar
-17
Jun-
17
Sep
-17
Dec
-17
Mar
-18
P/BVPS Mean +1 SD -1 SD +2 SD -2 SD
(x)
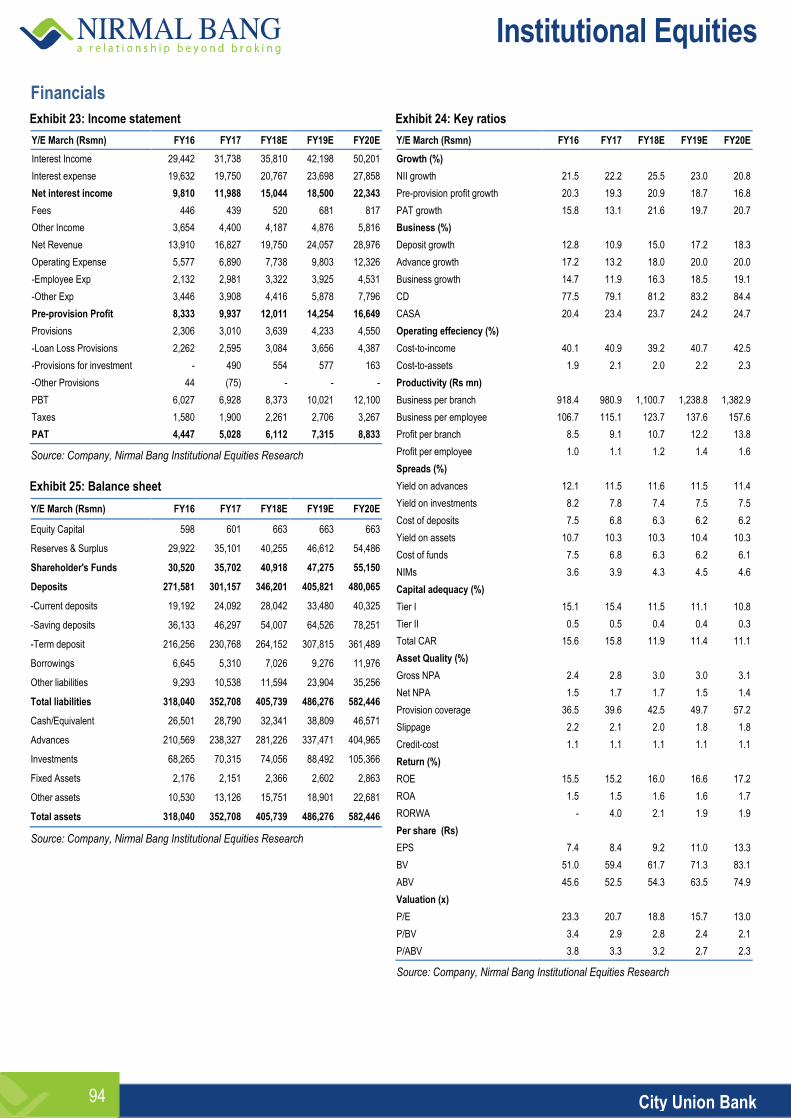
Institutional Equities
City Union Bank 94
Financials
Exhibit 23: Income statement
Y/E March (Rsmn) FY16 FY17 FY18E FY19E FY20E
Interest Income 29,442 31,738 35,810 42,198 50,201
Interest expense 19,632 19,750 20,767 23,698 27,858
Net interest income 9,810 11,988 15,044 18,500 22,343
Fees 446 439 520 681 817
Other Income 3,654 4,400 4,187 4,876 5,816
Net Revenue 13,910 16,827 19,750 24,057 28,976
Operating Expense 5,577 6,890 7,738 9,803 12,326
-Employee Exp 2,132 2,981 3,322 3,925 4,531
-Other Exp 3,446 3,908 4,416 5,878 7,796
Pre-provision Profit 8,333 9,937 12,011 14,254 16,649
Provisions 2,306 3,010 3,639 4,233 4,550
-Loan Loss Provisions 2,262 2,595 3,084 3,656 4,387
-Provisions for investment - 490 554 577 163
-Other Provisions 44 (75) - - -
PBT 6,027 6,928 8,373 10,021 12,100
Taxes 1,580 1,900 2,261 2,706 3,267
PAT 4,447 5,028 6,112 7,315 8,833
Source: Company, Nirmal Bang Institutional Equities Research
Exhibit 25: Balance sheet
Y/E March (Rsmn) FY16 FY17 FY18E FY19E FY20E
Equity Capital 598 601 663 663 663
Reserves & Surplus 29,922 35,101 40,255 46,612 54,486
Shareholder's Funds 30,520 35,702 40,918 47,275 55,150
Deposits 271,581 301,157 346,201 405,821 480,065
-Current deposits 19,192 24,092 28,042 33,480 40,325
-Saving deposits 36,133 46,297 54,007 64,526 78,251
-Term deposit 216,256 230,768 264,152 307,815 361,489
Borrowings 6,645 5,310 7,026 9,276 11,976
Other liabilities 9,293 10,538 11,594 23,904 35,256
Total liabilities 318,040 352,708 405,739 486,276 582,446
Cash/Equivalent 26,501 28,790 32,341 38,809 46,571
Advances 210,569 238,327 281,226 337,471 404,965
Investments 68,265 70,315 74,056 88,492 105,366
Fixed Assets 2,176 2,151 2,366 2,602 2,863
Other assets 10,530 13,126 15,751 18,901 22,681
Total assets 318,040 352,708 405,739 486,276 582,446
Source: Company, Nirmal Bang Institutional Equities Research
Exhibit 24: Key ratios
Y/E March (Rsmn) FY16 FY17 FY18E FY19E FY20E
Growth (%)
NII growth 21.5 22.2 25.5 23.0 20.8
Pre-provision profit growth 20.3 19.3 20.9 18.7 16.8
PAT growth 15.8 13.1 21.6 19.7 20.7
Business (%)
Deposit growth 12.8 10.9 15.0 17.2 18.3
Advance growth 17.2 13.2 18.0 20.0 20.0
Business growth 14.7 11.9 16.3 18.5 19.1
CD 77.5 79.1 81.2 83.2 84.4
CASA 20.4 23.4 23.7 24.2 24.7
Operating effeciency (%)
Cost-to-income 40.1 40.9 39.2 40.7 42.5
Cost-to-assets 1.9 2.1 2.0 2.2 2.3
Productivity (Rs mn)
Business per branch 918.4 980.9 1,100.7 1,238.8 1,382.9
Business per employee 106.7 115.1 123.7 137.6 157.6
Profit per branch 8.5 9.1 10.7 12.2 13.8
Profit per employee 1.0 1.1 1.2 1.4 1.6
Spreads (%)
Yield on advances 12.1 11.5 11.6 11.5 11.4
Yield on investments 8.2 7.8 7.4 7.5 7.5
Cost of deposits 7.5 6.8 6.3 6.2 6.2
Yield on assets 10.7 10.3 10.3 10.4 10.3
Cost of funds 7.5 6.8 6.3 6.2 6.1
NIMs 3.6 3.9 4.3 4.5 4.6
Capital adequacy (%)
Tier I 15.1 15.4 11.5 11.1 10.8
Tier II 0.5 0.5 0.4 0.4 0.3
Total CAR 15.6 15.8 11.9 11.4 11.1
Asset Quality (%)
Gross NPA 2.4 2.8 3.0 3.0 3.1
Net NPA 1.5 1.7 1.7 1.5 1.4
Provision coverage 36.5 39.6 42.5 49.7 57.2
Slippage 2.2 2.1 2.0 1.8 1.8
Credit-cost 1.1 1.1 1.1 1.1 1.1
Return (%)
ROE 15.5 15.2 16.0 16.6 17.2
ROA 1.5 1.5 1.6 1.6 1.7
RORWA - 4.0 2.1 1.9 1.9
Per share (Rs)
EPS 7.4 8.4 9.2 11.0 13.3
BV 51.0 59.4 61.7 71.3 83.1
ABV 45.6 52.5 54.3 63.5 74.9
Valuation (x)
P/E 23.3 20.7 18.8 15.7 13.0
P/BV 3.4 2.9 2.8 2.4 2.1
P/ABV 3.8 3.3 3.2 2.7 2.3
Source: Company, Nirmal Bang Institutional Equities Research
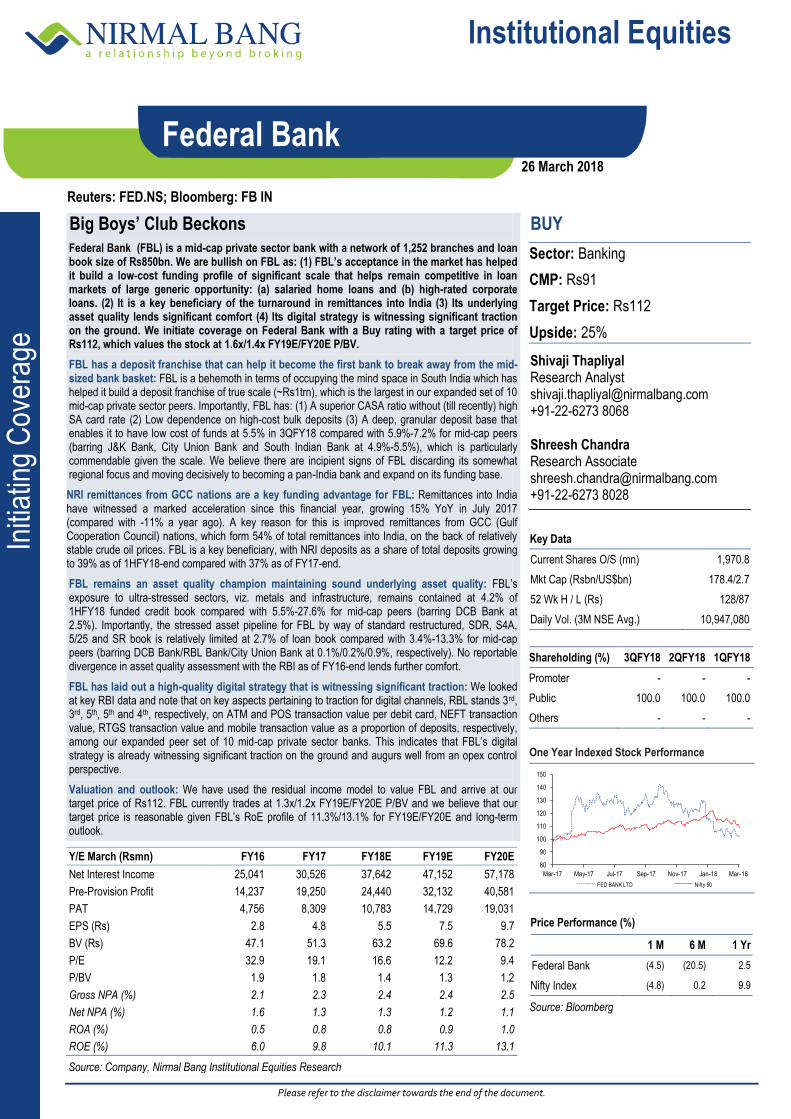
Please refer to the disclaimer towards the end of the document.
Institutional Equities
Initi
atin
g C
over
age
Reuters: FED.NS; Bloomberg: FB IN
Federal Bank
Big Boys’ Club Beckons
Federal Bank (FBL) is a mid-cap private sector bank with a network of 1,252 branches and loan book size of Rs850bn. We are bullish on FBL as: (1) FBL’s acceptance in the market has helped it build a low-cost funding profile of significant scale that helps remain competitive in loan markets of large generic opportunity: (a) salaried home loans and (b) high-rated corporate loans. (2) It is a key beneficiary of the turnaround in remittances into India (3) Its underlying asset quality lends significant comfort (4) Its digital strategy is witnessing significant traction on the ground. We initiate coverage on Federal Bank with a Buy rating with a target price of Rs112, which values the stock at 1.6x/1.4x FY19E/FY20E P/BV.
FBL has a deposit franchise that can help it become the first bank to break away from the mid-sized bank basket: FBL is a behemoth in terms of occupying the mind space in South India which has helped it build a deposit franchise of true scale (~Rs1trn), which is the largest in our expanded set of 10 mid-cap private sector peers. Importantly, FBL has: (1) A superior CASA ratio without (till recently) high SA card rate (2) Low dependence on high-cost bulk deposits (3) A deep, granular deposit base that enables it to have low cost of funds at 5.5% in 3QFY18 compared with 5.9%-7.2% for mid-cap peers (barring J&K Bank, City Union Bank and South Indian Bank at 4.9%-5.5%), which is particularly commendable given the scale. We believe there are incipient signs of FBL discarding its somewhat regional focus and moving decisively to becoming a pan-India bank and expand on its funding base.
NRI remittances from GCC nations are a key funding advantage for FBL: Remittances into India have witnessed a marked acceleration since this financial year, growing 15% YoY in July 2017 (compared with -11% a year ago). A key reason for this is improved remittances from GCC (Gulf Cooperation Council) nations, which form 54% of total remittances into India, on the back of relatively stable crude oil prices. FBL is a key beneficiary, with NRI deposits as a share of total deposits growing to 39% as of 1HFY18-end compared with 37% as of FY17-end.
FBL remains an asset quality champion maintaining sound underlying asset quality: FBL’s exposure to ultra-stressed sectors, viz. metals and infrastructure, remains contained at 4.2% of 1HFY18 funded credit book compared with 5.5%-27.6% for mid-cap peers (barring DCB Bank at 2.5%). Importantly, the stressed asset pipeline for FBL by way of standard restructured, SDR, S4A, 5/25 and SR book is relatively limited at 2.7% of loan book compared with 3.4%-13.3% for mid-cap peers (barring DCB Bank/RBL Bank/City Union Bank at 0.1%/0.2%/0.9%, respectively). No reportable divergence in asset quality assessment with the RBI as of FY16-end lends further comfort.
FBL has laid out a high-quality digital strategy that is witnessing significant traction: We looked at key RBI data and note that on key aspects pertaining to traction for digital channels, RBL stands 3rd, 3rd, 5th, 5th and 4th, respectively, on ATM and POS transaction value per debit card, NEFT transaction value, RTGS transaction value and mobile transaction value as a proportion of deposits, respectively, among our expanded peer set of 10 mid-cap private sector banks. This indicates that FBL’s digital strategy is already witnessing significant traction on the ground and augurs well from an opex control perspective.
Valuation and outlook: We have used the residual income model to value FBL and arrive at our target price of Rs112. FBL currently trades at 1.3x/1.2x FY19E/FY20E P/BV and we believe that our target price is reasonable given FBL’s RoE profile of 11.3%/13.1% for FY19E/FY20E and long-term outlook.
BUY
Sector: Banking
CMP: Rs91
Target Price: Rs112
Upside: 25%
Shivaji Thapliyal Research Analyst [email protected] +91-22-6273 8068 Shreesh Chandra Research Associate [email protected] +91-22-6273 8028
Key Data
Current Shares O/S (mn) 1,970.8
Mkt Cap (Rsbn/US$bn) 178.4/2.7
52 Wk H / L (Rs) 128/87
Daily Vol. (3M NSE Avg.) 10,947,080
Shareholding (%) 3QFY18 2QFY18 1QFY18
Promoter - - -
Public 100.0 100.0 100.0
Others - - -
One Year Indexed Stock Performance
Price Performance (%)
1 M 6 M 1 Yr
Federal Bank (4.5) (20.5) 2.5
Nifty Index (4.8) 0.2 9.9
Source: Bloomberg
Y/E March (Rsmn) FY16 FY17 FY18E FY19E FY20E
Net Interest Income 25,041 30,526 37,642 47,152 57,178
Pre-Provision Profit 14,237 19,250 24,440 32,132 40,581
PAT 4,756 8,309 10,783 14,729 19,031
EPS (Rs) 2.8 4.8 5.5 7.5 9.7
BV (Rs) 47.1 51.3 63.2 69.6 78.2
P/E 32.9 19.1 16.6 12.2 9.4
P/BV 1.9 1.8 1.4 1.3 1.2
Gross NPA (%) 2.1 2.3 2.4 2.4 2.5
Net NPA (%) 1.6 1.3 1.3 1.2 1.1
ROA (%) 0.5 0.8 0.8 0.9 1.0
ROE (%) 6.0 9.8 10.1 11.3 13.1
Source: Company, Nirmal Bang Institutional Equities Research
80
90
100
110
120
130
140
150
Mar-17 May-17 Jul-17 Sep-17 Nov-17 Jan-18 Mar-18
FED BANK LTD Nifty 50
26 March 2018
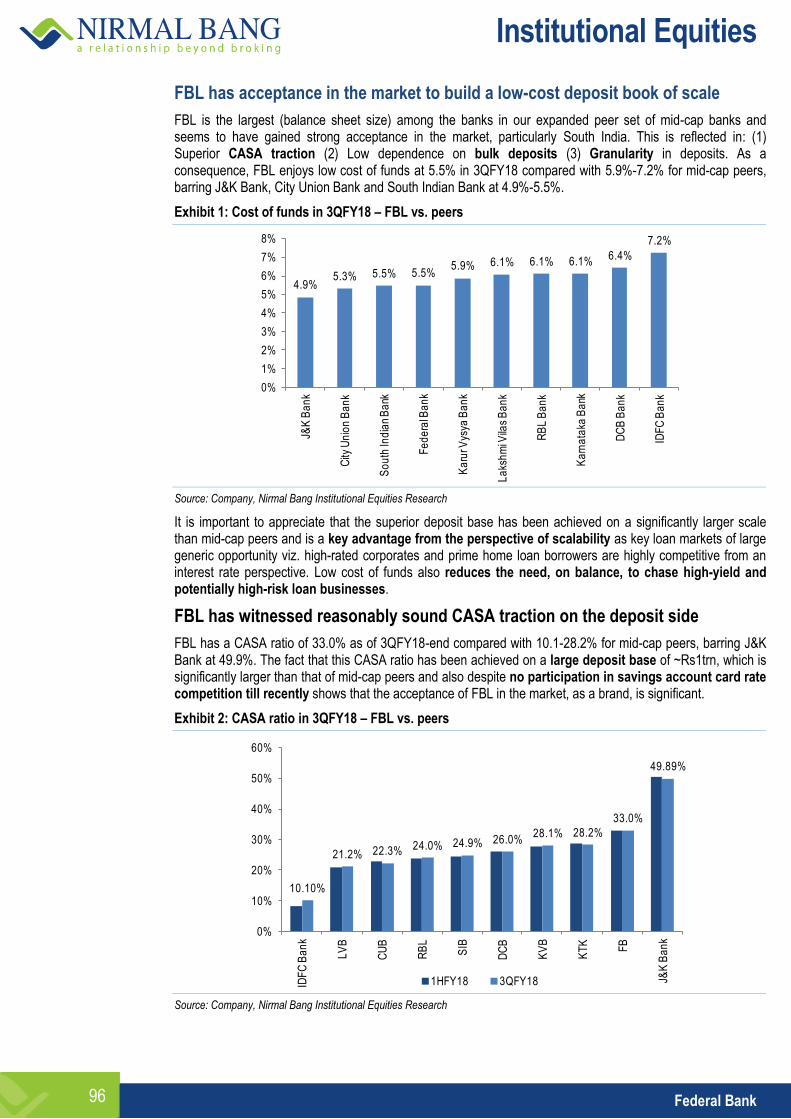
Institutional Equities
Federal Bank 96
FBL has acceptance in the market to build a low-cost deposit book of scale
FBL is the largest (balance sheet size) among the banks in our expanded peer set of mid-cap banks and seems to have gained strong acceptance in the market, particularly South India. This is reflected in: (1) Superior CASA traction (2) Low dependence on bulk deposits (3) Granularity in deposits. As a consequence, FBL enjoys low cost of funds at 5.5% in 3QFY18 compared with 5.9%-7.2% for mid-cap peers, barring J&K Bank, City Union Bank and South Indian Bank at 4.9%-5.5%.
Exhibit 1: Cost of funds in 3QFY18 – FBL vs. peers
Source: Company, Nirmal Bang Institutional Equities Research
It is important to appreciate that the superior deposit base has been achieved on a significantly larger scale than mid-cap peers and is a key advantage from the perspective of scalability as key loan markets of large generic opportunity viz. high-rated corporates and prime home loan borrowers are highly competitive from an interest rate perspective. Low cost of funds also reduces the need, on balance, to chase high-yield and potentially high-risk loan businesses.
FBL has witnessed reasonably sound CASA traction on the deposit side
FBL has a CASA ratio of 33.0% as of 3QFY18-end compared with 10.1-28.2% for mid-cap peers, barring J&K Bank at 49.9%. The fact that this CASA ratio has been achieved on a large deposit base of ~Rs1trn, which is significantly larger than that of mid-cap peers and also despite no participation in savings account card rate competition till recently shows that the acceptance of FBL in the market, as a brand, is significant.
Exhibit 2: CASA ratio in 3QFY18 – FBL vs. peers
Source: Company, Nirmal Bang Institutional Equities Research
4.9%5.3% 5.5% 5.5%
5.9% 6.1% 6.1% 6.1%6.4%
7.2%
0%
1%
2%
3%
4%
5%
6%
7%
8%
J&K
Ba
nk
City
Un
ion
Ba
nk
So
uth
Ind
ian
Ba
nk
Fe
de
ral B
an
k
Ka
rur V
ysya
Ba
nk
La
ksh
mi V
ilas
Ba
nk
RB
L B
an
k
Ka
rna
taka
Ba
nk
DC
B B
an
k
IDF
C B
an
k
10.10%
21.2% 22.3% 24.0% 24.9% 26.0%28.1% 28.2%
33.0%
49.89%
0%
10%
20%
30%
40%
50%
60%
IDF
C B
an
k
LV
B
CU
B
RB
L
SIB
DC
B
KV
B
KT
K
FB
J&K
Ba
nk
1HFY18 3QFY18
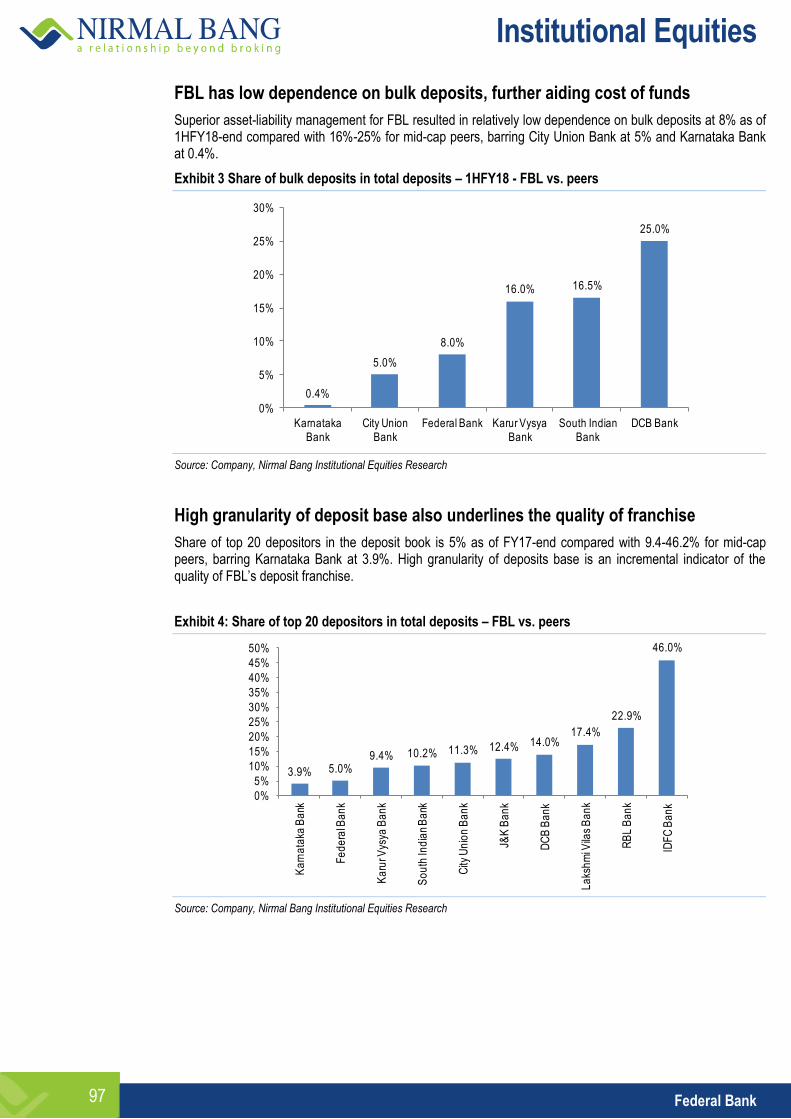
Institutional Equities
Federal Bank 97
FBL has low dependence on bulk deposits, further aiding cost of funds
Superior asset-liability management for FBL resulted in relatively low dependence on bulk deposits at 8% as of 1HFY18-end compared with 16%-25% for mid-cap peers, barring City Union Bank at 5% and Karnataka Bank at 0.4%.
Exhibit 3 Share of bulk deposits in total deposits – 1HFY18 - FBL vs. peers
Source: Company, Nirmal Bang Institutional Equities Research
High granularity of deposit base also underlines the quality of franchise
Share of top 20 depositors in the deposit book is 5% as of FY17-end compared with 9.4-46.2% for mid-cap peers, barring Karnataka Bank at 3.9%. High granularity of deposits base is an incremental indicator of the quality of FBL’s deposit franchise.
Exhibit 4: Share of top 20 depositors in total deposits – FBL vs. peers
Source: Company, Nirmal Bang Institutional Equities Research
0.4%
5.0%
8.0%
16.0% 16.5%
25.0%
0%
5%
10%
15%
20%
25%
30%
Karnataka Bank
City Union Bank
Federal Bank Karur Vysya Bank
South Indian Bank
DCB Bank
3.9% 5.0%9.4% 10.2% 11.3% 12.4% 14.0%
17.4%
22.9%
46.0%
0%
5%
10%
15%
20%
25%
30%
35%
40%
45%
50%
Ka
rna
taka
Ba
nk
Fe
de
ral B
an
k
Ka
rur V
ysya
Ba
nk
So
uth
Ind
ian
Ba
nk
City
Un
ion
Ba
nk
J&K
Ba
nk
DC
B B
an
k
La
ksh
mi V
ilas
Ba
nk
RB
L B
an
k
IDF
C B
an
k
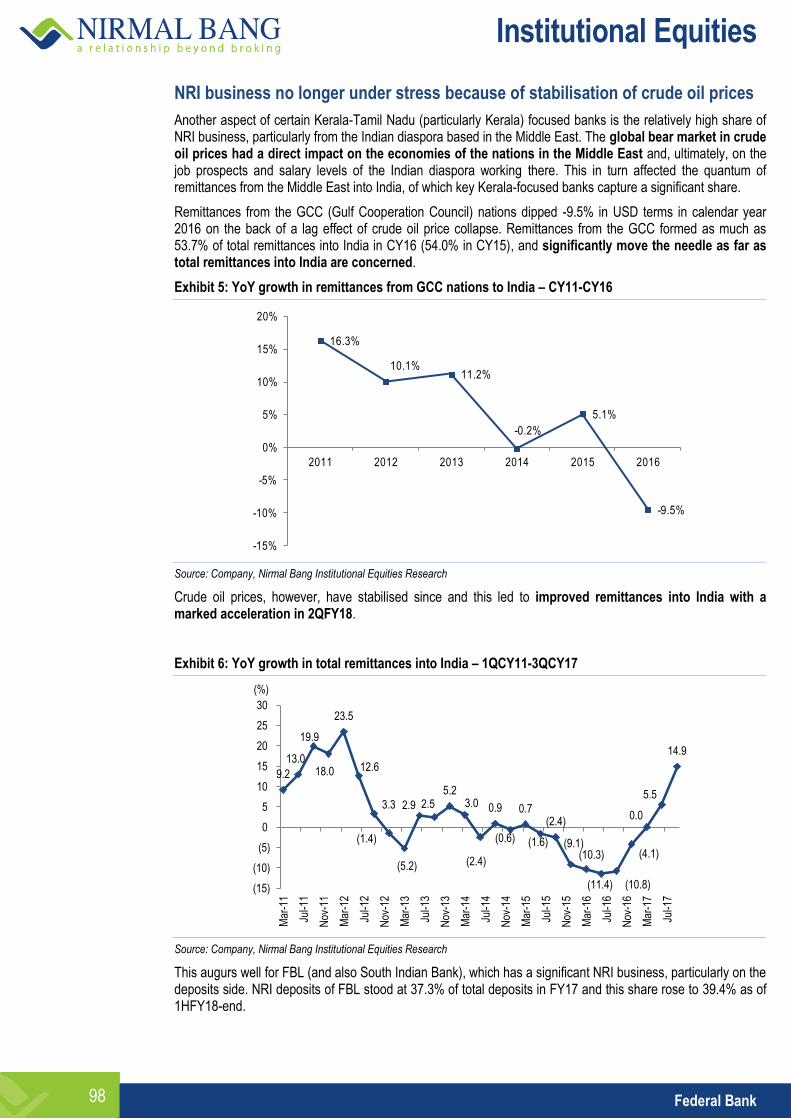
Institutional Equities
Federal Bank 98
NRI business no longer under stress because of stabilisation of crude oil prices
Another aspect of certain Kerala-Tamil Nadu (particularly Kerala) focused banks is the relatively high share of NRI business, particularly from the Indian diaspora based in the Middle East. The global bear market in crude oil prices had a direct impact on the economies of the nations in the Middle East and, ultimately, on the job prospects and salary levels of the Indian diaspora working there. This in turn affected the quantum of remittances from the Middle East into India, of which key Kerala-focused banks capture a significant share.
Remittances from the GCC (Gulf Cooperation Council) nations dipped -9.5% in USD terms in calendar year 2016 on the back of a lag effect of crude oil price collapse. Remittances from the GCC formed as much as 53.7% of total remittances into India in CY16 (54.0% in CY15), and significantly move the needle as far as total remittances into India are concerned.
Exhibit 5: YoY growth in remittances from GCC nations to India – CY11-CY16
Source: Company, Nirmal Bang Institutional Equities Research
Crude oil prices, however, have stabilised since and this led to improved remittances into India with a marked acceleration in 2QFY18.
Exhibit 6: YoY growth in total remittances into India – 1QCY11-3QCY17
Source: Company, Nirmal Bang Institutional Equities Research
This augurs well for FBL (and also South Indian Bank), which has a significant NRI business, particularly on the deposits side. NRI deposits of FBL stood at 37.3% of total deposits in FY17 and this share rose to 39.4% as of 1HFY18-end.
16.3%
10.1%11.2%
-0.2%
5.1%
-9.5%
-15%
-10%
-5%
0%
5%
10%
15%
20%
2011 2012 2013 2014 2015 2016
9.2
13.0
19.9
18.0
23.5
12.6
3.3
(1.4)
(5.2)
2.9 2.5 5.2
3.0
(2.4)
0.9
(0.6)
0.7
(1.6)
(2.4)
(9.1) (10.3)
(11.4) (10.8)
(4.1)
0.0
5.5
14.9
(15)
(10)
(5)
0
5
10
15
20
25
30
Mar
-11
Jul-1
1
Nov
-11
Mar
-12
Jul-1
2
Nov
-12
Mar
-13
Jul-1
3
Nov
-13
Mar
-14
Jul-1
4
Nov
-14
Mar
-15
Jul-1
5
Nov
-15
Mar
-16
Jul-1
6
Nov
-16
Mar
-17
Jul-1
7
(%)
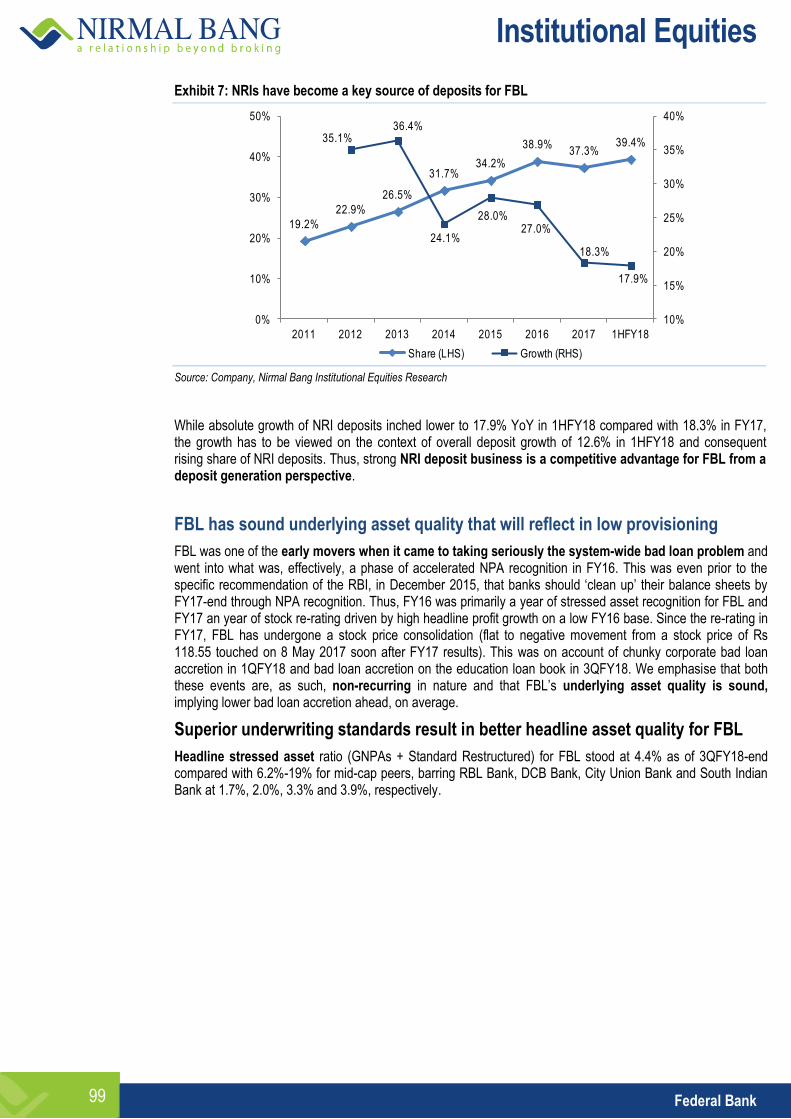
Institutional Equities
Federal Bank 99
Exhibit 7: NRIs have become a key source of deposits for FBL
Source: Company, Nirmal Bang Institutional Equities Research
While absolute growth of NRI deposits inched lower to 17.9% YoY in 1HFY18 compared with 18.3% in FY17, the growth has to be viewed on the context of overall deposit growth of 12.6% in 1HFY18 and consequent rising share of NRI deposits. Thus, strong NRI deposit business is a competitive advantage for FBL from a deposit generation perspective.
FBL has sound underlying asset quality that will reflect in low provisioning
FBL was one of the early movers when it came to taking seriously the system-wide bad loan problem and went into what was, effectively, a phase of accelerated NPA recognition in FY16. This was even prior to the specific recommendation of the RBI, in December 2015, that banks should ‘clean up’ their balance sheets by FY17-end through NPA recognition. Thus, FY16 was primarily a year of stressed asset recognition for FBL and FY17 an year of stock re-rating driven by high headline profit growth on a low FY16 base. Since the re-rating in FY17, FBL has undergone a stock price consolidation (flat to negative movement from a stock price of Rs 118.55 touched on 8 May 2017 soon after FY17 results). This was on account of chunky corporate bad loan accretion in 1QFY18 and bad loan accretion on the education loan book in 3QFY18. We emphasise that both these events are, as such, non-recurring in nature and that FBL’s underlying asset quality is sound, implying lower bad loan accretion ahead, on average.
Superior underwriting standards result in better headline asset quality for FBL
Headline stressed asset ratio (GNPAs + Standard Restructured) for FBL stood at 4.4% as of 3QFY18-end compared with 6.2%-19% for mid-cap peers, barring RBL Bank, DCB Bank, City Union Bank and South Indian Bank at 1.7%, 2.0%, 3.3% and 3.9%, respectively.
19.2%
22.9%
26.5%
31.7%34.2%
38.9%37.3%
39.4%35.1%36.4%
24.1%
28.0%27.0%
18.3%
17.9%
10%
15%
20%
25%
30%
35%
40%
0%
10%
20%
30%
40%
50%
2011 2012 2013 2014 2015 2016 2017 1HFY18
Share (LHS) Growth (RHS)
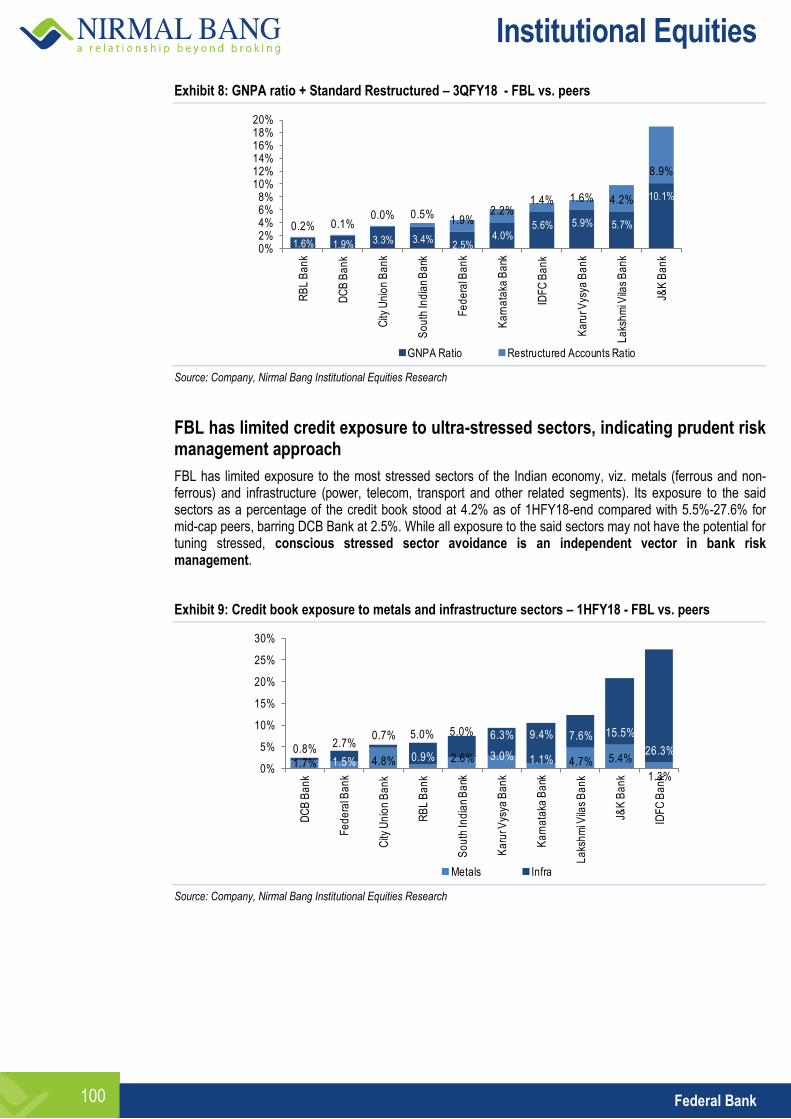
Institutional Equities
Federal Bank 100
Exhibit 8: GNPA ratio + Standard Restructured – 3QFY18 - FBL vs. peers
Source: Company, Nirmal Bang Institutional Equities Research
FBL has limited credit exposure to ultra-stressed sectors, indicating prudent risk management approach
FBL has limited exposure to the most stressed sectors of the Indian economy, viz. metals (ferrous and non-ferrous) and infrastructure (power, telecom, transport and other related segments). Its exposure to the said sectors as a percentage of the credit book stood at 4.2% as of 1HFY18-end compared with 5.5%-27.6% for mid-cap peers, barring DCB Bank at 2.5%. While all exposure to the said sectors may not have the potential for tuning stressed, conscious stressed sector avoidance is an independent vector in bank risk management.
Exhibit 9: Credit book exposure to metals and infrastructure sectors – 1HFY18 - FBL vs. peers
Source: Company, Nirmal Bang Institutional Equities Research
1.6% 1.9% 3.3% 3.4%2.5%
4.0%5.6% 5.9% 5.7%
10.1%
0.2% 0.1%0.0% 0.5%
1.9%2.2%
1.4% 1.6% 4.2%
8.9%
0%2%4%6%8%
10%12%14%16%18%20%
RB
L B
an
k
DC
B B
an
k
City
Un
ion
Ba
nk
So
uth
Ind
ian
Ba
nk
Fe
de
ral B
an
k
Ka
rna
taka
Ba
nk
IDF
C B
an
k
Ka
rur V
ysya
Ba
nk
La
ksh
mi V
ilas
Ba
nk
J&K
Ba
nk
GNPA Ratio Restructured Accounts Ratio
1.7% 1.5% 4.8% 0.9% 2.6% 3.0% 1.1% 4.7% 5.4%
1.3%
0.8%2.7%
0.7% 5.0% 5.0% 6.3% 9.4% 7.6% 15.5%
26.3%
0%
5%
10%
15%
20%
25%
30%
DC
B B
an
k
Fe
de
ral B
an
k
City
Un
ion
Ba
nk
RB
L B
an
k
So
uth
Ind
ian
Ba
nk
Ka
rur V
ysya
Ba
nk
Ka
rna
taka
Ba
nk
La
ksh
mi V
ilas
Ba
nk
J&K
Ba
nk
IDF
C B
an
k
Metals Infra
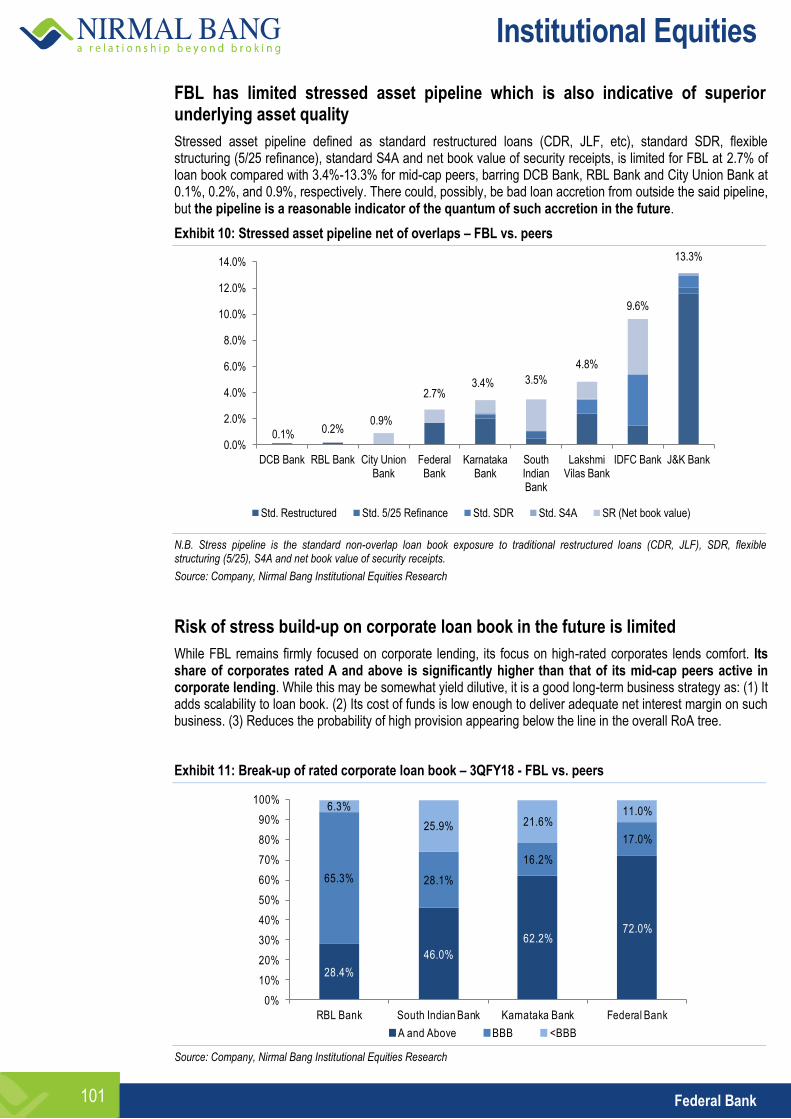
Institutional Equities
Federal Bank 101
FBL has limited stressed asset pipeline which is also indicative of superior underlying asset quality
Stressed asset pipeline defined as standard restructured loans (CDR, JLF, etc), standard SDR, flexible structuring (5/25 refinance), standard S4A and net book value of security receipts, is limited for FBL at 2.7% of loan book compared with 3.4%-13.3% for mid-cap peers, barring DCB Bank, RBL Bank and City Union Bank at 0.1%, 0.2%, and 0.9%, respectively. There could, possibly, be bad loan accretion from outside the said pipeline, but the pipeline is a reasonable indicator of the quantum of such accretion in the future.
Exhibit 10: Stressed asset pipeline net of overlaps – FBL vs. peers
N.B. Stress pipeline is the standard non-overlap loan book exposure to traditional restructured loans (CDR, JLF), SDR, flexible structuring (5/25), S4A and net book value of security receipts.
Source: Company, Nirmal Bang Institutional Equities Research
Risk of stress build-up on corporate loan book in the future is limited
While FBL remains firmly focused on corporate lending, its focus on high-rated corporates lends comfort. Its share of corporates rated A and above is significantly higher than that of its mid-cap peers active in corporate lending. While this may be somewhat yield dilutive, it is a good long-term business strategy as: (1) It adds scalability to loan book. (2) Its cost of funds is low enough to deliver adequate net interest margin on such business. (3) Reduces the probability of high provision appearing below the line in the overall RoA tree.
Exhibit 11: Break-up of rated corporate loan book – 3QFY18 - FBL vs. peers
Source: Company, Nirmal Bang Institutional Equities Research
0.1% 0.2% 0.9%
2.7% 3.4% 3.5%
4.8%
9.6%
13.3%
0.0%
2.0%
4.0%
6.0%
8.0%
10.0%
12.0%
14.0%
DCB Bank RBL Bank City Union Bank
Federal Bank
Karnataka Bank
South Indian Bank
Lakshmi Vilas Bank
IDFC Bank J&K Bank
Std. Restructured Std. 5/25 Refinance Std. SDR Std. S4A SR (Net book value)
28.4%
46.0%
62.2%72.0%
65.3% 28.1%
16.2%
17.0%
6.3%
25.9% 21.6%11.0%
0%
10%
20%
30%
40%
50%
60%
70%
80%
90%
100%
RBL Bank South Indian Bank Karnataka Bank Federal Bank
A and Above BBB <BBB
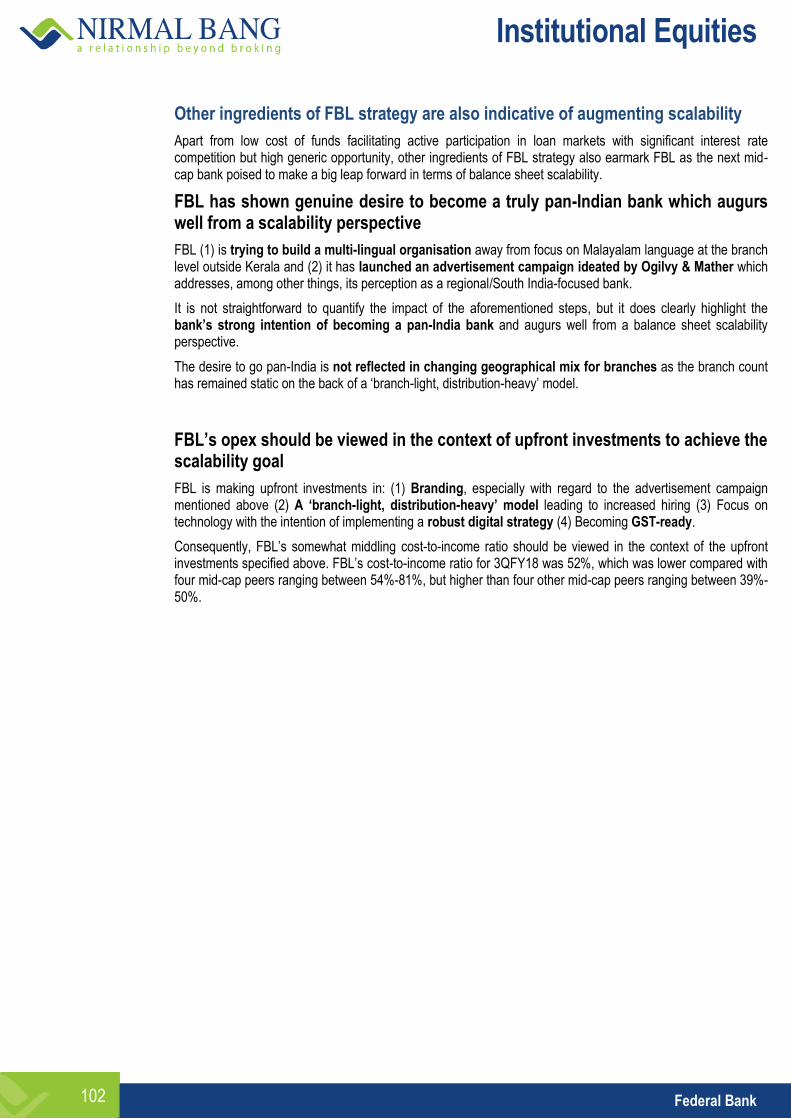
Institutional Equities
Federal Bank 102
Other ingredients of FBL strategy are also indicative of augmenting scalability
Apart from low cost of funds facilitating active participation in loan markets with significant interest rate competition but high generic opportunity, other ingredients of FBL strategy also earmark FBL as the next mid-cap bank poised to make a big leap forward in terms of balance sheet scalability.
FBL has shown genuine desire to become a truly pan-Indian bank which augurs well from a scalability perspective
FBL (1) is trying to build a multi-lingual organisation away from focus on Malayalam language at the branch level outside Kerala and (2) it has launched an advertisement campaign ideated by Ogilvy & Mather which addresses, among other things, its perception as a regional/South India-focused bank.
It is not straightforward to quantify the impact of the aforementioned steps, but it does clearly highlight the bank’s strong intention of becoming a pan-India bank and augurs well from a balance sheet scalability perspective.
The desire to go pan-India is not reflected in changing geographical mix for branches as the branch count has remained static on the back of a ‘branch-light, distribution-heavy’ model.
FBL’s opex should be viewed in the context of upfront investments to achieve the scalability goal
FBL is making upfront investments in: (1) Branding, especially with regard to the advertisement campaign mentioned above (2) A ‘branch-light, distribution-heavy’ model leading to increased hiring (3) Focus on technology with the intention of implementing a robust digital strategy (4) Becoming GST-ready.
Consequently, FBL’s somewhat middling cost-to-income ratio should be viewed in the context of the upfront investments specified above. FBL’s cost-to-income ratio for 3QFY18 was 52%, which was lower compared with four mid-cap peers ranging between 54%-81%, but higher than four other mid-cap peers ranging between 39%-50%.
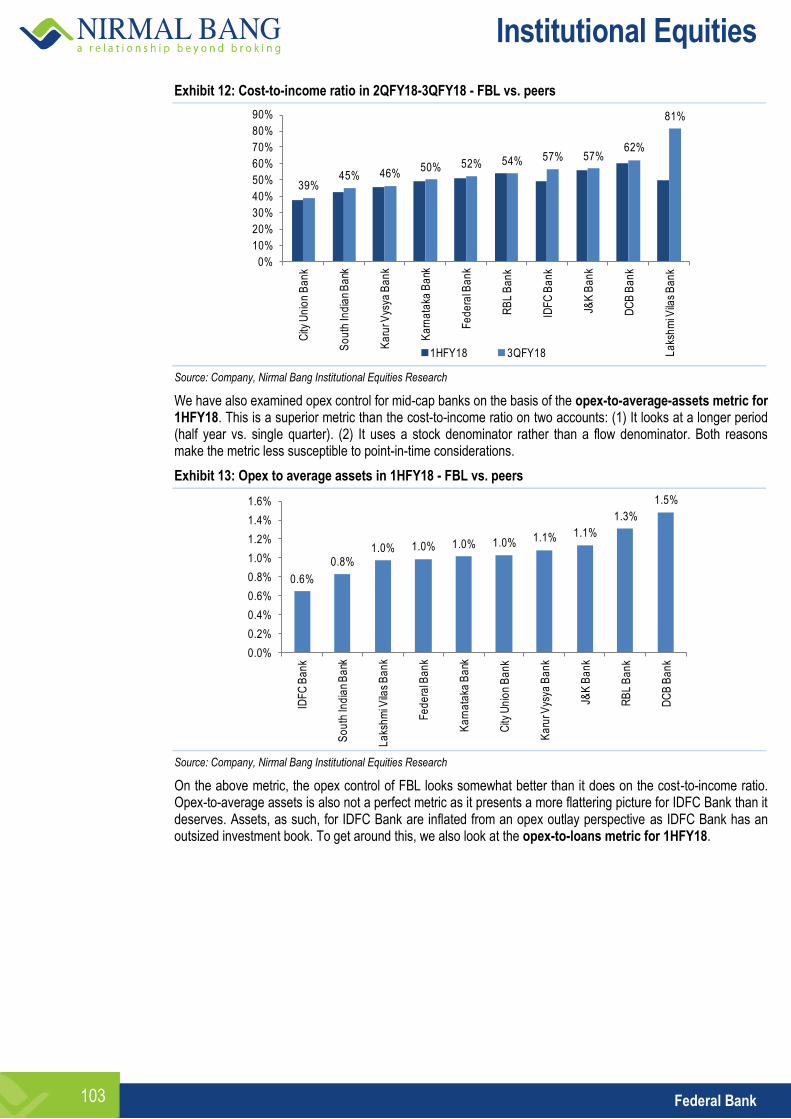
Institutional Equities
Federal Bank 103
Exhibit 12: Cost-to-income ratio in 2QFY18-3QFY18 - FBL vs. peers
Source: Company, Nirmal Bang Institutional Equities Research
We have also examined opex control for mid-cap banks on the basis of the opex-to-average-assets metric for 1HFY18. This is a superior metric than the cost-to-income ratio on two accounts: (1) It looks at a longer period (half year vs. single quarter). (2) It uses a stock denominator rather than a flow denominator. Both reasons make the metric less susceptible to point-in-time considerations.
Exhibit 13: Opex to average assets in 1HFY18 - FBL vs. peers
Source: Company, Nirmal Bang Institutional Equities Research
On the above metric, the opex control of FBL looks somewhat better than it does on the cost-to-income ratio. Opex-to-average assets is also not a perfect metric as it presents a more flattering picture for IDFC Bank than it deserves. Assets, as such, for IDFC Bank are inflated from an opex outlay perspective as IDFC Bank has an outsized investment book. To get around this, we also look at the opex-to-loans metric for 1HFY18.
39%45% 46%
50% 52% 54% 57% 57%62%
81%
0%
10%
20%
30%
40%
50%
60%
70%
80%
90%
City
Un
ion
Ba
nk
So
uth
Ind
ian
Ba
nk
Ka
rur V
ysya
Ba
nk
Ka
rna
taka
Ba
nk
Fe
de
ral B
an
k
RB
L B
an
k
IDF
C B
an
k
J&K
Ba
nk
DC
B B
an
k
La
ksh
mi V
ilas
Ba
nk
1HFY18 3QFY18
0.6%
0.8%1.0% 1.0% 1.0% 1.0% 1.1% 1.1%
1.3%
1.5%
0.0%
0.2%
0.4%
0.6%
0.8%
1.0%
1.2%
1.4%
1.6%
IDF
C B
an
k
So
uth
Ind
ian
Ba
nk
La
ksh
mi V
ilas
Ba
nk
Fe
de
ral B
an
k
Ka
rna
taka
Ba
nk
City
Un
ion
Ba
nk
Ka
rur V
ysya
Ba
nk
J&K
Ba
nk
RB
L B
an
k
DC
B B
an
k
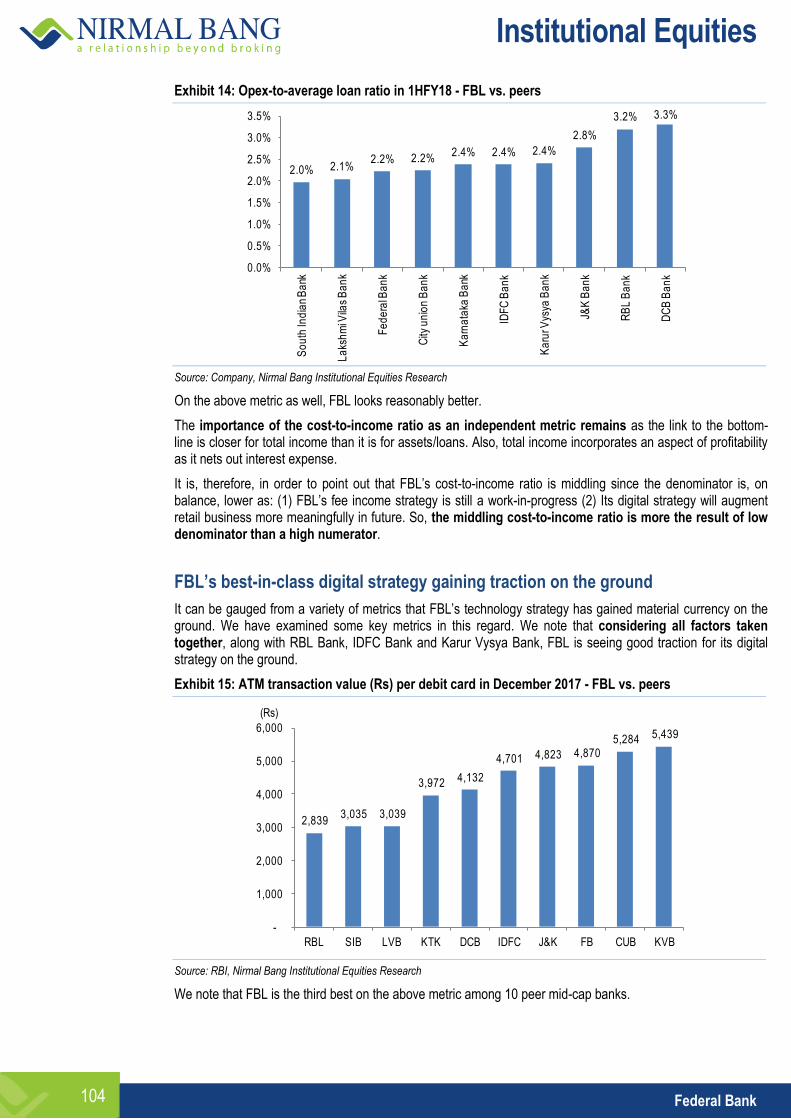
Institutional Equities
Federal Bank 104
Exhibit 14: Opex-to-average loan ratio in 1HFY18 - FBL vs. peers
Source: Company, Nirmal Bang Institutional Equities Research
On the above metric as well, FBL looks reasonably better.
The importance of the cost-to-income ratio as an independent metric remains as the link to the bottom-line is closer for total income than it is for assets/loans. Also, total income incorporates an aspect of profitability as it nets out interest expense.
It is, therefore, in order to point out that FBL’s cost-to-income ratio is middling since the denominator is, on balance, lower as: (1) FBL’s fee income strategy is still a work-in-progress (2) Its digital strategy will augment retail business more meaningfully in future. So, the middling cost-to-income ratio is more the result of low denominator than a high numerator.
FBL’s best-in-class digital strategy gaining traction on the ground
It can be gauged from a variety of metrics that FBL’s technology strategy has gained material currency on the ground. We have examined some key metrics in this regard. We note that considering all factors taken together, along with RBL Bank, IDFC Bank and Karur Vysya Bank, FBL is seeing good traction for its digital strategy on the ground.
Exhibit 15: ATM transaction value (Rs) per debit card in December 2017 - FBL vs. peers
Source: RBI, Nirmal Bang Institutional Equities Research
We note that FBL is the third best on the above metric among 10 peer mid-cap banks.
2.0% 2.1%2.2% 2.2%
2.4% 2.4% 2.4%
2.8%
3.2% 3.3%
0.0%
0.5%
1.0%
1.5%
2.0%
2.5%
3.0%
3.5%
So
uth
Ind
ian
Ba
nk
La
ksh
mi V
ilas
Ba
nk
Fe
de
ral B
an
k
City
un
ion
Ba
nk
Ka
rna
taka
Ba
nk
IDF
C B
an
k
Ka
rur V
ysya
Ba
nk
J&K
Ba
nk
RB
L B
an
k
DC
B B
an
k
2,839 3,035 3,039
3,972 4,132
4,701 4,823 4,870 5,284 5,439
-
1,000
2,000
3,000
4,000
5,000
6,000
RBL SIB LVB KTK DCB IDFC J&K FB CUB KVB
(Rs)
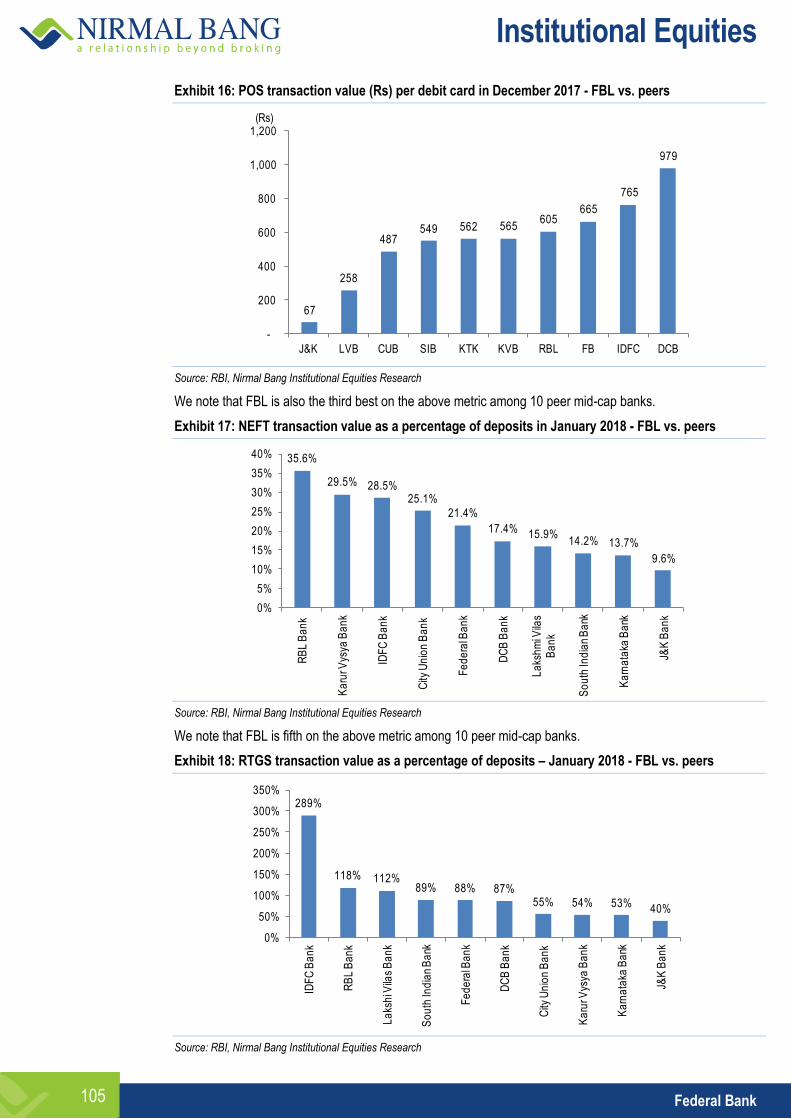
Institutional Equities
Federal Bank 105
Exhibit 16: POS transaction value (Rs) per debit card in December 2017 - FBL vs. peers
Source: RBI, Nirmal Bang Institutional Equities Research
We note that FBL is also the third best on the above metric among 10 peer mid-cap banks.
Exhibit 17: NEFT transaction value as a percentage of deposits in January 2018 - FBL vs. peers
Source: RBI, Nirmal Bang Institutional Equities Research
We note that FBL is fifth on the above metric among 10 peer mid-cap banks.
Exhibit 18: RTGS transaction value as a percentage of deposits – January 2018 - FBL vs. peers
Source: RBI, Nirmal Bang Institutional Equities Research
67
258
487549 562 565
605665
765
979
-
200
400
600
800
1,000
1,200
J&K LVB CUB SIB KTK KVB RBL FB IDFC DCB
(Rs)
35.6%
29.5% 28.5%25.1%
21.4%
17.4% 15.9%14.2% 13.7%
9.6%
0%
5%
10%
15%
20%
25%
30%
35%
40%
RB
L B
an
k
Ka
rur V
ysya
Ba
nk
IDF
C B
an
k
City
Un
ion
Ba
nk
Fe
de
ral B
an
k
DC
B B
an
k
La
ksh
mi V
ilas
Ba
nk
So
uth
Ind
ian
Ba
nk
Ka
rna
taka
Ba
nk
J&K
Ba
nk
289%
118% 112%89% 88% 87%
55% 54% 53% 40%
0%
50%
100%
150%
200%
250%
300%
350%
IDF
C B
an
k
RB
L B
an
k
La
ksh
i Vila
s B
an
k
So
uth
Ind
ian
Ba
nk
Fe
de
ral B
an
k
DC
B B
an
k
City
Un
ion
Ba
nk
Ka
rur V
ysya
Ba
nk
Ka
rna
taka
Ba
nk
J&K
Ba
nk
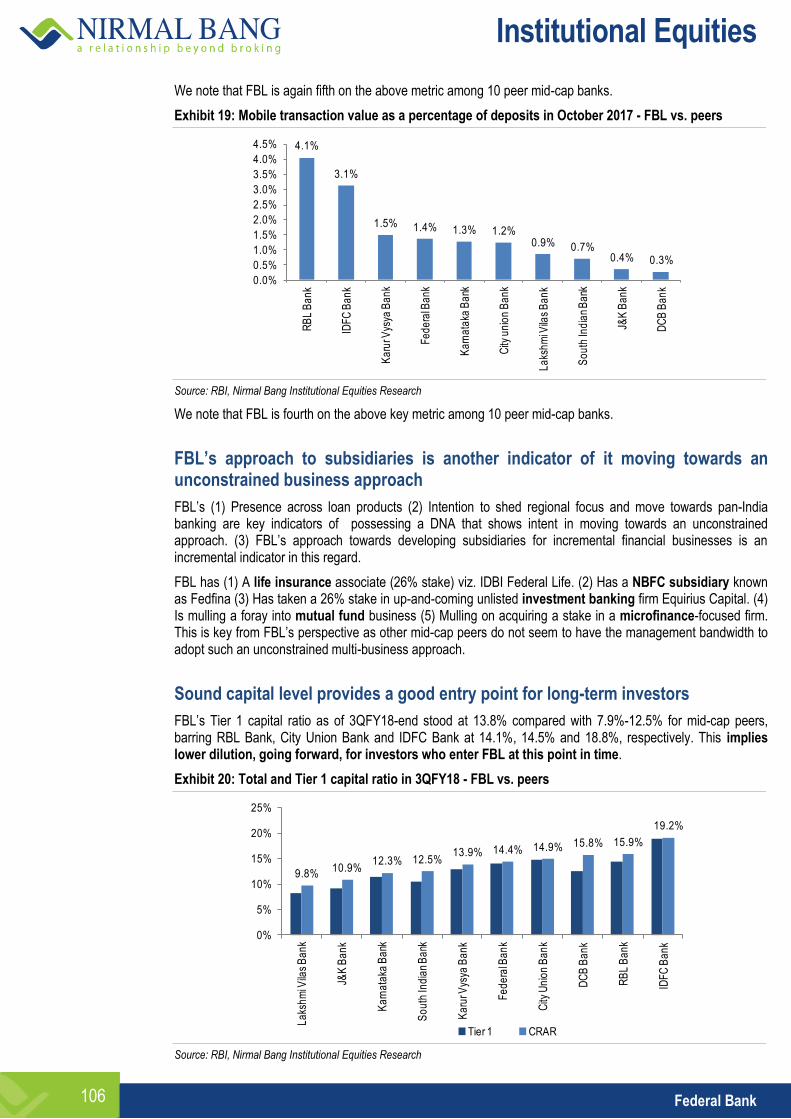
Institutional Equities
Federal Bank 106
We note that FBL is again fifth on the above metric among 10 peer mid-cap banks.
Exhibit 19: Mobile transaction value as a percentage of deposits in October 2017 - FBL vs. peers
Source: RBI, Nirmal Bang Institutional Equities Research
We note that FBL is fourth on the above key metric among 10 peer mid-cap banks.
FBL’s approach to subsidiaries is another indicator of it moving towards an unconstrained business approach
FBL’s (1) Presence across loan products (2) Intention to shed regional focus and move towards pan-India banking are key indicators of possessing a DNA that shows intent in moving towards an unconstrained approach. (3) FBL’s approach towards developing subsidiaries for incremental financial businesses is an incremental indicator in this regard.
FBL has (1) A life insurance associate (26% stake) viz. IDBI Federal Life. (2) Has a NBFC subsidiary known as Fedfina (3) Has taken a 26% stake in up-and-coming unlisted investment banking firm Equirius Capital. (4) Is mulling a foray into mutual fund business (5) Mulling on acquiring a stake in a microfinance-focused firm. This is key from FBL’s perspective as other mid-cap peers do not seem to have the management bandwidth to adopt such an unconstrained multi-business approach.
Sound capital level provides a good entry point for long-term investors
FBL’s Tier 1 capital ratio as of 3QFY18-end stood at 13.8% compared with 7.9%-12.5% for mid-cap peers, barring RBL Bank, City Union Bank and IDFC Bank at 14.1%, 14.5% and 18.8%, respectively. This implies lower dilution, going forward, for investors who enter FBL at this point in time.
Exhibit 20: Total and Tier 1 capital ratio in 3QFY18 - FBL vs. peers
Source: RBI, Nirmal Bang Institutional Equities Research
4.1%
3.1%
1.5% 1.4% 1.3% 1.2%0.9% 0.7%
0.4% 0.3%
0.0%
0.5%
1.0%
1.5%
2.0%
2.5%
3.0%
3.5%
4.0%
4.5%
RB
L B
an
k
IDF
C B
an
k
Ka
rur V
ysya
Ba
nk
Fe
de
ral B
an
k
Ka
rna
taka
Ba
nk
City
un
ion
Ba
nk
La
ksh
mi V
ilas
Ba
nk
So
uth
Ind
ian
Ba
nk
J&K
Ba
nk
DC
B B
an
k
9.8%10.9%
12.3% 12.5%13.9% 14.4% 14.9% 15.8% 15.9%
19.2%
0%
5%
10%
15%
20%
25%
La
ksh
mi V
ilas
Ba
nk
J&K
Ba
nk
Ka
rna
taka
Ba
nk
So
uth
Ind
ian
Ba
nk
Ka
rur V
ysya
Ba
nk
Fe
de
ral B
an
k
City
Un
ion
Ba
nk
DC
B B
an
k
RB
L B
an
k
IDF
C B
an
k
Tier 1 CRAR
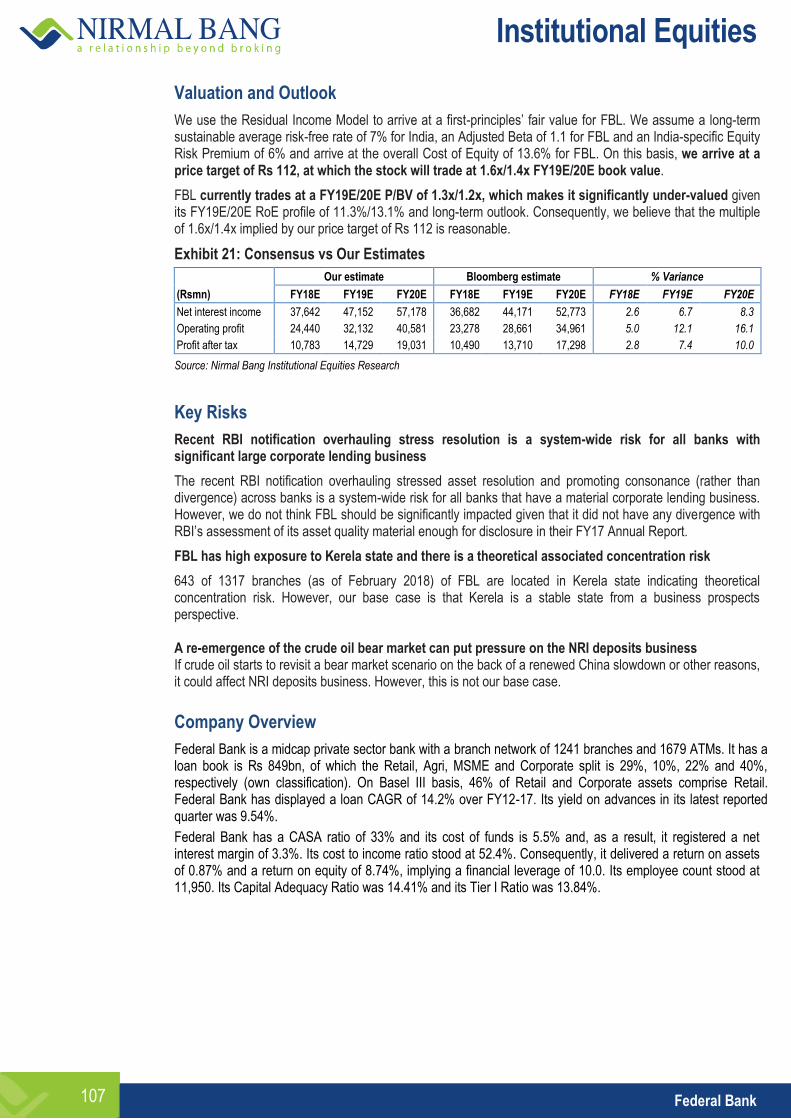
Institutional Equities
Federal Bank 107
Valuation and Outlook
We use the Residual Income Model to arrive at a first-principles’ fair value for FBL. We assume a long-term sustainable average risk-free rate of 7% for India, an Adjusted Beta of 1.1 for FBL and an India-specific Equity Risk Premium of 6% and arrive at the overall Cost of Equity of 13.6% for FBL. On this basis, we arrive at a price target of Rs 112, at which the stock will trade at 1.6x/1.4x FY19E/20E book value.
FBL currently trades at a FY19E/20E P/BV of 1.3x/1.2x, which makes it significantly under-valued given its FY19E/20E RoE profile of 11.3%/13.1% and long-term outlook. Consequently, we believe that the multiple of 1.6x/1.4x implied by our price target of Rs 112 is reasonable.
Exhibit 21: Consensus vs Our Estimates
Our estimate Bloomberg estimate % Variance
(Rsmn) FY18E FY19E FY20E FY18E FY19E FY20E FY18E FY19E FY20E
Net interest income 37,642 47,152 57,178 36,682 44,171 52,773 2.6 6.7 8.3
Operating profit 24,440 32,132 40,581 23,278 28,661 34,961 5.0 12.1 16.1
Profit after tax 10,783 14,729 19,031 10,490 13,710 17,298 2.8 7.4 10.0
Source: Nirmal Bang Institutional Equities Research
Key Risks
Recent RBI notification overhauling stress resolution is a system-wide risk for all banks with significant large corporate lending business
The recent RBI notification overhauling stressed asset resolution and promoting consonance (rather than divergence) across banks is a system-wide risk for all banks that have a material corporate lending business. However, we do not think FBL should be significantly impacted given that it did not have any divergence with RBI’s assessment of its asset quality material enough for disclosure in their FY17 Annual Report.
FBL has high exposure to Kerela state and there is a theoretical associated concentration risk
643 of 1317 branches (as of February 2018) of FBL are located in Kerela state indicating theoretical concentration risk. However, our base case is that Kerela is a stable state from a business prospects perspective. A re-emergence of the crude oil bear market can put pressure on the NRI deposits business If crude oil starts to revisit a bear market scenario on the back of a renewed China slowdown or other reasons, it could affect NRI deposits business. However, this is not our base case.
Company Overview
Federal Bank is a midcap private sector bank with a branch network of 1241 branches and 1679 ATMs. It has a loan book is Rs 849bn, of which the Retail, Agri, MSME and Corporate split is 29%, 10%, 22% and 40%, respectively (own classification). On Basel III basis, 46% of Retail and Corporate assets comprise Retail. Federal Bank has displayed a loan CAGR of 14.2% over FY12-17. Its yield on advances in its latest reported quarter was 9.54%.
Federal Bank has a CASA ratio of 33% and its cost of funds is 5.5% and, as a result, it registered a net interest margin of 3.3%. Its cost to income ratio stood at 52.4%. Consequently, it delivered a return on assets of 0.87% and a return on equity of 8.74%, implying a financial leverage of 10.0. Its employee count stood at 11,950. Its Capital Adequacy Ratio was 14.41% and its Tier I Ratio was 13.84%.
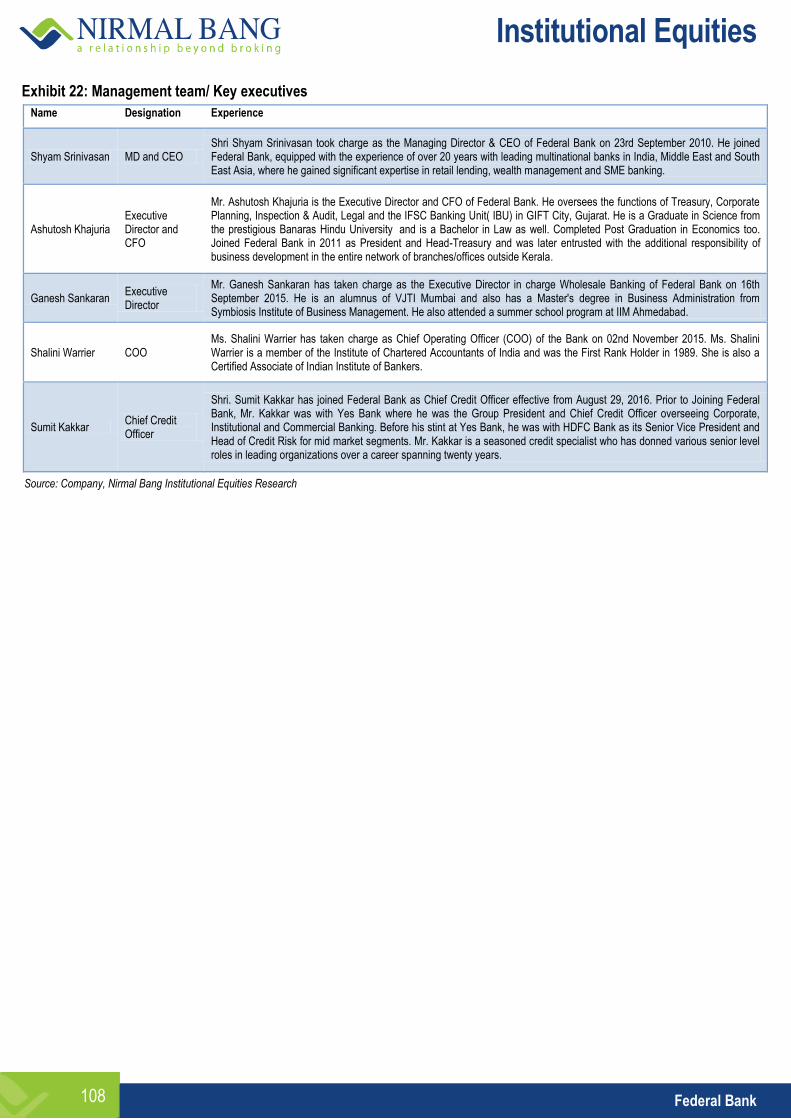
Institutional Equities
Federal Bank 108
Exhibit 22: Management team/ Key executives Name Designation Experience
Shyam Srinivasan MD and CEO Shri Shyam Srinivasan took charge as the Managing Director & CEO of Federal Bank on 23rd September 2010. He joined Federal Bank, equipped with the experience of over 20 years with leading multinational banks in India, Middle East and South East Asia, where he gained significant expertise in retail lending, wealth management and SME banking.
Ashutosh Khajuria Executive Director and CFO
Mr. Ashutosh Khajuria is the Executive Director and CFO of Federal Bank. He oversees the functions of Treasury, Corporate Planning, Inspection & Audit, Legal and the IFSC Banking Unit( IBU) in GIFT City, Gujarat. He is a Graduate in Science from the prestigious Banaras Hindu University and is a Bachelor in Law as well. Completed Post Graduation in Economics too. Joined Federal Bank in 2011 as President and Head-Treasury and was later entrusted with the additional responsibility of business development in the entire network of branches/offices outside Kerala.
Ganesh Sankaran Executive Director
Mr. Ganesh Sankaran has taken charge as the Executive Director in charge Wholesale Banking of Federal Bank on 16th September 2015. He is an alumnus of VJTI Mumbai and also has a Master's degree in Business Administration from Symbiosis Institute of Business Management. He also attended a summer school program at IIM Ahmedabad.
Shalini Warrier COO Ms. Shalini Warrier has taken charge as Chief Operating Officer (COO) of the Bank on 02nd November 2015. Ms. Shalini Warrier is a member of the Institute of Chartered Accountants of India and was the First Rank Holder in 1989. She is also a Certified Associate of Indian Institute of Bankers.
Sumit Kakkar Chief Credit Officer
Shri. Sumit Kakkar has joined Federal Bank as Chief Credit Officer effective from August 29, 2016. Prior to Joining Federal Bank, Mr. Kakkar was with Yes Bank where he was the Group President and Chief Credit Officer overseeing Corporate, Institutional and Commercial Banking. Before his stint at Yes Bank, he was with HDFC Bank as its Senior Vice President and Head of Credit Risk for mid market segments. Mr. Kakkar is a seasoned credit specialist who has donned various senior level roles in leading organizations over a career spanning twenty years.
Source: Company, Nirmal Bang Institutional Equities Research
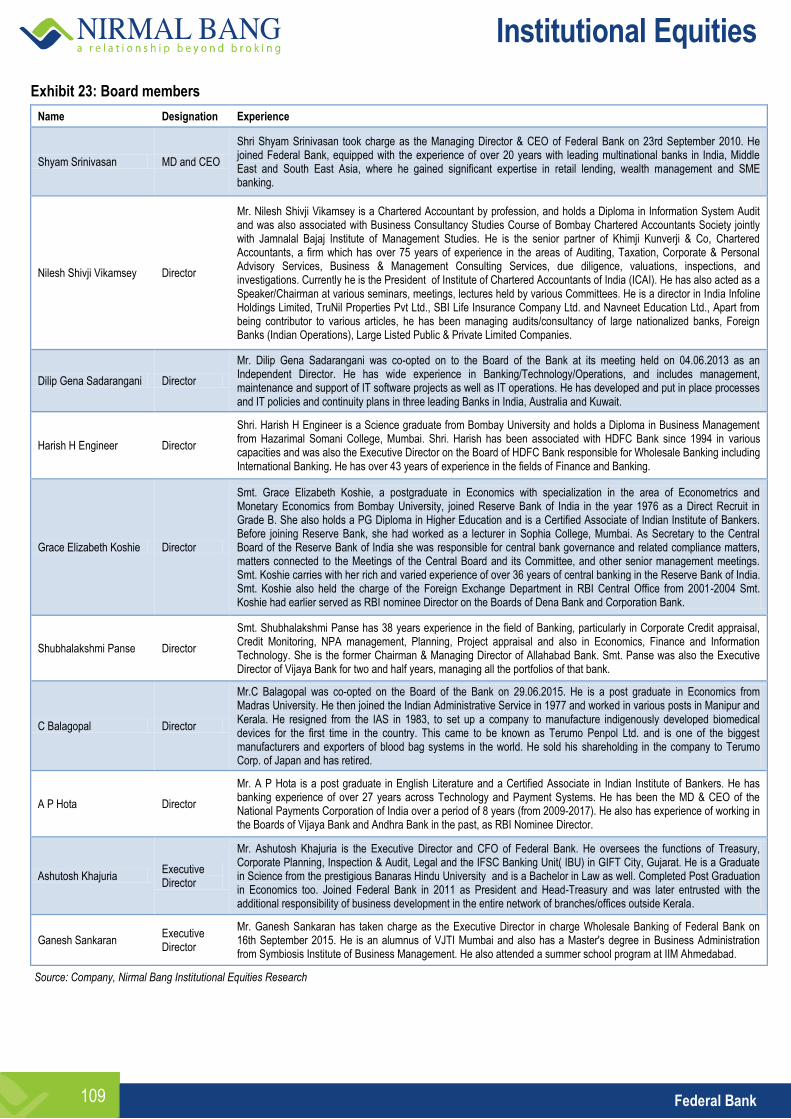
Institutional Equities
Federal Bank 109
Exhibit 23: Board members
Name Designation Experience
Shyam Srinivasan MD and CEO
Shri Shyam Srinivasan took charge as the Managing Director & CEO of Federal Bank on 23rd September 2010. He joined Federal Bank, equipped with the experience of over 20 years with leading multinational banks in India, Middle East and South East Asia, where he gained significant expertise in retail lending, wealth management and SME banking.
Nilesh Shivji Vikamsey Director
Mr. Nilesh Shivji Vikamsey is a Chartered Accountant by profession, and holds a Diploma in Information System Audit and was also associated with Business Consultancy Studies Course of Bombay Chartered Accountants Society jointly with Jamnalal Bajaj Institute of Management Studies. He is the senior partner of Khimji Kunverji & Co, Chartered Accountants, a firm which has over 75 years of experience in the areas of Auditing, Taxation, Corporate & Personal Advisory Services, Business & Management Consulting Services, due diligence, valuations, inspections, and investigations. Currently he is the President of Institute of Chartered Accountants of India (ICAI). He has also acted as a Speaker/Chairman at various seminars, meetings, lectures held by various Committees. He is a director in India Infoline Holdings Limited, TruNil Properties Pvt Ltd., SBI Life Insurance Company Ltd. and Navneet Education Ltd., Apart from being contributor to various articles, he has been managing audits/consultancy of large nationalized banks, Foreign Banks (Indian Operations), Large Listed Public & Private Limited Companies.
Dilip Gena Sadarangani Director
Mr. Dilip Gena Sadarangani was co-opted on to the Board of the Bank at its meeting held on 04.06.2013 as an Independent Director. He has wide experience in Banking/Technology/Operations, and includes management, maintenance and support of IT software projects as well as IT operations. He has developed and put in place processes and IT policies and continuity plans in three leading Banks in India, Australia and Kuwait.
Harish H Engineer Director
Shri. Harish H Engineer is a Science graduate from Bombay University and holds a Diploma in Business Management from Hazarimal Somani College, Mumbai. Shri. Harish has been associated with HDFC Bank since 1994 in various capacities and was also the Executive Director on the Board of HDFC Bank responsible for Wholesale Banking including International Banking. He has over 43 years of experience in the fields of Finance and Banking.
Grace Elizabeth Koshie Director
Smt. Grace Elizabeth Koshie, a postgraduate in Economics with specialization in the area of Econometrics and Monetary Economics from Bombay University, joined Reserve Bank of India in the year 1976 as a Direct Recruit in Grade B. She also holds a PG Diploma in Higher Education and is a Certified Associate of Indian Institute of Bankers. Before joining Reserve Bank, she had worked as a lecturer in Sophia College, Mumbai. As Secretary to the Central Board of the Reserve Bank of India she was responsible for central bank governance and related compliance matters, matters connected to the Meetings of the Central Board and its Committee, and other senior management meetings. Smt. Koshie carries with her rich and varied experience of over 36 years of central banking in the Reserve Bank of India. Smt. Koshie also held the charge of the Foreign Exchange Department in RBI Central Office from 2001-2004 Smt. Koshie had earlier served as RBI nominee Director on the Boards of Dena Bank and Corporation Bank.
Shubhalakshmi Panse Director
Smt. Shubhalakshmi Panse has 38 years experience in the field of Banking, particularly in Corporate Credit appraisal, Credit Monitoring, NPA management, Planning, Project appraisal and also in Economics, Finance and Information Technology. She is the former Chairman & Managing Director of Allahabad Bank. Smt. Panse was also the Executive Director of Vijaya Bank for two and half years, managing all the portfolios of that bank.
C Balagopal Director
Mr.C Balagopal was co-opted on the Board of the Bank on 29.06.2015. He is a post graduate in Economics from Madras University. He then joined the Indian Administrative Service in 1977 and worked in various posts in Manipur and Kerala. He resigned from the IAS in 1983, to set up a company to manufacture indigenously developed biomedical devices for the first time in the country. This came to be known as Terumo Penpol Ltd. and is one of the biggest manufacturers and exporters of blood bag systems in the world. He sold his shareholding in the company to Terumo Corp. of Japan and has retired.
A P Hota Director
Mr. A P Hota is a post graduate in English Literature and a Certified Associate in Indian Institute of Bankers. He has banking experience of over 27 years across Technology and Payment Systems. He has been the MD & CEO of the National Payments Corporation of India over a period of 8 years (from 2009-2017). He also has experience of working in the Boards of Vijaya Bank and Andhra Bank in the past, as RBI Nominee Director.
Ashutosh Khajuria Executive Director
Mr. Ashutosh Khajuria is the Executive Director and CFO of Federal Bank. He oversees the functions of Treasury, Corporate Planning, Inspection & Audit, Legal and the IFSC Banking Unit( IBU) in GIFT City, Gujarat. He is a Graduate in Science from the prestigious Banaras Hindu University and is a Bachelor in Law as well. Completed Post Graduation in Economics too. Joined Federal Bank in 2011 as President and Head-Treasury and was later entrusted with the additional responsibility of business development in the entire network of branches/offices outside Kerala.
Ganesh Sankaran Executive Director
Mr. Ganesh Sankaran has taken charge as the Executive Director in charge Wholesale Banking of Federal Bank on 16th September 2015. He is an alumnus of VJTI Mumbai and also has a Master's degree in Business Administration from Symbiosis Institute of Business Management. He also attended a summer school program at IIM Ahmedabad.
Source: Company, Nirmal Bang Institutional Equities Research
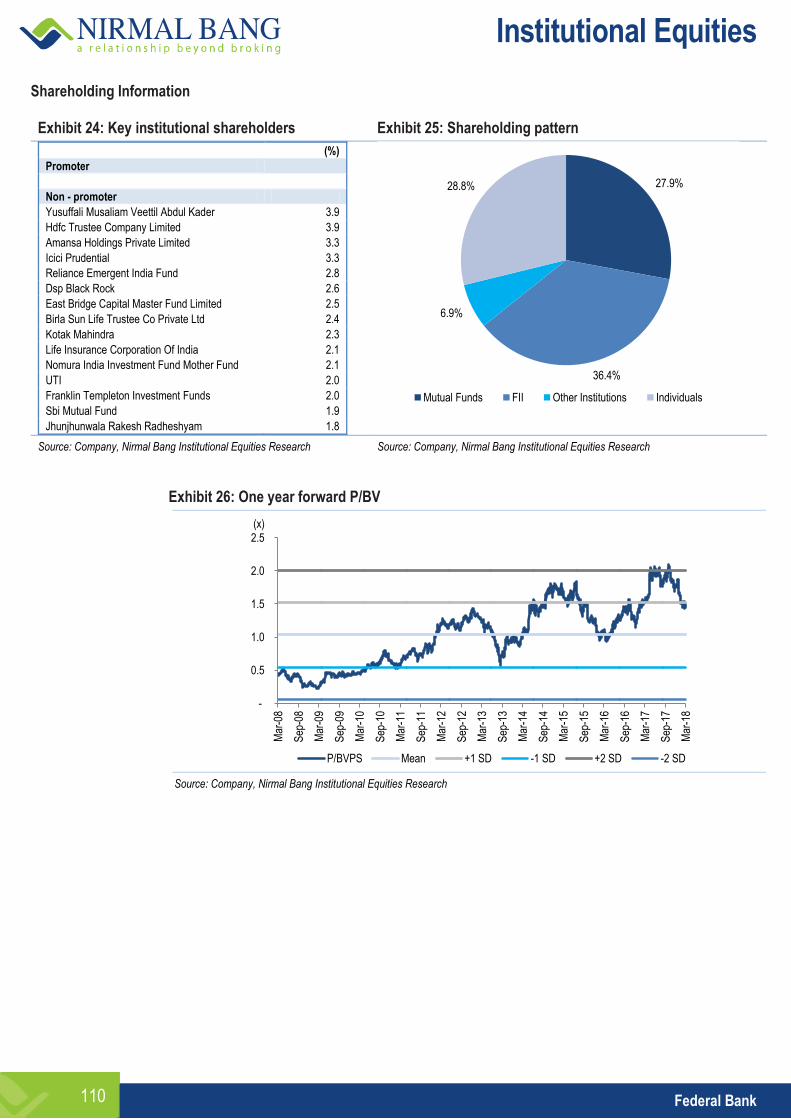
Institutional Equities
Federal Bank 110
Shareholding Information Exhibit 24: Key institutional shareholders Exhibit 25: Shareholding pattern
(%)
Promoter
Non - promoter
Yusuffali Musaliam Veettil Abdul Kader 3.9
Hdfc Trustee Company Limited 3.9
Amansa Holdings Private Limited 3.3
Icici Prudential 3.3
Reliance Emergent India Fund 2.8
Dsp Black Rock 2.6
East Bridge Capital Master Fund Limited 2.5
Birla Sun Life Trustee Co Private Ltd 2.4
Kotak Mahindra 2.3
Life Insurance Corporation Of India 2.1
Nomura India Investment Fund Mother Fund 2.1
UTI 2.0
Franklin Templeton Investment Funds 2.0
Sbi Mutual Fund 1.9
Jhunjhunwala Rakesh Radheshyam 1.8
Source: Company, Nirmal Bang Institutional Equities Research Source: Company, Nirmal Bang Institutional Equities Research
Exhibit 26: One year forward P/BV
Source: Company, Nirmal Bang Institutional Equities Research
27.9%
36.4%
6.9%
28.8%
Mutual Funds FII Other Institutions Individuals
-
0.5
1.0
1.5
2.0
2.5
Mar
-08
Sep
-08
Mar
-09
Sep
-09
Mar
-10
Sep
-10
Mar
-11
Sep
-11
Mar
-12
Sep
-12
Mar
-13
Sep
-13
Mar
-14
Sep
-14
Mar
-15
Sep
-15
Mar
-16
Sep
-16
Mar
-17
Sep
-17
Mar
-18
P/BVPS Mean +1 SD -1 SD +2 SD -2 SD
(x)
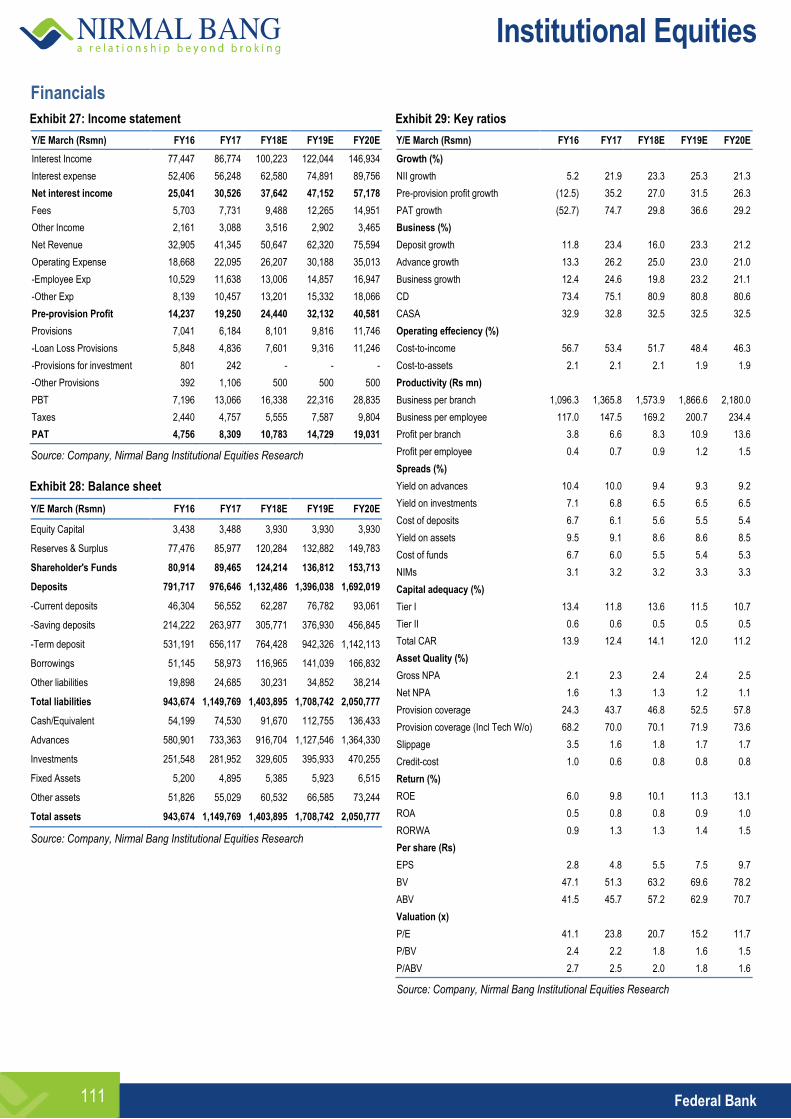
Institutional Equities
Federal Bank 111
Financials
Exhibit 27: Income statement
Y/E March (Rsmn) FY16 FY17 FY18E FY19E FY20E
Interest Income 77,447 86,774 100,223 122,044 146,934
Interest expense 52,406 56,248 62,580 74,891 89,756
Net interest income 25,041 30,526 37,642 47,152 57,178
Fees 5,703 7,731 9,488 12,265 14,951
Other Income 2,161 3,088 3,516 2,902 3,465
Net Revenue 32,905 41,345 50,647 62,320 75,594
Operating Expense 18,668 22,095 26,207 30,188 35,013
-Employee Exp 10,529 11,638 13,006 14,857 16,947
-Other Exp 8,139 10,457 13,201 15,332 18,066
Pre-provision Profit 14,237 19,250 24,440 32,132 40,581
Provisions 7,041 6,184 8,101 9,816 11,746
-Loan Loss Provisions 5,848 4,836 7,601 9,316 11,246
-Provisions for investment 801 242 - - -
-Other Provisions 392 1,106 500 500 500
PBT 7,196 13,066 16,338 22,316 28,835
Taxes 2,440 4,757 5,555 7,587 9,804
PAT 4,756 8,309 10,783 14,729 19,031
Source: Company, Nirmal Bang Institutional Equities Research
Exhibit 28: Balance sheet
Y/E March (Rsmn) FY16 FY17 FY18E FY19E FY20E
Equity Capital 3,438 3,488 3,930 3,930 3,930
Reserves & Surplus 77,476 85,977 120,284 132,882 149,783
Shareholder's Funds 80,914 89,465 124,214 136,812 153,713
Deposits 791,717 976,646 1,132,486 1,396,038 1,692,019
-Current deposits 46,304 56,552 62,287 76,782 93,061
-Saving deposits 214,222 263,977 305,771 376,930 456,845
-Term deposit 531,191 656,117 764,428 942,326 1,142,113
Borrowings 51,145 58,973 116,965 141,039 166,832
Other liabilities 19,898 24,685 30,231 34,852 38,214
Total liabilities 943,674 1,149,769 1,403,895 1,708,742 2,050,777
Cash/Equivalent 54,199 74,530 91,670 112,755 136,433
Advances 580,901 733,363 916,704 1,127,546 1,364,330
Investments 251,548 281,952 329,605 395,933 470,255
Fixed Assets 5,200 4,895 5,385 5,923 6,515
Other assets 51,826 55,029 60,532 66,585 73,244
Total assets 943,674 1,149,769 1,403,895 1,708,742 2,050,777
Source: Company, Nirmal Bang Institutional Equities Research
Exhibit 29: Key ratios
Y/E March (Rsmn) FY16 FY17 FY18E FY19E FY20E
Growth (%)
NII growth 5.2 21.9 23.3 25.3 21.3
Pre-provision profit growth (12.5) 35.2 27.0 31.5 26.3
PAT growth (52.7) 74.7 29.8 36.6 29.2
Business (%)
Deposit growth 11.8 23.4 16.0 23.3 21.2
Advance growth 13.3 26.2 25.0 23.0 21.0
Business growth 12.4 24.6 19.8 23.2 21.1
CD 73.4 75.1 80.9 80.8 80.6
CASA 32.9 32.8 32.5 32.5 32.5
Operating effeciency (%)
Cost-to-income 56.7 53.4 51.7 48.4 46.3
Cost-to-assets 2.1 2.1 2.1 1.9 1.9
Productivity (Rs mn)
Business per branch 1,096.3 1,365.8 1,573.9 1,866.6 2,180.0
Business per employee 117.0 147.5 169.2 200.7 234.4
Profit per branch 3.8 6.6 8.3 10.9 13.6
Profit per employee 0.4 0.7 0.9 1.2 1.5
Spreads (%)
Yield on advances 10.4 10.0 9.4 9.3 9.2
Yield on investments 7.1 6.8 6.5 6.5 6.5
Cost of deposits 6.7 6.1 5.6 5.5 5.4
Yield on assets 9.5 9.1 8.6 8.6 8.5
Cost of funds 6.7 6.0 5.5 5.4 5.3
NIMs 3.1 3.2 3.2 3.3 3.3
Capital adequacy (%)
Tier I 13.4 11.8 13.6 11.5 10.7
Tier II 0.6 0.6 0.5 0.5 0.5
Total CAR 13.9 12.4 14.1 12.0 11.2
Asset Quality (%)
Gross NPA 2.1 2.3 2.4 2.4 2.5
Net NPA 1.6 1.3 1.3 1.2 1.1
Provision coverage 24.3 43.7 46.8 52.5 57.8
Provision coverage (Incl Tech W/o) 68.2 70.0 70.1 71.9 73.6
Slippage 3.5 1.6 1.8 1.7 1.7
Credit-cost 1.0 0.6 0.8 0.8 0.8
Return (%)
ROE 6.0 9.8 10.1 11.3 13.1
ROA 0.5 0.8 0.8 0.9 1.0
RORWA 0.9 1.3 1.3 1.4 1.5
Per share (Rs)
EPS 2.8 4.8 5.5 7.5 9.7
BV 47.1 51.3 63.2 69.6 78.2
ABV 41.5 45.7 57.2 62.9 70.7
Valuation (x)
P/E 41.1 23.8 20.7 15.2 11.7
P/BV 2.4 2.2 1.8 1.6 1.5
P/ABV 2.7 2.5 2.0 1.8 1.6
Source: Company, Nirmal Bang Institutional Equities Research

Institutional Equities
Federal Bank 112
This page has been intentionally left blank
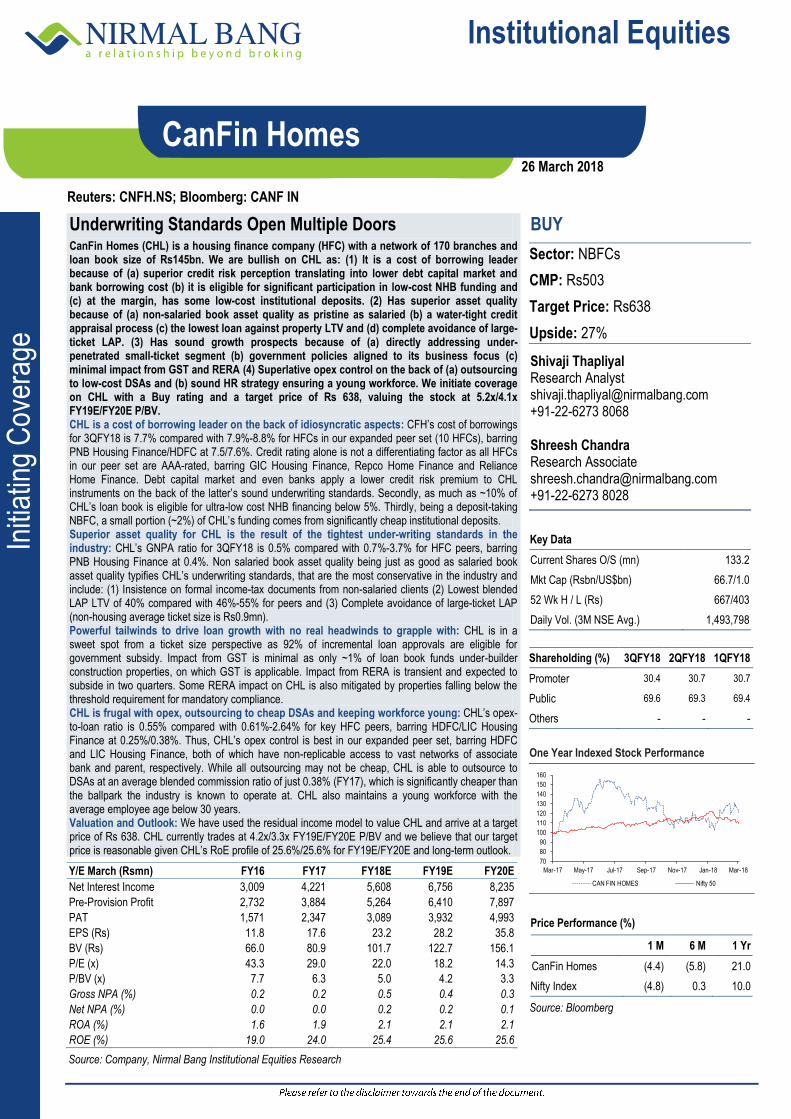
Institutional Equities
Initi
atin
g C
over
age
Reuters: CNFH.NS; Bloomberg: CANF IN
CanFin Homes
Underwriting Standards Open Multiple Doors CanFin Homes (CHL) is a housing finance company (HFC) with a network of 170 branches and loan book size of Rs145bn. We are bullish on CHL as: (1) It is a cost of borrowing leader because of (a) superior credit risk perception translating into lower debt capital market and bank borrowing cost (b) it is eligible for significant participation in low-cost NHB funding and (c) at the margin, has some low-cost institutional deposits. (2) Has superior asset quality because of (a) non-salaried book asset quality as pristine as salaried (b) a water-tight credit appraisal process (c) the lowest loan against property LTV and (d) complete avoidance of large-ticket LAP. (3) Has sound growth prospects because of (a) directly addressing under-penetrated small-ticket segment (b) government policies aligned to its business focus (c) minimal impact from GST and RERA (4) Superlative opex control on the back of (a) outsourcing to low-cost DSAs and (b) sound HR strategy ensuring a young workforce. We initiate coverage on CHL with a Buy rating and a target price of Rs 638, valuing the stock at 5.2x/4.1x FY19E/FY20E P/BV. CHL is a cost of borrowing leader on the back of idiosyncratic aspects: CFH’s cost of borrowings for 3QFY18 is 7.7% compared with 7.9%-8.8% for HFCs in our expanded peer set (10 HFCs), barring PNB Housing Finance/HDFC at 7.5/7.6%. Credit rating alone is not a differentiating factor as all HFCs in our peer set are AAA-rated, barring GIC Housing Finance, Repco Home Finance and Reliance Home Finance. Debt capital market and even banks apply a lower credit risk premium to CHL instruments on the back of the latter’s sound underwriting standards. Secondly, as much as ~10% of CHL’s loan book is eligible for ultra-low cost NHB financing below 5%. Thirdly, being a deposit-taking NBFC, a small portion (~2%) of CHL’s funding comes from significantly cheap institutional deposits. Superior asset quality for CHL is the result of the tightest under-writing standards in the industry: CHL’s GNPA ratio for 3QFY18 is 0.5% compared with 0.7%-3.7% for HFC peers, barring PNB Housing Finance at 0.4%. Non salaried book asset quality being just as good as salaried book asset quality typifies CHL’s underwriting standards, that are the most conservative in the industry and include: (1) Insistence on formal income-tax documents from non-salaried clients (2) Lowest blended LAP LTV of 40% compared with 46%-55% for peers and (3) Complete avoidance of large-ticket LAP (non-housing average ticket size is Rs0.9mn). Powerful tailwinds to drive loan growth with no real headwinds to grapple with: CHL is in a sweet spot from a ticket size perspective as 92% of incremental loan approvals are eligible for government subsidy. Impact from GST is minimal as only ~1% of loan book funds under-builder construction properties, on which GST is applicable. Impact from RERA is transient and expected to subside in two quarters. Some RERA impact on CHL is also mitigated by properties falling below the threshold requirement for mandatory compliance. CHL is frugal with opex, outsourcing to cheap DSAs and keeping workforce young: CHL’s opex-to-loan ratio is 0.55% compared with 0.61%-2.64% for key HFC peers, barring HDFC/LIC Housing Finance at 0.25%/0.38%. Thus, CHL’s opex control is best in our expanded peer set, barring HDFC and LIC Housing Finance, both of which have non-replicable access to vast networks of associate bank and parent, respectively. While all outsourcing may not be cheap, CHL is able to outsource to DSAs at an average blended commission ratio of just 0.38% (FY17), which is significantly cheaper than the ballpark the industry is known to operate at. CHL also maintains a young workforce with the average employee age below 30 years. Valuation and Outlook: We have used the residual income model to value CHL and arrive at a target price of Rs 638. CHL currently trades at 4.2x/3.3x FY19E/FY20E P/BV and we believe that our target price is reasonable given CHL’s RoE profile of 25.6%/25.6% for FY19E/FY20E and long-term outlook.
BUY
Sector: NBFCs
CMP: Rs503
Target Price: Rs638
Upside: 27%
Shivaji Thapliyal Research Analyst [email protected] +91-22-6273 8068 Shreesh Chandra Research Associate [email protected] +91-22-6273 8028
Key Data
Current Shares O/S (mn) 133.2
Mkt Cap (Rsbn/US$bn) 66.7/1.0
52 Wk H / L (Rs) 667/403
Daily Vol. (3M NSE Avg.) 1,493,798
Shareholding (%) 3QFY18 2QFY18 1QFY18
Promoter 30.4 30.7 30.7
Public 69.6 69.3 69.4
Others - - -
One Year Indexed Stock Performance
Price Performance (%)
1 M 6 M 1 Yr
CanFin Homes (4.4) (5.8) 21.0
Nifty Index (4.8) 0.3 10.0
Source: Bloomberg
Y/E March (Rsmn) FY16 FY17 FY18E FY19E FY20E
Net Interest Income 3,009 4,221 5,608 6,756 8,235
Pre-Provision Profit 2,732 3,884 5,264 6,410 7,897
PAT 1,571 2,347 3,089 3,932 4,993
EPS (Rs) 11.8 17.6 23.2 28.2 35.8
BV (Rs) 66.0 80.9 101.7 122.7 156.1
P/E (x) 43.3 29.0 22.0 18.2 14.3
P/BV (x) 7.7 6.3 5.0 4.2 3.3
Gross NPA (%) 0.2 0.2 0.5 0.4 0.3
Net NPA (%) 0.0 0.0 0.2 0.2 0.1
ROA (%) 1.6 1.9 2.1 2.1 2.1
ROE (%) 19.0 24.0 25.4 25.6 25.6
Source: Company, Nirmal Bang Institutional Equities Research
70
80
90
100
110
120
130
140
150
160
Mar-17 May-17 Jul-17 Sep-17 Nov-17 Jan-18 Mar-18
CAN FIN HOMES Nifty 50
26 March 2018
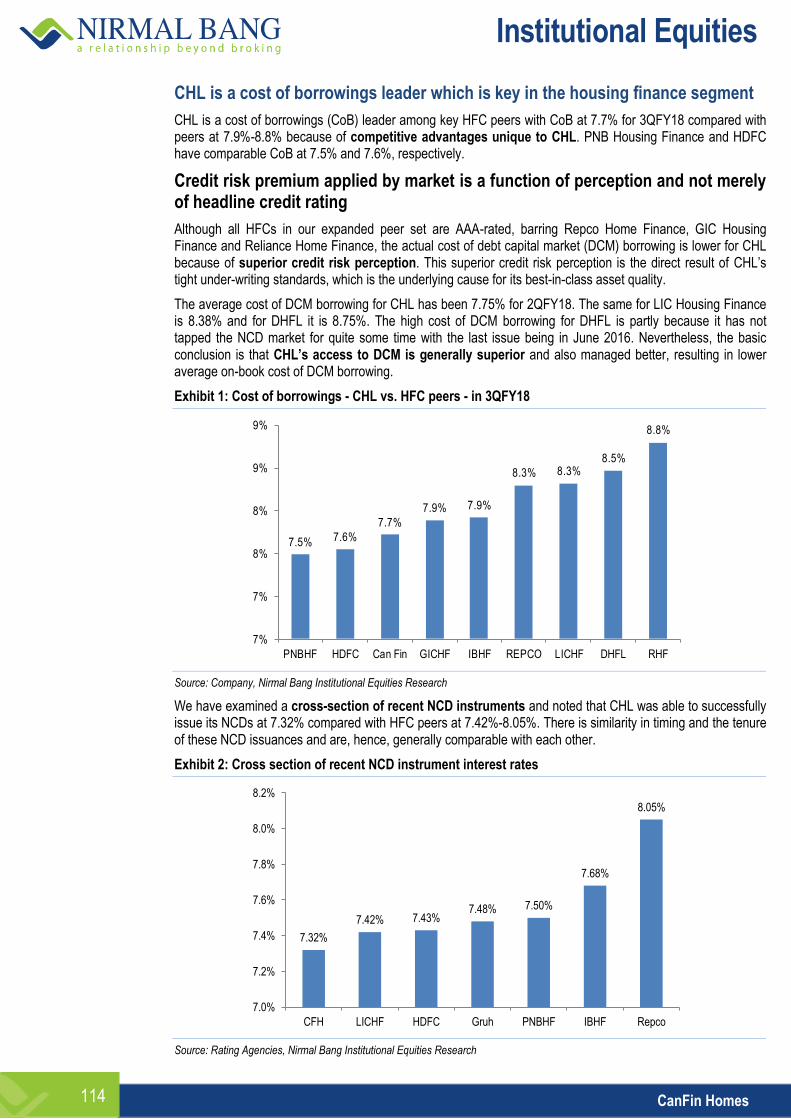
Institutional Equities
CanFin Homes 114
CHL is a cost of borrowings leader which is key in the housing finance segment
CHL is a cost of borrowings (CoB) leader among key HFC peers with CoB at 7.7% for 3QFY18 compared with peers at 7.9%-8.8% because of competitive advantages unique to CHL. PNB Housing Finance and HDFC have comparable CoB at 7.5% and 7.6%, respectively.
Credit risk premium applied by market is a function of perception and not merely of headline credit rating
Although all HFCs in our expanded peer set are AAA-rated, barring Repco Home Finance, GIC Housing Finance and Reliance Home Finance, the actual cost of debt capital market (DCM) borrowing is lower for CHL because of superior credit risk perception. This superior credit risk perception is the direct result of CHL’s tight under-writing standards, which is the underlying cause for its best-in-class asset quality.
The average cost of DCM borrowing for CHL has been 7.75% for 2QFY18. The same for LIC Housing Finance is 8.38% and for DHFL it is 8.75%. The high cost of DCM borrowing for DHFL is partly because it has not tapped the NCD market for quite some time with the last issue being in June 2016. Nevertheless, the basic conclusion is that CHL’s access to DCM is generally superior and also managed better, resulting in lower average on-book cost of DCM borrowing.
Exhibit 1: Cost of borrowings - CHL vs. HFC peers - in 3QFY18
Source: Company, Nirmal Bang Institutional Equities Research
We have examined a cross-section of recent NCD instruments and noted that CHL was able to successfully issue its NCDs at 7.32% compared with HFC peers at 7.42%-8.05%. There is similarity in timing and the tenure of these NCD issuances and are, hence, generally comparable with each other.
Exhibit 2: Cross section of recent NCD instrument interest rates
Source: Rating Agencies, Nirmal Bang Institutional Equities Research
7.5% 7.6%
7.7%
7.9% 7.9%
8.3% 8.3%8.5%
8.8%
7%
7%
8%
8%
9%
9%
PNBHF HDFC Can Fin GICHF IBHF REPCO LICHF DHFL RHF
7.32%
7.42% 7.43% 7.48% 7.50%
7.68%
8.05%
7.0%
7.2%
7.4%
7.6%
7.8%
8.0%
8.2%
CFH LICHF HDFC Gruh PNBHF IBHF Repco
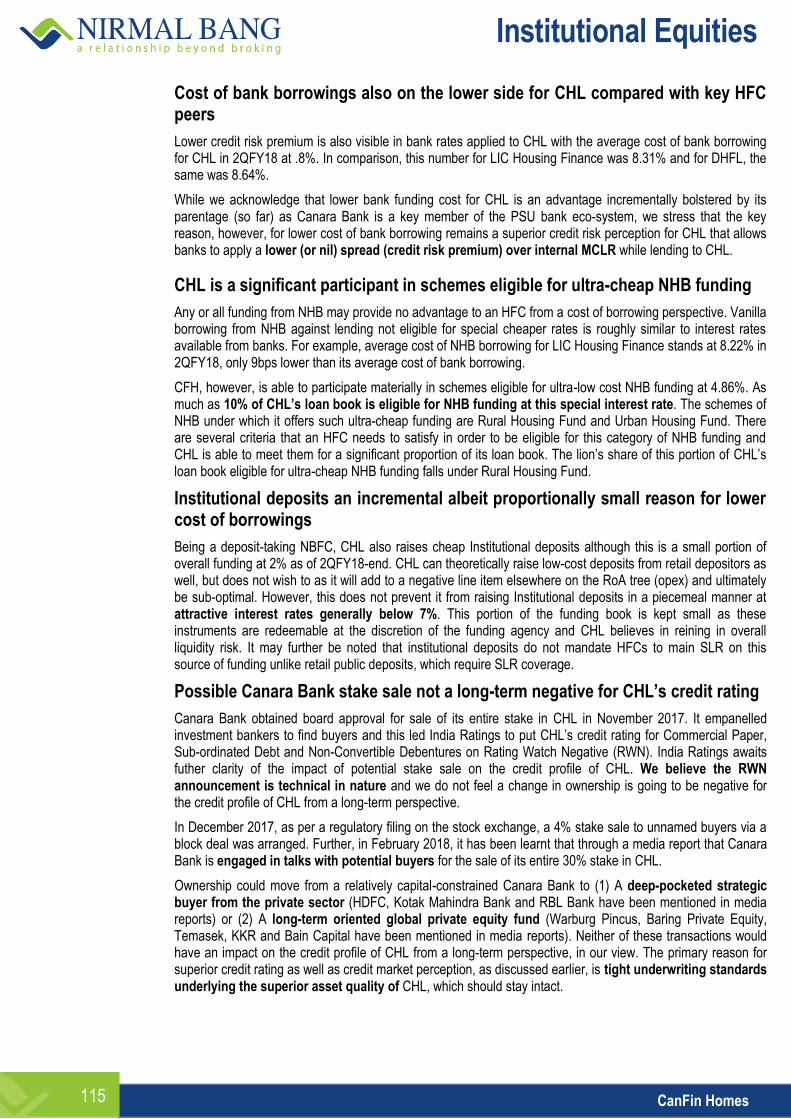
Institutional Equities
CanFin Homes 115
Cost of bank borrowings also on the lower side for CHL compared with key HFC peers
Lower credit risk premium is also visible in bank rates applied to CHL with the average cost of bank borrowing for CHL in 2QFY18 at .8%. In comparison, this number for LIC Housing Finance was 8.31% and for DHFL, the same was 8.64%.
While we acknowledge that lower bank funding cost for CHL is an advantage incrementally bolstered by its parentage (so far) as Canara Bank is a key member of the PSU bank eco-system, we stress that the key reason, however, for lower cost of bank borrowing remains a superior credit risk perception for CHL that allows banks to apply a lower (or nil) spread (credit risk premium) over internal MCLR while lending to CHL.
CHL is a significant participant in schemes eligible for ultra-cheap NHB funding
Any or all funding from NHB may provide no advantage to an HFC from a cost of borrowing perspective. Vanilla borrowing from NHB against lending not eligible for special cheaper rates is roughly similar to interest rates available from banks. For example, average cost of NHB borrowing for LIC Housing Finance stands at 8.22% in 2QFY18, only 9bps lower than its average cost of bank borrowing.
CFH, however, is able to participate materially in schemes eligible for ultra-low cost NHB funding at 4.86%. As much as 10% of CHL’s loan book is eligible for NHB funding at this special interest rate. The schemes of NHB under which it offers such ultra-cheap funding are Rural Housing Fund and Urban Housing Fund. There are several criteria that an HFC needs to satisfy in order to be eligible for this category of NHB funding and CHL is able to meet them for a significant proportion of its loan book. The lion’s share of this portion of CHL’s loan book eligible for ultra-cheap NHB funding falls under Rural Housing Fund.
Institutional deposits an incremental albeit proportionally small reason for lower cost of borrowings
Being a deposit-taking NBFC, CHL also raises cheap Institutional deposits although this is a small portion of overall funding at 2% as of 2QFY18-end. CHL can theoretically raise low-cost deposits from retail depositors as well, but does not wish to as it will add to a negative line item elsewhere on the RoA tree (opex) and ultimately be sub-optimal. However, this does not prevent it from raising Institutional deposits in a piecemeal manner at attractive interest rates generally below 7%. This portion of the funding book is kept small as these instruments are redeemable at the discretion of the funding agency and CHL believes in reining in overall liquidity risk. It may further be noted that institutional deposits do not mandate HFCs to main SLR on this source of funding unlike retail public deposits, which require SLR coverage.
Possible Canara Bank stake sale not a long-term negative for CHL’s credit rating
Canara Bank obtained board approval for sale of its entire stake in CHL in November 2017. It empanelled investment bankers to find buyers and this led India Ratings to put CHL’s credit rating for Commercial Paper, Sub-ordinated Debt and Non-Convertible Debentures on Rating Watch Negative (RWN). India Ratings awaits futher clarity of the impact of potential stake sale on the credit profile of CHL. We believe the RWN announcement is technical in nature and we do not feel a change in ownership is going to be negative for the credit profile of CHL from a long-term perspective.
In December 2017, as per a regulatory filing on the stock exchange, a 4% stake sale to unnamed buyers via a block deal was arranged. Further, in February 2018, it has been learnt that through a media report that Canara Bank is engaged in talks with potential buyers for the sale of its entire 30% stake in CHL.
Ownership could move from a relatively capital-constrained Canara Bank to (1) A deep-pocketed strategic buyer from the private sector (HDFC, Kotak Mahindra Bank and RBL Bank have been mentioned in media reports) or (2) A long-term oriented global private equity fund (Warburg Pincus, Baring Private Equity, Temasek, KKR and Bain Capital have been mentioned in media reports). Neither of these transactions would have an impact on the credit profile of CHL from a long-term perspective, in our view. The primary reason for superior credit rating as well as credit market perception, as discussed earlier, is tight underwriting standards underlying the superior asset quality of CHL, which should stay intact.
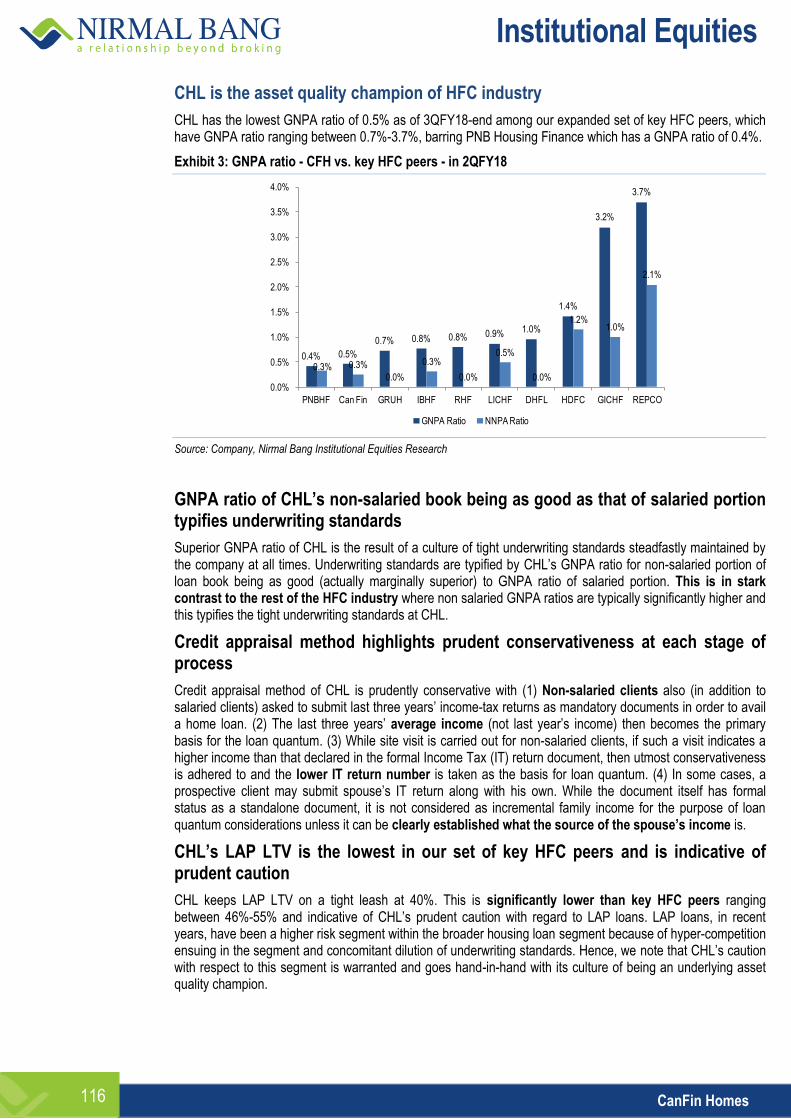
Institutional Equities
CanFin Homes 116
CHL is the asset quality champion of HFC industry
CHL has the lowest GNPA ratio of 0.5% as of 3QFY18-end among our expanded set of key HFC peers, which have GNPA ratio ranging between 0.7%-3.7%, barring PNB Housing Finance which has a GNPA ratio of 0.4%.
Exhibit 3: GNPA ratio - CFH vs. key HFC peers - in 2QFY18
Source: Company, Nirmal Bang Institutional Equities Research
GNPA ratio of CHL’s non-salaried book being as good as that of salaried portion typifies underwriting standards
Superior GNPA ratio of CHL is the result of a culture of tight underwriting standards steadfastly maintained by the company at all times. Underwriting standards are typified by CHL’s GNPA ratio for non-salaried portion of loan book being as good (actually marginally superior) to GNPA ratio of salaried portion. This is in stark contrast to the rest of the HFC industry where non salaried GNPA ratios are typically significantly higher and this typifies the tight underwriting standards at CHL.
Credit appraisal method highlights prudent conservativeness at each stage of process
Credit appraisal method of CHL is prudently conservative with (1) Non-salaried clients also (in addition to salaried clients) asked to submit last three years’ income-tax returns as mandatory documents in order to avail a home loan. (2) The last three years’ average income (not last year’s income) then becomes the primary basis for the loan quantum. (3) While site visit is carried out for non-salaried clients, if such a visit indicates a higher income than that declared in the formal Income Tax (IT) return document, then utmost conservativeness is adhered to and the lower IT return number is taken as the basis for loan quantum. (4) In some cases, a prospective client may submit spouse’s IT return along with his own. While the document itself has formal status as a standalone document, it is not considered as incremental family income for the purpose of loan quantum considerations unless it can be clearly established what the source of the spouse’s income is.
CHL’s LAP LTV is the lowest in our set of key HFC peers and is indicative of prudent caution
CHL keeps LAP LTV on a tight leash at 40%. This is significantly lower than key HFC peers ranging between 46%-55% and indicative of CHL’s prudent caution with regard to LAP loans. LAP loans, in recent years, have been a higher risk segment within the broader housing loan segment because of hyper-competition ensuing in the segment and concomitant dilution of underwriting standards. Hence, we note that CHL’s caution with respect to this segment is warranted and goes hand-in-hand with its culture of being an underlying asset quality champion.
0.4% 0.5%
0.7% 0.8% 0.8% 0.9% 1.0%
1.4%
3.2%
3.7%
0.3% 0.3%
0.0%
0.3%
0.0%
0.5%
0.0%
1.2%1.0%
2.1%
0.0%
0.5%
1.0%
1.5%
2.0%
2.5%
3.0%
3.5%
4.0%
PNBHF Can Fin GRUH IBHF RHF LICHF DHFL HDFC GICHF REPCO
GNPA Ratio NNPA Ratio
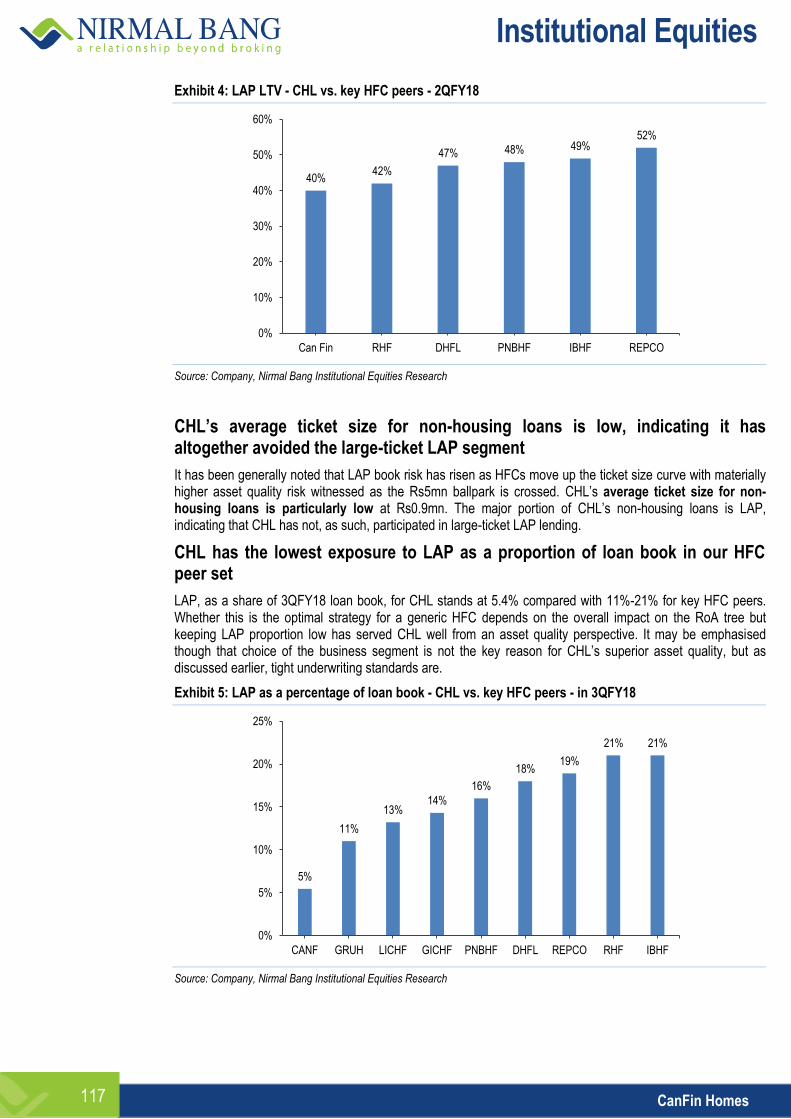
Institutional Equities
CanFin Homes 117
Exhibit 4: LAP LTV - CHL vs. key HFC peers - 2QFY18
Source: Company, Nirmal Bang Institutional Equities Research
CHL’s average ticket size for non-housing loans is low, indicating it has altogether avoided the large-ticket LAP segment
It has been generally noted that LAP book risk has risen as HFCs move up the ticket size curve with materially higher asset quality risk witnessed as the Rs5mn ballpark is crossed. CHL’s average ticket size for non-housing loans is particularly low at Rs0.9mn. The major portion of CHL’s non-housing loans is LAP, indicating that CHL has not, as such, participated in large-ticket LAP lending.
CHL has the lowest exposure to LAP as a proportion of loan book in our HFC peer set
LAP, as a share of 3QFY18 loan book, for CHL stands at 5.4% compared with 11%-21% for key HFC peers. Whether this is the optimal strategy for a generic HFC depends on the overall impact on the RoA tree but keeping LAP proportion low has served CHL well from an asset quality perspective. It may be emphasised though that choice of the business segment is not the key reason for CHL’s superior asset quality, but as discussed earlier, tight underwriting standards are.
Exhibit 5: LAP as a percentage of loan book - CHL vs. key HFC peers - in 3QFY18
Source: Company, Nirmal Bang Institutional Equities Research
40% 42%
47% 48% 49% 52%
0%
10%
20%
30%
40%
50%
60%
Can Fin RHF DHFL PNBHF IBHF REPCO
5%
11%
13% 14%
16%
18% 19%
21% 21%
0%
5%
10%
15%
20%
25%
CANF GRUH LICHF GICHF PNBHF DHFL REPCO RHF IBHF
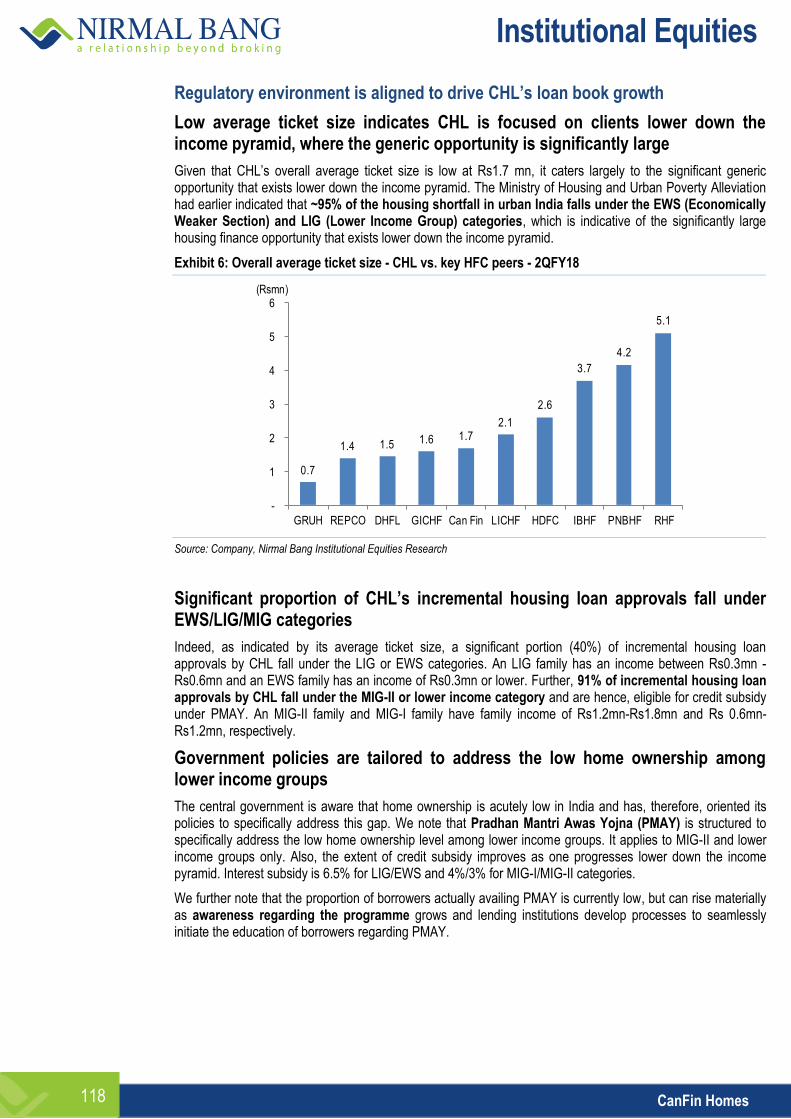
Institutional Equities
CanFin Homes 118
Regulatory environment is aligned to drive CHL’s loan book growth
Low average ticket size indicates CHL is focused on clients lower down the income pyramid, where the generic opportunity is significantly large
Given that CHL’s overall average ticket size is low at Rs1.7 mn, it caters largely to the significant generic opportunity that exists lower down the income pyramid. The Ministry of Housing and Urban Poverty Alleviation had earlier indicated that ~95% of the housing shortfall in urban India falls under the EWS (Economically Weaker Section) and LIG (Lower Income Group) categories, which is indicative of the significantly large housing finance opportunity that exists lower down the income pyramid.
Exhibit 6: Overall average ticket size - CHL vs. key HFC peers - 2QFY18
Source: Company, Nirmal Bang Institutional Equities Research
Significant proportion of CHL’s incremental housing loan approvals fall under EWS/LIG/MIG categories
Indeed, as indicated by its average ticket size, a significant portion (40%) of incremental housing loan approvals by CHL fall under the LIG or EWS categories. An LIG family has an income between Rs0.3mn - Rs0.6mn and an EWS family has an income of Rs0.3mn or lower. Further, 91% of incremental housing loan approvals by CHL fall under the MIG-II or lower income category and are hence, eligible for credit subsidy under PMAY. An MIG-II family and MIG-I family have family income of Rs1.2mn-Rs1.8mn and Rs 0.6mn-Rs1.2mn, respectively.
Government policies are tailored to address the low home ownership among lower income groups
The central government is aware that home ownership is acutely low in India and has, therefore, oriented its policies to specifically address this gap. We note that Pradhan Mantri Awas Yojna (PMAY) is structured to specifically address the low home ownership level among lower income groups. It applies to MIG-II and lower income groups only. Also, the extent of credit subsidy improves as one progresses lower down the income pyramid. Interest subsidy is 6.5% for LIG/EWS and 4%/3% for MIG-I/MIG-II categories.
We further note that the proportion of borrowers actually availing PMAY is currently low, but can rise materially as awareness regarding the programme grows and lending institutions develop processes to seamlessly initiate the education of borrowers regarding PMAY.
0.7
1.4 1.5 1.6 1.72.1
2.6
3.7
4.2
5.1
-
1
2
3
4
5
6
GRUH REPCO DHFL GICHF Can Fin LICHF HDFC IBHF PNBHF RHF
(Rsmn)
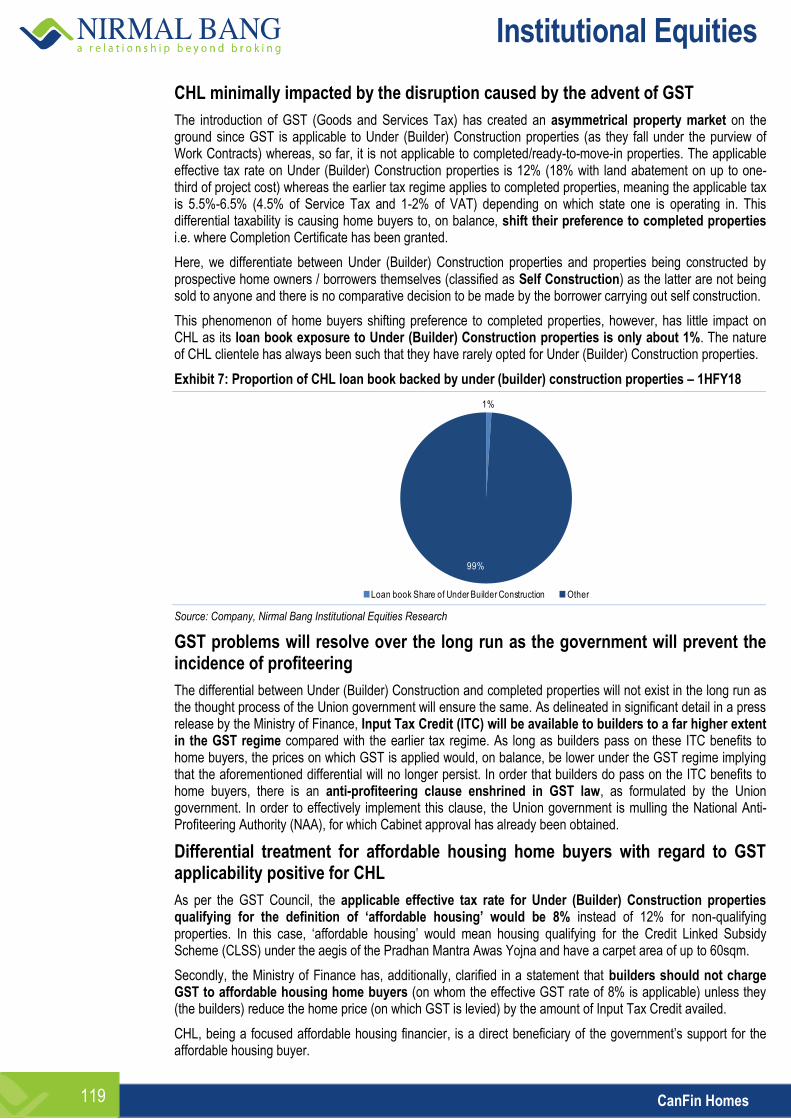
Institutional Equities
CanFin Homes 119
CHL minimally impacted by the disruption caused by the advent of GST
The introduction of GST (Goods and Services Tax) has created an asymmetrical property market on the ground since GST is applicable to Under (Builder) Construction properties (as they fall under the purview of Work Contracts) whereas, so far, it is not applicable to completed/ready-to-move-in properties. The applicable effective tax rate on Under (Builder) Construction properties is 12% (18% with land abatement on up to one-third of project cost) whereas the earlier tax regime applies to completed properties, meaning the applicable tax is 5.5%-6.5% (4.5% of Service Tax and 1-2% of VAT) depending on which state one is operating in. This differential taxability is causing home buyers to, on balance, shift their preference to completed properties i.e. where Completion Certificate has been granted.
Here, we differentiate between Under (Builder) Construction properties and properties being constructed by prospective home owners / borrowers themselves (classified as Self Construction) as the latter are not being sold to anyone and there is no comparative decision to be made by the borrower carrying out self construction.
This phenomenon of home buyers shifting preference to completed properties, however, has little impact on CHL as its loan book exposure to Under (Builder) Construction properties is only about 1%. The nature of CHL clientele has always been such that they have rarely opted for Under (Builder) Construction properties.
Exhibit 7: Proportion of CHL loan book backed by under (builder) construction properties – 1HFY18
Source: Company, Nirmal Bang Institutional Equities Research
GST problems will resolve over the long run as the government will prevent the incidence of profiteering
The differential between Under (Builder) Construction and completed properties will not exist in the long run as the thought process of the Union government will ensure the same. As delineated in significant detail in a press release by the Ministry of Finance, Input Tax Credit (ITC) will be available to builders to a far higher extent in the GST regime compared with the earlier tax regime. As long as builders pass on these ITC benefits to home buyers, the prices on which GST is applied would, on balance, be lower under the GST regime implying that the aforementioned differential will no longer persist. In order that builders do pass on the ITC benefits to home buyers, there is an anti-profiteering clause enshrined in GST law, as formulated by the Union government. In order to effectively implement this clause, the Union government is mulling the National Anti-Profiteering Authority (NAA), for which Cabinet approval has already been obtained.
Differential treatment for affordable housing home buyers with regard to GST applicability positive for CHL
As per the GST Council, the applicable effective tax rate for Under (Builder) Construction properties qualifying for the definition of ‘affordable housing’ would be 8% instead of 12% for non-qualifying properties. In this case, ‘affordable housing’ would mean housing qualifying for the Credit Linked Subsidy Scheme (CLSS) under the aegis of the Pradhan Mantra Awas Yojna and have a carpet area of up to 60sqm.
Secondly, the Ministry of Finance has, additionally, clarified in a statement that builders should not charge GST to affordable housing home buyers (on whom the effective GST rate of 8% is applicable) unless they (the builders) reduce the home price (on which GST is levied) by the amount of Input Tax Credit availed.
CHL, being a focused affordable housing financier, is a direct beneficiary of the government’s support for the affordable housing buyer.
1%
99%
Loan book Share of Under Builder Construction Other
Institutional Equities
CanFin Homes 120
RERA is a near-term concern, but will resolve over the medium term
We note that the introduction of RERA (Real Estate (Regulation and Development) Act 2016) has proved to be a near-term dampener on housing finance disbursement, but we expect its impact to abate in the medium term. From our conversations with various HFCs, on-ground impact of RERA could abate as soon as ~2 quarters after the 3QFY18 quarter.
The reason for generic negative impact on housing loan disbursement is non-compliance of a section of the builder community with RERA norms. Small builders/contractors with lesser sophistication have found compliance with RERA onerous and some of them, so far, have not been able carry out the formalities, paperwork and system installations to be in line with RERA requirements.
Particularly small builders/contractors need not comply with RERA norms
It may be noted that the particularly small contractors are generally not required to comply with RERA as the ballpark sizes of their projects are likely to fall below the minimum threshold above which RERA compliance requirement kicks in. These thresholds are (1) 500sqm and (2) 8 house units i.e. only projects where land area exceeds 500sqm or where the number of house units to be constructed exceeds 8 will have to register with RERA authority and smaller-sized projects will be exempt.
Current and future impact of RERA on CHL not particularly significant
Importantly, RERA compliance is not a matter of ‘whether’ but of ‘when’ and most small builders who have found compliance difficult will eventually fall in line. In particular, we do not see significant difficulties for CHL which sources 90% of loans in its loan book from Tier 1 centres and is, currently, not operating in an eco-system where builder sophistication is so low that compliance takes an exceedingly long time.
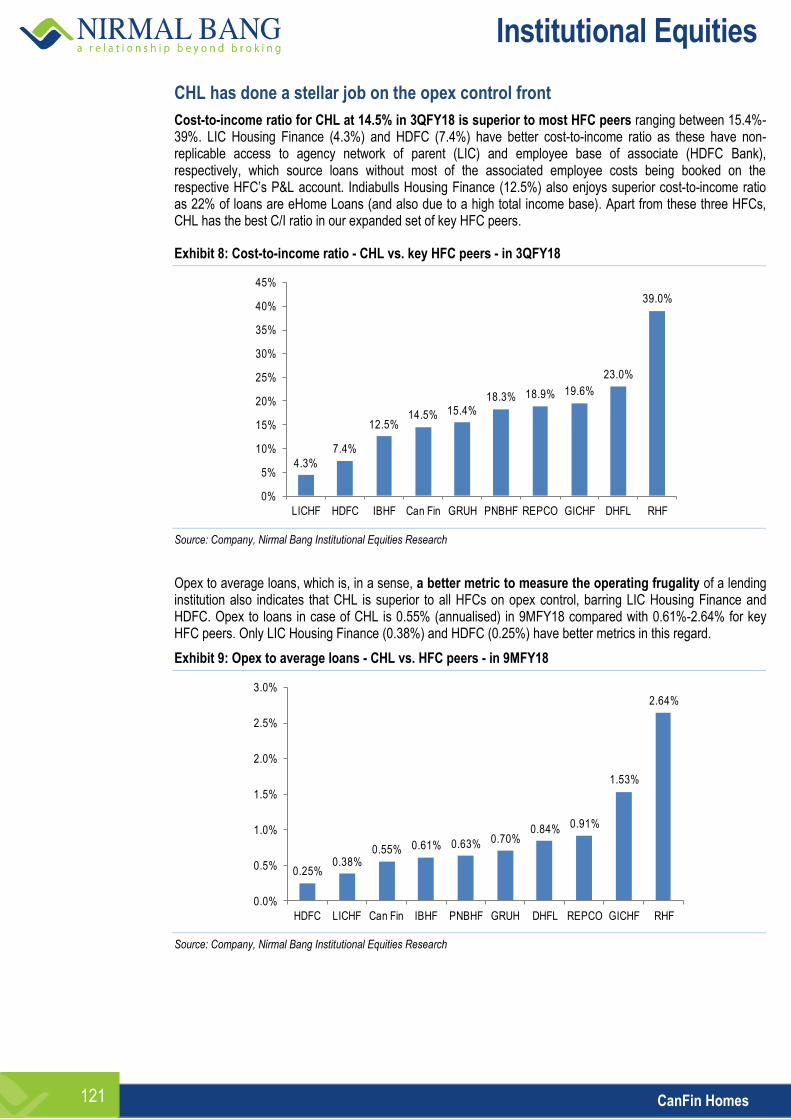
Institutional Equities
CanFin Homes 121
CHL has done a stellar job on the opex control front
Cost-to-income ratio for CHL at 14.5% in 3QFY18 is superior to most HFC peers ranging between 15.4%-39%. LIC Housing Finance (4.3%) and HDFC (7.4%) have better cost-to-income ratio as these have non-replicable access to agency network of parent (LIC) and employee base of associate (HDFC Bank), respectively, which source loans without most of the associated employee costs being booked on the respective HFC’s P&L account. Indiabulls Housing Finance (12.5%) also enjoys superior cost-to-income ratio as 22% of loans are eHome Loans (and also due to a high total income base). Apart from these three HFCs, CHL has the best C/I ratio in our expanded set of key HFC peers.
Exhibit 8: Cost-to-income ratio - CHL vs. key HFC peers - in 3QFY18
Source: Company, Nirmal Bang Institutional Equities Research
Opex to average loans, which is, in a sense, a better metric to measure the operating frugality of a lending institution also indicates that CHL is superior to all HFCs on opex control, barring LIC Housing Finance and HDFC. Opex to loans in case of CHL is 0.55% (annualised) in 9MFY18 compared with 0.61%-2.64% for key HFC peers. Only LIC Housing Finance (0.38%) and HDFC (0.25%) have better metrics in this regard.
Exhibit 9: Opex to average loans - CHL vs. HFC peers - in 9MFY18
Source: Company, Nirmal Bang Institutional Equities Research
4.3%
7.4%
12.5%14.5% 15.4%
18.3% 18.9% 19.6%
23.0%
39.0%
0%
5%
10%
15%
20%
25%
30%
35%
40%
45%
LICHF HDFC IBHF Can Fin GRUH PNBHF REPCO GICHF DHFL RHF
0.25%0.38%
0.55% 0.61% 0.63% 0.70%0.84% 0.91%
1.53%
2.64%
0.0%
0.5%
1.0%
1.5%
2.0%
2.5%
3.0%
HDFC LICHF Can Fin IBHF PNBHF GRUH DHFL REPCO GICHF RHF
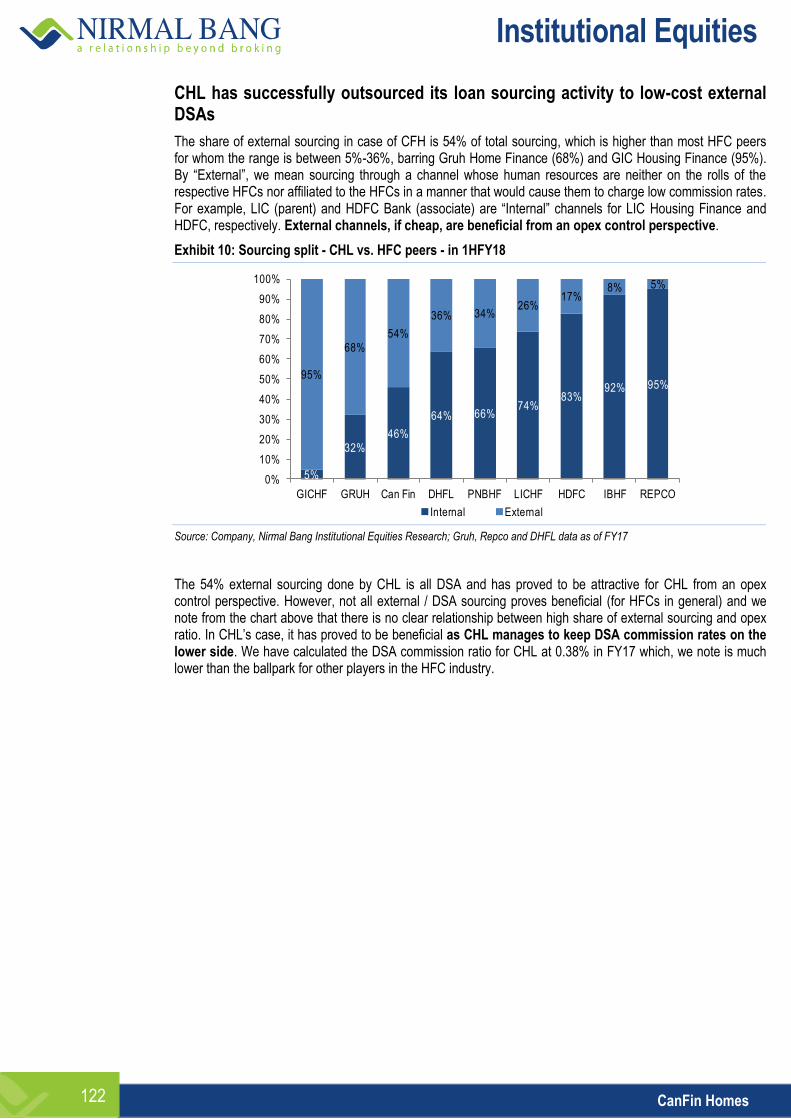
Institutional Equities
CanFin Homes 122
CHL has successfully outsourced its loan sourcing activity to low-cost external DSAs
The share of external sourcing in case of CFH is 54% of total sourcing, which is higher than most HFC peers for whom the range is between 5%-36%, barring Gruh Home Finance (68%) and GIC Housing Finance (95%). By “External”, we mean sourcing through a channel whose human resources are neither on the rolls of the respective HFCs nor affiliated to the HFCs in a manner that would cause them to charge low commission rates. For example, LIC (parent) and HDFC Bank (associate) are “Internal” channels for LIC Housing Finance and HDFC, respectively. External channels, if cheap, are beneficial from an opex control perspective.
Exhibit 10: Sourcing split - CHL vs. HFC peers - in 1HFY18
Source: Company, Nirmal Bang Institutional Equities Research; Gruh, Repco and DHFL data as of FY17
The 54% external sourcing done by CHL is all DSA and has proved to be attractive for CHL from an opex control perspective. However, not all external / DSA sourcing proves beneficial (for HFCs in general) and we note from the chart above that there is no clear relationship between high share of external sourcing and opex ratio. In CHL’s case, it has proved to be beneficial as CHL manages to keep DSA commission rates on the lower side. We have calculated the DSA commission ratio for CHL at 0.38% in FY17 which, we note is much lower than the ballpark for other players in the HFC industry.
5%
32%
46%
64% 66%74%
83%92% 95%
95%
68%
54%
36% 34%26%
17%8% 5%
0%
10%
20%
30%
40%
50%
60%
70%
80%
90%
100%
GICHF GRUH Can Fin DHFL PNBHF LICHF HDFC IBHF REPCO
Internal External
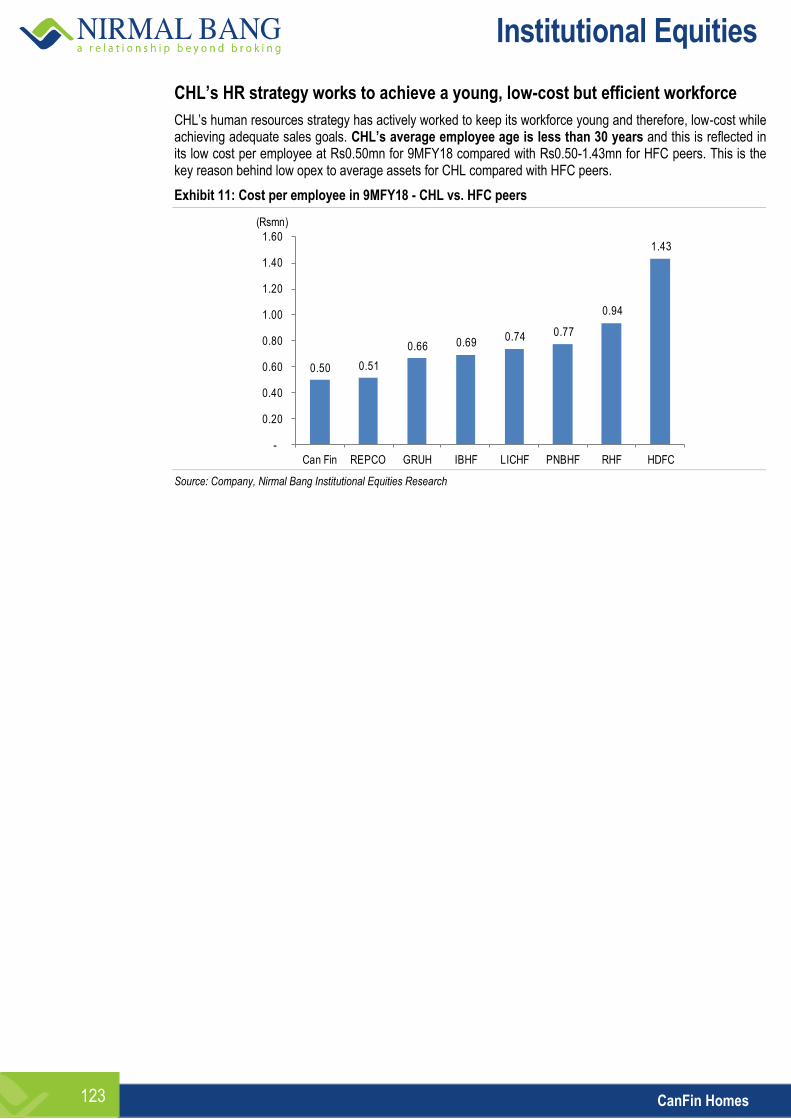
Institutional Equities
CanFin Homes 123
CHL’s HR strategy works to achieve a young, low-cost but efficient workforce
CHL’s human resources strategy has actively worked to keep its workforce young and therefore, low-cost while achieving adequate sales goals. CHL’s average employee age is less than 30 years and this is reflected in its low cost per employee at Rs0.50mn for 9MFY18 compared with Rs0.50-1.43mn for HFC peers. This is the key reason behind low opex to average assets for CHL compared with HFC peers.
Exhibit 11: Cost per employee in 9MFY18 - CHL vs. HFC peers
Source: Company, Nirmal Bang Institutional Equities Research
0.50 0.51
0.66 0.69 0.74 0.77
0.94
1.43
-
0.20
0.40
0.60
0.80
1.00
1.20
1.40
1.60
Can Fin REPCO GRUH IBHF LICHF PNBHF RHF HDFC
(Rsmn)
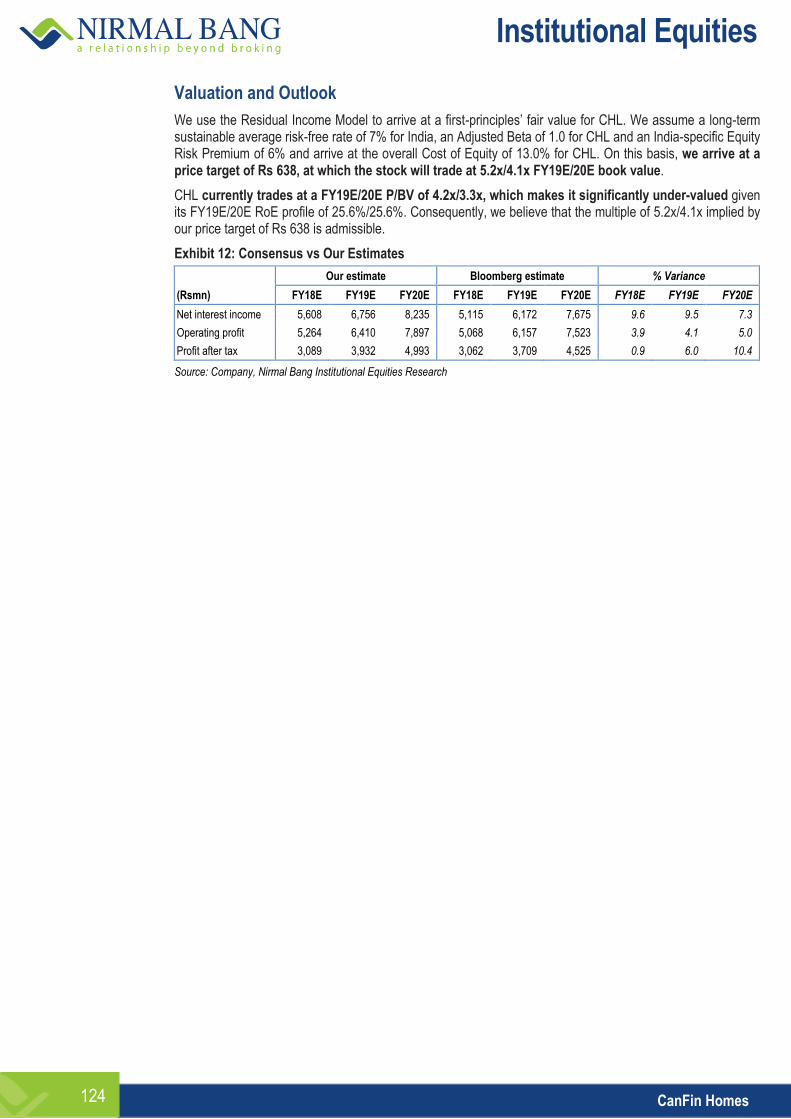
Institutional Equities
CanFin Homes 124
Valuation and Outlook
We use the Residual Income Model to arrive at a first-principles’ fair value for CHL. We assume a long-term sustainable average risk-free rate of 7% for India, an Adjusted Beta of 1.0 for CHL and an India-specific Equity Risk Premium of 6% and arrive at the overall Cost of Equity of 13.0% for CHL. On this basis, we arrive at a price target of Rs 638, at which the stock will trade at 5.2x/4.1x FY19E/20E book value.
CHL currently trades at a FY19E/20E P/BV of 4.2x/3.3x, which makes it significantly under-valued given its FY19E/20E RoE profile of 25.6%/25.6%. Consequently, we believe that the multiple of 5.2x/4.1x implied by our price target of Rs 638 is admissible.
Exhibit 12: Consensus vs Our Estimates
Our estimate Bloomberg estimate % Variance
(Rsmn) FY18E FY19E FY20E FY18E FY19E FY20E FY18E FY19E FY20E
Net interest income 5,608 6,756 8,235 5,115 6,172 7,675 9.6 9.5 7.3
Operating profit 5,264 6,410 7,897 5,068 6,157 7,523 3.9 4.1 5.0
Profit after tax 3,089 3,932 4,993 3,062 3,709 4,525 0.9 6.0 10.4
Source: Company, Nirmal Bang Institutional Equities Research
Institutional Equities
CanFin Homes 125
Key Risks
Competition from banks can rise significantly in a scenario of increased interest rate differential between banks and NBFCs
Bank interest rates are tied to cost of funds in the MCLR regime and this can lead to increased differential between bank and NBFC interest rates, leading to high competitive intensity in salaried home loans, where CFH is most active. However, CFH operates at a low incremental home loan average ticket size of Rs 1.9mn, at which it can able fend off bank competition.
Full stake sale by Canara Bank can have ramifications for CFH credit rating
CFH parent (Canara Bank) is undergoing a capital crisis to an extent given its deteriorated asset quality. This, theoretically, puts a full stake sale of Canara Bank’s stake in CFH (to raise capital) on an accelerated path. The impact from a full stake sale, however, may not be significant since CFH’s superior credit rating is derived from the most conservative under-writing standards, which will stay intact.
Company Overview
Can Fin Homes is a housing finance company with a branch network of 170 branches and a loan book of Rs 151bn. Con Fin Homes has displayed a loan CAGR of 38% over FY12-17 and its yield on advances in its latest reported quarter was 10.4%.
Can Fin Homes has a cost of funds of 7.7% and, as a result, it registered a net interest margin of 3.6%. Its cost to income ratio stood at 14.5%. Consequently, it delivered a return on assets of 2.1% and a return on equity of 23.8%, implying a financial leverage of 10.5. Its employee count stood at 632 and its Capital Adequacy Ratio was 19.2%.
Institutional Equities
CanFin Homes 126
Exhibit 13: Management team/ Key executives
Name Designation Experience
Sarada Kumar Hota MD, and Whole time Director
Shri. Sarada Kumar Hota has been the Managing Director of Can Fin Homes Ltd. since May 19, 2016. Shri. Hota served as Deputy General Manager in the Recovery wing of Canara Bank, Head Office, Bengaluru. Shri. Hota started his career as an Officer in Canara Bank in the year 1990. Shri. Hota is a senior banker with over 25 years of commercial banking experience having served across the Country. During his service in the Bank, he has headed different branches, Circle Offices and various departments at the Circle and Corporate level. He was heading the Jaipur and Nagpur Circles of Canara Bank. He also carries with him the experience of working in the areas of Human Relations, Strategic Business Planning and Profit Planning at the Head Office of the Bank in Bengaluru. He has been Additional & Whole-Time Director of Can Fin Homes Ltd. since April 28, 2016.
Atanu Bagchi CFO and Deputy GM
Mr. Atanu Bagchi serves as Chief Financial Officer and Deputy General Manager of Can Fin Homes Ltd. and served as its Chief Manager.
Source: Company, Nirmal Bang Institutional Equities Research
Exhibit 14: Board members
Name Designation Experience
Kokkarne Natarajan Prithviraj
Chairman
Mr. Kokkarne Natarajan Prithviraj serves as the Chairman of Management Board at Shinsei Trustee Company (India) Private Limited. Mr. Prithviraj has more than 38 years of experience in the banking industry. He serves as Chairman and Member of the Management Board of Daiwa Trustee Company (India) Private Limited. He served as the Chairman and Managing Director of Oriental Bank of Commerce from April 2006 to June 4, 2007. He served as General Manager of Punjab National Bank Corporate Credit & Human Resource Department and General Manager of Punjab National Bank - Western Zone. He has been the Chairman and Independent Non-Executive Director of Can Fin Homes Limited since June 04, 2014. He has been Independent Non executive Director at Dwarikesh Sugar Industries Ltd. since November 30, 2009. He has been an Independent director of Axis Finance Limited since July 04, 2016. He serves as a Director of Brickwork Ratings India Pvt. Ltd. He served as Independent Director of Surana Industries Ltd. from May 2, 2008 to February 04, 2016. He served as Director of The Oriental Insurance Company Limited. He served as a Director of AXIS Bank Limited since January 9, 2008 until January 8, 2016. He served as an Executive Director of United Bank of India. He served as the Whole time Director of Oriental Bank of Commerce until March 31, 2007. He served as Independent Director of Falcon Tyres Limited from June 28, 2008 to March 31, 2014. He served as a Director of DUNLOP India Ltd. since June 28, 2008.
P. V. Bharathi Non-Executive Director
Mrs. P. V. Bharathi has been Executive Director of Canara Bank Limited since September 15, 2016 and serves as the firms's General Manager in the Risk Management Wing. Mrs. Bharathi has more than 31 years of experience in the banking industry. She has served in different branches in the NCR region and also in Tamil Nadu State. She has experience in rural, semi-urban, urban and metro branches of the bank. She also served in administrative offices of the bank. Mrs. Bharathi has been a Non-Executive Director of Can Fin Homes Ltd. since September 22, 2014. Mrs. Bharathi serves as a Member of Board of Directors of Canbank Venture Capital Ltd. She served as Additional Director of Can Fin Homes Ltd. since September 22, 2014. She is a Certified Associate of the Indian Institute of Bankers (CAIIB).
Ganesan Naganathan Independent Director
Mr. Ganesan Naganathan, FCA, has been Independent Director of Can Fin Homes Ltd. since September 7, 2016. Mr. Naganathan is a Chartered Accountant.
Srinivas Ananthacharya Kadur
Non-Executive Director
Mr. Srinivas Ananthacharya Kadur serves as a General Manager of Canara Bank, Head Office, Bangalore. Mr. Kadur has been a Non-Executive Director of Can Fin Homes Ltd., since June 07, 2013. Mr. Kadur started his career as a Technical Field Officer in Canara Bank in February, 1984. During his service in the Bank over a period of 30 years, he has served in different branches of the Bank, including Prime Corporate branch at Pune and Chennai, Circle Office, Mumbai, Corporate Merchant Banking Division, Mumbai and Risk Management Wing at the Head Office.
Source: Company, Nirmal Bang Institutional Equities Research
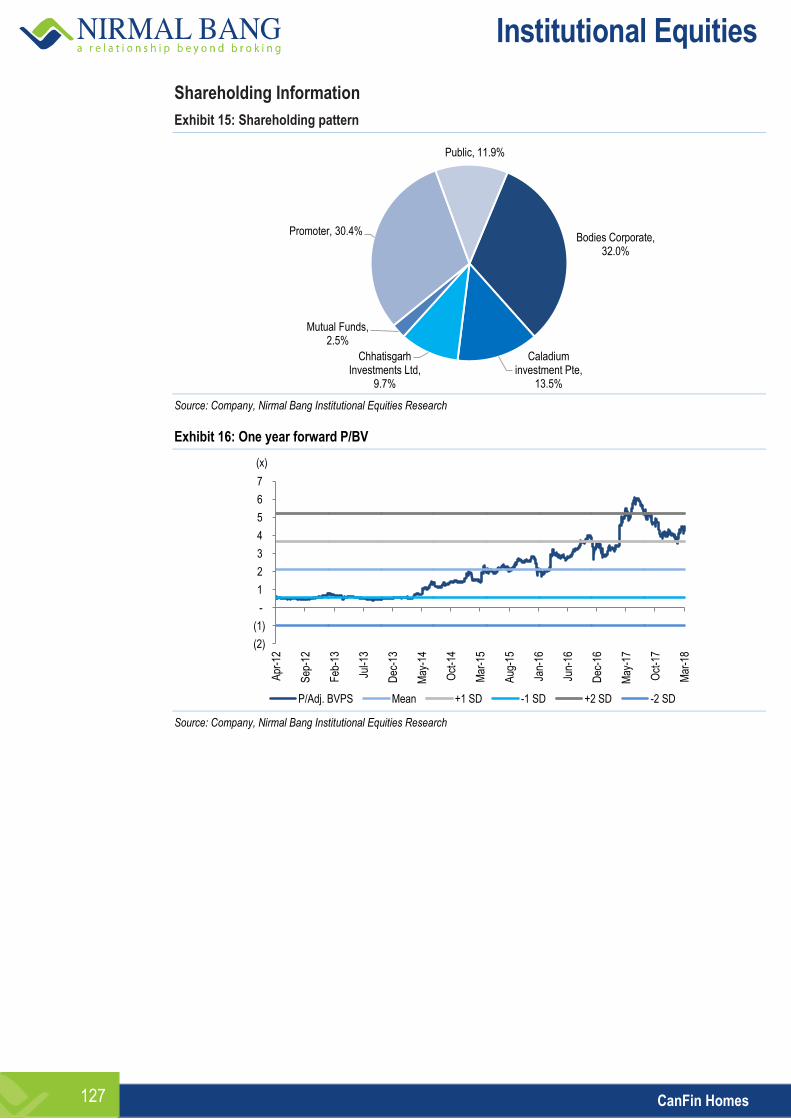
Institutional Equities
CanFin Homes 127
Shareholding Information
Exhibit 15: Shareholding pattern
Source: Company, Nirmal Bang Institutional Equities Research
Exhibit 16: One year forward P/BV
Source: Company, Nirmal Bang Institutional Equities Research
Bodies Corporate, 32.0%
Caladium investment Pte,
13.5%
Chhatisgarh Investments Ltd,
9.7%
Mutual Funds, 2.5%
Promoter, 30.4%
Public, 11.9%
(2)
(1)
-
1
2
3
4
5
6
7
Apr
-12
Sep
-12
Feb
-13
Jul-1
3
Dec
-13
May
-14
Oct
-14
Mar
-15
Aug
-15
Jan-
16
Jun-
16
Dec
-16
May
-17
Oct
-17
Mar
-18
P/Adj. BVPS Mean +1 SD -1 SD +2 SD -2 SD
(x)
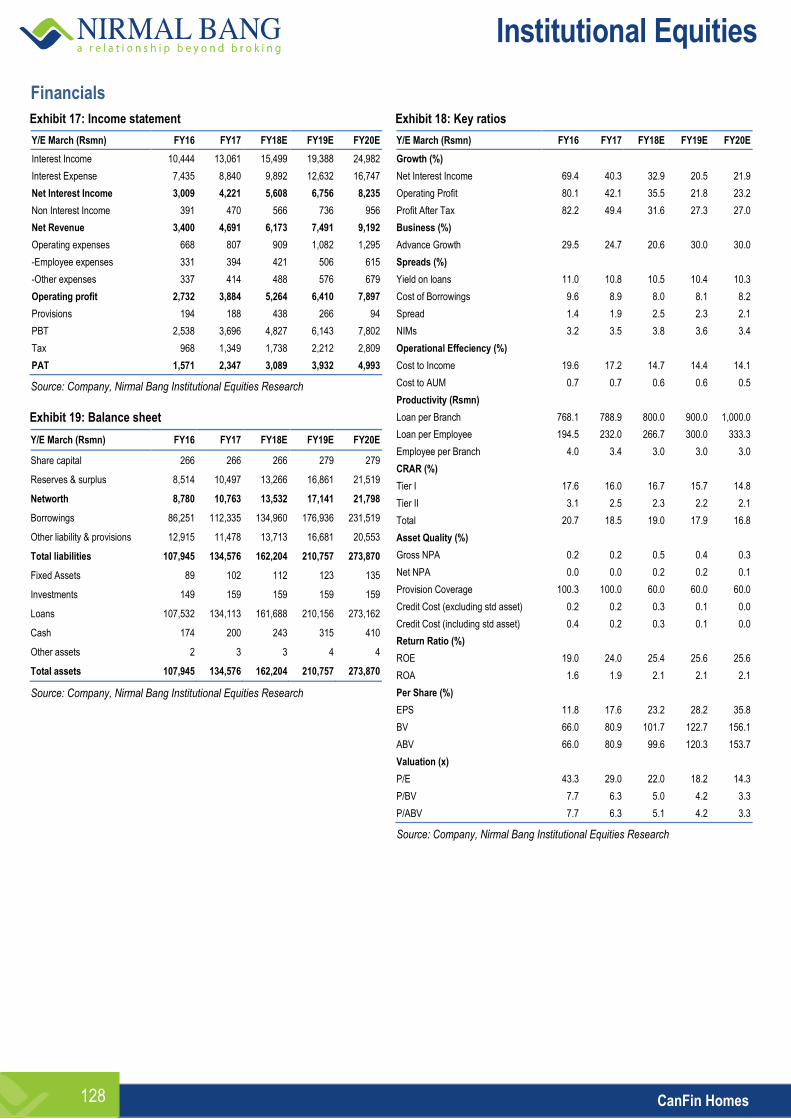
Institutional Equities
CanFin Homes 128
Financials
Exhibit 17: Income statement
Y/E March (Rsmn) FY16 FY17 FY18E FY19E FY20E
Interest Income 10,444 13,061 15,499 19,388 24,982
Interest Expense 7,435 8,840 9,892 12,632 16,747
Net Interest Income 3,009 4,221 5,608 6,756 8,235
Non Interest Income 391 470 566 736 956
Net Revenue 3,400 4,691 6,173 7,491 9,192
Operating expenses 668 807 909 1,082 1,295
-Employee expenses 331 394 421 506 615
-Other expenses 337 414 488 576 679
Operating profit 2,732 3,884 5,264 6,410 7,897
Provisions 194 188 438 266 94
PBT 2,538 3,696 4,827 6,143 7,802
Tax 968 1,349 1,738 2,212 2,809
PAT 1,571 2,347 3,089 3,932 4,993
Source: Company, Nirmal Bang Institutional Equities Research
Exhibit 19: Balance sheet
Y/E March (Rsmn) FY16 FY17 FY18E FY19E FY20E
Share capital 266 266 266 279 279
Reserves & surplus 8,514 10,497 13,266 16,861 21,519
Networth 8,780 10,763 13,532 17,141 21,798
Borrowings 86,251 112,335 134,960 176,936 231,519
Other liability & provisions 12,915 11,478 13,713 16,681 20,553
Total liabilities 107,945 134,576 162,204 210,757 273,870
Fixed Assets 89 102 112 123 135
Investments 149 159 159 159 159
Loans 107,532 134,113 161,688 210,156 273,162
Cash 174 200 243 315 410
Other assets 2 3 3 4 4
Total assets 107,945 134,576 162,204 210,757 273,870
Source: Company, Nirmal Bang Institutional Equities Research
Exhibit 18: Key ratios
Y/E March (Rsmn) FY16 FY17 FY18E FY19E FY20E
Growth (%)
Net Interest Income 69.4 40.3 32.9 20.5 21.9
Operating Profit 80.1 42.1 35.5 21.8 23.2
Profit After Tax 82.2 49.4 31.6 27.3 27.0
Business (%)
Advance Growth 29.5 24.7 20.6 30.0 30.0
Spreads (%)
Yield on loans 11.0 10.8 10.5 10.4 10.3
Cost of Borrowings 9.6 8.9 8.0 8.1 8.2
Spread 1.4 1.9 2.5 2.3 2.1
NIMs 3.2 3.5 3.8 3.6 3.4
Operational Effeciency (%)
Cost to Income 19.6 17.2 14.7 14.4 14.1
Cost to AUM 0.7 0.7 0.6 0.6 0.5
Productivity (Rsmn)
Loan per Branch 768.1 788.9 800.0 900.0 1,000.0
Loan per Employee 194.5 232.0 266.7 300.0 333.3
Employee per Branch 4.0 3.4 3.0 3.0 3.0
CRAR (%)
Tier I 17.6 16.0 16.7 15.7 14.8
Tier II 3.1 2.5 2.3 2.2 2.1
Total 20.7 18.5 19.0 17.9 16.8
Asset Quality (%)
Gross NPA 0.2 0.2 0.5 0.4 0.3
Net NPA 0.0 0.0 0.2 0.2 0.1
Provision Coverage 100.3 100.0 60.0 60.0 60.0
Credit Cost (excluding std asset) 0.2 0.2 0.3 0.1 0.0
Credit Cost (including std asset) 0.4 0.2 0.3 0.1 0.0
Return Ratio (%)
ROE 19.0 24.0 25.4 25.6 25.6
ROA 1.6 1.9 2.1 2.1 2.1
Per Share (%)
EPS 11.8 17.6 23.2 28.2 35.8
BV 66.0 80.9 101.7 122.7 156.1
ABV 66.0 80.9 99.6 120.3 153.7
Valuation (x)
P/E 43.3 29.0 22.0 18.2 14.3
P/BV 7.7 6.3 5.0 4.2 3.3
P/ABV 7.7 6.3 5.1 4.2 3.3
Source: Company, Nirmal Bang Institutional Equities Research

Please refer to the disclaimer towards the end of the document.
Institutional Equities
Initi
atin
g C
over
age
Reuters: PNBH.NS; Bloomberg: PNBHOUSI IN
PNB Housing Finance
Playing It Large, Prudently
PNB Housing Finance (PNBHF) is a housing finance company (HFC) with a network of 80 branches and loan book size of Rs463bn. We are bullish on PNBHF as: (1) The HFC is geared towards high asset growth driven by (a) meaningful presence in large-ticket businesses (b) pan-India focus (c) affiliation to PNB umbrella brand and (d) operating at an ‘efficient frontier’ in terms of loan ticket size. (2) It maintains cost of borrowings leadership because of superior credit risk perception in debt capital market. (3) It (a) maintains pristine asset quality even when viewed from a seasoning prism (b) is a cautious construction finance lender and (c) maintains ultra-high provision cover. We initiate coverage on the stock with a Buy rating and a target price of Rs1410, which values the stock at 3.2x/2.7x FY19E/FY20E P/BV.
PNBHF strategy and DNA geared towards high risk-managed asset growth: PNBHF meaningfully conducts the entire gamut of ultra-large-ticket businesses that a ‘monoline’ HFC can, which account for 21% of 1HFY18 loans. Secondly, PNBHF eschews geographically contiguous growth in any catchment area and has a truly pan-India approach, which lends scalability. Exposure to North India has fallen from 71% in FY12 to 35% in 1HFY18. Thirdly, PNBHF benefits from the PNB umbrella brand, which will stay despite fraud at the parent. Fourth, PNBHF operates, from its perspective, at an optimal average ticket size of Rs2.6mn for salaried home loans, where it can fend off competition from banks.
PNBHF is the cost of borrowings leader among key listed HFCs for idiosyncratic reasons: Credit rating alone is not a differentiating factor as all HFCs in our expanded peer set (10 HFCs) are AAA-rated, barring GIC Housing Finance, Repco Finance, and Reliance Home Finance. Debt capital markets as well as banks apply lower credit risk premium to PNBHF instruments on the back of the latter’s sound underwriting standards. Cost of borrowing at PNBHF for 3QFY18 stood at 7.5% compared with 7.6%-8.8% for HFC peers.
PNBHF is an asset quality champion despite high balance sheet growth: PNBHF has a GNPA ratio of 0.4% for 3QFY18 compared with 0.5%-3.7% for key HFC peers. This is the result of superior underwriting standards and not due to of the portfolio not being seasoned as the two-year lagged GNPA ratio for PNBHF in FY17 (well into PNBHF’s high-growth phase) stood at 0.5% compared with 1.1% for the rest of the HFC industry. PNBHF is particularly cautious with construction finance, adhering to the most stringent standards including funding only those projects that are within six months to completion. PNBHF also makes prudent contingent provisions on its book, taking provision coverage ratio to 174% as of 3QFY18-end compared with 46%-124% for key HFC peers, barring IBHF at 180%.
Valuation and Outlook: We have used the residual income model to value PNBHF and arrived at the target price of Rs1410. PNBHF currently trades at 2.6x/2.1x FY19E/FY20E P/BV and we believe that our target price is reasonable given PNBHF’s RoE profile of 16.9%/19.6% for FY19E/FY20E and long-term outlook.
BUY
Sector: NBFCs
CMP: Rs1,139
Target Price: Rs1,410
Upside: 24%
Shivaji Thapliyal Research Analyst
+91-22-6273 8068 Shreesh Chandra Research Associate [email protected] +91-22-6273 8028
Key Data
Current Shares O/S (mn) 166.6
Mkt Cap (Rsbn/US$bn) 189.2/2.9
52 Wk H / L (Rs) 1,718/1,006
Daily Vol. (3M NSE Avg.) 196,868
Shareholding (%) 3QFY18 2QFY18 1QFY18
Promoter 33.0 38.9 38.9
Public 67.0 61.1 61.0
Others - - -
One Year Indexed Stock Performance
Price Performance (%)
1 M 6 M 1 Yr
PNB Housing (6.5) (27.3) 2.7
Nifty Index (4.8) 0.3 10.0
Source: Bloomberg
Y/E March (Rsmn) FY16 FY17 FY18E FY19E FY20E
Net Interest Income 7,585 11,297 16,415 22,903 31,077
Pre-Provision Profit 5,838 9,015 14,500 19,384 26,166
PAT 3,265 5,237 8,501 11,513 15,850
EPS (Rs) 25.7 31.6 51.3 69.5 95.7
BV (Rs) 169.1 336.7 380.8 443.1 531.6
P/E (x) 44.3 36.0 22.2 16.4 11.9
P/BV (x) 6.7 3.4 3.0 2.6 2.1
Gross NPA (%) 0.2 0.2 0.4 0.5 0.5
Net NPA (%) 0.1 0.2 0.1 0.1 0.1
ROA (%) 1.3 1.4 1.6 1.5 1.6
ROE (%) 17.5 13.6 14.3 16.9 19.6
Source: Company, Nirmal Bang Institutional Equities Research
80
90
100
110
120
130
140
150
160
Mar-17 May-17 Jul-17 Sep-17 Nov-17 Jan-18 Mar-18
PNB HOUSING FINA Nifty 50
26 March 2018
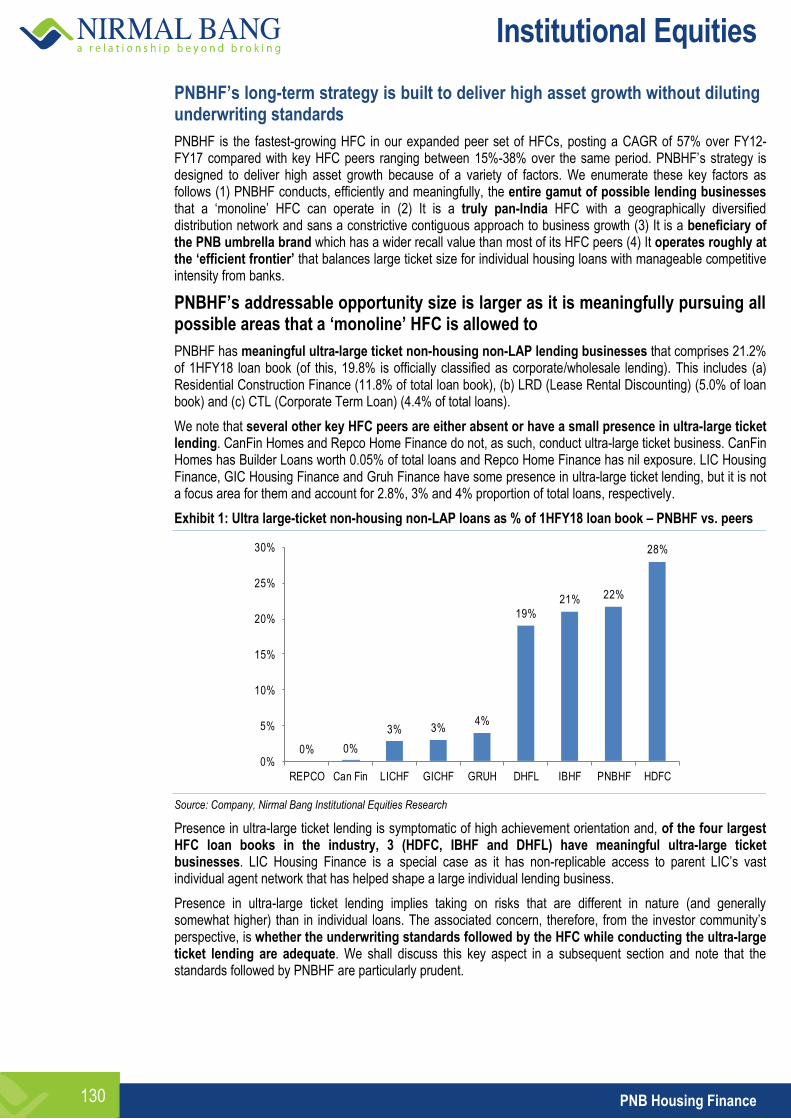
Institutional Equities
PNB Housing Finance 130
PNBHF’s long-term strategy is built to deliver high asset growth without diluting underwriting standards
PNBHF is the fastest-growing HFC in our expanded peer set of HFCs, posting a CAGR of 57% over FY12-FY17 compared with key HFC peers ranging between 15%-38% over the same period. PNBHF’s strategy is designed to deliver high asset growth because of a variety of factors. We enumerate these key factors as follows (1) PNBHF conducts, efficiently and meaningfully, the entire gamut of possible lending businesses that a ‘monoline’ HFC can operate in (2) It is a truly pan-India HFC with a geographically diversified distribution network and sans a constrictive contiguous approach to business growth (3) It is a beneficiary of the PNB umbrella brand which has a wider recall value than most of its HFC peers (4) It operates roughly at the ‘efficient frontier’ that balances large ticket size for individual housing loans with manageable competitive intensity from banks.
PNBHF’s addressable opportunity size is larger as it is meaningfully pursuing all possible areas that a ‘monoline’ HFC is allowed to
PNBHF has meaningful ultra-large ticket non-housing non-LAP lending businesses that comprises 21.2% of 1HFY18 loan book (of this, 19.8% is officially classified as corporate/wholesale lending). This includes (a) Residential Construction Finance (11.8% of total loan book), (b) LRD (Lease Rental Discounting) (5.0% of loan book) and (c) CTL (Corporate Term Loan) (4.4% of total loans).
We note that several other key HFC peers are either absent or have a small presence in ultra-large ticket lending. CanFin Homes and Repco Home Finance do not, as such, conduct ultra-large ticket business. CanFin Homes has Builder Loans worth 0.05% of total loans and Repco Home Finance has nil exposure. LIC Housing Finance, GIC Housing Finance and Gruh Finance have some presence in ultra-large ticket lending, but it is not a focus area for them and account for 2.8%, 3% and 4% proportion of total loans, respectively.
Exhibit 1: Ultra large-ticket non-housing non-LAP loans as % of 1HFY18 loan book – PNBHF vs. peers
Source: Company, Nirmal Bang Institutional Equities Research
Presence in ultra-large ticket lending is symptomatic of high achievement orientation and, of the four largest HFC loan books in the industry, 3 (HDFC, IBHF and DHFL) have meaningful ultra-large ticket businesses. LIC Housing Finance is a special case as it has non-replicable access to parent LIC’s vast individual agent network that has helped shape a large individual lending business.
Presence in ultra-large ticket lending implies taking on risks that are different in nature (and generally somewhat higher) than in individual loans. The associated concern, therefore, from the investor community’s perspective, is whether the underwriting standards followed by the HFC while conducting the ultra-large ticket lending are adequate. We shall discuss this key aspect in a subsequent section and note that the standards followed by PNBHF are particularly prudent.
0% 0%
3% 3%4%
19%
21% 22%
28%
0%
5%
10%
15%
20%
25%
30%
REPCO Can Fin LICHF GICHF GRUH DHFL IBHF PNBHF HDFC
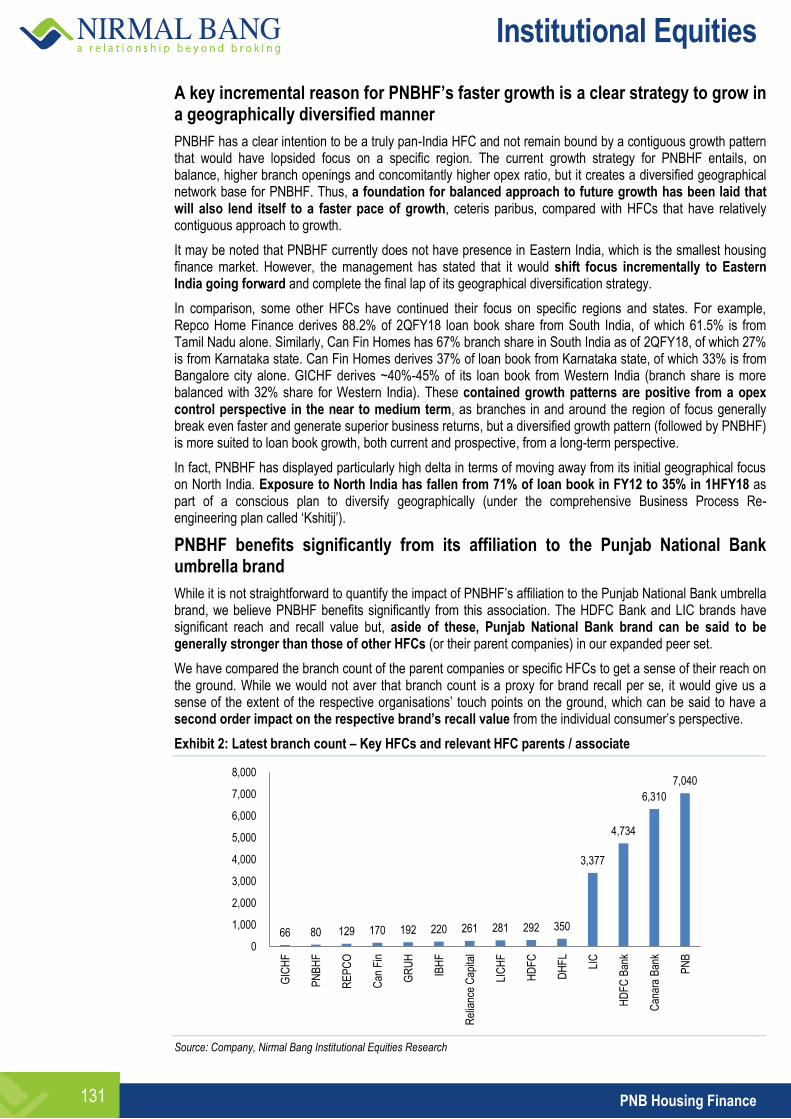
Institutional Equities
PNB Housing Finance 131
A key incremental reason for PNBHF’s faster growth is a clear strategy to grow in a geographically diversified manner
PNBHF has a clear intention to be a truly pan-India HFC and not remain bound by a contiguous growth pattern that would have lopsided focus on a specific region. The current growth strategy for PNBHF entails, on balance, higher branch openings and concomitantly higher opex ratio, but it creates a diversified geographical network base for PNBHF. Thus, a foundation for balanced approach to future growth has been laid that will also lend itself to a faster pace of growth, ceteris paribus, compared with HFCs that have relatively contiguous approach to growth.
It may be noted that PNBHF currently does not have presence in Eastern India, which is the smallest housing finance market. However, the management has stated that it would shift focus incrementally to Eastern India going forward and complete the final lap of its geographical diversification strategy.
In comparison, some other HFCs have continued their focus on specific regions and states. For example, Repco Home Finance derives 88.2% of 2QFY18 loan book share from South India, of which 61.5% is from Tamil Nadu alone. Similarly, Can Fin Homes has 67% branch share in South India as of 2QFY18, of which 27% is from Karnataka state. Can Fin Homes derives 37% of loan book from Karnataka state, of which 33% is from Bangalore city alone. GICHF derives ~40%-45% of its loan book from Western India (branch share is more balanced with 32% share for Western India). These contained growth patterns are positive from a opex control perspective in the near to medium term, as branches in and around the region of focus generally break even faster and generate superior business returns, but a diversified growth pattern (followed by PNBHF) is more suited to loan book growth, both current and prospective, from a long-term perspective.
In fact, PNBHF has displayed particularly high delta in terms of moving away from its initial geographical focus on North India. Exposure to North India has fallen from 71% of loan book in FY12 to 35% in 1HFY18 as part of a conscious plan to diversify geographically (under the comprehensive Business Process Re-engineering plan called ‘Kshitij’).
PNBHF benefits significantly from its affiliation to the Punjab National Bank umbrella brand
While it is not straightforward to quantify the impact of PNBHF’s affiliation to the Punjab National Bank umbrella brand, we believe PNBHF benefits significantly from this association. The HDFC Bank and LIC brands have significant reach and recall value but, aside of these, Punjab National Bank brand can be said to be generally stronger than those of other HFCs (or their parent companies) in our expanded peer set.
We have compared the branch count of the parent companies or specific HFCs to get a sense of their reach on the ground. While we would not aver that branch count is a proxy for brand recall per se, it would give us a sense of the extent of the respective organisations’ touch points on the ground, which can be said to have a second order impact on the respective brand’s recall value from the individual consumer’s perspective.
Exhibit 2: Latest branch count – Key HFCs and relevant HFC parents / associate
Source: Company, Nirmal Bang Institutional Equities Research
66 80 129 170 192 220 261 281 292 350
3,377
4,734
6,310
7,040
0
1,000
2,000
3,000
4,000
5,000
6,000
7,000
8,000
GIC
HF
PN
BH
F
RE
PC
O
Can
Fin
GR
UH
IBH
F
Rel
ianc
e C
apita
l
LIC
HF
HD
FC
DH
FL
LIC
HD
FC
Ban
k
Can
ara
Ban
k
PN
B
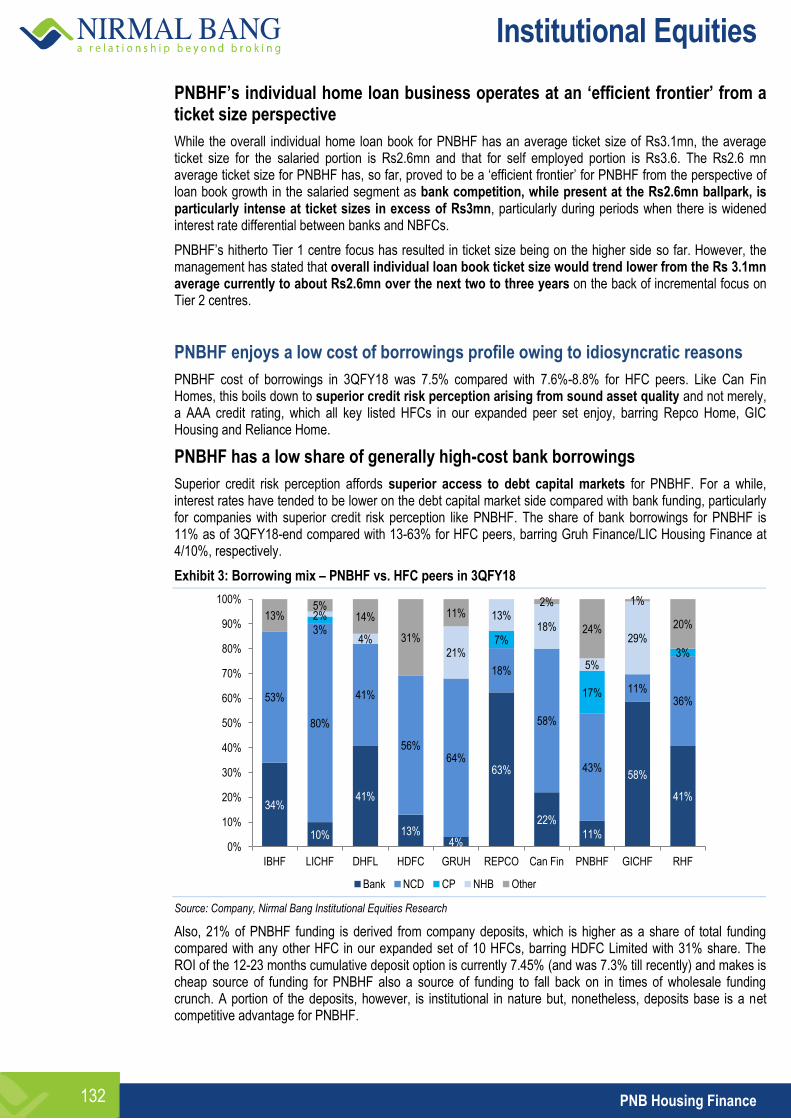
Institutional Equities
PNB Housing Finance 132
PNBHF’s individual home loan business operates at an ‘efficient frontier’ from a ticket size perspective
While the overall individual home loan book for PNBHF has an average ticket size of Rs3.1mn, the average ticket size for the salaried portion is Rs2.6mn and that for self employed portion is Rs3.6. The Rs2.6 mn average ticket size for PNBHF has, so far, proved to be a ‘efficient frontier’ for PNBHF from the perspective of loan book growth in the salaried segment as bank competition, while present at the Rs2.6mn ballpark, is particularly intense at ticket sizes in excess of Rs3mn, particularly during periods when there is widened interest rate differential between banks and NBFCs.
PNBHF’s hitherto Tier 1 centre focus has resulted in ticket size being on the higher side so far. However, the management has stated that overall individual loan book ticket size would trend lower from the Rs 3.1mn average currently to about Rs2.6mn over the next two to three years on the back of incremental focus on Tier 2 centres.
PNBHF enjoys a low cost of borrowings profile owing to idiosyncratic reasons
PNBHF cost of borrowings in 3QFY18 was 7.5% compared with 7.6%-8.8% for HFC peers. Like Can Fin Homes, this boils down to superior credit risk perception arising from sound asset quality and not merely, a AAA credit rating, which all key listed HFCs in our expanded peer set enjoy, barring Repco Home, GIC Housing and Reliance Home.
PNBHF has a low share of generally high-cost bank borrowings
Superior credit risk perception affords superior access to debt capital markets for PNBHF. For a while, interest rates have tended to be lower on the debt capital market side compared with bank funding, particularly for companies with superior credit risk perception like PNBHF. The share of bank borrowings for PNBHF is 11% as of 3QFY18-end compared with 13-63% for HFC peers, barring Gruh Finance/LIC Housing Finance at 4/10%, respectively.
Exhibit 3: Borrowing mix – PNBHF vs. HFC peers in 3QFY18
Source: Company, Nirmal Bang Institutional Equities Research
Also, 21% of PNBHF funding is derived from company deposits, which is higher as a share of total funding compared with any other HFC in our expanded set of 10 HFCs, barring HDFC Limited with 31% share. The ROI of the 12-23 months cumulative deposit option is currently 7.45% (and was 7.3% till recently) and makes is cheap source of funding for PNBHF also a source of funding to fall back on in times of wholesale funding crunch. A portion of the deposits, however, is institutional in nature but, nonetheless, deposits base is a net competitive advantage for PNBHF.
34%
10%
41%
13% 4%
63%
22%
11%
58%
41%
53%
80%
41%
56% 64%
18%
58%
43%
11% 36%
3% 7%
17%
3%
2%
4% 21%
13% 18%
5%
29%
13% 5%
14%
31%
11% 2%
24%
1%
20%
0%
10%
20%
30%
40%
50%
60%
70%
80%
90%
100%
IBHF LICHF DHFL HDFC GRUH REPCO Can Fin PNBHF GICHF RHF
Bank NCD CP NHB Other
Institutional Equities
PNB Housing Finance 133
Fraud at parent Punjab National Bank does not impact PNBHF credit risk profile from a long-term perspective
PNBHF’s parent Punjab National Bank (PNB) has been hit with a major fraud, which essentially entails unauthorised siphoning out of ~Rs136bn from a single Mumbai branch. While this does put pressure on PNB’s capital level in the near term, PNB’s management has clarified on a conference call that even a worst case scenario materialising will not deplete capital level below the regulatory requirement.
While capital constraints at PNB theoretically mean (1) Lower capital support for PNBHF from parent, ceteris paribus. (2) Greater urgency on the part of PNB to offload stake completely in PNBHF to raise capital for itself in this time of need and thereby, result in permanent comprehensive disassociation with PNBHF and also, possibly, loss of PNB umbrella brand for PNBHF.
These theoretical possibilities, however, are not likely to play out in any negative manner for PNBHF. Lower capital support from PNB, ceteris paribus, will not be a major factor as: (1) PNBHF itself is well-capitalised with a Tier 1 capital ratio of 13.3% as of 3QFY18-end and does not need to return to equity capital markets for capital raise in the near to medium term. (2) PNBHF has strong long-term prospects that will allow it to raise capital from (a) other existing investors including key private equity shareholders like Carlyle Group (largest shareholder) and General Atlantic as well as (b) New investors (3) Parent PNB has other significant non-core equity ownerships like PNB Metlife, UTI Asset Management and PNB Gilts. (4) Government of India has already indicated it would infuse Rs54.7bn in equity capital into PNB via the recapitalisation bond structure. (5) PNB has raised equity capital amounting to Rs50bn as recently as December 2017 via a Qualified Institutional Placement.
Parent PNB, also, cannot offload full stake in PNBHF right now as the latter listed on 7th November 2016 and, as per SEBI rules, PNB has to wait till at least three years (till 7th November 2019) before it can reduce its stake below a minimum of 20%. We do not believe that reduction of stake to a possible 20% will entail a comprehensive disassociation (from a capital support perspective) with PNBHF nor a loss of PNB umbrella brand for PNBHF. We further aver that the current capital crisis at parent PNB will abate well before 7th November 2019.
For the record, PNB had reduced its stake in PNBHF from 51% to 39% via the IPO. It further reduced its stake to 32.96% by selling ~6% stake sale in December 2017. The Carlyle Group held majority stake in PNBHF at 37.3% of equity as of 3QFY18-end. General Atlantic holds a 8.5% stake in PNBHF as of 3QFY18-end.
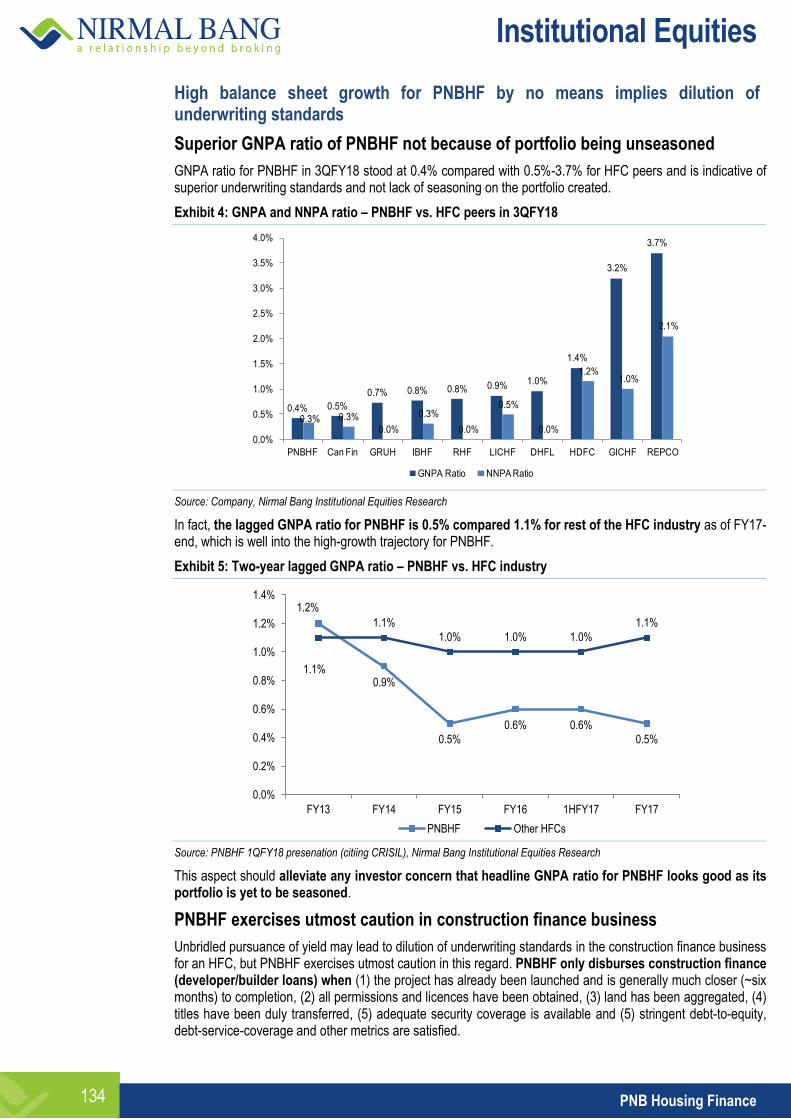
Institutional Equities
PNB Housing Finance 134
High balance sheet growth for PNBHF by no means implies dilution of underwriting standards
Superior GNPA ratio of PNBHF not because of portfolio being unseasoned
GNPA ratio for PNBHF in 3QFY18 stood at 0.4% compared with 0.5%-3.7% for HFC peers and is indicative of superior underwriting standards and not lack of seasoning on the portfolio created.
Exhibit 4: GNPA and NNPA ratio – PNBHF vs. HFC peers in 3QFY18
Source: Company, Nirmal Bang Institutional Equities Research
In fact, the lagged GNPA ratio for PNBHF is 0.5% compared 1.1% for rest of the HFC industry as of FY17-end, which is well into the high-growth trajectory for PNBHF.
Exhibit 5: Two-year lagged GNPA ratio – PNBHF vs. HFC industry
Source: PNBHF 1QFY18 presenation (citiing CRISIL), Nirmal Bang Institutional Equities Research
This aspect should alleviate any investor concern that headline GNPA ratio for PNBHF looks good as its portfolio is yet to be seasoned.
PNBHF exercises utmost caution in construction finance business
Unbridled pursuance of yield may lead to dilution of underwriting standards in the construction finance business for an HFC, but PNBHF exercises utmost caution in this regard. PNBHF only disburses construction finance (developer/builder loans) when (1) the project has already been launched and is generally much closer (~six months) to completion, (2) all permissions and licences have been obtained, (3) land has been aggregated, (4) titles have been duly transferred, (5) adequate security coverage is available and (5) stringent debt-to-equity, debt-service-coverage and other metrics are satisfied.
0.4% 0.5%
0.7% 0.8% 0.8% 0.9% 1.0%
1.4%
3.2%
3.7%
0.3% 0.3%
0.0%
0.3%
0.0%
0.5%
0.0%
1.2%1.0%
2.1%
0.0%
0.5%
1.0%
1.5%
2.0%
2.5%
3.0%
3.5%
4.0%
PNBHF Can Fin GRUH IBHF RHF LICHF DHFL HDFC GICHF REPCO
GNPA Ratio NNPA Ratio
1.2%
0.9%
0.5%
0.6% 0.6%
0.5%
1.1%
1.1%
1.0% 1.0% 1.0%
1.1%
0.0%
0.2%
0.4%
0.6%
0.8%
1.0%
1.2%
1.4%
FY13 FY14 FY15 FY16 1HFY17 FY17
PNBHF Other HFCs
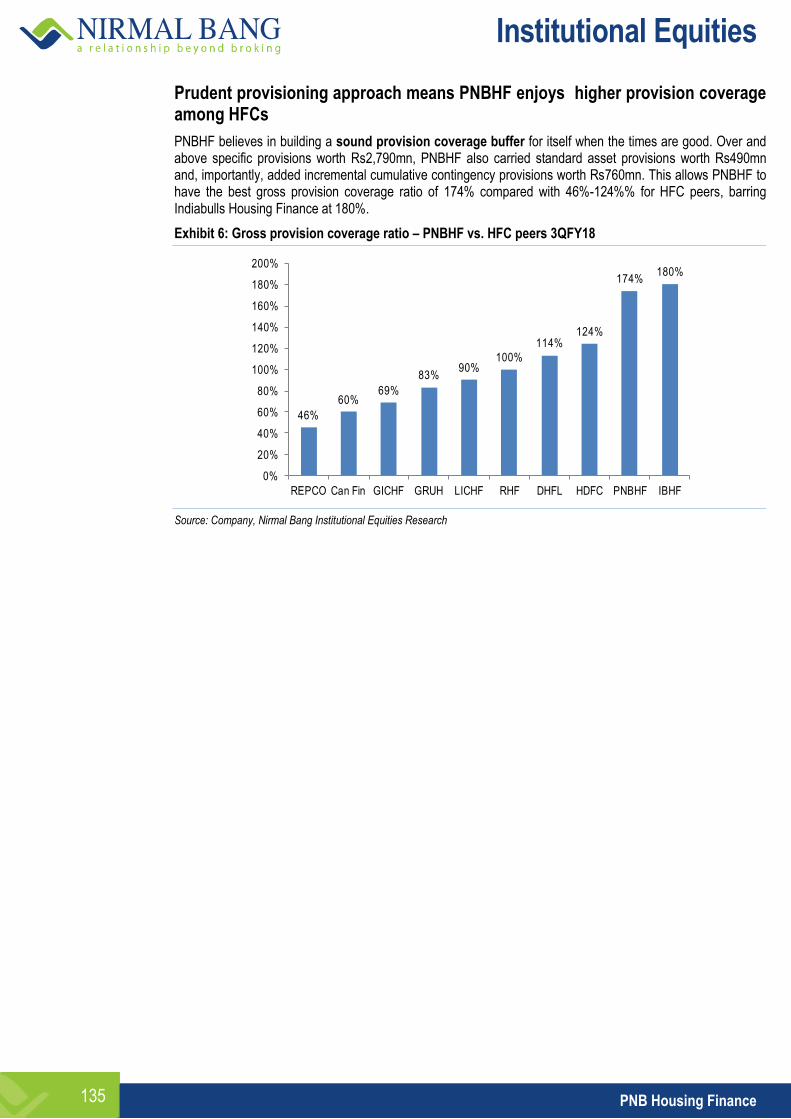
Institutional Equities
PNB Housing Finance 135
Prudent provisioning approach means PNBHF enjoys higher provision coverage among HFCs
PNBHF believes in building a sound provision coverage buffer for itself when the times are good. Over and above specific provisions worth Rs2,790mn, PNBHF also carried standard asset provisions worth Rs490mn and, importantly, added incremental cumulative contingency provisions worth Rs760mn. This allows PNBHF to have the best gross provision coverage ratio of 174% compared with 46%-124%% for HFC peers, barring Indiabulls Housing Finance at 180%.
Exhibit 6: Gross provision coverage ratio – PNBHF vs. HFC peers 3QFY18
Source: Company, Nirmal Bang Institutional Equities Research
46%
60%69%
83%90%
100%
114%124%
174%180%
0%
20%
40%
60%
80%
100%
120%
140%
160%
180%
200%
REPCO Can Fin GICHF GRUH LICHF RHF DHFL HDFC PNBHF IBHF
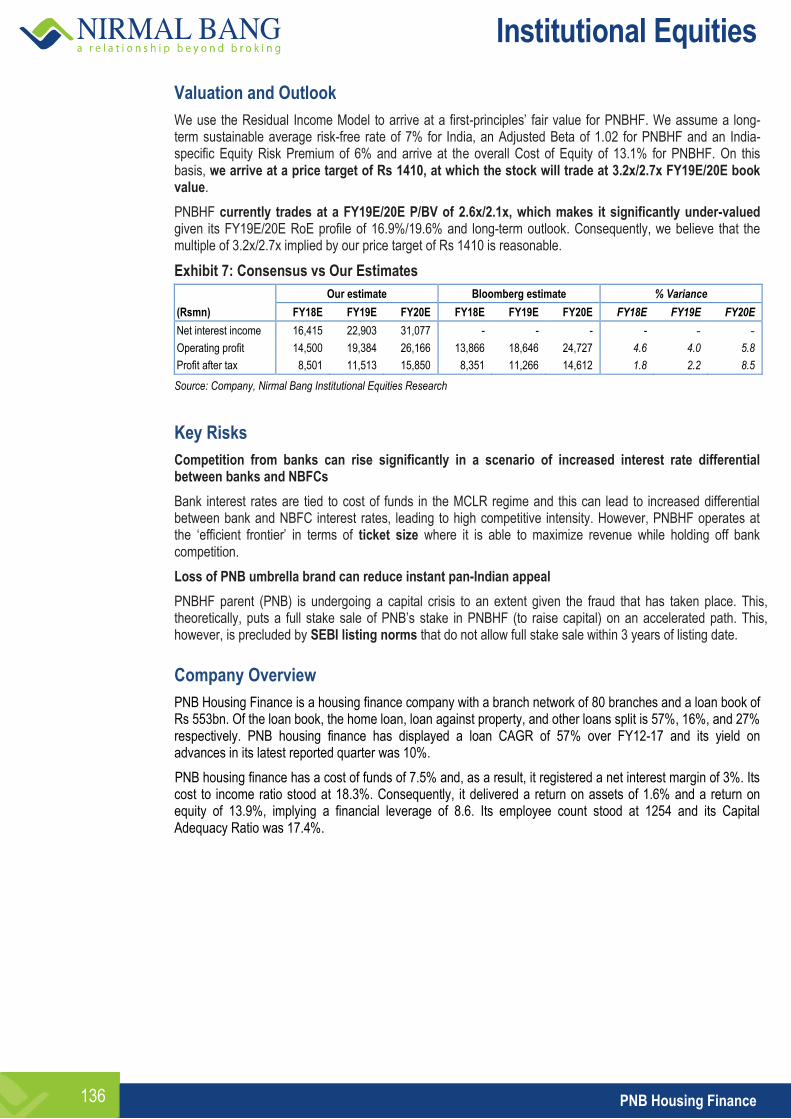
Institutional Equities
PNB Housing Finance 136
Valuation and Outlook
We use the Residual Income Model to arrive at a first-principles’ fair value for PNBHF. We assume a long-term sustainable average risk-free rate of 7% for India, an Adjusted Beta of 1.02 for PNBHF and an India-specific Equity Risk Premium of 6% and arrive at the overall Cost of Equity of 13.1% for PNBHF. On this basis, we arrive at a price target of Rs 1410, at which the stock will trade at 3.2x/2.7x FY19E/20E book value.
PNBHF currently trades at a FY19E/20E P/BV of 2.6x/2.1x, which makes it significantly under-valued given its FY19E/20E RoE profile of 16.9%/19.6% and long-term outlook. Consequently, we believe that the multiple of 3.2x/2.7x implied by our price target of Rs 1410 is reasonable.
Exhibit 7: Consensus vs Our Estimates
Our estimate Bloomberg estimate % Variance
(Rsmn) FY18E FY19E FY20E FY18E FY19E FY20E FY18E FY19E FY20E
Net interest income 16,415 22,903 31,077 - - - - - -
Operating profit 14,500 19,384 26,166 13,866 18,646 24,727 4.6 4.0 5.8
Profit after tax 8,501 11,513 15,850 8,351 11,266 14,612 1.8 2.2 8.5
Source: Company, Nirmal Bang Institutional Equities Research
Key Risks
Competition from banks can rise significantly in a scenario of increased interest rate differential between banks and NBFCs
Bank interest rates are tied to cost of funds in the MCLR regime and this can lead to increased differential between bank and NBFC interest rates, leading to high competitive intensity. However, PNBHF operates at the ‘efficient frontier’ in terms of ticket size where it is able to maximize revenue while holding off bank competition.
Loss of PNB umbrella brand can reduce instant pan-Indian appeal
PNBHF parent (PNB) is undergoing a capital crisis to an extent given the fraud that has taken place. This, theoretically, puts a full stake sale of PNB’s stake in PNBHF (to raise capital) on an accelerated path. This, however, is precluded by SEBI listing norms that do not allow full stake sale within 3 years of listing date.
Company Overview
PNB Housing Finance is a housing finance company with a branch network of 80 branches and a loan book of Rs 553bn. Of the loan book, the home loan, loan against property, and other loans split is 57%, 16%, and 27% respectively. PNB housing finance has displayed a loan CAGR of 57% over FY12-17 and its yield on advances in its latest reported quarter was 10%.
PNB housing finance has a cost of funds of 7.5% and, as a result, it registered a net interest margin of 3%. Its cost to income ratio stood at 18.3%. Consequently, it delivered a return on assets of 1.6% and a return on equity of 13.9%, implying a financial leverage of 8.6. Its employee count stood at 1254 and its Capital Adequacy Ratio was 17.4%.
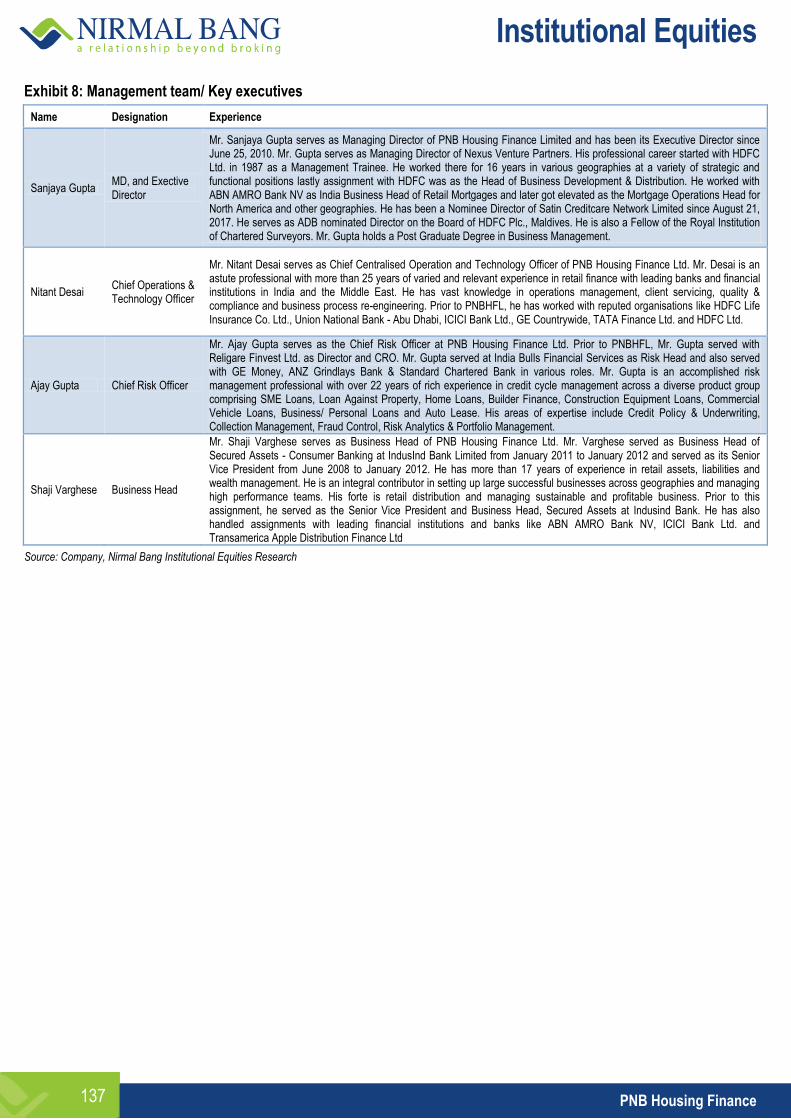
Institutional Equities
PNB Housing Finance 137
Exhibit 8: Management team/ Key executives
Name Designation Experience
Sanjaya Gupta MD, and Exective Director
Mr. Sanjaya Gupta serves as Managing Director of PNB Housing Finance Limited and has been its Executive Director since June 25, 2010. Mr. Gupta serves as Managing Director of Nexus Venture Partners. His professional career started with HDFC Ltd. in 1987 as a Management Trainee. He worked there for 16 years in various geographies at a variety of strategic and functional positions lastly assignment with HDFC was as the Head of Business Development & Distribution. He worked with ABN AMRO Bank NV as India Business Head of Retail Mortgages and later got elevated as the Mortgage Operations Head for North America and other geographies. He has been a Nominee Director of Satin Creditcare Network Limited since August 21, 2017. He serves as ADB nominated Director on the Board of HDFC Plc., Maldives. He is also a Fellow of the Royal Institution of Chartered Surveyors. Mr. Gupta holds a Post Graduate Degree in Business Management.
Nitant Desai Chief Operations & Technology Officer
Mr. Nitant Desai serves as Chief Centralised Operation and Technology Officer of PNB Housing Finance Ltd. Mr. Desai is an astute professional with more than 25 years of varied and relevant experience in retail finance with leading banks and financial institutions in India and the Middle East. He has vast knowledge in operations management, client servicing, quality & compliance and business process re-engineering. Prior to PNBHFL, he has worked with reputed organisations like HDFC Life Insurance Co. Ltd., Union National Bank - Abu Dhabi, ICICI Bank Ltd., GE Countrywide, TATA Finance Ltd. and HDFC Ltd.
Ajay Gupta Chief Risk Officer
Mr. Ajay Gupta serves as the Chief Risk Officer at PNB Housing Finance Ltd. Prior to PNBHFL, Mr. Gupta served with Religare Finvest Ltd. as Director and CRO. Mr. Gupta served at India Bulls Financial Services as Risk Head and also served with GE Money, ANZ Grindlays Bank & Standard Chartered Bank in various roles. Mr. Gupta is an accomplished risk management professional with over 22 years of rich experience in credit cycle management across a diverse product group comprising SME Loans, Loan Against Property, Home Loans, Builder Finance, Construction Equipment Loans, Commercial Vehicle Loans, Business/ Personal Loans and Auto Lease. His areas of expertise include Credit Policy & Underwriting, Collection Management, Fraud Control, Risk Analytics & Portfolio Management.
Shaji Varghese Business Head
Mr. Shaji Varghese serves as Business Head of PNB Housing Finance Ltd. Mr. Varghese served as Business Head of Secured Assets - Consumer Banking at IndusInd Bank Limited from January 2011 to January 2012 and served as its Senior Vice President from June 2008 to January 2012. He has more than 17 years of experience in retail assets, liabilities and wealth management. He is an integral contributor in setting up large successful businesses across geographies and managing high performance teams. His forte is retail distribution and managing sustainable and profitable business. Prior to this assignment, he served as the Senior Vice President and Business Head, Secured Assets at Indusind Bank. He has also handled assignments with leading financial institutions and banks like ABN AMRO Bank NV, ICICI Bank Ltd. and Transamerica Apple Distribution Finance Ltd
Source: Company, Nirmal Bang Institutional Equities Research
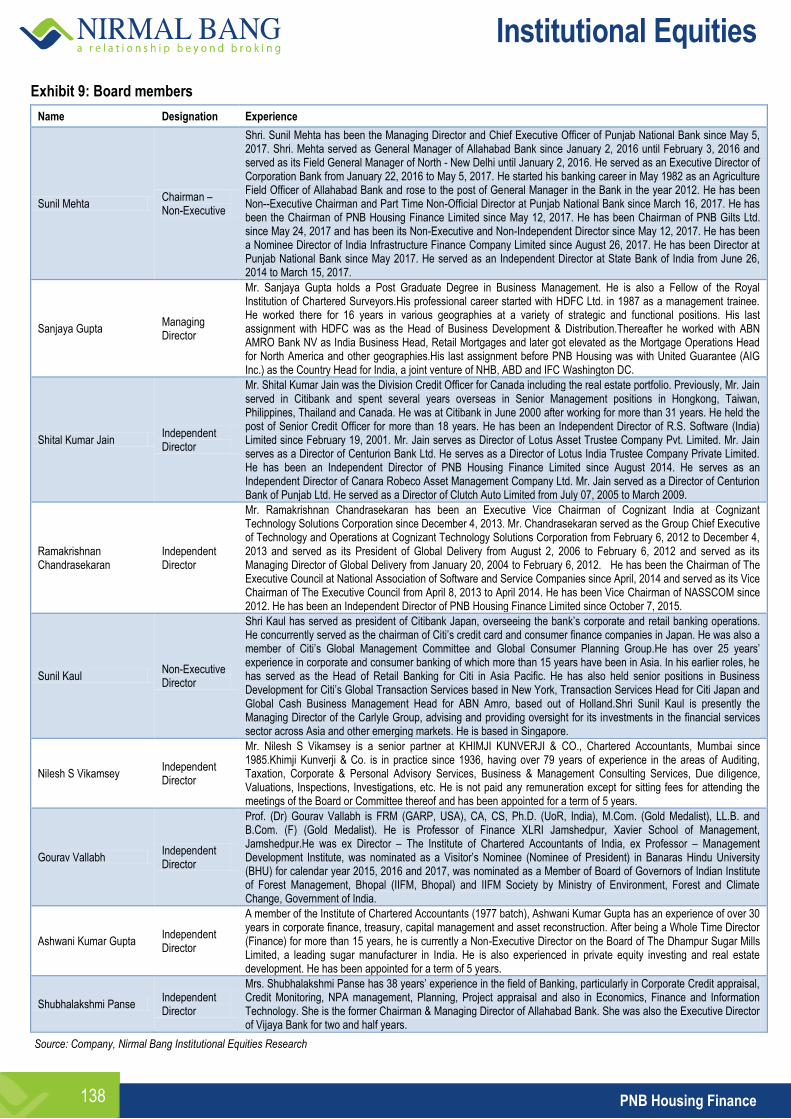
Institutional Equities
PNB Housing Finance 138
Exhibit 9: Board members
Name Designation Experience
Sunil Mehta Chairman – Non-Executive
Shri. Sunil Mehta has been the Managing Director and Chief Executive Officer of Punjab National Bank since May 5, 2017. Shri. Mehta served as General Manager of Allahabad Bank since January 2, 2016 until February 3, 2016 and served as its Field General Manager of North - New Delhi until January 2, 2016. He served as an Executive Director of Corporation Bank from January 22, 2016 to May 5, 2017. He started his banking career in May 1982 as an Agriculture Field Officer of Allahabad Bank and rose to the post of General Manager in the Bank in the year 2012. He has been Non--Executive Chairman and Part Time Non-Official Director at Punjab National Bank since March 16, 2017. He has been the Chairman of PNB Housing Finance Limited since May 12, 2017. He has been Chairman of PNB Gilts Ltd. since May 24, 2017 and has been its Non-Executive and Non-Independent Director since May 12, 2017. He has been a Nominee Director of India Infrastructure Finance Company Limited since August 26, 2017. He has been Director at Punjab National Bank since May 2017. He served as an Independent Director at State Bank of India from June 26, 2014 to March 15, 2017.
Sanjaya Gupta Managing Director
Mr. Sanjaya Gupta holds a Post Graduate Degree in Business Management. He is also a Fellow of the Royal Institution of Chartered Surveyors.His professional career started with HDFC Ltd. in 1987 as a management trainee. He worked there for 16 years in various geographies at a variety of strategic and functional positions. His last assignment with HDFC was as the Head of Business Development & Distribution.Thereafter he worked with ABN AMRO Bank NV as India Business Head, Retail Mortgages and later got elevated as the Mortgage Operations Head for North America and other geographies.His last assignment before PNB Housing was with United Guarantee (AIG Inc.) as the Country Head for India, a joint venture of NHB, ABD and IFC Washington DC.
Shital Kumar Jain Independent Director
Mr. Shital Kumar Jain was the Division Credit Officer for Canada including the real estate portfolio. Previously, Mr. Jain served in Citibank and spent several years overseas in Senior Management positions in Hongkong, Taiwan, Philippines, Thailand and Canada. He was at Citibank in June 2000 after working for more than 31 years. He held the post of Senior Credit Officer for more than 18 years. He has been an Independent Director of R.S. Software (India) Limited since February 19, 2001. Mr. Jain serves as Director of Lotus Asset Trustee Company Pvt. Limited. Mr. Jain serves as a Director of Centurion Bank Ltd. He serves as a Director of Lotus India Trustee Company Private Limited. He has been an Independent Director of PNB Housing Finance Limited since August 2014. He serves as an Independent Director of Canara Robeco Asset Management Company Ltd. Mr. Jain served as a Director of Centurion Bank of Punjab Ltd. He served as a Director of Clutch Auto Limited from July 07, 2005 to March 2009.
Ramakrishnan Chandrasekaran
Independent Director
Mr. Ramakrishnan Chandrasekaran has been an Executive Vice Chairman of Cognizant India at Cognizant Technology Solutions Corporation since December 4, 2013. Mr. Chandrasekaran served as the Group Chief Executive of Technology and Operations at Cognizant Technology Solutions Corporation from February 6, 2012 to December 4, 2013 and served as its President of Global Delivery from August 2, 2006 to February 6, 2012 and served as its Managing Director of Global Delivery from January 20, 2004 to February 6, 2012. He has been the Chairman of The Executive Council at National Association of Software and Service Companies since April, 2014 and served as its Vice Chairman of The Executive Council from April 8, 2013 to April 2014. He has been Vice Chairman of NASSCOM since 2012. He has been an Independent Director of PNB Housing Finance Limited since October 7, 2015.
Sunil Kaul Non-Executive Director
Shri Kaul has served as president of Citibank Japan, overseeing the bank’s corporate and retail banking operations. He concurrently served as the chairman of Citi’s credit card and consumer finance companies in Japan. He was also a member of Citi’s Global Management Committee and Global Consumer Planning Group.He has over 25 years’ experience in corporate and consumer banking of which more than 15 years have been in Asia. In his earlier roles, he has served as the Head of Retail Banking for Citi in Asia Pacific. He has also held senior positions in Business Development for Citi’s Global Transaction Services based in New York, Transaction Services Head for Citi Japan and Global Cash Business Management Head for ABN Amro, based out of Holland.Shri Sunil Kaul is presently the Managing Director of the Carlyle Group, advising and providing oversight for its investments in the financial services sector across Asia and other emerging markets. He is based in Singapore.
Nilesh S Vikamsey Independent Director
Mr. Nilesh S Vikamsey is a senior partner at KHIMJI KUNVERJI & CO., Chartered Accountants, Mumbai since 1985.Khimji Kunverji & Co. is in practice since 1936, having over 79 years of experience in the areas of Auditing, Taxation, Corporate & Personal Advisory Services, Business & Management Consulting Services, Due diligence, Valuations, Inspections, Investigations, etc. He is not paid any remuneration except for sitting fees for attending the meetings of the Board or Committee thereof and has been appointed for a term of 5 years.
Gourav Vallabh Independent Director
Prof. (Dr) Gourav Vallabh is FRM (GARP, USA), CA, CS, Ph.D. (UoR, India), M.Com. (Gold Medalist), LL.B. and B.Com. (F) (Gold Medalist). He is Professor of Finance XLRI Jamshedpur, Xavier School of Management, Jamshedpur.He was ex Director – The Institute of Chartered Accountants of India, ex Professor – Management Development Institute, was nominated as a Visitor’s Nominee (Nominee of President) in Banaras Hindu University (BHU) for calendar year 2015, 2016 and 2017, was nominated as a Member of Board of Governors of Indian Institute of Forest Management, Bhopal (IIFM, Bhopal) and IIFM Society by Ministry of Environment, Forest and Climate Change, Government of India.
Ashwani Kumar Gupta Independent Director
A member of the Institute of Chartered Accountants (1977 batch), Ashwani Kumar Gupta has an experience of over 30 years in corporate finance, treasury, capital management and asset reconstruction. After being a Whole Time Director (Finance) for more than 15 years, he is currently a Non-Executive Director on the Board of The Dhampur Sugar Mills Limited, a leading sugar manufacturer in India. He is also experienced in private equity investing and real estate development. He has been appointed for a term of 5 years.
Shubhalakshmi Panse Independent Director
Mrs. Shubhalakshmi Panse has 38 years’ experience in the field of Banking, particularly in Corporate Credit appraisal, Credit Monitoring, NPA management, Planning, Project appraisal and also in Economics, Finance and Information Technology. She is the former Chairman & Managing Director of Allahabad Bank. She was also the Executive Director of Vijaya Bank for two and half years.
Source: Company, Nirmal Bang Institutional Equities Research
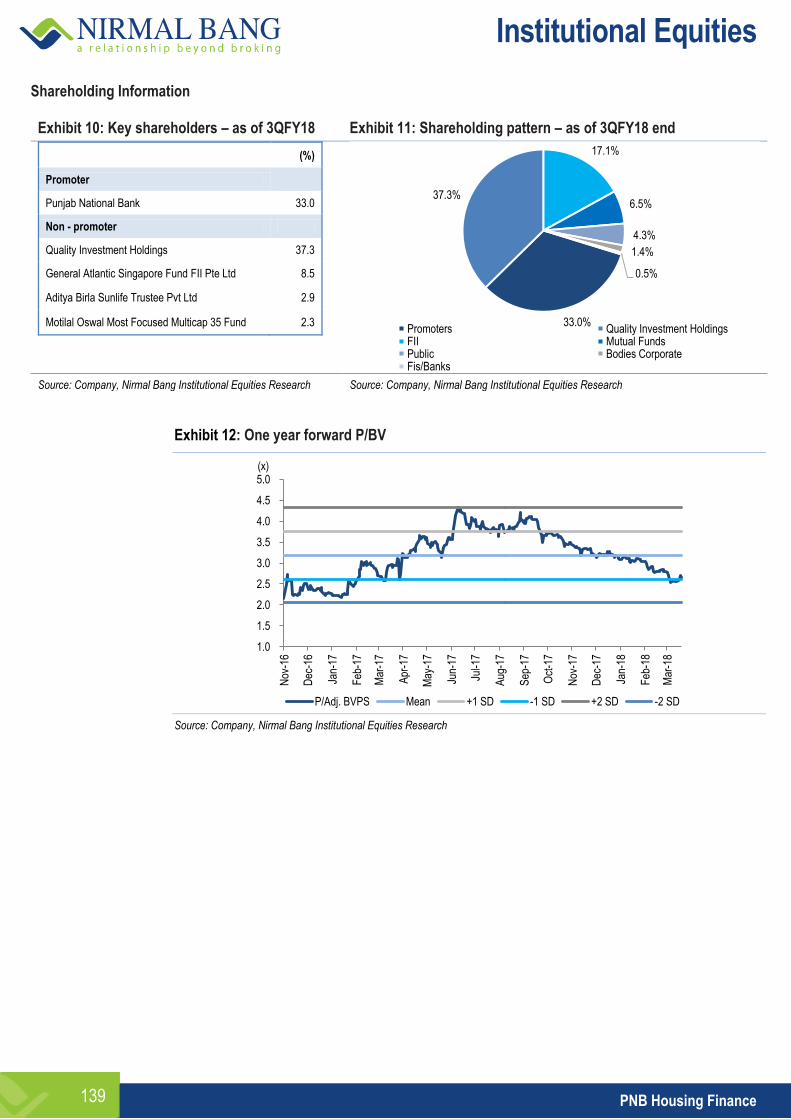
Institutional Equities
PNB Housing Finance 139
Shareholding Information Exhibit 10: Key shareholders – as of 3QFY18 Exhibit 11: Shareholding pattern – as of 3QFY18 end
(%)
Promoter
Punjab National Bank 33.0
Non - promoter
Quality Investment Holdings 37.3
General Atlantic Singapore Fund FII Pte Ltd 8.5
Aditya Birla Sunlife Trustee Pvt Ltd 2.9
Motilal Oswal Most Focused Multicap 35 Fund 2.3
Source: Company, Nirmal Bang Institutional Equities Research Source: Company, Nirmal Bang Institutional Equities Research
Exhibit 12: One year forward P/BV
Source: Company, Nirmal Bang Institutional Equities Research
33.0%
37.3%
17.1%
6.5%
4.3%
1.4%
0.5%
Promoters Quality Investment Holdings FII Mutual Funds Public Bodies Corporate Fis/Banks
1.0
1.5
2.0
2.5
3.0
3.5
4.0
4.5
5.0
Nov
-16
Dec
-16
Jan-
17
Feb
-17
Mar
-17
Apr
-17
May
-17
Jun-
17
Jul-1
7
Aug
-17
Sep
-17
Oct
-17
Nov
-17
Dec
-17
Jan-
18
Feb
-18
Mar
-18
P/Adj. BVPS Mean +1 SD -1 SD +2 SD -2 SD
(x)
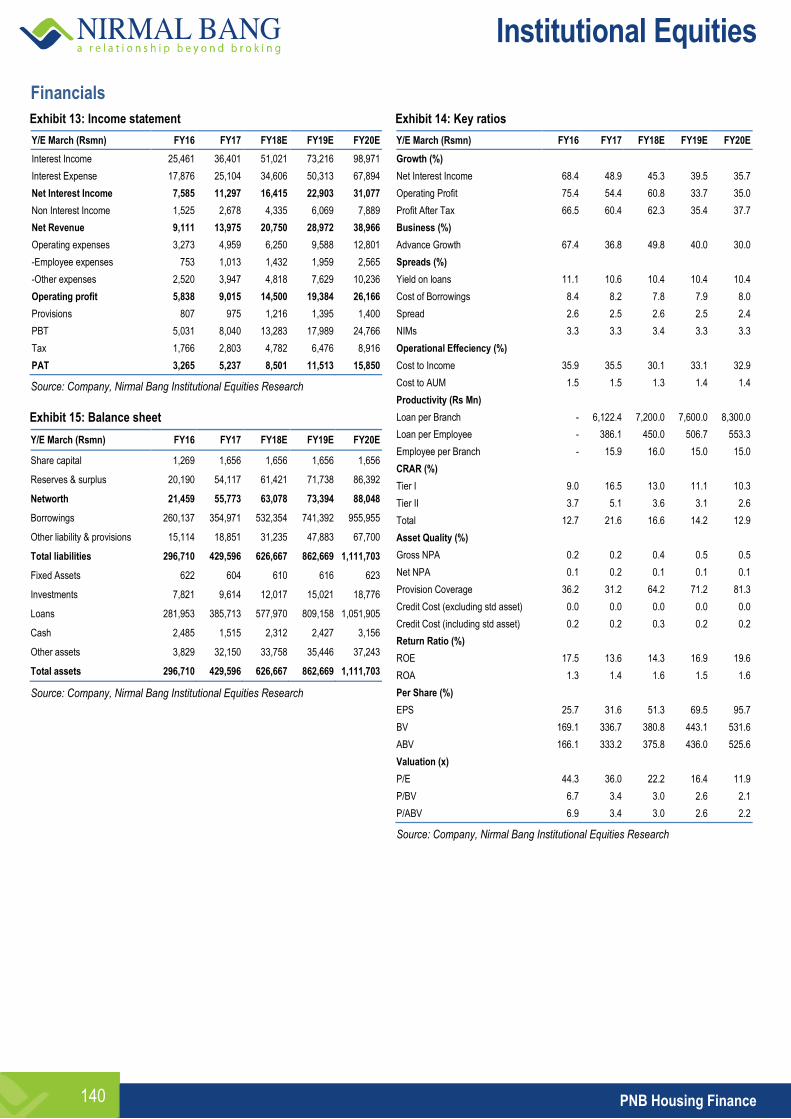
Institutional Equities
PNB Housing Finance 140
Financials
Exhibit 13: Income statement
Y/E March (Rsmn) FY16 FY17 FY18E FY19E FY20E
Interest Income 25,461 36,401 51,021 73,216 98,971
Interest Expense 17,876 25,104 34,606 50,313 67,894
Net Interest Income 7,585 11,297 16,415 22,903 31,077
Non Interest Income 1,525 2,678 4,335 6,069 7,889
Net Revenue 9,111 13,975 20,750 28,972 38,966
Operating expenses 3,273 4,959 6,250 9,588 12,801
-Employee expenses 753 1,013 1,432 1,959 2,565
-Other expenses 2,520 3,947 4,818 7,629 10,236
Operating profit 5,838 9,015 14,500 19,384 26,166
Provisions 807 975 1,216 1,395 1,400
PBT 5,031 8,040 13,283 17,989 24,766
Tax 1,766 2,803 4,782 6,476 8,916
PAT 3,265 5,237 8,501 11,513 15,850
Source: Company, Nirmal Bang Institutional Equities Research
Exhibit 15: Balance sheet
Y/E March (Rsmn) FY16 FY17 FY18E FY19E FY20E
Share capital 1,269 1,656 1,656 1,656 1,656
Reserves & surplus 20,190 54,117 61,421 71,738 86,392
Networth 21,459 55,773 63,078 73,394 88,048
Borrowings 260,137 354,971 532,354 741,392 955,955
Other liability & provisions 15,114 18,851 31,235 47,883 67,700
Total liabilities 296,710 429,596 626,667 862,669 1,111,703
Fixed Assets 622 604 610 616 623
Investments 7,821 9,614 12,017 15,021 18,776
Loans 281,953 385,713 577,970 809,158 1,051,905
Cash 2,485 1,515 2,312 2,427 3,156
Other assets 3,829 32,150 33,758 35,446 37,243
Total assets 296,710 429,596 626,667 862,669 1,111,703
Source: Company, Nirmal Bang Institutional Equities Research
Exhibit 14: Key ratios
Y/E March (Rsmn) FY16 FY17 FY18E FY19E FY20E
Growth (%)
Net Interest Income 68.4 48.9 45.3 39.5 35.7
Operating Profit 75.4 54.4 60.8 33.7 35.0
Profit After Tax 66.5 60.4 62.3 35.4 37.7
Business (%)
Advance Growth 67.4 36.8 49.8 40.0 30.0
Spreads (%)
Yield on loans 11.1 10.6 10.4 10.4 10.4
Cost of Borrowings 8.4 8.2 7.8 7.9 8.0
Spread 2.6 2.5 2.6 2.5 2.4
NIMs 3.3 3.3 3.4 3.3 3.3
Operational Effeciency (%)
Cost to Income 35.9 35.5 30.1 33.1 32.9
Cost to AUM 1.5 1.5 1.3 1.4 1.4
Productivity (Rs Mn)
Loan per Branch - 6,122.4 7,200.0 7,600.0 8,300.0
Loan per Employee - 386.1 450.0 506.7 553.3
Employee per Branch - 15.9 16.0 15.0 15.0
CRAR (%)
Tier I 9.0 16.5 13.0 11.1 10.3
Tier II 3.7 5.1 3.6 3.1 2.6
Total 12.7 21.6 16.6 14.2 12.9
Asset Quality (%)
Gross NPA 0.2 0.2 0.4 0.5 0.5
Net NPA 0.1 0.2 0.1 0.1 0.1
Provision Coverage 36.2 31.2 64.2 71.2 81.3
Credit Cost (excluding std asset) 0.0 0.0 0.0 0.0 0.0
Credit Cost (including std asset) 0.2 0.2 0.3 0.2 0.2
Return Ratio (%)
ROE 17.5 13.6 14.3 16.9 19.6
ROA 1.3 1.4 1.6 1.5 1.6
Per Share (%)
EPS 25.7 31.6 51.3 69.5 95.7
BV 169.1 336.7 380.8 443.1 531.6
ABV 166.1 333.2 375.8 436.0 525.6
Valuation (x)
P/E 44.3 36.0 22.2 16.4 11.9
P/BV 6.7 3.4 3.0 2.6 2.1
P/ABV 6.9 3.4 3.0 2.6 2.2
Source: Company, Nirmal Bang Institutional Equities Research
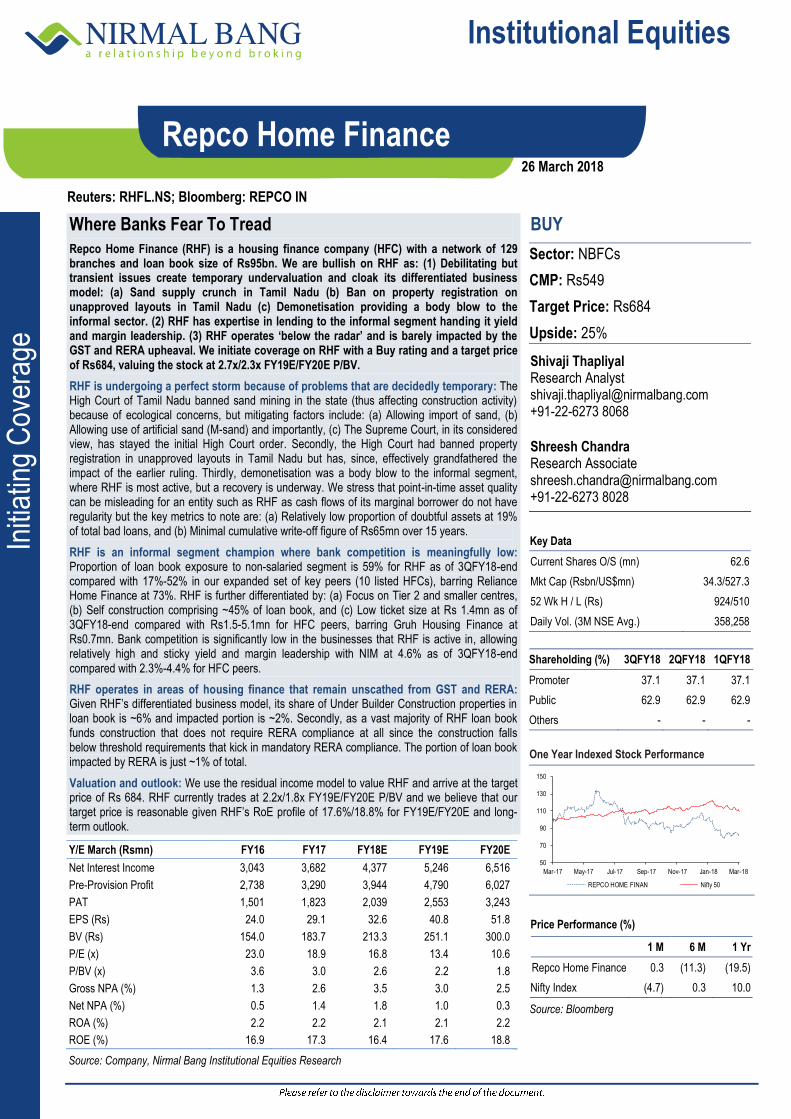
Institutional Equities
Initi
atin
g C
over
age
Reuters: RHFL.NS; Bloomberg: REPCO IN
Repco Home Finance
Where Banks Fear To Tread
Repco Home Finance (RHF) is a housing finance company (HFC) with a network of 129 branches and loan book size of Rs95bn. We are bullish on RHF as: (1) Debilitating but transient issues create temporary undervaluation and cloak its differentiated business model: (a) Sand supply crunch in Tamil Nadu (b) Ban on property registration on unapproved layouts in Tamil Nadu (c) Demonetisation providing a body blow to the informal sector. (2) RHF has expertise in lending to the informal segment handing it yield and margin leadership. (3) RHF operates ‘below the radar’ and is barely impacted by the GST and RERA upheaval. We initiate coverage on RHF with a Buy rating and a target price of Rs684, valuing the stock at 2.7x/2.3x FY19E/FY20E P/BV.
RHF is undergoing a perfect storm because of problems that are decidedly temporary: The High Court of Tamil Nadu banned sand mining in the state (thus affecting construction activity) because of ecological concerns, but mitigating factors include: (a) Allowing import of sand, (b) Allowing use of artificial sand (M-sand) and importantly, (c) The Supreme Court, in its considered view, has stayed the initial High Court order. Secondly, the High Court had banned property registration in unapproved layouts in Tamil Nadu but has, since, effectively grandfathered the impact of the earlier ruling. Thirdly, demonetisation was a body blow to the informal segment, where RHF is most active, but a recovery is underway. We stress that point-in-time asset quality can be misleading for an entity such as RHF as cash flows of its marginal borrower do not have regularity but the key metrics to note are: (a) Relatively low proportion of doubtful assets at 19% of total bad loans, and (b) Minimal cumulative write-off figure of Rs65mn over 15 years.
RHF is an informal segment champion where bank competition is meaningfully low: Proportion of loan book exposure to non-salaried segment is 59% for RHF as of 3QFY18-end compared with 17%-52% in our expanded set of key peers (10 listed HFCs), barring Reliance Home Finance at 73%. RHF is further differentiated by: (a) Focus on Tier 2 and smaller centres, (b) Self construction comprising ~45% of loan book, and (c) Low ticket size at Rs 1.4mn as of 3QFY18-end compared with Rs1.5-5.1mn for HFC peers, barring Gruh Housing Finance at Rs0.7mn. Bank competition is significantly low in the businesses that RHF is active in, allowing relatively high and sticky yield and margin leadership with NIM at 4.6% as of 3QFY18-end compared with 2.3%-4.4% for HFC peers.
RHF operates in areas of housing finance that remain unscathed from GST and RERA: Given RHF’s differentiated business model, its share of Under Builder Construction properties in loan book is ~6% and impacted portion is ~2%. Secondly, as a vast majority of RHF loan book funds construction that does not require RERA compliance at all since the construction falls below threshold requirements that kick in mandatory RERA compliance. The portion of loan book impacted by RERA is just ~1% of total.
Valuation and outlook: We use the residual income model to value RHF and arrive at the target price of Rs 684. RHF currently trades at 2.2x/1.8x FY19E/FY20E P/BV and we believe that our target price is reasonable given RHF’s RoE profile of 17.6%/18.8% for FY19E/FY20E and long-term outlook.
BUY
Sector: NBFCs
CMP: Rs549
Target Price: Rs684
Upside: 25%
Shivaji Thapliyal Research Analyst [email protected] +91-22-6273 8068 Shreesh Chandra Research Associate [email protected] +91-22-6273 8028
Key Data
Current Shares O/S (mn) 62.6
Mkt Cap (Rsbn/US$mn) 34.3/527.3
52 Wk H / L (Rs) 924/510
Daily Vol. (3M NSE Avg.) 358,258
Shareholding (%) 3QFY18 2QFY18 1QFY18
Promoter 37.1 37.1 37.1
Public 62.9 62.9 62.9
Others - - -
One Year Indexed Stock Performance
Price Performance (%)
1 M 6 M 1 Yr
Repco Home Finance 0.3 (11.3) (19.5)
Nifty Index (4.7) 0.3 10.0
Source: Bloomberg
Y/E March (Rsmn) FY16 FY17 FY18E FY19E FY20E
Net Interest Income 3,043 3,682 4,377 5,246 6,516
Pre-Provision Profit 2,738 3,290 3,944 4,790 6,027
PAT 1,501 1,823 2,039 2,553 3,243
EPS (Rs) 24.0 29.1 32.6 40.8 51.8
BV (Rs) 154.0 183.7 213.3 251.1 300.0
P/E (x) 23.0 18.9 16.8 13.4 10.6
P/BV (x) 3.6 3.0 2.6 2.2 1.8
Gross NPA (%) 1.3 2.6 3.5 3.0 2.5
Net NPA (%) 0.5 1.4 1.8 1.0 0.3
ROA (%) 2.2 2.2 2.1 2.1 2.2
ROE (%) 16.9 17.3 16.4 17.6 18.8
Source: Company, Nirmal Bang Institutional Equities Research
50
70
90
110
130
150
Mar-17 May-17 Jul-17 Sep-17 Nov-17 Jan-18 Mar-18
REPCO HOME FINAN Nifty 50
26 March 2018
Institutional Equities
Repco Home Finance 142
Transient problems currently cloak RHF’s differentiated business model
RHF is currently beset with loan growth and asset quality challenges arising out of: (1) Sand supply crunch (2) Ban on specified properties’ registration and (3) Lagged residual impact from Demonetisation. The simultaneous occurrence of these problems have created a perfect storm for RHF but we stress that all these problems are transient in nature and only serve to cloak RHF’s differentiated business model, which is particularly well placed over the long run.
We will first establish as to why we opine that the impact from the negative issues is temporary and then elaborate on how RHF’s business model is differentiated and well placed to tap the generic housing finance opportunity.
Sand supply crunch currently having second-order impact on disbursals but will resolve in the long run
Owing to the depletion of river bed and other associated environmental impact, the NGT (National Green Tribunal) had banned sand mining in several areas of Tamil Nadu. Finally, in November 2017, the Madurai bench of the Madras High Court, in its considered view, decided that all current sand quarries in the state must stop operation within six months.
Sand supply crunch and concomitant spike in sand prices by 3x led to slower construction activity in Tamil Nadu and impacted, particularly, the self construction loan book of RHF. There are, however, several mitigating factors for this from the perspective of RHF disbursements:
(1) Current impact on RHF disbursements is a second-order impact.
(2) State government has launched a website to allow online booking of sand by lorry owners, thus ensuring quicker turnaround time in approval for sand supply.
(3) Trucks would be equipped with GPS to monitor the movement of sand across the state and also improve supply chain and inventory management of sand across the state
(4) State government has decided (in May 2017) to take over all current sand quarries over a period of three years.
(5) State government has further decided to open 70 new sand quarries across Tamil Nadu, which is comparable to the existing number of 90 sand quarries in the state.
(6) The High Court, in its judgment of November 2017 itself, has allowed import of sand from Malaysia.
(7) Import of sand from other nations such as the Philippines and Cambodia is also being explored.
(8) Use of M-sand (artificial manufactured sand) has been allowed in Tamil Nadu.
(9) The latest and most significant development has been the interim stay order granted by Supreme Court on 5th February 2018 on the earlier High Court order in November 2017 that directed the Tamil Nadu government to shut sand quarries in the state within six months.
(10) On 16 February 2018, Madras High Court refrained from instituting any fresh ban on sand quarrying, but ordered the installation of modern camera technology on excavator machines as well as close-circuit television cameras at quarry sites to enable efficient monitoring of sand mining activity.
(11) Subsequently, Public Works Department (PWD) of Tamil Nadu government has initiated the bidding process to open sand quarries in the state again. Importantly, an e-tender process is being considered to ensure transparency and curb the possibility of illegal sand mining.
From the above considerations, it seems that the apex court has taken cognisance of the importance of construction activity to achieve the long-term goal of Housing for All by 2022 in Tamil Nadu and is not in favour of disruption of activity leading to the said overarching goal. Prior to Supreme Court stay order, RHF management has given guidance of overall loan book growth of 18%-20% in FY18 and, further, guided long-term overall loan book CAGR of 0.25%.
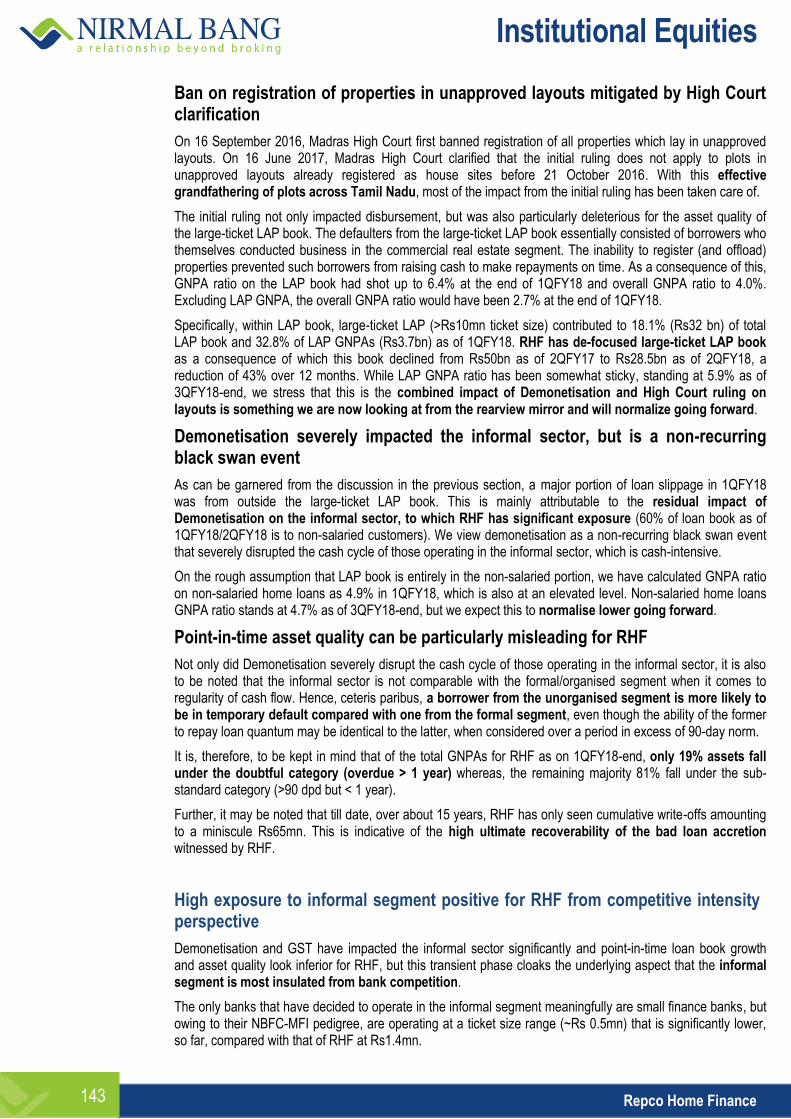
Institutional Equities
Repco Home Finance 143
Ban on registration of properties in unapproved layouts mitigated by High Court clarification
On 16 September 2016, Madras High Court first banned registration of all properties which lay in unapproved layouts. On 16 June 2017, Madras High Court clarified that the initial ruling does not apply to plots in unapproved layouts already registered as house sites before 21 October 2016. With this effective grandfathering of plots across Tamil Nadu, most of the impact from the initial ruling has been taken care of.
The initial ruling not only impacted disbursement, but was also particularly deleterious for the asset quality of the large-ticket LAP book. The defaulters from the large-ticket LAP book essentially consisted of borrowers who themselves conducted business in the commercial real estate segment. The inability to register (and offload) properties prevented such borrowers from raising cash to make repayments on time. As a consequence of this, GNPA ratio on the LAP book had shot up to 6.4% at the end of 1QFY18 and overall GNPA ratio to 4.0%. Excluding LAP GNPA, the overall GNPA ratio would have been 2.7% at the end of 1QFY18.
Specifically, within LAP book, large-ticket LAP (>Rs10mn ticket size) contributed to 18.1% (Rs32 bn) of total LAP book and 32.8% of LAP GNPAs (Rs3.7bn) as of 1QFY18. RHF has de-focused large-ticket LAP book as a consequence of which this book declined from Rs50bn as of 2QFY17 to Rs28.5bn as of 2QFY18, a reduction of 43% over 12 months. While LAP GNPA ratio has been somewhat sticky, standing at 5.9% as of 3QFY18-end, we stress that this is the combined impact of Demonetisation and High Court ruling on layouts is something we are now looking at from the rearview mirror and will normalize going forward.
Demonetisation severely impacted the informal sector, but is a non-recurring black swan event
As can be garnered from the discussion in the previous section, a major portion of loan slippage in 1QFY18 was from outside the large-ticket LAP book. This is mainly attributable to the residual impact of Demonetisation on the informal sector, to which RHF has significant exposure (60% of loan book as of 1QFY18/2QFY18 is to non-salaried customers). We view demonetisation as a non-recurring black swan event that severely disrupted the cash cycle of those operating in the informal sector, which is cash-intensive.
On the rough assumption that LAP book is entirely in the non-salaried portion, we have calculated GNPA ratio on non-salaried home loans as 4.9% in 1QFY18, which is also at an elevated level. Non-salaried home loans GNPA ratio stands at 4.7% as of 3QFY18-end, but we expect this to normalise lower going forward.
Point-in-time asset quality can be particularly misleading for RHF
Not only did Demonetisation severely disrupt the cash cycle of those operating in the informal sector, it is also to be noted that the informal sector is not comparable with the formal/organised segment when it comes to regularity of cash flow. Hence, ceteris paribus, a borrower from the unorganised segment is more likely to be in temporary default compared with one from the formal segment, even though the ability of the former to repay loan quantum may be identical to the latter, when considered over a period in excess of 90-day norm.
It is, therefore, to be kept in mind that of the total GNPAs for RHF as on 1QFY18-end, only 19% assets fall under the doubtful category (overdue > 1 year) whereas, the remaining majority 81% fall under the sub-standard category (>90 dpd but < 1 year).
Further, it may be noted that till date, over about 15 years, RHF has only seen cumulative write-offs amounting to a miniscule Rs65mn. This is indicative of the high ultimate recoverability of the bad loan accretion witnessed by RHF.
High exposure to informal segment positive for RHF from competitive intensity perspective
Demonetisation and GST have impacted the informal sector significantly and point-in-time loan book growth and asset quality look inferior for RHF, but this transient phase cloaks the underlying aspect that the informal segment is most insulated from bank competition.
The only banks that have decided to operate in the informal segment meaningfully are small finance banks, but owing to their NBFC-MFI pedigree, are operating at a ticket size range (~Rs 0.5mn) that is significantly lower, so far, compared with that of RHF at Rs1.4mn.
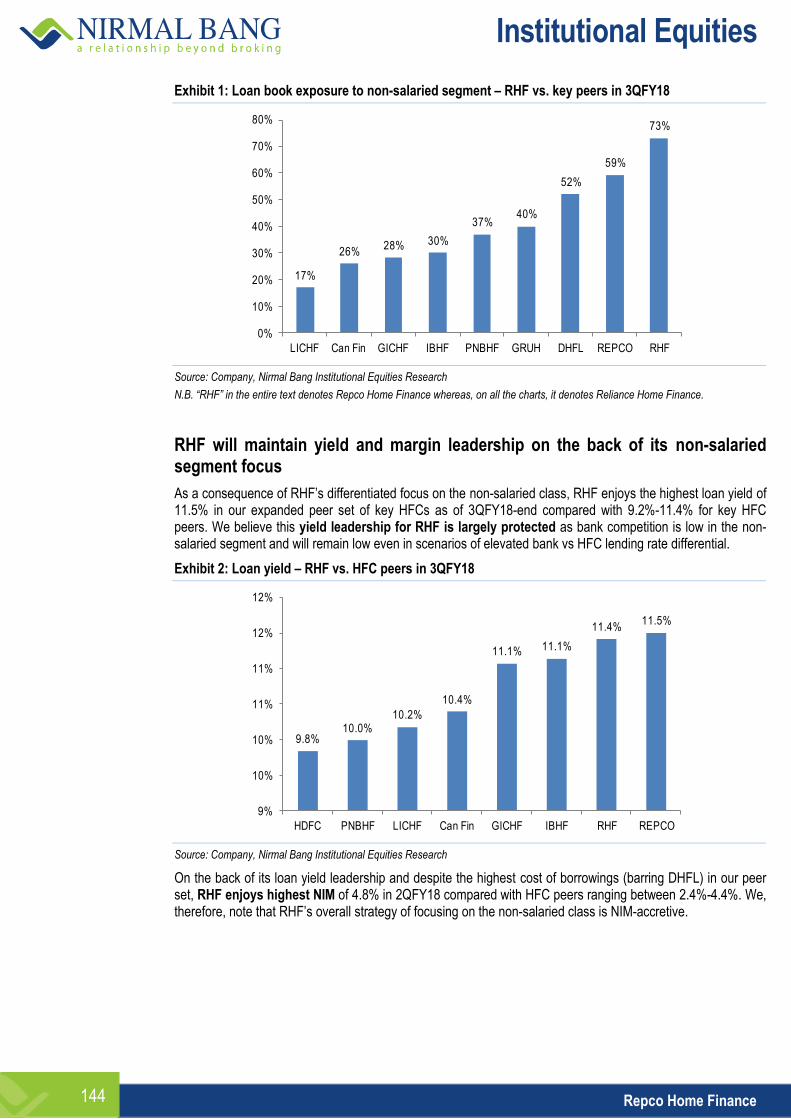
Institutional Equities
Repco Home Finance 144
Exhibit 1: Loan book exposure to non-salaried segment – RHF vs. key peers in 3QFY18
Source: Company, Nirmal Bang Institutional Equities Research
N.B. “RHF” in the entire text denotes Repco Home Finance whereas, on all the charts, it denotes Reliance Home Finance.
RHF will maintain yield and margin leadership on the back of its non-salaried segment focus
As a consequence of RHF’s differentiated focus on the non-salaried class, RHF enjoys the highest loan yield of 11.5% in our expanded peer set of key HFCs as of 3QFY18-end compared with 9.2%-11.4% for key HFC peers. We believe this yield leadership for RHF is largely protected as bank competition is low in the non-salaried segment and will remain low even in scenarios of elevated bank vs HFC lending rate differential.
Exhibit 2: Loan yield – RHF vs. HFC peers in 3QFY18
Source: Company, Nirmal Bang Institutional Equities Research
On the back of its loan yield leadership and despite the highest cost of borrowings (barring DHFL) in our peer set, RHF enjoys highest NIM of 4.8% in 2QFY18 compared with HFC peers ranging between 2.4%-4.4%. We, therefore, note that RHF’s overall strategy of focusing on the non-salaried class is NIM-accretive.
17%
26%28% 30%
37%40%
52%
59%
73%
0%
10%
20%
30%
40%
50%
60%
70%
80%
LICHF Can Fin GICHF IBHF PNBHF GRUH DHFL REPCO RHF
9.8%10.0%
10.2%
10.4%
11.1% 11.1%
11.4%11.5%
9%
10%
10%
11%
11%
12%
12%
HDFC PNBHF LICHF Can Fin GICHF IBHF RHF REPCO
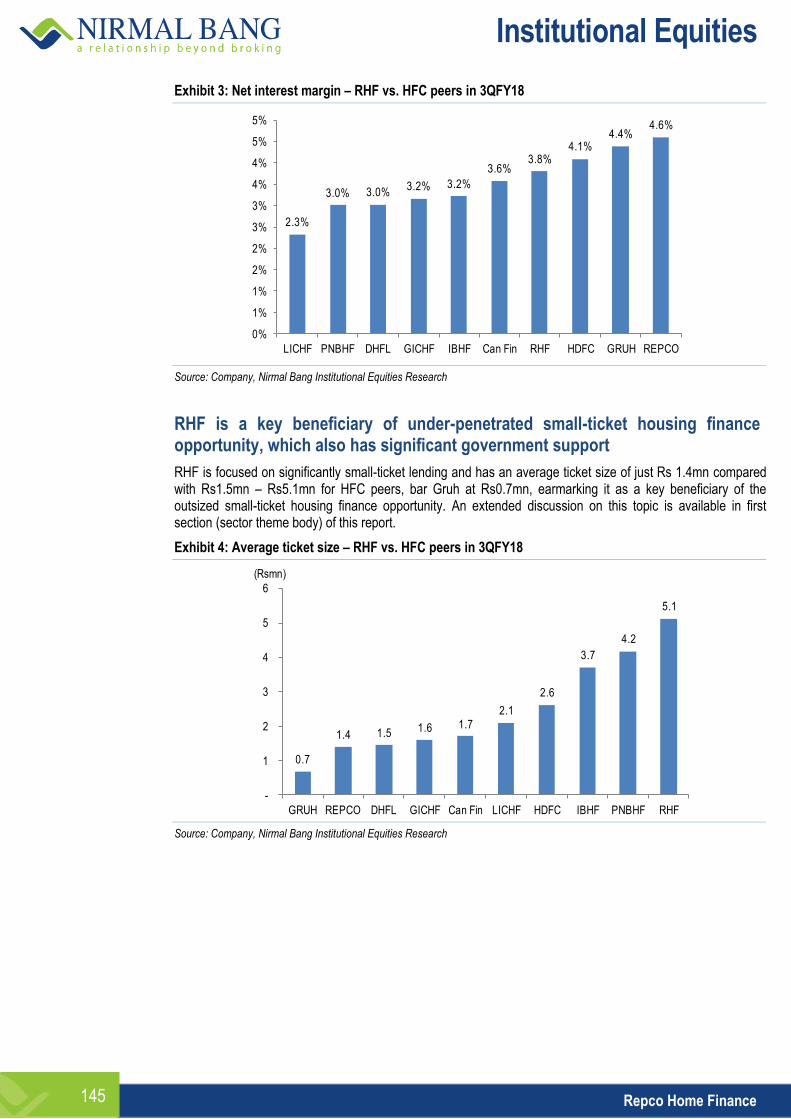
Institutional Equities
Repco Home Finance 145
Exhibit 3: Net interest margin – RHF vs. HFC peers in 3QFY18
Source: Company, Nirmal Bang Institutional Equities Research
RHF is a key beneficiary of under-penetrated small-ticket housing finance opportunity, which also has significant government support
RHF is focused on significantly small-ticket lending and has an average ticket size of just Rs 1.4mn compared with Rs1.5mn – Rs5.1mn for HFC peers, bar Gruh at Rs0.7mn, earmarking it as a key beneficiary of the outsized small-ticket housing finance opportunity. An extended discussion on this topic is available in first section (sector theme body) of this report.
Exhibit 4: Average ticket size – RHF vs. HFC peers in 3QFY18
Source: Company, Nirmal Bang Institutional Equities Research
2.3%
3.0% 3.0%3.2% 3.2%
3.6%3.8%
4.1%4.4%
4.6%
0%
1%
1%
2%
2%
3%
3%
4%
4%
5%
5%
LICHF PNBHF DHFL GICHF IBHF Can Fin RHF HDFC GRUH REPCO
0.7
1.4 1.5 1.6 1.72.1
2.6
3.7
4.2
5.1
-
1
2
3
4
5
6
GRUH REPCO DHFL GICHF Can Fin LICHF HDFC IBHF PNBHF RHF
(Rsmn)
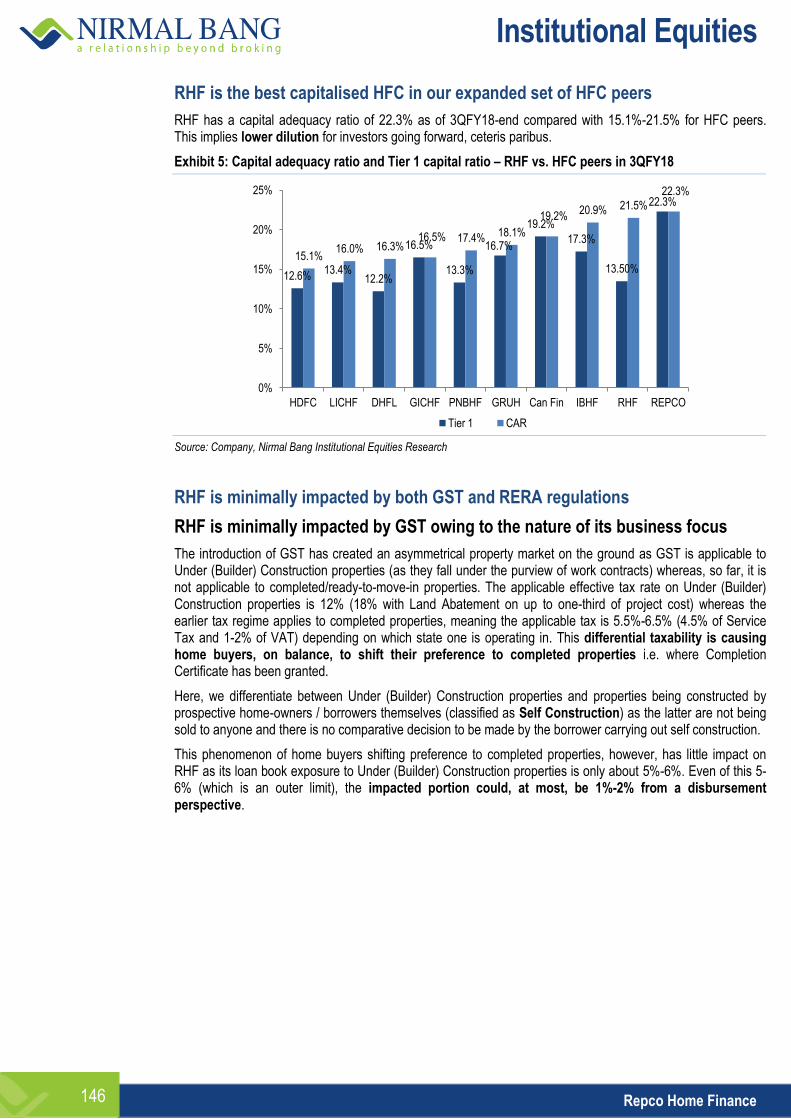
Institutional Equities
Repco Home Finance 146
RHF is the best capitalised HFC in our expanded set of HFC peers
RHF has a capital adequacy ratio of 22.3% as of 3QFY18-end compared with 15.1%-21.5% for HFC peers. This implies lower dilution for investors going forward, ceteris paribus.
Exhibit 5: Capital adequacy ratio and Tier 1 capital ratio – RHF vs. HFC peers in 3QFY18
Source: Company, Nirmal Bang Institutional Equities Research
RHF is minimally impacted by both GST and RERA regulations
RHF is minimally impacted by GST owing to the nature of its business focus
The introduction of GST has created an asymmetrical property market on the ground as GST is applicable to Under (Builder) Construction properties (as they fall under the purview of work contracts) whereas, so far, it is not applicable to completed/ready-to-move-in properties. The applicable effective tax rate on Under (Builder) Construction properties is 12% (18% with Land Abatement on up to one-third of project cost) whereas the earlier tax regime applies to completed properties, meaning the applicable tax is 5.5%-6.5% (4.5% of Service Tax and 1-2% of VAT) depending on which state one is operating in. This differential taxability is causing home buyers, on balance, to shift their preference to completed properties i.e. where Completion Certificate has been granted.
Here, we differentiate between Under (Builder) Construction properties and properties being constructed by prospective home-owners / borrowers themselves (classified as Self Construction) as the latter are not being sold to anyone and there is no comparative decision to be made by the borrower carrying out self construction.
This phenomenon of home buyers shifting preference to completed properties, however, has little impact on RHF as its loan book exposure to Under (Builder) Construction properties is only about 5%-6%. Even of this 5-6% (which is an outer limit), the impacted portion could, at most, be 1%-2% from a disbursement perspective.
12.6% 13.4%
12.2%
16.5%
13.3%
16.7%
19.2%
17.3%
13.50%
22.3%
15.1% 16.0% 16.3%
16.5% 17.4% 18.1%
19.2% 20.9% 21.5%
22.3%
0%
5%
10%
15%
20%
25%
HDFC LICHF DHFL GICHF PNBHF GRUH Can Fin IBHF RHF REPCO
Tier 1 CAR
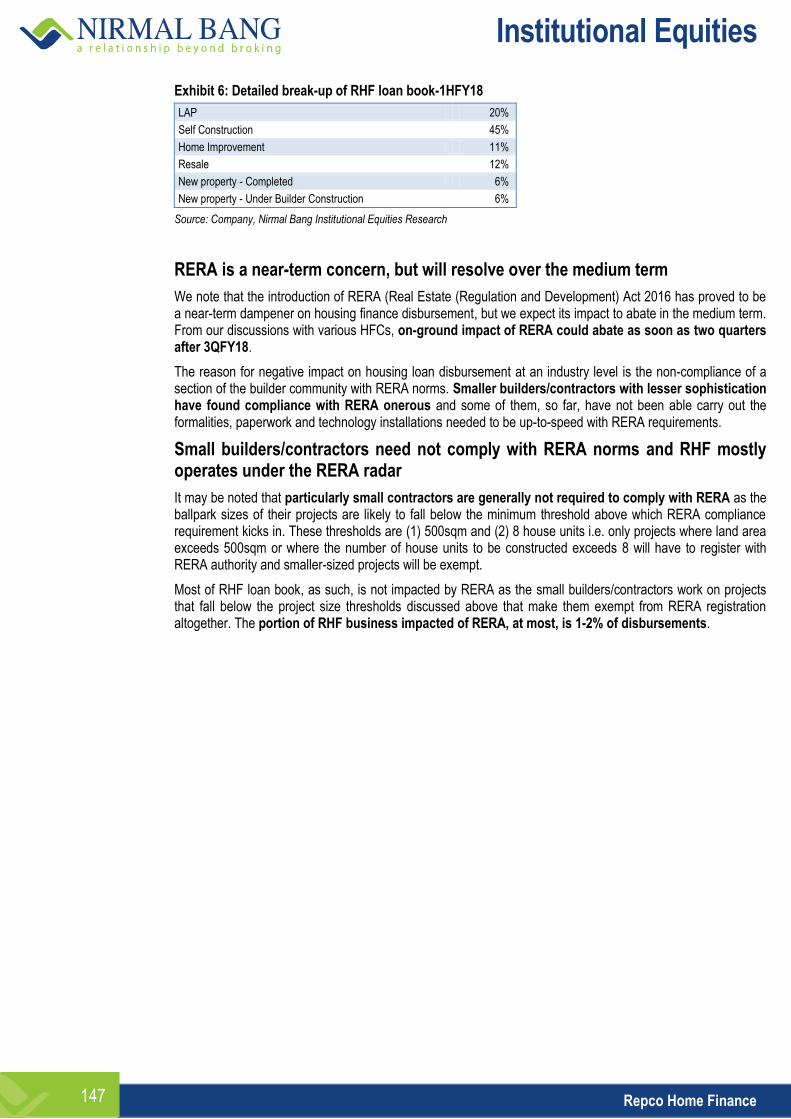
Institutional Equities
Repco Home Finance 147
Exhibit 6: Detailed break-up of RHF loan book-1HFY18
LAP 20%
Self Construction 45%
Home Improvement 11%
Resale 12%
New property - Completed 6%
New property - Under Builder Construction 6%
Source: Company, Nirmal Bang Institutional Equities Research
RERA is a near-term concern, but will resolve over the medium term
We note that the introduction of RERA (Real Estate (Regulation and Development) Act 2016 has proved to be a near-term dampener on housing finance disbursement, but we expect its impact to abate in the medium term. From our discussions with various HFCs, on-ground impact of RERA could abate as soon as two quarters after 3QFY18.
The reason for negative impact on housing loan disbursement at an industry level is the non-compliance of a section of the builder community with RERA norms. Smaller builders/contractors with lesser sophistication have found compliance with RERA onerous and some of them, so far, have not been able carry out the formalities, paperwork and technology installations needed to be up-to-speed with RERA requirements.
Small builders/contractors need not comply with RERA norms and RHF mostly operates under the RERA radar
It may be noted that particularly small contractors are generally not required to comply with RERA as the ballpark sizes of their projects are likely to fall below the minimum threshold above which RERA compliance requirement kicks in. These thresholds are (1) 500sqm and (2) 8 house units i.e. only projects where land area exceeds 500sqm or where the number of house units to be constructed exceeds 8 will have to register with RERA authority and smaller-sized projects will be exempt.
Most of RHF loan book, as such, is not impacted by RERA as the small builders/contractors work on projects that fall below the project size thresholds discussed above that make them exempt from RERA registration altogether. The portion of RHF business impacted of RERA, at most, is 1-2% of disbursements.
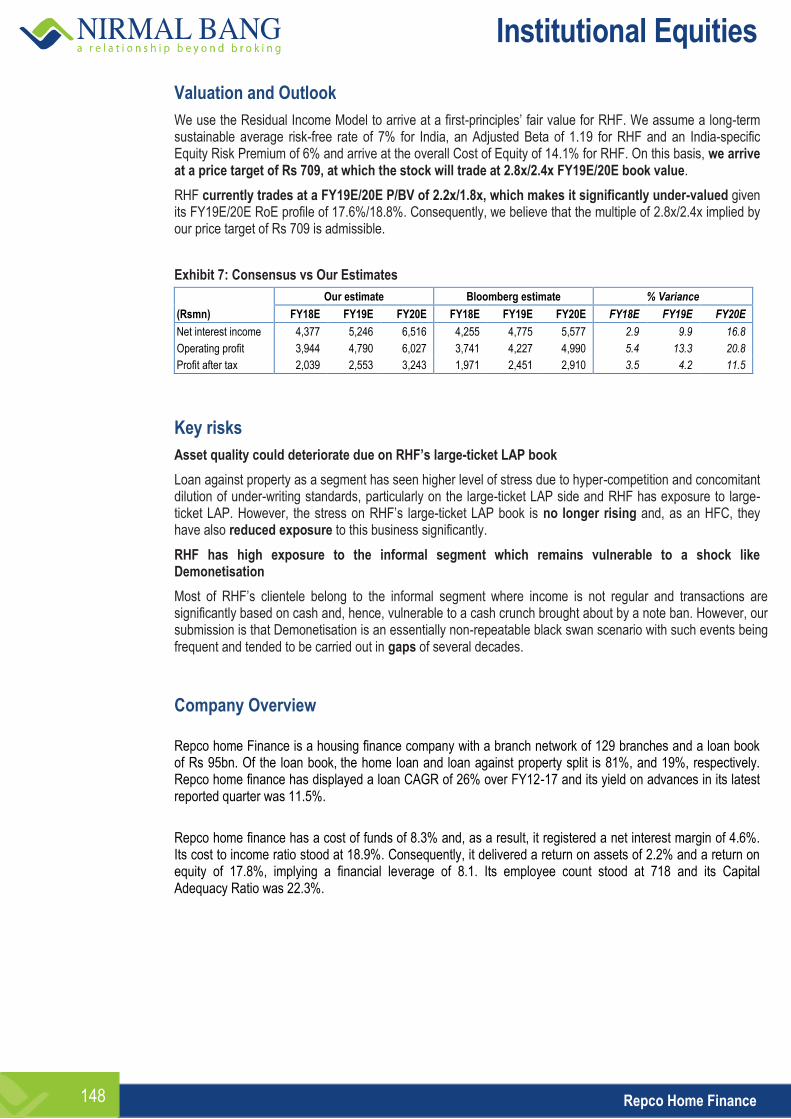
Institutional Equities
Repco Home Finance 148
Valuation and Outlook
We use the Residual Income Model to arrive at a first-principles’ fair value for RHF. We assume a long-term sustainable average risk-free rate of 7% for India, an Adjusted Beta of 1.19 for RHF and an India-specific Equity Risk Premium of 6% and arrive at the overall Cost of Equity of 14.1% for RHF. On this basis, we arrive at a price target of Rs 709, at which the stock will trade at 2.8x/2.4x FY19E/20E book value.
RHF currently trades at a FY19E/20E P/BV of 2.2x/1.8x, which makes it significantly under-valued given its FY19E/20E RoE profile of 17.6%/18.8%. Consequently, we believe that the multiple of 2.8x/2.4x implied by our price target of Rs 709 is admissible.
Exhibit 7: Consensus vs Our Estimates
Our estimate Bloomberg estimate % Variance
(Rsmn) FY18E FY19E FY20E FY18E FY19E FY20E FY18E FY19E FY20E
Net interest income 4,377 5,246 6,516 4,255 4,775 5,577 2.9 9.9 16.8
Operating profit 3,944 4,790 6,027 3,741 4,227 4,990 5.4 13.3 20.8
Profit after tax 2,039 2,553 3,243 1,971 2,451 2,910 3.5 4.2 11.5
Key risks
Asset quality could deteriorate due on RHF’s large-ticket LAP book
Loan against property as a segment has seen higher level of stress due to hyper-competition and concomitant dilution of under-writing standards, particularly on the large-ticket LAP side and RHF has exposure to large-ticket LAP. However, the stress on RHF’s large-ticket LAP book is no longer rising and, as an HFC, they have also reduced exposure to this business significantly.
RHF has high exposure to the informal segment which remains vulnerable to a shock like Demonetisation
Most of RHF’s clientele belong to the informal segment where income is not regular and transactions are significantly based on cash and, hence, vulnerable to a cash crunch brought about by a note ban. However, our submission is that Demonetisation is an essentially non-repeatable black swan scenario with such events being frequent and tended to be carried out in gaps of several decades.
Company Overview Repco home Finance is a housing finance company with a branch network of 129 branches and a loan book of Rs 95bn. Of the loan book, the home loan and loan against property split is 81%, and 19%, respectively. Repco home finance has displayed a loan CAGR of 26% over FY12-17 and its yield on advances in its latest reported quarter was 11.5%.
Repco home finance has a cost of funds of 8.3% and, as a result, it registered a net interest margin of 4.6%. Its cost to income ratio stood at 18.9%. Consequently, it delivered a return on assets of 2.2% and a return on equity of 17.8%, implying a financial leverage of 8.1. Its employee count stood at 718 and its Capital Adequacy Ratio was 22.3%.
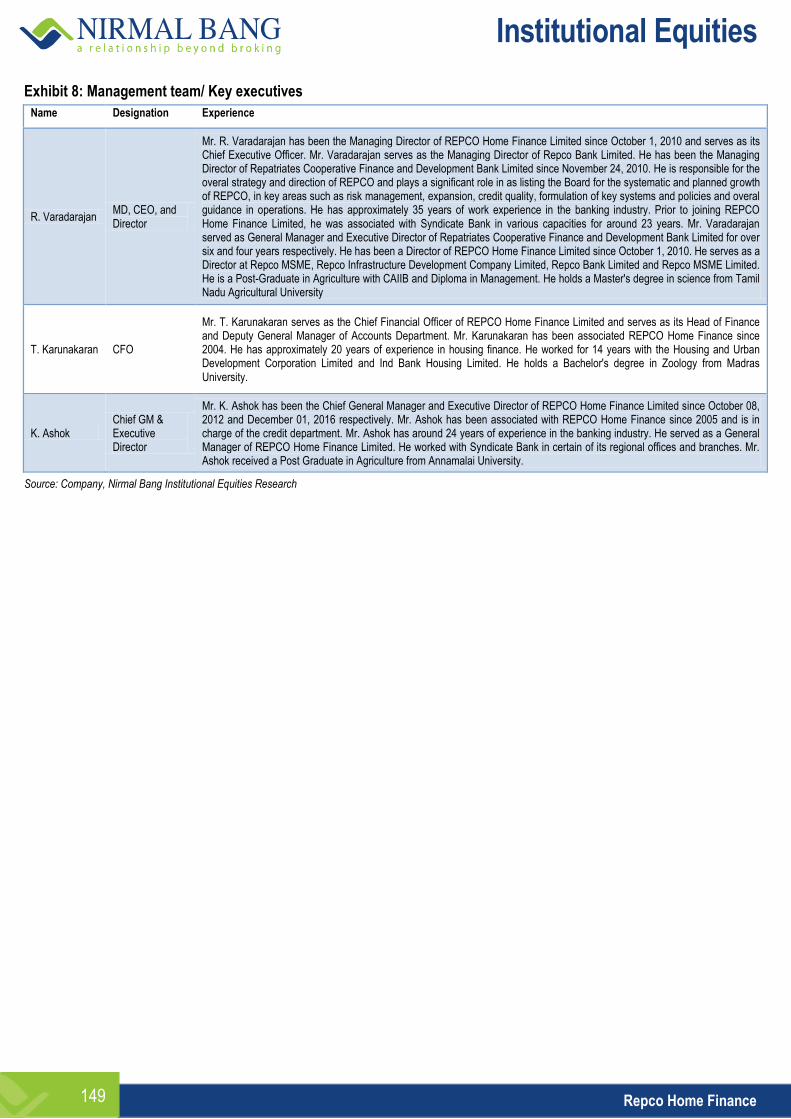
Institutional Equities
Repco Home Finance 149
Exhibit 8: Management team/ Key executives Name Designation Experience
R. Varadarajan MD, CEO, and Director
Mr. R. Varadarajan has been the Managing Director of REPCO Home Finance Limited since October 1, 2010 and serves as its Chief Executive Officer. Mr. Varadarajan serves as the Managing Director of Repco Bank Limited. He has been the Managing Director of Repatriates Cooperative Finance and Development Bank Limited since November 24, 2010. He is responsible for the overal strategy and direction of REPCO and plays a significant role in as listing the Board for the systematic and planned growth of REPCO, in key areas such as risk management, expansion, credit quality, formulation of key systems and policies and overal guidance in operations. He has approximately 35 years of work experience in the banking industry. Prior to joining REPCO Home Finance Limited, he was associated with Syndicate Bank in various capacities for around 23 years. Mr. Varadarajan served as General Manager and Executive Director of Repatriates Cooperative Finance and Development Bank Limited for over six and four years respectively. He has been a Director of REPCO Home Finance Limited since October 1, 2010. He serves as a Director at Repco MSME, Repco Infrastructure Development Company Limited, Repco Bank Limited and Repco MSME Limited. He is a Post-Graduate in Agriculture with CAIIB and Diploma in Management. He holds a Master's degree in science from Tamil Nadu Agricultural University
T. Karunakaran CFO
Mr. T. Karunakaran serves as the Chief Financial Officer of REPCO Home Finance Limited and serves as its Head of Finance and Deputy General Manager of Accounts Department. Mr. Karunakaran has been associated REPCO Home Finance since 2004. He has approximately 20 years of experience in housing finance. He worked for 14 years with the Housing and Urban Development Corporation Limited and Ind Bank Housing Limited. He holds a Bachelor's degree in Zoology from Madras University.
K. Ashok Chief GM & Executive Director
Mr. K. Ashok has been the Chief General Manager and Executive Director of REPCO Home Finance Limited since October 08, 2012 and December 01, 2016 respectively. Mr. Ashok has been associated with REPCO Home Finance since 2005 and is in charge of the credit department. Mr. Ashok has around 24 years of experience in the banking industry. He served as a General Manager of REPCO Home Finance Limited. He worked with Syndicate Bank in certain of its regional offices and branches. Mr. Ashok received a Post Graduate in Agriculture from Annamalai University.
Source: Company, Nirmal Bang Institutional Equities Research
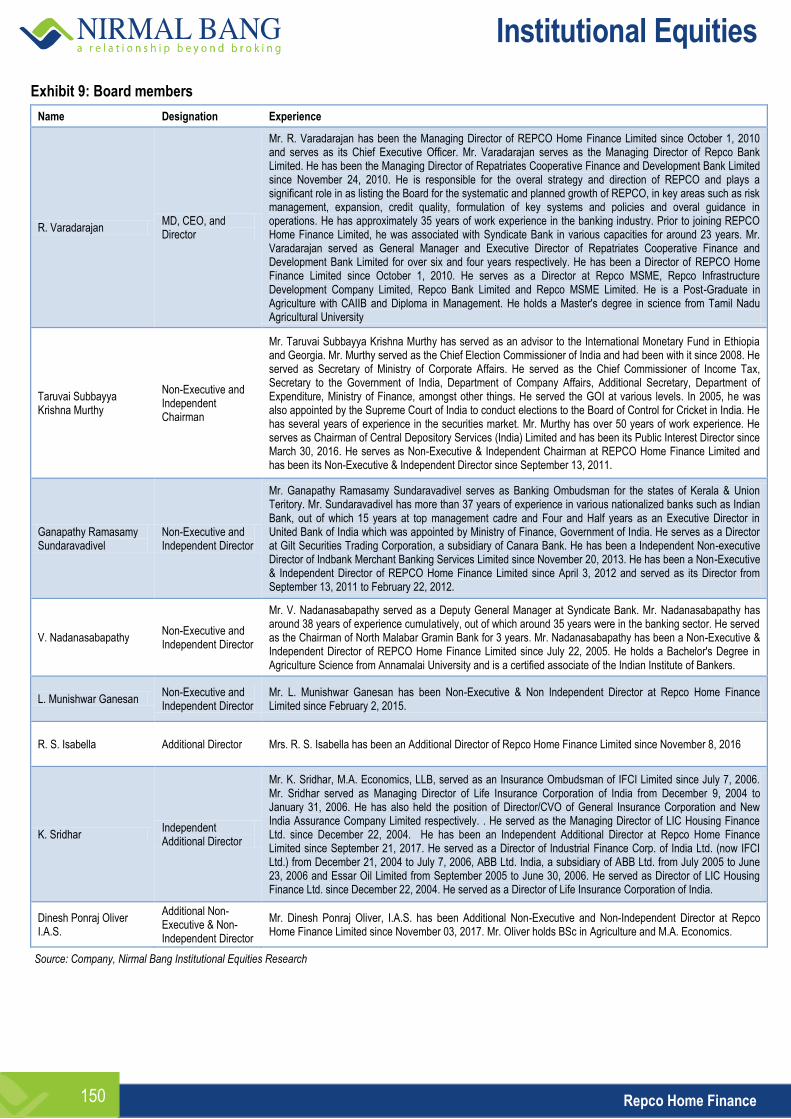
Institutional Equities
Repco Home Finance 150
Exhibit 9: Board members
Name Designation Experience
R. Varadarajan MD, CEO, and Director
Mr. R. Varadarajan has been the Managing Director of REPCO Home Finance Limited since October 1, 2010 and serves as its Chief Executive Officer. Mr. Varadarajan serves as the Managing Director of Repco Bank Limited. He has been the Managing Director of Repatriates Cooperative Finance and Development Bank Limited since November 24, 2010. He is responsible for the overal strategy and direction of REPCO and plays a significant role in as listing the Board for the systematic and planned growth of REPCO, in key areas such as risk management, expansion, credit quality, formulation of key systems and policies and overal guidance in operations. He has approximately 35 years of work experience in the banking industry. Prior to joining REPCO Home Finance Limited, he was associated with Syndicate Bank in various capacities for around 23 years. Mr. Varadarajan served as General Manager and Executive Director of Repatriates Cooperative Finance and Development Bank Limited for over six and four years respectively. He has been a Director of REPCO Home Finance Limited since October 1, 2010. He serves as a Director at Repco MSME, Repco Infrastructure Development Company Limited, Repco Bank Limited and Repco MSME Limited. He is a Post-Graduate in Agriculture with CAIIB and Diploma in Management. He holds a Master's degree in science from Tamil Nadu Agricultural University
Taruvai Subbayya Krishna Murthy
Non-Executive and Independent Chairman
Mr. Taruvai Subbayya Krishna Murthy has served as an advisor to the International Monetary Fund in Ethiopia and Georgia. Mr. Murthy served as the Chief Election Commissioner of India and had been with it since 2008. He served as Secretary of Ministry of Corporate Affairs. He served as the Chief Commissioner of Income Tax, Secretary to the Government of India, Department of Company Affairs, Additional Secretary, Department of Expenditure, Ministry of Finance, amongst other things. He served the GOI at various levels. In 2005, he was also appointed by the Supreme Court of India to conduct elections to the Board of Control for Cricket in India. He has several years of experience in the securities market. Mr. Murthy has over 50 years of work experience. He serves as Chairman of Central Depository Services (India) Limited and has been its Public Interest Director since March 30, 2016. He serves as Non-Executive & Independent Chairman at REPCO Home Finance Limited and has been its Non-Executive & Independent Director since September 13, 2011.
Ganapathy Ramasamy Sundaravadivel
Non-Executive and Independent Director
Mr. Ganapathy Ramasamy Sundaravadivel serves as Banking Ombudsman for the states of Kerala & Union Teritory. Mr. Sundaravadivel has more than 37 years of experience in various nationalized banks such as Indian Bank, out of which 15 years at top management cadre and Four and Half years as an Executive Director in United Bank of India which was appointed by Ministry of Finance, Government of India. He serves as a Director at Gilt Securities Trading Corporation, a subsidiary of Canara Bank. He has been a Independent Non-executive Director of Indbank Merchant Banking Services Limited since November 20, 2013. He has been a Non-Executive & Independent Director of REPCO Home Finance Limited since April 3, 2012 and served as its Director from September 13, 2011 to February 22, 2012.
V. Nadanasabapathy Non-Executive and Independent Director
Mr. V. Nadanasabapathy served as a Deputy General Manager at Syndicate Bank. Mr. Nadanasabapathy has around 38 years of experience cumulatively, out of which around 35 years were in the banking sector. He served as the Chairman of North Malabar Gramin Bank for 3 years. Mr. Nadanasabapathy has been a Non-Executive & Independent Director of REPCO Home Finance Limited since July 22, 2005. He holds a Bachelor's Degree in Agriculture Science from Annamalai University and is a certified associate of the Indian Institute of Bankers.
L. Munishwar Ganesan Non-Executive and Independent Director
Mr. L. Munishwar Ganesan has been Non-Executive & Non Independent Director at Repco Home Finance Limited since February 2, 2015.
R. S. Isabella Additional Director Mrs. R. S. Isabella has been an Additional Director of Repco Home Finance Limited since November 8, 2016
K. Sridhar Independent Additional Director
Mr. K. Sridhar, M.A. Economics, LLB, served as an Insurance Ombudsman of IFCI Limited since July 7, 2006. Mr. Sridhar served as Managing Director of Life Insurance Corporation of India from December 9, 2004 to January 31, 2006. He has also held the position of Director/CVO of General Insurance Corporation and New India Assurance Company Limited respectively. . He served as the Managing Director of LIC Housing Finance Ltd. since December 22, 2004. He has been an Independent Additional Director at Repco Home Finance Limited since September 21, 2017. He served as a Director of Industrial Finance Corp. of India Ltd. (now IFCI Ltd.) from December 21, 2004 to July 7, 2006, ABB Ltd. India, a subsidiary of ABB Ltd. from July 2005 to June 23, 2006 and Essar Oil Limited from September 2005 to June 30, 2006. He served as Director of LIC Housing Finance Ltd. since December 22, 2004. He served as a Director of Life Insurance Corporation of India.
Dinesh Ponraj Oliver I.A.S.
Additional Non-Executive & Non-Independent Director
Mr. Dinesh Ponraj Oliver, I.A.S. has been Additional Non-Executive and Non-Independent Director at Repco Home Finance Limited since November 03, 2017. Mr. Oliver holds BSc in Agriculture and M.A. Economics.
Source: Company, Nirmal Bang Institutional Equities Research
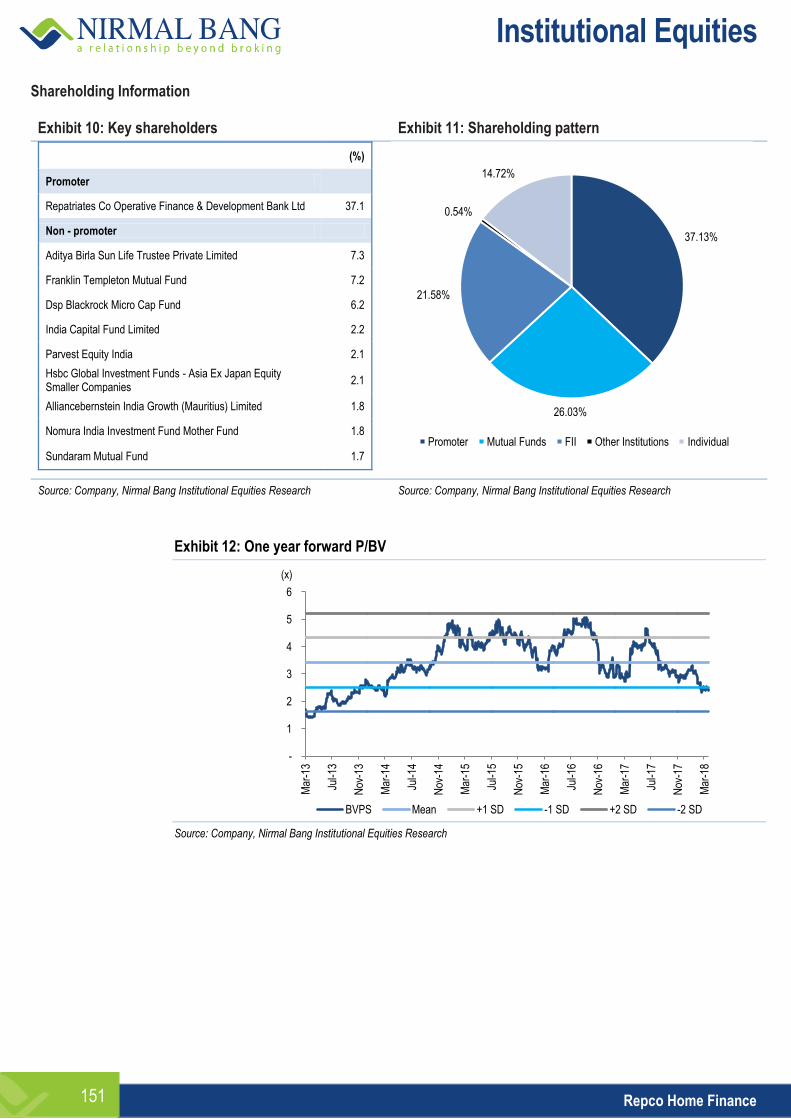
Institutional Equities
Repco Home Finance 151
Shareholding Information Exhibit 10: Key shareholders Exhibit 11: Shareholding pattern
(%)
Promoter
Repatriates Co Operative Finance & Development Bank Ltd 37.1
Non - promoter
Aditya Birla Sun Life Trustee Private Limited 7.3
Franklin Templeton Mutual Fund 7.2
Dsp Blackrock Micro Cap Fund 6.2
India Capital Fund Limited 2.2
Parvest Equity India 2.1
Hsbc Global Investment Funds - Asia Ex Japan Equity Smaller Companies
2.1
Alliancebernstein India Growth (Mauritius) Limited 1.8
Nomura India Investment Fund Mother Fund 1.8
Sundaram Mutual Fund 1.7
Source: Company, Nirmal Bang Institutional Equities Research Source: Company, Nirmal Bang Institutional Equities Research
Exhibit 12: One year forward P/BV
Source: Company, Nirmal Bang Institutional Equities Research
-
1
2
3
4
5
6
Mar
-13
Jul-1
3
Nov
-13
Mar
-14
Jul-1
4
Nov
-14
Mar
-15
Jul-1
5
Nov
-15
Mar
-16
Jul-1
6
Nov
-16
Mar
-17
Jul-1
7
Nov
-17
Mar
-18
BVPS Mean +1 SD -1 SD +2 SD -2 SD
(x)
37.13%
26.03%
21.58%
0.54%
14.72%
Promoter Mutual Funds FII Other Institutions Individual
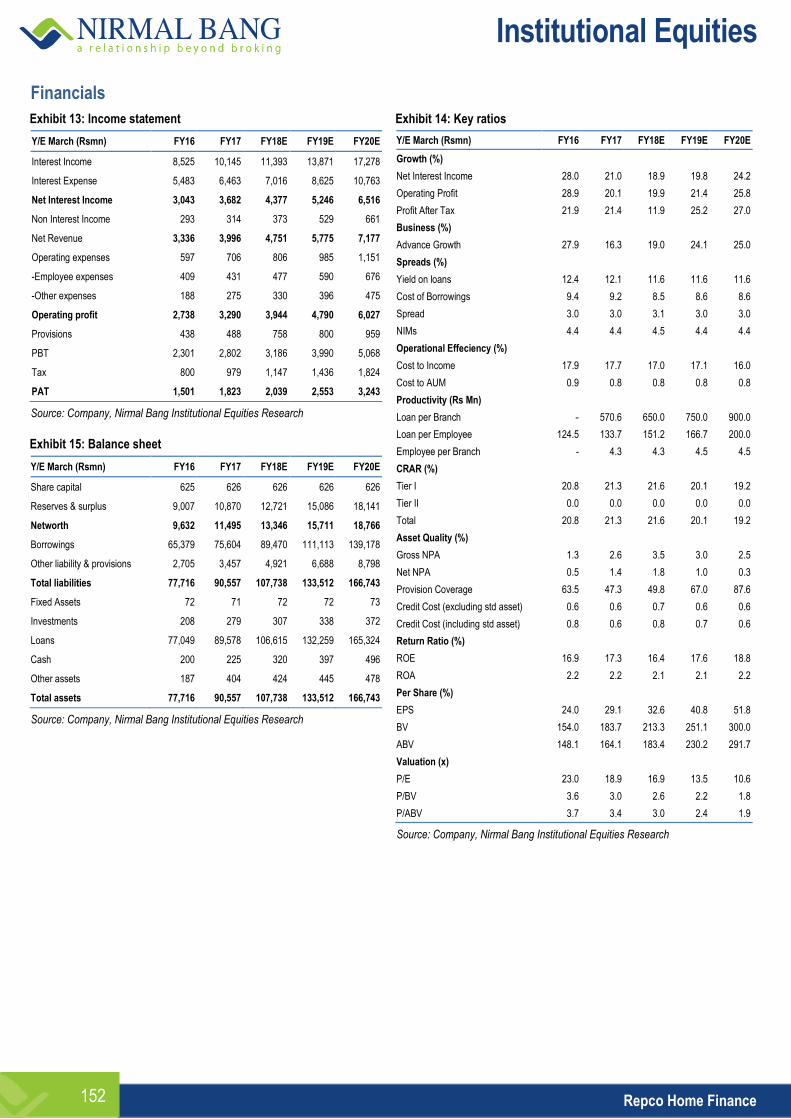
Institutional Equities
Repco Home Finance 152
Financials
Exhibit 13: Income statement
Y/E March (Rsmn) FY16 FY17 FY18E FY19E FY20E
Interest Income 8,525 10,145 11,393 13,871 17,278
Interest Expense 5,483 6,463 7,016 8,625 10,763
Net Interest Income 3,043 3,682 4,377 5,246 6,516
Non Interest Income 293 314 373 529 661
Net Revenue 3,336 3,996 4,751 5,775 7,177
Operating expenses 597 706 806 985 1,151
-Employee expenses 409 431 477 590 676
-Other expenses 188 275 330 396 475
Operating profit 2,738 3,290 3,944 4,790 6,027
Provisions 438 488 758 800 959
PBT 2,301 2,802 3,186 3,990 5,068
Tax 800 979 1,147 1,436 1,824
PAT 1,501 1,823 2,039 2,553 3,243
Source: Company, Nirmal Bang Institutional Equities Research
Exhibit 15: Balance sheet
Y/E March (Rsmn) FY16 FY17 FY18E FY19E FY20E
Share capital 625 626 626 626 626
Reserves & surplus 9,007 10,870 12,721 15,086 18,141
Networth 9,632 11,495 13,346 15,711 18,766
Borrowings 65,379 75,604 89,470 111,113 139,178
Other liability & provisions 2,705 3,457 4,921 6,688 8,798
Total liabilities 77,716 90,557 107,738 133,512 166,743
Fixed Assets 72 71 72 72 73
Investments 208 279 307 338 372
Loans 77,049 89,578 106,615 132,259 165,324
Cash 200 225 320 397 496
Other assets 187 404 424 445 478
Total assets 77,716 90,557 107,738 133,512 166,743
Source: Company, Nirmal Bang Institutional Equities Research
Exhibit 14: Key ratios
Y/E March (Rsmn) FY16 FY17 FY18E FY19E FY20E
Growth (%)
Net Interest Income 28.0 21.0 18.9 19.8 24.2
Operating Profit 28.9 20.1 19.9 21.4 25.8
Profit After Tax 21.9 21.4 11.9 25.2 27.0
Business (%)
Advance Growth 27.9 16.3 19.0 24.1 25.0
Spreads (%)
Yield on loans 12.4 12.1 11.6 11.6 11.6
Cost of Borrowings 9.4 9.2 8.5 8.6 8.6
Spread 3.0 3.0 3.1 3.0 3.0
NIMs 4.4 4.4 4.5 4.4 4.4
Operational Effeciency (%)
Cost to Income 17.9 17.7 17.0 17.1 16.0
Cost to AUM 0.9 0.8 0.8 0.8 0.8
Productivity (Rs Mn)
Loan per Branch - 570.6 650.0 750.0 900.0
Loan per Employee 124.5 133.7 151.2 166.7 200.0
Employee per Branch - 4.3 4.3 4.5 4.5
CRAR (%)
Tier I 20.8 21.3 21.6 20.1 19.2
Tier II 0.0 0.0 0.0 0.0 0.0
Total 20.8 21.3 21.6 20.1 19.2
Asset Quality (%)
Gross NPA 1.3 2.6 3.5 3.0 2.5
Net NPA 0.5 1.4 1.8 1.0 0.3
Provision Coverage 63.5 47.3 49.8 67.0 87.6
Credit Cost (excluding std asset) 0.6 0.6 0.7 0.6 0.6
Credit Cost (including std asset) 0.8 0.6 0.8 0.7 0.6
Return Ratio (%)
ROE 16.9 17.3 16.4 17.6 18.8
ROA 2.2 2.2 2.1 2.1 2.2
Per Share (%)
EPS 24.0 29.1 32.6 40.8 51.8
BV 154.0 183.7 213.3 251.1 300.0
ABV 148.1 164.1 183.4 230.2 291.7
Valuation (x)
P/E 23.0 18.9 16.9 13.5 10.6
P/BV 3.6 3.0 2.6 2.2 1.8
P/ABV 3.7 3.4 3.0 2.4 1.9
Source: Company, Nirmal Bang Institutional Equities Research
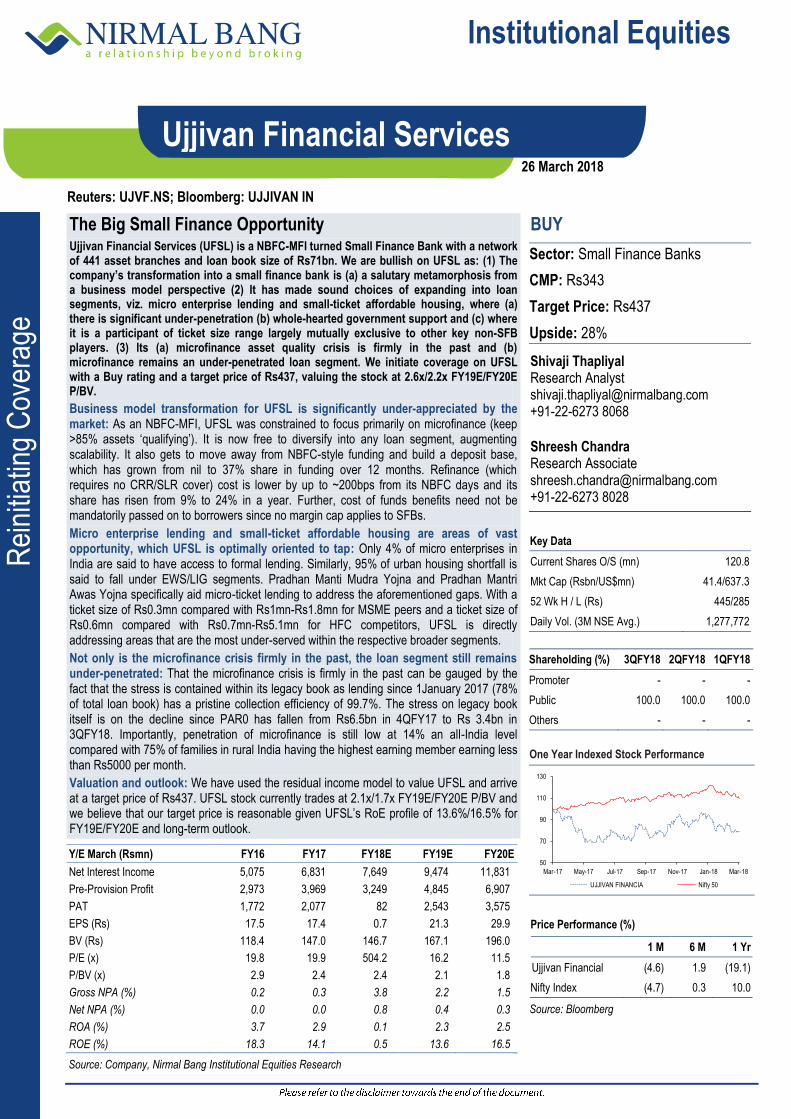
Institutional Equities
Rei
nitia
ting
Cov
erag
e
Reuters: UJVF.NS; Bloomberg: UJJIVAN IN
Ujjivan Financial Services
The Big Small Finance Opportunity Ujjivan Financial Services (UFSL) is a NBFC-MFI turned Small Finance Bank with a network of 441 asset branches and loan book size of Rs71bn. We are bullish on UFSL as: (1) The company’s transformation into a small finance bank is (a) a salutary metamorphosis from a business model perspective (2) It has made sound choices of expanding into loan segments, viz. micro enterprise lending and small-ticket affordable housing, where (a) there is significant under-penetration (b) whole-hearted government support and (c) where it is a participant of ticket size range largely mutually exclusive to other key non-SFB players. (3) Its (a) microfinance asset quality crisis is firmly in the past and (b) microfinance remains an under-penetrated loan segment. We initiate coverage on UFSL with a Buy rating and a target price of Rs437, valuing the stock at 2.6x/2.2x FY19E/FY20E P/BV.
Business model transformation for UFSL is significantly under-appreciated by the market: As an NBFC-MFI, UFSL was constrained to focus primarily on microfinance (keep >85% assets ‘qualifying’). It is now free to diversify into any loan segment, augmenting scalability. It also gets to move away from NBFC-style funding and build a deposit base, which has grown from nil to 37% share in funding over 12 months. Refinance (which requires no CRR/SLR cover) cost is lower by up to ~200bps from its NBFC days and its share has risen from 9% to 24% in a year. Further, cost of funds benefits need not be mandatorily passed on to borrowers since no margin cap applies to SFBs.
Micro enterprise lending and small-ticket affordable housing are areas of vast opportunity, which UFSL is optimally oriented to tap: Only 4% of micro enterprises in India are said to have access to formal lending. Similarly, 95% of urban housing shortfall is said to fall under EWS/LIG segments. Pradhan Manti Mudra Yojna and Pradhan Mantri Awas Yojna specifically aid micro-ticket lending to address the aforementioned gaps. With a ticket size of Rs0.3mn compared with Rs1mn-Rs1.8mn for MSME peers and a ticket size of Rs0.6mn compared with Rs0.7mn-Rs5.1mn for HFC competitors, UFSL is directly addressing areas that are the most under-served within the respective broader segments.
Not only is the microfinance crisis firmly in the past, the loan segment still remains under-penetrated: That the microfinance crisis is firmly in the past can be gauged by the fact that the stress is contained within its legacy book as lending since 1January 2017 (78% of total loan book) has a pristine collection efficiency of 99.7%. The stress on legacy book itself is on the decline since PAR0 has fallen from Rs6.5bn in 4QFY17 to Rs 3.4bn in 3QFY18. Importantly, penetration of microfinance is still low at 14% an all-India level compared with 75% of families in rural India having the highest earning member earning less than Rs5000 per month.
Valuation and outlook: We have used the residual income model to value UFSL and arrive at a target price of Rs437. UFSL stock currently trades at 2.1x/1.7x FY19E/FY20E P/BV and we believe that our target price is reasonable given UFSL’s RoE profile of 13.6%/16.5% for FY19E/FY20E and long-term outlook.
BUY
Sector: Small Finance Banks
CMP: Rs343
Target Price: Rs437
Upside: 28%
Shivaji Thapliyal Research Analyst [email protected] +91-22-6273 8068 Shreesh Chandra Research Associate [email protected] +91-22-6273 8028
Key Data
Current Shares O/S (mn) 120.8
Mkt Cap (Rsbn/US$mn) 41.4/637.3
52 Wk H / L (Rs) 445/285
Daily Vol. (3M NSE Avg.) 1,277,772
Shareholding (%) 3QFY18 2QFY18 1QFY18
Promoter - - -
Public 100.0 100.0 100.0
Others - - -
One Year Indexed Stock Performance
Price Performance (%)
1 M 6 M 1 Yr
Ujjivan Financial (4.6) 1.9 (19.1)
Nifty Index (4.7) 0.3 10.0
Source: Bloomberg
Y/E March (Rsmn) FY16 FY17 FY18E FY19E FY20E
Net Interest Income 5,075 6,831 7,649 9,474 11,831
Pre-Provision Profit 2,973 3,969 3,249 4,845 6,907
PAT 1,772 2,077 82 2,543 3,575
EPS (Rs) 17.5 17.4 0.7 21.3 29.9
BV (Rs) 118.4 147.0 146.7 167.1 196.0
P/E (x) 19.8 19.9 504.2 16.2 11.5
P/BV (x) 2.9 2.4 2.4 2.1 1.8
Gross NPA (%) 0.2 0.3 3.8 2.2 1.5
Net NPA (%) 0.0 0.0 0.8 0.4 0.3
ROA (%) 3.7 2.9 0.1 2.3 2.5
ROE (%) 18.3 14.1 0.5 13.6 16.5
Source: Company, Nirmal Bang Institutional Equities Research
50
70
90
110
130
Mar-17 May-17 Jul-17 Sep-17 Nov-17 Jan-18 Mar-18
UJJIVAN FINANCIA Nifty 50
26 March 2018
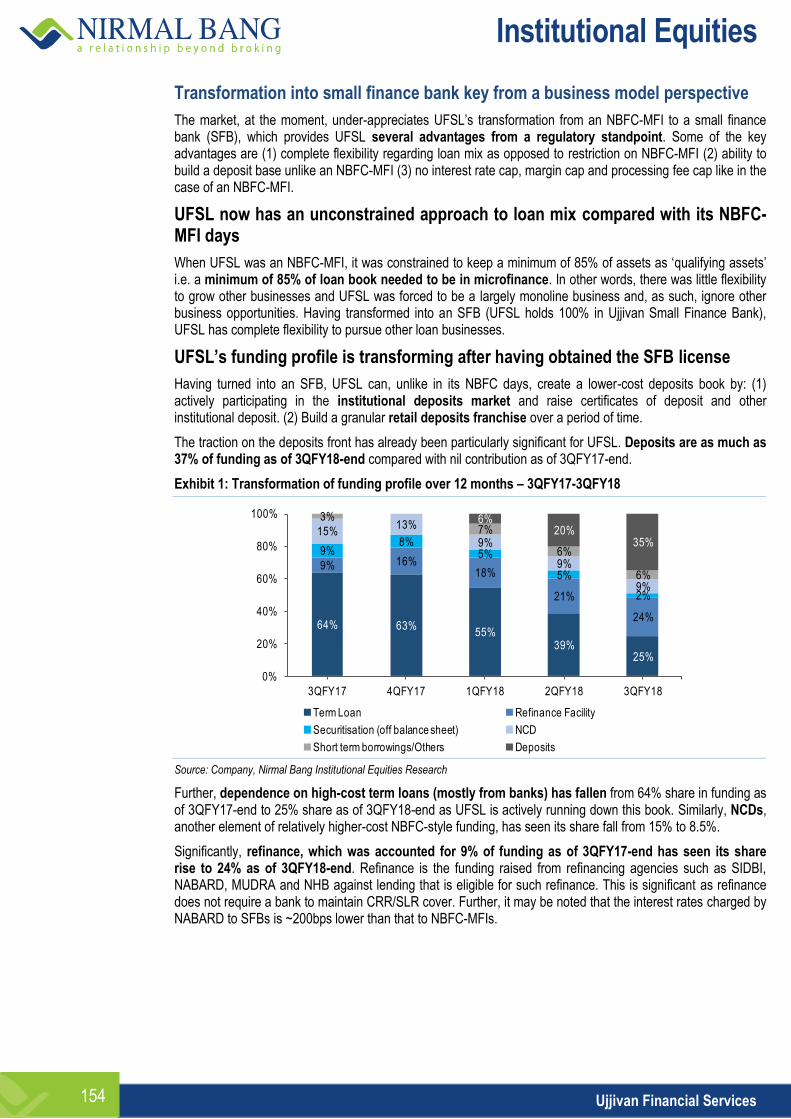
Institutional Equities
Ujjivan Financial Services 154
Transformation into small finance bank key from a business model perspective
The market, at the moment, under-appreciates UFSL’s transformation from an NBFC-MFI to a small finance bank (SFB), which provides UFSL several advantages from a regulatory standpoint. Some of the key advantages are (1) complete flexibility regarding loan mix as opposed to restriction on NBFC-MFI (2) ability to build a deposit base unlike an NBFC-MFI (3) no interest rate cap, margin cap and processing fee cap like in the case of an NBFC-MFI.
UFSL now has an unconstrained approach to loan mix compared with its NBFC-MFI days
When UFSL was an NBFC-MFI, it was constrained to keep a minimum of 85% of assets as ‘qualifying assets’ i.e. a minimum of 85% of loan book needed to be in microfinance. In other words, there was little flexibility to grow other businesses and UFSL was forced to be a largely monoline business and, as such, ignore other business opportunities. Having transformed into an SFB (UFSL holds 100% in Ujjivan Small Finance Bank), UFSL has complete flexibility to pursue other loan businesses.
UFSL’s funding profile is transforming after having obtained the SFB license
Having turned into an SFB, UFSL can, unlike in its NBFC days, create a lower-cost deposits book by: (1) actively participating in the institutional deposits market and raise certificates of deposit and other institutional deposit. (2) Build a granular retail deposits franchise over a period of time.
The traction on the deposits front has already been particularly significant for UFSL. Deposits are as much as 37% of funding as of 3QFY18-end compared with nil contribution as of 3QFY17-end.
Exhibit 1: Transformation of funding profile over 12 months – 3QFY17-3QFY18
Source: Company, Nirmal Bang Institutional Equities Research
Further, dependence on high-cost term loans (mostly from banks) has fallen from 64% share in funding as of 3QFY17-end to 25% share as of 3QFY18-end as UFSL is actively running down this book. Similarly, NCDs, another element of relatively higher-cost NBFC-style funding, has seen its share fall from 15% to 8.5%.
Significantly, refinance, which was accounted for 9% of funding as of 3QFY17-end has seen its share rise to 24% as of 3QFY18-end. Refinance is the funding raised from refinancing agencies such as SIDBI, NABARD, MUDRA and NHB against lending that is eligible for such refinance. This is significant as refinance does not require a bank to maintain CRR/SLR cover. Further, it may be noted that the interest rates charged by NABARD to SFBs is ~200bps lower than that to NBFC-MFIs.
64% 63%55%
39%25%
9% 16%18%
21%
24%
9%8%
5%
5%
2%
15%13%
9%
9%
9%
3%7%
6%
6%
6%20%
35%
0%
20%
40%
60%
80%
100%
3QFY17 4QFY17 1QFY18 2QFY18 3QFY18
Term Loan Refinance Facility
Securitisation (off balance sheet) NCD
Short term borrowings/Others Deposits
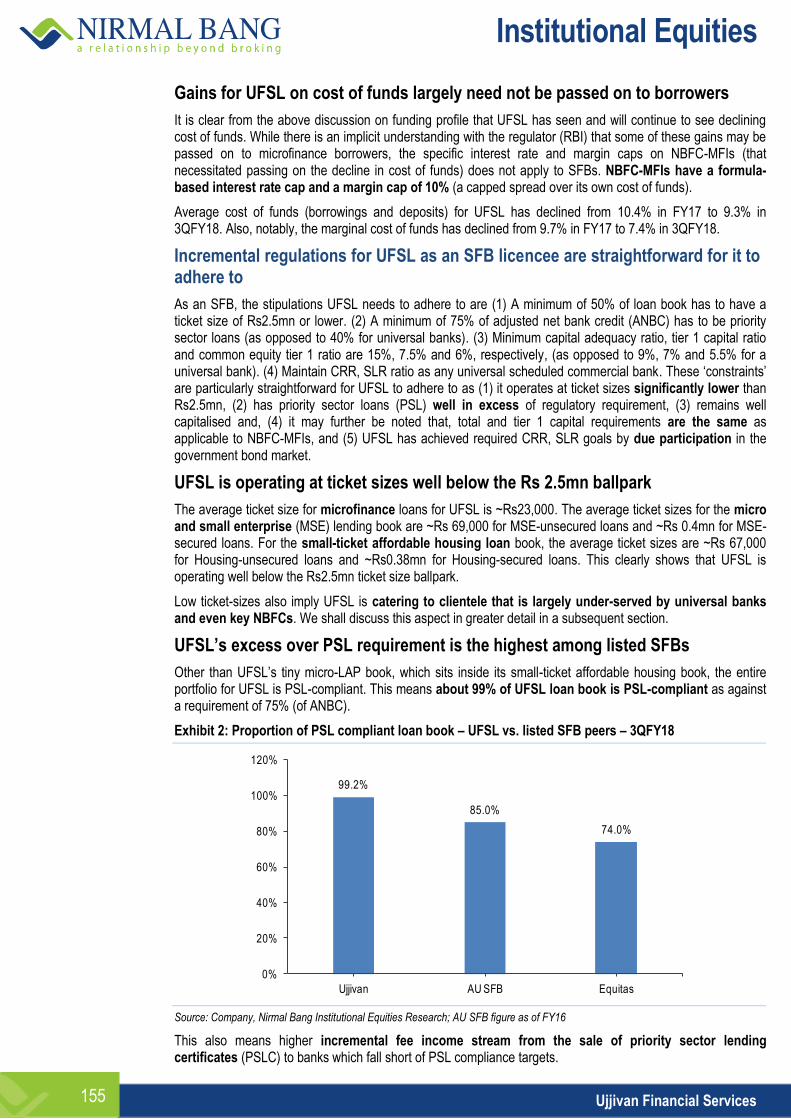
Institutional Equities
Ujjivan Financial Services 155
Gains for UFSL on cost of funds largely need not be passed on to borrowers
It is clear from the above discussion on funding profile that UFSL has seen and will continue to see declining cost of funds. While there is an implicit understanding with the regulator (RBI) that some of these gains may be passed on to microfinance borrowers, the specific interest rate and margin caps on NBFC-MFIs (that necessitated passing on the decline in cost of funds) does not apply to SFBs. NBFC-MFIs have a formula-based interest rate cap and a margin cap of 10% (a capped spread over its own cost of funds).
Average cost of funds (borrowings and deposits) for UFSL has declined from 10.4% in FY17 to 9.3% in 3QFY18. Also, notably, the marginal cost of funds has declined from 9.7% in FY17 to 7.4% in 3QFY18.
Incremental regulations for UFSL as an SFB licencee are straightforward for it to adhere to
As an SFB, the stipulations UFSL needs to adhere to are (1) A minimum of 50% of loan book has to have a ticket size of Rs2.5mn or lower. (2) A minimum of 75% of adjusted net bank credit (ANBC) has to be priority sector loans (as opposed to 40% for universal banks). (3) Minimum capital adequacy ratio, tier 1 capital ratio and common equity tier 1 ratio are 15%, 7.5% and 6%, respectively, (as opposed to 9%, 7% and 5.5% for a universal bank). (4) Maintain CRR, SLR ratio as any universal scheduled commercial bank. These ‘constraints’ are particularly straightforward for UFSL to adhere to as (1) it operates at ticket sizes significantly lower than Rs2.5mn, (2) has priority sector loans (PSL) well in excess of regulatory requirement, (3) remains well capitalised and, (4) it may further be noted that, total and tier 1 capital requirements are the same as applicable to NBFC-MFIs, and (5) UFSL has achieved required CRR, SLR goals by due participation in the government bond market.
UFSL is operating at ticket sizes well below the Rs 2.5mn ballpark
The average ticket size for microfinance loans for UFSL is ~Rs23,000. The average ticket sizes for the micro and small enterprise (MSE) lending book are ~Rs 69,000 for MSE-unsecured loans and ~Rs 0.4mn for MSE-secured loans. For the small-ticket affordable housing loan book, the average ticket sizes are ~Rs 67,000 for Housing-unsecured loans and ~Rs0.38mn for Housing-secured loans. This clearly shows that UFSL is operating well below the Rs2.5mn ticket size ballpark.
Low ticket-sizes also imply UFSL is catering to clientele that is largely under-served by universal banks and even key NBFCs. We shall discuss this aspect in greater detail in a subsequent section.
UFSL’s excess over PSL requirement is the highest among listed SFBs
Other than UFSL’s tiny micro-LAP book, which sits inside its small-ticket affordable housing book, the entire portfolio for UFSL is PSL-compliant. This means about 99% of UFSL loan book is PSL-compliant as against a requirement of 75% (of ANBC).
Exhibit 2: Proportion of PSL compliant loan book – UFSL vs. listed SFB peers – 3QFY18
Source: Company, Nirmal Bang Institutional Equities Research; AU SFB figure as of FY16
This also means higher incremental fee income stream from the sale of priority sector lending certificates (PSLC) to banks which fall short of PSL compliance targets.
99.2%
85.0%
74.0%
0%
20%
40%
60%
80%
100%
120%
Ujjivan AU SFB Equitas
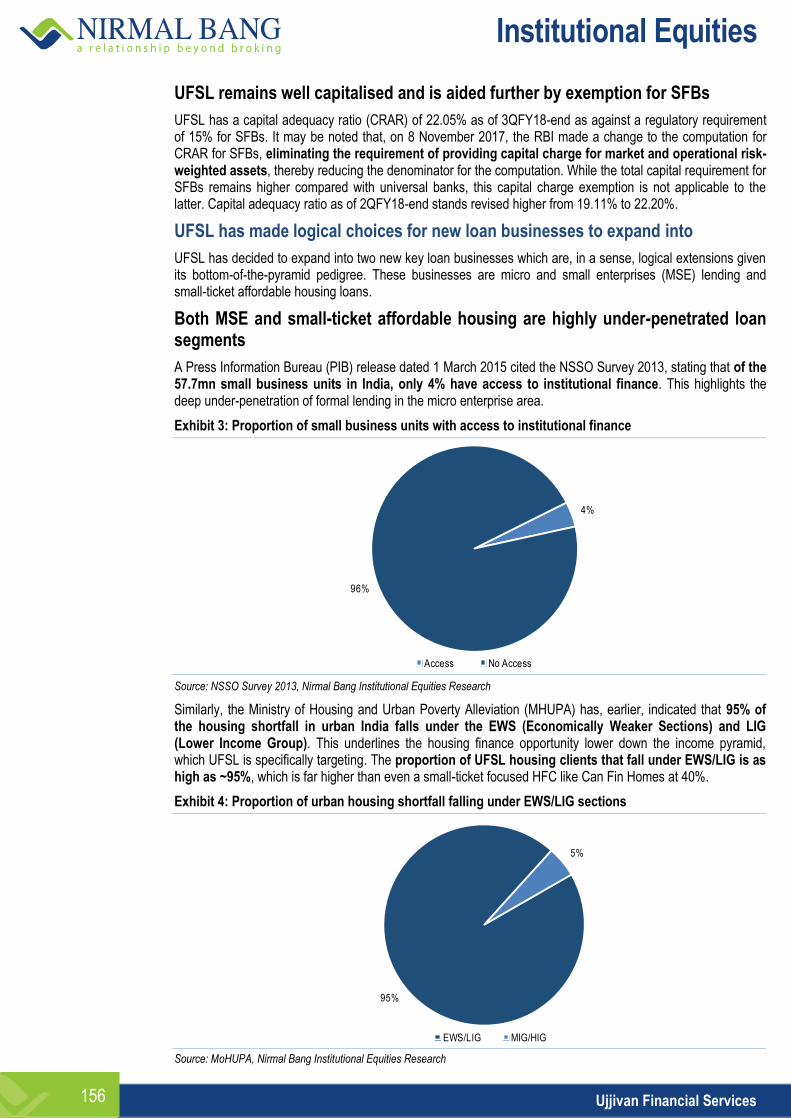
Institutional Equities
Ujjivan Financial Services 156
UFSL remains well capitalised and is aided further by exemption for SFBs
UFSL has a capital adequacy ratio (CRAR) of 22.05% as of 3QFY18-end as against a regulatory requirement of 15% for SFBs. It may be noted that, on 8 November 2017, the RBI made a change to the computation for CRAR for SFBs, eliminating the requirement of providing capital charge for market and operational risk-weighted assets, thereby reducing the denominator for the computation. While the total capital requirement for SFBs remains higher compared with universal banks, this capital charge exemption is not applicable to the latter. Capital adequacy ratio as of 2QFY18-end stands revised higher from 19.11% to 22.20%.
UFSL has made logical choices for new loan businesses to expand into
UFSL has decided to expand into two new key loan businesses which are, in a sense, logical extensions given its bottom-of-the-pyramid pedigree. These businesses are micro and small enterprises (MSE) lending and small-ticket affordable housing loans.
Both MSE and small-ticket affordable housing are highly under-penetrated loan segments
A Press Information Bureau (PIB) release dated 1 March 2015 cited the NSSO Survey 2013, stating that of the 57.7mn small business units in India, only 4% have access to institutional finance. This highlights the deep under-penetration of formal lending in the micro enterprise area.
Exhibit 3: Proportion of small business units with access to institutional finance
Source: NSSO Survey 2013, Nirmal Bang Institutional Equities Research
Similarly, the Ministry of Housing and Urban Poverty Alleviation (MHUPA) has, earlier, indicated that 95% of the housing shortfall in urban India falls under the EWS (Economically Weaker Sections) and LIG (Lower Income Group). This underlines the housing finance opportunity lower down the income pyramid, which UFSL is specifically targeting. The proportion of UFSL housing clients that fall under EWS/LIG is as high as ~95%, which is far higher than even a small-ticket focused HFC like Can Fin Homes at 40%.
Exhibit 4: Proportion of urban housing shortfall falling under EWS/LIG sections
Source: MoHUPA, Nirmal Bang Institutional Equities Research
4%
96%
Access No Access
95%
5%
EWS/LIG MIG/HIG
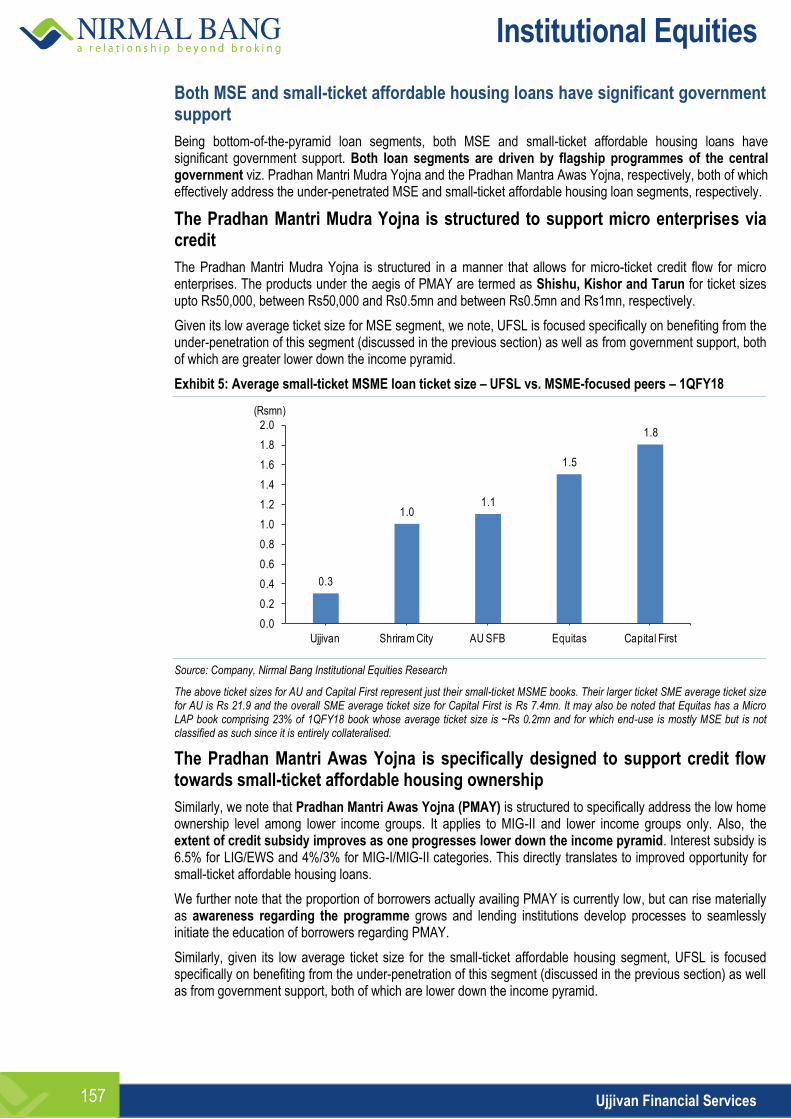
Institutional Equities
Ujjivan Financial Services 157
Both MSE and small-ticket affordable housing loans have significant government support
Being bottom-of-the-pyramid loan segments, both MSE and small-ticket affordable housing loans have significant government support. Both loan segments are driven by flagship programmes of the central government viz. Pradhan Mantri Mudra Yojna and the Pradhan Mantra Awas Yojna, respectively, both of which effectively address the under-penetrated MSE and small-ticket affordable housing loan segments, respectively.
The Pradhan Mantri Mudra Yojna is structured to support micro enterprises via credit
The Pradhan Mantri Mudra Yojna is structured in a manner that allows for micro-ticket credit flow for micro enterprises. The products under the aegis of PMAY are termed as Shishu, Kishor and Tarun for ticket sizes upto Rs50,000, between Rs50,000 and Rs0.5mn and between Rs0.5mn and Rs1mn, respectively.
Given its low average ticket size for MSE segment, we note, UFSL is focused specifically on benefiting from the under-penetration of this segment (discussed in the previous section) as well as from government support, both of which are greater lower down the income pyramid.
Exhibit 5: Average small-ticket MSME loan ticket size – UFSL vs. MSME-focused peers – 1QFY18
Source: Company, Nirmal Bang Institutional Equities Research
The above ticket sizes for AU and Capital First represent just their small-ticket MSME books. Their larger ticket SME average ticket size for AU is Rs 21.9 and the overall SME average ticket size for Capital First is Rs 7.4mn. It may also be noted that Equitas has a Micro LAP book comprising 23% of 1QFY18 book whose average ticket size is ~Rs 0.2mn and for which end-use is mostly MSE but is not classified as such since it is entirely collateralised.
The Pradhan Mantri Awas Yojna is specifically designed to support credit flow towards small-ticket affordable housing ownership
Similarly, we note that Pradhan Mantri Awas Yojna (PMAY) is structured to specifically address the low home ownership level among lower income groups. It applies to MIG-II and lower income groups only. Also, the extent of credit subsidy improves as one progresses lower down the income pyramid. Interest subsidy is 6.5% for LIG/EWS and 4%/3% for MIG-I/MIG-II categories. This directly translates to improved opportunity for small-ticket affordable housing loans.
We further note that the proportion of borrowers actually availing PMAY is currently low, but can rise materially as awareness regarding the programme grows and lending institutions develop processes to seamlessly initiate the education of borrowers regarding PMAY.
Similarly, given its low average ticket size for the small-ticket affordable housing segment, UFSL is focused specifically on benefiting from the under-penetration of this segment (discussed in the previous section) as well as from government support, both of which are lower down the income pyramid.
0.3
1.01.1
1.5
1.8
0.0
0.2
0.4
0.6
0.8
1.0
1.2
1.4
1.6
1.8
2.0
Ujjivan Shriram City AU SFB Equitas Capital First
(Rsmn)
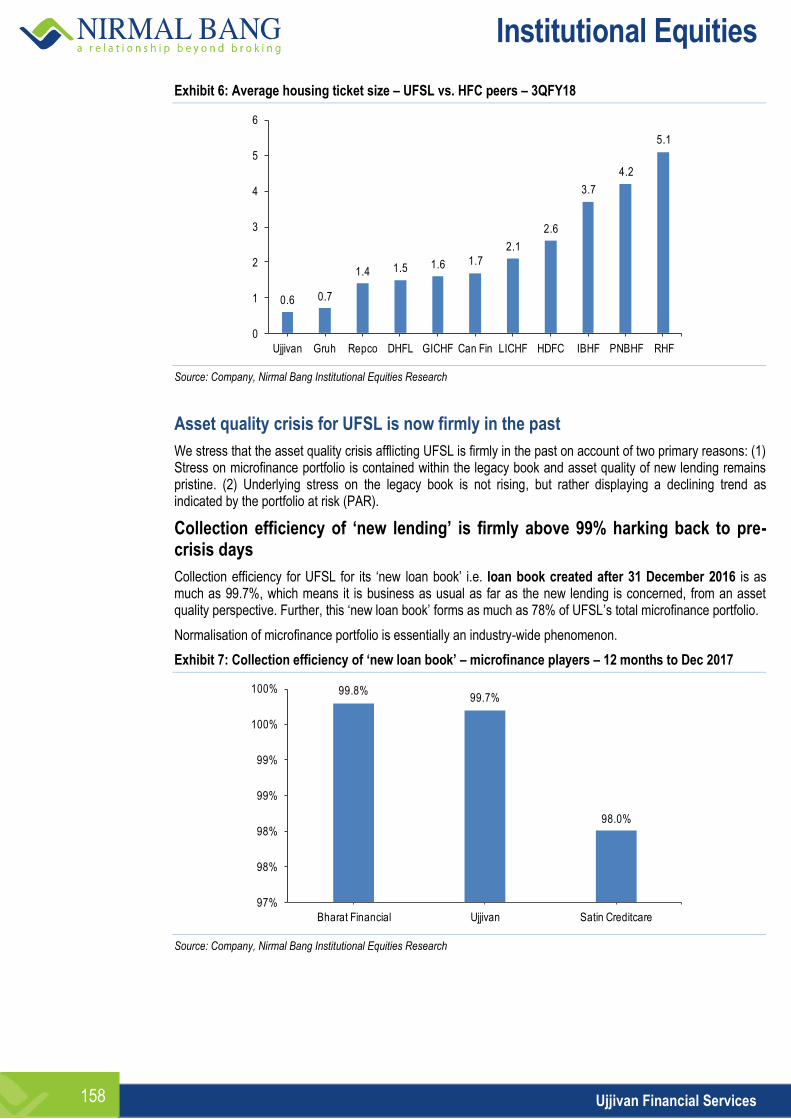
Institutional Equities
Ujjivan Financial Services 158
Exhibit 6: Average housing ticket size – UFSL vs. HFC peers – 3QFY18
Source: Company, Nirmal Bang Institutional Equities Research
Asset quality crisis for UFSL is now firmly in the past
We stress that the asset quality crisis afflicting UFSL is firmly in the past on account of two primary reasons: (1) Stress on microfinance portfolio is contained within the legacy book and asset quality of new lending remains pristine. (2) Underlying stress on the legacy book is not rising, but rather displaying a declining trend as indicated by the portfolio at risk (PAR).
Collection efficiency of ‘new lending’ is firmly above 99% harking back to pre-crisis days
Collection efficiency for UFSL for its ‘new loan book’ i.e. loan book created after 31 December 2016 is as much as 99.7%, which means it is business as usual as far as the new lending is concerned, from an asset quality perspective. Further, this ‘new loan book’ forms as much as 78% of UFSL’s total microfinance portfolio.
Normalisation of microfinance portfolio is essentially an industry-wide phenomenon.
Exhibit 7: Collection efficiency of ‘new loan book’ – microfinance players – 12 months to Dec 2017
Source: Company, Nirmal Bang Institutional Equities Research
0.6 0.7
1.4 1.5 1.6 1.7
2.1
2.6
3.7
4.2
5.1
0
1
2
3
4
5
6
Ujjivan Gruh Repco DHFL GICHF Can Fin LICHF HDFC IBHF PNBHF RHF
99.8%99.7%
98.0%
97%
98%
98%
99%
99%
100%
100%
Bharat Financial Ujjivan Satin Creditcare
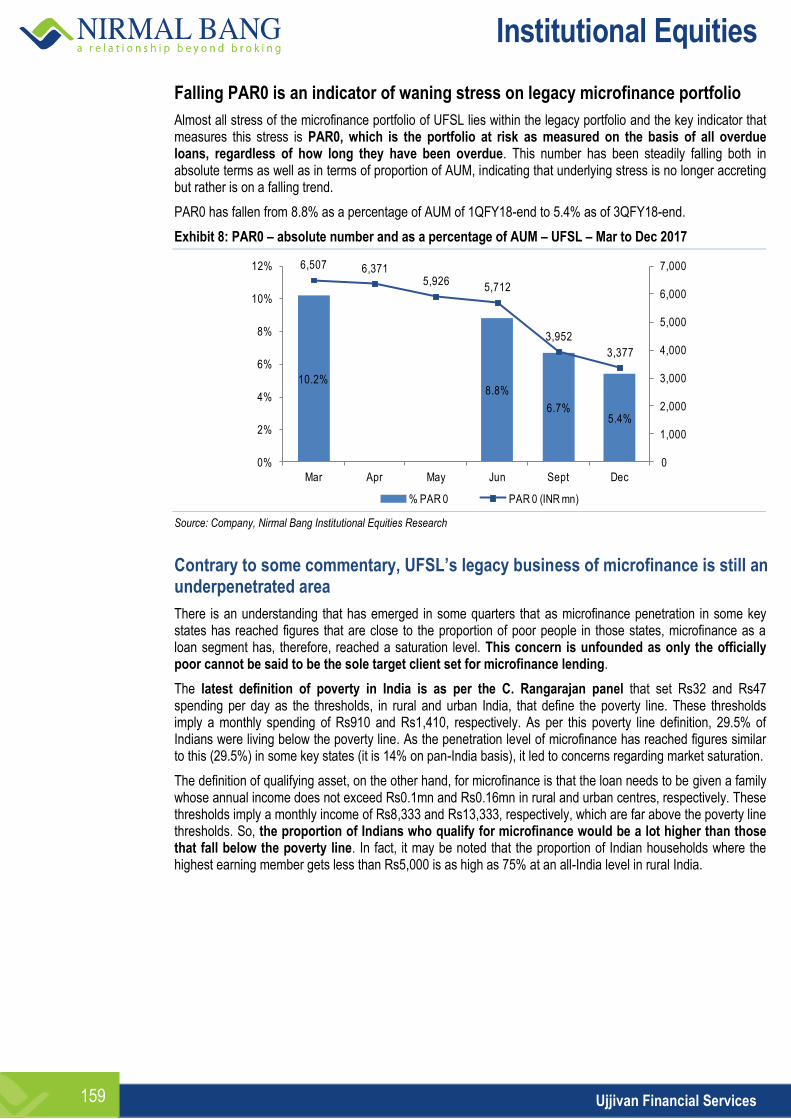
Institutional Equities
Ujjivan Financial Services 159
Falling PAR0 is an indicator of waning stress on legacy microfinance portfolio
Almost all stress of the microfinance portfolio of UFSL lies within the legacy portfolio and the key indicator that measures this stress is PAR0, which is the portfolio at risk as measured on the basis of all overdue loans, regardless of how long they have been overdue. This number has been steadily falling both in absolute terms as well as in terms of proportion of AUM, indicating that underlying stress is no longer accreting but rather is on a falling trend.
PAR0 has fallen from 8.8% as a percentage of AUM of 1QFY18-end to 5.4% as of 3QFY18-end.
Exhibit 8: PAR0 – absolute number and as a percentage of AUM – UFSL – Mar to Dec 2017
Source: Company, Nirmal Bang Institutional Equities Research
Contrary to some commentary, UFSL’s legacy business of microfinance is still an underpenetrated area
There is an understanding that has emerged in some quarters that as microfinance penetration in some key states has reached figures that are close to the proportion of poor people in those states, microfinance as a loan segment has, therefore, reached a saturation level. This concern is unfounded as only the officially poor cannot be said to be the sole target client set for microfinance lending.
The latest definition of poverty in India is as per the C. Rangarajan panel that set Rs32 and Rs47 spending per day as the thresholds, in rural and urban India, that define the poverty line. These thresholds imply a monthly spending of Rs910 and Rs1,410, respectively. As per this poverty line definition, 29.5% of Indians were living below the poverty line. As the penetration level of microfinance has reached figures similar to this (29.5%) in some key states (it is 14% on pan-India basis), it led to concerns regarding market saturation.
The definition of qualifying asset, on the other hand, for microfinance is that the loan needs to be given a family whose annual income does not exceed Rs0.1mn and Rs0.16mn in rural and urban centres, respectively. These thresholds imply a monthly income of Rs8,333 and Rs13,333, respectively, which are far above the poverty line thresholds. So, the proportion of Indians who qualify for microfinance would be a lot higher than those that fall below the poverty line. In fact, it may be noted that the proportion of Indian households where the highest earning member gets less than Rs5,000 is as high as 75% at an all-India level in rural India.
10.2%8.8%
6.7%5.4%
6,507 6,371 5,926
5,712
3,952
3,377
0
1,000
2,000
3,000
4,000
5,000
6,000
7,000
0%
2%
4%
6%
8%
10%
12%
Mar Apr May Jun Sept Dec
% PAR 0 PAR 0 (INR mn)
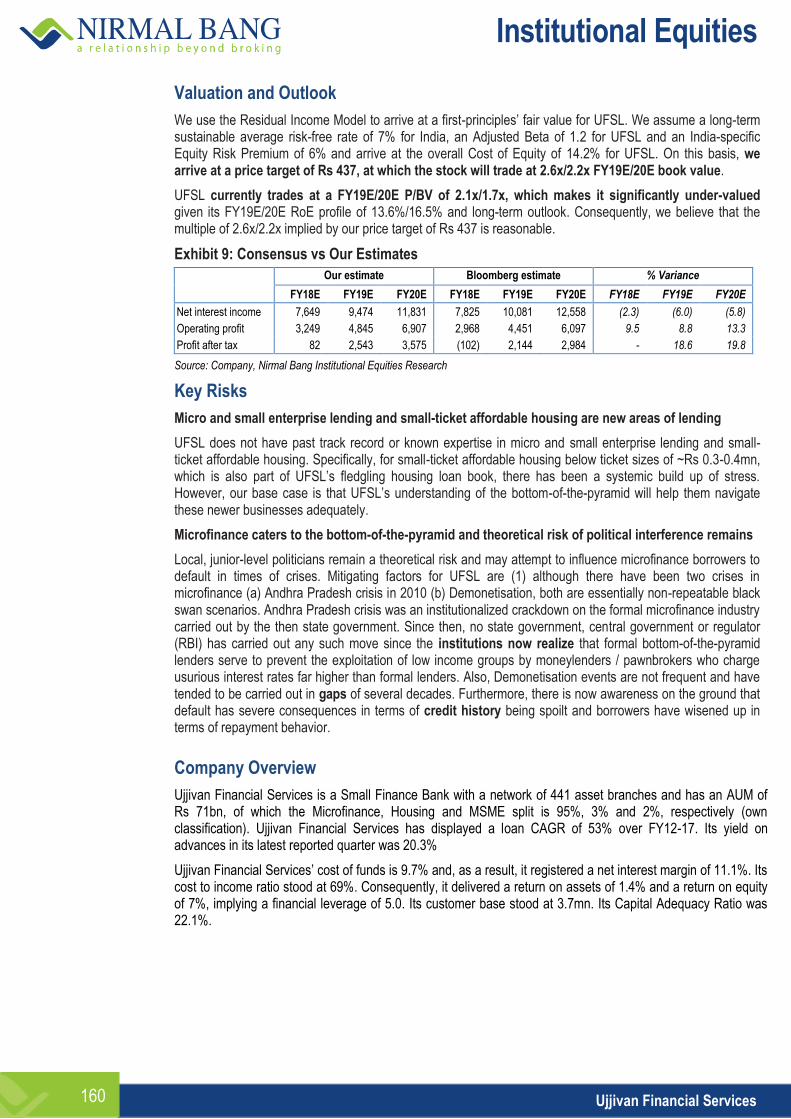
Institutional Equities
Ujjivan Financial Services 160
Valuation and Outlook
We use the Residual Income Model to arrive at a first-principles’ fair value for UFSL. We assume a long-term sustainable average risk-free rate of 7% for India, an Adjusted Beta of 1.2 for UFSL and an India-specific Equity Risk Premium of 6% and arrive at the overall Cost of Equity of 14.2% for UFSL. On this basis, we arrive at a price target of Rs 437, at which the stock will trade at 2.6x/2.2x FY19E/20E book value.
UFSL currently trades at a FY19E/20E P/BV of 2.1x/1.7x, which makes it significantly under-valued given its FY19E/20E RoE profile of 13.6%/16.5% and long-term outlook. Consequently, we believe that the multiple of 2.6x/2.2x implied by our price target of Rs 437 is reasonable.
Exhibit 9: Consensus vs Our Estimates
Our estimate Bloomberg estimate % Variance
FY18E FY19E FY20E FY18E FY19E FY20E FY18E FY19E FY20E
Net interest income 7,649 9,474 11,831 7,825 10,081 12,558 (2.3) (6.0) (5.8)
Operating profit 3,249 4,845 6,907 2,968 4,451 6,097 9.5 8.8 13.3
Profit after tax 82 2,543 3,575 (102) 2,144 2,984 - 18.6 19.8
Source: Company, Nirmal Bang Institutional Equities Research
Key Risks
Micro and small enterprise lending and small-ticket affordable housing are new areas of lending
UFSL does not have past track record or known expertise in micro and small enterprise lending and small-ticket affordable housing. Specifically, for small-ticket affordable housing below ticket sizes of ~Rs 0.3-0.4mn, which is also part of UFSL’s fledgling housing loan book, there has been a systemic build up of stress. However, our base case is that UFSL’s understanding of the bottom-of-the-pyramid will help them navigate these newer businesses adequately.
Microfinance caters to the bottom-of-the-pyramid and theoretical risk of political interference remains
Local, junior-level politicians remain a theoretical risk and may attempt to influence microfinance borrowers to default in times of crises. Mitigating factors for UFSL are (1) although there have been two crises in microfinance (a) Andhra Pradesh crisis in 2010 (b) Demonetisation, both are essentially non-repeatable black swan scenarios. Andhra Pradesh crisis was an institutionalized crackdown on the formal microfinance industry carried out by the then state government. Since then, no state government, central government or regulator (RBI) has carried out any such move since the institutions now realize that formal bottom-of-the-pyramid lenders serve to prevent the exploitation of low income groups by moneylenders / pawnbrokers who charge usurious interest rates far higher than formal lenders. Also, Demonetisation events are not frequent and have tended to be carried out in gaps of several decades. Furthermore, there is now awareness on the ground that default has severe consequences in terms of credit history being spoilt and borrowers have wisened up in terms of repayment behavior.
Company Overview
Ujjivan Financial Services is a Small Finance Bank with a network of 441 asset branches and has an AUM of Rs 71bn, of which the Microfinance, Housing and MSME split is 95%, 3% and 2%, respectively (own classification). Ujjivan Financial Services has displayed a loan CAGR of 53% over FY12-17. Its yield on advances in its latest reported quarter was 20.3%
Ujjivan Financial Services’ cost of funds is 9.7% and, as a result, it registered a net interest margin of 11.1%. Its cost to income ratio stood at 69%. Consequently, it delivered a return on assets of 1.4% and a return on equity of 7%, implying a financial leverage of 5.0. Its customer base stood at 3.7mn. Its Capital Adequacy Ratio was 22.1%.
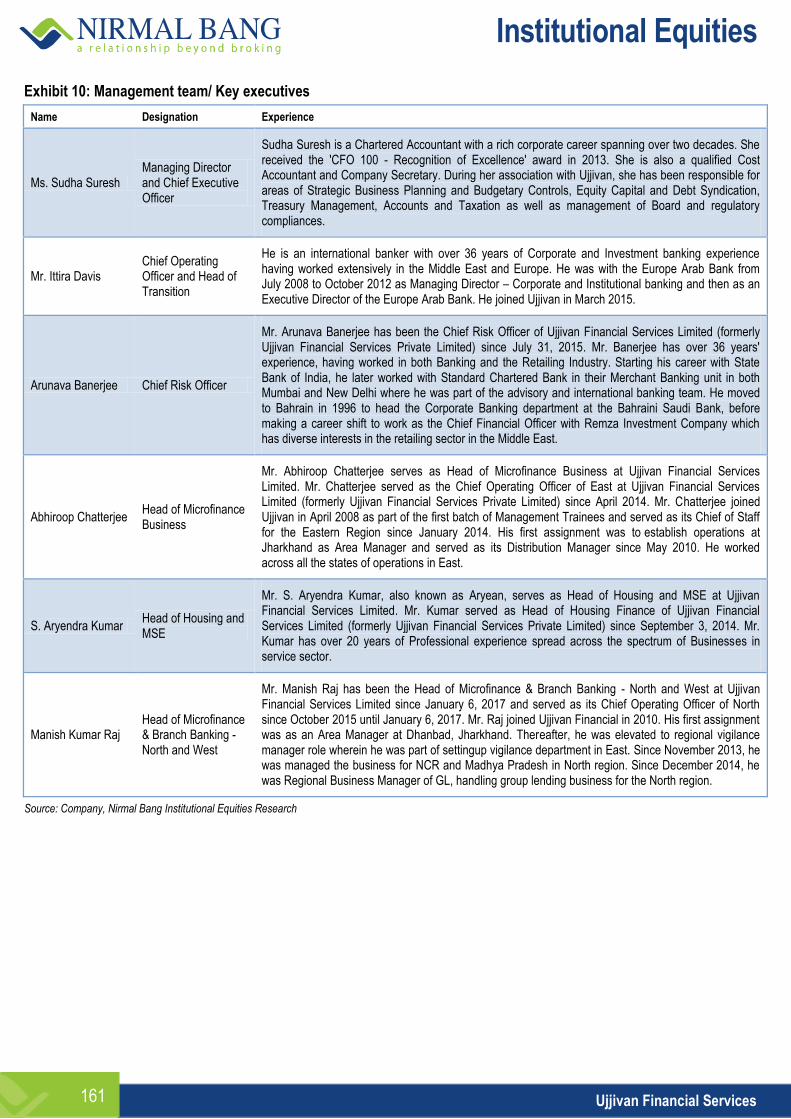
Institutional Equities
Ujjivan Financial Services 161
Exhibit 10: Management team/ Key executives
Name Designation Experience
Ms. Sudha Suresh Managing Director and Chief Executive Officer
Sudha Suresh is a Chartered Accountant with a rich corporate career spanning over two decades. She received the 'CFO 100 - Recognition of Excellence' award in 2013. She is also a qualified Cost Accountant and Company Secretary. During her association with Ujjivan, she has been responsible for areas of Strategic Business Planning and Budgetary Controls, Equity Capital and Debt Syndication, Treasury Management, Accounts and Taxation as well as management of Board and regulatory compliances.
Mr. Ittira Davis Chief Operating Officer and Head of Transition
He is an international banker with over 36 years of Corporate and Investment banking experience having worked extensively in the Middle East and Europe. He was with the Europe Arab Bank from July 2008 to October 2012 as Managing Director – Corporate and Institutional banking and then as an Executive Director of the Europe Arab Bank. He joined Ujjivan in March 2015.
Arunava Banerjee Chief Risk Officer
Mr. Arunava Banerjee has been the Chief Risk Officer of Ujjivan Financial Services Limited (formerly Ujjivan Financial Services Private Limited) since July 31, 2015. Mr. Banerjee has over 36 years' experience, having worked in both Banking and the Retailing Industry. Starting his career with State Bank of India, he later worked with Standard Chartered Bank in their Merchant Banking unit in both Mumbai and New Delhi where he was part of the advisory and international banking team. He moved to Bahrain in 1996 to head the Corporate Banking department at the Bahraini Saudi Bank, before making a career shift to work as the Chief Financial Officer with Remza Investment Company which has diverse interests in the retailing sector in the Middle East.
Abhiroop Chatterjee Head of Microfinance Business
Mr. Abhiroop Chatterjee serves as Head of Microfinance Business at Ujjivan Financial Services Limited. Mr. Chatterjee served as the Chief Operating Officer of East at Ujjivan Financial Services Limited (formerly Ujjivan Financial Services Private Limited) since April 2014. Mr. Chatterjee joined Ujjivan in April 2008 as part of the first batch of Management Trainees and served as its Chief of Staff for the Eastern Region since January 2014. His first assignment was to establish operations at Jharkhand as Area Manager and served as its Distribution Manager since May 2010. He worked across all the states of operations in East.
S. Aryendra Kumar Head of Housing and MSE
Mr. S. Aryendra Kumar, also known as Aryean, serves as Head of Housing and MSE at Ujjivan Financial Services Limited. Mr. Kumar served as Head of Housing Finance of Ujjivan Financial Services Limited (formerly Ujjivan Financial Services Private Limited) since September 3, 2014. Mr. Kumar has over 20 years of Professional experience spread across the spectrum of Businesses in service sector.
Manish Kumar Raj Head of Microfinance & Branch Banking - North and West
Mr. Manish Raj has been the Head of Microfinance & Branch Banking - North and West at Ujjivan Financial Services Limited since January 6, 2017 and served as its Chief Operating Officer of North since October 2015 until January 6, 2017. Mr. Raj joined Ujjivan Financial in 2010. His first assignment was as an Area Manager at Dhanbad, Jharkhand. Thereafter, he was elevated to regional vigilance manager role wherein he was part of settingup vigilance department in East. Since November 2013, he was managed the business for NCR and Madhya Pradesh in North region. Since December 2014, he was Regional Business Manager of GL, handling group lending business for the North region.
Source: Company, Nirmal Bang Institutional Equities Research
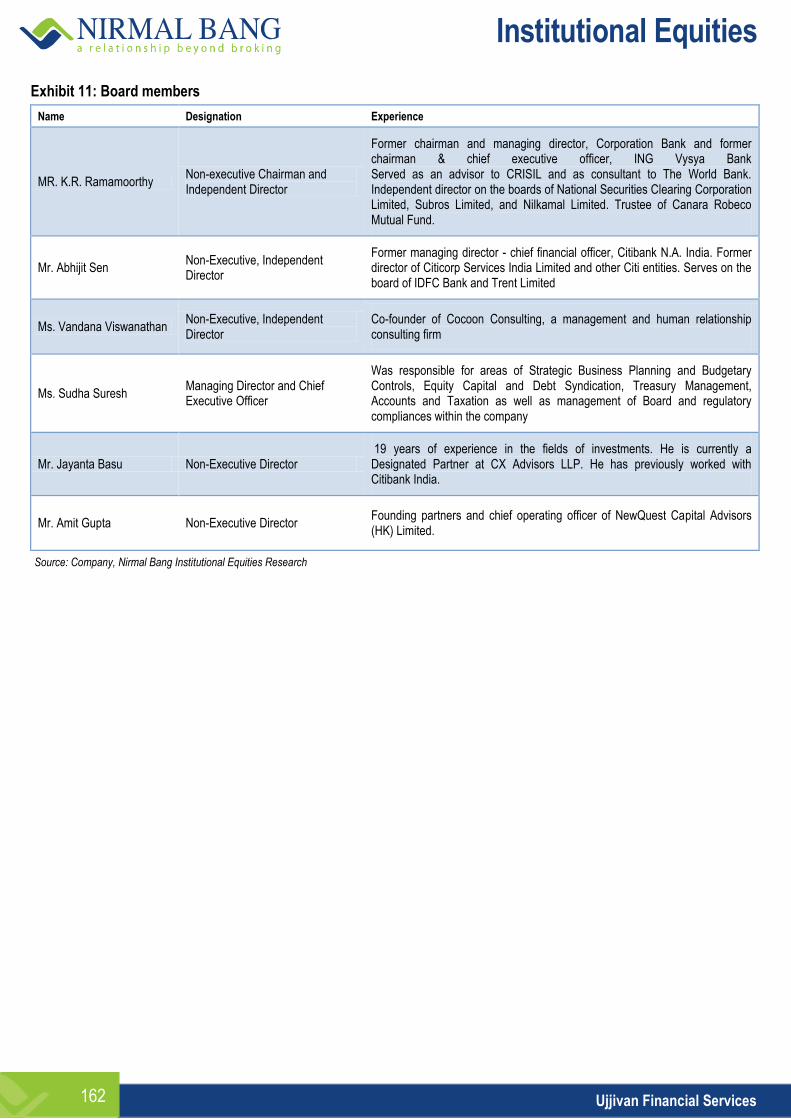
Institutional Equities
Ujjivan Financial Services 162
Exhibit 11: Board members
Name Designation Experience
MR. K.R. Ramamoorthy Non-executive Chairman and Independent Director
Former chairman and managing director, Corporation Bank and former chairman & chief executive officer, ING Vysya Bank Served as an advisor to CRISIL and as consultant to The World Bank. Independent director on the boards of National Securities Clearing Corporation Limited, Subros Limited, and Nilkamal Limited. Trustee of Canara Robeco Mutual Fund.
Mr. Abhijit Sen Non-Executive, Independent Director
Former managing director - chief financial officer, Citibank N.A. India. Former director of Citicorp Services India Limited and other Citi entities. Serves on the board of IDFC Bank and Trent Limited
Ms. Vandana Viswanathan Non-Executive, Independent Director
Co-founder of Cocoon Consulting, a management and human relationship consulting firm
Ms. Sudha Suresh Managing Director and Chief Executive Officer
Was responsible for areas of Strategic Business Planning and Budgetary Controls, Equity Capital and Debt Syndication, Treasury Management, Accounts and Taxation as well as management of Board and regulatory compliances within the company
Mr. Jayanta Basu Non-Executive Director 19 years of experience in the fields of investments. He is currently a Designated Partner at CX Advisors LLP. He has previously worked with Citibank India.
Mr. Amit Gupta Non-Executive Director Founding partners and chief operating officer of NewQuest Capital Advisors (HK) Limited.
Source: Company, Nirmal Bang Institutional Equities Research
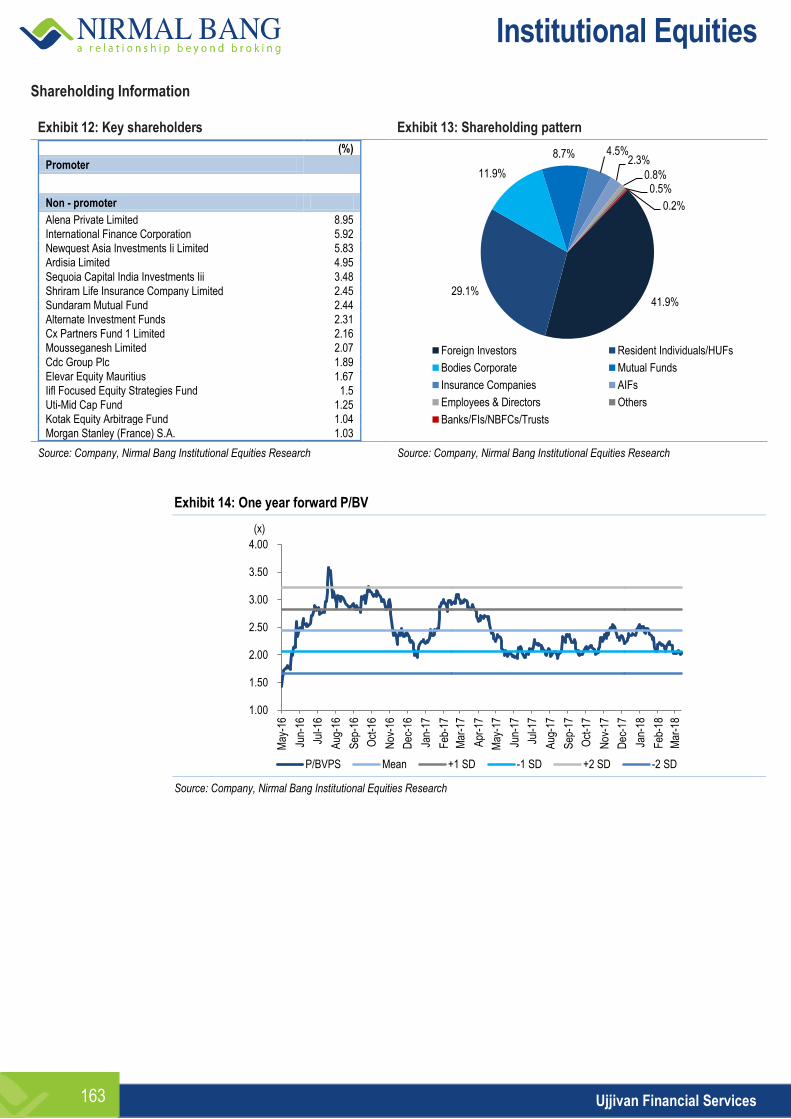
Institutional Equities
Ujjivan Financial Services 163
Shareholding Information
Exhibit 12: Key shareholders Exhibit 13: Shareholding pattern
(%)
Promoter
Non - promoter
Alena Private Limited 8.95
International Finance Corporation 5.92
Newquest Asia Investments Ii Limited 5.83
Ardisia Limited 4.95
Sequoia Capital India Investments Iii 3.48
Shriram Life Insurance Company Limited 2.45
Sundaram Mutual Fund 2.44
Alternate Investment Funds 2.31
Cx Partners Fund 1 Limited 2.16
Mousseganesh Limited 2.07
Cdc Group Plc 1.89
Elevar Equity Mauritius 1.67
Iifl Focused Equity Strategies Fund 1.5
Uti-Mid Cap Fund 1.25
Kotak Equity Arbitrage Fund 1.04
Morgan Stanley (France) S.A. 1.03
Source: Company, Nirmal Bang Institutional Equities Research Source: Company, Nirmal Bang Institutional Equities Research
Exhibit 14: One year forward P/BV
Source: Company, Nirmal Bang Institutional Equities Research
41.9% 29.1%
11.9%
8.7% 4.5% 2.3%
0.8% 0.5%
0.2%
Foreign Investors Resident Individuals/HUFs
Bodies Corporate Mutual Funds
Insurance Companies AIFs
Employees & Directors Others
Banks/FIs/NBFCs/Trusts
1.00
1.50
2.00
2.50
3.00
3.50
4.00
May
-16
Jun-
16
Jul-1
6
Aug
-16
Sep
-16
Oct
-16
Nov
-16
Dec
-16
Jan-
17
Feb
-17
Mar
-17
Apr
-17
May
-17
Jun-
17
Jul-1
7
Aug
-17
Sep
-17
Oct
-17
Nov
-17
Dec
-17
Jan-
18
Feb
-18
Mar
-18
P/BVPS Mean +1 SD -1 SD +2 SD -2 SD
(x)
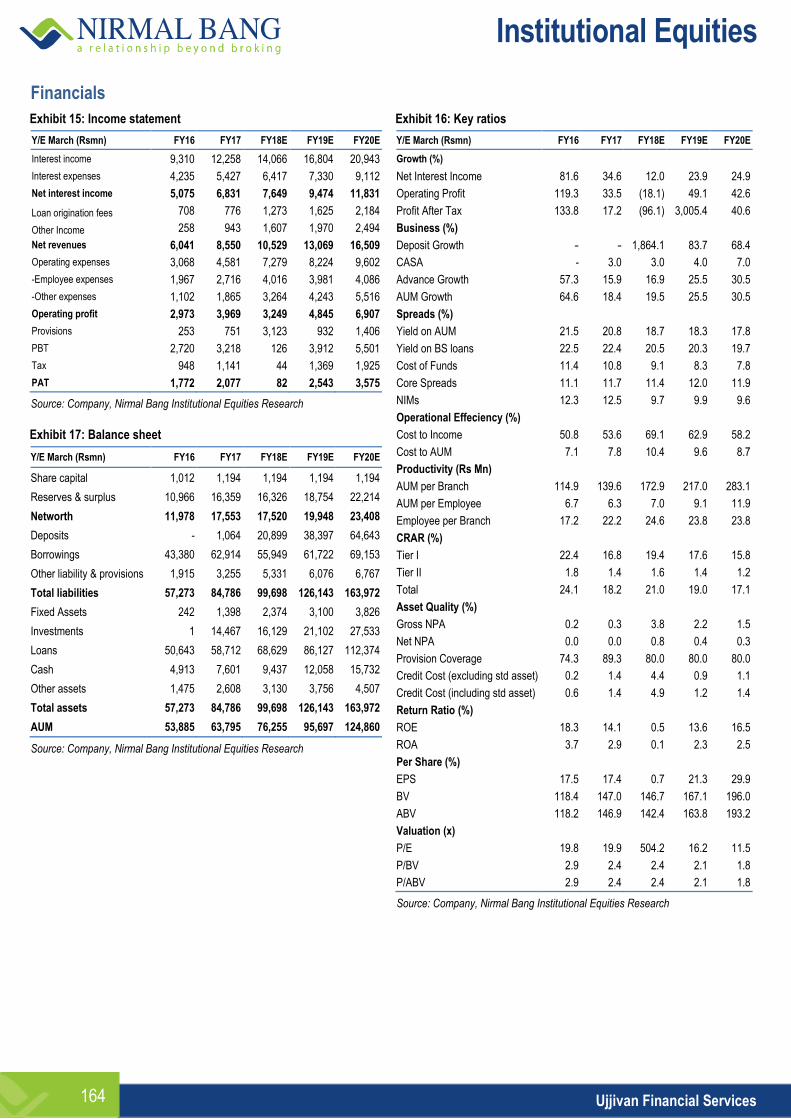
Institutional Equities
Ujjivan Financial Services 164
Financials
Exhibit 15: Income statement
Y/E March (Rsmn) FY16 FY17 FY18E FY19E FY20E
Interest income 9,310 12,258 14,066 16,804 20,943
Interest expenses 4,235 5,427 6,417 7,330 9,112
Net interest income 5,075 6,831 7,649 9,474 11,831
Loan origination fees 708 776 1,273 1,625 2,184
Other Income 258 943 1,607 1,970 2,494
Net revenues 6,041 8,550 10,529 13,069 16,509
Operating expenses 3,068 4,581 7,279 8,224 9,602
-Employee expenses 1,967 2,716 4,016 3,981 4,086
-Other expenses 1,102 1,865 3,264 4,243 5,516
Operating profit 2,973 3,969 3,249 4,845 6,907
Provisions 253 751 3,123 932 1,406
PBT 2,720 3,218 126 3,912 5,501
Tax 948 1,141 44 1,369 1,925
PAT 1,772 2,077 82 2,543 3,575
Source: Company, Nirmal Bang Institutional Equities Research
Exhibit 17: Balance sheet
Y/E March (Rsmn) FY16 FY17 FY18E FY19E FY20E
Share capital 1,012 1,194 1,194 1,194 1,194
Reserves & surplus 10,966 16,359 16,326 18,754 22,214
Networth 11,978 17,553 17,520 19,948 23,408
Deposits - 1,064 20,899 38,397 64,643
Borrowings 43,380 62,914 55,949 61,722 69,153
Other liability & provisions 1,915 3,255 5,331 6,076 6,767
Total liabilities 57,273 84,786 99,698 126,143 163,972
Fixed Assets 242 1,398 2,374 3,100 3,826
Investments 1 14,467 16,129 21,102 27,533
Loans 50,643 58,712 68,629 86,127 112,374
Cash 4,913 7,601 9,437 12,058 15,732
Other assets 1,475 2,608 3,130 3,756 4,507
Total assets 57,273 84,786 99,698 126,143 163,972
AUM 53,885 63,795 76,255 95,697 124,860
Source: Company, Nirmal Bang Institutional Equities Research
Exhibit 16: Key ratios
Y/E March (Rsmn) FY16 FY17 FY18E FY19E FY20E
Growth (%)
Net Interest Income 81.6 34.6 12.0 23.9 24.9
Operating Profit 119.3 33.5 (18.1) 49.1 42.6
Profit After Tax 133.8 17.2 (96.1) 3,005.4 40.6
Business (%)
Deposit Growth - - 1,864.1 83.7 68.4
CASA - 3.0 3.0 4.0 7.0
Advance Growth 57.3 15.9 16.9 25.5 30.5
AUM Growth 64.6 18.4 19.5 25.5 30.5
Spreads (%)
Yield on AUM 21.5 20.8 18.7 18.3 17.8
Yield on BS loans 22.5 22.4 20.5 20.3 19.7
Cost of Funds 11.4 10.8 9.1 8.3 7.8
Core Spreads 11.1 11.7 11.4 12.0 11.9
NIMs 12.3 12.5 9.7 9.9 9.6
Operational Effeciency (%)
Cost to Income 50.8 53.6 69.1 62.9 58.2
Cost to AUM 7.1 7.8 10.4 9.6 8.7
Productivity (Rs Mn)
AUM per Branch 114.9 139.6 172.9 217.0 283.1
AUM per Employee 6.7 6.3 7.0 9.1 11.9
Employee per Branch 17.2 22.2 24.6 23.8 23.8
CRAR (%)
Tier I 22.4 16.8 19.4 17.6 15.8
Tier II 1.8 1.4 1.6 1.4 1.2
Total 24.1 18.2 21.0 19.0 17.1
Asset Quality (%)
Gross NPA 0.2 0.3 3.8 2.2 1.5
Net NPA 0.0 0.0 0.8 0.4 0.3
Provision Coverage 74.3 89.3 80.0 80.0 80.0
Credit Cost (excluding std asset) 0.2 1.4 4.4 0.9 1.1
Credit Cost (including std asset) 0.6 1.4 4.9 1.2 1.4
Return Ratio (%)
ROE 18.3 14.1 0.5 13.6 16.5
ROA 3.7 2.9 0.1 2.3 2.5
Per Share (%)
EPS 17.5 17.4 0.7 21.3 29.9
BV 118.4 147.0 146.7 167.1 196.0
ABV 118.2 146.9 142.4 163.8 193.2
Valuation (x)
P/E 19.8 19.9 504.2 16.2 11.5
P/BV 2.9 2.4 2.4 2.1 1.8
P/ABV 2.9 2.4 2.4 2.1 1.8
Source: Company, Nirmal Bang Institutional Equities Research
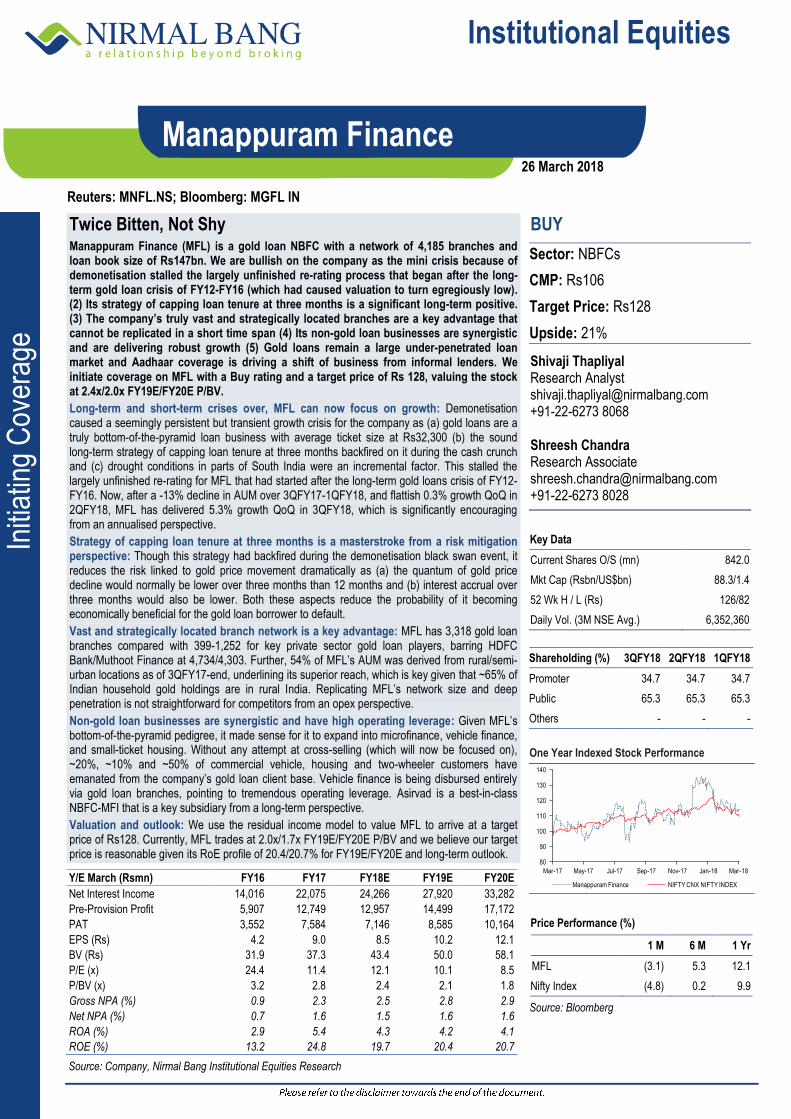
Institutional Equities
Initi
atin
g C
over
age
Reuters: MNFL.NS; Bloomberg: MGFL IN
Manappuram Finance
Twice Bitten, Not Shy Manappuram Finance (MFL) is a gold loan NBFC with a network of 4,185 branches and loan book size of Rs147bn. We are bullish on the company as the mini crisis because of demonetisation stalled the largely unfinished re-rating process that began after the long-term gold loan crisis of FY12-FY16 (which had caused valuation to turn egregiously low). (2) Its strategy of capping loan tenure at three months is a significant long-term positive. (3) The company’s truly vast and strategically located branches are a key advantage that cannot be replicated in a short time span (4) Its non-gold loan businesses are synergistic and are delivering robust growth (5) Gold loans remain a large under-penetrated loan market and Aadhaar coverage is driving a shift of business from informal lenders. We initiate coverage on MFL with a Buy rating and a target price of Rs 128, valuing the stock at 2.4x/2.0x FY19E/FY20E P/BV.
Long-term and short-term crises over, MFL can now focus on growth: Demonetisation caused a seemingly persistent but transient growth crisis for the company as (a) gold loans are a truly bottom-of-the-pyramid loan business with average ticket size at Rs32,300 (b) the sound long-term strategy of capping loan tenure at three months backfired on it during the cash crunch and (c) drought conditions in parts of South India were an incremental factor. This stalled the largely unfinished re-rating for MFL that had started after the long-term gold loans crisis of FY12-FY16. Now, after a -13% decline in AUM over 3QFY17-1QFY18, and flattish 0.3% growth QoQ in 2QFY18, MFL has delivered 5.3% growth QoQ in 3QFY18, which is significantly encouraging from an annualised perspective.
Strategy of capping loan tenure at three months is a masterstroke from a risk mitigation perspective: Though this strategy had backfired during the demonetisation black swan event, it reduces the risk linked to gold price movement dramatically as (a) the quantum of gold price decline would normally be lower over three months than 12 months and (b) interest accrual over three months would also be lower. Both these aspects reduce the probability of it becoming economically beneficial for the gold loan borrower to default.
Vast and strategically located branch network is a key advantage: MFL has 3,318 gold loan branches compared with 399-1,252 for key private sector gold loan players, barring HDFC Bank/Muthoot Finance at 4,734/4,303. Further, 54% of MFL’s AUM was derived from rural/semi-urban locations as of 3QFY17-end, underlining its superior reach, which is key given that ~65% of Indian household gold holdings are in rural India. Replicating MFL’s network size and deep penetration is not straightforward for competitors from an opex perspective.
Non-gold loan businesses are synergistic and have high operating leverage: Given MFL’s bottom-of-the-pyramid pedigree, it made sense for it to expand into microfinance, vehicle finance, and small-ticket housing. Without any attempt at cross-selling (which will now be focused on), ~20%, ~10% and ~50% of commercial vehicle, housing and two-wheeler customers have emanated from the company’s gold loan client base. Vehicle finance is being disbursed entirely via gold loan branches, pointing to tremendous operating leverage. Asirvad is a best-in-class NBFC-MFI that is a key subsidiary from a long-term perspective.
Valuation and outlook: We use the residual income model to value MFL to arrive at a target price of Rs128. Currently, MFL trades at 2.0x/1.7x FY19E/FY20E P/BV and we believe our target price is reasonable given its RoE profile of 20.4/20.7% for FY19E/FY20E and long-term outlook.
BUY
Sector: NBFCs
CMP: Rs106
Target Price: Rs128
Upside: 21%
Shivaji Thapliyal Research Analyst [email protected] +91-22-6273 8068 Shreesh Chandra Research Associate [email protected] +91-22-6273 8028
Key Data
Current Shares O/S (mn) 842.0
Mkt Cap (Rsbn/US$bn) 88.3/1.4
52 Wk H / L (Rs) 126/82
Daily Vol. (3M NSE Avg.) 6,352,360
Shareholding (%) 3QFY18 2QFY18 1QFY18
Promoter 34.7 34.7 34.7
Public 65.3 65.3 65.3
Others - - -
One Year Indexed Stock Performance
Price Performance (%)
1 M 6 M 1 Yr
MFL (3.1) 5.3 12.1
Nifty Index (4.8) 0.2 9.9
Source: Bloomberg
Y/E March (Rsmn) FY16 FY17 FY18E FY19E FY20E
Net Interest Income 14,016 22,075 24,266 27,920 33,282
Pre-Provision Profit 5,907 12,749 12,957 14,499 17,172
PAT 3,552 7,584 7,146 8,585 10,164
EPS (Rs) 4.2 9.0 8.5 10.2 12.1
BV (Rs) 31.9 37.3 43.4 50.0 58.1
P/E (x) 24.4 11.4 12.1 10.1 8.5
P/BV (x) 3.2 2.8 2.4 2.1 1.8
Gross NPA (%) 0.9 2.3 2.5 2.8 2.9
Net NPA (%) 0.7 1.6 1.5 1.6 1.6
ROA (%) 2.9 5.4 4.3 4.2 4.1
ROE (%) 13.2 24.8 19.7 20.4 20.7
Source: Company, Nirmal Bang Institutional Equities Research
80
90
100
110
120
130
140
Mar-17 May-17 Jul-17 Sep-17 Nov-17 Jan-18 Mar-18
Manappuram Finance NIFTY CNX NIFTY INDEX
26 March 2018
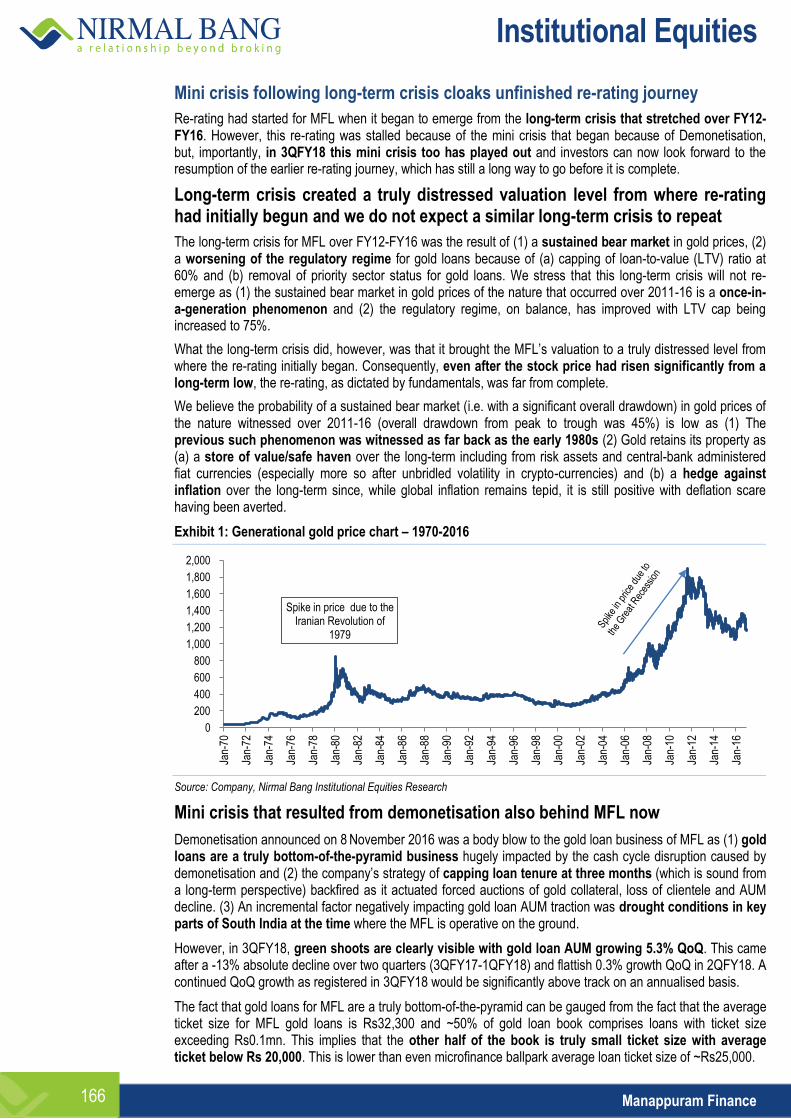
Institutional Equities
Manappuram Finance 166
Mini crisis following long-term crisis cloaks unfinished re-rating journey
Re-rating had started for MFL when it began to emerge from the long-term crisis that stretched over FY12-FY16. However, this re-rating was stalled because of the mini crisis that began because of Demonetisation, but, importantly, in 3QFY18 this mini crisis too has played out and investors can now look forward to the resumption of the earlier re-rating journey, which has still a long way to go before it is complete.
Long-term crisis created a truly distressed valuation level from where re-rating had initially begun and we do not expect a similar long-term crisis to repeat
The long-term crisis for MFL over FY12-FY16 was the result of (1) a sustained bear market in gold prices, (2) a worsening of the regulatory regime for gold loans because of (a) capping of loan-to-value (LTV) ratio at 60% and (b) removal of priority sector status for gold loans. We stress that this long-term crisis will not re-emerge as (1) the sustained bear market in gold prices of the nature that occurred over 2011-16 is a once-in-a-generation phenomenon and (2) the regulatory regime, on balance, has improved with LTV cap being increased to 75%.
What the long-term crisis did, however, was that it brought the MFL’s valuation to a truly distressed level from where the re-rating initially began. Consequently, even after the stock price had risen significantly from a long-term low, the re-rating, as dictated by fundamentals, was far from complete.
We believe the probability of a sustained bear market (i.e. with a significant overall drawdown) in gold prices of the nature witnessed over 2011-16 (overall drawdown from peak to trough was 45%) is low as (1) The previous such phenomenon was witnessed as far back as the early 1980s (2) Gold retains its property as (a) a store of value/safe haven over the long-term including from risk assets and central-bank administered fiat currencies (especially more so after unbridled volatility in crypto-currencies) and (b) a hedge against inflation over the long-term since, while global inflation remains tepid, it is still positive with deflation scare having been averted.
Exhibit 1: Generational gold price chart – 1970-2016
Source: Company, Nirmal Bang Institutional Equities Research
Mini crisis that resulted from demonetisation also behind MFL now
Demonetisation announced on 8 November 2016 was a body blow to the gold loan business of MFL as (1) gold loans are a truly bottom-of-the-pyramid business hugely impacted by the cash cycle disruption caused by demonetisation and (2) the company’s strategy of capping loan tenure at three months (which is sound from a long-term perspective) backfired as it actuated forced auctions of gold collateral, loss of clientele and AUM decline. (3) An incremental factor negatively impacting gold loan AUM traction was drought conditions in key parts of South India at the time where the MFL is operative on the ground.
However, in 3QFY18, green shoots are clearly visible with gold loan AUM growing 5.3% QoQ. This came after a -13% absolute decline over two quarters (3QFY17-1QFY18) and flattish 0.3% growth QoQ in 2QFY18. A continued QoQ growth as registered in 3QFY18 would be significantly above track on an annualised basis.
The fact that gold loans for MFL are a truly bottom-of-the-pyramid can be gauged from the fact that the average ticket size for MFL gold loans is Rs32,300 and ~50% of gold loan book comprises loans with ticket size exceeding Rs0.1mn. This implies that the other half of the book is truly small ticket size with average ticket below Rs 20,000. This is lower than even microfinance ballpark average loan ticket size of ~Rs25,000.
Spike in price due to the Iranian Revolution of
1979
0
200
400
600
800
1,000
1,200
1,400
1,600
1,800
2,000
Jan-
70
Jan-
72
Jan-
74
Jan-
76
Jan-
78
Jan-
80
Jan-
82
Jan-
84
Jan-
86
Jan-
88
Jan-
90
Jan-
92
Jan-
94
Jan-
96
Jan-
98
Jan-
00
Jan-
02
Jan-
04
Jan-
06
Jan-
08
Jan-
10
Jan-
12
Jan-
14
Jan-
16
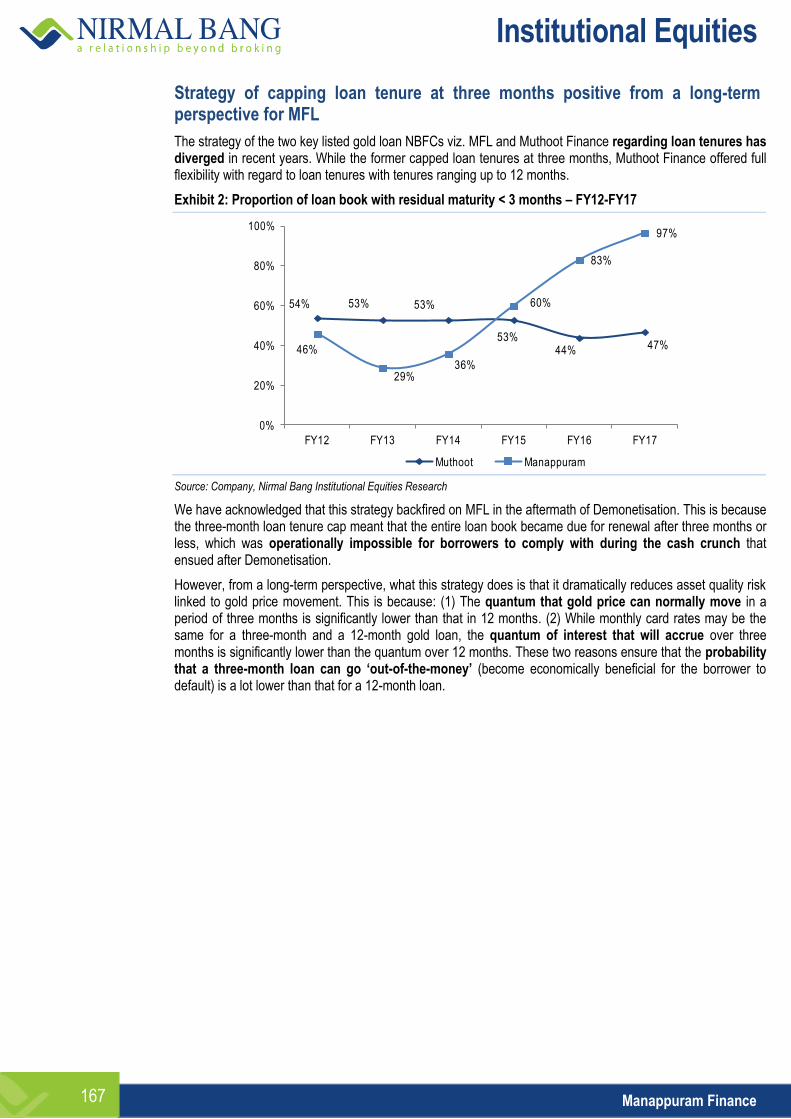
Institutional Equities
Manappuram Finance 167
Strategy of capping loan tenure at three months positive from a long-term perspective for MFL
The strategy of the two key listed gold loan NBFCs viz. MFL and Muthoot Finance regarding loan tenures has diverged in recent years. While the former capped loan tenures at three months, Muthoot Finance offered full flexibility with regard to loan tenures with tenures ranging up to 12 months.
Exhibit 2: Proportion of loan book with residual maturity < 3 months – FY12-FY17
Source: Company, Nirmal Bang Institutional Equities Research
We have acknowledged that this strategy backfired on MFL in the aftermath of Demonetisation. This is because the three-month loan tenure cap meant that the entire loan book became due for renewal after three months or less, which was operationally impossible for borrowers to comply with during the cash crunch that ensued after Demonetisation.
However, from a long-term perspective, what this strategy does is that it dramatically reduces asset quality risk linked to gold price movement. This is because: (1) The quantum that gold price can normally move in a period of three months is significantly lower than that in 12 months. (2) While monthly card rates may be the same for a three-month and a 12-month gold loan, the quantum of interest that will accrue over three months is significantly lower than the quantum over 12 months. These two reasons ensure that the probability that a three-month loan can go ‘out-of-the-money’ (become economically beneficial for the borrower to default) is a lot lower than that for a 12-month loan.
54% 53% 53%
53%44% 47%46%
29%36%
60%
83%
97%
0%
20%
40%
60%
80%
100%
FY12 FY13 FY14 FY15 FY16 FY17
Muthoot Manappuram
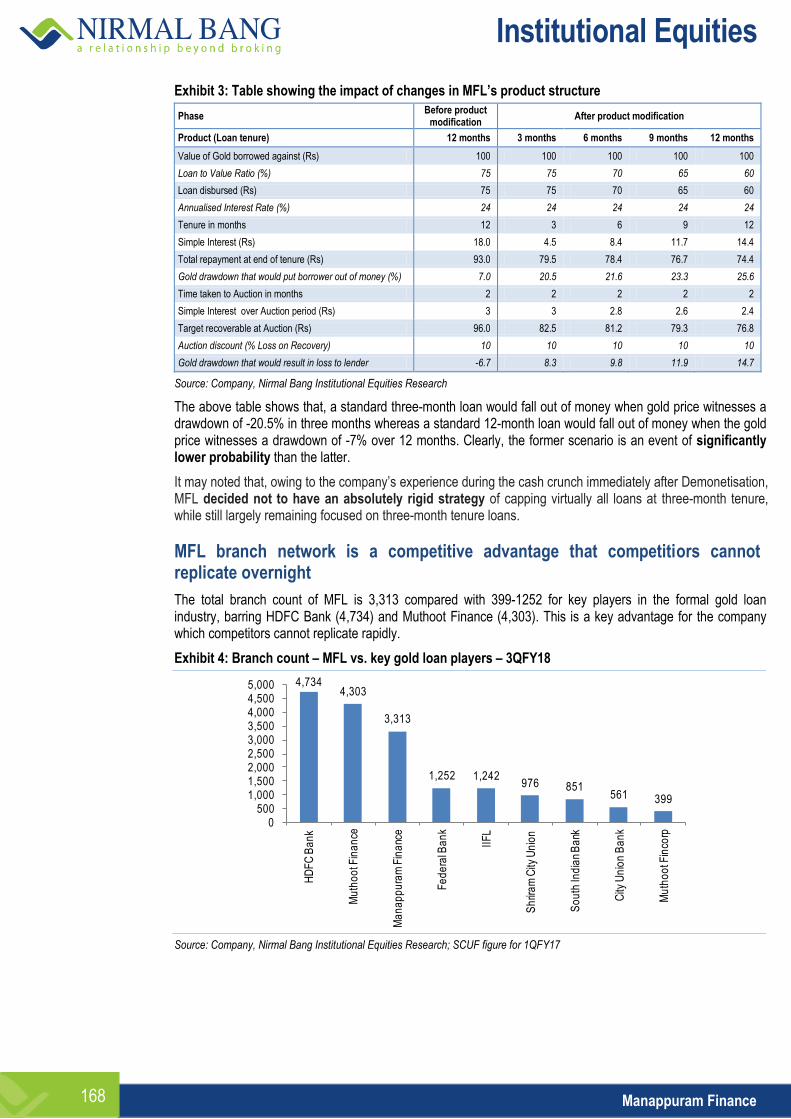
Institutional Equities
Manappuram Finance 168
Exhibit 3: Table showing the impact of changes in MFL’s product structure
Phase Before product
modification After product modification
Product (Loan tenure) 12 months 3 months 6 months 9 months 12 months
Value of Gold borrowed against (Rs) 100 100 100 100 100
Loan to Value Ratio (%) 75 75 70 65 60
Loan disbursed (Rs) 75 75 70 65 60
Annualised Interest Rate (%) 24 24 24 24 24
Tenure in months 12 3 6 9 12
Simple Interest (Rs) 18.0 4.5 8.4 11.7 14.4
Total repayment at end of tenure (Rs) 93.0 79.5 78.4 76.7 74.4
Gold drawdown that would put borrower out of money (%) 7.0 20.5 21.6 23.3 25.6
Time taken to Auction in months 2 2 2 2 2
Simple Interest over Auction period (Rs) 3 3 2.8 2.6 2.4
Target recoverable at Auction (Rs) 96.0 82.5 81.2 79.3 76.8
Auction discount (% Loss on Recovery) 10 10 10 10 10
Gold drawdown that would result in loss to lender -6.7 8.3 9.8 11.9 14.7
Source: Company, Nirmal Bang Institutional Equities Research
The above table shows that, a standard three-month loan would fall out of money when gold price witnesses a drawdown of -20.5% in three months whereas a standard 12-month loan would fall out of money when the gold price witnesses a drawdown of -7% over 12 months. Clearly, the former scenario is an event of significantly lower probability than the latter.
It may noted that, owing to the company’s experience during the cash crunch immediately after Demonetisation, MFL decided not to have an absolutely rigid strategy of capping virtually all loans at three-month tenure, while still largely remaining focused on three-month tenure loans.
MFL branch network is a competitive advantage that competitiors cannot replicate overnight
The total branch count of MFL is 3,313 compared with 399-1252 for key players in the formal gold loan industry, barring HDFC Bank (4,734) and Muthoot Finance (4,303). This is a key advantage for the company which competitors cannot replicate rapidly.
Exhibit 4: Branch count – MFL vs. key gold loan players – 3QFY18
Source: Company, Nirmal Bang Institutional Equities Research; SCUF figure for 1QFY17
4,734 4,303
3,313
1,252 1,242 976 851
561 399
0 500
1,000 1,500 2,000 2,500 3,000 3,500 4,000 4,500 5,000
HD
FC
Ba
nk
Mu
tho
ot F
ina
nce
Ma
na
pp
ura
m F
ina
nce
Fe
de
ral B
an
k
IIF
L
Sh
rira
m C
ity U
nio
n
So
uth
Ind
ian
Ba
nk
City
Un
ion
Ba
nk
Mu
tho
ot F
inco
rp
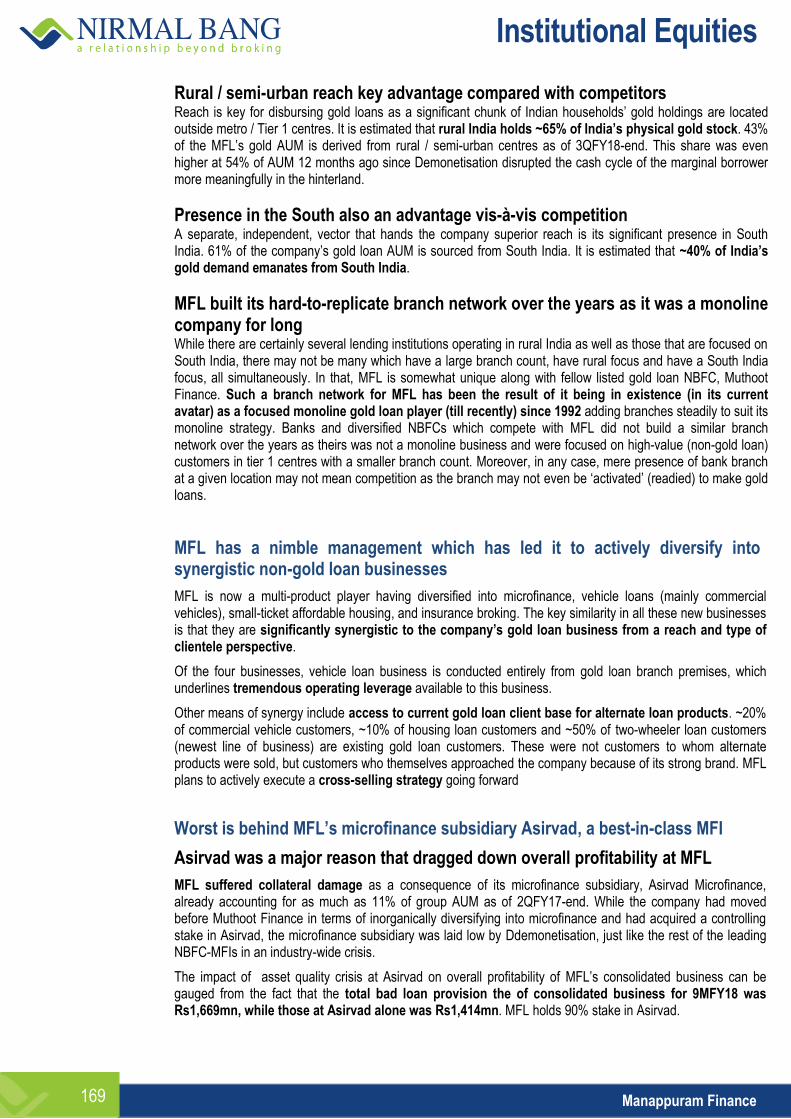
Institutional Equities
Manappuram Finance 169
Rural / semi-urban reach key advantage compared with competitors Reach is key for disbursing gold loans as a significant chunk of Indian households’ gold holdings are located outside metro / Tier 1 centres. It is estimated that rural India holds ~65% of India’s physical gold stock. 43% of the MFL’s gold AUM is derived from rural / semi-urban centres as of 3QFY18-end. This share was even higher at 54% of AUM 12 months ago since Demonetisation disrupted the cash cycle of the marginal borrower more meaningfully in the hinterland.
Presence in the South also an advantage vis-à-vis competition A separate, independent, vector that hands the company superior reach is its significant presence in South India. 61% of the company’s gold loan AUM is sourced from South India. It is estimated that ~40% of India’s gold demand emanates from South India.
MFL built its hard-to-replicate branch network over the years as it was a monoline company for long While there are certainly several lending institutions operating in rural India as well as those that are focused on South India, there may not be many which have a large branch count, have rural focus and have a South India focus, all simultaneously. In that, MFL is somewhat unique along with fellow listed gold loan NBFC, Muthoot Finance. Such a branch network for MFL has been the result of it being in existence (in its current avatar) as a focused monoline gold loan player (till recently) since 1992 adding branches steadily to suit its monoline strategy. Banks and diversified NBFCs which compete with MFL did not build a similar branch network over the years as theirs was not a monoline business and were focused on high-value (non-gold loan) customers in tier 1 centres with a smaller branch count. Moreover, in any case, mere presence of bank branch at a given location may not mean competition as the branch may not even be ‘activated’ (readied) to make gold loans.
MFL has a nimble management which has led it to actively diversify into synergistic non-gold loan businesses
MFL is now a multi-product player having diversified into microfinance, vehicle loans (mainly commercial vehicles), small-ticket affordable housing, and insurance broking. The key similarity in all these new businesses is that they are significantly synergistic to the company’s gold loan business from a reach and type of clientele perspective.
Of the four businesses, vehicle loan business is conducted entirely from gold loan branch premises, which underlines tremendous operating leverage available to this business.
Other means of synergy include access to current gold loan client base for alternate loan products. ~20% of commercial vehicle customers, ~10% of housing loan customers and ~50% of two-wheeler loan customers (newest line of business) are existing gold loan customers. These were not customers to whom alternate products were sold, but customers who themselves approached the company because of its strong brand. MFL plans to actively execute a cross-selling strategy going forward
Worst is behind MFL’s microfinance subsidiary Asirvad, a best-in-class MFI
Asirvad was a major reason that dragged down overall profitability at MFL
MFL suffered collateral damage as a consequence of its microfinance subsidiary, Asirvad Microfinance, already accounting for as much as 11% of group AUM as of 2QFY17-end. While the company had moved before Muthoot Finance in terms of inorganically diversifying into microfinance and had acquired a controlling stake in Asirvad, the microfinance subsidiary was laid low by Ddemonetisation, just like the rest of the leading NBFC-MFIs in an industry-wide crisis.
The impact of asset quality crisis at Asirvad on overall profitability of MFL’s consolidated business can be gauged from the fact that the total bad loan provision the of consolidated business for 9MFY18 was Rs1,669mn, while those at Asirvad alone was Rs1,414mn. MFL holds 90% stake in Asirvad.
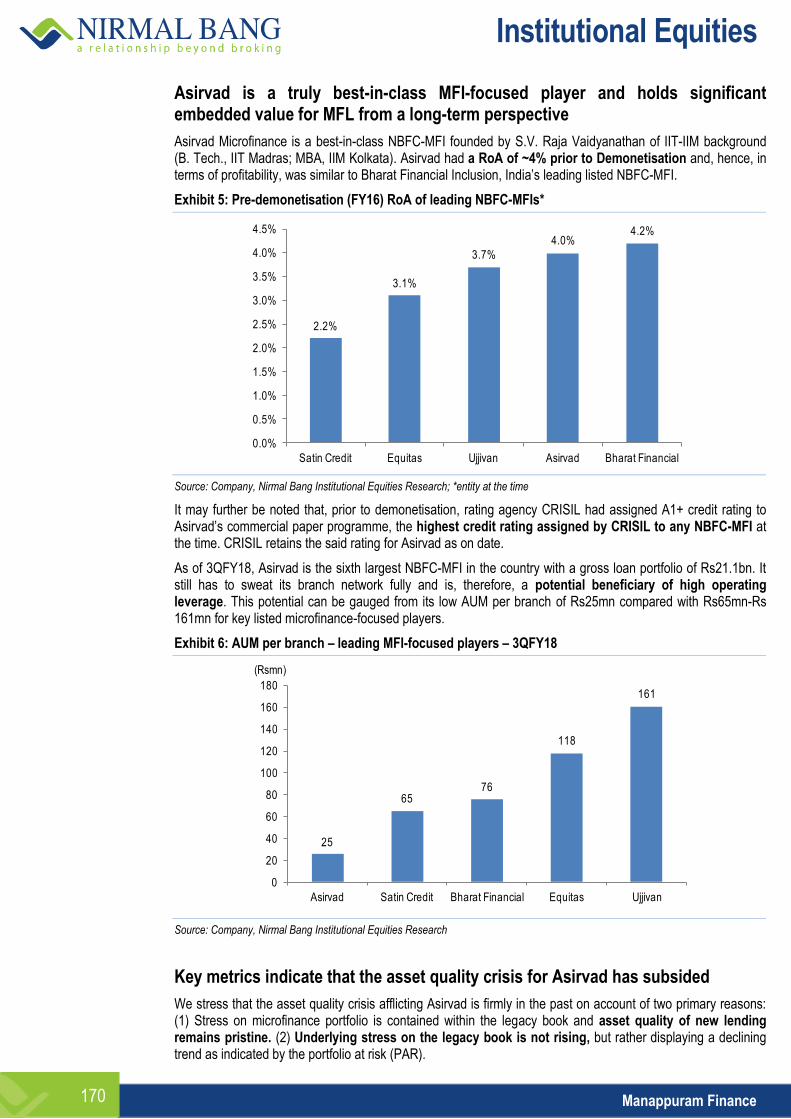
Institutional Equities
Manappuram Finance 170
Asirvad is a truly best-in-class MFI-focused player and holds significant embedded value for MFL from a long-term perspective
Asirvad Microfinance is a best-in-class NBFC-MFI founded by S.V. Raja Vaidyanathan of IIT-IIM background (B. Tech., IIT Madras; MBA, IIM Kolkata). Asirvad had a RoA of ~4% prior to Demonetisation and, hence, in terms of profitability, was similar to Bharat Financial Inclusion, India’s leading listed NBFC-MFI.
Exhibit 5: Pre-demonetisation (FY16) RoA of leading NBFC-MFIs*
Source: Company, Nirmal Bang Institutional Equities Research; *entity at the time
It may further be noted that, prior to demonetisation, rating agency CRISIL had assigned A1+ credit rating to Asirvad’s commercial paper programme, the highest credit rating assigned by CRISIL to any NBFC-MFI at the time. CRISIL retains the said rating for Asirvad as on date.
As of 3QFY18, Asirvad is the sixth largest NBFC-MFI in the country with a gross loan portfolio of Rs21.1bn. It still has to sweat its branch network fully and is, therefore, a potential beneficiary of high operating leverage. This potential can be gauged from its low AUM per branch of Rs25mn compared with Rs65mn-Rs 161mn for key listed microfinance-focused players.
Exhibit 6: AUM per branch – leading MFI-focused players – 3QFY18
Source: Company, Nirmal Bang Institutional Equities Research
Key metrics indicate that the asset quality crisis for Asirvad has subsided
We stress that the asset quality crisis afflicting Asirvad is firmly in the past on account of two primary reasons: (1) Stress on microfinance portfolio is contained within the legacy book and asset quality of new lending remains pristine. (2) Underlying stress on the legacy book is not rising, but rather displaying a declining trend as indicated by the portfolio at risk (PAR).
2.2%
3.1%
3.7%
4.0%4.2%
0.0%
0.5%
1.0%
1.5%
2.0%
2.5%
3.0%
3.5%
4.0%
4.5%
Satin Credit Equitas Ujjivan Asirvad Bharat Financial
25
6576
118
161
0
20
40
60
80
100
120
140
160
180
Asirvad Satin Credit Bharat Financial Equitas Ujjivan
(Rsmn)
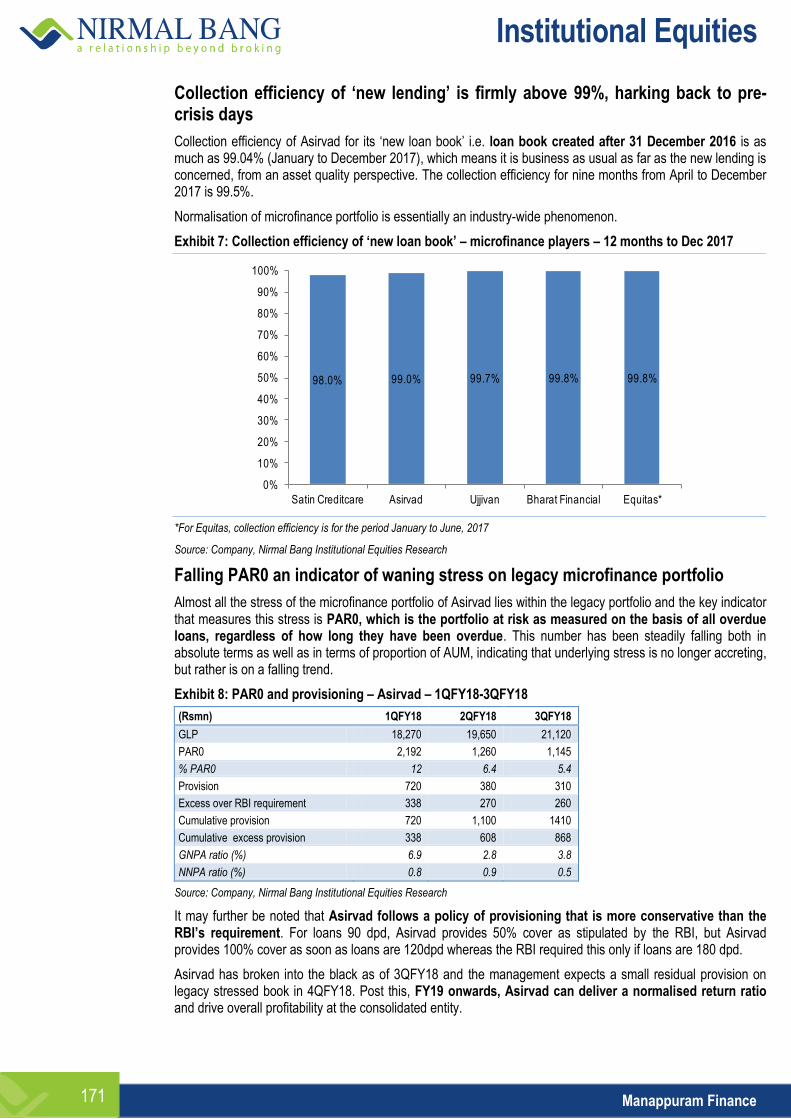
Institutional Equities
Manappuram Finance 171
Collection efficiency of ‘new lending’ is firmly above 99%, harking back to pre-crisis days
Collection efficiency of Asirvad for its ‘new loan book’ i.e. loan book created after 31 December 2016 is as much as 99.04% (January to December 2017), which means it is business as usual as far as the new lending is concerned, from an asset quality perspective. The collection efficiency for nine months from April to December 2017 is 99.5%.
Normalisation of microfinance portfolio is essentially an industry-wide phenomenon.
Exhibit 7: Collection efficiency of ‘new loan book’ – microfinance players – 12 months to Dec 2017
*For Equitas, collection efficiency is for the period January to June, 2017
Source: Company, Nirmal Bang Institutional Equities Research
Falling PAR0 an indicator of waning stress on legacy microfinance portfolio
Almost all the stress of the microfinance portfolio of Asirvad lies within the legacy portfolio and the key indicator that measures this stress is PAR0, which is the portfolio at risk as measured on the basis of all overdue loans, regardless of how long they have been overdue. This number has been steadily falling both in absolute terms as well as in terms of proportion of AUM, indicating that underlying stress is no longer accreting, but rather is on a falling trend.
Exhibit 8: PAR0 and provisioning – Asirvad – 1QFY18-3QFY18
(Rsmn) 1QFY18 2QFY18 3QFY18
GLP 18,270 19,650 21,120
PAR0 2,192 1,260 1,145
% PAR0 12 6.4 5.4
Provision 720 380 310
Excess over RBI requirement 338 270 260
Cumulative provision 720 1,100 1410
Cumulative excess provision 338 608 868
GNPA ratio (%) 6.9 2.8 3.8
NNPA ratio (%) 0.8 0.9 0.5
Source: Company, Nirmal Bang Institutional Equities Research
It may further be noted that Asirvad follows a policy of provisioning that is more conservative than the RBI’s requirement. For loans 90 dpd, Asirvad provides 50% cover as stipulated by the RBI, but Asirvad provides 100% cover as soon as loans are 120dpd whereas the RBI required this only if loans are 180 dpd.
Asirvad has broken into the black as of 3QFY18 and the management expects a small residual provision on legacy stressed book in 4QFY18. Post this, FY19 onwards, Asirvad can deliver a normalised return ratio and drive overall profitability at the consolidated entity.
98.0% 99.0% 99.7% 99.8% 99.8%
0%
10%
20%
30%
40%
50%
60%
70%
80%
90%
100%
Satin Creditcare Asirvad Ujjivan Bharat Financial Equitas*
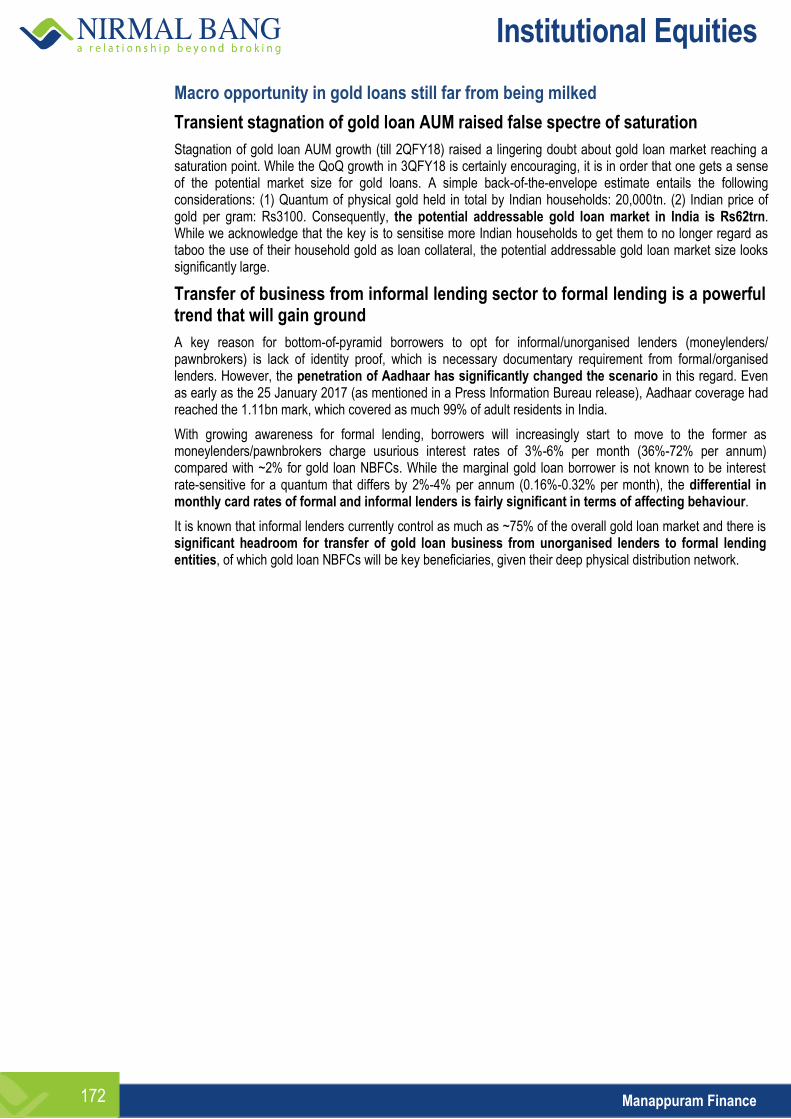
Institutional Equities
Manappuram Finance 172
Macro opportunity in gold loans still far from being milked
Transient stagnation of gold loan AUM raised false spectre of saturation
Stagnation of gold loan AUM growth (till 2QFY18) raised a lingering doubt about gold loan market reaching a saturation point. While the QoQ growth in 3QFY18 is certainly encouraging, it is in order that one gets a sense of the potential market size for gold loans. A simple back-of-the-envelope estimate entails the following considerations: (1) Quantum of physical gold held in total by Indian households: 20,000tn. (2) Indian price of gold per gram: Rs3100. Consequently, the potential addressable gold loan market in India is Rs62trn. While we acknowledge that the key is to sensitise more Indian households to get them to no longer regard as taboo the use of their household gold as loan collateral, the potential addressable gold loan market size looks significantly large.
Transfer of business from informal lending sector to formal lending is a powerful trend that will gain ground
A key reason for bottom-of-pyramid borrowers to opt for informal/unorganised lenders (moneylenders/ pawnbrokers) is lack of identity proof, which is necessary documentary requirement from formal/organised lenders. However, the penetration of Aadhaar has significantly changed the scenario in this regard. Even as early as the 25 January 2017 (as mentioned in a Press Information Bureau release), Aadhaar coverage had reached the 1.11bn mark, which covered as much 99% of adult residents in India.
With growing awareness for formal lending, borrowers will increasingly start to move to the former as moneylenders/pawnbrokers charge usurious interest rates of 3%-6% per month (36%-72% per annum) compared with ~2% for gold loan NBFCs. While the marginal gold loan borrower is not known to be interest rate-sensitive for a quantum that differs by 2%-4% per annum (0.16%-0.32% per month), the differential in monthly card rates of formal and informal lenders is fairly significant in terms of affecting behaviour.
It is known that informal lenders currently control as much as ~75% of the overall gold loan market and there is significant headroom for transfer of gold loan business from unorganised lenders to formal lending entities, of which gold loan NBFCs will be key beneficiaries, given their deep physical distribution network.
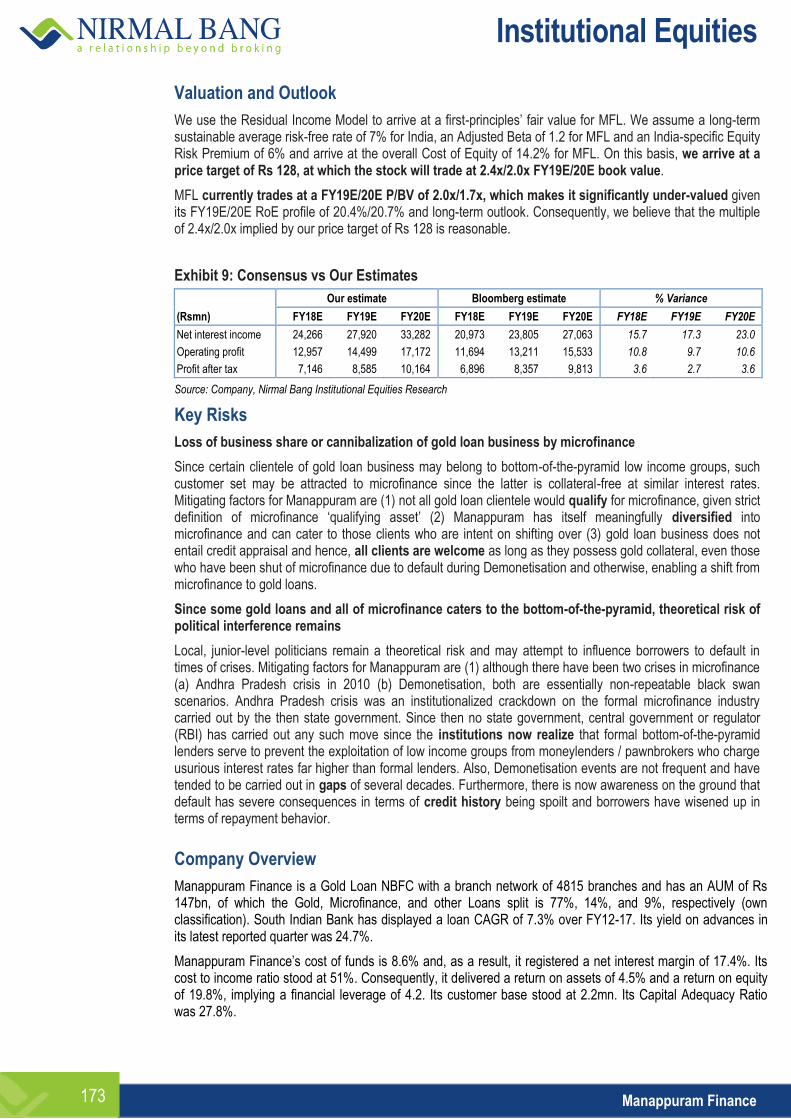
Institutional Equities
Manappuram Finance 173
Valuation and Outlook
We use the Residual Income Model to arrive at a first-principles’ fair value for MFL. We assume a long-term sustainable average risk-free rate of 7% for India, an Adjusted Beta of 1.2 for MFL and an India-specific Equity Risk Premium of 6% and arrive at the overall Cost of Equity of 14.2% for MFL. On this basis, we arrive at a price target of Rs 128, at which the stock will trade at 2.4x/2.0x FY19E/20E book value.
MFL currently trades at a FY19E/20E P/BV of 2.0x/1.7x, which makes it significantly under-valued given its FY19E/20E RoE profile of 20.4%/20.7% and long-term outlook. Consequently, we believe that the multiple of 2.4x/2.0x implied by our price target of Rs 128 is reasonable.
Exhibit 9: Consensus vs Our Estimates
Our estimate Bloomberg estimate % Variance
(Rsmn) FY18E FY19E FY20E FY18E FY19E FY20E FY18E FY19E FY20E
Net interest income 24,266 27,920 33,282 20,973 23,805 27,063 15.7 17.3 23.0
Operating profit 12,957 14,499 17,172 11,694 13,211 15,533 10.8 9.7 10.6
Profit after tax 7,146 8,585 10,164 6,896 8,357 9,813 3.6 2.7 3.6
Source: Company, Nirmal Bang Institutional Equities Research
Key Risks
Loss of business share or cannibalization of gold loan business by microfinance
Since certain clientele of gold loan business may belong to bottom-of-the-pyramid low income groups, such customer set may be attracted to microfinance since the latter is collateral-free at similar interest rates. Mitigating factors for Manappuram are (1) not all gold loan clientele would qualify for microfinance, given strict definition of microfinance ‘qualifying asset’ (2) Manappuram has itself meaningfully diversified into microfinance and can cater to those clients who are intent on shifting over (3) gold loan business does not entail credit appraisal and hence, all clients are welcome as long as they possess gold collateral, even those who have been shut of microfinance due to default during Demonetisation and otherwise, enabling a shift from microfinance to gold loans.
Since some gold loans and all of microfinance caters to the bottom-of-the-pyramid, theoretical risk of political interference remains
Local, junior-level politicians remain a theoretical risk and may attempt to influence borrowers to default in times of crises. Mitigating factors for Manappuram are (1) although there have been two crises in microfinance (a) Andhra Pradesh crisis in 2010 (b) Demonetisation, both are essentially non-repeatable black swan scenarios. Andhra Pradesh crisis was an institutionalized crackdown on the formal microfinance industry carried out by the then state government. Since then no state government, central government or regulator (RBI) has carried out any such move since the institutions now realize that formal bottom-of-the-pyramid lenders serve to prevent the exploitation of low income groups from moneylenders / pawnbrokers who charge usurious interest rates far higher than formal lenders. Also, Demonetisation events are not frequent and have tended to be carried out in gaps of several decades. Furthermore, there is now awareness on the ground that default has severe consequences in terms of credit history being spoilt and borrowers have wisened up in terms of repayment behavior.
Company Overview
Manappuram Finance is a Gold Loan NBFC with a branch network of 4815 branches and has an AUM of Rs 147bn, of which the Gold, Microfinance, and other Loans split is 77%, 14%, and 9%, respectively (own classification). South Indian Bank has displayed a loan CAGR of 7.3% over FY12-17. Its yield on advances in its latest reported quarter was 24.7%.
Manappuram Finance’s cost of funds is 8.6% and, as a result, it registered a net interest margin of 17.4%. Its cost to income ratio stood at 51%. Consequently, it delivered a return on assets of 4.5% and a return on equity of 19.8%, implying a financial leverage of 4.2. Its customer base stood at 2.2mn. Its Capital Adequacy Ratio was 27.8%.
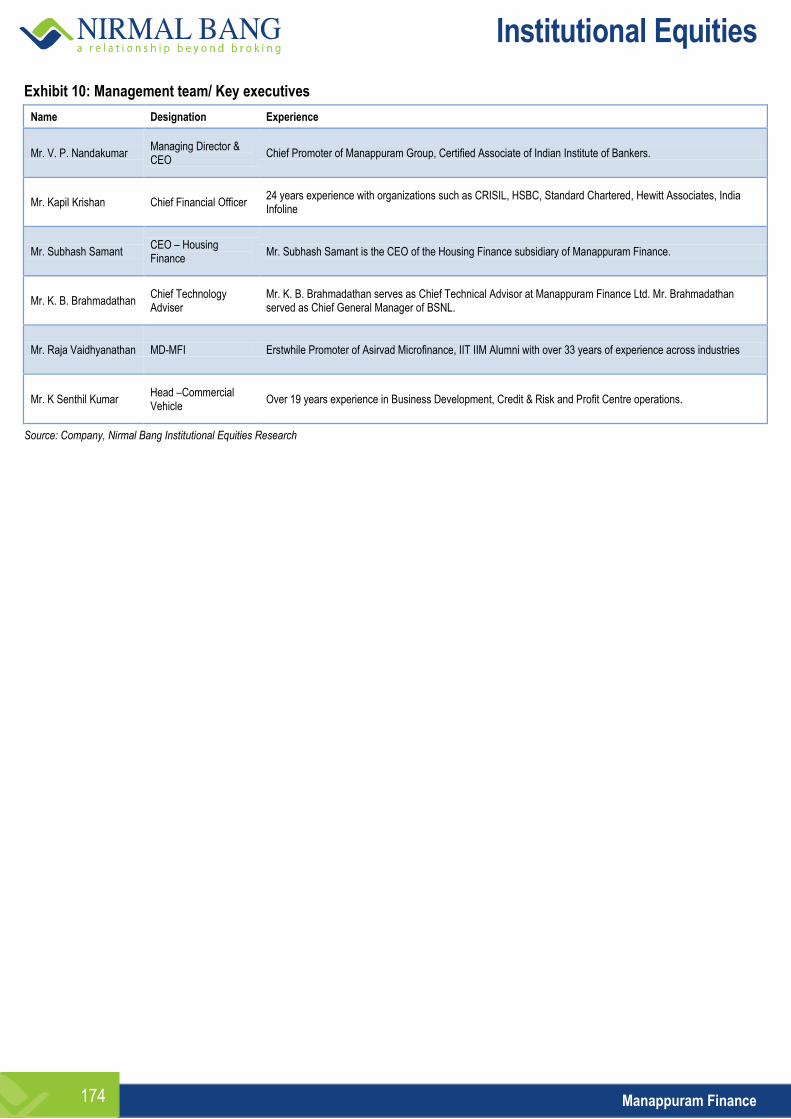
Institutional Equities
Manappuram Finance 174
Exhibit 10: Management team/ Key executives
Name Designation Experience
Mr. V. P. Nandakumar Managing Director & CEO
Chief Promoter of Manappuram Group, Certified Associate of Indian Institute of Bankers.
Mr. Kapil Krishan Chief Financial Officer 24 years experience with organizations such as CRISIL, HSBC, Standard Chartered, Hewitt Associates, India Infoline
Mr. Subhash Samant CEO – Housing Finance
Mr. Subhash Samant is the CEO of the Housing Finance subsidiary of Manappuram Finance.
Mr. K. B. Brahmadathan Chief Technology Adviser
Mr. K. B. Brahmadathan serves as Chief Technical Advisor at Manappuram Finance Ltd. Mr. Brahmadathan served as Chief General Manager of BSNL.
Mr. Raja Vaidhyanathan MD-MFI Erstwhile Promoter of Asirvad Microfinance, IIT IIM Alumni with over 33 years of experience across industries
Mr. K Senthil Kumar Head –Commercial Vehicle
Over 19 years experience in Business Development, Credit & Risk and Profit Centre operations.
Source: Company, Nirmal Bang Institutional Equities Research
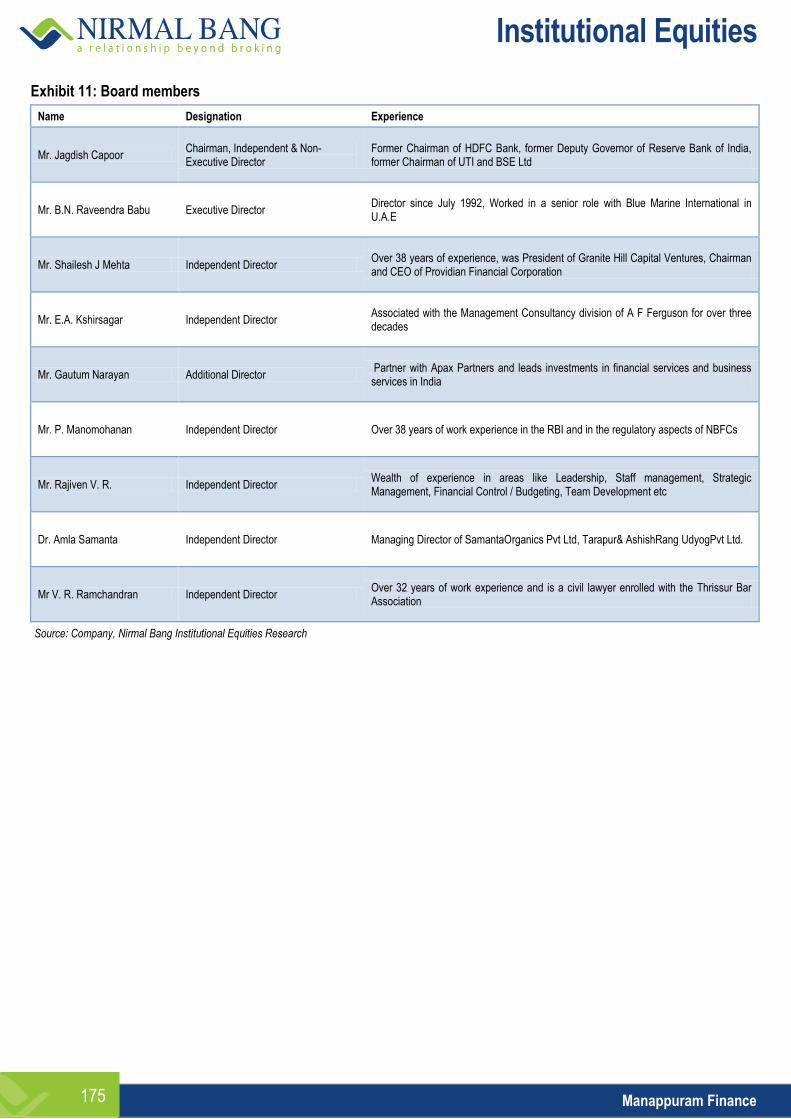
Institutional Equities
Manappuram Finance 175
Exhibit 11: Board members
Name Designation Experience
Mr. Jagdish Capoor Chairman, Independent & Non-Executive Director
Former Chairman of HDFC Bank, former Deputy Governor of Reserve Bank of India, former Chairman of UTI and BSE Ltd
Mr. B.N. Raveendra Babu Executive Director Director since July 1992, Worked in a senior role with Blue Marine International in U.A.E
Mr. Shailesh J Mehta Independent Director Over 38 years of experience, was President of Granite Hill Capital Ventures, Chairman and CEO of Providian Financial Corporation
Mr. E.A. Kshirsagar Independent Director Associated with the Management Consultancy division of A F Ferguson for over three decades
Mr. Gautum Narayan Additional Director Partner with Apax Partners and leads investments in financial services and business services in India
Mr. P. Manomohanan Independent Director Over 38 years of work experience in the RBI and in the regulatory aspects of NBFCs
Mr. Rajiven V. R. Independent Director Wealth of experience in areas like Leadership, Staff management, Strategic Management, Financial Control / Budgeting, Team Development etc
Dr. Amla Samanta Independent Director Managing Director of SamantaOrganics Pvt Ltd, Tarapur& AshishRang UdyogPvt Ltd.
Mr V. R. Ramchandran Independent Director Over 32 years of work experience and is a civil lawyer enrolled with the Thrissur Bar Association
Source: Company, Nirmal Bang Institutional Equities Research
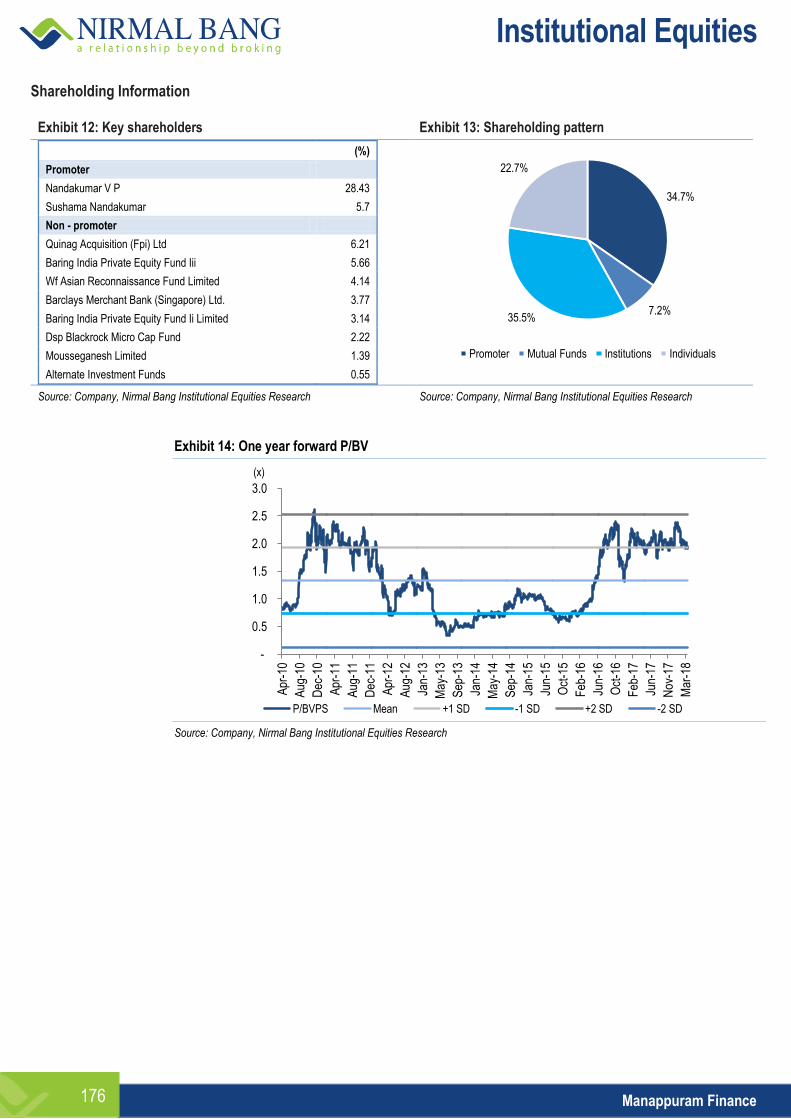
Institutional Equities
Manappuram Finance 176
Shareholding Information
Exhibit 12: Key shareholders Exhibit 13: Shareholding pattern
(%)
Promoter
Nandakumar V P 28.43
Sushama Nandakumar 5.7
Non - promoter
Quinag Acquisition (Fpi) Ltd 6.21
Baring India Private Equity Fund Iii 5.66
Wf Asian Reconnaissance Fund Limited 4.14
Barclays Merchant Bank (Singapore) Ltd. 3.77
Baring India Private Equity Fund Ii Limited 3.14
Dsp Blackrock Micro Cap Fund 2.22
Mousseganesh Limited 1.39
Alternate Investment Funds 0.55
Source: Company, Nirmal Bang Institutional Equities Research Source: Company, Nirmal Bang Institutional Equities Research
Exhibit 14: One year forward P/BV
Source: Company, Nirmal Bang Institutional Equities Research
-
0.5
1.0
1.5
2.0
2.5
3.0
Apr
-10
Aug
-10
Dec
-10
Apr
-11
Aug
-11
Dec
-11
Apr
-12
Aug
-12
Jan-
13
May
-13
Sep
-13
Jan-
14
May
-14
Sep
-14
Jan-
15
Jun-
15
Oct
-15
Feb
-16
Jun-
16
Oct
-16
Feb
-17
Jun-
17
Nov
-17
Mar
-18
P/BVPS Mean +1 SD -1 SD +2 SD -2 SD
(x)
34.7%
7.2% 35.5%
22.7%
Promoter Mutual Funds Institutions Individuals
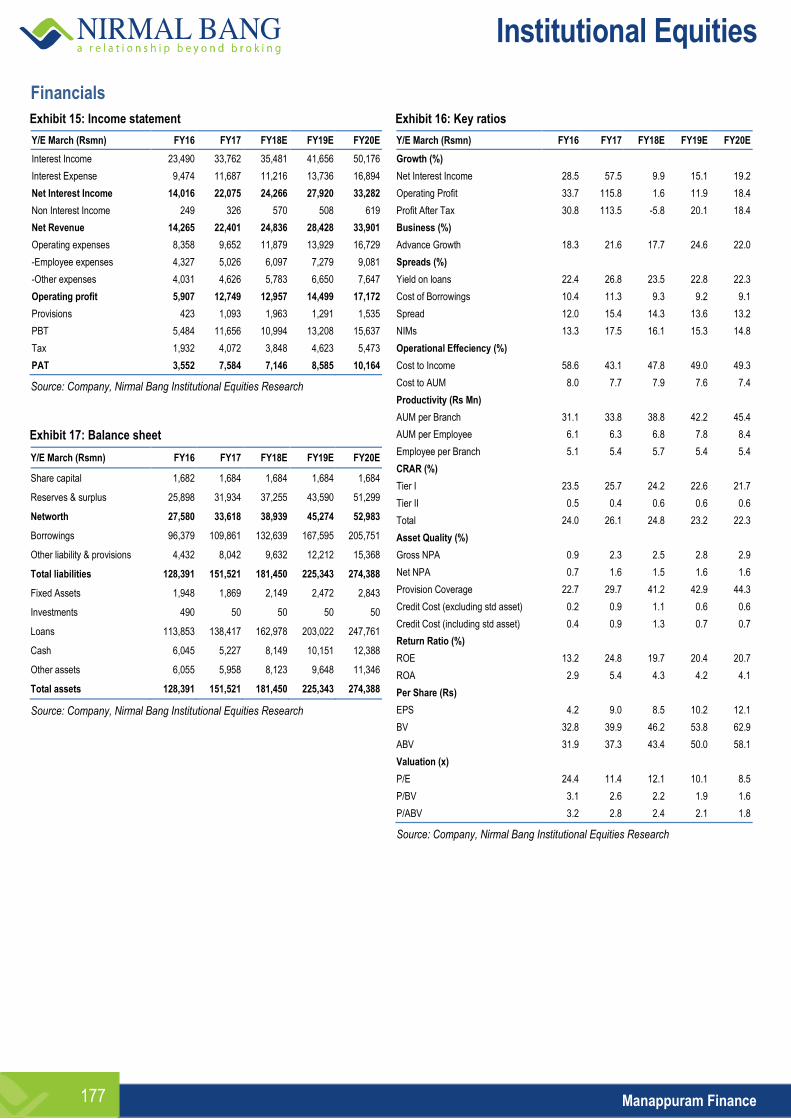
Institutional Equities
Manappuram Finance 177
Financials
Exhibit 15: Income statement
Y/E March (Rsmn) FY16 FY17 FY18E FY19E FY20E
Interest Income 23,490 33,762 35,481 41,656 50,176
Interest Expense 9,474 11,687 11,216 13,736 16,894
Net Interest Income 14,016 22,075 24,266 27,920 33,282
Non Interest Income 249 326 570 508 619
Net Revenue 14,265 22,401 24,836 28,428 33,901
Operating expenses 8,358 9,652 11,879 13,929 16,729
-Employee expenses 4,327 5,026 6,097 7,279 9,081
-Other expenses 4,031 4,626 5,783 6,650 7,647
Operating profit 5,907 12,749 12,957 14,499 17,172
Provisions 423 1,093 1,963 1,291 1,535
PBT 5,484 11,656 10,994 13,208 15,637
Tax 1,932 4,072 3,848 4,623 5,473
PAT 3,552 7,584 7,146 8,585 10,164
Source: Company, Nirmal Bang Institutional Equities Research
Exhibit 17: Balance sheet
Y/E March (Rsmn) FY16 FY17 FY18E FY19E FY20E
Share capital 1,682 1,684 1,684 1,684 1,684
Reserves & surplus 25,898 31,934 37,255 43,590 51,299
Networth 27,580 33,618 38,939 45,274 52,983
Borrowings 96,379 109,861 132,639 167,595 205,751
Other liability & provisions 4,432 8,042 9,632 12,212 15,368
Total liabilities 128,391 151,521 181,450 225,343 274,388
Fixed Assets 1,948 1,869 2,149 2,472 2,843
Investments 490 50 50 50 50
Loans 113,853 138,417 162,978 203,022 247,761
Cash 6,045 5,227 8,149 10,151 12,388
Other assets 6,055 5,958 8,123 9,648 11,346
Total assets 128,391 151,521 181,450 225,343 274,388
Source: Company, Nirmal Bang Institutional Equities Research
Exhibit 16: Key ratios
Y/E March (Rsmn) FY16 FY17 FY18E FY19E FY20E
Growth (%)
Net Interest Income 28.5 57.5 9.9 15.1 19.2
Operating Profit 33.7 115.8 1.6 11.9 18.4
Profit After Tax 30.8 113.5 -5.8 20.1 18.4
Business (%)
Advance Growth 18.3 21.6 17.7 24.6 22.0
Spreads (%)
Yield on loans 22.4 26.8 23.5 22.8 22.3
Cost of Borrowings 10.4 11.3 9.3 9.2 9.1
Spread 12.0 15.4 14.3 13.6 13.2
NIMs 13.3 17.5 16.1 15.3 14.8
Operational Effeciency (%)
Cost to Income 58.6 43.1 47.8 49.0 49.3
Cost to AUM 8.0 7.7 7.9 7.6 7.4
Productivity (Rs Mn)
AUM per Branch 31.1 33.8 38.8 42.2 45.4
AUM per Employee 6.1 6.3 6.8 7.8 8.4
Employee per Branch 5.1 5.4 5.7 5.4 5.4
CRAR (%)
Tier I 23.5 25.7 24.2 22.6 21.7
Tier II 0.5 0.4 0.6 0.6 0.6
Total 24.0 26.1 24.8 23.2 22.3
Asset Quality (%)
Gross NPA 0.9 2.3 2.5 2.8 2.9
Net NPA 0.7 1.6 1.5 1.6 1.6
Provision Coverage 22.7 29.7 41.2 42.9 44.3
Credit Cost (excluding std asset) 0.2 0.9 1.1 0.6 0.6
Credit Cost (including std asset) 0.4 0.9 1.3 0.7 0.7
Return Ratio (%)
ROE 13.2 24.8 19.7 20.4 20.7
ROA 2.9 5.4 4.3 4.2 4.1
Per Share (Rs)
EPS 4.2 9.0 8.5 10.2 12.1
BV 32.8 39.9 46.2 53.8 62.9
ABV 31.9 37.3 43.4 50.0 58.1
Valuation (x)
P/E 24.4 11.4 12.1 10.1 8.5
P/BV 3.1 2.6 2.2 1.9 1.6
P/ABV 3.2 2.8 2.4 2.1 1.8
Source: Company, Nirmal Bang Institutional Equities Research

Institutional Equities
Manappuram Finance 178
This page has been intentionally left blank

Institutional Equities
Initi
atin
g C
over
age
Reuters: MUTT.NS; Bloomberg: MUTH IN
Muthoot Finance
The Elephant Can Dance Muthoot Finance (MUT) is a gold loan NBFC with a network of 4,303 branches and loan book size of Rs283bn. We are bullish on MUT as: (1) The mini crisis because of Demonetisation has stalled the largely unfinished re-rating process that had begun post the long-term gold loan crisis of FY12-FY16 (which had caused valuation to turn egregiously low) (2) MUT’s truly vast and strategically located branches are a key advantage that cannot be replicated in a short time span (3) MUT’s non-gold loan businesses are synergistic and are delivering robust growth (4) MUT is a branding machine that has ironed out the creases in its brand strategy (5) Gold loans remain a large under-penetrated loan market and Aadhaar coverage is driving a shift of business from informal lenders. We initiate coverage on MUT with a Buy rating and a target price of Rs471, valuing the stock at 2.0x/1.7x FY19E/FY20E P/BV.
Long-term and short-term crises over, MUT can now focus on growth: Demonetisation caused a seemingly persistent, but transient growth crisis at MUT as (a) Gold loans at MUT is a truly bottom-of-pyramid loan business with average ticket size at ~Rs40,000. (b) Drought conditions in parts of South India was an incremental factor. This stalled the largely unfinished re-rating of MUT that had started after the long-term gold loan crisis of FY12-FY16. Now, after flattish absolute growth of 0.5% over four quarters (2QFY17-2QFY18), MUT has delivered 2.0% growth QoQ in 3QFY18, which is significantly encouraging from an annualised perspective.
MUT’s vast and strategically located branch network is a key advantage: MUT has 4,303 gold loan branches compared with 399-3,313 for key private sector gold loan players, barring HDFC Bank at 4,734. Further, 70% of MUT’s branches are located in rural centres as of 3QFY18-end, underlining its superior reach, which is key given that ~65% of Indian household gold holdings are in rural areas. Replicating MUT’s network size and deep penetration is not straightforward for key competitors from an opex perspective.
MUT’s non-gold loan businesses are synergistic and have high operating leverage: Given MUT’s bottom-of-pyramid pedigree, it made sense for it to expand into microfinance, retail financing in Sri Lanka, small-ticket housing and insurance broking. Non-gold loan businesses, which currently account for 8% of group AUM, as guided by the management, are slated to go up ~15% as a share of group AUM by FY19E. All these businesses (other than Sri Lankan subsidiary) are significantly synergistic to MUT’s gold loan business from a reach and clientele perspective.
MUT is a branding machine that has ironed out the creases existing in its brand strategy: MUT has been ranked as India’s most trusted financial services brand in ‘The Brand Trust Report, India Study 2017’. MUT, in 4QFY18, signed on film star Amitabh Bachchan as its all-India brand ambassador, a celebrity who has a significant pan-India appeal. It has also engaged with IPL cricket team Chennai Super Kings (CSK) as principal team partner. MUT stands to benefit from the performance consistency and brand strength (especially in South India) of CSK.
Valuation and outlook: We have used the residual income model to value MUT and arrive at our target price of Rs471. MUT currently trades at 1.6x/1.4x FY19E/FY20E P/BV and we believe that our target price is reasonable given MUT’s RoE profile of 20.6%/20.1% for FY19E/FY20E and long-term outlook.
BUY
Sector: NBFCs
CMP: Rs381
Target Price: Rs471
Upside: 24%
Shivaji Thapliyal Research Analyst [email protected] +91-22-6273 8068 Shreesh Chandra Research Associate [email protected] +91-22-6273 8028
Key Data
Current Shares O/S (mn) 399.9
Mkt Cap (Rsbn/US$bn) 152.6/2.3
52 Wk H / L (Rs) 526/348
Daily Vol. (3M NSE Avg.) 803,645
Shareholding (%) 3QFY18 2QFY18 1QFY18
Promoter 73.6 73.7 73.7
FII 26.4 26.3 26.0
Others 22.7 18.8 15.4
One Year Indexed Stock Performance
Price Performance (%)
1 M 6 M 1 Yr
Muthoot Finance (1.6) (21.8) 7.9
Nifty Index (4.8) 0.2 9.9
Source: Bloomberg
Y/E March (Rsmn) FY16 FY17 FY18E FY19E FY20E
Net Interest Income 25,552 33,609 40,965 42,671 47,837
Pre-Provision Profit 14,791 22,026 29,115 29,775 33,551
PAT 8,095 11,798 17,262 17,944 20,799
EPS (Rs) 20.3 29.5 43.2 44.9 52.1
BV (Rs) 140.8 163.1 199.1 236.8 281.6
P/E (x) 18.8 12.9 8.8 8.5 7.3
P/BV (x) 2.7 2.3 1.9 1.6 1.4
Gross NPA (%) 2.9 2.1 5.0 3.0 2.5
Net NPA (%) 2.5 1.7 4.1 1.9 1.5
ROA (%) 3.0 4.1 5.5 5.3 5.4
ROE (%) 15.1 19.4 23.9 20.6 20.1
Source: Company, Nirmal Bang Institutional Equities Research
80
90
100
110
120
130
140
150
160
Mar-17 May-17 Jul-17 Sep-17 Nov-17 Jan-18 Mar-18
MUTHOOT FINANCE Nifty 50
26 March 2018
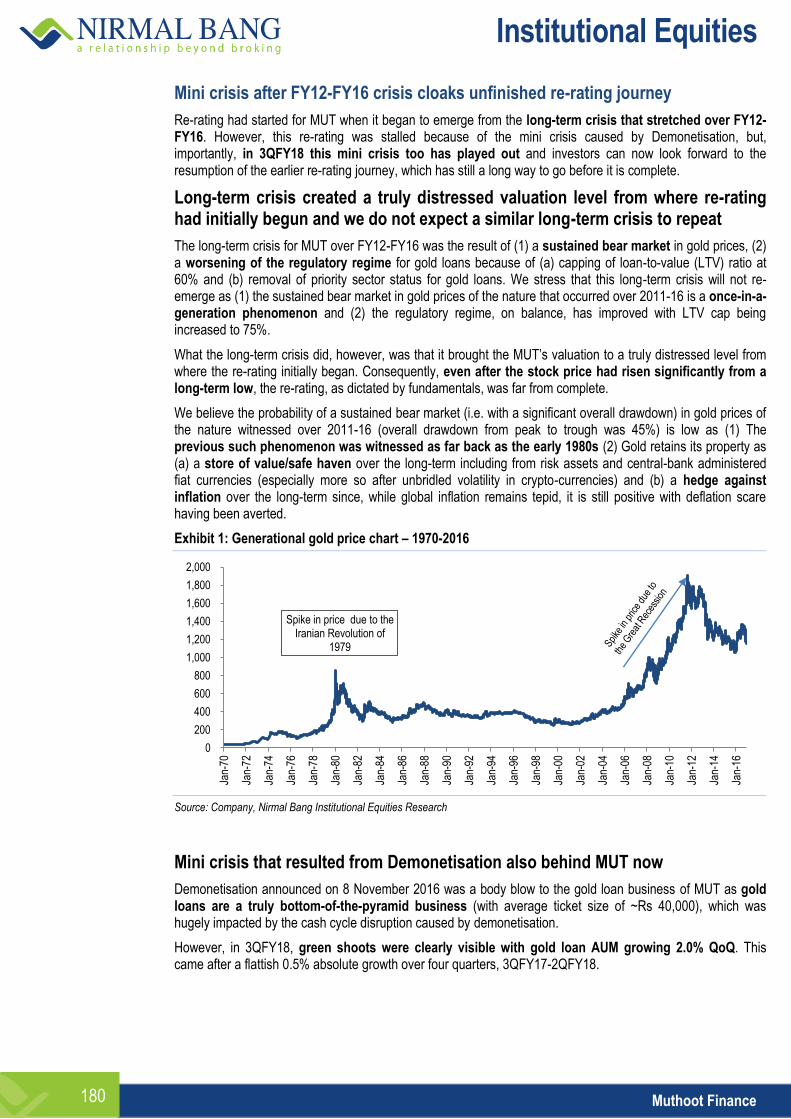
Institutional Equities
Muthoot Finance 180
Mini crisis after FY12-FY16 crisis cloaks unfinished re-rating journey
Re-rating had started for MUT when it began to emerge from the long-term crisis that stretched over FY12-FY16. However, this re-rating was stalled because of the mini crisis caused by Demonetisation, but, importantly, in 3QFY18 this mini crisis too has played out and investors can now look forward to the resumption of the earlier re-rating journey, which has still a long way to go before it is complete.
Long-term crisis created a truly distressed valuation level from where re-rating had initially begun and we do not expect a similar long-term crisis to repeat
The long-term crisis for MUT over FY12-FY16 was the result of (1) a sustained bear market in gold prices, (2) a worsening of the regulatory regime for gold loans because of (a) capping of loan-to-value (LTV) ratio at 60% and (b) removal of priority sector status for gold loans. We stress that this long-term crisis will not re-emerge as (1) the sustained bear market in gold prices of the nature that occurred over 2011-16 is a once-in-a-generation phenomenon and (2) the regulatory regime, on balance, has improved with LTV cap being increased to 75%.
What the long-term crisis did, however, was that it brought the MUT’s valuation to a truly distressed level from where the re-rating initially began. Consequently, even after the stock price had risen significantly from a long-term low, the re-rating, as dictated by fundamentals, was far from complete.
We believe the probability of a sustained bear market (i.e. with a significant overall drawdown) in gold prices of the nature witnessed over 2011-16 (overall drawdown from peak to trough was 45%) is low as (1) The previous such phenomenon was witnessed as far back as the early 1980s (2) Gold retains its property as (a) a store of value/safe haven over the long-term including from risk assets and central-bank administered fiat currencies (especially more so after unbridled volatility in crypto-currencies) and (b) a hedge against inflation over the long-term since, while global inflation remains tepid, it is still positive with deflation scare having been averted.
Exhibit 1: Generational gold price chart – 1970-2016
Source: Company, Nirmal Bang Institutional Equities Research
Mini crisis that resulted from Demonetisation also behind MUT now
Demonetisation announced on 8 November 2016 was a body blow to the gold loan business of MUT as gold loans are a truly bottom-of-the-pyramid business (with average ticket size of ~Rs 40,000), which was hugely impacted by the cash cycle disruption caused by demonetisation.
However, in 3QFY18, green shoots were clearly visible with gold loan AUM growing 2.0% QoQ. This came after a flattish 0.5% absolute growth over four quarters, 3QFY17-2QFY18.
Spike in price due to the Iranian Revolution of
1979
0
200
400
600
800
1,000
1,200
1,400
1,600
1,800
2,000
Jan-
70
Jan-
72
Jan-
74
Jan-
76
Jan-
78
Jan-
80
Jan-
82
Jan-
84
Jan-
86
Jan-
88
Jan-
90
Jan-
92
Jan-
94
Jan-
96
Jan-
98
Jan-
00
Jan-
02
Jan-
04
Jan-
06
Jan-
08
Jan-
10
Jan-
12
Jan-
14
Jan-
16
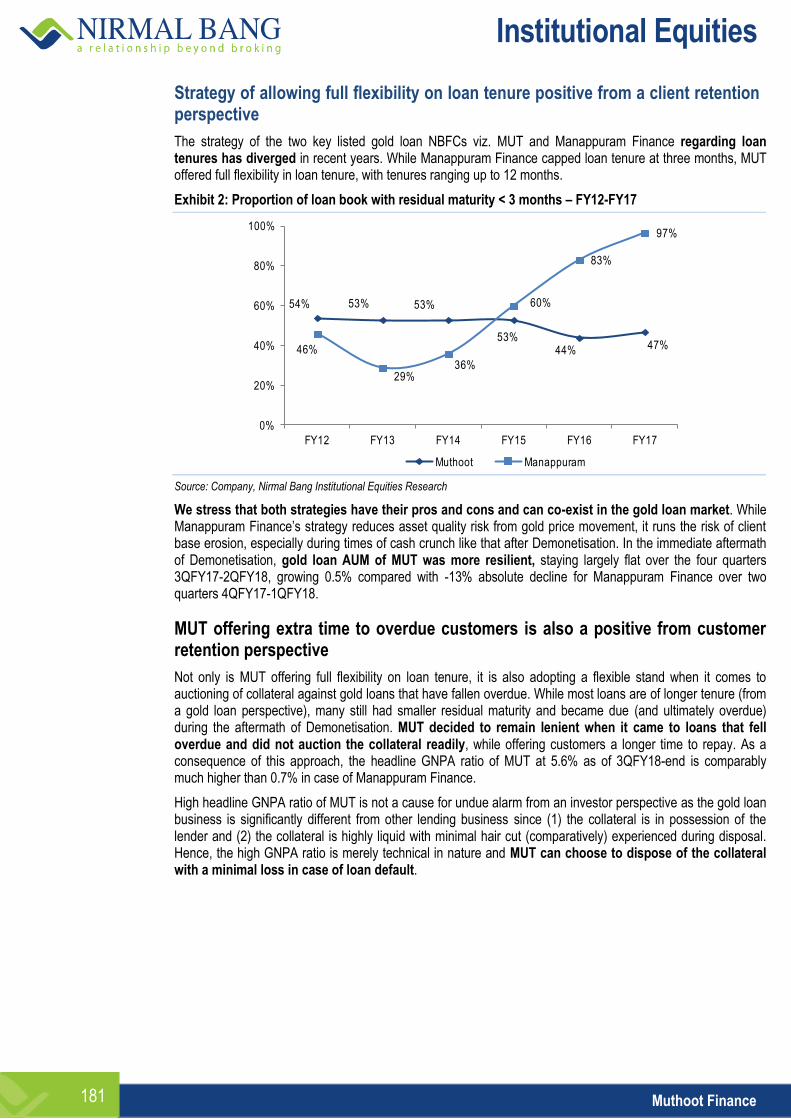
Institutional Equities
Muthoot Finance 181
Strategy of allowing full flexibility on loan tenure positive from a client retention perspective
The strategy of the two key listed gold loan NBFCs viz. MUT and Manappuram Finance regarding loan tenures has diverged in recent years. While Manappuram Finance capped loan tenure at three months, MUT offered full flexibility in loan tenure, with tenures ranging up to 12 months.
Exhibit 2: Proportion of loan book with residual maturity < 3 months – FY12-FY17
Source: Company, Nirmal Bang Institutional Equities Research
We stress that both strategies have their pros and cons and can co-exist in the gold loan market. While Manappuram Finance’s strategy reduces asset quality risk from gold price movement, it runs the risk of client base erosion, especially during times of cash crunch like that after Demonetisation. In the immediate aftermath of Demonetisation, gold loan AUM of MUT was more resilient, staying largely flat over the four quarters 3QFY17-2QFY18, growing 0.5% compared with -13% absolute decline for Manappuram Finance over two quarters 4QFY17-1QFY18.
MUT offering extra time to overdue customers is also a positive from customer retention perspective
Not only is MUT offering full flexibility on loan tenure, it is also adopting a flexible stand when it comes to auctioning of collateral against gold loans that have fallen overdue. While most loans are of longer tenure (from a gold loan perspective), many still had smaller residual maturity and became due (and ultimately overdue) during the aftermath of Demonetisation. MUT decided to remain lenient when it came to loans that fell overdue and did not auction the collateral readily, while offering customers a longer time to repay. As a consequence of this approach, the headline GNPA ratio of MUT at 5.6% as of 3QFY18-end is comparably much higher than 0.7% in case of Manappuram Finance.
High headline GNPA ratio of MUT is not a cause for undue alarm from an investor perspective as the gold loan business is significantly different from other lending business since (1) the collateral is in possession of the lender and (2) the collateral is highly liquid with minimal hair cut (comparatively) experienced during disposal. Hence, the high GNPA ratio is merely technical in nature and MUT can choose to dispose of the collateral with a minimal loss in case of loan default.
54% 53% 53%
53%44% 47%46%
29%36%
60%
83%
97%
0%
20%
40%
60%
80%
100%
FY12 FY13 FY14 FY15 FY16 FY17
Muthoot Manappuram
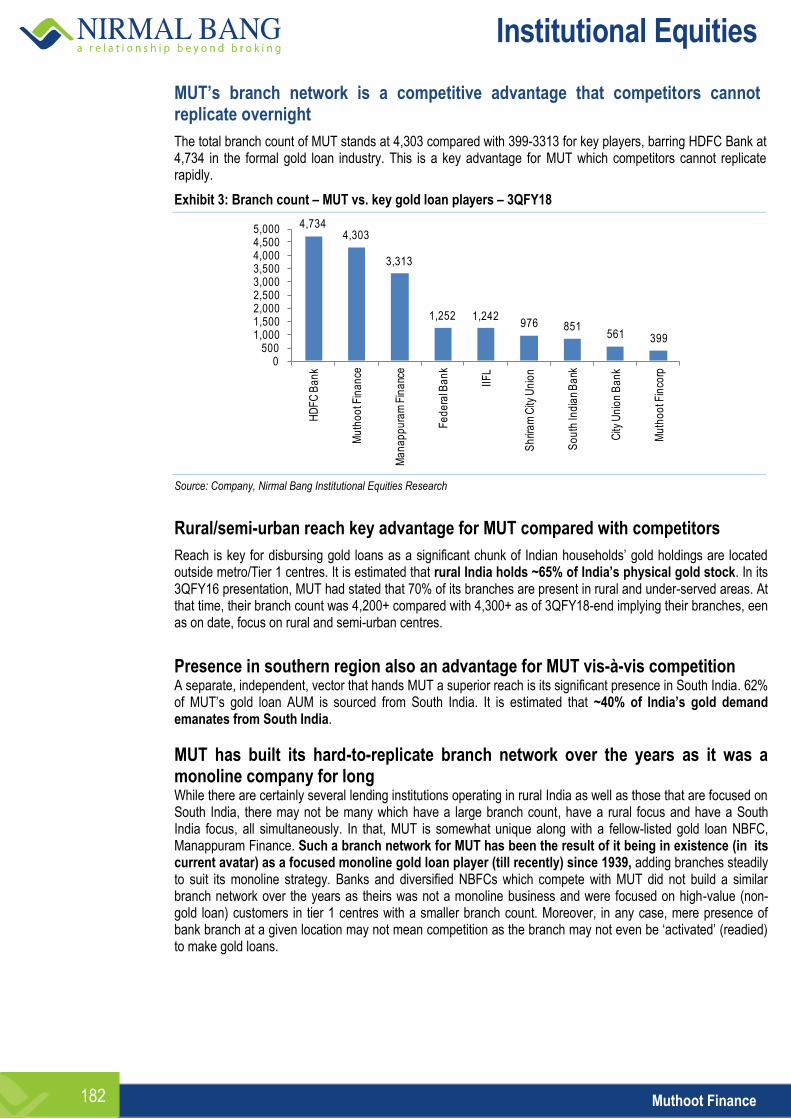
Institutional Equities
Muthoot Finance 182
MUT’s branch network is a competitive advantage that competitors cannot replicate overnight
The total branch count of MUT stands at 4,303 compared with 399-3313 for key players, barring HDFC Bank at 4,734 in the formal gold loan industry. This is a key advantage for MUT which competitors cannot replicate rapidly.
Exhibit 3: Branch count – MUT vs. key gold loan players – 3QFY18
Source: Company, Nirmal Bang Institutional Equities Research
Rural/semi-urban reach key advantage for MUT compared with competitors
Reach is key for disbursing gold loans as a significant chunk of Indian households’ gold holdings are located outside metro/Tier 1 centres. It is estimated that rural India holds ~65% of India’s physical gold stock. In its 3QFY16 presentation, MUT had stated that 70% of its branches are present in rural and under-served areas. At that time, their branch count was 4,200+ compared with 4,300+ as of 3QFY18-end implying their branches, een as on date, focus on rural and semi-urban centres.
Presence in southern region also an advantage for MUT vis-à-vis competition A separate, independent, vector that hands MUT a superior reach is its significant presence in South India. 62% of MUT’s gold loan AUM is sourced from South India. It is estimated that ~40% of India’s gold demand emanates from South India.
MUT has built its hard-to-replicate branch network over the years as it was a monoline company for long While there are certainly several lending institutions operating in rural India as well as those that are focused on South India, there may not be many which have a large branch count, have a rural focus and have a South India focus, all simultaneously. In that, MUT is somewhat unique along with a fellow-listed gold loan NBFC, Manappuram Finance. Such a branch network for MUT has been the result of it being in existence (in its current avatar) as a focused monoline gold loan player (till recently) since 1939, adding branches steadily to suit its monoline strategy. Banks and diversified NBFCs which compete with MUT did not build a similar branch network over the years as theirs was not a monoline business and were focused on high-value (non-gold loan) customers in tier 1 centres with a smaller branch count. Moreover, in any case, mere presence of bank branch at a given location may not mean competition as the branch may not even be ‘activated’ (readied) to make gold loans.
4,734 4,303
3,313
1,252 1,242 976 851
561 399
0 500
1,000 1,500 2,000 2,500 3,000 3,500 4,000 4,500 5,000
HD
FC
Ba
nk
Mu
tho
ot F
ina
nce
Ma
na
pp
ura
m F
ina
nce
Fe
de
ral B
an
k
IIF
L
Sh
rira
m C
ity U
nio
n
So
uth
Ind
ian
Ba
nk
City
Un
ion
Ba
nk
Mu
tho
ot F
inco
rp
Institutional Equities
Muthoot Finance 183
MUT has a nimble management and has actively diversified into synergistic non-gold loan businesses
MUT is now a multi-product player having diversified into microfinance, retail financing in Sri Lanka, small-ticket affordable housing, and insurance broking. The key similarity in these new businesses (other than the Sri Lankan subsidiary) is that they are significantly synergistic to MUT’s gold loan business from a reach and type of clientele perspective.
Other means of synergy include access to current gold loan client base for alternate loan products.
The traction in non-gold businesses is strong and these businesses currently make up 8% of group loan AUM. The Management has given guidance that this is expected to go up to ~15% by FY19E.
MUT is a branding machine that has ironed out erstwhile creases on this front
MUT has been ranked as India’s most trusted financial services brand in ‘The Brand Trust Report, India Study 2017’ conducted by TRA Research. A client base of ~6mn indicates that MUT has done a superlative job creating a financial services brand over the years.
Some of the key investments of MUT in brand building over the past decade, however, had been sub-optimal. MUT had eschewed using Bollywood actors and relied upon sportsmen as celebrity brand endorsers. MUT’s primary brand endorsers during this phase were IPL cricket team Delhi Daredevils and specific individual team members (Virdendra Sehwag, Gautam Gambhir, Dinesh Karthik), and football star Bhaichung Bhutia. These investments proved to be sub-optimal as Delhi Daredevils consistently under-performed as a team in the IPL (Indian Premium League) cricket matches and Bhaichung Bhutia was in the twilight of his playing career and retired from international football in 2011. However, MUT is likely to bounce back from these disappointments as it has in 4QFY18 (1) signed on Amitabh Bachchan, someone who has a significant pan-India appeal, as its all-India brand ambassador. (2) It has also engaged with IPL cricket team Chennai Super Kings (CSK) as its principal team partner and stands to benefit from CSK’s significant performance consistency and brand strength (especially in South India).
Institutional Equities
Muthoot Finance 184
Valuation and Outlook
We use the Residual Income Model to arrive at a first-principles’ fair value for MUT. We assume a long-term sustainable average risk-free rate of 7% for India, an Adjusted Beta of 1.1 for MUT and an India-specific Equity Risk Premium of 6% and arrive at the overall Cost of Equity of 13.6% for MUT. On this basis, we arrive at a price target of Rs 471, at which the stock will trade at 2.0x/1.7x FY19E/20E book value.
MUT currently trades at a FY19E/20E P/BV of 1.6x/1.4x, which makes it significantly under-valued given its FY19E/20E RoE profile of 20.6%/20.1% and long-term outlook. Consequently, we believe that the multiple of 2.0x/1.7x implied by our price target of Rs 471 is reasonable.
Exhibit 4: Consensus vs Our Estimates
Our estimate Bloomberg estimate % Variance
(Rsmn) FY18E FY19E FY20E FY18E FY19E FY20E FY18E FY19E FY20E
Net interest income 40,965 42,671 47,837 41,221 40,929 45,497 (0.6) 4.3 5.1
Operating profit 29,115 29,775 33,551 27,793 28,523 31,835 4.8 4.4 5.4
Profit after tax 17,262 17,944 20,799 17,036 17,356 18,892 1.3 3.4 10.1
Source: Company, Nirmal Bang Institutional Equities Research
Key Risks
Loss of business share or cannibalization of gold loan business by microfinance
Since certain clientele of gold loan business may belong to bottom-of-the-pyramid low income groups, such customer set may be attracted to microfinance since the latter is collateral-free at similar interest rates. Mitigating factors for Muthoot are (1) not all gold loan clientele would qualify for microfinance, given strict definition of microfinance ‘qualifying asset’ (2) Muthoot has itself meaningfully diversified into microfinance and can cater to those clients who are intent on shifting over (3) gold loan business does not entail credit appraisal and hence, all clients are welcome as long as they possess gold collateral, even those who have been shut of microfinance due to default during Demonetisation and otherwise, enabling a shift from microfinance to gold loans.
Since some gold loans and all of microfinance caters to the bottom-of-the-pyramid, theoretical risk of political interference remains
Local, junior-level politicians remain a theoretical risk and may attempt to influence borrowers to default in times of crises. Mitigating factors for Muthoot are (1) although there have been two crises in microfinance (a) Andhra Pradesh crisis in 2010 (b) Demonetisation, both are essentially non-repeatable black swan scenarios. Andhra Pradesh crisis was an institutionalized crackdown on the formal microfinance industry carried out by the then state government. Since then no state government, central government or regulator (RBI) has carried out any such move since the institutions now realize that formal bottom-of-the-pyramid lenders serve to prevent the exploitation of low income groups from moneylenders / pawnbrokers who charge usurious interest rates far higher than formal lenders. Also, Demonetisation events are not frequent and have tended to be carried out in gaps of several decades. Furthermore, there is now awareness on the ground that default has severe consequences in terms of credit history being spoilt and borrowers have wisened up in terms of repayment behavior.
Company Overview
Muthooth Finance is a Gold Loan NBFC with a branch network of 4303 branches and has an AUM of Rs 283bn, of which the Gold, and other Loans split is 99%, and 1%, respectively (own classification). Muthooth Finance has displayed a loan CAGR of 5% over FY12-17. Its yield on advances in its latest reported quarter was 21.8%
Muthooth Finance’s cost of funds is 8.6% and, as a result, it registered a net interest margin of 15.1%. Its cost to income ratio stood at 29.3%. Consequently, it delivered a return on assets of 6.6% and a return on equity of 24.5%, implying a financial leverage of 3.7. Its customer base stood at 7.6mn. Its Capital Adequacy Ratio was 27.7%.
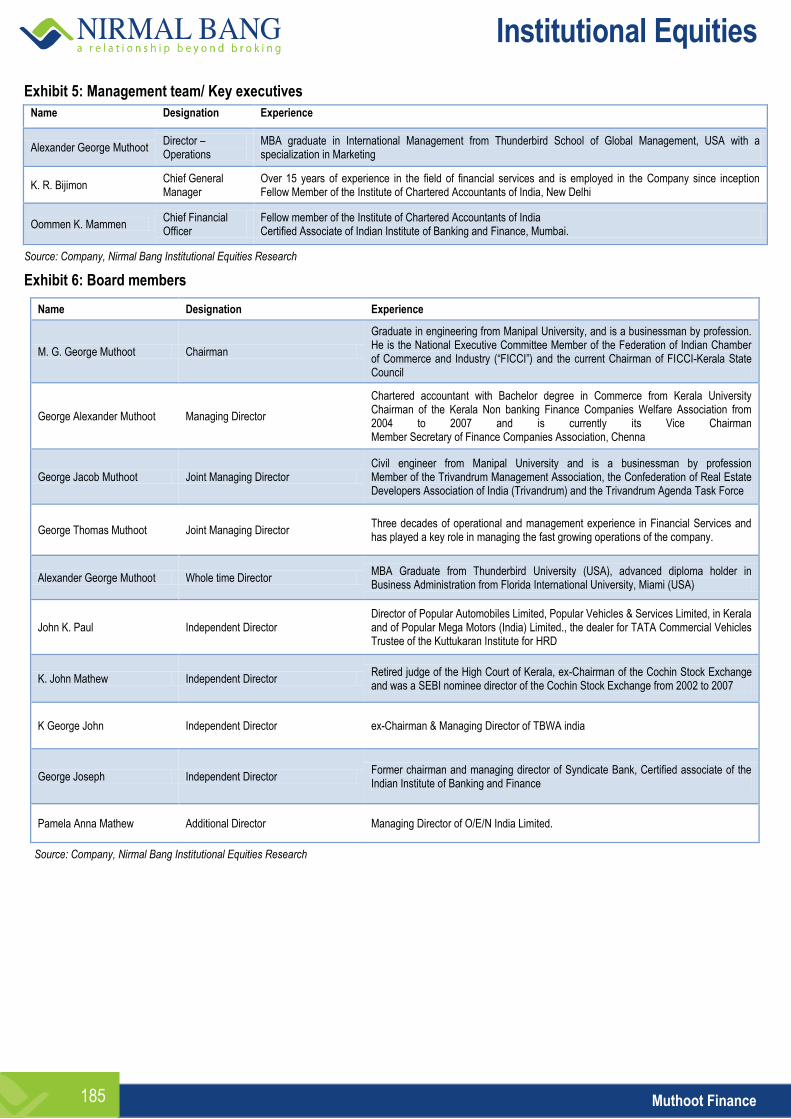
Institutional Equities
Muthoot Finance 185
Exhibit 5: Management team/ Key executives Name Designation Experience
Alexander George Muthoot Director – Operations
MBA graduate in International Management from Thunderbird School of Global Management, USA with a specialization in Marketing
K. R. Bijimon Chief General Manager
Over 15 years of experience in the field of financial services and is employed in the Company since inception Fellow Member of the Institute of Chartered Accountants of India, New Delhi
Oommen K. Mammen Chief Financial Officer
Fellow member of the Institute of Chartered Accountants of India Certified Associate of Indian Institute of Banking and Finance, Mumbai.
Source: Company, Nirmal Bang Institutional Equities Research
Exhibit 6: Board members
Name Designation Experience
M. G. George Muthoot Chairman
Graduate in engineering from Manipal University, and is a businessman by profession. He is the National Executive Committee Member of the Federation of Indian Chamber of Commerce and Industry (“FICCI”) and the current Chairman of FICCI-Kerala State Council
George Alexander Muthoot Managing Director
Chartered accountant with Bachelor degree in Commerce from Kerala University Chairman of the Kerala Non banking Finance Companies Welfare Association from 2004 to 2007 and is currently its Vice Chairman Member Secretary of Finance Companies Association, Chenna
George Jacob Muthoot Joint Managing Director Civil engineer from Manipal University and is a businessman by profession Member of the Trivandrum Management Association, the Confederation of Real Estate Developers Association of India (Trivandrum) and the Trivandrum Agenda Task Force
George Thomas Muthoot Joint Managing Director Three decades of operational and management experience in Financial Services and has played a key role in managing the fast growing operations of the company.
Alexander George Muthoot Whole time Director MBA Graduate from Thunderbird University (USA), advanced diploma holder in Business Administration from Florida International University, Miami (USA)
John K. Paul Independent Director Director of Popular Automobiles Limited, Popular Vehicles & Services Limited, in Kerala and of Popular Mega Motors (India) Limited., the dealer for TATA Commercial Vehicles Trustee of the Kuttukaran Institute for HRD
K. John Mathew Independent Director Retired judge of the High Court of Kerala, ex-Chairman of the Cochin Stock Exchange and was a SEBI nominee director of the Cochin Stock Exchange from 2002 to 2007
K George John Independent Director ex-Chairman & Managing Director of TBWA india
George Joseph Independent Director Former chairman and managing director of Syndicate Bank, Certified associate of the Indian Institute of Banking and Finance
Pamela Anna Mathew Additional Director Managing Director of O/E/N India Limited.
Source: Company, Nirmal Bang Institutional Equities Research
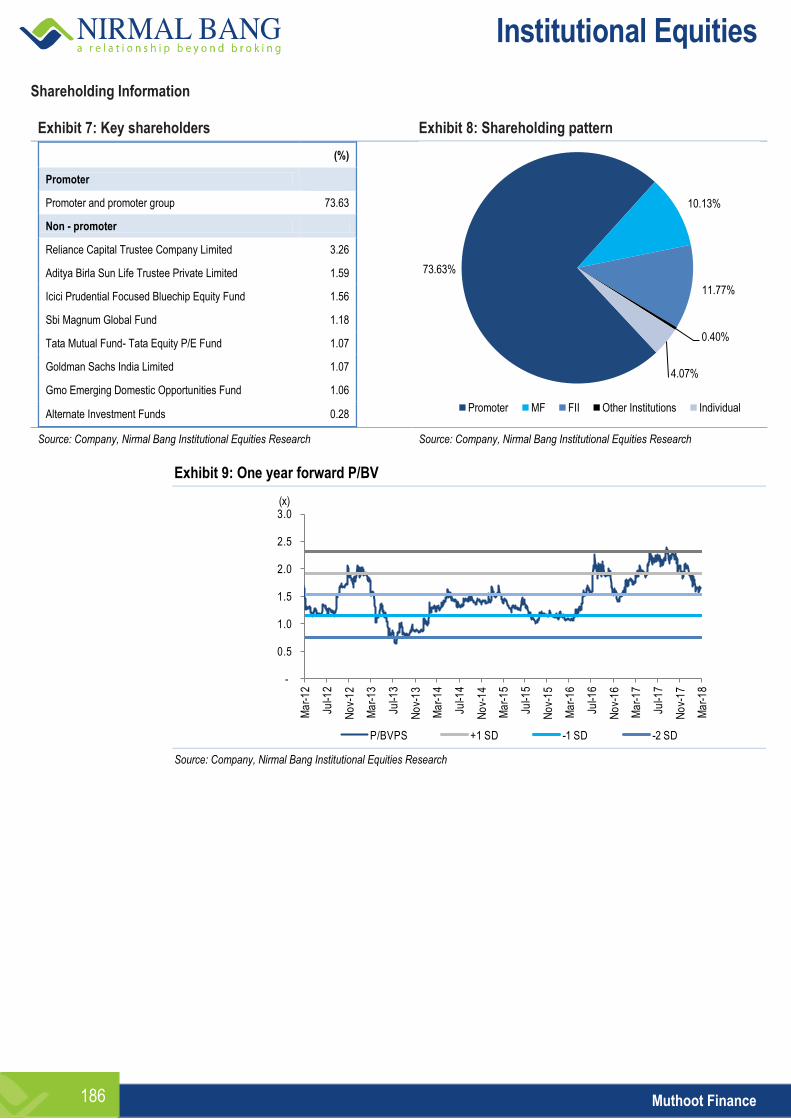
Institutional Equities
Muthoot Finance 186
Shareholding Information Exhibit 7: Key shareholders Exhibit 8: Shareholding pattern
(%)
Promoter
Promoter and promoter group 73.63
Non - promoter
Reliance Capital Trustee Company Limited 3.26
Aditya Birla Sun Life Trustee Private Limited 1.59
Icici Prudential Focused Bluechip Equity Fund 1.56
Sbi Magnum Global Fund 1.18
Tata Mutual Fund- Tata Equity P/E Fund 1.07
Goldman Sachs India Limited 1.07
Gmo Emerging Domestic Opportunities Fund 1.06
Alternate Investment Funds 0.28
Source: Company, Nirmal Bang Institutional Equities Research Source: Company, Nirmal Bang Institutional Equities Research
Exhibit 9: One year forward P/BV
Source: Company, Nirmal Bang Institutional Equities Research
73.63%
10.13%
11.77%
0.40%
4.07%
Promoter MF FII Other Institutions Individual
-
0.5
1.0
1.5
2.0
2.5
3.0
Ma
r-1
2
Jul-1
2
No
v-1
2
Ma
r-1
3
Jul-1
3
No
v-1
3
Ma
r-1
4
Jul-1
4
No
v-1
4
Ma
r-1
5
Jul-1
5
No
v-1
5
Ma
r-1
6
Jul-1
6
No
v-1
6
Ma
r-1
7
Jul-1
7
No
v-1
7
Ma
r-1
8
P/BVPS +1 SD -1 SD -2 SD
(x)
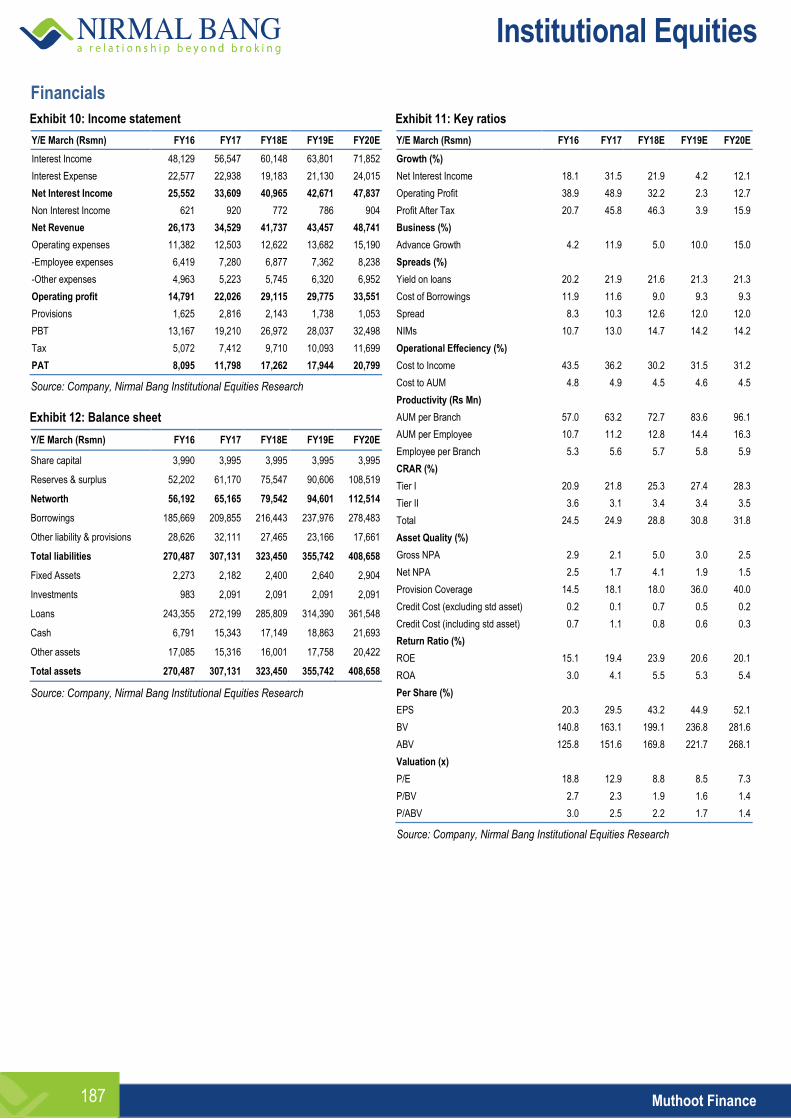
Institutional Equities
Muthoot Finance 187
Financials
Exhibit 10: Income statement
Y/E March (Rsmn) FY16 FY17 FY18E FY19E FY20E
Interest Income 48,129 56,547 60,148 63,801 71,852
Interest Expense 22,577 22,938 19,183 21,130 24,015
Net Interest Income 25,552 33,609 40,965 42,671 47,837
Non Interest Income 621 920 772 786 904
Net Revenue 26,173 34,529 41,737 43,457 48,741
Operating expenses 11,382 12,503 12,622 13,682 15,190
-Employee expenses 6,419 7,280 6,877 7,362 8,238
-Other expenses 4,963 5,223 5,745 6,320 6,952
Operating profit 14,791 22,026 29,115 29,775 33,551
Provisions 1,625 2,816 2,143 1,738 1,053
PBT 13,167 19,210 26,972 28,037 32,498
Tax 5,072 7,412 9,710 10,093 11,699
PAT 8,095 11,798 17,262 17,944 20,799
Source: Company, Nirmal Bang Institutional Equities Research
Exhibit 12: Balance sheet
Y/E March (Rsmn) FY16 FY17 FY18E FY19E FY20E
Share capital 3,990 3,995 3,995 3,995 3,995
Reserves & surplus 52,202 61,170 75,547 90,606 108,519
Networth 56,192 65,165 79,542 94,601 112,514
Borrowings 185,669 209,855 216,443 237,976 278,483
Other liability & provisions 28,626 32,111 27,465 23,166 17,661
Total liabilities 270,487 307,131 323,450 355,742 408,658
Fixed Assets 2,273 2,182 2,400 2,640 2,904
Investments 983 2,091 2,091 2,091 2,091
Loans 243,355 272,199 285,809 314,390 361,548
Cash 6,791 15,343 17,149 18,863 21,693
Other assets 17,085 15,316 16,001 17,758 20,422
Total assets 270,487 307,131 323,450 355,742 408,658
Source: Company, Nirmal Bang Institutional Equities Research
Exhibit 11: Key ratios
Y/E March (Rsmn) FY16 FY17 FY18E FY19E FY20E
Growth (%)
Net Interest Income 18.1 31.5 21.9 4.2 12.1
Operating Profit 38.9 48.9 32.2 2.3 12.7
Profit After Tax 20.7 45.8 46.3 3.9 15.9
Business (%)
Advance Growth 4.2 11.9 5.0 10.0 15.0
Spreads (%)
Yield on loans 20.2 21.9 21.6 21.3 21.3
Cost of Borrowings 11.9 11.6 9.0 9.3 9.3
Spread 8.3 10.3 12.6 12.0 12.0
NIMs 10.7 13.0 14.7 14.2 14.2
Operational Effeciency (%)
Cost to Income 43.5 36.2 30.2 31.5 31.2
Cost to AUM 4.8 4.9 4.5 4.6 4.5
Productivity (Rs Mn)
AUM per Branch 57.0 63.2 72.7 83.6 96.1
AUM per Employee 10.7 11.2 12.8 14.4 16.3
Employee per Branch 5.3 5.6 5.7 5.8 5.9
CRAR (%)
Tier I 20.9 21.8 25.3 27.4 28.3
Tier II 3.6 3.1 3.4 3.4 3.5
Total 24.5 24.9 28.8 30.8 31.8
Asset Quality (%)
Gross NPA 2.9 2.1 5.0 3.0 2.5
Net NPA 2.5 1.7 4.1 1.9 1.5
Provision Coverage 14.5 18.1 18.0 36.0 40.0
Credit Cost (excluding std asset) 0.2 0.1 0.7 0.5 0.2
Credit Cost (including std asset) 0.7 1.1 0.8 0.6 0.3
Return Ratio (%)
ROE 15.1 19.4 23.9 20.6 20.1
ROA 3.0 4.1 5.5 5.3 5.4
Per Share (%)
EPS 20.3 29.5 43.2 44.9 52.1
BV 140.8 163.1 199.1 236.8 281.6
ABV 125.8 151.6 169.8 221.7 268.1
Valuation (x)
P/E 18.8 12.9 8.8 8.5 7.3
P/BV 2.7 2.3 1.9 1.6 1.4
P/ABV 3.0 2.5 2.2 1.7 1.4
Source: Company, Nirmal Bang Institutional Equities Research

Institutional Equities
Muthoot Finance 188
This page has been intentionally left blank
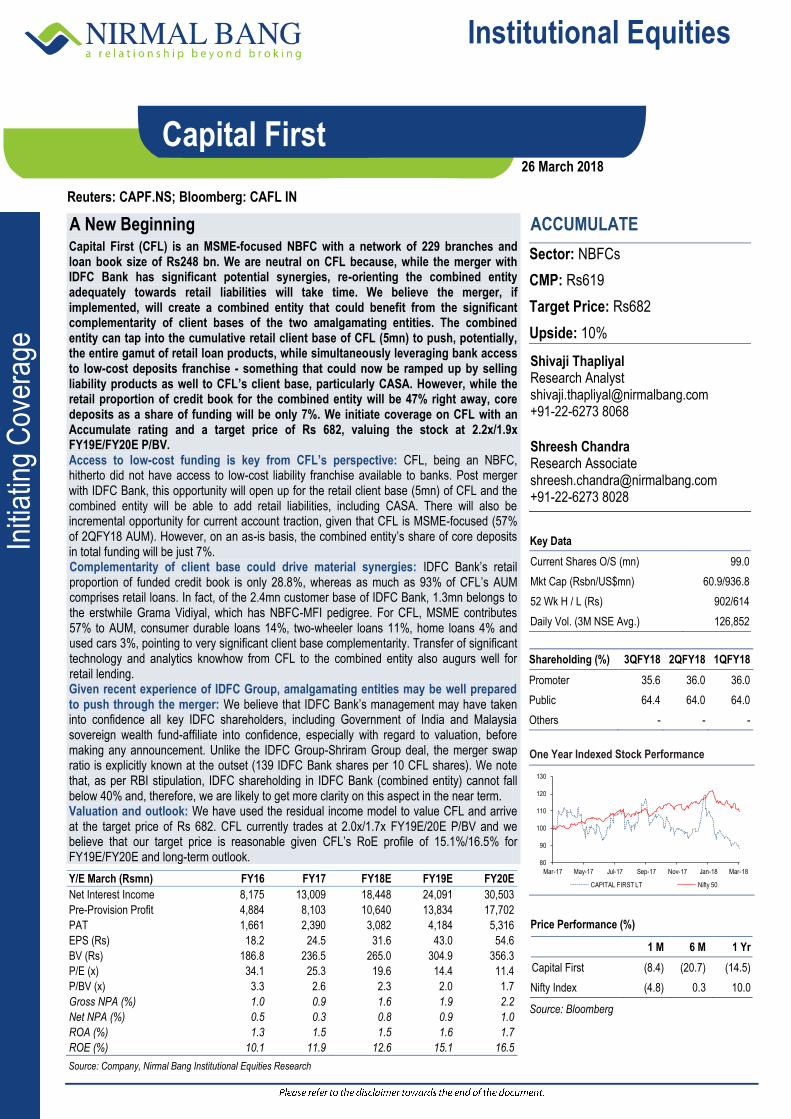
Institutional Equities
Initi
atin
g C
over
age
Reuters: CAPF.NS; Bloomberg: CAFL IN
Capital First
A New Beginning Capital First (CFL) is an MSME-focused NBFC with a network of 229 branches and loan book size of Rs248 bn. We are neutral on CFL because, while the merger with IDFC Bank has significant potential synergies, re-orienting the combined entity adequately towards retail liabilities will take time. We believe the merger, if implemented, will create a combined entity that could benefit from the significant complementarity of client bases of the two amalgamating entities. The combined entity can tap into the cumulative retail client base of CFL (5mn) to push, potentially, the entire gamut of retail loan products, while simultaneously leveraging bank access to low-cost deposits franchise - something that could now be ramped up by selling liability products as well to CFL’s client base, particularly CASA. However, while the retail proportion of credit book for the combined entity will be 47% right away, core deposits as a share of funding will be only 7%. We initiate coverage on CFL with an Accumulate rating and a target price of Rs 682, valuing the stock at 2.2x/1.9x FY19E/FY20E P/BV. Access to low-cost funding is key from CFL’s perspective: CFL, being an NBFC, hitherto did not have access to low-cost liability franchise available to banks. Post merger with IDFC Bank, this opportunity will open up for the retail client base (5mn) of CFL and the combined entity will be able to add retail liabilities, including CASA. There will also be incremental opportunity for current account traction, given that CFL is MSME-focused (57% of 2QFY18 AUM). However, on an as-is basis, the combined entity’s share of core deposits in total funding will be just 7%. Complementarity of client base could drive material synergies: IDFC Bank’s retail proportion of funded credit book is only 28.8%, whereas as much as 93% of CFL’s AUM comprises retail loans. In fact, of the 2.4mn customer base of IDFC Bank, 1.3mn belongs to the erstwhile Grama Vidiyal, which has NBFC-MFI pedigree. For CFL, MSME contributes 57% to AUM, consumer durable loans 14%, two-wheeler loans 11%, home loans 4% and used cars 3%, pointing to very significant client base complementarity. Transfer of significant technology and analytics knowhow from CFL to the combined entity also augurs well for retail lending. Given recent experience of IDFC Group, amalgamating entities may be well prepared to push through the merger: We believe that IDFC Bank’s management may have taken into confidence all key IDFC shareholders, including Government of India and Malaysia sovereign wealth fund-affiliate into confidence, especially with regard to valuation, before making any announcement. Unlike the IDFC Group-Shriram Group deal, the merger swap ratio is explicitly known at the outset (139 IDFC Bank shares per 10 CFL shares). We note that, as per RBI stipulation, IDFC shareholding in IDFC Bank (combined entity) cannot fall below 40% and, therefore, we are likely to get more clarity on this aspect in the near term. Valuation and outlook: We have used the residual income model to value CFL and arrive at the target price of Rs 682. CFL currently trades at 2.0x/1.7x FY19E/20E P/BV and we believe that our target price is reasonable given CFL’s RoE profile of 15.1%/16.5% for FY19E/FY20E and long-term outlook.
ACCUMULATE
Sector: NBFCs
CMP: Rs619
Target Price: Rs682
Upside: 10%
Shivaji Thapliyal Research Analyst [email protected] +91-22-6273 8068 Shreesh Chandra Research Associate [email protected] +91-22-6273 8028
Key Data
Current Shares O/S (mn) 99.0
Mkt Cap (Rsbn/US$mn) 60.9/936.8
52 Wk H / L (Rs) 902/614
Daily Vol. (3M NSE Avg.) 126,852
Shareholding (%) 3QFY18 2QFY18 1QFY18
Promoter 35.6 36.0 36.0
Public 64.4 64.0 64.0
Others - - -
One Year Indexed Stock Performance
Price Performance (%)
1 M 6 M 1 Yr
Capital First (8.4) (20.7) (14.5)
Nifty Index (4.8) 0.3 10.0
Source: Bloomberg
Y/E March (Rsmn) FY16 FY17 FY18E FY19E FY20E
Net Interest Income 8,175 13,009 18,448 24,091 30,503
Pre-Provision Profit 4,884 8,103 10,640 13,834 17,702
PAT 1,661 2,390 3,082 4,184 5,316
EPS (Rs) 18.2 24.5 31.6 43.0 54.6
BV (Rs) 186.8 236.5 265.0 304.9 356.3
P/E (x) 34.1 25.3 19.6 14.4 11.4
P/BV (x) 3.3 2.6 2.3 2.0 1.7
Gross NPA (%) 1.0 0.9 1.6 1.9 2.2
Net NPA (%) 0.5 0.3 0.8 0.9 1.0
ROA (%) 1.3 1.5 1.5 1.6 1.7
ROE (%) 10.1 11.9 12.6 15.1 16.5
Source: Company, Nirmal Bang Institutional Equities Research
80
90
100
110
120
130
Mar-17 May-17 Jul-17 Sep-17 Nov-17 Jan-18 Mar-18
CAPITAL FIRST LT Nifty 50
26 March 2018
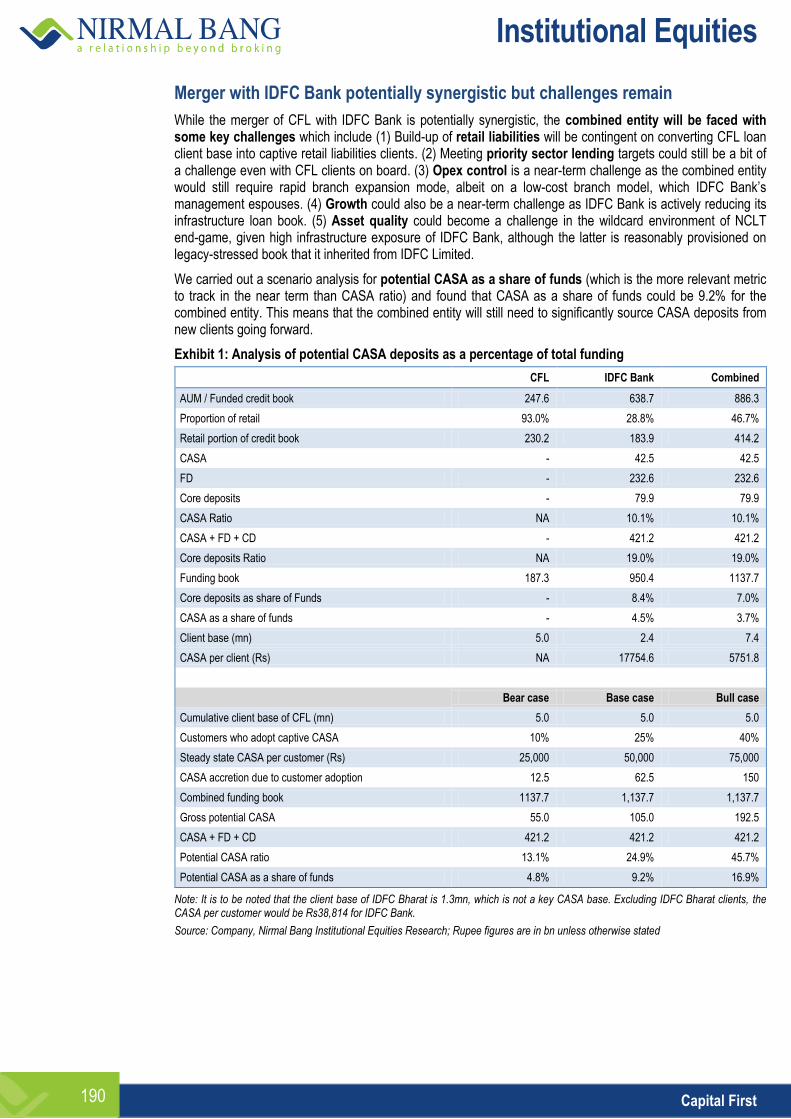
Institutional Equities
Capital First 190
Merger with IDFC Bank potentially synergistic but challenges remain
While the merger of CFL with IDFC Bank is potentially synergistic, the combined entity will be faced with some key challenges which include (1) Build-up of retail liabilities will be contingent on converting CFL loan client base into captive retail liabilities clients. (2) Meeting priority sector lending targets could still be a bit of a challenge even with CFL clients on board. (3) Opex control is a near-term challenge as the combined entity would still require rapid branch expansion mode, albeit on a low-cost branch model, which IDFC Bank’s management espouses. (4) Growth could also be a near-term challenge as IDFC Bank is actively reducing its infrastructure loan book. (5) Asset quality could become a challenge in the wildcard environment of NCLT end-game, given high infrastructure exposure of IDFC Bank, although the latter is reasonably provisioned on legacy-stressed book that it inherited from IDFC Limited.
We carried out a scenario analysis for potential CASA as a share of funds (which is the more relevant metric to track in the near term than CASA ratio) and found that CASA as a share of funds could be 9.2% for the combined entity. This means that the combined entity will still need to significantly source CASA deposits from new clients going forward.
Exhibit 1: Analysis of potential CASA deposits as a percentage of total funding
CFL IDFC Bank Combined
AUM / Funded credit book 247.6 638.7 886.3
Proportion of retail 93.0% 28.8% 46.7%
Retail portion of credit book 230.2 183.9 414.2
CASA - 42.5 42.5
FD - 232.6 232.6
Core deposits - 79.9 79.9
CASA Ratio NA 10.1% 10.1%
CASA + FD + CD - 421.2 421.2
Core deposits Ratio NA 19.0% 19.0%
Funding book 187.3 950.4 1137.7
Core deposits as share of Funds - 8.4% 7.0%
CASA as a share of funds - 4.5% 3.7%
Client base (mn) 5.0 2.4 7.4
CASA per client (Rs) NA 17754.6 5751.8
Bear case Base case Bull case
Cumulative client base of CFL (mn) 5.0 5.0 5.0
Customers who adopt captive CASA 10% 25% 40%
Steady state CASA per customer (Rs) 25,000 50,000 75,000
CASA accretion due to customer adoption 12.5 62.5 150
Combined funding book 1137.7 1,137.7 1,137.7
Gross potential CASA 55.0 105.0 192.5
CASA + FD + CD 421.2 421.2 421.2
Potential CASA ratio 13.1% 24.9% 45.7%
Potential CASA as a share of funds 4.8% 9.2% 16.9%
Note: It is to be noted that the client base of IDFC Bharat is 1.3mn, which is not a key CASA base. Excluding IDFC Bharat clients, the CASA per customer would be Rs38,814 for IDFC Bank.
Source: Company, Nirmal Bang Institutional Equities Research; Rupee figures are in bn unless otherwise stated
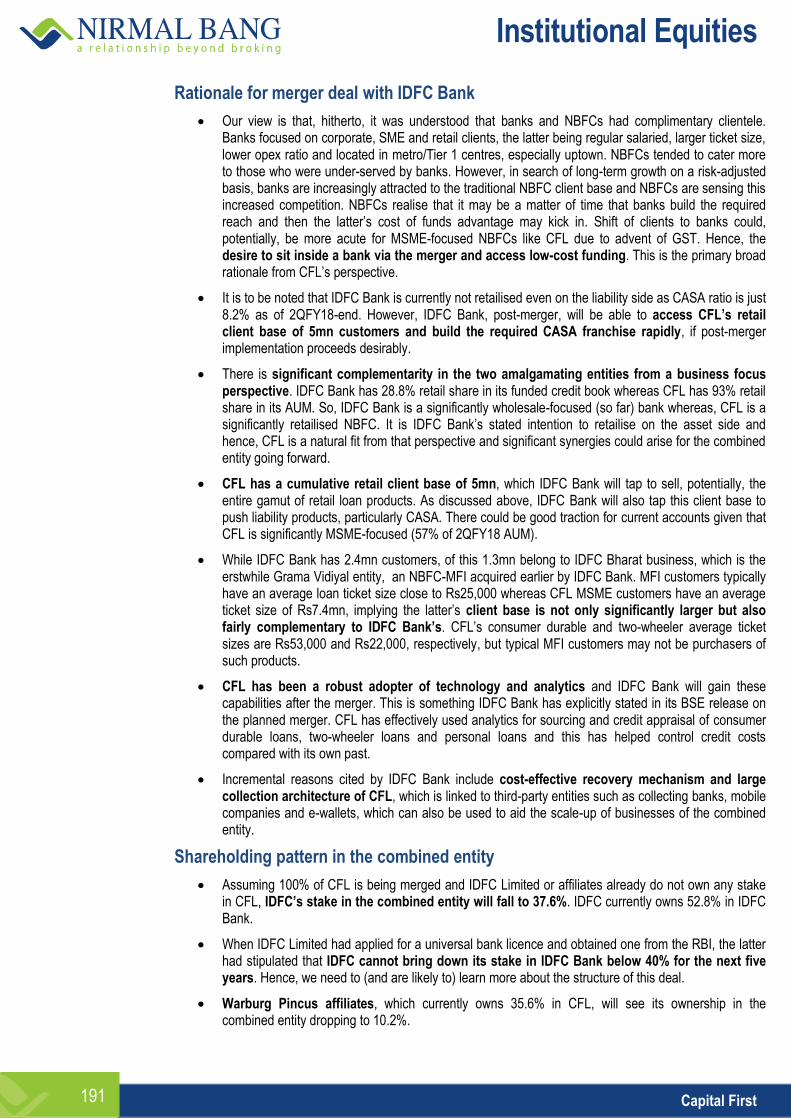
Institutional Equities
Capital First 191
Rationale for merger deal with IDFC Bank
Our view is that, hitherto, it was understood that banks and NBFCs had complimentary clientele. Banks focused on corporate, SME and retail clients, the latter being regular salaried, larger ticket size, lower opex ratio and located in metro/Tier 1 centres, especially uptown. NBFCs tended to cater more to those who were under-served by banks. However, in search of long-term growth on a risk-adjusted basis, banks are increasingly attracted to the traditional NBFC client base and NBFCs are sensing this increased competition. NBFCs realise that it may be a matter of time that banks build the required reach and then the latter’s cost of funds advantage may kick in. Shift of clients to banks could, potentially, be more acute for MSME-focused NBFCs like CFL due to advent of GST. Hence, the desire to sit inside a bank via the merger and access low-cost funding. This is the primary broad rationale from CFL’s perspective.
It is to be noted that IDFC Bank is currently not retailised even on the liability side as CASA ratio is just 8.2% as of 2QFY18-end. However, IDFC Bank, post-merger, will be able to access CFL’s retail client base of 5mn customers and build the required CASA franchise rapidly, if post-merger implementation proceeds desirably.
There is significant complementarity in the two amalgamating entities from a business focus perspective. IDFC Bank has 28.8% retail share in its funded credit book whereas CFL has 93% retail share in its AUM. So, IDFC Bank is a significantly wholesale-focused (so far) bank whereas, CFL is a significantly retailised NBFC. It is IDFC Bank’s stated intention to retailise on the asset side and hence, CFL is a natural fit from that perspective and significant synergies could arise for the combined entity going forward.
CFL has a cumulative retail client base of 5mn, which IDFC Bank will tap to sell, potentially, the entire gamut of retail loan products. As discussed above, IDFC Bank will also tap this client base to push liability products, particularly CASA. There could be good traction for current accounts given that CFL is significantly MSME-focused (57% of 2QFY18 AUM).
While IDFC Bank has 2.4mn customers, of this 1.3mn belong to IDFC Bharat business, which is the erstwhile Grama Vidiyal entity, an NBFC-MFI acquired earlier by IDFC Bank. MFI customers typically have an average loan ticket size close to Rs25,000 whereas CFL MSME customers have an average ticket size of Rs7.4mn, implying the latter’s client base is not only significantly larger but also fairly complementary to IDFC Bank’s. CFL’s consumer durable and two-wheeler average ticket sizes are Rs53,000 and Rs22,000, respectively, but typical MFI customers may not be purchasers of such products.
CFL has been a robust adopter of technology and analytics and IDFC Bank will gain these capabilities after the merger. This is something IDFC Bank has explicitly stated in its BSE release on the planned merger. CFL has effectively used analytics for sourcing and credit appraisal of consumer durable loans, two-wheeler loans and personal loans and this has helped control credit costs compared with its own past.
Incremental reasons cited by IDFC Bank include cost-effective recovery mechanism and large collection architecture of CFL, which is linked to third-party entities such as collecting banks, mobile companies and e-wallets, which can also be used to aid the scale-up of businesses of the combined entity.
Shareholding pattern in the combined entity
Assuming 100% of CFL is being merged and IDFC Limited or affiliates already do not own any stake in CFL, IDFC’s stake in the combined entity will fall to 37.6%. IDFC currently owns 52.8% in IDFC Bank.
When IDFC Limited had applied for a universal bank licence and obtained one from the RBI, the latter had stipulated that IDFC cannot bring down its stake in IDFC Bank below 40% for the next five years. Hence, we need to (and are likely to) learn more about the structure of this deal.
Warburg Pincus affiliates, which currently owns 35.6% in CFL, will see its ownership in the combined entity dropping to 10.2%.
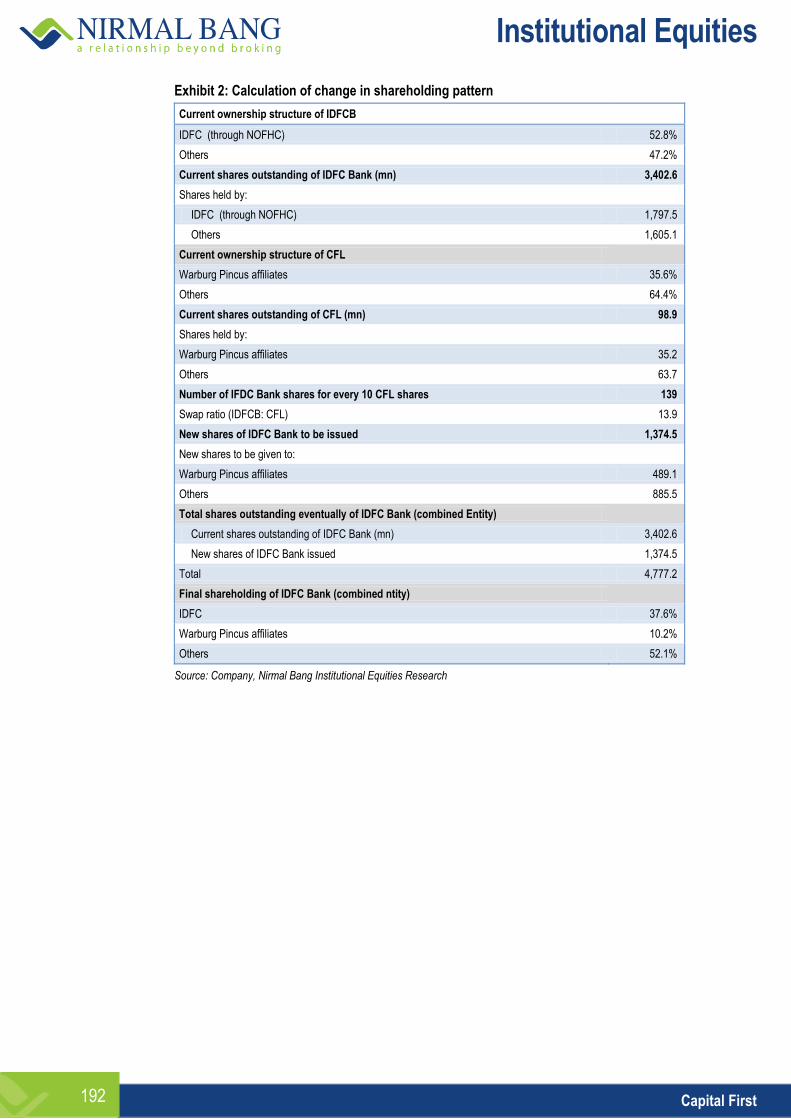
Institutional Equities
Capital First 192
Exhibit 2: Calculation of change in shareholding pattern
Current ownership structure of IDFCB
IDFC (through NOFHC) 52.8%
Others 47.2%
Current shares outstanding of IDFC Bank (mn) 3,402.6
Shares held by:
IDFC (through NOFHC) 1,797.5
Others 1,605.1
Current ownership structure of CFL
Warburg Pincus affiliates 35.6%
Others 64.4%
Current shares outstanding of CFL (mn) 98.9
Shares held by:
Warburg Pincus affiliates 35.2
Others 63.7
Number of IFDC Bank shares for every 10 CFL shares 139
Swap ratio (IDFCB: CFL) 13.9
New shares of IDFC Bank to be issued 1,374.5
New shares to be given to:
Warburg Pincus affiliates 489.1
Others 885.5
Total shares outstanding eventually of IDFC Bank (combined Entity)
Current shares outstanding of IDFC Bank (mn) 3,402.6
New shares of IDFC Bank issued 1,374.5
Total 4,777.2
Final shareholding of IDFC Bank (combined ntity)
IDFC 37.6%
Warburg Pincus affiliates 10.2%
Others 52.1%
Source: Company, Nirmal Bang Institutional Equities Research
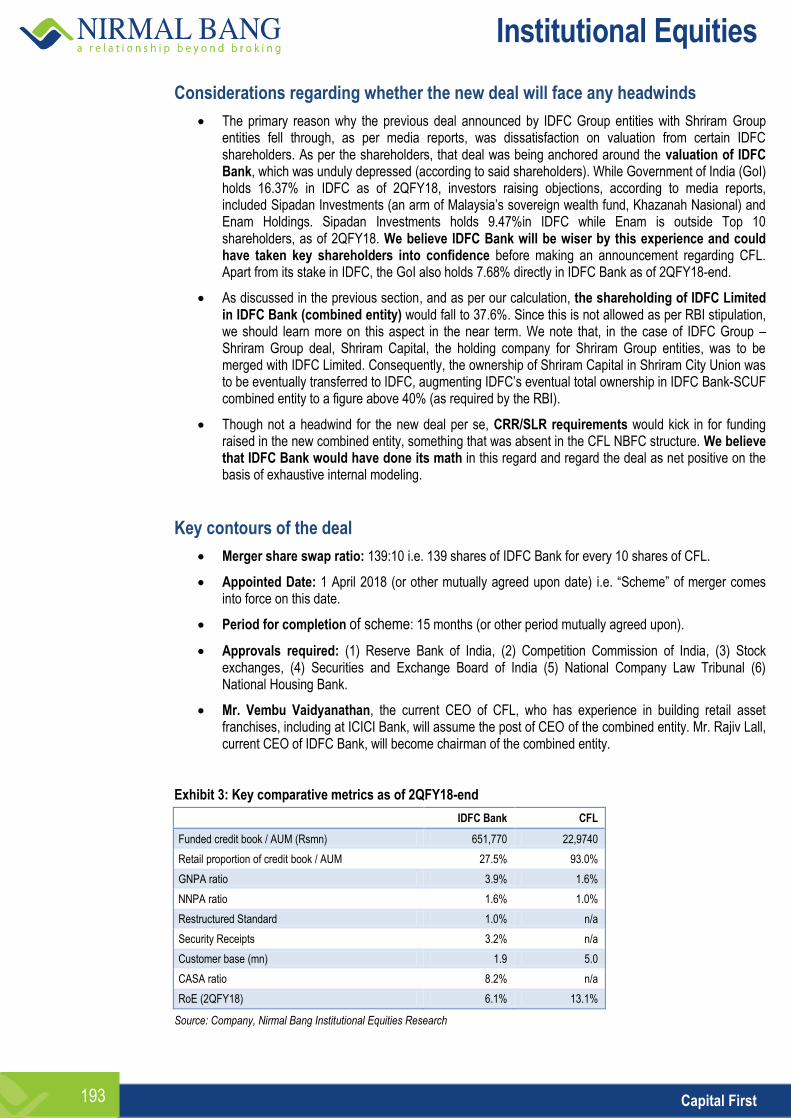
Institutional Equities
Capital First 193
Considerations regarding whether the new deal will face any headwinds
The primary reason why the previous deal announced by IDFC Group entities with Shriram Group entities fell through, as per media reports, was dissatisfaction on valuation from certain IDFC shareholders. As per the shareholders, that deal was being anchored around the valuation of IDFC Bank, which was unduly depressed (according to said shareholders). While Government of India (GoI) holds 16.37% in IDFC as of 2QFY18, investors raising objections, according to media reports, included Sipadan Investments (an arm of Malaysia’s sovereign wealth fund, Khazanah Nasional) and Enam Holdings. Sipadan Investments holds 9.47%in IDFC while Enam is outside Top 10 shareholders, as of 2QFY18. We believe IDFC Bank will be wiser by this experience and could have taken key shareholders into confidence before making an announcement regarding CFL. Apart from its stake in IDFC, the GoI also holds 7.68% directly in IDFC Bank as of 2QFY18-end.
As discussed in the previous section, and as per our calculation, the shareholding of IDFC Limited in IDFC Bank (combined entity) would fall to 37.6%. Since this is not allowed as per RBI stipulation, we should learn more on this aspect in the near term. We note that, in the case of IDFC Group – Shriram Group deal, Shriram Capital, the holding company for Shriram Group entities, was to be merged with IDFC Limited. Consequently, the ownership of Shriram Capital in Shriram City Union was to be eventually transferred to IDFC, augmenting IDFC’s eventual total ownership in IDFC Bank-SCUF combined entity to a figure above 40% (as required by the RBI).
Though not a headwind for the new deal per se, CRR/SLR requirements would kick in for funding raised in the new combined entity, something that was absent in the CFL NBFC structure. We believe that IDFC Bank would have done its math in this regard and regard the deal as net positive on the basis of exhaustive internal modeling.
Key contours of the deal
Merger share swap ratio: 139:10 i.e. 139 shares of IDFC Bank for every 10 shares of CFL.
Appointed Date: 1 April 2018 (or other mutually agreed upon date) i.e. “Scheme” of merger comes into force on this date.
Period for completion of scheme: 15 months (or other period mutually agreed upon).
Approvals required: (1) Reserve Bank of India, (2) Competition Commission of India, (3) Stock exchanges, (4) Securities and Exchange Board of India (5) National Company Law Tribunal (6) National Housing Bank.
Mr. Vembu Vaidyanathan, the current CEO of CFL, who has experience in building retail asset franchises, including at ICICI Bank, will assume the post of CEO of the combined entity. Mr. Rajiv Lall, current CEO of IDFC Bank, will become chairman of the combined entity.
Exhibit 3: Key comparative metrics as of 2QFY18-end
IDFC Bank CFL
Funded credit book / AUM (Rsmn) 651,770 22,9740
Retail proportion of credit book / AUM 27.5% 93.0%
GNPA ratio 3.9% 1.6%
NNPA ratio 1.6% 1.0%
Restructured Standard 1.0% n/a
Security Receipts 3.2% n/a
Customer base (mn) 1.9 5.0
CASA ratio 8.2% n/a
RoE (2QFY18) 6.1% 13.1%
Source: Company, Nirmal Bang Institutional Equities Research
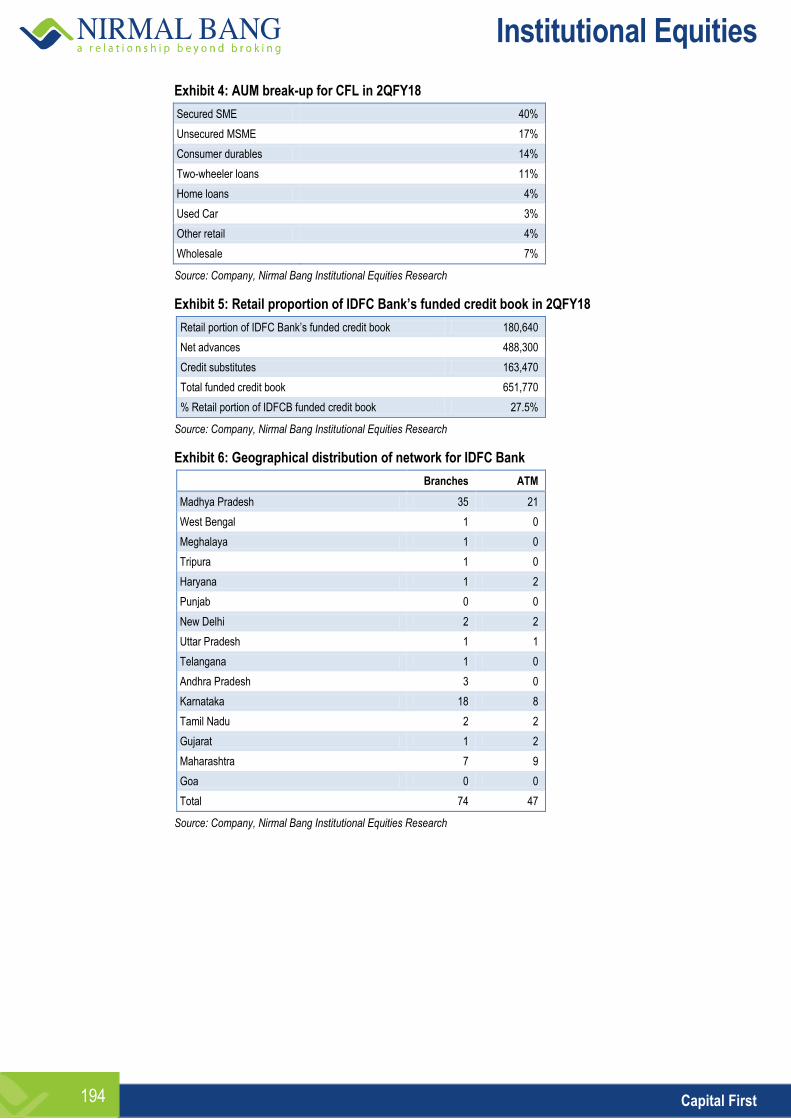
Institutional Equities
Capital First 194
Exhibit 4: AUM break-up for CFL in 2QFY18
Secured SME 40%
Unsecured MSME 17%
Consumer durables 14%
Two-wheeler loans 11%
Home loans 4%
Used Car 3%
Other retail 4%
Wholesale 7%
Source: Company, Nirmal Bang Institutional Equities Research
Exhibit 5: Retail proportion of IDFC Bank’s funded credit book in 2QFY18
Retail portion of IDFC Bank’s funded credit book 180,640
Net advances 488,300
Credit substitutes 163,470
Total funded credit book 651,770
% Retail portion of IDFCB funded credit book 27.5%
Source: Company, Nirmal Bang Institutional Equities Research
Exhibit 6: Geographical distribution of network for IDFC Bank
Branches ATM
Madhya Pradesh 35 21
West Bengal 1 0
Meghalaya 1 0
Tripura 1 0
Haryana 1 2
Punjab 0 0
New Delhi 2 2
Uttar Pradesh 1 1
Telangana 1 0
Andhra Pradesh 3 0
Karnataka 18 8
Tamil Nadu 2 2
Gujarat 1 2
Maharashtra 7 9
Goa 0 0
Total 74 47
Source: Company, Nirmal Bang Institutional Equities Research
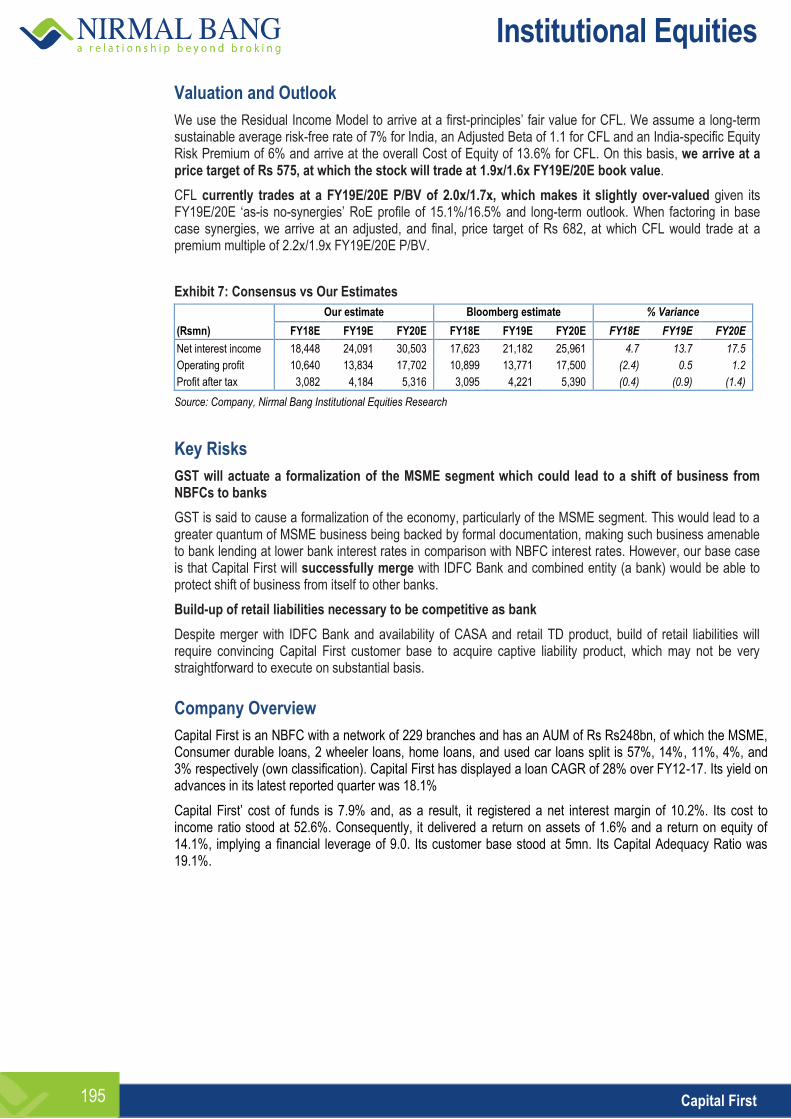
Institutional Equities
Capital First 195
Valuation and Outlook
We use the Residual Income Model to arrive at a first-principles’ fair value for CFL. We assume a long-term sustainable average risk-free rate of 7% for India, an Adjusted Beta of 1.1 for CFL and an India-specific Equity Risk Premium of 6% and arrive at the overall Cost of Equity of 13.6% for CFL. On this basis, we arrive at a price target of Rs 575, at which the stock will trade at 1.9x/1.6x FY19E/20E book value.
CFL currently trades at a FY19E/20E P/BV of 2.0x/1.7x, which makes it slightly over-valued given its FY19E/20E ‘as-is no-synergies’ RoE profile of 15.1%/16.5% and long-term outlook. When factoring in base case synergies, we arrive at an adjusted, and final, price target of Rs 682, at which CFL would trade at a premium multiple of 2.2x/1.9x FY19E/20E P/BV.
Exhibit 7: Consensus vs Our Estimates
Our estimate Bloomberg estimate % Variance
(Rsmn) FY18E FY19E FY20E FY18E FY19E FY20E FY18E FY19E FY20E
Net interest income 18,448 24,091 30,503 17,623 21,182 25,961 4.7 13.7 17.5
Operating profit 10,640 13,834 17,702 10,899 13,771 17,500 (2.4) 0.5 1.2
Profit after tax 3,082 4,184 5,316 3,095 4,221 5,390 (0.4) (0.9) (1.4)
Source: Company, Nirmal Bang Institutional Equities Research
Key Risks
GST will actuate a formalization of the MSME segment which could lead to a shift of business from NBFCs to banks
GST is said to cause a formalization of the economy, particularly of the MSME segment. This would lead to a greater quantum of MSME business being backed by formal documentation, making such business amenable to bank lending at lower bank interest rates in comparison with NBFC interest rates. However, our base case is that Capital First will successfully merge with IDFC Bank and combined entity (a bank) would be able to protect shift of business from itself to other banks.
Build-up of retail liabilities necessary to be competitive as bank
Despite merger with IDFC Bank and availability of CASA and retail TD product, build of retail liabilities will require convincing Capital First customer base to acquire captive liability product, which may not be very straightforward to execute on substantial basis.
Company Overview
Capital First is an NBFC with a network of 229 branches and has an AUM of Rs Rs248bn, of which the MSME, Consumer durable loans, 2 wheeler loans, home loans, and used car loans split is 57%, 14%, 11%, 4%, and 3% respectively (own classification). Capital First has displayed a loan CAGR of 28% over FY12-17. Its yield on advances in its latest reported quarter was 18.1%
Capital First’ cost of funds is 7.9% and, as a result, it registered a net interest margin of 10.2%. Its cost to income ratio stood at 52.6%. Consequently, it delivered a return on assets of 1.6% and a return on equity of 14.1%, implying a financial leverage of 9.0. Its customer base stood at 5mn. Its Capital Adequacy Ratio was 19.1%.
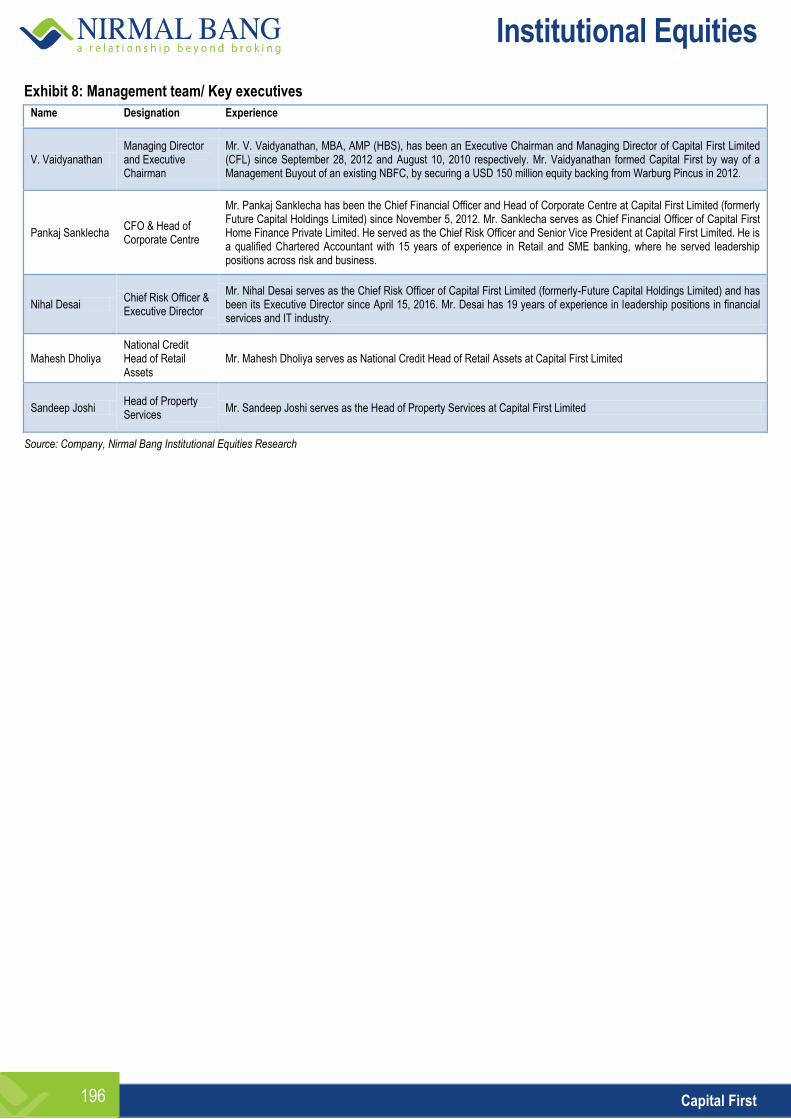
Institutional Equities
Capital First 196
Exhibit 8: Management team/ Key executives Name Designation Experience
V. Vaidyanathan Managing Director and Executive Chairman
Mr. V. Vaidyanathan, MBA, AMP (HBS), has been an Executive Chairman and Managing Director of Capital First Limited (CFL) since September 28, 2012 and August 10, 2010 respectively. Mr. Vaidyanathan formed Capital First by way of a Management Buyout of an existing NBFC, by securing a USD 150 million equity backing from Warburg Pincus in 2012.
Pankaj Sanklecha CFO & Head of Corporate Centre
Mr. Pankaj Sanklecha has been the Chief Financial Officer and Head of Corporate Centre at Capital First Limited (formerly Future Capital Holdings Limited) since November 5, 2012. Mr. Sanklecha serves as Chief Financial Officer of Capital First Home Finance Private Limited. He served as the Chief Risk Officer and Senior Vice President at Capital First Limited. He is a qualified Chartered Accountant with 15 years of experience in Retail and SME banking, where he served leadership positions across risk and business.
Nihal Desai Chief Risk Officer & Executive Director
Mr. Nihal Desai serves as the Chief Risk Officer of Capital First Limited (formerly-Future Capital Holdings Limited) and has been its Executive Director since April 15, 2016. Mr. Desai has 19 years of experience in leadership positions in financial services and IT industry.
Mahesh Dholiya National Credit Head of Retail Assets
Mr. Mahesh Dholiya serves as National Credit Head of Retail Assets at Capital First Limited
Sandeep Joshi Head of Property Services
Mr. Sandeep Joshi serves as the Head of Property Services at Capital First Limited
Source: Company, Nirmal Bang Institutional Equities Research
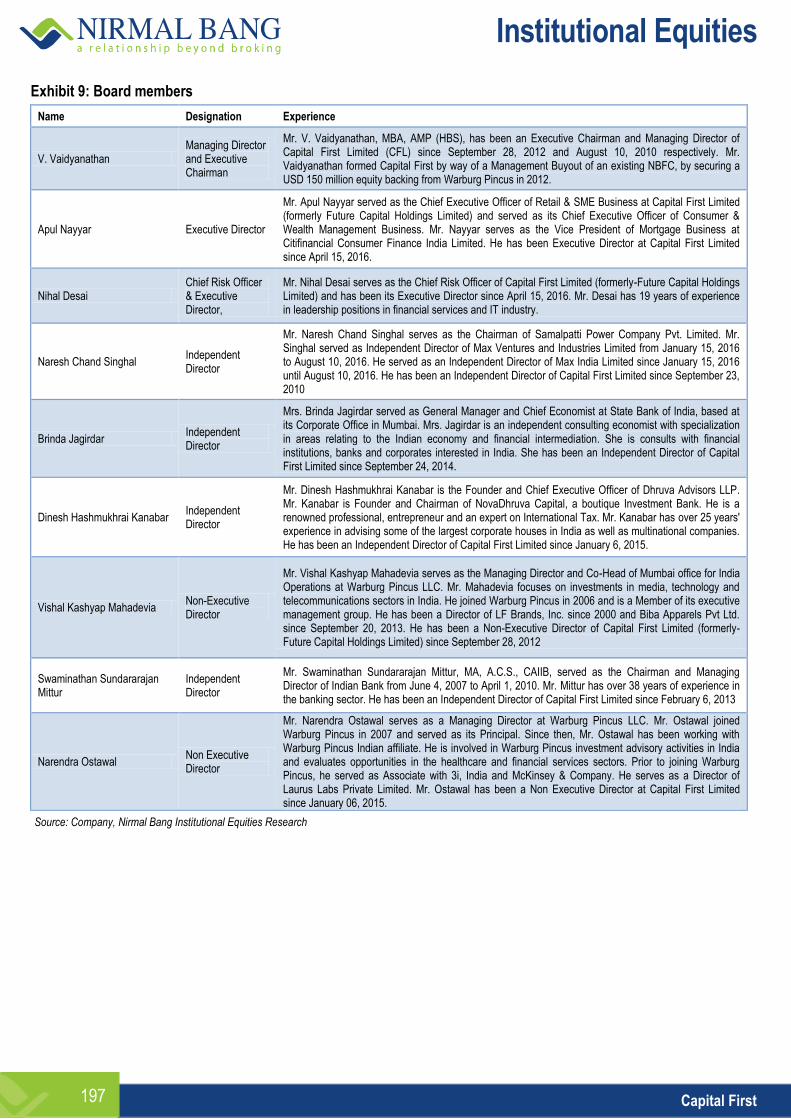
Institutional Equities
Capital First 197
Exhibit 9: Board members
Name Designation Experience
V. Vaidyanathan Managing Director and Executive Chairman
Mr. V. Vaidyanathan, MBA, AMP (HBS), has been an Executive Chairman and Managing Director of Capital First Limited (CFL) since September 28, 2012 and August 10, 2010 respectively. Mr. Vaidyanathan formed Capital First by way of a Management Buyout of an existing NBFC, by securing a USD 150 million equity backing from Warburg Pincus in 2012.
Apul Nayyar Executive Director
Mr. Apul Nayyar served as the Chief Executive Officer of Retail & SME Business at Capital First Limited (formerly Future Capital Holdings Limited) and served as its Chief Executive Officer of Consumer & Wealth Management Business. Mr. Nayyar serves as the Vice President of Mortgage Business at Citifinancial Consumer Finance India Limited. He has been Executive Director at Capital First Limited since April 15, 2016.
Nihal Desai Chief Risk Officer & Executive Director,
Mr. Nihal Desai serves as the Chief Risk Officer of Capital First Limited (formerly-Future Capital Holdings Limited) and has been its Executive Director since April 15, 2016. Mr. Desai has 19 years of experience in leadership positions in financial services and IT industry.
Naresh Chand Singhal Independent Director
Mr. Naresh Chand Singhal serves as the Chairman of Samalpatti Power Company Pvt. Limited. Mr. Singhal served as Independent Director of Max Ventures and Industries Limited from January 15, 2016 to August 10, 2016. He served as an Independent Director of Max India Limited since January 15, 2016 until August 10, 2016. He has been an Independent Director of Capital First Limited since September 23, 2010
Brinda Jagirdar Independent Director
Mrs. Brinda Jagirdar served as General Manager and Chief Economist at State Bank of India, based at its Corporate Office in Mumbai. Mrs. Jagirdar is an independent consulting economist with specialization in areas relating to the Indian economy and financial intermediation. She is consults with financial institutions, banks and corporates interested in India. She has been an Independent Director of Capital First Limited since September 24, 2014.
Dinesh Hashmukhrai Kanabar Independent Director
Mr. Dinesh Hashmukhrai Kanabar is the Founder and Chief Executive Officer of Dhruva Advisors LLP. Mr. Kanabar is Founder and Chairman of NovaDhruva Capital, a boutique Investment Bank. He is a renowned professional, entrepreneur and an expert on International Tax. Mr. Kanabar has over 25 years' experience in advising some of the largest corporate houses in India as well as multinational companies. He has been an Independent Director of Capital First Limited since January 6, 2015.
Vishal Kashyap Mahadevia Non-Executive Director
Mr. Vishal Kashyap Mahadevia serves as the Managing Director and Co-Head of Mumbai office for India Operations at Warburg Pincus LLC. Mr. Mahadevia focuses on investments in media, technology and telecommunications sectors in India. He joined Warburg Pincus in 2006 and is a Member of its executive management group. He has been a Director of LF Brands, Inc. since 2000 and Biba Apparels Pvt Ltd. since September 20, 2013. He has been a Non-Executive Director of Capital First Limited (formerly-Future Capital Holdings Limited) since September 28, 2012
Swaminathan Sundararajan Mittur
Independent Director
Mr. Swaminathan Sundararajan Mittur, MA, A.C.S., CAIIB, served as the Chairman and Managing Director of Indian Bank from June 4, 2007 to April 1, 2010. Mr. Mittur has over 38 years of experience in the banking sector. He has been an Independent Director of Capital First Limited since February 6, 2013
Narendra Ostawal Non Executive Director
Mr. Narendra Ostawal serves as a Managing Director at Warburg Pincus LLC. Mr. Ostawal joined Warburg Pincus in 2007 and served as its Principal. Since then, Mr. Ostawal has been working with Warburg Pincus Indian affiliate. He is involved in Warburg Pincus investment advisory activities in India and evaluates opportunities in the healthcare and financial services sectors. Prior to joining Warburg Pincus, he served as Associate with 3i, India and McKinsey & Company. He serves as a Director of Laurus Labs Private Limited. Mr. Ostawal has been a Non Executive Director at Capital First Limited since January 06, 2015.
Source: Company, Nirmal Bang Institutional Equities Research
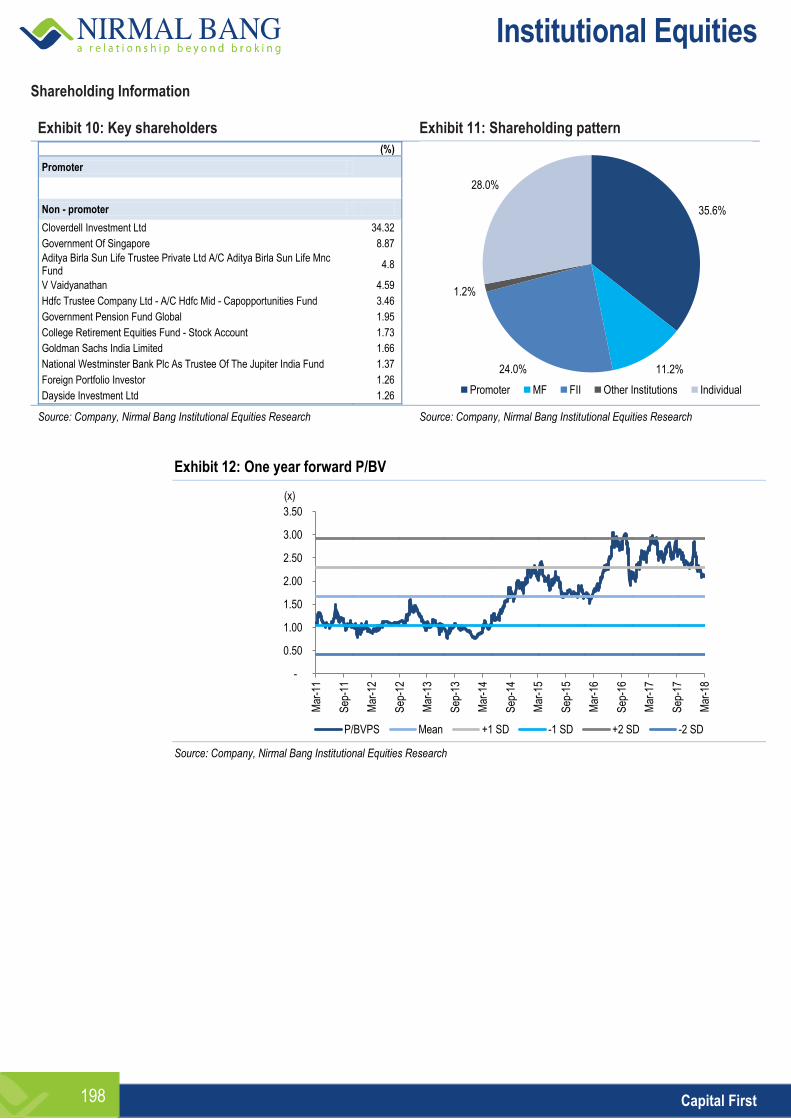
Institutional Equities
Capital First 198
Shareholding Information Exhibit 10: Key shareholders Exhibit 11: Shareholding pattern
(%)
Promoter
Non - promoter
Cloverdell Investment Ltd 34.32
Government Of Singapore 8.87
Aditya Birla Sun Life Trustee Private Ltd A/C Aditya Birla Sun Life Mnc Fund
4.8
V Vaidyanathan 4.59
Hdfc Trustee Company Ltd - A/C Hdfc Mid - Capopportunities Fund 3.46
Government Pension Fund Global 1.95
College Retirement Equities Fund - Stock Account 1.73
Goldman Sachs India Limited 1.66
National Westminster Bank Plc As Trustee Of The Jupiter India Fund 1.37
Foreign Portfolio Investor 1.26
Dayside Investment Ltd 1.26 Source: Company, Nirmal Bang Institutional Equities Research Source: Company, Nirmal Bang Institutional Equities Research
Exhibit 12: One year forward P/BV
Source: Company, Nirmal Bang Institutional Equities Research
35.6%
11.2% 24.0%
1.2%
28.0%
Promoter MF FII Other Institutions Individual
-
0.50
1.00
1.50
2.00
2.50
3.00
3.50
Mar
-11
Sep
-11
Mar
-12
Sep
-12
Mar
-13
Sep
-13
Mar
-14
Sep
-14
Mar
-15
Sep
-15
Mar
-16
Sep
-16
Mar
-17
Sep
-17
Mar
-18
P/BVPS Mean +1 SD -1 SD +2 SD -2 SD
(x)
Institutional Equities
Capital First 199
Financials
Exhibit 13: Income statement
Y/E March (Rsmn) FY16 FY17 FY18E FY19E FY20E
Interest Income 17,147 24,615 32,014 41,016 52,091
Interest Expense 8,972 11,606 13,566 16,926 21,588
Net Interest Income 8,175 13,009 18,448 24,091 30,503
Non Interest Income 1,741 3,393 4,230 5,359 6,766
Net Revenue 9,916 16,402 22,678 29,450 37,269
Operating expenses 5,032 8,299 12,038 15,616 19,567
-Employee expenses 1,764 2,394 3,181 4,101 5,174
-Other expenses 3,268 5,905 8,858 11,515 14,393
Operating profit 4,884 8,103 10,640 13,834 17,702
Provisions 2,364 4,529 6,237 7,856 10,108
PBT 2,520 3,574 4,403 5,977 7,594
Tax 859 1,184 1,321 1,793 2,278
PAT 1,661 2,390 3,082 4,184 5,316
Source: Company, Nirmal Bang Institutional Equities Research
Exhibit 15: Balance sheet
Y/E March (Rsmn) FY16 FY17 FY18E FY19E FY20E
Share capital 912 974 974 974 974
Reserves & surplus 16,121 22,064 24,841 28,720 33,730
Networth 17,033 23,038 25,815 29,694 34,704
Borrowings 119,549 141,081 185,566 237,249 302,444
Other liability & provisions 8,669 12,433 13,826 15,087 16,545
Total liabilities 145,251 176,552 225,208 282,031 353,694
Fixed Assets 292 646 775 930 1,116
Investments 416 437 437 437 437
Loans 125,246 150,914 196,188 249,159 316,432
Cash 11,127 15,936 18,326 21,075 24,237
Other assets 8,170 8,619 9,481 10,429 11,472
Total assets 145,251 176,552 225,208 282,031 353,694
AUM 160,408 198,241 259,606 330,334 420,336
Source: Company, Nirmal Bang Institutional Equities Research
Exhibit 14: Key ratios
Y/E March (Rsmn) FY16 FY17 FY18E FY19E FY20E
Growth (%)
Net Interest Income 52.4 59.1 41.8 30.6 26.6
Operating Profit 79.8 65.9 31.3 30.0 28.0
Profit After Tax 45.3 43.9 29.0 35.7 27.0
Business (%)
Advance Growth 42.6 20.5 30.0 27.0 27.0
Gross Loan Growth (Incl Securitisation)
34.0 23.6 31.0 27.2 27.2
Spreads (%)
Yield on loans 16.1 17.8 18.4 18.4 18.4
Cost of Borrowings 8.8 8.9 8.3 8.0 8.0
Spread 7.3 8.9 10.1 10.4 10.4
NIMs 6.9 8.6 9.7 9.9 10.0
NIMs (On AUM) 5.4 6.7 7.5 7.6 7.7
Operational Effeciency (%)
Cost to Income 50.7 50.6 53.1 53.0 52.5
Cost to Assets 4.0 5.2 6.0 6.2 6.2
Cost to AUM 3.6 4.6 5.3 5.3 5.2
Productivity (Rs Mn)
Gross portfolio per Employee 113.6 103.0 111.7 121.3 134.6
Profit per Employee 1.2 1.2 1.3 1.5 1.7
CRAR (%)
Tier I 14.5 15.5 13.2 11.8 10.7
Tier II 5.3 4.6 4.7 4.7 4.7
Total 19.8 20.2 17.9 16.5 15.5
Asset Quality (%)
Gross NPA 1.0 0.9 1.6 1.9 2.2
Net NPA 0.5 0.3 0.8 0.9 1.0
Provision Coverage 49.0 68.7 50.0 52.6 54.5
Credit Cost (excluding std asset) 2.2 3.2 3.4 3.4 3.5
Credit Cost (including std asset) 2.2 3.3 3.6 3.5 3.6
Return Ratio (%)
ROE 10.1 11.9 12.6 15.1 16.5
ROA 1.3 1.5 1.5 1.6 1.7
Per Share (%)
EPS 18.2 24.5 31.6 43.0 54.6
BV 186.8 236.5 265.0 304.9 356.3
ABV 179.4 232.1 248.9 281.8 323.8
Valuation (x)
P/E 34.1 25.3 19.6 14.4 11.4
P/BV 3.3 2.6 2.3 2.0 1.7
P/ABV 3.5 2.7 2.5 2.2 1.9
Net Interest Income 52.4 59.1 41.8 30.6 26.6
Operating Profit 79.8 65.9 31.3 30.0 28.0
Profit After Tax 45.3 43.9 29.0 35.7 27.0
Source: Company, Nirmal Bang Institutional Equities Research
Institutional Equities
200
DISCLOSURES
This Report is published by Nirmal Bang Equities Private Limited (hereinafter referred to as “NBEPL”) for private circulation. NBEPL is a registered Research Analyst under SEBI (Research Analyst) Regulations, 2014 having Registration no. INH000001436. NBEPL is also a registered Stock Broker with National Stock Exchange of India Limited and BSE Limited in cash and derivatives segments. NBEPL has other business divisions with independent research teams separated by Chinese walls, and therefore may, at times, have different or contrary views on stocks and markets. NBEPL or its associates have not been debarred / suspended by SEBI or any other regulatory authority for accessing / dealing in securities Market. NBEPL, its associates or analyst or his relatives do not hold any financial interest in the subject company. NBEPL or its associates or Analyst do not have any conflict or material conflict of interest at the time of publication of the research report with the subject company. NBEPL or its associates or Analyst or his relatives do not hold beneficial ownership of 1% or more in the subject company at the end of the month immediately preceding the date of publication of this research report. NBEPL or its associates / analyst has not received any compensation / managed or co-managed public offering of securities of the company covered by Analyst during the past twelve months. NBEPL or its associates have not received any compensation or other benefits from the company covered by Analyst or third party in connection with the research report. Analyst has not served as an officer, director or employee of Subject Company and NBEPL / analyst has not been engaged in market making activity of the subject company. Analyst Certification: I/We, Shivaji Thapliyal, the research analyst and Shreesh Chandra, the research associate are the author of this report, hereby certify that the views expressed in this research report accurately reflects my/our personal views about the subject securities, issuers, products, sectors or industries. It is also certified that no part of the compensation of the analyst(s) was, is, or will be directly or indirectly related to the inclusion of specific recommendations or views in this research. The analyst(s) principally responsible for the preparation of this research report and has taken reasonable care to achieve and maintain independence and objectivity in making any recommendations.
Institutional Equities
201
Disclaimer
Stock Ratings Absolute Returns
BUY > 15%
ACCUMULATE -5% to15%
SELL < -5%
This report is for the personal information of the authorized recipient and does not construe to be any investment, legal or taxation advice to you. NBEPL is not soliciting any action based upon it. Nothing in this research shall be construed as a solicitation to buy or sell any security or product, or to engage in or refrain from engaging in any such transaction. In preparing this research, we did not take into account the investment objectives, financial situation and particular needs of the reader.
This research has been prepared for the general use of the clients of NBEPL and must not be copied, either in whole or in part, or distributed or redistributed to any other person in any form. If you are not the intended recipient you must not use or disclose the information in this research in any way. Though disseminated to all the customers simultaneously, not all customers may receive this report at the same time. NBEPL will not treat recipients as customers by virtue of their receiving this report. This report is not directed or intended for distribution to or use by any person or entity resident in a state, country or any jurisdiction, where such distribution, publication, availability or use would be contrary to law, regulation or which would subject NBEPL & its group companies to registration or licensing requirements within such jurisdictions.
The report is based on the information obtained from sources believed to be reliable, but we do not make any representation or warranty that it is accurate, complete or up-to-date and it should not be relied upon as such. We accept no obligation to correct or update the information or opinions in it . NBEPL or any of its affiliates or employees shall not be in any way responsible for any loss or damage that may arise to any person from any inadvertent error in the information contained in this report. NBEPL or any of its affiliates or employees do not provide, at any time, any express or implied warranty of any kind, regarding any matter pertaining to this report, including without limitation the implied warranties of merchantability, fitness for a particular purpose, and non-infringement. The recipients of this report should rely on their own investigations.
This information is subject to change without any prior notice. NBEPL reserves its absolute discretion and right to make or refrain from making modifications and alterations to this statement from time to time. Nevertheless, NBEPL is committed to providing independent and transparent recommendations to its clients, and would be happy to provide information in response to specific client queries.
Before making an investment decision on the basis of this research, the reader needs to consider, with or without the assistance of an adviser, whether the advice is appropriate in light of their particular investment needs, objectives and financial circumstances. There are risks involved in securities trading. The price of securities can and does fluctuate, and an individual security may even become valueless. International investors are reminded of the additional risks inherent in international investments, such as currency fluctuations and international stock market or economic conditions, which may adversely affect the value of the investment. Opinions expressed are subject to change without any notice. Neither the company nor the director or the employees of NBEPL accept any liability whatsoever for any direct, indirect, consequential or other loss arising from any use of this research and/or further communication in relation to this research. Here it may be noted that neither NBEPL, nor its directors, employees, agents or representatives shall be liable for any damages whether direct or indirect, incidental, special or consequential including lost revenue or lost profit that may arise from or in connection with the use of the information contained in this report.
Copyright of this document vests exclusively with NBEPL.
Our reports are also available on our website www.nirmalbang.com
Access all our reports on Bloomberg, Thomson Reuters and Factset.
Team Details:
Name Email Id Direct Line
Rahul Arora CEO [email protected] -
Girish Pai Head of Research [email protected] +91 22 6273 8017 / 18
Dealing
Ravi Jagtiani Dealing Desk [email protected] +91 22 6273 8230, +91 22 6636 8833
Pradeep Kasat Dealing Desk [email protected] +91 22 6273 8100/8101, +91 22 6636 8831
Michael Pillai Dealing Desk [email protected] +91 22 6273 8102/8103, +91 22 6636 8830
Nirmal Bang Equities Pvt. Ltd.
Correspondence Address
B-2, 301/302, Marathon Innova,
Nr. Peninsula Corporate Park,
Lower Parel (W), Mumbai-400013.
Board No. : 91 22 6273 8000/1; Fax. : 022 6273 8010
Recommended


