Interpreting urban space through cognitive mapsketching and sequence analysis
NIEM TU HUYNHDepartment of Geography and Environmental Studies, Wilfrid Laurier University, Waterloo, Ontario, Canada N2L 3C5 (e-mail: [email protected])
G. BRENT HALLSchool of Surveying, University of Otago, P O Box 56, Dunedin, New Zealand (e-mail: [email protected])
SEAN DOHERTYDepartment of Geography and Environmental Studies, Wilfrid Laurier University, Waterloo, Ontario, Canada N2L 3C5 (e-mail: [email protected])
WAYNE W. SMITHDepartment of Hospitality and Tourism Management, College of Charleston, Charleston, South Carolina, US 29424 (e-mail: [email protected])
Traditionally, analysis of sketch maps of urban areashas focused on the interpretation of hand-drawnrenditions of features that are most familiar toindividuals. Few researchers have investigated thesequence that sketchers use to identify features onthe urban landscape and how these features arelinked together to form a coherent ‘picture’ of anarea. This article builds upon previous research byexploring the sequential pattern of sketch mapcreation. Two research questions are proposed,namely, can a repetitive sequential order in elementinclusion be identified for different individualssketching the same urban environment? If so whatfeatures are mapped in which order to create thesketchers’ image of the city? Findings suggest thatthree distinct groups of cognitive maps exist, namely,sequential, spatial and hybrid, and that the mapelements of each group are organised in a distinctivemanner with paths and landmarks as principalelements. It is suggested that insights into this
Interpreter l’espace urbain par la realisation de cartescognitives et par l’analyse sequentielle
Traditionnellement, l’analyse de cartes schematiquesde zones urbaines s’est concentree surl’interpretation des croquis faits a main leveerepresentant des elements bien connus pour despersonnes. Peu de chercheurs se sont interesse a lasequence par laquelle les dessinateurs arrivent aidentifier les differents elements du paysage urbain etcomment ces elements sont associes pour produireune �image� coherente d’un lieu. S’appuyant surdes recherches anterieures, cet article s’interesse aumode sequentiel de la creation de cartesschematiques. Deux questions de recherche sontabordees. D’abord, au niveau de l’inclusion deselements, un ordre sequentiel repetitif peut-il sedistinguer chez differentes personnes qui dessinent lememe environnement urbain? Ensuite, si c’est le cas,quels elements sont cartographies et dans quel ordreafin que les dessinateurs produisent une image de la
The Canadian Geographer / Le Geographe canadien 52, no 2 (2008) 222–240C© / Canadian Association of Geographers / L’Association canadienne des geographes
Interpreting urban space through cognitive map sketching and sequence analysis 223
process provide more substance to understanding howindividuals interpret and structure urban space anduse this information to navigate both known and newenvironments.
Key words: cognitive cartography, sketch maps,sequence analysis, urban space, navigation
ville? D’apres les resultats obtenus, on peut dis-tinguer trois groupes de cartes cognitives, soit, lacarte sequentielle, spatiale et hybride. De plus, leselements de cartographie s’articulent par groupe demaniere distincte dont les sentiers et les points derepere representent les principaux elements. Faire lalumiere sur ce processus permet d’approfondir lesconnaissances sur la maniere dont les individus in-terpretent et concoivent l’espace urbain et se serventde cette information pour naviguer a travers des envi-ronnements connus ou nouveaux
Mots cles : cartographie cognitive, carte, schema-tique, analyse sequentielle, espace urbain, naviga-tion
Introduction
Humans relied on drawing as an important com-munication medium before the creation of for-mal, spoken languages (Gelb 1963; Taylor andTversky 1992). In the same sense that languagesassemble words into grammatically correct sen-tences to enable communication, sketches anddrawings are used to capture external reality asperceived and understood by observers. Such rep-resentations of reality constitute an important ba-sis for understanding the linkages between theprocesses of environmental perception, informa-tion gathering, cognitive information processingand, ultimately, behaviour.
Since the time of the first use of the conceptof an ‘imaginary map’ by Trowbridge (1913), re-searchers have investigated aspects of the rela-tionship between perceptions of external reality,cognitive constructions of ‘the real world’ in theform of a ‘mental map’ and behaviour. Tolman(1948) was the first to undertake experimentalwork on way-finding behaviour and stored cog-nitive memory in rats, and from this he intro-duced the concept of a ‘cognitive map’ that ratsuse to navigate within known or experienced en-vironments. Tolman’s general idea was that en-vironments are learned, remembered in cognitive‘space’ and recalled to assist with spatial be-haviour.
Transference of this concept to the humanrealm initiated a lengthy stream of researchthat has sought to understand how humansperceive and structure information about the
environments they live in, and how this infor-mation is used to perform a variety of tasksthrough deconstructing and reconstructing selec-tive aspects of reality. This article contributes tothis research by investigating urban sketch map-ping and its relation to the processes by whichhumans observe, store and recall urban environ-ments. In particular the focus of reality is the se-quence in which spatial elements are recalled andused to describe objective reality.
Traditional ways of understanding sketch mapsof urban areas have focused on spatial percep-tions (Carr and Schissler 1969; Devlin 1976; Wong1979; Brown and Broadway 1981), distortions ofreal world space (Briggs 1976; Sherman et al.1979; Buttenfield 1986) and the hierarchical or-ganisation of map elements (Holyoak and Mah1982; Hirtle and Jonides 1985). Few researchershave discussed the sequence that sketchers useto identify elements or features in the urbanlandscape and how these features are linked to-gether to form a coherent ‘picture’ of reality. Therelative immaturity of technology during the hey-day of cognitive mapping research in the 1960sand 1970s combined with a lack of method-ological flexibility substantially limited the re-sults of sketch mapping research to recordingthe frequency with which elements were drawnand interpreting content relative to the behaviourspaces of sketchers.
The specific emphasis in this article is on thesequence, or order in which individuals incremen-tally add elements that, together, describe the en-vironment they live and work in. Two aspects
The Canadian Geographer / Le Geographe canadien 52, no 2 (2008)
224 Niem Tu Huynh et al.
of Abbott’s (1995) framework of sequence prop-erties are directly applicable to sketch mappingas conceptualised in this context. First, the ele-ments in a sequence can be unique or can be re-peated and second, element sequences can eitherbe independent of other factors or they can beexamined as components of a linked process.
In this article it is argued that in a sequence,first order elements form a basic frameworkaround which successively less important sec-ond and lower order elements are assembled(Golledge 1978; McNamara 1992). This processcontinues until there is a self-determined corre-spondence between the cognitive representationof the area under consideration and reality. Envi-ronments that contain more elements of a higherorder than those of a lower order are likely to bemore legible to observers, and more legible en-vironments should occasion more efficient spa-tial behaviour. At least two generic map ‘types’can be discerned from this process, namely,those that primarily describe linear aspects of thetransportation network, and those that identifypoints of importance to the observer. This arti-cle proposes a third, hybrid or ‘complete’ maptype that mixes linear and point elements inter-changeably within the sequence of map elements.
The approach used to capture the sequencein which individuals draw elements uses an in-novative combination of modern digital multi-media. Further, the technique of sequence align-ment is used to assemble sketch map elementsinto groups based on common sequence patterns.The groups are then analysed using ClustalWsoftware that was developed originally for assess-ing gene assemblages.
Sketch Map Sequence
The literature on cognitive mapping is extensiveand spans numerous disciplinary boundaries. De-spite the common use of sketch mapping to de-scribe cognitive representations of urban areas,there is a general paucity of published researchon the order in which elements are sketched asindividuals portray the cognitive structure of theenvironments they live and work in. In complexenvironments, such as urban areas, it is likelythat residents organise their cognitive informa-tion, for ease of recall, into ‘sets’ that structureurban space based upon repetitive spatial be-
haviours in areas known as activity spaces. Hor-ton and Reynolds (1971) explain these areas ascontaining all urban locations that an individualhas direct contact with due to daily activities. Forexample, common daily trips, such as the jour-ney to work, to school or to shop serve as imme-diate frames of reference around which primary,secondary and lower order elements in the urbanlandscape are assembled (Appleyard et al. 1964;Golledge 1978).
These reference points allow segments of bothregular and new journeys to be linked togetherwith ancillary attributes of places to form com-posite cognitive images of space that are storedin memory and recalled as needed when navigat-ing through an environment (Lee 1968; Siegel andWhite 1975; Montello 1998). Much of this infor-mation relies on visual cues that characterise thelandscape. However, sound, olfactory and eventactile reference points can also serve as informa-tion inputs for the creation of cognitive images oflocations.
Lynch (1960) pioneered and popularised theconcept of urban imagery or legibility in hisseminal work The Image of the City. In thisbook Lynch identified five landscape features,namely, paths, edges, districts, nodes and land-marks, which comprise the elemental cognitivebuilding blocks of all urban spaces. He suggestedthat the interrelatedness of these elements andperceptions of urban space are centrally impor-tant for enhancing what he described as placelegibility, or the manner in which elements arecombined to create easily understandable lay-outs of space. Two elements are prominent inspatial development research, namely, landmarksand paths, with both being regarded as mini-mum elements of spatial representation (Siegeland White 1975). Landmarks can be considereda predominantly visual element in the landscape,while paths are considered to be sensorimotor el-ements that form the shape of the spatial area(Siegel and White 1975).
Despite capturing the cognitive building blocksof urban images, Lynch only briefly mentionedthe sequential relationships between the con-structions of his five elements. No working def-inition of sequence was provided either in hisclassical work, or in his prior or subsequent soleauthored and collaborative contributions (e.g.,Appleyard et al. 1964; Lynch 1981). However, a
The Canadian Geographer / Le Geographe canadien 52, no 2 (2008)
Interpreting urban space through cognitive map sketching and sequence analysis 225
sequential ordering of elements in both cogni-tive and real world space is implicit in his basicproposition of urban imagery. The organisationalhierarchy suggests that paths form the skeletalinfrastructure from which edges that compriselines not in the path group are defined. Edges,in turn, define districts, and nodes operate asstrategic points that have individualised meaningalong paths and edges. Finally, landmarks or ob-jects that serve as both cognitive and physicalreference points are added to comprise the ur-ban image.
Although Lynch’s (Lynch 1960, 1981; Lynchet al. 1997) work initiated a substantial streamof subsequent research over the intervening years(e.g., Banerjee et al. 1977; Hirtle and Jonides1985), the implied ordering of his five elementshas not been examined empirically to any greatextent. This neglect is somewhat surprising asthe order in which cognitive information aboutspatial structure is perceived, stored and then re-layed as needed clearly has implications for thelegibility of spaces relative to behaviour withinthem. However, some researchers have touchedupon the possibility that the components of in-dividual cognitive maps of urban space have animplied order in the way that information isstructured, recalled and used for decision mak-ing purposes and for way-finding or navigation(Aragones and Arredondo 1985; Banai 1999).
Despite the paucity of sketch map sequence re-search, several studies are closely related to se-quencing, including investigation of the hierar-chy of elements within sketch maps (Stevens andCoupe 1978; Hirtle and Jonides 1985) and an-chor point theory (Golledge 1978). Element hier-archies refer to the ‘reliable tendency of partici-pants to subdivide the environments and to drawor describe one set of features prior to another’(Taylor and Tversky 1992, 494). Anchor point the-ory, developed by Golledge (1978), illustrates therelationship between nodes and paths, showingthat primary nodes and primary paths are linkedin a hierarchical order. According to this theory,the node-path skeletal network of urban space isfilled incrementally with detail, creating a spreadeffect that develops into areal information suchas neighbourhoods. The hierarchical order of lo-cational cues (landmarks, paths, etc.) is dividedinto primary, secondary and tertiary levels andthen into lower ordered nodes. Primary nodes
represent the most well-known cues, whereas thesuccessively lower-level nodes reflect decreasinglevels of spatial information, infrequency of useand greater difficulty of recall (Golledge 1978).
The relationship between the elements in asketch map is closely related to anchor pointtheory. Tversky and Taylor (1998) found thatparticipants described the environment in seg-ments with background features drawn first, fol-lowed by relevant landmarks placed into seg-ments. Participants used different perspectives tolocate landmarks within the segments and theninterconnected the segments to create a skeletalframework of space. The description of routeswas constructed in the same hierarchical fash-ion. The same authors also found that promi-nent or significant features were described first,which supports the general notion underlyingGolledge’s (1978) anchor point concept. Peruchet al. (1989) identified a hierarchy in the organi-sation of a street network. The levels of organisa-tion reflected the order of perceived importancewith major highways, freeway segments and mainroads, followed by neighbourhood streets, identi-fied in sequential order.
In a conversation with Golledge (2004), he of-fered two reasons why element sequencing isunder-represented in the literature. He suggestedthat in the early years of research on this topicthe focus was on obtaining and analysing staticrenditions of urban space, and this interest pre-empted consideration of the order in which theconstituent elements were collected. Hence, thefocus was on what comprised the urban imagerather than how the content was assembled. Sec-ond, Golledge noted that researchers have tendedto assume that element sequences were known,and hence there was no need to investigate thisaspect of cognitive mapping. As a result of thesetwo factors, the concept of element sequencingwas neglected and received little attention in theresearch.
Hence, there is some evidence of the presenceof consistent and coherent ordering of the ele-ments that comprise urban images. Despite thisthere is a lack of knowledge on the extent towhich the process of constructing and using spa-tial cognitive information varies, for example, byplace of residence, by degree of familiarity withthe urban area being assessed and many othercontributory factors. In the following section, a
The Canadian Geographer / Le Geographe canadien 52, no 2 (2008)
226 Niem Tu Huynh et al.
novel approach is presented for gaining insightinto the process of element sequencing of urbancognitive information.
Unidimensional SequenceAlignment Analysis
Since Watson and Crick’s (1953) helix structure ofdeoxyribonucleic acid (DNA) was first proposed,research has accumulated on the development ofmethods to analyse such sequences. Within thistradition, biochemists in the 1980s formulated se-quence analysis strategies, which were modifiedin the late 1990s for use in the social sciences(Shoval and Isaacson 2007). Research applicationsinclude diverse fields such as archaeology (order-ing sequence of artefacts), economics (game the-ory, marketing), linguistics (language acquisition,construction of word/text images) and psychol-ogy (sequence of stimuli, sequence of item recall,sequence anchoring) (Abbott 1995).
Unidimensional sequence alignment analysiswas developed in the field of molecular biology tocompare the degree to which different sequencesof DNA and ribonucleic acid (RNA) structuresare similar. The extension of unidimensional se-quence alignment to the spatial domain involvesanalogical reasoning whereby the analysis of thebiological sequences is transferred to events,such as spatial behaviours, or locations, such asthe elements of spatial knowledge, are chainedtogether. The technique is relatively untested inthe context of human behaviour, with a few ex-ceptions including Joh et al. (2002); Bargemanet al. (2002); Kemperman et al. (2002) and Shovaland Isaacson (2007). In each of these examples,unidimensional sequence alignment was used toexamine travel patterns.
Unidimensional sequencing alignment looks forthe best ‘local arrangement’ based on a se-quencing algorithm designed to find similaritiesbetween strings of data (Durbin et al. 1999;Bargeman et al. 2002; Eloffson 2002). The se-quencing algorithm evaluates each pair of se-quences to determine how many changes wouldbe required for one sequence to be transformedinto another. The transformation is done by usinga combination of substitution, identity, insertionand deletion operations. Specifically, substitutioninvolves the replacement of a component within asequence. For example, if one sequence is coded
‘ABCD’ and a second sequence is coded ‘ABCF’,the algorithm will detect three matching com-ponents and one mismatch that could be cor-rected by a substitution. Identity operations re-fer to adjusting the order of components withina sequence. Thus, if one sequence is coded asABCD and another is coded as ABDC, both se-quences are identical, but the order of the com-ponents is different. In this case, the algorithmwill adjust the concordance score, which repre-sents the degree of similarity or differences be-tween sequences.
Insertion and deletion operations are employedwhen one or more components of a sequence aremissing. Insertions refer to a similar pairing inthe sequence, with the exception of a missingcomponent at the end of the sequence. In thiscase, consider the sequences ABDC and ABC. Be-cause D is missing from the second sequence,the technique will attempt to group it with theother sequence because it shares the first threeelements (ABC). The matching of the first threecomponents will be acknowledged and as willthe fact that a fourth element, D, is neededto make the sequences identical. Deletion oper-ations refer to the presence of a ‘hole’ in themiddle of a sequence, where a variety of deci-sions might be made. In this case, deletion oper-ations are similar to insertions in that there aremissing components. However, if sequence oneis ABCD and sequence two is AB?D (the ques-tion mark represents the missing component), thetechnique will drop the third component of thefirst sequence and adjust the concordance scoreaccordingly.
Clearly, this approach lends itself well to theprocess of element chaining in sketch maps ofurban space, and provides a number of opportu-nities for discovering insights into the sequencein which elements of the urban landscape aredrawn. Moreover, the ability to analyse sequencestrings of sketch map elements within and be-tween groups of individuals offers previously un-explored possibilities for examining some of thefundamental building blocks of spatial knowledgeretention and recall.
The case study used to explore the applica-tion of unidimensional sequence analysis to ur-ban spatial knowledge accumulation and recallthrough sketch mapping is discussed in the fol-lowing section.
The Canadian Geographer / Le Geographe canadien 52, no 2 (2008)
Interpreting urban space through cognitive map sketching and sequence analysis 227
Methodology
Study sites
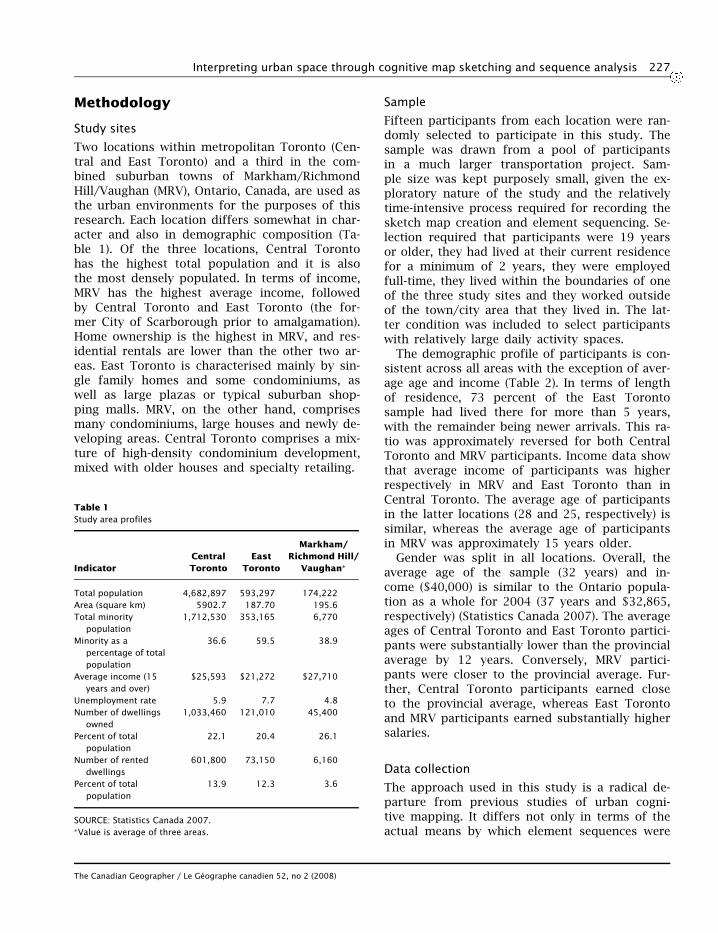
Two locations within metropolitan Toronto (Cen-tral and East Toronto) and a third in the com-bined suburban towns of Markham/RichmondHill/Vaughan (MRV), Ontario, Canada, are used asthe urban environments for the purposes of thisresearch. Each location differs somewhat in char-acter and also in demographic composition (Ta-ble 1). Of the three locations, Central Torontohas the highest total population and it is alsothe most densely populated. In terms of income,MRV has the highest average income, followedby Central Toronto and East Toronto (the for-mer City of Scarborough prior to amalgamation).Home ownership is the highest in MRV, and res-idential rentals are lower than the other two ar-eas. East Toronto is characterised mainly by sin-gle family homes and some condominiums, aswell as large plazas or typical suburban shop-ping malls. MRV, on the other hand, comprisesmany condominiums, large houses and newly de-veloping areas. Central Toronto comprises a mix-ture of high-density condominium development,mixed with older houses and specialty retailing.
Table 1Study area profiles
Markham/Central East Richmond Hill/
Indicator Toronto Toronto Vaughan∗
Total population 4,682,897 593,297 174,222Area (square km) 5902.7 187.70 195.6Total minority
population1,712,530 353,165 6,770
Minority as apercentage of totalpopulation
36.6 59.5 38.9
Average income (15years and over)
$25,593 $21,272 $27,710
Unemployment rate 5.9 7.7 4.8Number of dwellings
owned1,033,460 121,010 45,400
Percent of totalpopulation
22.1 20.4 26.1
Number of renteddwellings
601,800 73,150 6,160
Percent of totalpopulation
13.9 12.3 3.6
SOURCE: Statistics Canada 2007.∗Value is average of three areas.
Sample
Fifteen participants from each location were ran-domly selected to participate in this study. Thesample was drawn from a pool of participantsin a much larger transportation project. Sam-ple size was kept purposely small, given the ex-ploratory nature of the study and the relativelytime-intensive process required for recording thesketch map creation and element sequencing. Se-lection required that participants were 19 yearsor older, they had lived at their current residencefor a minimum of 2 years, they were employedfull-time, they lived within the boundaries of oneof the three study sites and they worked outsideof the town/city area that they lived in. The lat-ter condition was included to select participantswith relatively large daily activity spaces.
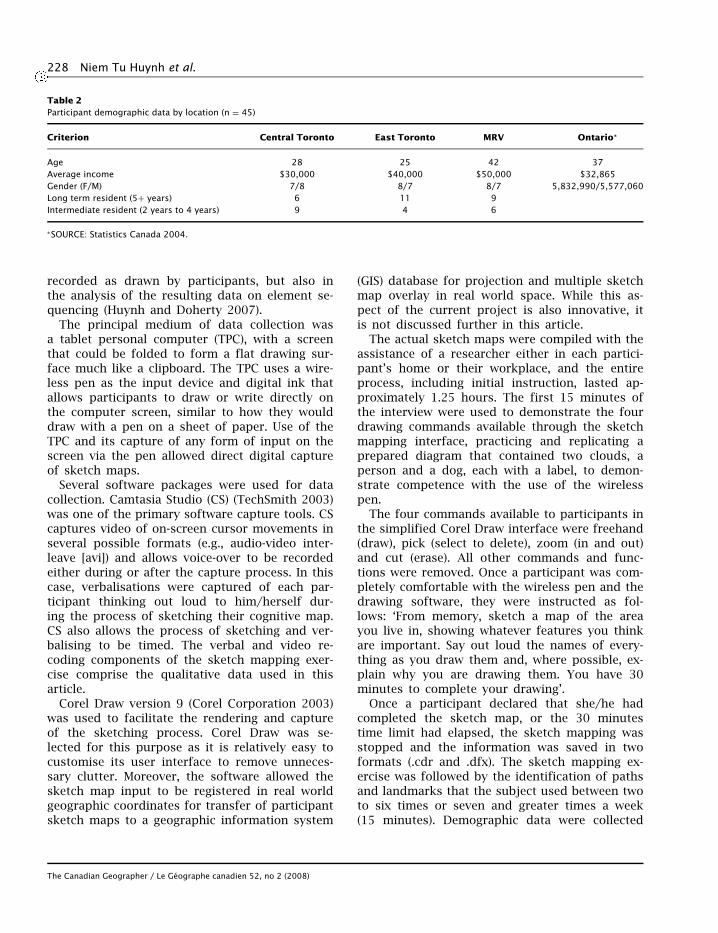
The demographic profile of participants is con-sistent across all areas with the exception of aver-age age and income (Table 2). In terms of lengthof residence, 73 percent of the East Torontosample had lived there for more than 5 years,with the remainder being newer arrivals. This ra-tio was approximately reversed for both CentralToronto and MRV participants. Income data showthat average income of participants was higherrespectively in MRV and East Toronto than inCentral Toronto. The average age of participantsin the latter locations (28 and 25, respectively) issimilar, whereas the average age of participantsin MRV was approximately 15 years older.
Gender was split in all locations. Overall, theaverage age of the sample (32 years) and in-come ($40,000) is similar to the Ontario popula-tion as a whole for 2004 (37 years and $32,865,respectively) (Statistics Canada 2007). The averageages of Central Toronto and East Toronto partici-pants were substantially lower than the provincialaverage by 12 years. Conversely, MRV partici-pants were closer to the provincial average. Fur-ther, Central Toronto participants earned closeto the provincial average, whereas East Torontoand MRV participants earned substantially highersalaries.
Data collection
The approach used in this study is a radical de-parture from previous studies of urban cogni-tive mapping. It differs not only in terms of theactual means by which element sequences were
The Canadian Geographer / Le Geographe canadien 52, no 2 (2008)
228 Niem Tu Huynh et al.
Table 2Participant demographic data by location (n = 45)
Criterion Central Toronto East Toronto MRV Ontario∗
Age 28 25 42 37Average income $30,000 $40,000 $50,000 $32,865Gender (F/M) 7/8 8/7 8/7 5,832,990/5,577,060Long term resident (5+ years) 6 11 9Intermediate resident (2 years to 4 years) 9 4 6
∗SOURCE: Statistics Canada 2004.
recorded as drawn by participants, but also inthe analysis of the resulting data on element se-quencing (Huynh and Doherty 2007).
The principal medium of data collection wasa tablet personal computer (TPC), with a screenthat could be folded to form a flat drawing sur-face much like a clipboard. The TPC uses a wire-less pen as the input device and digital ink thatallows participants to draw or write directly onthe computer screen, similar to how they woulddraw with a pen on a sheet of paper. Use of theTPC and its capture of any form of input on thescreen via the pen allowed direct digital captureof sketch maps.
Several software packages were used for datacollection. Camtasia Studio (CS) (TechSmith 2003)was one of the primary software capture tools. CScaptures video of on-screen cursor movements inseveral possible formats (e.g., audio-video inter-leave [avi]) and allows voice-over to be recordedeither during or after the capture process. In thiscase, verbalisations were captured of each par-ticipant thinking out loud to him/herself dur-ing the process of sketching their cognitive map.CS also allows the process of sketching and ver-balising to be timed. The verbal and video re-coding components of the sketch mapping exer-cise comprise the qualitative data used in thisarticle.
Corel Draw version 9 (Corel Corporation 2003)was used to facilitate the rendering and captureof the sketching process. Corel Draw was se-lected for this purpose as it is relatively easy tocustomise its user interface to remove unneces-sary clutter. Moreover, the software allowed thesketch map input to be registered in real worldgeographic coordinates for transfer of participantsketch maps to a geographic information system
(GIS) database for projection and multiple sketchmap overlay in real world space. While this as-pect of the current project is also innovative, itis not discussed further in this article.
The actual sketch maps were compiled with theassistance of a researcher either in each partici-pant’s home or their workplace, and the entireprocess, including initial instruction, lasted ap-proximately 1.25 hours. The first 15 minutes ofthe interview were used to demonstrate the fourdrawing commands available through the sketchmapping interface, practicing and replicating aprepared diagram that contained two clouds, aperson and a dog, each with a label, to demon-strate competence with the use of the wirelesspen.
The four commands available to participants inthe simplified Corel Draw interface were freehand(draw), pick (select to delete), zoom (in and out)and cut (erase). All other commands and func-tions were removed. Once a participant was com-pletely comfortable with the wireless pen and thedrawing software, they were instructed as fol-lows: ‘From memory, sketch a map of the areayou live in, showing whatever features you thinkare important. Say out loud the names of every-thing as you draw them and, where possible, ex-plain why you are drawing them. You have 30minutes to complete your drawing’.
Once a participant declared that she/he hadcompleted the sketch map, or the 30 minutestime limit had elapsed, the sketch mapping wasstopped and the information was saved in twoformats (.cdr and .dfx). The sketch mapping ex-ercise was followed by the identification of pathsand landmarks that the subject used between twoto six times or seven and greater times a week(15 minutes). Demographic data were collected
The Canadian Geographer / Le Geographe canadien 52, no 2 (2008)
Interpreting urban space through cognitive map sketching and sequence analysis 229
in the last part of the interview process (10minutes).
Sequence extraction from verbal data
All verbalised comments recorded during thesketch mapping process were transcribed to Mi-crosoft Word. Care had to be taken during thisprocess not to mis-interpret comments, especiallyduring instances where the recording volume wastoo low and information was inaudible, or whenwords were mumbled or poorly pronounced andwere difficult to cross-check and understand. Insome instances, participants back-tracked to cor-rect errors, stopped often to think for a lengthyperiod of time or spoke quickly, requiring theperson transcribing to replay the interview in or-der to capture everything that was said.
Data were subsequently transformed into se-quence strings. First, each subject’s verbal re-count of their sketch map creation was recorded.This was followed by coding every element in in-dividual strings as P = path, L = landmark, N= node, B = boundary and D = district fromthe start to the end of each transcription. Thecoding required interpretation or follow up of in-formation to identify then confirm which of thefive Lynch elements an ambiguous or unknownelement should be assigned to. Hence, a samplesequence string would appear as L L L P P P LP . . . . . , or a condensed run encoding form suchas 3 L 3P 1 L 1P, where the number precedingeach letter represents the frequency of that ele-ment. The resulting data set formed the input forsequence analysis using ClustalW software. Thisprocess is described in the following results.
Results
Sketch map classification
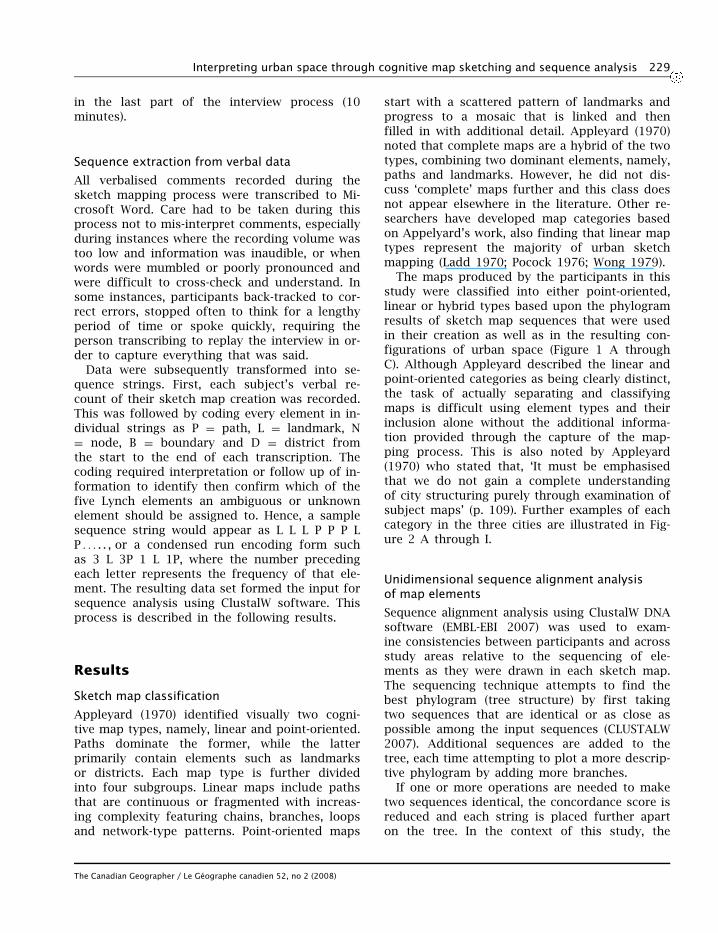
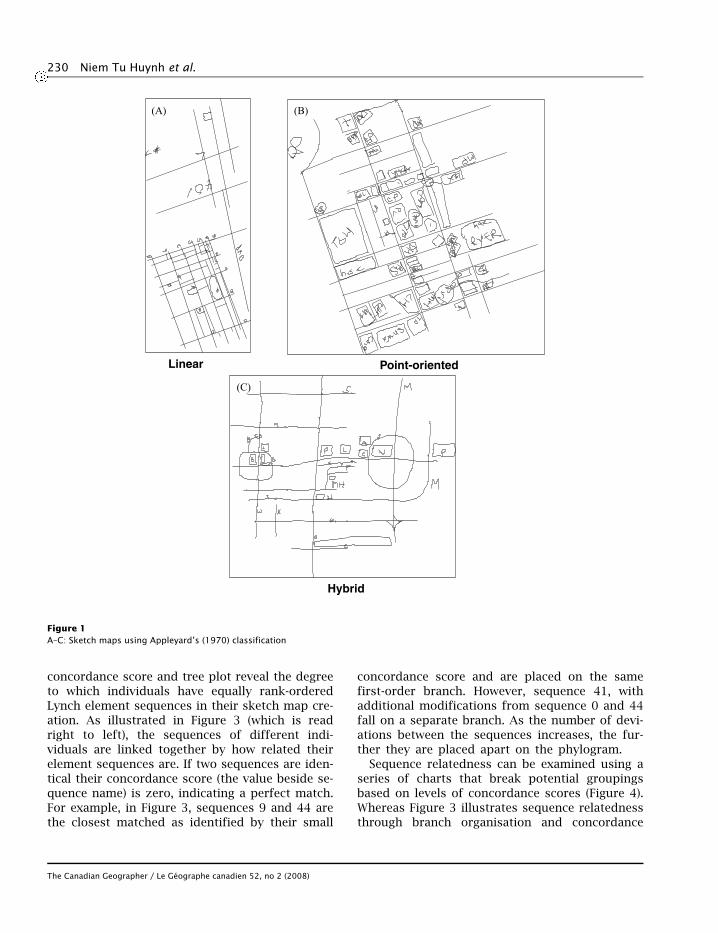
Appleyard (1970) identified visually two cogni-tive map types, namely, linear and point-oriented.Paths dominate the former, while the latterprimarily contain elements such as landmarksor districts. Each map type is further dividedinto four subgroups. Linear maps include pathsthat are continuous or fragmented with increas-ing complexity featuring chains, branches, loopsand network-type patterns. Point-oriented maps
start with a scattered pattern of landmarks andprogress to a mosaic that is linked and thenfilled in with additional detail. Appleyard (1970)noted that complete maps are a hybrid of the twotypes, combining two dominant elements, namely,paths and landmarks. However, he did not dis-cuss ‘complete’ maps further and this class doesnot appear elsewhere in the literature. Other re-searchers have developed map categories basedon Appelyard’s work, also finding that linear maptypes represent the majority of urban sketchmapping (Ladd 1970; Pocock 1976; Wong 1979).
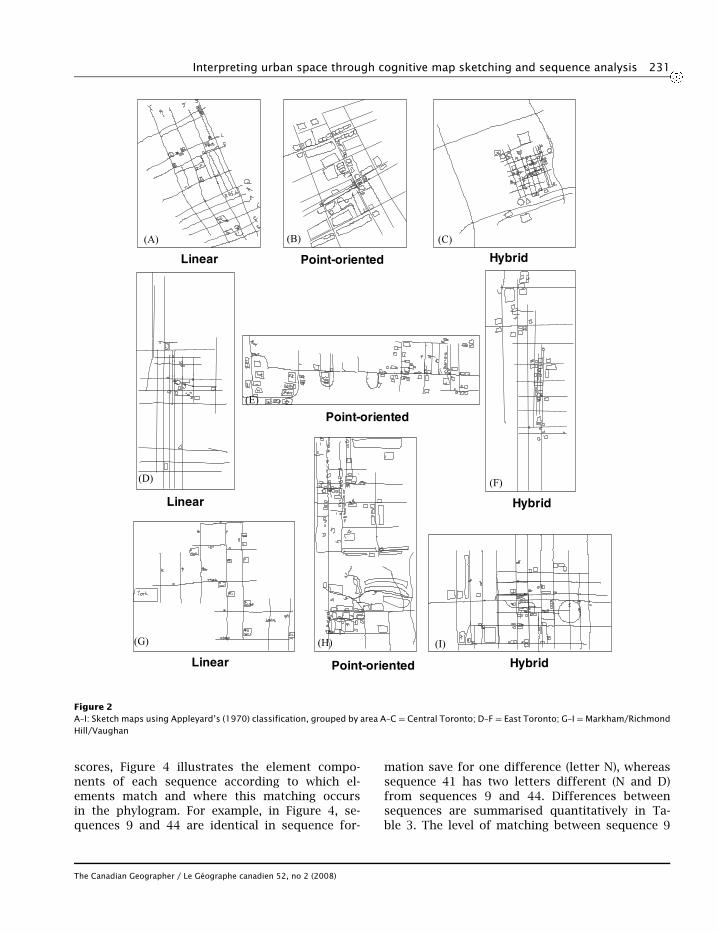
The maps produced by the participants in thisstudy were classified into either point-oriented,linear or hybrid types based upon the phylogramresults of sketch map sequences that were usedin their creation as well as in the resulting con-figurations of urban space (Figure 1 A throughC). Although Appleyard described the linear andpoint-oriented categories as being clearly distinct,the task of actually separating and classifyingmaps is difficult using element types and theirinclusion alone without the additional informa-tion provided through the capture of the map-ping process. This is also noted by Appleyard(1970) who stated that, ‘It must be emphasisedthat we do not gain a complete understandingof city structuring purely through examination ofsubject maps’ (p. 109). Further examples of eachcategory in the three cities are illustrated in Fig-ure 2 A through I.
Unidimensional sequence alignment analysisof map elements
Sequence alignment analysis using ClustalW DNAsoftware (EMBL-EBI 2007) was used to exam-ine consistencies between participants and acrossstudy areas relative to the sequencing of ele-ments as they were drawn in each sketch map.The sequencing technique attempts to find thebest phylogram (tree structure) by first takingtwo sequences that are identical or as close aspossible among the input sequences (CLUSTALW2007). Additional sequences are added to thetree, each time attempting to plot a more descrip-tive phylogram by adding more branches.
If one or more operations are needed to maketwo sequences identical, the concordance score isreduced and each string is placed further aparton the tree. In the context of this study, the
The Canadian Geographer / Le Geographe canadien 52, no 2 (2008)
230 Niem Tu Huynh et al.
(A)
Linear
(B)
Point-oriented
(C)
Hybrid
Figure 1A–C: Sketch maps using Appleyard’s (1970) classification
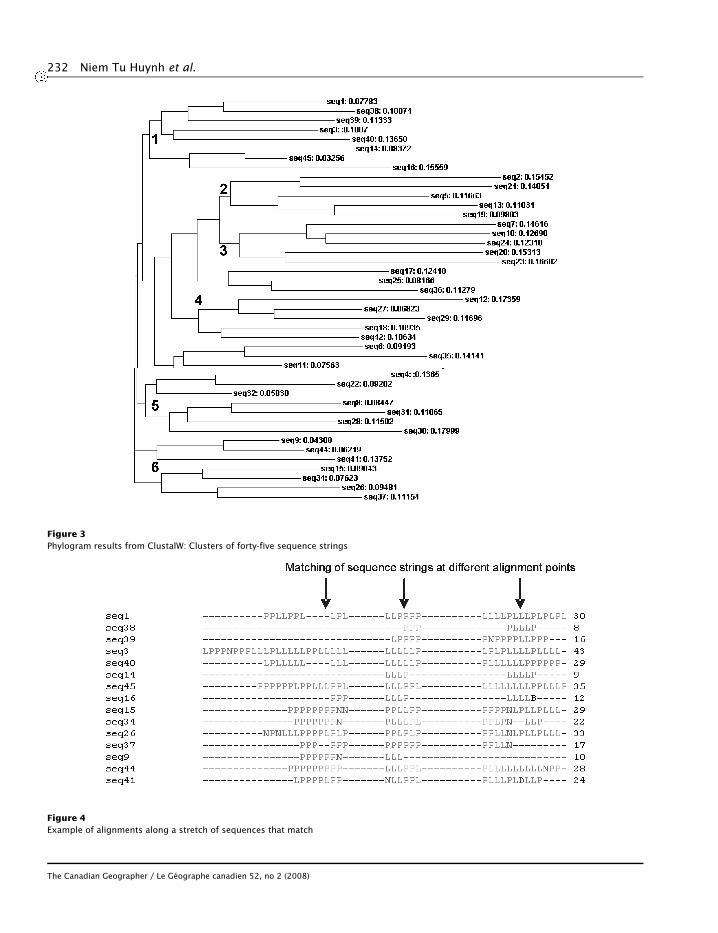
concordance score and tree plot reveal the degreeto which individuals have equally rank-orderedLynch element sequences in their sketch map cre-ation. As illustrated in Figure 3 (which is readright to left), the sequences of different indi-viduals are linked together by how related theirelement sequences are. If two sequences are iden-tical their concordance score (the value beside se-quence name) is zero, indicating a perfect match.For example, in Figure 3, sequences 9 and 44 arethe closest matched as identified by their small
concordance score and are placed on the samefirst-order branch. However, sequence 41, withadditional modifications from sequence 0 and 44fall on a separate branch. As the number of devi-ations between the sequences increases, the fur-ther they are placed apart on the phylogram.
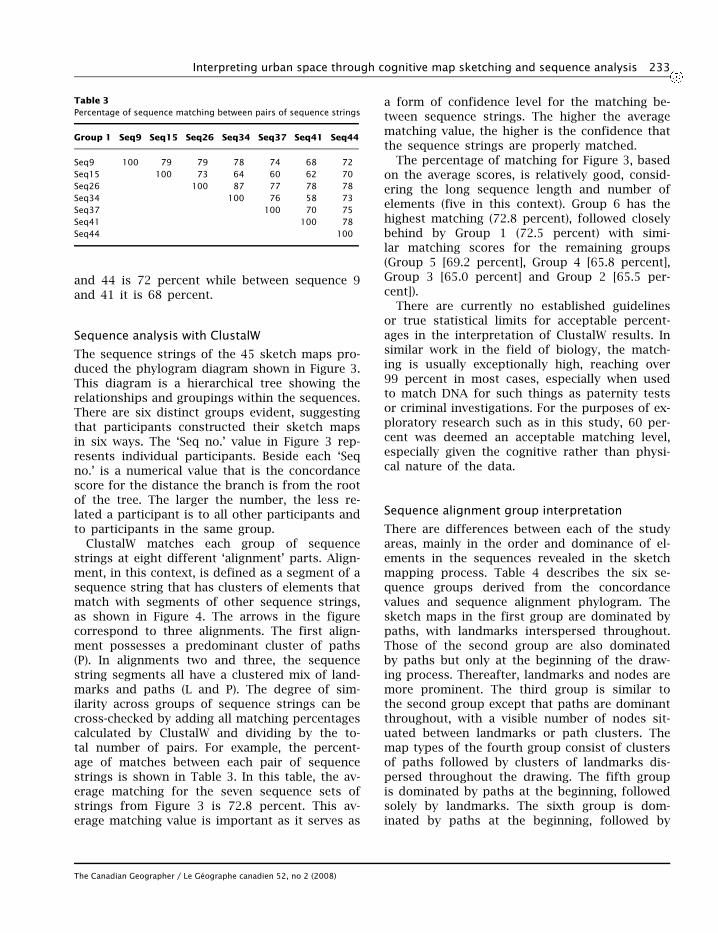
Sequence relatedness can be examined using aseries of charts that break potential groupingsbased on levels of concordance scores (Figure 4).Whereas Figure 3 illustrates sequence relatednessthrough branch organisation and concordance
The Canadian Geographer / Le Geographe canadien 52, no 2 (2008)
Interpreting urban space through cognitive map sketching and sequence analysis 231
(A)
(G)
(D)
(B)
(H)
(F)
(C)
(I)
(E)
Linear
Linear
Linear
Point-oriented
Point-oriented
Point-oriented
Hybrid
Hybrid
Hybrid
Figure 2A–I: Sketch maps using Appleyard’s (1970) classification, grouped by area A–C = Central Toronto; D–F = East Toronto; G–I = Markham/RichmondHill/Vaughan
scores, Figure 4 illustrates the element compo-nents of each sequence according to which el-ements match and where this matching occursin the phylogram. For example, in Figure 4, se-quences 9 and 44 are identical in sequence for-
mation save for one difference (letter N), whereassequence 41 has two letters different (N and D)from sequences 9 and 44. Differences betweensequences are summarised quantitatively in Ta-ble 3. The level of matching between sequence 9
The Canadian Geographer / Le Geographe canadien 52, no 2 (2008)
232 Niem Tu Huynh et al.
Figure 3Phylogram results from ClustalW: Clusters of forty-five sequence strings
Figure 4Example of alignments along a stretch of sequences that match
The Canadian Geographer / Le Geographe canadien 52, no 2 (2008)
Interpreting urban space through cognitive map sketching and sequence analysis 233
Table 3Percentage of sequence matching between pairs of sequence strings
Group 1 Seq9 Seq15 Seq26 Seq34 Seq37 Seq41 Seq44
Seq9 100 79 79 78 74 68 72Seq15 100 73 64 60 62 70Seq26 100 87 77 78 78Seq34 100 76 58 73Seq37 100 70 75Seq41 100 78Seq44 100
and 44 is 72 percent while between sequence 9and 41 it is 68 percent.
Sequence analysis with ClustalW
The sequence strings of the 45 sketch maps pro-duced the phylogram diagram shown in Figure 3.This diagram is a hierarchical tree showing therelationships and groupings within the sequences.There are six distinct groups evident, suggestingthat participants constructed their sketch mapsin six ways. The ‘Seq no.’ value in Figure 3 rep-resents individual participants. Beside each ‘Seqno.’ is a numerical value that is the concordancescore for the distance the branch is from the rootof the tree. The larger the number, the less re-lated a participant is to all other participants andto participants in the same group.
ClustalW matches each group of sequencestrings at eight different ‘alignment’ parts. Align-ment, in this context, is defined as a segment of asequence string that has clusters of elements thatmatch with segments of other sequence strings,as shown in Figure 4. The arrows in the figurecorrespond to three alignments. The first align-ment possesses a predominant cluster of paths(P). In alignments two and three, the sequencestring segments all have a clustered mix of land-marks and paths (L and P). The degree of sim-ilarity across groups of sequence strings can becross-checked by adding all matching percentagescalculated by ClustalW and dividing by the to-tal number of pairs. For example, the percent-age of matches between each pair of sequencestrings is shown in Table 3. In this table, the av-erage matching for the seven sequence sets ofstrings from Figure 3 is 72.8 percent. This av-erage matching value is important as it serves as
a form of confidence level for the matching be-tween sequence strings. The higher the averagematching value, the higher is the confidence thatthe sequence strings are properly matched.
The percentage of matching for Figure 3, basedon the average scores, is relatively good, consid-ering the long sequence length and number ofelements (five in this context). Group 6 has thehighest matching (72.8 percent), followed closelybehind by Group 1 (72.5 percent) with simi-lar matching scores for the remaining groups(Group 5 [69.2 percent], Group 4 [65.8 percent],Group 3 [65.0 percent] and Group 2 [65.5 per-cent]).
There are currently no established guidelinesor true statistical limits for acceptable percent-ages in the interpretation of ClustalW results. Insimilar work in the field of biology, the match-ing is usually exceptionally high, reaching over99 percent in most cases, especially when usedto match DNA for such things as paternity testsor criminal investigations. For the purposes of ex-ploratory research such as in this study, 60 per-cent was deemed an acceptable matching level,especially given the cognitive rather than physi-cal nature of the data.
Sequence alignment group interpretation
There are differences between each of the studyareas, mainly in the order and dominance of el-ements in the sequences revealed in the sketchmapping process. Table 4 describes the six se-quence groups derived from the concordancevalues and sequence alignment phylogram. Thesketch maps in the first group are dominated bypaths, with landmarks interspersed throughout.Those of the second group are also dominatedby paths but only at the beginning of the draw-ing process. Thereafter, landmarks and nodes aremore prominent. The third group is similar tothe second group except that paths are dominantthroughout, with a visible number of nodes sit-uated between landmarks or path clusters. Themap types of the fourth group consist of clustersof paths followed by clusters of landmarks dis-persed throughout the drawing. The fifth groupis dominated by paths at the beginning, followedsolely by landmarks. The sixth group is dom-inated by paths at the beginning, followed by
The Canadian Geographer / Le Geographe canadien 52, no 2 (2008)
234 Niem Tu Huynh et al.
Table 4Summary of phylogram classification produced from 45 sketchmaps
Map Distinct mapGroup type description
Group 1 Linear Dominated by paths. Landmarks areinterspersed amongst paths.
Group 2 Linear Paths dominate the start of the sequence.The middle to end of the sequences isdominated by a fairly consistent pattern ofpaths, landmarks and nodes.
Group 3 Hybrid Dominated by paths at the start. Nodes areevident either between landmarks andpaths.
Group 4 Hybrid Pattern of groups of paths followed bylandmarks throughout the drawing.
Group 5 Hybrid The start of the sequence is dominated bypaths followed by landmarks thereafteruntil the end of the map creation.
Group 6 Spatial The start of the sequence is dominated bypaths. The rest of the sequences includelandmarks interspersed with a few pathsand nodes throughout.
landmarks that dominate the rest of the sketchmap, except for a few paths and nodes.
Based on these results a new classification isproposed in Table 4 which employs the point-oriented and linear map type categories fromAppleyard (1970), with the addition of the hy-brid, more complete, group. As noted earlier, thehybrid group describes sketch maps that havequalities of both linear, path-oriented and point-or landmark-oriented representations that do notfall neatly into either group.
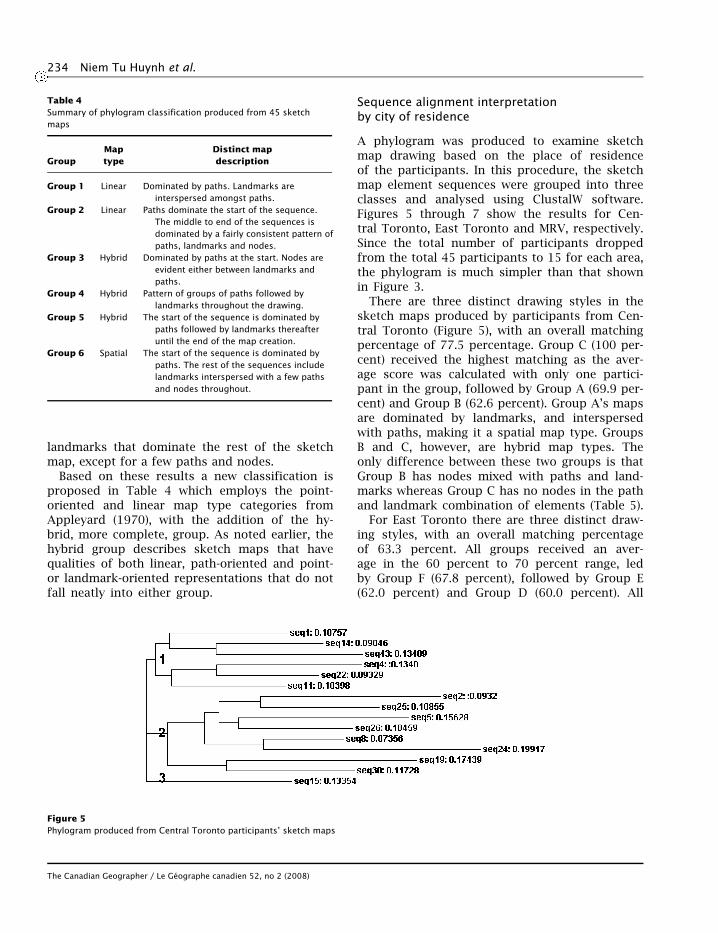
Figure 5Phylogram produced from Central Toronto participants’ sketch maps
Sequence alignment interpretationby city of residence
A phylogram was produced to examine sketchmap drawing based on the place of residenceof the participants. In this procedure, the sketchmap element sequences were grouped into threeclasses and analysed using ClustalW software.Figures 5 through 7 show the results for Cen-tral Toronto, East Toronto and MRV, respectively.Since the total number of participants droppedfrom the total 45 participants to 15 for each area,the phylogram is much simpler than that shownin Figure 3.
There are three distinct drawing styles in thesketch maps produced by participants from Cen-tral Toronto (Figure 5), with an overall matchingpercentage of 77.5 percentage. Group C (100 per-cent) received the highest matching as the aver-age score was calculated with only one partici-pant in the group, followed by Group A (69.9 per-cent) and Group B (62.6 percent). Group A’s mapsare dominated by landmarks, and interspersedwith paths, making it a spatial map type. GroupsB and C, however, are hybrid map types. Theonly difference between these two groups is thatGroup B has nodes mixed with paths and land-marks whereas Group C has no nodes in the pathand landmark combination of elements (Table 5).
For East Toronto there are three distinct draw-ing styles, with an overall matching percentageof 63.3 percent. All groups received an aver-age in the 60 percent to 70 percent range, ledby Group F (67.8 percent), followed by Group E(62.0 percent) and Group D (60.0 percent). All
The Canadian Geographer / Le Geographe canadien 52, no 2 (2008)
Interpreting urban space through cognitive map sketching and sequence analysis 235
Table 5Summary of phylogram classification produced from Central Toronto
No. of participantsGroup number Map type in group Distinct map description
Group A Point-oriented 6 Dominated by landmarks throughout. Sparsely populatedwith paths and rarely nodes.
Group B Hybrid 8 Paths dominate the start of the sequence. The middle to endof the sequence is dominated by a fairly consistentpattern of paths, landmarks and nodes.
Group C Hybrid 1 Paths dominate the start of the sequence. Fairly equal mix ofpaths and landmarks throughout.
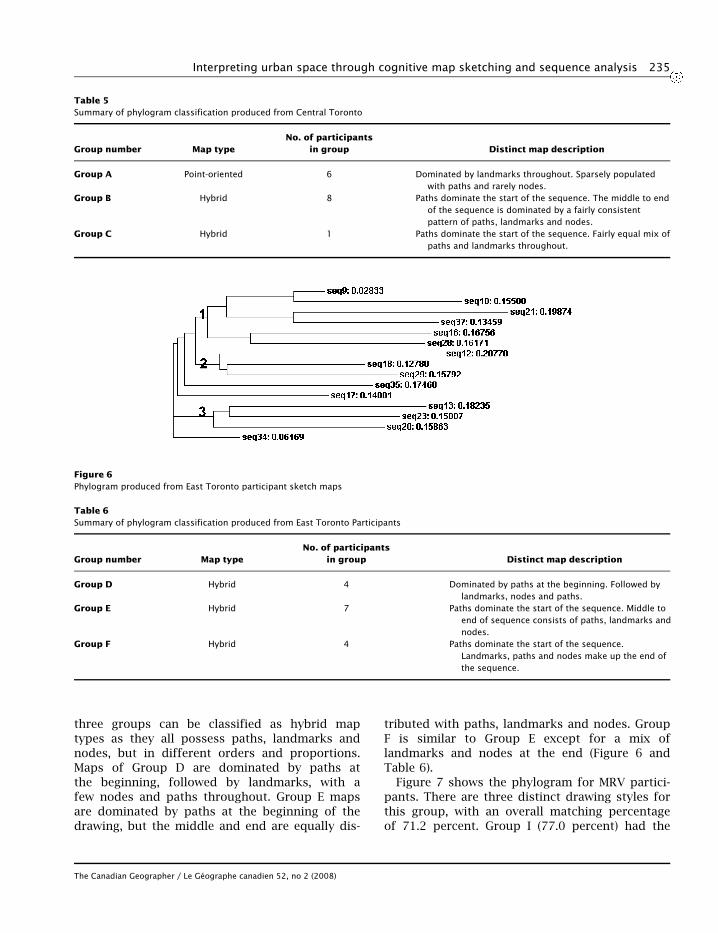
Figure 6Phylogram produced from East Toronto participant sketch maps
Table 6Summary of phylogram classification produced from East Toronto Participants
No. of participantsGroup number Map type in group Distinct map description
Group D Hybrid 4 Dominated by paths at the beginning. Followed bylandmarks, nodes and paths.
Group E Hybrid 7 Paths dominate the start of the sequence. Middle toend of sequence consists of paths, landmarks andnodes.
Group F Hybrid 4 Paths dominate the start of the sequence.Landmarks, paths and nodes make up the end ofthe sequence.
three groups can be classified as hybrid maptypes as they all possess paths, landmarks andnodes, but in different orders and proportions.Maps of Group D are dominated by paths atthe beginning, followed by landmarks, with afew nodes and paths throughout. Group E mapsare dominated by paths at the beginning of thedrawing, but the middle and end are equally dis-
tributed with paths, landmarks and nodes. GroupF is similar to Group E except for a mix oflandmarks and nodes at the end (Figure 6 andTable 6).
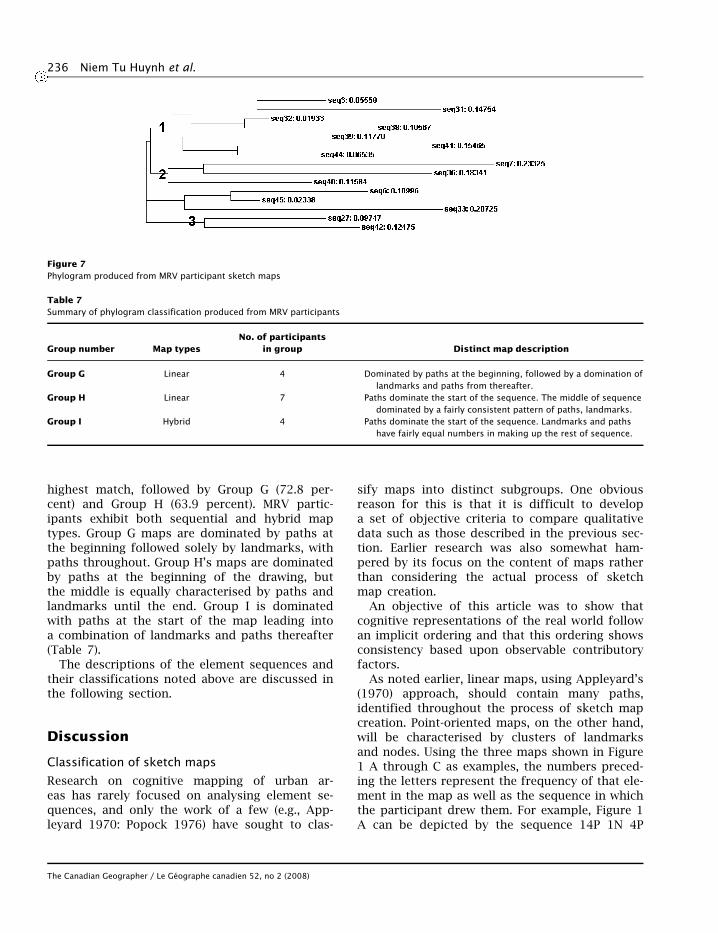
Figure 7 shows the phylogram for MRV partici-pants. There are three distinct drawing styles forthis group, with an overall matching percentageof 71.2 percent. Group I (77.0 percent) had the
The Canadian Geographer / Le Geographe canadien 52, no 2 (2008)
236 Niem Tu Huynh et al.
Figure 7Phylogram produced from MRV participant sketch maps
Table 7Summary of phylogram classification produced from MRV participants
No. of participantsGroup number Map types in group Distinct map description
Group G Linear 4 Dominated by paths at the beginning, followed by a domination oflandmarks and paths from thereafter.
Group H Linear 7 Paths dominate the start of the sequence. The middle of sequencedominated by a fairly consistent pattern of paths, landmarks.
Group I Hybrid 4 Paths dominate the start of the sequence. Landmarks and pathshave fairly equal numbers in making up the rest of sequence.
highest match, followed by Group G (72.8 per-cent) and Group H (63.9 percent). MRV partic-ipants exhibit both sequential and hybrid maptypes. Group G maps are dominated by paths atthe beginning followed solely by landmarks, withpaths throughout. Group H’s maps are dominatedby paths at the beginning of the drawing, butthe middle is equally characterised by paths andlandmarks until the end. Group I is dominatedwith paths at the start of the map leading intoa combination of landmarks and paths thereafter(Table 7).
The descriptions of the element sequences andtheir classifications noted above are discussed inthe following section.
Discussion
Classification of sketch maps
Research on cognitive mapping of urban ar-eas has rarely focused on analysing element se-quences, and only the work of a few (e.g., App-leyard 1970: Popock 1976) have sought to clas-
sify maps into distinct subgroups. One obviousreason for this is that it is difficult to developa set of objective criteria to compare qualitativedata such as those described in the previous sec-tion. Earlier research was also somewhat ham-pered by its focus on the content of maps ratherthan considering the actual process of sketchmap creation.
An objective of this article was to show thatcognitive representations of the real world followan implicit ordering and that this ordering showsconsistency based upon observable contributoryfactors.
As noted earlier, linear maps, using Appleyard’s(1970) approach, should contain many paths,identified throughout the process of sketch mapcreation. Point-oriented maps, on the other hand,will be characterised by clusters of landmarksand nodes. Using the three maps shown in Figure1 A through C as examples, the numbers preced-ing the letters represent the frequency of that ele-ment in the map as well as the sequence in whichthe participant drew them. For example, Figure 1A can be depicted by the sequence 14P 1N 4P
The Canadian Geographer / Le Geographe canadien 52, no 2 (2008)
Interpreting urban space through cognitive map sketching and sequence analysis 237
1L 4P 1L 4P 1L 1P 1N 1L 4L 1L 5P 1N (Path: 35,Landmark: 8, Node: 1, District: 0, Boundary: 0);Figure 1 B with 12P 1L 2P 1D 1N 2P 1L 3N 7L 1P2L 1P 1L 1P 1L 1P 2N 3L 1P 9L 1N 20L 2N 6L 1P8L 1N 1L 1N 4L 1P 8L 1P 1L 4P (Path: 28, Land-mark: 80, Node: 5, District: 1, Boundary: 0) andFigure 1 C with 1L 5P 1N 4P 2N 5L 2P 1N 1L 5P1N 1P 2L 2N 1L 1P 2L 3P 2L 1P 2L 1D 1N (Path:21, Landmark: 16, Node: 6, District: 1, Boundary:0).
The first sequence supports a linear map typebecause of the large number of paths sketched atthe start, followed by a consistent display of mul-tiple paths and landmarks interspersed through-out. The second sequence supports a point-oriented map type because of clusters, both largeand small, of landmarks throughout the map andthe likely use of paths as links or connectors be-tween these clusters. The third sequence is a hy-brid map since the numbers of landmarks andpaths are nearly equal to each other (±5).
The most dominant map type produced by theToronto participants was hybrid followed by lin-ear. This differs from previous research, whichreports a dominance of linear maps (Appleyard1970; Pocock 1976; Wong 1979). Specifically, thehybrid map type was dominant for 28 of the 45respondents (62.2 percent of total), followed by11 linear maps (24.4 percent of total) and onlysix point-oriented maps (13.3 percent of total).It is likely that the difference in map types is afunction of the fact that the sketch mapping andanalysis processes used in this research do notrely solely on interpreting only the final sketchmaps and its topology as was the case with ear-lier research. Rather, the multimedia approachused allows not only element sequences to be ob-jectively established, but also facilitates a muchclearer understanding of the combined effect ofelement relations to be derived as the map iscreated.
When the map types are examined by area, Cen-tral Toronto residents predominantly producedhybrid maps followed by point-oriented maptypes, whereas Eastern Toronto participants usedonly hybrid maps in their representations of localurban space. In MRV, linear maps were dominant,followed by hybrid maps. Since the maps por-tray an individual’s learning of place, it is likelythat different areas evoke somewhat differentrepresentations relative to local characteristics of
the built environment and personal interactionpatterns (Blaut and Stea 1969). This finding isconfirmed by the work of Lloyd and Heivly(1987).
An individual’s learning commences with astimulus, such as the environment, which ini-tialises a cognitive process including the abilityto encode, store and experience the immediateand eventually more distant surroundings. Theseare then compared with and/or built onto pastlearning. Consider, for example, Central Toronto,where the downtown area is dense with paths(major and minor), landmarks and nodes, whichare stimuli that residents receive and store inmemory. In Eastern Toronto, landmarks are rel-atively more dispersed than in Central Toronto,arguably providing less visual stimuli for the up-dating of cognitive information. Further, publictransport in Eastern Toronto is the dominantmode of above ground travel (78 routes trav-elling east–west and 24 travelling north–south).This serves to provide public transit users withboth passive visual (landmarks) and sensorimo-tor (paths) stimuli. This contrasts with three east–west and 23 north–south public transit routes inCentral Toronto (TTC 2007). This substantial dif-ference may help to explain why only hybrid maptypes were drawn by East Toronto participants.MRV is undergoing intensive urban developmentin the form of urban sprawl. The landscapeis a mosaic of residential neighbourhoods con-nected by roads and highways, which may pro-vide strong stimuli for the production of linearmap types for MRV residents.
ClustalW sequencing
As noted earlier, ClustalW was used in this studyto analyse sequence strings, creating the resultspresented in Figures 5–7. These figures illustratethe use of different sketch map types as well asthe recall sequence in which elements are addedto cognitive maps. All sketch maps, independentof location, start with a dominance of paths. Thisis followed with landmarks or a mix of pathsand landmarks, while nodes do not figure promi-nently in the configuration of urban space forthe participants in this study. Neither districtsnor boundaries were used to any extent by theparticipants in any of the three study areas inMetropolitan Toronto.
The Canadian Geographer / Le Geographe canadien 52, no 2 (2008)
238 Niem Tu Huynh et al.
These results reveal three methods of repeti-tive sequential orders in sketch maps of two maptypes, namely, linear and hybrid. Residents ofCentral Toronto recalled their action space usinglandmarks and paths, resulting in point-orientedand hybrid map types. East Toronto residentsemployed a strictly hybrid approach, using bothlandmarks and paths consistently in their sketchmap development, whereas MRV residents reliedon paths to structure their space.
The first result points to the influence of ur-ban structure on navigation, specifically the re-liance on landmarks, paths or both to make threenavigation-related functions, namely, the decisionto stay or go, the decision of where to go andthe decision of which route to take (Cadwallader1976). Siegel and White (1975) classify landmarksand paths as the minimum elements of spatialrepresentation, which impact on the reliance ofone or both elements in travel. For participantswho focus on landmarks, the network or bestpath is not a strong consideration. On the otherhand, individuals who rely on paths are less likelyto focus on landmarks, though they may be awarethat their route starts and ends at a landmark.These two extreme cases are balanced by a hy-brid representation. In this case, individuals arelikely to be aware of landmarks and cognisantof the path network, combining both visual andsensorimotor abilities to navigate. This suggeststhat people who rely heavily on visual learningshow a reliance on landmarks, and those who aredependent on a road network experience a sen-sorimotor form of spatial learning within urbanenvironments.
Of the five map elements, paths and land-marks take on complementary roles. In all sketchmaps, paths are used to configure the skele-tal framework for urban space either to formboundaries between areas or establish a frame-work within which to locate subsequent elements.This supports past research findings and result-ing theories (Siegel and White 1975; Golledge1978; Montello 2002) on the importance of pathsas connectors and landmarks as anchors. How-ever, it is curious that only a small group of in-dividuals in the current sample portrayed point-oriented type maps, given the important role oflandmarks in spatial development research (Hartand Moore 1973; Siegel and White 1975) andtheir cognitive distinction from other elementsin spatial memory (Presson and Montello 1988).
This suggests that individuals differ in their in-terpretation and hierarchical organisation of ur-ban space, conforming to breadth and depth ap-proaches as suggested by Taylor and Tversky(1992). Linear map creators use paths to defineboundaries giving a breadth-first approach, us-ing the paths to display an overview of the area.Point-oriented and hybrid map sketchers use adepth-first approach, choosing to draw in detailone area before going on to the next.
Conclusion
The analysis of mapping sequences of urbanspace presented in this article helps to consoli-date the process of cognitive map classification.The addition of the hybrid map type to Apple-yard’s (1970) two classes is potentially beneficialto understanding the cognitive construction of ur-ban space, built around map sequence alignmentanalysis. This suggests that there is some con-sistency in the way that residents of three dis-tinct areas articulate their interpretation of theurban spaces. Some participants were reliant onpaths as the foundation of their cognitive map,whereas others identified landmarks first, and athird group used both paths and landmarks toconfigure their cognitive representation of realworld space. The six distinct groups of sequencesidentified in this article suggest that there are dif-ferences in mental map creation that go beyondthose noted in the earlier literature. Incorporat-ing the sequence of map elements into practi-cal models could contribute to improving our un-derstanding of people’s interpretation of spatialareas, and eventually allow replication and pre-diction of the objectives and choice sets fromwhich people choose travel routes and activitydestinations.
The consolidation of an urban image is formedwith at least two elements, namely, paths andlandmarks. The implication of order in these ele-ments may extend our knowledge on place navi-gation. Paths are an important element at the pre-liminary stages of recall, though their importancemay decline in the case of point-oriented maps,or share importance with landmarks in hybridmaps. Where paths are most important, in lin-ear maps, this suggests that individuals interprettheir surroundings using paths to recall otherpaths forming a road network. The implication
The Canadian Geographer / Le Geographe canadien 52, no 2 (2008)
Interpreting urban space through cognitive map sketching and sequence analysis 239
for route navigation is that the best routes arelikely to be located first, giving less importanceto surrounding landmarks. In contrast, individ-uals who identify with landmarks may navigatebased on their knowledge of destinations but maynot necessarily choose the most efficient travelpath between the start and end points of a trip.Those who use hybrid cognitive maps are likelyto use a combination of landmarks and paths toaccess and travel through the environment suchthat the presence of paths promotes the recallof landmarks and vice versa. These individualsmay arguably be the most efficient travellers asthey rely on both types of prominent cues fornavigation.
The findings from this exploratory researchcan be a starting point for several areas of fu-ture work. In particular, renewed focus can beplaced on the sequencing of sketch map cre-ation and information recall to provide a newmeans with which to model the extent and con-tent of cognitive maps of urban areas. For ex-ample, the sequence strings of each sketch mapare similar to a string of DNA in the sense thatneither cognitive map element sequence stringsnor DNA strands from two people are identical.This suggests that knowledge of individual se-quence strings may help to identify an individ-ual’s environmental awareness and perception aswell as be of assistance in way-finding withincomplex urban environments. Insights into thisprocess can provide more substance to our un-derstanding of how individuals structure urbanspace and use this to navigate both known andnew environments.
Acknowledgements
The authors would like to extend their gratitude to the sub-jects who participated in this study and to the Social Sciencesand Humanities Research Council for funding this project.The authors also convey special thanks to Dr. Bob Sharpe,who provided insightful ideas to the thesis from which thisarticle is developed and to the reviewers and editor of thisjournal for their thoughtful feedback.
References
ABBOTT, A. 1995 ‘Sequence analysis: new methods for old ideas’Annual Review of Sociology 21, 93–113
APPLEYARD, D. 1970 ‘Styles and methods of structuring a city’ En-vironment and Behavior 2, 100–117
APPLEYARD, D., LYNCH, K., and MYER, J. 1964 The View from the Road(Cambridge, MA: Massachusetts Institute of Technology Li-brary)
ARAGONES, J., and ARREDONDO, J. 1985 ‘Structure of urban cognitivemaps’ Journal of Environmental Psychology 5, 197–212
BANAI, R. 1999 ‘A methodology for the image of the city’ Envi-ronment and Behavior B: Planning and Design 26, 133–144
BANERJEE, T., BATTRO, A., ELLIS, E., DOWNTON, P., SUSULOWSK, M., and TOMASZEWSK,
T. 1977 Growing up in Cities (Cambridge, MA: The Mas-sachusetts Institute of Technology Press)
BARGEMAN, B., JOH, C. H., and TIMMERMANS, H. 2002 ‘Vacation behaviorusing a sequence alignment method’ Annals of Tourism Re-search 29(2), 320–337
BLAUT, J. M. and STEA, D. 1969 Place Learning. No. Place PerceptionResearch Reports—Report Number 4 (Worcester, MA: ClarkUniversity)
BRIGGS, R. 1976 ‘Methodology for the measurement of cognitivedistance’ in Environmental knowing, eds. G. Moore and R.Golledge (Stroudsburg: Dowden, Hutchinson & Ross) 325–334
BROWN, M., and BROADWAY, M. 1981 ‘The cognitive maps of ado-lescents: confusion about inter-town distances’ ProfessionalGeographer 33(3), 315–325
BUTTENFIELD, B. 1986 ‘Comparing distortion on sketch maps andMDS configurations’ Professional Geographer 38(3), 238–246
CADWALLADER, M. 1976 ‘Cognitive distance in intraurban space’in Environmental Knowing, eds. G. Moore and R. Golledge(Stroudsberg: Dowden, Hutchinson & Ross) 316–324
CARR, S., and SCHISSLER, D. 1969 ‘The city as a trip: perceptual selec-tion and memory in the view from the road’ Environmentand Behaviour 1, 7–35
CLUSTALW. 2007 Guide to CLUSTALW (Available at: http://www.ebi.ac.uk/clustalw/clustalw help.html, accessed on 5 Octo-ber 2007)
COREL CORPORATION. 2003 Corel Draw 9 (Version 9.0) (Ottawa, ON:Corel Corporation)
DEVLIN, A. 1976 ‘The ‘small town’ cognitive map: Adjusting to anew environment’ in Environmental Knowing, eds. G. Mooreand R. Golledge (Stroudsburg: Dowden, Hutchinson & Ross)58–66
DURBIN, R., EDDY, S., KROGH, A., and MITCHISON, G. 1999 Biological SequenceAnalysis: Probabilistic Models of Proteins and Nucleic Acids(Cambridge: University Press)
ELOFFSON, A. 2002 ‘A study on protein sequence alignment qual-ity’ Proteins: Structure, Function and Genetics 46, 330–339
EMBL-EBI. 2007 ClustalW (Available at: http://www.ebi.ac.uk/clustalw/, accessed on 5 October 2007)
GELB, I. 1963 A Study of Writing (Chicago: University of ChicagoPress)
GOLLEDGE, R. 1978 ‘Representing, interpreting, and using cognizedenvironments’ Papers of the Regional Science Association41, 169–204
—. 2004 Conversation with Prof. Golledge on Sequence in Men-tal Maps, in ed. N. T. Huynh (Waterloo)
HART, R., and MOORE, G. 1973 ‘The development of spatial cogni-tion: a review’ in Image and Environment, eds. R. Downsand D. Stea (Chicago: Aldine Publishing Company) 246–288
HIRTLE, S., and JONIDES, J. 1985 ‘Evidence of hierarchies in cognitivemaps’ Memory and Cognition 13(3), 208–217
HOLYOAK, K., and MAH, W. 1982 ‘Cognitive reference points in judg-ments of symbolic magnitude’ Cognitive Psychology 14,328–352
The Canadian Geographer / Le Geographe canadien 52, no 2 (2008)
240 Niem Tu Huynh et al.
HORTON, F. E., and REYNOLDS, D. R. 1971 ‘Effects of urban spatial struc-ture on individual behaviour’ Economic Geography 47, 36–48
HUYNH, N. T., and DOHERTY, S. T. 2007 ‘Digitial sketch map drawingas an instrument to colllect data about spatial cognition’Cartographica 42(4), 285–296.
JOH, C. H., ARENTZE, T., HOFMAN, F., and TIMMERMANS, H. 2002 ‘Activ-ity pattern similarity: a multidimensional sequence align-ment method’ Transportation Research, Part B 36, 385–403
KEMPERMAN, A., BORGERS, A., and TIMMERMANS, H. 2002 ‘A semiparamet-ric hazard model of activity timing and sequencing deci-sions during visits to theme parks using experimental de-sign data’ Tourism Analysis 7, 1–13
LADD, F. 1970 ‘Black youths view their environment: neighbour-hood maps’ Environment and Behavior 9(7), 74–99
LEE, T. 1968 ‘Urban neighbourhood as socio-spatial schema’ Hu-man Relations 21, 241–267
LLOYD, R., and HEIVLY, C. 1987 ‘Systematic distortions in urban cog-nitive maps’ Annals of the Association of American Geogra-phers 77(2), 191–207
LYNCH, K. 1960 Image of the City (Cambridge, MA: The Technol-ogy Press & Harvard University Press)
—. 1981 A Theory of Good City Form (Cambridge, MA: Mas-sachusetts Institute of Technology Press)
LYNCH, K., HERTZFELD, A. J., and ATKINSON, W. D. 1997 Graphical User In-terface for Navigating between Levels Displaying Hallwayand Room Metaphors, United States Patent (United Statesof America: General Magic) 68
MCNAMARA, T. P. 1992 ‘Spatial representation’ Geoforum 23, 139–150
MONTELLO, D. 1998 ‘A new framework for understanding the ac-quisition of spatial knowledge in large-scale environments’in Spatial and Temporal Reasoning in Geographic Informa-tion Systems, eds. M. Egenhofer and R. Golledge (New York:Oxford University Press)
—. 2002 ‘Cognitive map-design research in the twentiethcentury: theoretical and empirical approaches’ Cartog-raphy and Geographic Information Systems 29(3), 283–304
PERUCH, P., GIRAUDO, M.-D., and GARLING, T. 1989 ‘Distance cognition bytaxi drivers and the general public’ Journal of Environmen-tal Psychology 9, 233–239
POCOCK, D. 1976 ‘Some characteristics of mental maps: an em-pirical study’ Transactions of the Institute of British Geog-raphers 1, 493–512
PRESSON, C., and MONTELLO, D. 1988 ‘Points of reference in spatialcognition: stalking the elusive landmark’ British Journal ofDevelopmental Psychology 6, 378–381
SHERMAN, R., CROXTON, J., and GIOVANATTO, J. 1979 ‘Investigating cog-nitive representations of spatial relationships’ Environmentand Behavior 11(2), 209–226
SHOVAL, N., and ISAACSON, M. 2007 ‘Sequence alignment as a methodfor human activity analysis in space and time’ Annals ofthe Association of American Geographers 97(2), 282–297
SIEGEL, A., and WHITE, S. 1975 ‘The development of spatial repre-sentations of large-scale environments’ in Advances in ChildDevelopment and Behavior , ed. H. Reese, Vol. 10 (New York:Academic Press) 9–55
STATISTICS CANADA. 2007 April 4, 2007. Community Profiles.(Available at: http://www12.statcan.ca/english/profil01/PlaceSearchForm1.cfm, accessed on 5 October 2007, 2004)
STEVENS, A., and COUPE, P. 1978 ‘Distortions in judged spatial rela-tions’ Cognitive Psychology 10, 422–437
TAYLOR, H., and TVERSKY, B. 1992 ‘Descriptions and depictions ofenvironments’ Memory and Cognition 20(5), 483–496
TECHSMITH. 2003 Camtasia Studio (Version 2)TOLMAN, E. 1948 ‘Cognitive maps in rats and men’ The Psycho-
logical Review 55(4), 189–208TROWBRIDGE, C. 1913 ‘On fundamental methods of orientation and
imaginary maps’ Science 38, 888–897TTC (Cartographer). 2007 Ride GuideTVERSKY, B., and TAYLOR, H. 1998 ‘Acquiring spatial and temporal
knowledge from language’ in Spatial and Temporal Reason-ing in Geographic Information Systems, eds. M. Egenhoferand R. Golledge (New York: Oxford University Press)
WATSON, J. D., and CRICK, F. H. C. 1953 ‘A structure for deoxyribosenucleic acid’ Nature 171, 737–738
WONG, K. 1979 ‘Maps in minds: an empirical study’ Environmentand Planning A 11(11), 1289–1304
The Canadian Geographer / Le Geographe canadien 52, no 2 (2008)
Recommended


