
Proceedings of the CIB W78-W102 2011: International Conference –Sophia Antipolis, France, 26-28 October
KEY PERFORMANCE INDICATORS TO ANALYZE AND IMPROVE MANAGEMENT OF INFORMATION FLOW IN THE BIM DESIGN PROCESS
Leonardo Manzione, PhD Candidate, [email protected] Escola Politécnica at University of Sao Paulo, Brazil (POLI-USP) Mariana Wyse, MSc Candidate, [email protected] Escola Politécnica at University of Sao Paulo, Brazil (POLI-USP) Rafael Sacks, Associate Professor, [email protected] Technion-Israel Institute of Technology, Haifa, ISRAEL
Léon van Berlo, PhD Candidate, [email protected] Netherlands Organisation of Applied Scientific Research TNO, Delft, The Netherlands
Silvio B. Melhado, Associate Professor, [email protected] Escola Politécnica at University of Sao Paulo, Brazil (POLI-USP)
ABSTRACT
Thanks to the interoperability provided by the IFC standard, BIM technologies and IFC model servers
are beginning to enable a design environment where the exchange of information among the actors can
be synchronous and continuous using a single and central data model. Although this new set of
technologies enables concurrent design, the problems associated with managing the flow of
information itself in a concurrent design environment requires explicit management of editing rights
and version control at the level of individual objects, rather than at the file level. However, while these
are technical issues that have standard solutions, managing designers’ involvement in the process also
becomes more challenging, requiring the development of new management methods suitable for the
BIM collaborative environment.
Common problems such as information ‘overflow’, incomplete modelling solutions or incorrectly
matched technical solutions, and inventories of work in progress due to inattentive designers, if not
treated methodically in the BIM platform, can quickly cause bottlenecks for the advancement of the
process. The bottlenecks result in process waste (such as time spent waiting, large inventories of
design information, processing sequences that cause unnecessary iterations, long cycle times and
schedule overruns, etc.). Application of concepts that allow structuring and measuring of the
information flow can improve the process and reduce the waste of resources, but there is no specific
methodology for measuring information flow in a BIM environment. Taking a previous study, in
which seven key performance indicators were developed and validated for application with
conventional technology, as a starting point, this work has developed the methodology for using these
indicators in a BIM project.
Keywords: information flow measure, collaborative design, model server, design management
1. INTRODUCTION
When talking about building construction, developers’ claims about design delivery being late are
common. The design process is informally managed, with inappropriate planning techniques and low
utilization of IT resources. There are also claims from the design professionals because of the need for
rework, which is responsible for the loss of profits (MANZIONE, 2006).
Due to the interoperability provided by the IFC standard, BIM technologies and IFC model servers
are beginning to enable a design environment where the exchange of information among the actors can
be made synchronously and continuously using a single and central data model (KERRY LONDON,
2010). Although this new set of technologies enables concurrent design, the problems associated with
managing the information flow itself in a concurrent design environment require explicit management
of editing rights and version control at the level of individual objects, rather than at the file level.
However, while these are technical issues that have standard solutions, managing designers’
involvement in the process also becomes more challenging, requiring the development of new
management methods suitable for the BIM collaborative environment.
The purpose of this paper is to propose a new methodology for the organization, planning and
control of design processes within BIM technology, focusing on defining key performance indicators
(KPIs) to measure process efficiency. Information is the fuel for the design process and the proper organization of the flow of
information constitutes one of the key actions to ensure that a project’s goals are achieved. The design process has a variable nature. In the first development stages, the information content
has high impact on the final solution, and as the process follows to more advanced stages the impact is
reduced, corresponding to the passage from a less structured status with more uncertainty where
negotiations are required, to a more structured status, where information flow complexity grows with
the larger number of actors involved (Austin et. al., 2002).
Traditionally, the design process has been planned with the same techniques used for construction
planning. But these techniques don’t allow representation of the cycles and iteration existing in a
process as complex as the design process. They only monitor design’s progress based on the
conclusion and delivery of 2D designs instead of analyzing the increment and advance of the design
through key information that aggregates along the process. BIM technology potentially increases the
rise in information content impact as it enables all actors to work together from the start of the process
due to its semantic richness.
This semantic richness of BIM technology generates an additional obstacle to the process as it
facilitates integration and exchange between actors and demands a structured methodology for
managing the information flow and the design process as a whole. The literature on this subject
consists of several published papers defining concepts and methodologies developed towards directing
the implementation of BIM as a process (SCIENCES, 2007), (UNIVERSITY, 2010), (KRISTINE K.
FALLON, 2007). Other structured methodologies, like ADePT (Austin 1999), (Austin 2002), were
developed in an attempt to structure the design process in a generic way, but without focusing on BIM
(Austin 2001). More recently, the Inpro Project (Benning et al. 2010(PIERRE BENNING, 2010) can
be considered as a broader initiative, as it organizes the initial stages of the BIM design process,
aligning the management and information technology demands in IFC language within a collaborative
Hub.
In the BIM universe, the preparation of Information Delivery Manuals (IDM) (WIX, 2006) has
been used as a process structuring methodology. The main goal of developing an IDM and Model
View Definitions (MVD) is to define specifications to map information exchange between object
models in IFC, for implementation in software interfacing. Later, rules for its use in process models
were developed through Business Process Modeling Notation (BPMN) (WHITE, 2004), (OUYANG,
2009)(Ouyang 2009). BPMN was adopted in the IDM methodology as a process mapping tool and has
been efficient, for it creates a bridge linking the design process conception and its implementation,
establishing stages, defining responsibilities for each involved actor and creating models of
information exchange through Exchange Requirements (RAFAEL SACKS, 2010a). Although the
developed methodology has consistency and serves its specific purposes, a systemic approach that
combines these methods and enables process planning and control in an integrated IFC platform is still
lacking.
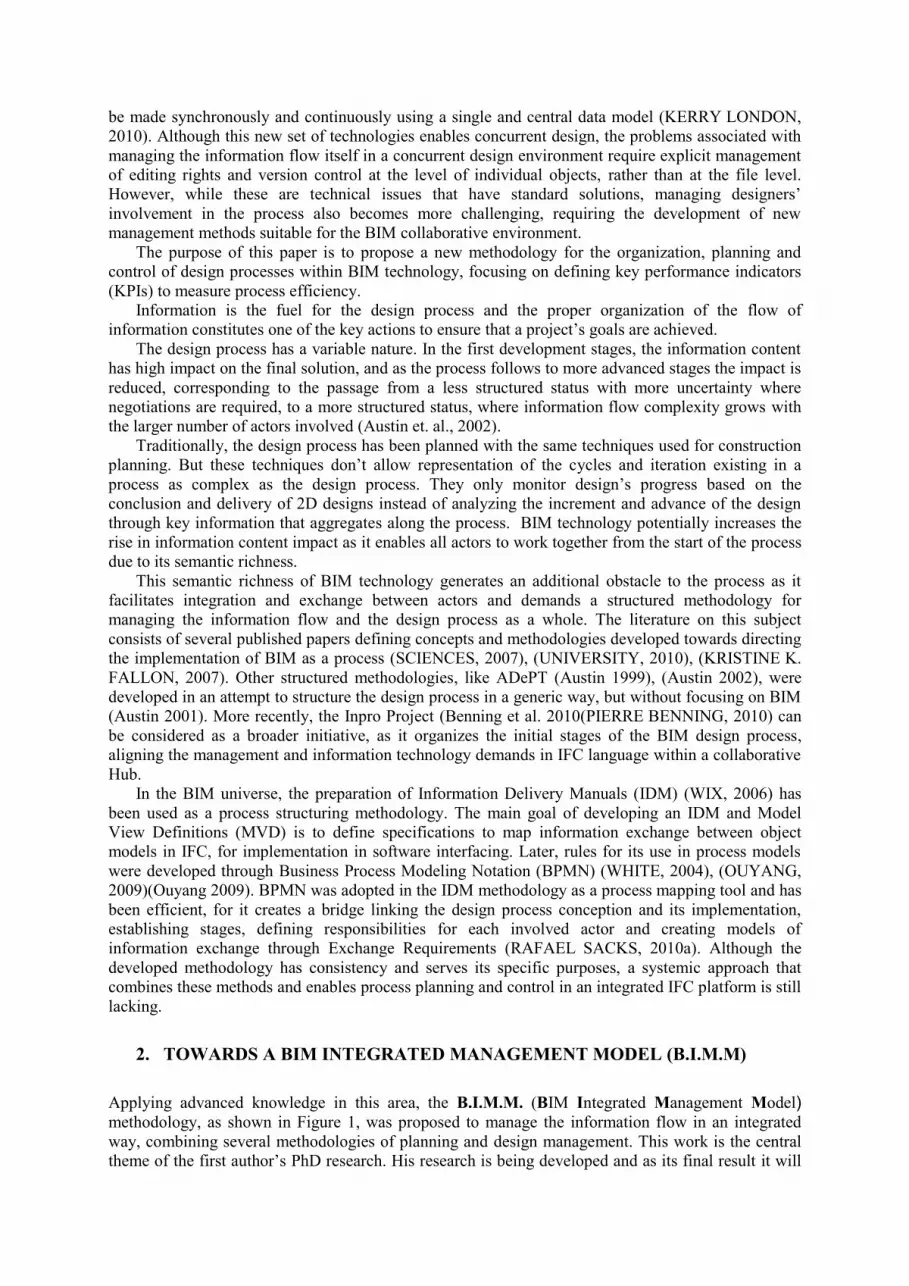
2. TOWARDS A BIM INTEGRATED MANAGEMENT MODEL (B.I.M.M)
Applying advanced knowledge in this area, the B.I.M.M. (BIM Integrated Management Model) methodology, as shown in Figure 1, was proposed to manage the information flow in an integrated
way, combining several methodologies of planning and design management. This work is the central
theme of the first author’s PhD research. His research is being developed and as its final result it will

establish the necessary procedures for each stage defined from 1 to 11, as well as the proposition of a
collaborative Hub for its support.
Figure 1: BIM Integrated Management Model (B.I.M.M.)
The methodology’s steps will be briefly presented, followed by explanation of the detailed
procedure to measure the process efficiency through its KPIs. The methodology consists of four main
interconnected loops. Their goals, methods and IT tools used are listed in table 1.
A. Process Model Loop
Organizing the design process requires studying all activities predecessors through the information
flow and for this purpose the use of BPMN methodology may lead to flaws as it doesn’t allow the
optimization of information flow and the entrance of information may occur in advanced moments
where they would result in rework cycles. The Design Structure Matrix (DSM) is a planning tool that
allows optimization of the information flow and has been intensively and thoroughly studied
(STEWARD, 1981). We suggest the use of the DSM combined with the BPMN as a process
improvement. In this case the IDM is used as a guide.
B. Planning Loop
In the planning loop, we need to be careful to distinguish between the different levels of resolution
of planning. We think the DSM and the Critical Path Method (CPM) should be used for the Master
Planning, which sets the major design project milestones, and only the milestones. The planning
cycles review not only the completion of each detailed phase, but also within each phase from time to
time. After that, in the planning stage, one can use the DSM again together with process mapping or
with the detailed IDM process maps to prepare phase schedules. These could be good for say 1-3
month time slots.
At this level of resolution, one can define actual information transfers that can be monitored using
the control cycle. The planning for each phase should be a team collaboration effort, where the
different actors meet to prepare the process map and define the interchanges of information among
themselves. This should produce a practical and doable plan, in a similar way to doing weekly work
planning for production activities using the Last Planner System (LPS).
C. Control Loop
Model and workbreakdown
Design Structure Matrix(DSM)
CPM/GANTTPLANNING
LOOP
CONTROLLOOP
MODELING
IFC ANALYSIS
DASHBOARDKPI Measures
PPCLast Planner
DisciplinesSwinlanes
1
4
56
7
8
9
MODEL CONCLUSION
EDITINGMODELLING
LOOP
Architecture
Structure
COORDINATIONDesignExchanges
and Central Model Updates
10
ArchitectureStructure
HVACCoordination
HVAC
ExchangesRequirements
B.I.M.M. Collaboration Hub
CORRECTIVEACTIONS
PROCESS MODELLOOP
2
3
2
3
IDM/BPMN
10
Information Delivery Manual (IDM)Business ProcessModelling Notation (BPMN)
11
MODELEVOLUTION

The Control Loop uses the BIMserver (LÉON VAN BERLO, 2010) as a BIM model repository
and IFC analyzer (LIPMAN, 2010) as a tool to develop coverage analysis for IFC data. Analyzing the
content of the IFC model with IFC analyzer allow us to measure the efficiency of the design through
the measures of the information flow with KPIs (RAFAEL SACKS, 2010b). Then the control loop
goes in progression from Modeling to BIMserver to IFC analyzer to KPIs and the dashboard.
D. Modeling Loop
The Modeling Loop occurs across all processes, from the start and incrementally as the project
progresses. The Planning and Control Loops give feedback to the modeling process.
LOOP STEP NAME GOALS METHODOLOGIES
AND IT TOOLS
PR
OC
ES
S M
OD
EL
1 WBS / MBS Define roles and disciplines
swimlanes
Break the work and the model into
manageable parts
Work Breakdown Structure
Model Breakdown Structure
2 IDM /
BPMN Process Model
Exchange Requirements
Exchange Models
Information Delivery Manual
Business Process Modeling
Notation (BPMN)
3 DSM Optimize the BPMN information flow Design Structure Matrix
PL
AN
NIN
G 4 CPM Master Plan
Sequencing phases, scheduling tasks
and information milestones
Critical Path Method (CPM)
MSProject, Primavera, etc.
5 LPS
Last Planner, short term tasks and
information delivery
Last Planner System (LPS) and
Percent Planned Completed
(PPC)
CO
NT
RO
L
6 Modeling Modeling in incremental stages BIM software tools
7 Coordination Model Merge and IFC Integration
Clash detection
BIMserver
8 IFC
Analysis Developing Coverage Analysis for IFC
Files
IFC File Analyzer - NIST
9 Dashboard
KPIs: Key
Performance
Indicators
measure
AR Action Rate BS Batch Size
PS Package Size DV Development Velocity
WIP Work in Process BN Bottleneck
RW Rework
MO
DE
LIN
G 10 Action From the KPIs the necessary correcting actions are raised to define the next
steps, process feedback and modeling.
11 Evolution Design model will develop through coordinated evolution cycles until it
reaches its final form.
Table 1: BIM Model Management Procedure: Phases and Steps
3. KEY PERFORMANCE INDICATORS METHODOLOGY
Structuring the proposed methodology will require several steps, with the measure of process
performance being one of the most important steps. For that, this paper’s main goal is to specifically
define the KPIs for a BIM environment, and to establish how information flow evaluation will be
measured in the management model previously presented.
Taking a previous study of Tribelsky and Sacks (2010b), in which seven key performance
indicators were developed and validated for application with conventional technology, as a starting
point, this work has developed the methodology for using these indicators in a BIM project. A BIM
model of a simple housing building with only the architectural discipline (Figure 2) was used for
testing. Five stages of evolution of this model, in which the degree of detail steadily increases, were
simulated and for each one of the stages an IFC data was exported and sent to the BIMserver using a

hypothetical user. Later, the IFC data were processed in the IFC analyzer and generated the respective
worksheets.
Figure 2: Stages of model’s sample evolution
For KPI calculation some preliminary definitions are needed. These concepts were defined in a
previous paper by Tribelsky and Sacks (2010) and are reproduced using the IFC file analyzer
generated screens. For better conceptual understanding of the IFC file analyzer, Figure 3 shows the
correspondence between the Information Objects definitions and Information attributes crossing and
corresponding with the IFC Schema.
Figure 3: Correspondence between IFC analyzer and IFC Schema
Basic definitions:
The KPIs are based on lean concepts, such as batch sizes, bottlenecks and work in process and
they measure patterns and rates of design information. To enable their calculation, a number of
concepts were defined below, (Table 2).
INFORMATION PACKAGE
Definition Represents an entire model or a subset of a model in an exchange, (Figure 4)
Figure 4: An Information Package
INFORMATION OBJECT
Definition A distinct component of a building or facility with technical and engineering attributes and
characteristics, (Figure 5).
INFORMATION ITEM
Definition A single piece of information. It may be textual or graphic.An information package represents a
set of information items, (Figure 5).
INFORMATION OBJECTS
INFORMATIONATTRIBUTES
Information PackageA entire model or a subset of a model in an exchange.
IFAIFC file analyser spreadsheet representing the whole content of the package information

Figure 5: An Information Object and an Information Item
INFORMATION ATTRIBUTE
Definition A technical, engineering or management attribute of an information object such as its dimensions,
material type, supplier name, colour, price, etc. The value of an information attribute may appear
in any number of information packages, (Figure 6).
Figure 6: An Information Attribute
ACTION
Definition Performed by a team member to communicate information. In our case: upload or download an
IFC data to the central model at BIMserver and vice-versa.
INFORMATION BATCH
Definition A set of information packages transferred together.
Table 2: Basic Definitions
4. KPIS DEFINITION AND PROOF OF CONCEPTS
With the definitions and model data example from Figure 3, the KPIs were calculated for the
sample models using the IFC analyzer and the BIMserver data indicated in tables 3 and 4, and
represented graphically through a dashboard as shown in Figure 8. From Tribelsky and Sacks’
definitions of KPIs for traditional projects, we are able to extend and prove their utilization in a BIM
environment, as shown in the following table:
AR: ACTION RATE
Definition: The rate at which information is transferred, (Figure 7).
Goal This index goal is to measure design team members’ actions
Formula This KPI is calculated from the measurement of users' actions directly from a BIMserver log file.
The average over any given time period t1 to t2 for a number of team members nTM is defined as:
Information ItenA single piece of information
Information Object
Information AttributeA technical or management attibute of an information object
IfcArbitraryClosedProfileDef
IfcArbitraryProfileDefWithVoids
IfcCircleProfileDef
IfcExtrudedAreaSolid
IfcRectangleProfileDef
IfcDoorLiningProperties
IfcDoorStyle
IfcPropertySet
IfcPropertySingleValue
IfcRelDefinesByProperties
IfcWindowLiningProperties
IfcWindowStyle
IfcMaterial
IfcMaterialLayer
IfcMaterialLayerSet
IfcMaterialLayerSetUsage
IfcRelAssociatesMaterial
IfcGeometricRepresentationContext
IfcGeometricRepresentationSubContext
IfcGeometricSet
IfcMappedItem
IfcMaterialDefinitionRepresentation
IfcProductDefinitionShape
IfcRepresentationMap
IfcShapeRepresentation
IfcStyledRepresentation
Actions at BIMServerRevisions, Checkouts

Figure 7: Action Rate = Actions of a user at BIMserver per unit time
PS: PACKAGE SIZE
Definition: Quantifies the level of detail of information packages
Goal This KPI measures the level of detail of the information contained in the packages and enables the
evaluation of the rate of accumulation of these details, allowing the deduction of the level of design
conclusion. A change in the package information size doesn’t necessarily reflect an increase or a
reduction of transferred information content, which is why this KPI is, based on units of information
counted.
Formula nIAi v is the number of attributes belonging to an information object that have values assigned to
them (at time t), and nIO is the total number of information objects in the package. In the IFC
analyzer worksheet, the Package Size is calculated directly by adding the number of entities
corresponding to the IFC classes of the IFC Shared Building Elements, (Table 4).
Obsv. An important point is to measure how complete the package is and it will be necessary to first
determine what size it should have. The solution to this problem is not simple because it sets the
amount of information that should be contained in a project, and specifying it will require planning
of packages to be produced and referencing them to specific stages of development. By estimating
the total PS we can define the PSMaturity by the following formula. In the example, the PSM was
calculated by dividing each PS value from each model version by the total PS of the last version, for
in this case this value was already known; in other cases it could have been estimated.
Formula
WIP: WORK IN PROGRESS
Definition: The number of available but unused information packages
Goal As this KPI measures the delay between information upload and download, it indicates possible
bottlenecks in team members that build up a large volume of information before initiating their
work.
Formula This KPI is based on calculating the interval time that a package of information is available on a
server waiting to be downloaded or viewed by the interested user. Working with a model in the
central BIMserver the calculation of this KPI is simple and uses the BIMserver log file with the
actions date of the team member k. Tupj is the day on which package j was uploaded, package size
(PS) is as defined earlier and Uj = 1, if package j has been viewed or downloaded by team member
k, Uj = 0 if not. In the example, the WIP was calculated from normalized distributions of the
number of IFC entities counted in the IFC analyses in each model version.
BS: BATCH SIZE
Definition: The batch volume of information transferred
Goal This KPI reflects the quantity of information built up by a specific team member since his last
information input. Professionals have a frequently observed tendency to transmit information in
large packages, usually right before meetings or on the eve of a payment milestone date. This
procedure is adopted for the optimization of office production, but it harms their team partners’
workflows, which are frozen while waiting for information. Instead, it is recommended that
information should be transferred in many small packages.
Formula nIP is the number of information packages in the batch. In the example, the number of information
objects in each model version was counted by the IFC analyzer.

DV: DEVELOPMENT VELOCITY
Definition: Represents the speed with which information is transferred to the Project team.
Goal Allows the identification of bottlenecks in the process as low speed can point out delays and big
packages of information being transferred.
Formula Easily measured because it is calculated directly from measures of Package Sizes or Batch Sizes.
BN: BOTTLENECKS
Definition: Identifies possible bottleneck partners in the process at any given time.
Goal Allow the identification of the nodes where information gets obstructed in its flow.
Formula Easily measured because it correlates the indices DV and WIP. With the IFC analyzer this KPI was
graphically calculated by the correlation of DV and WIP indexes; the linear correlation index was
also calculated, and in the example we’ve obtained -0.79, which shows strong relation to these
indices.
RW: REWORK
Definition: Quantify the rework included in information packages
Goal The goal is to identify rework resultant from negative iterations, and the KPI calculation must be
supplemented by the direct analysis of the design and the observations of the changes occurred so
negative and positive iterations can be separated.
Formula nIAt is obtained through the counting of Information Attributes, whose values were modified in the
time gap between T and T-1. This KPI is obtained by using the IFC analyzer to process
simultaneously two different model versions (T and T-1), and compare IFC entities existent in both
versions, and the count of attributes that have suffered any modifications (Table 4).
Table 3: KPIs Definition
5. KPIS CALCULATION AND DASHBOARD
With the data example (Figure 3) and the definitions the KPIs were calculated. The sample model data
are calculated with the metadata of BIMServer and the results of IFC analyser. The results are
indicated in Table 4 and the KPIs are represented, as an illustration, through a dashboard as show in
Figure 8 below.
Action Rate Package Size Maturity
0,00
0,50
1,00
1,50
2,00
2,50
19/04/11 20/04/11 21/04/11 22/04/11 23/04/11
Action Rate
-
0,2000
0,4000
0,6000
0,8000
1,0000
1,2000
1 2 3 4 5
Package Size Maturity

Work in Process Batch Size
Development Velocity Bottlenecks
Rework
Figure 8: KPIs Dashboard
-1,50
-1,00
-0,50
0,00
0,50
1,00
1,50
1 2 3 4 5
Work in Process Normalized
-
5.000
10.000
15.000
20.000
25.000
30.000
35.000
1 2 3 4 5
Batch Size
-1,5
-1
-0,5
0
0,5
1
1,5
1 2 3 4 5
Development Velocity Normalized
-1,50
-1,00
-0,50
0,00
0,50
1,00
1,50
-1,5 -1 -0,5 0 0,5 1 1,5
DV
WIP
Linear (DV)
0 0 0 0
-63,50
1 2 3 4 5
Rework

Table 4: IFC analyzer spreadsheet and KPIs calculation

REFERENCES
Austin, S. (1999). "Analytical design planning technique: a model of the detailed building design
process." Design Studies 20(3): 279-296.
Austin, S. (2002). "Modeling and managing project complexity." International Journal of Project
Management 20(3): 191-198.
Austin, S. et al. (2001). "Design Chains: a Handbook for Integrated and Collaborative Design."
Loughborough, Loughborough University.
London, K., et al. (2010). "Towards the Development of a Project Decision Support Framework for
Adoption of an Integrated Building Information Model using a Model Server. Building
Information Modeling and Construction Informatics". J. U. U. Isikdag. New York,
Information Science Reference: 270-300.
Fallon, K., et. al (2007). General Buildings Information: Handover Guide: Principles, Methodology
and Case Studies, National Institute Of Standards and Technology: 99.
Berlo, L. et. al (2010). "BIMSERVER.ORG – an Open Source IFC Model Server". 27th International
Conference - Applications of IT in the AEC Industry & Accelerating BIM Research Workshop,
Cairo, Egypt, CIB.
Lipman, R. (2010). "Developing Coverage Analysis for IFC Files". 27th International Conference -
Applications of IT in the AEC Industry & Accelerating BIM Research Workshop, Cairo,
Egypt, CIB.
Manzione, L. (2006)." Estudo de Métodos de Planejamento do Processo de Projeto de Edifícios".
Master Dissertation, Universidade de São Paulo.
Ouyang, C., et al. (2009). "From Business Process Models to Process-oriented Software Systems: The
BPMN to BPEL Way." ACM Transactions on Software Engineering and Methodology.
Benning, P., et al. (2010). "Collaboration processes. Framework for Collaboration". Inpro Report,
Inpro Consortium: 43.
Sacks, R., et al. (2010). "Introducing a new Methodology to Develop the Information Delivery
Manual for AEC Projects". 27th International Conference - Applications of IT in the AEC
Industry & Accelerating BIM Research Workshop, Cairo, Egypt, CIB.
Sciences, National Institute of Building (2007). National Building Information Model Standard.
"Overview, Principles and Methodologies".
Steward, D. (1981). "The Design Structure System: a Method for Managing the Design of Complex
Systems." IEEE Transactions on Engineering Management 28: 71-74.
Tribelsky, E., and Sacks, R., (2011). "An empirical study of information flows in multi-disciplinary
civil engineering design teams using lean measures", Architectural Engineering and Design
Management (in press).
University, The Pennsylvania State (2010). "BIM Project Execution Planning Guide – Version 2.0".
University Park, PA, USA., The Pennsylvania State University: 127.
White, S. A. (2004). "Introduction to BPMN", IBM Corporation.
Wix, J. (2006). "Information Delivery Manual Guide to Components and Development Methods",
buildingSMART, Oslo, Norway: 82.
Recommended


