
ST. ANTHONY FALLS LABORATORY Engineering, Environmental and Geophysical Fluid Dynamics
Project Report No. 506
Lake Evaporation Response to Climate in Minnesota
by
Filiz Dadaser-Celik
and
Heinz G. Stefan
Prepared for Legislative Citizens Committee on Minnesota Resources
St. Paul, Minnesota
March 2008
Minneapolis, Minnesota

2

The University of Minnesota is committed to the policy that all persons shall have equal access to its programs, facilities, and employment without regard to race, religion, color, sex, national origin, handicap, age or veteran status.

4
Abstract
In this report we analyze the variability of water losses by evaporation from lake surfaces
in Minnesota, and trends in lake evaporation for the period 1964 – 2005. Daily evaporation rates
were estimated using a mass-transfer equation with recorded daily weather data as input. The
weather data came from six Class A weather stations (International Falls, Duluth, Minneaplis/St.
Paul, LaCrosse, WI, Sioux Falls, SD, and Fargo, ND). Annual (Jan-Dec) lake evaporation
ignoring lake ice-covers and annual evaporation for the actual open-water season were computed
from the daily values. Trends in annual evaporation over the periods 1964 – 2005 and 1986 –
2005 were determined using a linear regression method. The trend analysis was repeated for
annual water availability (precipitation minus evaporation). Finally correlation coefficients
between annual average water levels of 25 Minnesota lakes, and annual evaporation or annual
water availability were calculated.
In the last 40 years (1964 – 2005), annual average open-water season evaporation ranged
from 580 to 747 mm/yr (22.8 to 29.4 in/yr) at the six locations. The trend over the 1964 – 2005
period was upward (rising) at three stations (International Falls, Duluth, and Sioux Falls), and
downward (falling) at three stations (Fargo, Minneapolis, and La Crosse). The strongest upward
trend in evaporation (0.64 mm/yr) was for Duluth and the strongest downward trend (-1.65
mm/yr) for La Crosse. Annual evaporation for the 12-month (Jan-Dec) period, i.e., disregarding
ice covers, was from 79 mm/yr (3.1 in/yr) to 140 mm/yr (5.5 in/yr) higher than annual
evaporation computed for the open-water season at the six locations.
In the last 20-years (1986–2005) annual open-water season evaporation had a decreasing
trend at five of the six locations. The decreasing trends were stronger than for the 1964 – 2005
period and ranged from -0.69 for International Falls and Minneapolis to -1.57 mm/yr for La
Crosse. The only positive trend was 1.09 mm/yr for Sioux Falls.
Annual average measured precipitation for the 1964 – 2005 period at the six locations
ranged from 536 mm/yr to 812 mm/yr (21.1 in/yr to 32.0 in/yr) and showed a rising trend at four

6
of the six stations (International Falls and Duluth were the exceptions). For the 1986 – 2005
period precipitation showed an increasing trend at all stations except Duluth and La Crosse.
Water availability, calculated as the difference between annual open-water season
precipitation and annual open-water evaporation, showed upward trends at all stations from 1964
to 2005. The trends ranged from 0.05 mm/yr for Duluth to 4.27 mm/yr for Fargo. From 1986 to
2005 five locations showed an upward trend and one a downward trend. The five upward trends
were much stronger than for the 1964 – 2005 period, ranging from 0.58mm/yr for La Crosse to
15.06 mm/yr for Fargo. The only downward trend was -2.67 mm/yr for Duluth.
Overall, the analysis showed that positive and negative trends in lake evaporation have
occurred in Minnesota in the last 40 years. Trends in measured precipitation during the same
time period were stronger and upwards. As a result, water availability in Minnesota also has an
upward trend. No strong correlation between lake levels, annual evaporation rates or annual
water availability was found, but the increase in water availability can explain the observed
water level increases in 25 Minnesota lakes.
7
TABLE OF CONTENTS
1. INTRODUCTION ...................................................................................................................... 8
2. METHODS ............................................................................................................................... 15
2.1. Estimation of Daily Evaporation ....................................................................................... 15
2.2. Climate Data Input............................................................................................................. 19
2.3. Estimation of Annual Evaporation/Ice Cover Effects ....................................................... 20
2.4. Estimation of Trends in Evaporation ................................................................................. 21
2.5. Correlation of lake levels with evaporation....................................................................... 22
3. RESULTS ................................................................................................................................. 22
3.1. Statistics of Daily Lake Evaporation in Minnesota ........................................................... 22
3.2. Statistics of Monthly Lake Evaporation in Minnesota ...................................................... 26
3.3. Statistics of Annual (Jan-Dec) Evaporation in Minnesota................................................. 29
3.4. Statistics of Annual Natural Open-Water Evaporation in Minnesota: Effects of Ice Cover
.................................................................................................................................................. 35
3.5. Trends in Annual, Open-Water and Peak Monthly (July) Evaporation in Minnesota ...... 38
3.6. Trends in Precipitation....................................................................................................... 41
3.7. Trends in Annual Water Availability (Precipitation minus Evaporation) ......................... 43
3.8. Correlations of lake levels with evaporation and water availability.................................. 47
4. SUMMARY & CONCLUSIONS............................................................................................. 50
ACKNOWLEDGEMENTS.......................................................................................................... 53
REFERENCES ............................................................................................................................. 54
APPENDIX 1. Sensitivity of evaporation to water temperature assumption ............................... 57
APPENDIX 2. Average Ice-out and Ice-in dates for Minnesota Lakes ....................................... 60
APPENDIX 3. Names, locations, characteristics of Minnesota lakes included in this study....... 62

8
1. INTRODUCTION
About a foot of water is lost annually by evaporation from Minnesota lakes, more in the
south and less in the north. In this report we examine lake evaporation in Minnesota in the last
four decades and relate this information to climate and observed lake water levels. Trends are of
particular interest.
Precipitation and evaporation are the amounts of water received and emitted at a lake’s
surface. They are component of a lake’s water budget which also includes surface inflow from
the watershed, surface outflow from a lake to a stream, seepage and ground-water recharge from
a lake, and storage resulting in lake level change. The water budget of a lake can be stated as:
∆L/∆t = P – E + I – O + GI – GO (1)
In Equation (1), P refers to precipitation on the lake surface, E is evaporation from the
lake surface, I is surface runoff from a watershed into a lake, GI is ground-water inflow, and GO
is ground-water outflow. All water budget components can be expressed as flow per unit surface
area of a lake, e.g., in units of mm/yr. L is the water level in mm and ∆t is a time interval,
typically one year.
Changes in Minnesota’s climate (recorded weather) in recent years have increased the
concern for changes in annual evaporation rates and the consequences for lake levels and water
availability from lakes. Seeley (2003) reported that Minnesota is now having warmer winters,
higher minimum air temperatures, higher frequency of tropical dew points, and greater annual
precipitation. Air temperature and precipitation showed rising trends of 2 – 3°C/100 years and 5-
10%/100 years , respectively, from 1900 to 1994 (Gleick, 2000). Effects of a changing climate
have already been identified in some of Minnesota’s water resources (Changnon and Kunkel,
1995; Johnson and Stefan, 2006; Novotny and Stefan, 2007). Although evaporation is one of the
most important parameters affecting water resources in Minnesota, no studies of changes in this
parameter have yet been conducted.
Mean annual lake evaporation and mean summer evaporation in the United States
including Minnesota are given in Figures 1 and 2. The maps were developed by a Minnesota
hydrologist (Adolph Meyer) and published in 1942. Meyer (1942) conducted extensive studies

9
on lake evaporation in Minnesota, and developed an evaporation equation that we will use. In
Meyer’s studies (Meyer 1942), mean annual lake evaporation in Minnesota was in the range
559 - 914 mm (22 - 40 in), while mean summer evaporation was in the range 508 - 889 mm (20 -
35 in). Evaporation rates vary with geographic location and increase from north to south.
According to an unpublished report prepared by the National Climatic Data Center (NCDC),
annual lake evaporation in Minnesota ranges from 508 mm (20 in) at the northeast corner to 889
mm (35 in) at the southwest corner (NCDC, unpublished report). Pan evaporation varies from
762 mm (30 in) to 1270 mm (50 in) (NCDC, unpublished report) .
Another noteworthy study on lake evaporation in Minnesota was conducted by Sturrock,
Rosenberry, and Winter (1992) on Williams Lake in central Minnesota. In this study evaporation
from May to September for the 1982 – 1986 period was estimated using both energy budget and
mass-transfer methods. Evaporation for the May – September period was found to be 419 mm
(16.5 in) with the energy balance method and 427 mm (16.8 in) with the mass transfer method
(Sturrock et al., 1992).

10
Figure 1.Mean annual lake evaporation in the U.S. (Meyer, 1942).

11
Figure 2.Mean summer lake evaporation in the U.S. (Meyer, 1942).

12
Direct measurements of evaporation (pan evaporation) are available for recent years only
at two locations in Minnesota, and only for the summer months (May to September)
(http://www.climate.umn.edu). Based on these data, average annual summer pan evaporation in
Minneapolis was 857 mm (33.7 in) with a standard deviation of 112 mm (4.4 in) for the period
1972 – 2006. In Waseca, it was 917 mm (36.1 in) with a standard deviation of 9.7 mm (3.8 in)
for the period of 1964 – 2002. Pan evaporation is generally higher than lake evaporation for a
number of reasons, and a pan coefficient on the order 0.6 to 0.9 has to be applied to pan
evaporation to obtain lake evaporation (Winter, 1981). If a pan coefficient of 0.7 is used, annual
summer lake evaporation in Minneapolis and Waseca correspond to 560 mm (23.6 in) and 642
mm (25.3 in), respectively.
By comparison mean annual precipitation was 752 mm (29.61 in) in Minneapolis (1972 –
2006) and 875 mm (34.43 in) in Waseca (1964 – 2002). Pan evaporation measured in
Minneapolis (May-September, 1972 – 2006) and Waseca (May-September, 1964 – 2002) has
decreased at a rate (trend) of -5.08 mm/yr (-0.20 in/yr; significant at the 0.01 level) and -1.27
mm/yr (0.05 in/yr; significant at the 0.5 level), respectively. These results are at best
representative of southern Minnesota because of the high climate variability throughout the state.
Measurements of pan evaporation in northern Minnesota are not available.
The downward trend in measured pan evaporation at two Minnesota locations contradicts
projections for evaporation rates due to climatic change (warming). Rising air temperatures are
thought to stimulate evaporation in the future (Kling et al., 2003). Annual lake evaporation was
estimated to increase by 20% (112 to 183 mm/yr or 4.5 to 7.2 in/yr) for a 4°F warmer climate in
Minnesota (Anonymous, 1997). Simulations of lake temperature changes based on heat budgets
under a 2xCO2 climate scenario in Minnesota (Table 1) showed an increase in evaporative heat
fluxes corresponding to approximately 200mm/yr (7.9 in/yr) of water (Figure 3) (Fang and
Stefan, 1999).

13
Table 1. Weather parameter increments and ratios for Minnesota. Values were obtained
from the Canadian Climate Center General Circulation Model (CCC GCM) for a 2xCO2
climate scenario (Stefan et al., 1998).
Month
Air
Temperature (oC)a
Solar radiation
ratiob
Wind speed
ratiob
Specific
humidity ratiob
Precipitation
ratiob
Jan 8.17 0.94 1.08 1.85 1.23
Feb 8.5 0.92 1.1 1.94 1.26
Mar 4.37 0.95 0.88 1.53 1.22
Apr 5.76 0.95 1.01 1.78 1.5
May 5.39 0.97 0.97 1.46 1.05
Jun 4.27 0.96 0.85 1.32 0.99
Jul 3.54 0.96 0.8 1.23 0.87
Aug 5.24 0.99 0.83 1.35 0.87
Sep 4.51 0.99 0.9 1.29 0.79
Oct 2.71 0.98 1.01 1.19 0.96
Nov 2.9 1.01 1.02 1.29 0.96
Dec 4.38 1 0.91 1.25 0.97
Average 4.98 0.97 0.95 1.46 1.06
a Increment = 2xCO2 CCC GCM output – 1xCO2 CCC GCM output
b Ratio = 2xCO2 CCC GCM output divided by 1xCO2 CCC GCM output

14
Figure 3. Projected changes in mean annual evaporative water loss (m) from small lakes
under 2xCO2 scenario (reproduced from (Fang and Stefan, 1999) (1 in = 0.0254 m).
The impact of changed evaporative water losses from a lake can be mitigated by the other
water budget components in equation (1). For example, precipitation is projected to increase in
Minnesota. The increase can be about 15% in summer, fall and winter with no change in spring
(Anonymous, 1997). Lower lake levels due to increased evaporative water losses can be
prevented by increased precipitation. The difference between increases in precipitation and
increases in evaporation in Minnesota, therefore, will be an important factor to control the future
state of the lakes in Minnesota.
In this study, we will calculate annual evaporation rates from water surfaces during 40
years of changing Minnesota climate conditions. We will use weather data recorded at six
locations in and around Minnesota for the 1964 – 2005 and 1986 – 2005 periods, and four
different evaporation equations. We will then determine the linear trends in the calculated annual
evaporation rates.

15
For comparison we will also examine the trends in precipitation at the same locations,
and trends in the difference between precipitation and evaporation, i.e. net water input through
the surface of lakes (water availability). To be able to understand the relationships between
evaporation rates and lake levels, we will correlate the calculated annual net water input through
the surface of lakes with observed lake levels.
2. METHODS 2.1. Estimation of Daily Evaporation
Evaporation from a water surface can be determined by several methods based on
different principles (Chow, 1964; Winter, 1981). Methods used include (1) measurement in
evaporation pans, (2) the water budget method, (3) the energy budget method, and (4)
aerodynamic methods (e.g., eddy correlation, gradient or mass transfer method). Most of these
methods require extensive data collection. For example, to use the energy budget method, all
energy fluxes to and from a lake, e.g., incoming and reflected solar radiation, and the change in
heat energy stored within the lake have to be estimated. The water budget method requires
estimation of water inputs and outputs for a lake. Overland flow and ground-water inflow and
outflow can be difficult to determine because of uncertainties in watershed characteristics,
ground-water/surface-water relationships, etc. The pan evaporation method is a straightforward
method, but the accurate estimation of pan coefficient is very difficult (Winter, 1981). In this
study, we chose to use an aerodynamic mass transfer method because most of the data required
by this equation are climatic data that are available from weather stations. We also had no water
temperature time series data that were long enough to use the more accurate energy balance
equation. Mass transfer methods have been shown to be useful in estimating lake evaporation
with sufficient accuracy (Singh and Xu, 1997a).
The mass transfer method for estimating evaporation is based on the principles developed
by Dalton (1802). According to Dalton, the evaporation rate from a water surface depends on the
difference between the water-vapor pressure at the evaporating surface (eo) and the water vapor
pressure in the air above that surface (ea) and on wind speed (u) above the water surface. A
general equation based on Dalton’s principles is provided as equation (2) and a general equation
for estimating wind function, f(u), is given as equation (3).

16
))(( ao eeufE −= (2)
nNuauf +=)( (3)
Parameters in equations (2) and (3), i.e., a, N, n, were estimated by calibrating equation
(2) with climatic data at specific locations. The equations obtained in this way by numerous
investigators can be found in the hydrological literature (e.g., Chow 1964). An evaluation and
generalization of most commonly used empirical equations is provided in Singh and Yu (1997).
Singh and Yu concluded that empirical equations can provide satisfactory estimation of
evaporation if parameter values were estimated by calibration with local climatic data. However,
transfer of parameter values from other regions (even within a small region with similar climatic
characteristics) can significantly affect the reliability of the evaporation estimates.
In this study, sufficient historical data were not available to estimate parameter values for
different regions of Minnesota. Therefore, we had to transfer parameter values from other
studies. To show the degree of uncertainty in evaporation values estimated by different
parameter values, we calculated evaporation with four different empirical equations. These
equations were the Meyer equation, Lake Hefner equation, Rohwer equation, and Ryan &
Harleman equation. The first three of these equations have been commonly used to estimate
evaporation from lakes in the United States (Chow, 1964). The fourth equation provides a
different perspective, because it was originally developed for estimating water losses from
heated water bodies, e.g., cooling ponds, rather than natural water bodies. Below we provide a
brief discussion and explanation of these equations.
The Meyer equation (equation (4)) (Meyer, 1942) was developed to estimate evaporative
water losses from lakes. Meyer was a hydrologist based in Minnesota and the equation was
originally developed for Minnesota conditions. In equation (4), E refers to evaporation rate
(in/day), eo is the saturation vapor pressure (in Hg) at mean water temperature, ea is the vapor
pressure (in Hg) of the air measured at 7.6 m (25 ft) above the water surface, u is the wind speed
(mph) measured at 7.6 m (25 ft) above the water surface, and C is an empirical constant. C was
determined to be 0.33 for daily evaporation from Lake Minnetonka when climate data from the
Minneapolis/St. Paul Airport were used as input.

17
)10
1)(( ueeCE ao +−= (4)
The Lake Hefner equation (Marciano and Harbeck, 1954) was developed for a water-
supply reservoir (Lake Hefner) located near Oklahoma City, OK. In equation (5), E is again the
evaporation rate (in/day), eo is saturation vapor pressure (mb) at the water temperature and ea is
vapor pressure (mb) of the air, and u is the mean daily wind speed (mph). To develop this
equation Marciano and Harbeck used wind speed and relative humidity data from the nearest
airport (13 miles away), and water-surface temperatures were measured.
)(00177.0 ao eeuE −= (5)
The Rohwer equation (Rohwer, 1931) is provided in equation (6). In equation (6) E is
evaporation (in/day), eo and ea are saturation vapor pressure (mb) at the mean water temperature
and vapor pressure (mb) of the air, respectively, and u is the wind speed (mph) measured at the
water surface. P is air pressure in Pa.
))(118.044.0)(0186.0465.1(771.0 as eeuPE −+−= (6)
The Ryan & Harleman equation (equation (7)) was developed to estimate evaporation
from heated water bodies. In that case, both forced (wind driven) convection and free (buoyancy
driven) convection effectively control evaporation rates, while for natural water bodies forced
convection is the dominant factor. In equation (7), Qe is evaporative heat flux (W/m2), ∆Qv is
virtual temperature difference (0C), u is the wind speed measured at 2 m (m/s) and, eo and ea are
saturation vapor pressure at the water surface and vapor pressure of the air (mb), respectively.
))(1.37.2( 31
zsve eeuQQ −+∆= (7)
∆Qv can be calculated with equation (8), where Tw is water temperature (oC), Ta is air
temperature (oC), and P is air pressure (mb).

18
)378.01()378.01(PeT
PeTQ a
as
wv +−+=∆ (8)
Evaporation can be found by dividing Qe by latent heat of vaporization (Lv) (equation
(9)). Lv is nearly constant. A relationship with water temperature used by (Stefan et al., 1980) is
given in equation (10).
v
e
LQE = (9)
wv TL 592.05.597 −= (10)
Saturation vapor pressure and vapor pressure of the air were estimated using equations
(11) and (12), respectively. In these equations, eo and ea are in millibars, T is in oC and Td is dew
point temperature in oC.
TwTw
oe +×
×= 7.2375.7
1011.6 (11)
d
dT
T
ae +×
×= 7.2375.7
1011.6 (12)
Because daily water temperature measurements were not available, we used equilibrium
temperature, Te, as a substitute for surface water temperature (Tw). Te was calculated using the
equation (13) developed by Edinger et al. (1968).
KHTT s
de += (13)
In equation (13), Hs is the shortwave solar radiation in (W/m2) and K is the bulk surface
heat exchange coefficient (W/m2/oC1). K can be calculated from equation (14), where β is an
approximation of the slope of the saturation pressure vs. water temperature curve (mm Hg/oC)
and f(u) is a function (W/m2/mmHg-1) of wind speed u (m/s)

19
)(47.0)(05.05.4 ufufTK +++= β (14)
β and f(u) can be calculate with equations (15) and (16).
246.02.9)( uuf += (15)
20012.015.035.0 mm TT ++=β (16)
In equation (17), the mean temperature Tm is calculated as:
2d
mTTT +
= (17)
As explained by Singh and Xu (1997b), the mass-transfer based evaporation equations
are most sensitive to the vapor pressure difference, which is affected by water temperature and
air temperature measurements. Because we did not have long time series of actual measured
water temperature data, we used equilibrium temperatures in our calculations. The equilibrium
temperature is by definition the water temperature that a water body with no thermal inertia, i.e.,
zero depth, assumes instantaneously under a given set of weather (climate) conditions. The
equations to evaluate equilibrium temperature are based on the heat flux balance at a water
surface. Water temperatures of water bodies of finite depth generally lag in temperature behind
the equilibrium temperature. That means that the water temperatures we used are good estimates
for very shallow water, but are too low in spring and too high in fall for water bodies of greater
depth. We evaluated the sensitivity of the calculated evaporation values to changes in
equilibrium temperature. The approach and the results of the sensitivity analysis are presented in
Appendix 1. The sensitivity analysis shows how much water temperatures deviate from
equilibrium temperatures as the lake water depth increases.
2.2. Climate Data Input
The climate data (air temperature, dew point temperature, and wind speed) required for
the evaporation computations came from six weather stations (Figure 4). The stations chosen are
on the boundaries of Minnesota. Geographic variability is therefore well-covered. Although we

20
wanted to include some stations inside Minnesota (i.e., Bemidji, Brainerd, Detroit Lakes, and St.
Cloud), climate data for those stations were not available for long enough period of time (they
were available after mid-1990s). The climate data included in this analysis were obtained from
the State Climatology Office. Shortwave solar radiation data required for estimating daily
equilibrium temperatures were obtained from the National Solar Radiation Database
(http://rredc.nrel.gov/solar/old_data/nsrdb/). Daily climate data from 1964 to 2005 were used in
the analysis. Prior to 1964, daily climate data for some parameters (e.g., wind speed) were
unavailable. The 40-year period was deemed long enough to detect trends due to global climate
change. Daily precipitation data were available for a longer period (prior to 1950 to 2005)
Figure 4. Location of weather stations used in this study
2.3. Estimation of Annual Evaporation/Ice Cover Effects
Annual evaporation from lakes will first be calculated by accumulating the daily
evaporation values from January 1 to December 31.

21
During the winter months most Minnesota lakes are covered by ice. We therefore
calculated separately the annual evaporation for the natural open-water period to estimate the
actual amount of water lost from lakes. For the ice-cover period we assumed that no water was
evaporated, even though a small amount of water transfers from lake ice and snow covers to the
atmosphere, i.e. the water loss by ablation of snow and ice covers during the ice cover period
was neglected. The most important water loss from a lake to the atmosphere in winter is not in
the form of water vapor but most likely as snow drift blown from lake ice covers on to the land.
This would be particularly important for lakes with a large surface area, i.e. wind fetch. Although
snow removal from lake surfaces by wind can be easily observed, not much data seems to have
been collected on this phenomenon. Snow accumulation in a suburb was reported to be
substantially larger than on a lake in the Twin Cities area (Stefanovic, 2000)
To calculate annual evaporation for the open-water season, we ignored evaporation
calculated for the ice-cover period. The ice-cover periods on northern and southern Minnesota
lakes are significantly different (average ice-in and ice-out dates for Minnesota lakes are given in
Appendix 2) According to Johnson and Stefan (2004) the average lake ice-out date in Minnesota
varies from April 1 at 44.3o latitude to May 1 at 48.6o latitude. In the same study, ice-in dates
were found to vary from November 12 at 47.0o latitude to December 8 at 47.2o latitude. The
effect of latitude is not as apparent in recorded ice-in dates as in ice-out dates, because in
addition to latitude lake depth has a strong effect on ice-in (Williams et al., 2004). Based on
recorded ice-in and ice-out dates, the ice-cover period was assumed to be from November to
May at northern locations (Fargo, International Falls, and Duluth) and December to April for
southern stations (Sioux Falls, Minneapolis, and La Crosse). The bulk of the annual evaporation
occurs in summer and only a small fraction in winter (Meyer, 1942). A precise estimation of the
ice cover period is therefore not necessary.
2.4. Estimation of Trends in Evaporation
Trends in evaporation, precipitation and water availability (annual precipitation minus
open-water evaporation) were estimated using a linear regression. Water availability was
calculated in two ways:
1) as the difference between measured total annual precipitation and open-water evaporation,
which is based on the assumptions that (a) water loss from snow and ice covers of lakes will not

22
be significant during ice-cover periods and (b) snowfall on an ice or snow covered lake will
accumulate and be entirely captured by the lake as snowmelt. It should be noted that during
warm weather periods in winter a lake’s snow cover can be melted from below by heat
conducted from the lake water through the ice cover or by radiative and conductive heat input
from the atmosphere. The resulting snowmelt water accumulates between the snow cover and the
lake ice cover, and freezes to “white ice” on the top of the existing lake ice cover when cold
weather sets in.
2) as the difference between precipitation during the natural open-water period and open-water
evaporation. This procedure is based on the assumption (a) that snowfall will not accumulate on
a lake ice cover, but will be blown away by wind, and (b) water loss from the ice/snow surface of
a lake is negligible.
It is likely that case (1) is more appropriate for wind sheltered, i.e. small lake surrounded
by significant vegetation (trees) or buildings, while case (2) is representative of a lake with large
surface areas and lack of wind sheltering.
2.5. Correlation of lake levels with evaporation
Correlation coefficients between water levels recorded in 25 Minnesota Lakes (8
landlocked and 17 flow-through lakes) and calculated annual evaporation or water availability
(precipitation minus evaporation) were calculated. The names, locations and characteristics of
the lakes included in this study are provided in Appendix 3.
3. RESULTS 3.1. Statistics of Daily Lake Evaporation in Minnesota
Daily evaporation rates at the six weather stations were calculated by the Meyer, Lake
Hefner, Rohwer, and Ryan & Harleman equations with daily weather data for the 1964 – 2005
period as input. Examples of daily evaporation values for the month of July are given in Figures
5a and 5b. These figures were obtained by averaging daily evaporation values calculated by four
equations for every July day from 1964 to 2005. Average daily evaporation values for July were
in the range 3.5 - 6 mm/day (0.14 - 0.24 in/day). The Meyer equation gave the highest estimates
for all stations and the Lake Hefner equation the lowest. Variations in daily evaporation in July
were in the range 0.15 - 0.30 mm/day (0.006 - 0.012 in/day). Mean daily evaporation rates for

23
July calculated with the Meyer equation varied between 4.4 and 6.7 mm/day (0.17 and 0.26
in/day) for the six weather stations. The Lake Hefner equation gave mean annual evaporation
rates from 3.1 to 4.9 mm/day (0.12 to 0.19 in/day); the Rohwer equation predicted values in the
range from 3.9 to 5.5 mm/day (0.15 to 0.22 in/day), and the Ryan & Harleman equation gave
values in the range from 3.6 to 6.6 mm/day (0.14 to 0.26 in/day).

24
Figure 5a. Average daily evaporation for July calculated using the Meyer and Lake Hefner equations (1 in = 25.4 mm).

25
Figure 5b. Average daily evaporation for July calculated using the Rohwer and Ryan & Harleman equations (1 in = 25.4 mm).

26
3.2. Statistics of Monthly Lake Evaporation in Minnesota
Monthly evaporation values were obtained from computed daily values. A plot of
monthly evaporation values is given in Figures 6a and 6b. Figure 6 was obtained by averaging
daily evaporation values calculated by the four equations for every month from 1964 to 2005.
Monthly evaporation values calculated with the Meyer, Lake Hefner, and Rohwer equations
showed similar seasonal fluctuations for all six climate stations. Monthly evaporation values
were consistently lowest at International Falls and highest at La Crosse. This geographic
difference is expected and matches the gradients shown in Figures 1 and 2. Results were not
quite as consistent when the Ryan & Harleman equation was used.
All equations predicted the occurrence of peak monthly evaporation in July. Variations in
the monthly evaporation by latitude can be seen in Figures 6a and 6b, one panel for each
equation used. The geographic range of computed July evaporation values was 134 - 160 mm
(5.3 - 6.3 in) when the Meyer equation was used, 103 - 130 mm (4.1 - 5.2 in) for the Lake Hefner
equation, 132 - 144 mm (5.2 - 5.7).for the Rohwer equation, and 123 - 179 mm (4.8 - 7.1 in)
when the Ryan & Harleman equation was used.

27
Figure 6a. Average monthly evaporation calculated using the Meyer and Lake Hefner equations (1 in = 25.4 mm).

28
Figure 6b. Average monthly evaporation calculated using the Rohwer and Ryan & Harleman equations (1 in = 25.4 mm).

29
3.3. Statistics of Annual (Jan-Dec) Evaporation in Minnesota
Annual (Jan to Dec) evaporation was obtained as the sum of the daily values. Annual
evaporation varied, as to be expected, by location and from year to year (Figures 7a and 7b).
The four equations gave somewhat different results. Annual (Jan-Dec) evaporation values
estimated by the Meyer Equation were consistently higher than values obtained from the other
three equations. The Lake Hefner, the Rohwer, and the Ryan & Harleman equations provided
similar results. Mean annual evaporation rates for the period 1994 – 2005 calculated with the
Meyer equation varied between 781 and 942 mm/yr (30.8 and 37.1 in/yr) for the six locations
investigated. The Lake Hefner equation gave mean annual evaporation rates from 579 to 802
mm/yr (22.8 to 31.6 in/yr); the Rohwer equation predicted values in the range from 704 to 843
mm/yr (27.7 to 33.2 in/yr), and the Ryan & Harleman equation gave values in the range from
692 to 800 mm/yr (27.2 to 31.5 in/yr).

30
Figure 7a. Annual evaporation (Jan – Dec) from 1964 to 2005 calculated using the Meyer and Lake Hefner equations (1 in =
25.4 mm).

31
Figure 7b. Annual evaporation (Jan – Dec) from 1964 to 2005 calculated using the Rohwer and Ryan & Harleman equations
(1 in = 25.4 mm).

32
When the values obtained with the four equations were averaged for every year and
plotted against time, Figure 8 was obtained. Statistics of the time-series for the period 1964 –
2005 in Figure 8 are given in Table 2. According to Table 2 mean annual evaporation rates
varied going from north to south. This is in agreement with Figures 1 and 2. The absolute values
in Figures 1 are about the same as those in Table 2 for central Minnesota, but the gradient from
north to south in Figure 1 is stronger than in Table2.
Standard deviation of mean annual evaporation does not seem related to latitude (Table
2), but the extreme values (minimum and maximum annual evaporation in the 1964 – 2005
period show a weak dependence on latitude.
Figure 8. Mean annual evaporation calculated for six locations. Average values obtained by
four equations are used.

33
Table 2. Statistics of annual (Jan-Dec) evaporation in mm/yr (in/yr) for 1964 – 2005. Values
obtained by the four equations are averaged (1 in = 25.4 mm).
Location Mean Stand. Dev. Minimum Maximum
International Falls 699 (27.5) 38 (1.5) 579 (22.8) 770 (30.3)
Duluth 736 (29.0) 37 (1.4) 652 (25.7) 819 (32.2)
Fargo, ND 778 (30.6) 34 (1.3) 678 (26.7) 841 (33.1)
Minneapolis 780 (30.7) 40 (1.6) 668 (26.3) 838 (33.0)
La Crosse, WI 811 (31.9) 45 (1.8) 685 (27.0) 881 (34.7)
Sioux Falls, SD 837 (33.0) 29 (1.1) 752 (29.6) 889 (35.0)
According to Figure 8, the maximum of annual evaporation occurred in the years 1987 –
1988 for all stations except for International Falls and Sioux Falls. The minimum of annual
evaporation for all stations occurred in the 1992 – 1993 period. 1987 – 1988 is recalled as an
extremely dry period with very low river flows and lake stages. 1992 – 1993 was a wet period.
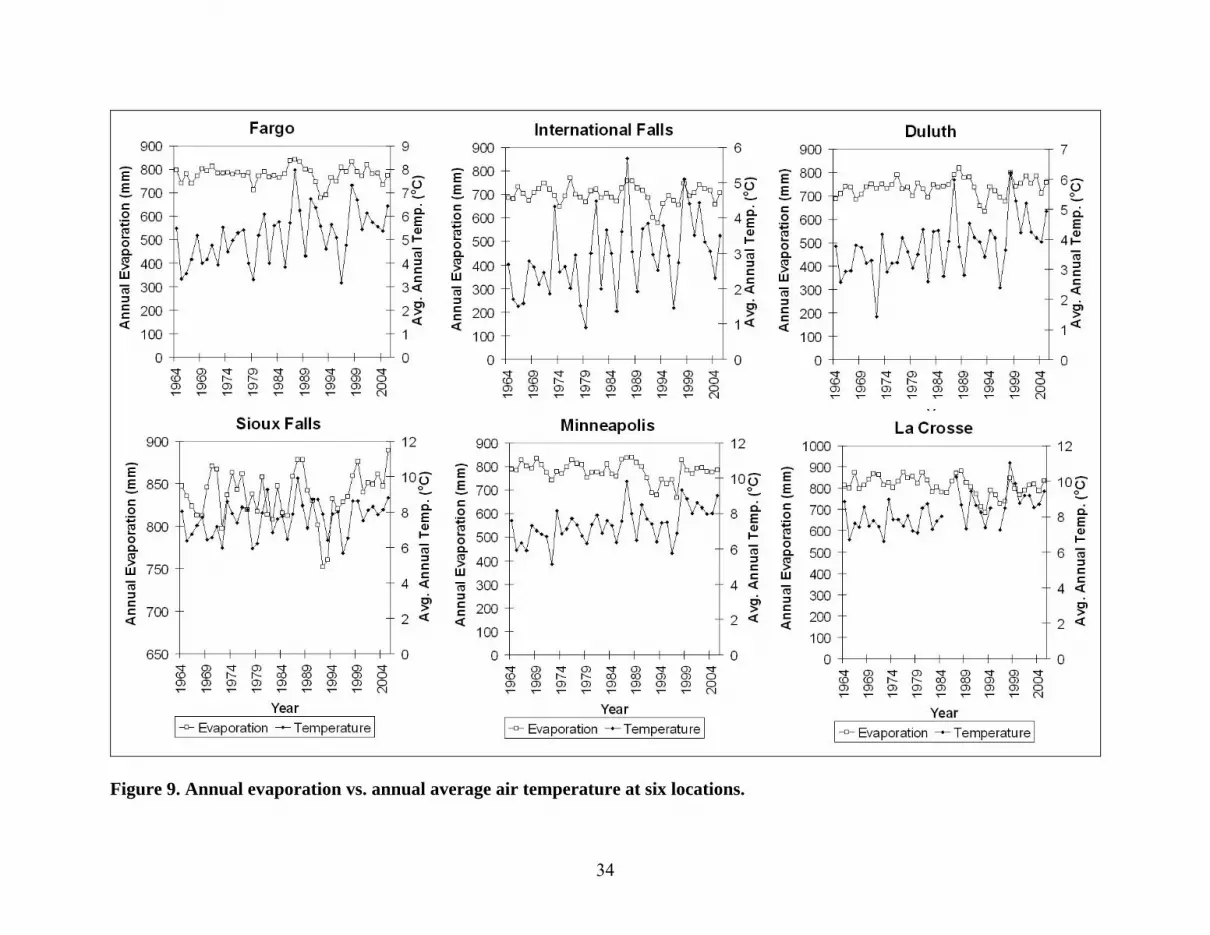
The periods of extreme evaporation also appear aligned with the periods of extreme
annual air temperatures in Minnesota (Figure 9). Maximum annual average air temperature in
Minnesota was observed in 1987 and minimum annual average air temperature in 1996. Overall
the correlation between annual evaporation and annual average air temperature is not strong.
Correlation coefficients varied from 0.12 to 0.38. The highest correlation was found for Duluth
and the lowest for La Crosse.
The statistics (mean and standard deviation) of annual (Jan – Dec) evaporation rates
obtained by individual equations are given in Table 3.
34
Figure 9. Annual evaporation vs. annual average air temperature at six locations.

35
Table 3. Statistics of annual (Jan – Dec) evaporation in mm/yr (in/yr) calculated with four
evaporation equations for 1964 – 2005.
Equation Statistic Meyer Lake Hefner Rohwer Ryan & Harleman
Mean 781 (30.7) 579 (22.8) 704 (27.7) 733 (28.9) International Falls
Std. Dev. 44 (1.7) 38 (1.5) 40 (1.6) 44 (1.7)
Mean 803 (31.6) 662 (26.1) 721 (28.4) 760 (29.9) Duluth
Std. Dev. 42 (1.7) 35 (1.6) 39 (1.5) 43 (1.7)
Mean 838 (33.0) 725 (28.5) 750 (29.5) 800 (31.5) Fargo, ND
Std. Dev. 38 (1.5) 37 (1.5) 34 (1.3) 38 (1.5)
Mean 895 (35.2) 732 (28.8) 802 (31.6) 692 (27.2) Minneapolis
Std. Dev. 47 (1.9) 48 (1.6) 42 (1.3) 39 (1.5)
Mean 925 (36.4) 741 (29.2) 829 (32.6) 750 (29.5) La Crosse, WI
Std. Dev. 56 (2.2) 45 (1.8) 52 (2.0) 55 (2.2)
Mean 942 (37.1) 802 (31.6) 843 (33.2) 759 (29.9) Sioux Falls, SD
Std. Dev. 36 (1.4) 41 (1.6)) 32 (1.3) 39 (1.5)
All equations, except the Ryan & Harleman equation showed that the highest mean
annual evaporation rate was at Sioux Falls and the lowest was at International Falls. The three
northern locations (Fargo, International Falls, and Duluth) had lower mean annual evaporation
rates than the three southern locations (Sioux Falls, Minneapolis, and La Crosse). Evaporation
rates calculated with the Ryan & Harleman equation deviated from those obtained by the other
three equations, possibly because the Ryan & Harleman equation was developed with data from
heated water bodies such as cooling water ponds of power plants and warm springs, not natural
lakes.
3.4. Statistics of Annual Natural Open-Water Evaporation in Minnesota: Effects of Ice
Cover
Mean annual evaporation rates for the period 1964 – 2005, calculated for the natural
open-water period, i.e. excluding the ice-cover period, were from 71 to 163 mm/yr (2.8 to 6.4

36
in/yr) lower than the calculated total annual evaporation from Jan to Dec. Mean annual
evaporation rates for a natural open-water season, i.e. averages obtained from the four equations
are plotted in Figure 10. The statistics of these values are given in Table 4. Averages of annual
open-water evaporation rates obtained by individual equations are provided in Table 5.
Comparing the values in Tables 2 for the Jan-Dec period and in Table 4 for the open-
water period leads to very similar conclusions. The same holds true for a comparison of Table 3
and Table 5. The geographic distribution of the mean annual evaporation rates for the open-water
period resembles that for the full year (Jan to Dec). The highest and lowest annual open-water
evaporation values were calculated for the southernmost and the northernmost locations, i.e.
Sioux Falls and International Falls, respectively, when the Meyer, Lake Hefner, and Rohwer
equations were used. The Ryan & Harleman equation deviated from that result.
Figure 10. Annual natural open-water evaporation at 6 locations for 1964 – 2005. Values
obtained by the four equations are averaged.

37
Table 4. Statistics of annual open-water evaporation in mm/yr (in/yr) for 1964 – 2005.
Values obtained by the four equations for the natural open-water season are averaged.
Location Mean Stand. Dev. Minimum Maximum
International Falls 580 (22.8) 33 (1.3) 474 (18.7) 642 (25.3)
Duluth 602 (23.7) 31 (1.2) 531 (29.9) 678 (26.7)
Fargo. ND 638 (25.1) 28 (1.1) 561 (22.1) 693 (27.3)
Minneapolis 701 (27.6) 36 (1.4) 597 (23.5) 756 (29.8)
La Crosse, WI 727 (28.6) 40 (1.6) 619 (24.4) 793 (31.2)
Sioux Falls, SD 747 (29.4) 26 (1.0) 666 (26.2) 788 (31.0)
Table 5. Statistics of annual open-water evaporation in mm/yr (in/yr) calculated with four
evaporation equations for 1964 – 2005.
Equation Statistic Meyer Lake Hefner Rohwer Ryan and Harleman
Mean 634 (25.0) 463 (18.2) 572 (22.5) 650 (25.6)
International Falls Std. Dev. 36 (1.4) 31 (1.2) 33 (1.3) 41 (1.6)
Mean 643 (25.3) 524 (20.6) 578 (22.8) 662 (26.1)
Duluth Std. Dev. 35 (1.4) 28 (1.1) 32 (1.2) 39 (1.5)
Mean 676 (26.6) 578 (22.7) 605 (23.8) 696 (27.4)
Fargo, ND Std. Dev. 29 (1.1) 31 (1.2) 26 (1.0) 34 (1.4)
Mean 805 (31.7) 657 (25.9) 722 (28.4) 621 (24.4)
Minneapolis Std. Dev. 43 (1.7) 43 (1.7) 38 (1.5) 35 (1.4)
Mean 829 (32.6) 662 (26.1) 744 (26.5) 674 (26.5)
La Crosse, WI Std. Dev. 50 (2.0) 40 (1.6) 47 (1.9) 49 (1.9)
Mean 843 (33.2) 716 (28.2) 754 (29.7) 677 (26.7)
Sioux Falls, SD Std. Dev. 31 (1.2) 37 (1.5) 29 (1.1) 36 (1.4)

38
3.5. Trends in Annual (Jan-Dec), Open-Water and Peak Monthly (July) Evaporation in
Minnesota
We examined the trends in evaporation for the 1964 – 2005 and 1986 – 2005 periods by
using linear regression. In this trend estimation we used the evaporation values calculated by the
Meyer equation. Although the Meyer equation provided somewhat higher results than the other
three equations, we chose to use it for the trend analysis because (1) parameters of the Meyer
equation were developed and tested with data from a Minnesota lake (Lake Minnetonka) -mass-
transfer equations are expected to provide better estimates if parameters are obtained by
calibration with local data-, and (2) the results obtained by the Meyer equation agree well with
lake evaporation estimates for the Minnesota region (NCDC).
The annual (Jan-Dec) evaporation for the 1964 – 2005 period showed an increasing
trend at four of the six locations investigated (Table 6). La Crosse and Minneapolis showed a
decreasing trend. Only the trend for La Crosse was significant at the 0.05 level; trends for
Duluth, Minneapolis and Sioux Falls were significant at the 0.5 level. The long-term trends were
obviously weak, and are not readily apparent in Figure 7. The annual (Jan-Dec) evaporation for
the more recent 1986 – 2005 period showed a decreasing trend (Table 6). These trends were
negative, except for Sioux Falls. All trends were significant near the 0.5 level. It therefore
appears that the trends over the 40-year and 20-year periods are reversed, but not significant.
Even the strongest trends in the calculated annual evaporation were not hugely different. The
extreme values were found for La Crosse (-1.7mm/yr; -0.065 in/yr) for the 1964 – 2005 period
and for Sioux Falls (1.2mm/yr; 0.046 in/yr) for the 1986 – 2005 period.
The statistics of annual evaporation rates calculated by the Meyer equation for the two
periods (1964 – 2005 and 1986 – 2005) are summarized in Table 7. Average annual evaporation
rates were higher during the 1986 – 2005 period than the 1964 – 2005 period for four stations,
except Minneapolis and LaCrosse. Standard deviations of mean annual evaporation rates were
higher for the 1986 – 2005 period than the 1964 – 2005 period for all stations.
Overall the results suggest that evaporation became more variable in the last 20-year
period, but that no significant trend can be established.
Annual open-water evaporation from 1964 to 2005 showed no conclusive trends.
(Table 6). From 1986 to 2005 all stations, except Sioux Falls, showed a negative trend. The
trends for Fargo, Sioux Falls, and La Crosse were significant at the 0.5 level. The strongest

39
trends in both time periods were observed at La Crosse (-0.065 and -0.062 in/yr, respectively).
Means and standard deviations of annual open-water evaporation values for the two periods
showed similar geographic distributions as the annual (Jan-Dec) evaporation (Table 7).
Table 6. Trends in annual evaporation, open-water evaporation, and peak monthly
evaporation calculated by linear regression on values from the Meyer equation (1 in=25.4
mm).
1964 – 2005 1986 – 2005
Location
Trend
And
Sig.
Annual
Evap.
(mm/yr)
Open
Water
Evap.
(mm/yr)
Peak
Monthly
Evap.
(mm/mo)
Annual
Evap.
(mm/yr)
Open
Water
Evap.
(mm/yr)
Peak
Monthly
Evap.
(mm/mo)
Trend 0.30 0.13 0.08 -0.05 -0.69 0.53 International
Falls Sig. 0.58 0.79 0.56 0.98 0.69 0.35
Trend 0.84 0.64 0.13 -0.25 -1.07 0.25
Duluth Sig. 0.13 0.16 0.46 0.90 0.52 0.67
Trend 0.23 -0.03 -0.03 -0.89 -1.32 0.33
Fargo, ND Sig. 0.63 0.93 0.90 0.64 0.39 0.54
Trend -0.81 -0.99 -0.25 -0.20 -0.69 0.30
Minneapolis Sig. 0.18 0.07 0.15 0.93 0.75 0.63
Trend -1.65 -1.65 -0.30 -1.17 -1.57 -0.13 La Crosse,
WI Sig. 0.02 0.01 0.04 0.65 0.48 0.84
Trend 0.56 0.23 0.03 1.63 1.09 0.36 Sioux Falls,
SD Sig. 0.22 0.56 0.79 0.35 0.47 0.50
Maximum (peak) monthly evaporation occurred in July. From 1964 to 2005 it had a
decreasing trend for Fargo, Minneapolis, and La Crosse and an increasing trend for International
Falls, Duluth, and Sioux Falls (Table 6). Only the trend for La Crosse was significant at the 0.05
level, while all others were near the 0.5 level. From 1986 to 2005, peak monthly evaporation
showed an upward trend at all stations except La Crosse (Table 7). The trends were significant
near the 0.5 level. The strongest trend in July evaporation was obtained for La Crosse for the

40
1964 – 2005 period (-0.012 in/month) and in Sioux Falls for the 1986 – 2005 period (0.021
in/month).
Table 7. Mean and standard deviation of annual (Jan – Dec) and open-water evaporation
in mm/yr (in/yr) for the periods 1964 – 2005 and 1986 – 2005 from the Meyer equation
Annual
Evaporation
Annual Open-Water
Evaporation
Location Statistic 1964 – 2005 1986 – 2005 1964 – 2005 1986 – 2005
Mean 781 (30.7) 785 (30.1) 634 (25.0) 637 (25.1) International
Falls Std. Dev. 44 (1.7) 53 (2.1) 36 (1.4) 41 (1.6)
Mean 803 (31.6) 813 (32.0) 643 (25.3) 653 (25.7)
Duluth Std. Dev. 42 (1.7) 54 (2.1) 35 (1.4) 41 (1.6)
Mean 838 (33.0) 843 (33.2) 676 (26.6) 678 (26.7)
Fargo, ND Std. Dev. 38 (1.5) 48 (1.9) 29 (1.1) 38 (1.5)
Mean 895 (35.2) 887 (34.9) 805 (31.7) 796 (31.3)
Minneapolis Std. Dev. 47 (1.9) 60 (2.3) 43 (1.7) 53 (2.1)
Mean 925 (36.4) 904 (35.6) 829 (32.6) 809 (31.8) La Crosse,
WI Std. Dev. 56 (2.2) 64 (2.5) 50 (2.0) 56 (2.2)
Mean 942 (37.1) 948 (37.3) 843 (33.2) 845 (33.3) Sioux Falls,
SD Std. Dev. 36 (1.4) 43 (1.7) 31 (1.2) 38 (1.5)
To summarize, all three parameters (i.e., annual (Jan-Dec), open-water, and peak monthly
evaporation) had an upward trend at International Falls, Duluth, and Sioux Falls and a downward
trend at Minneapolis and La Crosse for the period 1964 – 2005. In recent years (1986 – 2005),
there has been a change in direction of annual and open-water evaporation trends for
International Falls and Duluth and peak monthly evaporation trend for Minneapolis. The trends
at all other locations have remained the same, although their magnitudes have changed. For
example, the magnitude of annual and open-water evaporation trends has decreased for
Minneapolis and La Crosse in recent years, but increased for Sioux Falls.

41
3.6. Statistics and Trends of Annual Precipitation in Minnesota
Precipitation is considered in this study because the difference between annual
evaporation and annual precipitation gives the net water loss through a lake’s surface. To
maintain a stable lake level the net loss of water through a lake’s surface has to be made up by
surface runoff from the watershed into a lake or by a net groundwater input.
Annual precipitation time series at the six locations Figure 4 have been plotted in Figure
11. The lowest annual precipitation for the 1964 – 2005 period was observed at Fargo with an
average rate of 536 mm/yr (21.1 in/yr). The highest annual precipitation was observed at La
Crosse with an average rate of 812 mm/yr (32.0 in/yr). The highest variation in annual
precipitation was at Minneapolis (standard deviation was 154 mm/yr or 6.1 in/yr) and the lowest
variation was at International Falls (standard deviation was 91 mm/yr or 3.6). Both annual (Jan-
Dec) and annual open-water season precipitation were higher during the 1986 – 2005 period than
the 1964 – 2005 period for all stations except International Falls (Table 8).
Table 8. Mean and standard deviation of annual (Jan – Dec) and open-water season
precipitation in mm/yr (in/yr) for the periods 1964 – 2005 and 1986 – 2005 .
Annual (Jan-Dec)
Precipitation
Annual Open-Water
Precipitation
Location Statistic 1964 – 2005 1986 – 2005 1964 – 2005 1986 – 2005
Mean 616 (24.3) 599 (23.6) 466 (18.3) 461 (18.1) International
Falls Std. Dev. 91 (3.6) 93 (3.7) 77 (3.0) 81 (3.2) Mean 786 (31.0) 792 (31.2) 551 (21.7) 567 (22.3) Duluth
Std. Dev. 133 (5.2) 139 (5.5) 110 (4.3) 117 (4.6) Mean 535 (21.1) 572 (22.5) 395 (15.6) 431 (17.0) Fargo, ND
Std. Dev. 131 (5.1) 136 (5.3) 115 (4.5) 118 (4.6) Mean 751 (29.6) 774 (30.5) 633 (24.9) 669 (26.3) Minneapolis
Std. Dev. 154 (6.1) 130 (5.1) 148 (5.8) 129 (5.1) Mean 812 (32.0) 837 (32.9) 678 (26.7) 696 (27.4) La Crosse,
WI Std. Dev. 151 (5.9) 145 (5.7) 143 (5.6) 125 (4.9) Mean 632 (24.9) 656 (25.8) 547 (21.6) 575 (22.6) Sioux Falls,
SD Std. Dev. 148 (5.8) 149 (5.9) 132 (5.2) 136 (5.4)

42
Figure 11. Annual precipitation at six weather stations.
Trends in precipitation were analyzed for the 1964 – 2005 and 1986 – 2005 periods
(Table 9). For the 1964 – 2005 period, precipitation at the three southern locations, i.e. Sioux
Falls, La Crosse, Minneapolis, as well as Fargo had an upward trend. Only the trend for Fargo

43
was significant at the 0.05 level. Trends at all other locations, except International Falls, were
significant at the 0.5 level (Table 9).
For the more recent 1986 – 2005 period, precipitation at all stations, except La Crosse
and Duluth, showed an upward trend. The trend for Fargo was significant at the 0.05 level and
the trends at the other stations, except Duluth, were significant at the 0.5 level (Table 9).
Table 9. Trends in precipitation (mm/yr) for 1964 – 2005 and 1986 – 2005.
Location Period 1964 – 2005 1986 – 2005
Trend -0.84 5.10 International Falls
Sig. 0.47 0.16
Trend -0.44 -1.10 Duluth
Sig. 0.80 0.84
Trend 3.89 13.18 Fargo, ND
Sig. 0.02 0.01
Trend 2.47 1.78 Minneapolis
Sig. 0.21 0.73
Trend 1.70 -1.53 La Crosse, WI
Sig. 0.39 0.78
Trend 2.61 7.20 Sioux Falls, SD
Sig. 0.17 0.22
3.7. Statistics and Trends of Annual Water Availability (Precipitation minus Evaporation)
Annual water availability is defined as precipitation minus evaporation through a lake
surface. Water availability is calculated as a) annual precipitation minus annual open-water
evaporation, and b) annual open-water season precipitation minus open-water evaporation. This
dual approach is used because in the winter months when lakes are ice-covered and precipitation
is in the form of snow, the water gains and losses are more difficult to quantify then for the
summer months. Under the scenario (a) the water availability is maximum, i.e. winter
precipitation is retained in its entirety as an input to the lake. There is no water loss by snow

44
blown away from the lake surface onto land, or by ablation of snow and ice from the frozen lake
surface. Under scenario (b) the water availability is a minimum because winter precipitation is
ignored entirely, i.e. snow fall on a lake surface is blown away by the wind or evaporated. It is
likely that scenario (a) matches conditions on small, wind-sheltered lakes better, while scenario
(b) may be more appropriate for lakes with large wind-exposed fetches.
Table 10 provides the statistics of water availability for the six stations. The values in
Table 10 are the differences between measured precipitation (Table 8) and calculated annual
evaporation (Table 7). All are annual values averaged over the indicated period. According to
Table 10, water availability (for scenarios (a) and (b)) in all stations except International Falls
and Duluth was higher in the last 20 years (1986 – 2005 ). Water availability at International
Falls showed a slight decrease in the 1986 – 2005 period. Water availability at Duluth calculated
with scenario (a) showed a slight decrease and water availability calculated with scenario (b)
showed an increase in the last 20 years.
Annual water availability has a negative value for most years at all six locations because
evaporation tends to exceed precipitation. This water deficit has to be made up by surface runoff
from the watershed into a lake or by a net groundwater input if a stable lake level is to be
maintained.

45
Table 10. Mean and standard deviation of annual water availability in mm/yr (in/yr) for
the periods 1964 – 2005 and 1986 – 2005 . Water availability is calculated as
a) annual precipitation minus annual open-water season evaporation, and
b) annual open-water season precipitation minus annual open-water season evaporation.
Precipitation -
Open-Water Evaporation
Open-Water Precipitation -
Open-Water Evaporation
Location Statistic 1964 – 2005 1986 – 2005 1964 – 2005 1986 – 2005
Mean -18 (-0.7) -39 (-1.5) -168(-6.6) -177 (-7.0) International
Falls Std. Dev. 106 (4.2) 106 (4.2) 92 (3.6) 93 (3.6) Mean 256 (10.1) 253 (10.0) 21 (0.8) 28 (1.1)
Duluth Std. Dev. 141 (5.6) 147 (5.8) 118 (4.7) 128 (5.1) Mean -140 (-5.5) -107 (-4.2) -281 (-11.0) -248 (-9.7)
Fargo, ND Std. Dev. 138 (5.4) 147 (5.8) 121 (4.8) 131 (5.2) Mean -54 (-2.1) -22 (-0.9) -173 (-6.8) -127 (-5.0)
Minneapolis Std. Dev. 171 (6.7) 151 (5.9) 166 (6.5) 153 (6.0) Mean -16 (-0.6) 30 (1.3) -150 (-5.9) -110 (-4.3) La Crosse,
WI Std. Dev. 167 (6.6) 153 (6.0) 167 (6.6) 153 (6.0) Mean -212 (-8.3) -190 (-7.5) -308 (-12.1) -294 (-11.6) Sioux Falls,
SD Std. Dev. 164 (6.4) 170 (6.7) 171 (6.7) 204 (8.0)
Trends in annual water availability are given in Table 11. For the period 1964 – 2005,
annual water availability – calculated as annual precipitation minus annual open-water
evaporation – showed an upward trend, i.e. a smaller annual water deficit at the lake surface, for
Fargo, Minneapolis, Sioux Falls, and La Crosse. The trend calculated for Fargo was significant at
the 0.05 level, all others were significant at the 0.5 level. Annual water availability for
International Falls and Duluth showed a decreasing trend. For International Falls this trend was
significant at the 0.5 level; for Duluth the trend was not significant.
For the period 1986 – 2005, water availability trends were upward for International Falls,
Fargo, Minneapolis, and Sioux Falls (Table 11). Trends for Fargo were significant at the 0.05
level; trends for International Falls, Minneapolis, and Sioux Falls were significant at the 0.5

46
level. Annual water availability had an upward trend for Duluth, but a downward trend for La
Crosse.
For the period 1964 – 2005, annual water availability – calculated as the difference
between open-water precipitation minus open-water evaporation – showed increasing trends at
all stations (Table 11). The trends for Fargo and Minneapolis were significant at the 0.05 level,
and the trends for La Crosse and Sioux Falls at the 0.5 level. The trends for International Falls
and Duluth were near zero, but the other four ranged from 1.6 to 4.3 mm/yr.
For the period 1986 – 2005, annual water availability for the open-water season (Table
11) showed an upward trend at all locations, except Duluth. The trends for Fargo and Sioux Falls
were significant at the 0.05 level, the trend for International Falls at the 0.5 level. The strongest
trend was at Fargo (15.1 mm/yr).
Table 11. Trends (mm/yr) in annual water availability. Water availability is calculated as
a) annual precipitation minus annual open-water evaporation, and
b) annual open-water season precipitation minus annual open-water evaporation.
Precipitation -
Open-Water Evaporation
Open-Water Precipitation -
Open-Water Evaporation
Location Trend
Sig. 1964 – 2005 1986 – 2005 1964 – 2005 1986 – 2005
Trend -0.96 5.77 0.18 6.76 International Falls
Sig. 0.48 0.17 0.88 0.06
Trend -0.98 -0.22 0.05 -2.67 Duluth
Sig. 0.59 0.97 0.97 0.61
Trend 3.93 14.50 4.27 15.06 Fargo, ND
Sig. 0.02 0.01 0.00 0.00
Trend 3.45 2.47 4.17 2.29 Minneapolis
Sig. 0.11 0.68 0.05 0.71
Trend 3.68 1.89 3.23 0.58 La Crosse, WI
Sig. 0.09 0.78 0.13 0.93
Trend 2.37 6.09 1.63 5.04 Sioux Falls, SD Sig. 0.27 0.37 0.47 0.54
47
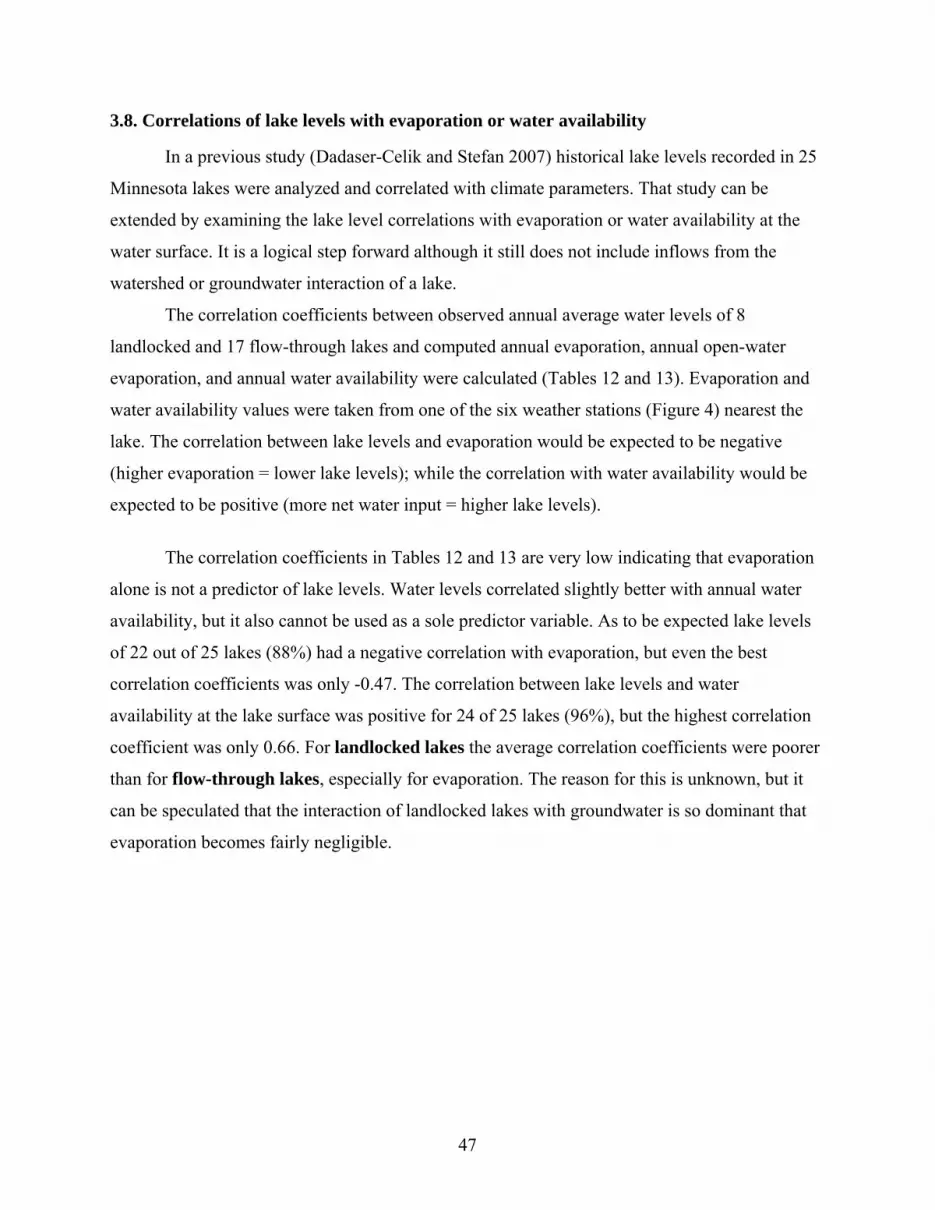
3.8. Correlations of lake levels with evaporation or water availability
In a previous study (Dadaser-Celik and Stefan 2007) historical lake levels recorded in 25
Minnesota lakes were analyzed and correlated with climate parameters. That study can be
extended by examining the lake level correlations with evaporation or water availability at the
water surface. It is a logical step forward although it still does not include inflows from the
watershed or groundwater interaction of a lake.
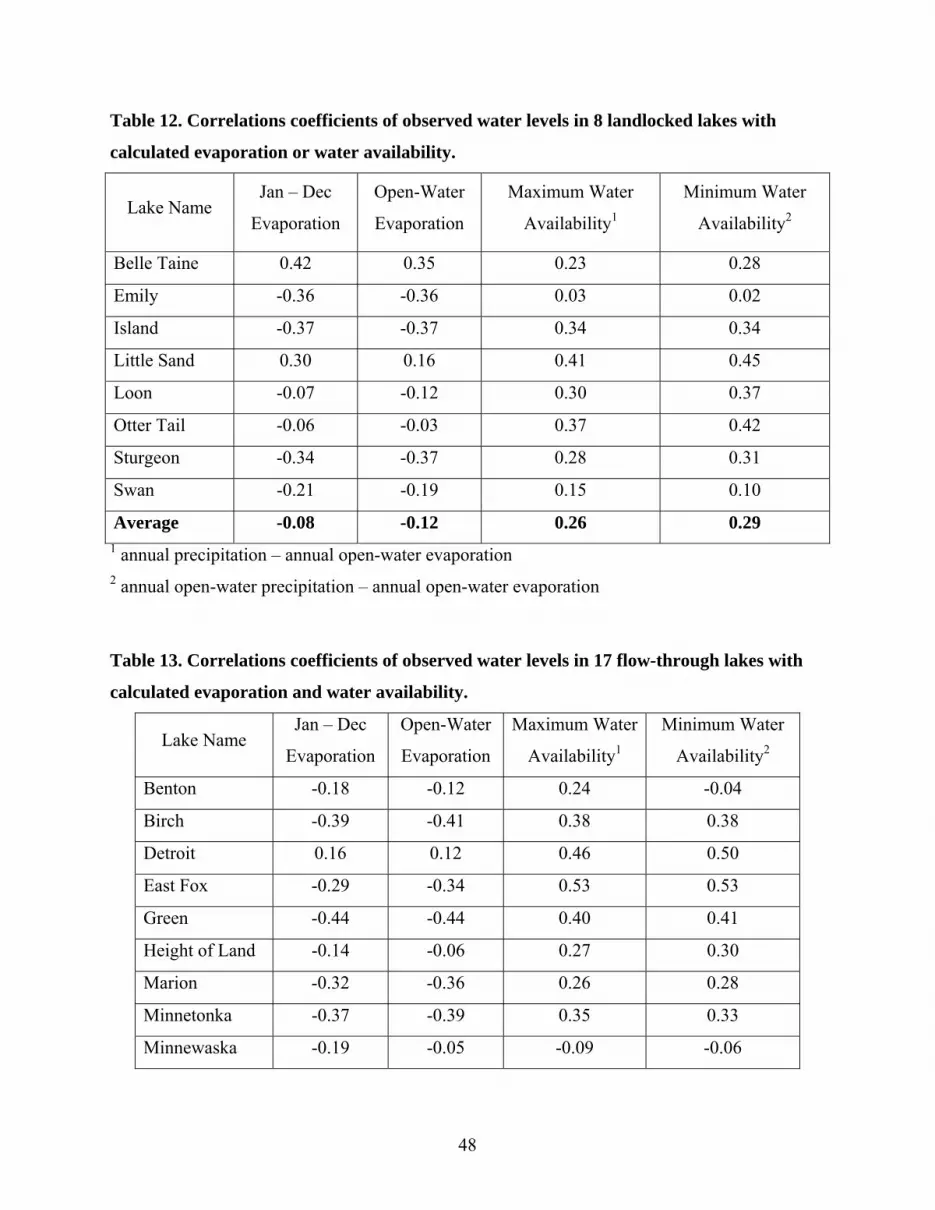
The correlation coefficients between observed annual average water levels of 8
landlocked and 17 flow-through lakes and computed annual evaporation, annual open-water
evaporation, and annual water availability were calculated (Tables 12 and 13). Evaporation and
water availability values were taken from one of the six weather stations (Figure 4) nearest the
lake. The correlation between lake levels and evaporation would be expected to be negative
(higher evaporation = lower lake levels); while the correlation with water availability would be
expected to be positive (more net water input = higher lake levels).
The correlation coefficients in Tables 12 and 13 are very low indicating that evaporation
alone is not a predictor of lake levels. Water levels correlated slightly better with annual water
availability, but it also cannot be used as a sole predictor variable. As to be expected lake levels
of 22 out of 25 lakes (88%) had a negative correlation with evaporation, but even the best
correlation coefficients was only -0.47. The correlation between lake levels and water
availability at the lake surface was positive for 24 of 25 lakes (96%), but the highest correlation
coefficient was only 0.66. For landlocked lakes the average correlation coefficients were poorer
than for flow-through lakes, especially for evaporation. The reason for this is unknown, but it
can be speculated that the interaction of landlocked lakes with groundwater is so dominant that
evaporation becomes fairly negligible.
48
Table 12. Correlations coefficients of observed water levels in 8 landlocked lakes with
calculated evaporation or water availability.
Lake Name Jan – Dec
Evaporation
Open-Water
Evaporation
Maximum Water
Availability1
Minimum Water
Availability2
Belle Taine 0.42 0.35 0.23 0.28
Emily -0.36 -0.36 0.03 0.02
Island -0.37 -0.37 0.34 0.34
Little Sand 0.30 0.16 0.41 0.45
Loon -0.07 -0.12 0.30 0.37
Otter Tail -0.06 -0.03 0.37 0.42
Sturgeon -0.34 -0.37 0.28 0.31
Swan -0.21 -0.19 0.15 0.10
Average -0.08 -0.12 0.26 0.29 1 annual precipitation – annual open-water evaporation 2 annual open-water precipitation – annual open-water evaporation
Table 13. Correlations coefficients of observed water levels in 17 flow-through lakes with
calculated evaporation and water availability.
Lake Name Jan – Dec
Evaporation
Open-Water
Evaporation
Maximum Water
Availability1
Minimum Water
Availability2
Benton -0.18 -0.12 0.24 -0.04
Birch -0.39 -0.41 0.38 0.38
Detroit 0.16 0.12 0.46 0.50
East Fox -0.29 -0.34 0.53 0.53
Green -0.44 -0.44 0.40 0.41
Height of Land -0.14 -0.06 0.27 0.30
Marion -0.32 -0.36 0.26 0.28
Minnetonka -0.37 -0.39 0.35 0.33
Minnewaska -0.19 -0.05 -0.09 -0.06

49
Mud -0.41 -0.47 0.66 0.64
Pelican -0.31 -0.32 0.23 0.20
Peltier -0.41 -0.45 0.48 0.52
Rush -0.12 -0.09 0.40 0.40
Shetek -0.19 -0.12 0.56 0.09
Swan -0.37 -0.40 0.11 0.09
Upper Prior -0.27 -0.32 0.23 0.20
Vermillion -0.29 -0.33 0.38 0.42
Average -0.27 -0.27 0.34 0.31 1 annual precipitation – annual open-water evaporation 2 annual open-water precipitation – annual open-water evaporation
We also calculated the correlation coefficients between lake levels in October and
evaporation during the summer (June-August and May-October) (Tables 14 and 15). May-
October evaporation had a higher average correlation coefficient than June-August evaporation.
Correlation coefficients of October water levels with May-October evaporation were negative, as
to be expected for 22 out of 25 lakes ( 88 %), but the best value was only -0.64, and the average
only -0.22 and -0.27 for landlocked and flow-through lakes, respectively.
Table 14. Correlation coefficients of observed October water levels in 8 landlocked lakes
with calculated summer evaporation.
Lake Name June-August Evaporation May-October Evaporation
Belle Taine 0.45 0.32
Emily -0.56 -0.64
Island -0.44 -0.48
Little Sand 0.10 0.00
Loon -0.21 -0.14
Otter Tail -0.13 -0.19
Sturgeon -0.06 -0.27
Swan -0.30 -0.38
Average -0.14 -0.22

50
Table 15. Correlation coefficients of observed October water levels in 17 flow-through
lakes with calculated summer evaporation.
Lake Name June-August Evaporation May-October Evaporation
Benton 0.29 -0.01
Birch -0.40 -0.49
Detroit 0.03 0.15
East Fox 0.02 -0.13
Green -0.02 -0.24
Height of Land -0.12 -0.10
Marion -0.55 -0.53
Minnetonka -0.42 -0.52
Minnewasha -0.14 -0.11
Mud -0.51 -0.50
Pelican -0.04 -0.12
Peltier -0.41 -0.47
Rush -0.21 -0.18
Shetek -0.23 -0.21
Swan -0.34 -0.35
Upper prior -0.49 -0.57
Vermillion -0.34 -0.26
Average -0.23 -0.27
In summary, these results show that the correlation between lake water levels and
evaporation and water availability is low. This is attributed to the fact that surface water inflow
from the watershed of a lake and groundwater interactions (Eq.1) affect lake water levels at least
as much or more than evaporation and precipitation on the lake surface. The obvious conclusion
is that for most lake water budgets surface water runoff from the watershed must be considered.

51
4. SUMMARY & CONCLUSIONS
Lake evaporation can be measured as pan evaporation or computed from relationships
with climate parameters. We reviewed measured pan evaporation data and computed evaporation
rates from Minnesota lakes by using daily weather data recorded at six Class A weather stations
(Figure 4) from 1964 to 2005. Daily evaporation at these stations was estimated using mass-
transfer equations named after Meyer, Lake Hefner, Rohwer, and Ryan and Harleman. Results
were analyzed individually or as averages.
Trends in evaporation and water availability (precipitation minus evaporation) were
calculated using linear regression. We also compared results for the full period of record (1964 –
2005) with results for the recent 20 years (1986 – 2005). For the trend analysis we selected the
Meyer equation as most appropriate for Minnesota conditions.
We examined the correlation coefficients between annual average water levels of 25
previously analyzed Minnesota lakes (Dadaser-Celik and Stefan (2007)) and annual evaporation
or water availability. Eight lakes were landlocked and 17 flow-through lakes.
The results can be summarized as follows:
1) July is the month with the highest evaporation from lake surfaces in Minnesota. Daily
evaporation from Minnesota lakes in July is on average 4.4 – 6.7 mm/day (0.17 – 0.26
in/day). Monthly evaporation in July varied in the range 134 – 160 mm (5.3 – 6.3 in).
2) Annual evaporation from Minnesota lakes ranged from 781 to 942 mm/yr (30.8 to 37.1
in/yr). To obtain these results, daily values calculated by the Meyer equation for six
locations were averaged for the 1964 – 2005 period. The lowest evaporation occurs when
Minnesota lakes are ice-covered.
3) The open-water season evaporation showed no consistent trend in the 1964 – 2005 period
(Table 6). Three locations (International Falls, Duluth and Sioux Falls) had a weakly rising
trend (0.13 to 0.64 mm/yr), and the other three locations (Fargo, Minneapolis and La
Crosse) had a weakly falling trend (-0.03 to -1.65 mm/yr).
4) Over the last 20 years (1986 – 2005), the open-water season evaporation trends became
slightly more negative. Five of the six locations had negative trends from -0.69 to
-1.57 mm/yr. The exception was Sioux Falls with a positive trend of 1.09mm/yr (Table 6).

52
5) Annual average precipitation at the six locations ranged from 536mm/yr to 812 mm/yr
(21.1 in/yr to 32.0 in/yr) in the 1964 – 2005 period. Annual precipitation showed a rising
trend at four of the six locations (International Falls and Duluth were the exceptions) from
1964 to 2005. Increasing trends were in the range of 1.70 to 3.85 mm/yr, while the
strongest decreasing trend was -0.84 mm/yr (Table 8).
6) Over the last 20 years (1986 – 2005), the annual precipitation also showed a rising trend at
four of the six locations (Duluth and La Crosse were the exceptions). Increasing trends
were in the range of 1.78 to 13.18 mm/yr, while the strongest decreasing trend was –1.53
mm/yr (Table 8).
7) Water availability had trends similar to precipitation for the period 1964 – 2005. The
strongest upward trend was found for Fargo with a rate of 3.93 mm/yr and the strongest
negative trend for Duluth with a rate of -0.98 mm/yr. For the last 20 years (1986 – 2005)
water availability had a stronger upward trend (e.g., 14.5 mm/yr in Fargo) than for the 40-
year period (1964 – 2005).
8) Water availability during the open-water period – calculated as annual open-water season
precipitation minus annual open-water evaporation – increased at all six locations from
1964 to 2005 (Table 9). The strongest rise was at Fargo with a rate of 4.27 mm/yr.
9) From 1986 to 2006, water availability during open-water periods showed even stronger
rising trends for all locations, except Duluth. The strongest upward trend was again at
Fargo (15.06mm/yr). Duluth had a downward trend of -2.67mm/yr.
We have also attempted to understand how Minnesota lake levels have responded to
climate in the past 40 year, and evaporation is an important component of this investigation.
Correlation coefficients between annual lake water levels and annual evaporation or annual water
availability were, however, very weak. Similarly weak were correlation coefficients between
lake levels in October and evaporation from May to October.
Overall, the analysis shows that lake evaporation in Minnesota in the last 40 and the last
20 years has had trends that were not strong enough to form a conclusion about evaporation
changes. Evaporation seems to have become more variable from year to year in the last 20 years.
By comparison trends in precipitation during the same time periods were positive and much

53
stronger than trends in evaporation. As a result, upward trends in annual water availability exist
in the state of Minnesota. That is mostly good news.
Although we did not find strong correlations between lake levels and evaporation and
water availability, increases in water availability can perhaps explain the increased observed
water levels of 25 lakes, which we analyzed before (Dadaser-Celik and Stefan 2007).
ACKNOWLEDGEMENTS
This study was conducted with funding from the Minnesota Citizens Committee on
Minnesota Resources, St Paul, Minnesota, to the University of Minnesota. The grant was
coordinated by Lucinda Johnson from the Natural Resources Research Institute in Duluth.
The lake level data used in this study came from a database of the Minnesota Department of
Natural Resources in St. Paul. Weather data were extracted from the database of the State
Climatologist Office. We thank these institutions and individuals for their help and co-operation.

54
REFERENCES Anonymous, 1997. Climate Change and Minnesota. EPA 230-F-97-008w, United States
Environmental Protection Agency (EPA), Office of Policy, Planning and Evaluation,
Washington, D.C.
Changnon, S.A. and Kunkel, K.E., 1995. Climate-related fluctuations in Midwestern floods
during 1921-1985. Journal of Water Resources Planning and Management, 121(4): 326-
334.
Chow, V.T., 1964. Handbook of Applied Hydrology. McGraw-Hill Book Company, New York,
NY, USA.
Dadaser-Celik, F. and Stefan, H.G., 2007. Lake level response to climate in Minnesota.,
University of Minnesota, St. Anthony Falls Laboratory, Report No: 502., Minneapolis,
MN.
Dalton, J., 1802. Experimental essays on evaporation. Machester Literary Philosophical Society
Proceedings, 5: 536-602.
Edinger, J.E., Brady, D.K. and Geyer, J.C., 1968. The response of water temperatures to
meteorological conditions. Water Resources Research, 4(5): 1137-1143.
Fang, X. and Stefan, H.G., 1999. Projections of climate change effects on water temperature
characteristics of small lakes in the contiguous U.S. Climatic Change, 42: 377-412.
Gleick, P.G., 2000. Water - The Potential Consequences of Climate Variability and Change,
Pacific Institude for Studies in Development, Environment, and Security, Oakland, CA.
Johnson, S.L. and Stefan, H.G., 2004. Indicators of climate warming in water resources data
from Minnesota, St. Antony Falls Laboratory, University of Minnesota, Minneapolis,
MN, USA.

55
Johnson, S.L. and Stefan, H.G., 2006. Indicators of climatewarming in Minnesota: Lake ice
covers and snowmelt runoff. Climatic Change, 75: 421–453.
Kling, G.W. et al., 2003. Confronting Climate Change in the Great Lakes Region: Impacts on
our Communities and Ecosystems, The Union of Concerned Scientists, Cambridge, MA
and The Ecological Society of America, Washington, D.C.
Marciano, J.J. and Harbeck, G.E., 1954. Mass-transfer studies. In: USGS (Editor), Water-Loss
Investigations: Lake Hefner Studies, Technical Report. United States Geological Survey,
Washington, D.C., pp. 46-70.
Meyer, A.F., 1942. Evaporation From Lakes and Reservoirs: A Study Based on Fifth Years'
Weather Bureau Records. Minnesota Resources Commission, St. Paul, MN.
NCDC, Climate of Minnesota, National Climatic Data Center (NCDC), Available at
http://www5.ncdc.noaa.gov/climatenormals/clim60/states/Clim_MN_01.pdf (accessed
February 22, 2008).
Novotny, E.V. and Stefan, H.G., 2007. Stream flow in Minnesota: Indicator of climate change.
Journal of Hydrology, 334: 319– 333.
Rohwer, C., 1931. Evaporation from free water surfaces, U.S. Department of Agriculture,
Washington, D.C., USA.
Seeley, M., 2003. Climate trends: what are some implications for Minnesota’s air and water
resources?
Singh, V.P. and Xu, C.-Y., 1997a. Evaluation and Generalization of 13 Mass-Transfer Equations
for Determining Free Water Evaporation. Hydrological Processes, 11(3): 311-323.
Singh, V.P. and Xu, C.-Y., 1997b. Sensitivity of mass transfer-based evaporation equations to
errors in daily and monthly input data. Hydrological Processes, 11(11): 1465-1473.

56
Stefan, H.G., Fang, X. and Hondzo, M., 1998. Simulated climate change effects on year-round
water temperatures in temperate zone lakes. Climatic Change, 40: 547–576.
Stefan, H.G., Gulliver, J., Hahn, M.G. and Fu, A.Y., 1980. Water temperature dynamics in
experimental field channels: Analysis and modeling, St. Antony Falls Hydraulic
Laboratory, University of Minnesota, Minneapolis, MN, USA.
Stefanovic, 2000. personal communication.
Sturrock, A.M., Winter, T.C. and Rosenberry, D.O., 1992. Energy budget evaporation from
Willams Lake: A closed lake in North Central Minnesota. Water Resources Research,
28(6): 1605-1617.
Williams, G., Layman, K.L. and Stefan, H.G., 2004. Dependence of lake ice covers on climatic,
geographic and batyhmetric variables. Cold Regions Science and Technology, 40: 145-
164.
Winter, T.C., 1981. Uncertainties in Estimating the Water Balance of Lakes. Water Resources
Bulletin, 17(1): 82-115.

57
APPENDIX 1. Sensitivity of evaporation to water temperature assumption In the sensitivity analysis, we estimated average daily lake water water temperatures by
solving equation A1.1
ChTTK
dtdT we
ρ)( −
= (A1.1)
In Equation A1.1, Tw is water surface temperature (oC), t is time (day), K is the bulk
surface heat exchange coefficient (W/m2/C), Te is the equilibrium temperature (oC), ρ is density
of water (1,000 kg/m3), C is the heat capacity of water (4,186 J/kg/oC), and h is the surface
mixed layer depth (m) of a lake. Daily Te and K values were obtained by using the climatic data
and equations provided by Edinger (1974) as explained in the Methods section. Equation A1.1
was solved numerically for Tw for mixed layer depths of 0, 1.0, 5.0, and 20.0 m.
Average daily and average monthly water temperatures corresponding to different mixed
layer depths are shown on Figures A1.1 and A1.2, respectively, for the year 1964. As can be
seen, daily water temperatures become more dynamic when mixed depth is decreased (Figure
A1.1). Day to day temperature fluctuations are highest when mixed layer depths are 0 and 1 m
and small when mixed water depths are 5 and 20 m. The peak water temperatures decrease and
the timing of peaks is delayed as mixed layer depths increase (Figures A.1 and A.2). Average
annual surface water temperatures for mixed layer depths of 0, 1, 5 and 20 m were 8.4 oC (47.2 oF), 8.0 oC (46.4 oF), 8.6 oC (47.2 oF), and 9.1 oC (48.4 oF), respectively, under 1964 climate
conditions. This is a fairly narrow range. In our evaporation estimates/calculations we used the
water temperatures for 0 m mixed layer depth, which is within 0.7oC of the other values.

58
Figure A1.1. Daily water temperatures for the year 1964 corresponding to mixed water
depths of 0, 1, 5, and 20 m.
Figure A1.2. Average monthly water temperatures for the year 1964 corresponding to
mixed layer depths of 0, 1, 5, and 20 m.

59
The annual evaporation values calculated with the Meyer equation corresponding to
different mixed water depths are provided in Figure A1.3. As expected, annual evaporation
decreased as mixed water depth increased because the surface water remained colder. Average
annual evaporation values for the 1964 – 2005 period corresponding to mixed water depths of 0,
1, 5 and 20 m were 895 mm (35.2 in), 851 mm (33.5 in), 840 mm (33.1 in), and 767 mm (30.2
in), respectively. Mixed layer depths in Minnesota’s dimictic lakes are typically from 2 to 5 m in
summer, when evaporation is at a maximum. Evaporation values for those depths given in Figure
A1.3 are on the order of 5 to 8% lower than those for 0m mixed layer depth. Absolute
evaporation estimates may be too high by this fraction, but trends would not be much affected.
Figure A1.3. Annual evaporation calculated with water temperatures estimated for mixed
layer depths of 0, 1, 5, and 20 m.

60
APPENDIX 2. Average Ice-out and Ice-in dates for Minnesota Lakes
Ice-out and ice-in dates for Minnesota lakes are shown in Figures A2.1 and A2.2. The data cover the latitudes over which the state of Minnesota extends. The data are averages of
many years of record (Johnson and Stefan 2006). Ice-out date data show less scatter because ice-
out is more directly correlated with climate variables some of which are strongly dependent on
latitude. Ice out depends also on climate, but in addition has a strong dependence on average lake
depth which is not accounted for in the data plot.
y = 5.1441x + 37489R2 = 0.7418
30-Mar
4-Apr
9-Apr
14-Apr
19-Apr
24-Apr
29-Apr
4-May
43.0 44.0 45.0 46.0 47.0 48.0 49.0 50.0
Latitude (o)
Ave
rage
Ice-
Out
Dat
e
Figure A2.1. Average ice-out dates for Minnesota lakes (Johnson and Stefan, 2006)
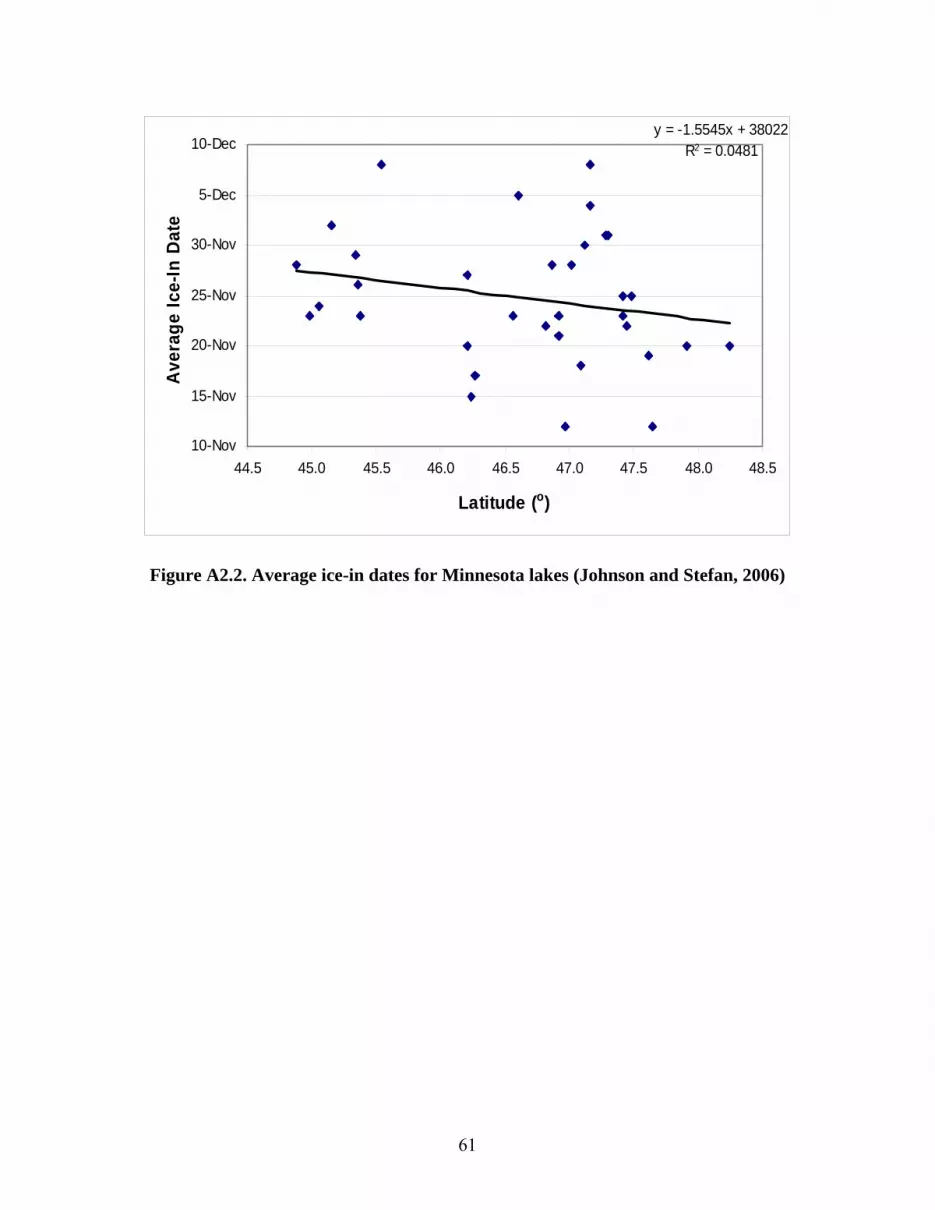
61
y = -1.5545x + 38022R2 = 0.0481
10-Nov
15-Nov
20-Nov
25-Nov
30-Nov
5-Dec
10-Dec
44.5 45.0 45.5 46.0 46.5 47.0 47.5 48.0 48.5
Latitude (o)
Aver
age
Ice-
In D
ate
Figure A2.2. Average ice-in dates for Minnesota lakes (Johnson and Stefan, 2006)

62
APPENDIX 3. Names, locations, and characteristics of Minnesota lakes
included in this study
The names and locations of the lakes included in the lake level study (Dadasser-Celik and
Stefan 2007) are given in Figure A3.1. The lake characteristics are listed on Table A3.1.
Figure A3.1.Locations and names of Minnesota lakes included in the lake level study
(Dadaser-Celik and Stefan 2007)
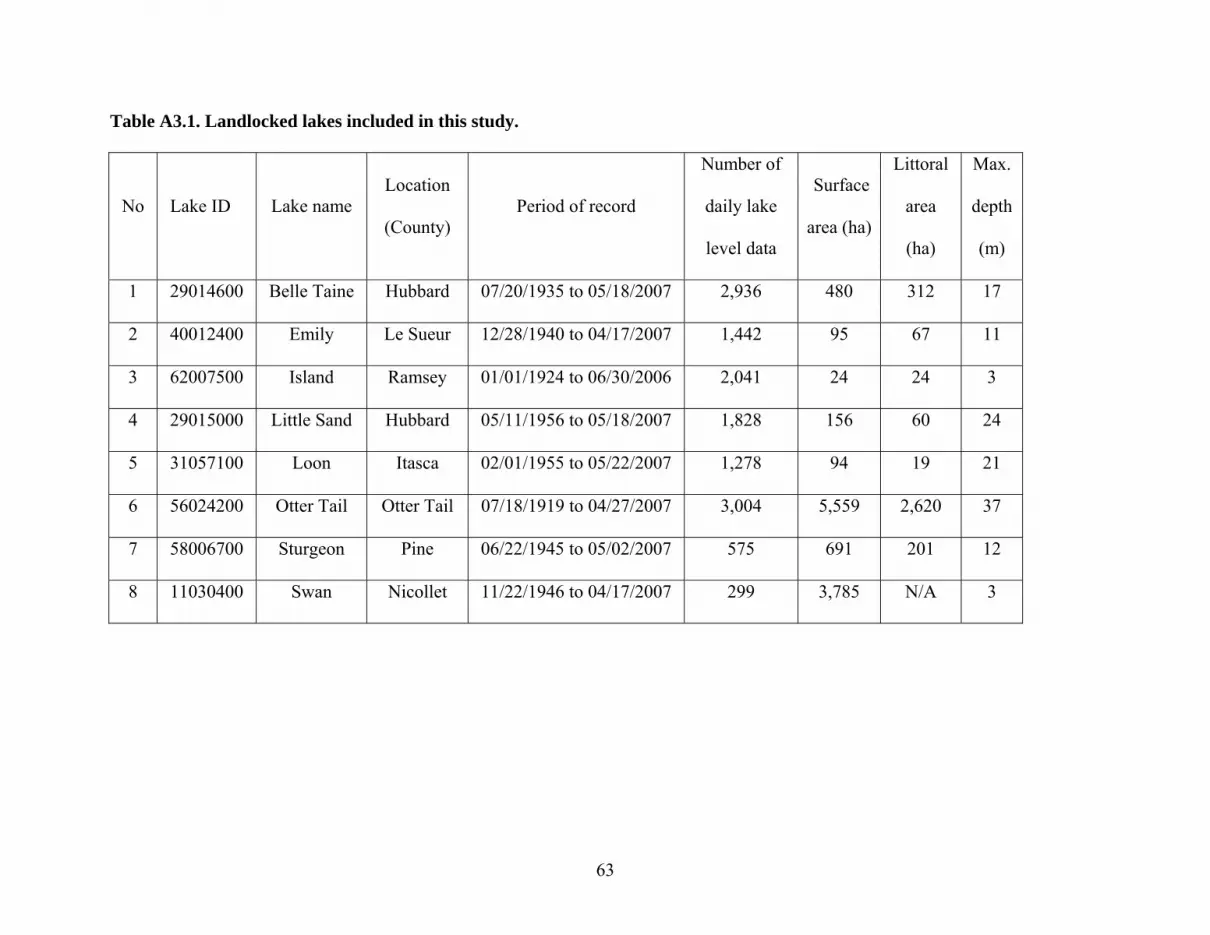
63
Table A3.1. Landlocked lakes included in this study.
No Lake ID Lake name Location
(County) Period of record
Number of
daily lake
level data
Surface
area (ha)
Littoral
area
(ha)
Max.
depth
(m)
1 29014600 Belle Taine Hubbard 07/20/1935 to 05/18/2007 2,936 480 312 17
2 40012400 Emily Le Sueur 12/28/1940 to 04/17/2007 1,442 95 67 11
3 62007500 Island Ramsey 01/01/1924 to 06/30/2006 2,041 24 24 3
4 29015000 Little Sand Hubbard 05/11/1956 to 05/18/2007 1,828 156 60 24
5 31057100 Loon Itasca 02/01/1955 to 05/22/2007 1,278 94 19 21
6 56024200 Otter Tail Otter Tail 07/18/1919 to 04/27/2007 3,004 5,559 2,620 37
7 58006700 Sturgeon Pine 06/22/1945 to 05/02/2007 575 691 201 12
8 11030400 Swan Nicollet 11/22/1946 to 04/17/2007 299 3,785 N/A 3

64
Table A3.2. Flow-through lakes included in this study.
No Lake ID Lake name Location
(County) Period of record
Number of
daily lake
level data
Surface
area
(ha)
Littoral
area
(ha)
Max.
depth
(m)
1 41004300 Benton Lincoln 07/31/1947 to 04/17/2007 2,325 1,157 1,157 3
2 62002400 Birch Ramsey 06/04/1930 to 04/13/2007 2,537 N/A N/A N/A
3 3038100 Detroit Becker 08/25/1943 to 05/17/2007 3,625 1,249 767 27
4 18029800 East Fox Crow Wing 04/22/1937 to 05/15/2007 2,401 97 41 20
5 30013600 Green Isanti 06/22/1937 to 04/20/2007 2,407 325 145 9
6 3019500 Height of
Land Becker 03/24/1938 to 05/16/2007 3,004
1,426 1,292 6
7 19002600 Marion Dakota 05/03/1946 to 04/16/2007 2,963 227 184 6
8 27013300 Minnetonka Hennepin 05/30/1906 to 04/18/2007 18,616 5,672 2,369 34
9 61013000 Minnewaska Pope 05/29/1935 to 04/25/2007 2,860 2,880 867 10
10 34015800 Mud Kandiyohi 12/02/1945 to 04/26/2007 3,735 939 939 4
11 18030800 Pelican Crow Wing 11/29/1933 to 05/04/2007 3,125 3,342 1,584 32
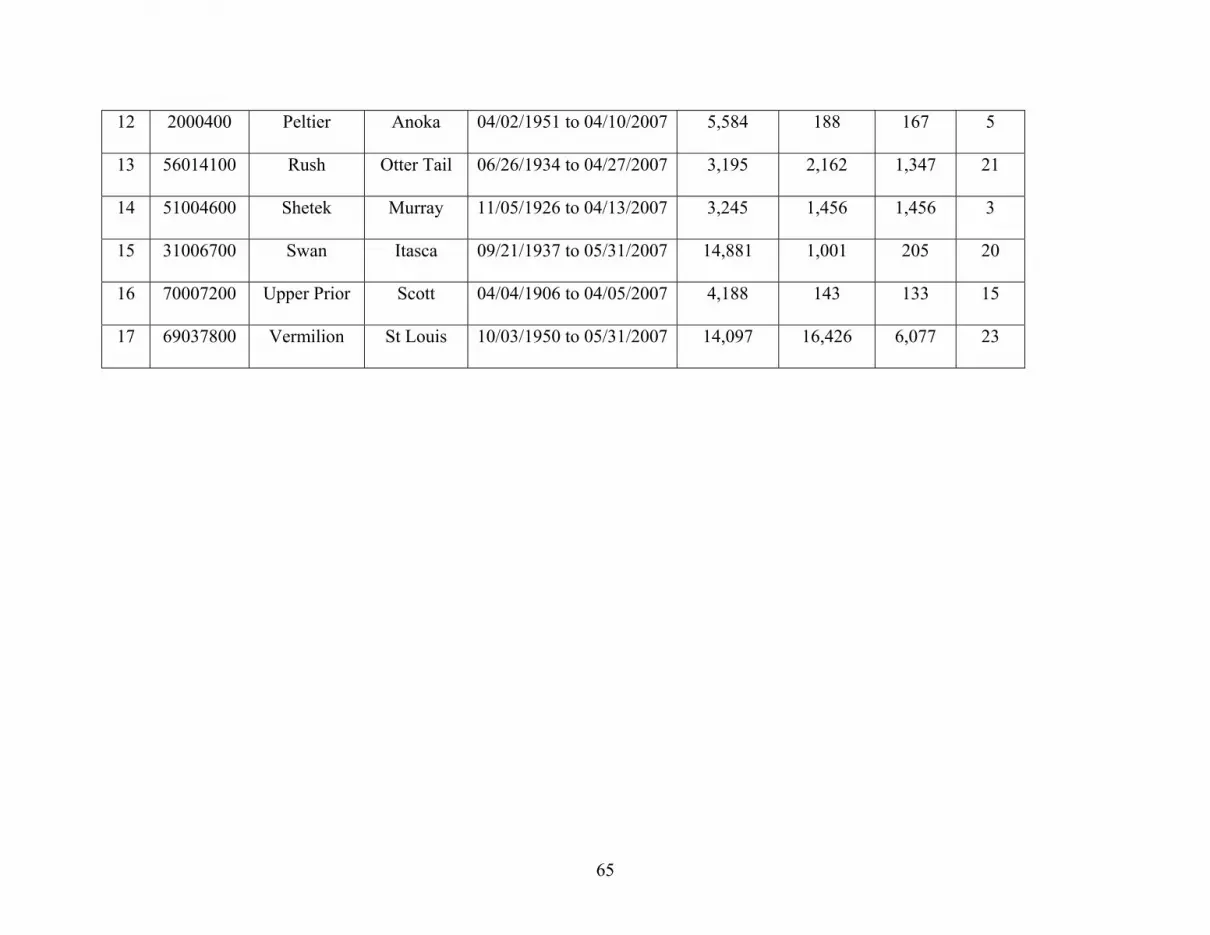
65
12 2000400 Peltier Anoka 04/02/1951 to 04/10/2007 5,584 188 167 5
13 56014100 Rush Otter Tail 06/26/1934 to 04/27/2007 3,195 2,162 1,347 21
14 51004600 Shetek Murray 11/05/1926 to 04/13/2007 3,245 1,456 1,456 3
15 31006700 Swan Itasca 09/21/1937 to 05/31/2007 14,881 1,001 205 20
16 70007200 Upper Prior Scott 04/04/1906 to 04/05/2007 4,188 143 133 15
17 69037800 Vermilion St Louis 10/03/1950 to 05/31/2007 14,097 16,426 6,077 23
Recommended


