Long-Term Occupancy Trends in a Data-Poor DugongPopulation in the Andaman and Nicobar ArchipelagoElrika D’Souza1, Vardhan Patankar1, Rohan Arthur1, Teresa Alcoverro1,2, Nachiket Kelkar1*
1 Oceans and Coasts Program, Nature Conservation Foundation, Mysore, Karnataka, India, 2 Centre d’Estudis Avancats de Blanes (Spanish National Research Council),
Blanes, Girona, Spain
Abstract
Prioritizing efforts for conserving rare and threatened species with limited past data and lacking population estimates ispredicated on robust assessments of their occupancy rates. This is particularly challenging for elusive, long-lived and wide-ranging marine mammals. In this paper we estimate trends in long-term (over 50years) occupancy, persistence andextinction of a vulnerable and data-poor dugong (Dugong dugon) population across multiple seagrass meadows in theAndaman and Nicobar archipelago (India). For this we use hierarchical Bayesian dynamic occupancy models accounting forfalse negatives (detection probability,1), persistence and extinction, to two datasets: a) fragmentary long-term occurrencerecords from multiple sources (1959–2004, n = 40 locations), and b) systematic detection/non-detection data from currentsurveys (2010–2012, n = 57). Dugong occupancy across the archipelago declined by 60% (from 0.45 to 0.18) over the last 20years and present distribution was largely restricted to sheltered bays and channels with seagrass meadows dominated byHalophila and Halodule sp. Dugongs were not found in patchy meadows with low seagrass cover. In general, seagrasshabitat availability was not limiting for dugong occupancy, suggesting that anthropogenic factors such as entanglement ingillnets and direct hunting may have led to local extinction of dugongs from locations where extensive seagrass meadowsstill thrive. Effective management of these remnant dugong populations will require a multi-pronged approach, involving 1)protection of areas where dugongs still persist, 2) monitoring of seagrass habitats that dugongs could recolonize, 3)reducing gillnet use in areas used by dugongs, and 4) engaging with indigenous/settler communities to reduce impacts ofhunting.
Citation: D’Souza E, Patankar V, Arthur R, Alcoverro T, Kelkar N (2013) Long-Term Occupancy Trends in a Data-Poor Dugong Population in the Andaman andNicobar Archipelago. PLoS ONE 8(10): e76181. doi:10.1371/journal.pone.0076181
Editor: Danilo Russo, Universita degli Studi di Napoli Federico II, Italy
Received May 2, 2013; Accepted August 23, 2013; Published October 15, 2013
Copyright: � 2013 D’Souza et al. This is an open-access article distributed under the terms of the Creative Commons Attribution License, which permitsunrestricted use, distribution, and reproduction in any medium, provided the original author and source are credited.
Funding: This research was supported and funded by the Conservation Leadership Program (Future Conservationist Award), Ministry of Environment and Forests(Species Recovery Program), Mohammed Bin Zayed Species Conservation Fund, the Ravi Sankaran Inlaks Small Grants Program and Nature ConservationFoundation (Oceans and Coasts program). TA was partially funded by the project CTM2010-22273-C02 (Plan Nacional I+D+I, Spain). The funders had no role instudy design, data collection and analysis, decision to publish, or preparation of the manuscript.
Competing Interests: The authors have declared that no competing interests exist.
* E-mail: [email protected]
Introduction
Many species of marine mammals have undergone major
declines in the world’s oceans in the recent past due to threats
ranging from habitat loss, interactions with fisheries and hunting,
their numbers now restricted to small populations across their
range [1], [2]. The effective management of these remnant
populations requires an understanding of factors underlying long-
term changes leading to their present distribution. For these
typically long-lived, wide-ranging and elusive species [2], obtaining
reliable population estimates across large spatiotemporal scales can
be a considerable challenge [3], [4].
Recent advances in occupancy-based modeling provide a
probabilistic description of species’ distribution across large spatial
scales as well as a useful framework to identify factors influencing
distributional changes in marine species over time [3], [5], [6], [7].
Long-term studies can help identify sites where rare and
threatened marine species have persisted or become extinct, and
can be useful for prioritizing conservation strategies [8]. But only a
few studies, predominantly on terrestrial species, have attempted
to describe long-term occupancy dynamics with robust, quantita-
tive methods [9], [10].
In the case of rare marine mammals, these estimates can be
difficult to obtain at large scales, as they are almost always, subject
to sampling error, related to spatial coverage and false negatives
(i.e. imperfect detection) [11–13]. Another common problem with
rare and threatened marine mammals is the poor availability of
data on their past occurrence, making conservationists rely largely
on anecdotal or fragmentary information that is viewed as ‘‘less
than robust’’.
Historical records remain among the few sources of information
on most rare species [14]. These data are often too fragmentary to
coherently assess and identify trends and timing of population
decline [14], [15]. In the absence of ‘better’ data, however, it is
vital to explore these sources of information to develop current
conservation strategies for endangered marine mammals, as they
may conceal important clues about past declines [16]. Advances in
analysis techniques, including occupancy models, allow us to make
the best use of such data and given biological assumptions, to infer
trends in the distributional status of species [10].
Apart from issues of data quality, effective sampling strategies
can also be difficult to devise. Oceanographic patterns, topogra-
phy, depth and nutrient flows make marine environments highly
dynamic [17], adding to difficulties in conducting distribution
PLOS ONE | www.plosone.org 1 October 2013 | Volume 8 | Issue 10 | e76181
surveys with the assumption of habitat stability during survey
periods [6]. These problems are aggravated by logistical and
technical constraints in covering large areas, which often limit
sampling coverage, particularly in developing countries where
these species occur [18]. These challenges result in limited
knowledge of occupancy dynamics of threatened marine mammals
across their range [19].
The dugong (Dugong dugon), classified as Vulnerable (IUCN,
2012), is a case in point, having shown considerable reductions
across many seascapes of the Indo-Pacific region [20]. Yet, data on
population status and distribution are still scarce from many
regions, although they represent an important part of the current
global distribution. As a result, our understanding of the ecology
and distribution of dugongs is informed largely from well-studied
regions like Australia, where their densities are typically higher
than most other regions in the animal’s present range [21]. In
South Asia, dugong numbers have shown declines and are
currently restricted to small, localized populations, the status of
which is poorly known [22], [23]. In India, the population
occurring in the Andaman and Nicobar (A&N) archipelago might
form an important connecting link between Southeast Asian
(Indochinese) dugong populations (e.g. Thailand and Myanmar
[23–25]). Despite the global importance of this population,
information from the region is scarce and no comprehensive
surveys of dugong distribution have been carried out. Most
historical records of dugong occurrence from this archipelago are
based on opportunistic sightings and mortality reports [26]. These
records indicate that dugongs were apparently common here until
the 1960s. Das and Dey [27] estimated approximately 40 dugongs
in 1994-95, based on a compilation of chance encounters reported
by fishers and dive operators, but this number was based on fairly
limited survey effort and coverage.
The sparseness of information from this population has been
mainly due to the considerable difficulties in surveying the
archipelago. Apart from their remoteness, most A&N islands are
uninhabited or difficult to access, being protected as indigenous
tribal areas by the Andaman & Nicobar Islands Protection of
Aboriginal Tribes Regulation [28]. Additionally, ship or aerial
surveys are not feasible given the low visibility and the high costs of
carrying out large-scale surveys. Under these conditions, land- and
boat-based sampling [29] offers logistically easier and cheaper
alternatives. Even in the absence of direct sightings, dugongs,
being considerably dependent on seagrass meadows for their
forage requirements, leave unmistakable feeding trails that last for
several days [30], allowing us to reliably determine recent meadow
usage. These surveys, if conducted in a systematic spatial sampling
framework, yield data that can be analyzed effectively with
occupancy models. In addition, these models can prove helpful in
estimating past distribution dynamics, by addressing issues of
imperfect detection inherent to available historical records.
In this paper we use historical records and systematic
archipelago-wide surveys in two separate model sets, to describe
1) long-term trends in dugong distribution and 2) identify factors
potentially affecting current dugong occupancy within the A&N
archipelago. We analyzed past records from multiple seagrass
meadows (over 45 years) with Bayesian hierarchical, dynamic
occupancy models based on a detection and non-detection
framework. To assess short-term (current) occupancy dynamics
we conducted comprehensive surveys of dugong presence/absence
in seagrass meadows over three consecutive years. Based on our
results, we discuss applications of occupancy-based approaches to
assess long-term distribution dynamics of small populations of
threatened marine mammals. Finally, we demonstrate how these
estimates can help in developing and prioritizing site-specific
conservation strategies for dugongs in the A&N archipelago.
Materials and Methods
Ethics statementThe dugong is listed under Schedule I of the Indian Wildlife
(Protection) Act, 1972 and hence we obtained all necessary permits
from the Chief Wildlife Warden, Department of Environment and
Forests, Port Blair, India to study the species and its habitats. As
our research did not involve handling or collection of animals,
specific animal handling permits were not sought and ethical
clearance for did not apply. Part of the study was carried out in
and around protected areas, national parks, sanctuaries and tribal
reserves. For this purpose, entry permits were obtained from the
Department of Environment and Forests and the Andaman and
Nicobar Islands Administration.
Our work with human communities adhered to all standard
scientific ethical norms and we received due clearance from
Nature Conservation Foundation’s human ethics committee for
this work. The informants in our study included members of tribal
and settler communities. Apart from settlers, only members of the
Nicobarese tribal community were part of our informant network
due to restrictions on entry and interactions with other indigenous
communities. Levels of literacy are very low in these communities
and because written permissions were therefore not possible, our
studies were conducted after verbal consent and informal
permissions were obtained from local Nicobarese Tribal Council
Heads. The measure for documenting the process of verbal
consent was to have the consent before witnesses from the
community appointed by the council head that would also
accompany us during the interviews. The ethics committee of
the Nature Conservation Foundation independently contacted
these enlisted witnesses regarding their witnessing of verbal
consent, and after such confirmation approved the process.
Further, we obtained hunting records from the Nicobarese only
from voluntary reporting of dugong sightings by community
members themselves. All these interactions were conducted in a
manner respectful of local cultural norms and traditions and in the
presence of a village head.
Due to legal issues and sensitivity in discussing issues pertaining
to hunting, individuals belonging to settler communities were not
asked to report records of illegally hunted animals; this informa-
tion was obtained only from records maintained with the
Department of Environment and Forests. The ethics committee
of the Nature Conservation Foundation (Mysore, India) also
approved of these methods.
Study areaThe Andaman and Nicobar archipelago of India, is part of the
Indo-Myanmar and Sundaland biodiversity hotspots [31], [32]
between latitudes 6o45’ N and 13o41’ N and longitudes 92o12’ E
and 93o57’ E in the southeastern part of the Bay of Bengal. This
archipelago comprises more than 350 islands, occupying an area
of 8,249 km2 with a total coastline of 1,962 km that includes the
Andaman group (.325 islands, 24 inhabited, 6,408 km2) and the
Nicobar group (21 islands, 13 inhabited, 1,841 km2 [33]). This
region is significantly influenced by the southwestern and
northeastern monsoons (May-December). The islands have highly
diverse terrestrial and marine ecosystems, comprising evergreen
and littoral mangrove forests, extensive seagrass meadows, fringing
coral reefs and active volcanic islands. The islands have historically
been occupied by indigenous tribes of negroid (Onge, Jarawa,
Great Andamanese, Sentinelese) and mongoloid (Nicobarese,
Long-Term Occupancy Dynamics of Threatened Dugongs
PLOS ONE | www.plosone.org 2 October 2013 | Volume 8 | Issue 10 | e76181
Shompen) origins [33]. These native tribes constitute only about
9% of the present population, which is dominated by recent (c.80–
100 years) immigrant settlers from mainland India, Bangladesh,
Sri Lanka and Myanmar. Agriculture, livestock rearing, fisheries
and plantation forestry are the main occupations in the islands,
and the indigenous tribes still significantly depend on minor forest
produce and hunting, including ritual hunting of dugongs [34].
Data collectionHistorical records of dugongs. A comprehensive database
of historical records of dugongs (n = 55 records of 124 individual
dugongs) was collated spanning the last 50 years (1959–2009) from
40 seagrass meadow locations across the A&N archipelago
(Appendix S1). Newspaper reports, occasional publications,
fisheries by-catch records, reports by local forest departments,
and interviews with key informants and wildlife experts were used
to compile these records to represent these occurrences. The
records included sightings of dead (entangled in gillnets or hunted)
and live animals. As such, we expected considerable bias in naıve
occupancy estimates, evidently associated with false negatives or
imperfect detection (detection probability of less than 1) that
historical ‘presence-only’ data are typically subject to [14], [16].
To allow for detection probabilities of dugongs to be estimated
meaningfully (with relatively uniform coverage) across islands, we
grouped the historical data into 3 primary periods of 15 years each
(45 years, 1959–2004), further sub-dividing each primary period
into three replicate periods of 5 years each. We did not use data on
dugong records from 2005–2009 for historical records, as most of
it came from our focused surveys at a few sites, and could have
biased detection relative to other sites not surveyed in this period.
We covered all sites uniformly in the current (short-term) dynamic
occupancy surveys (2010–2012). This assumption was based on
the possibility that at least one dugong sighting was likely to be
reported from one location within a 5-year period. Given the
general rarity of dugong sightings, maintaining a shorter replicate
period could have led to biased assignment of probable detection
as a ‘false absence’, thus leading to increased estimation of false-
negatives (or Type II errors) [35], [36]. On the other hand, a
longer replicate period could have led to unnecessary loss of
‘detected’ data. Based on these assumptions, we constructed a
detection-non-detection matrix based on sighting records [36] for
40 meadow locations over 3 primary periods. We also assumed
that dugong occupancy, persistence and extinction probabilities
would not change across replicates but only across primary periods
(15 years), based on calving intervals [37], [38]; movement
patterns and home ranges (as estimated in tagging studies in
Indonesia [39]) and our personal direct observations of three
individually identified dugongs over two, four and seven years
respectively. For these models, we assumed survey coverage across
sites to be similar given the duration of the replicate periods.
Although these assumptions appear ad hoc and still have some
limitations with respect to spatial coverage, our recent field
observations (regularly obtained between 2005 and 2012) suggest-
ed that they provide a reasonable idea of occupancy and detection
across sites [16], [37]. The details of the assumptions and their
bearing on our long-term occupancy models are given in Table 1.
For each meadow we also obtained information on wave exposure
and depth from bathymetry maps [40] and ground measurements.
Live and dead dugong sighting records within replicate periods
could not be correlated with anthropogenic threats, as threat data
could not be reliably obtained for all locations over 45 years.
Meadow persistence and current dugong occupancy.Information on trends in dugong occupancy from long-term
occupancy models was used as prior information in the current,
short-term occupancy models (based on data between 2010-2012).
Current occupancy was assumed to be weakly dependent on long-
term occupancy, as it would provide a clear way of identifying
meadow sites that have had long-term dugong persistence or
recent extinction/colonization. A correspondence or increase
between past and current occupancy would imply persistence or
colonization, whereas a decrease would indicate local extinction.
Second, we estimated relative seagrass meadow persistence for
sites where past information was available over a 15-year period,
comparing an earlier seagrass status report [41] with our surveys.
We tracked 26 out of the total 57 surveyed seagrass meadows over
a seven-year period (2005–2012) and used data on seagrass cover
and community composition to categorize the meadow dynamics
at each location as follows: (1 = Lost, 2 = Recently established,
3 = Dynamic changing, 4 = Stable/Persistent). We collected pri-
mary detection and non-detection data on dugongs from 57
meadows after a comprehensive survey across c. 75% shoreline
area of the A&N archipelago between 2010–2012. These data
were collected using two methods: i) boat-based surveys (for direct
sightings) and SCUBA diving and snorkeling (for feeding signs of
dugongs in meadows), and ii) sightings by reliable key informants
compiled in parallel along with the time of our surveys. At each
site where meadows were present, two observers scanned the
surface for direct sighting of dugongs using boat transects parallel
to the shoreline contours throughout the seagrass meadow and
surrounding area (based on [29]). In situ, by snorkeling and
SCUBA diving, we surveyed each meadow for dugong feeding
signs along four 50 m transects distributed randomly in the
meadow, covering 70–80% of the meadows for optimal coverage,
adequate spacing of transects and overall efficient sampling.
During our seagrass surveys we also checked for leaf-cropping
signs (by dugongs or green turtles) on other species (Thalassia
hemprichii, Cymodocea rotundata, Cymodocea serrulata, Enhalus acoroides)
since it has been suggested that dugongs may also crop these
species without leaving feeding trails [42]. However cropping of
seagrasses was not observed on these species throughout our study,
making us reasonably certain that feeding trails provided an
unbiased measure of the overall extent of dugong presence at each
site. Seagrass meadows surveyed had mostly sandy substrates
(92%); hence the influence of sediment type on detection of
feeding signs was negligible. Since we employed SCUBA and
snorkeling in every seagrass meadow surveyed there was no effect
of water depth on detection of feeding signs. Meadow-level
occupancy data were pooled from these replicate transects within
each sampling location. To avoid misidentification of feeding
signs, we familiarized ourselves with characteristics of typical
feeding trails (c.20 cm wide) by following feeding dugongs and
examining the signs they left behind. In the same survey period we
interviewed key informants who were familiar with and regularly
visited each location (across 57 meadows); we compiled detection
and non-detection data from their observations during the year.
Replicate detections from our direct observations/feeding signs
and from informant reports were recorded as ‘1’ and non-
detection as ‘0’, to form a 1/0 matrix for each location over 3
years.
In each year, surveys were conducted for a fixed period of three
months (Feb-May) corresponding with the observed period of
highest seagrass biomass (personal observations), [43], [44] that
allowed us to assume occupancy state to be closed within each
year, but to change from year to year. The size of individual
sampling units (locations including seagrass meadows, with
seagrass cover larger than 100 m2 and the surrounding landscape
(4–8 km2)) was determined based on published studies on dugong
home ranges, residence time and foraging time [44], [45]. Studies
Long-Term Occupancy Dynamics of Threatened Dugongs
PLOS ONE | www.plosone.org 3 October 2013 | Volume 8 | Issue 10 | e76181
have found that dugong movements are highly individualistic, and
it may thus be difficult to estimate home ranges [46]. However, a
clear operational definition of such a ‘home-range’ was necessary
to delineate sampling units. Dugongs showed high site-fidelity and
occurred within localized areas throughout the sampling period,
and showed ranging behavior similar to the range sizes reported
by de Iongh et al. (1998) [39]. Within each year, we assumed
feeding dugongs to have stayed in the same sampling units through
the short survey periods, a pattern confirmed by our long-term
observations on 3 dugongs. We preferred to use estimates of
movement reported by de Iongh et al. (1998) over the detailed
study by Sheppard et al. (2007) [46], despite the former’s low
sample size, as they reported similar herd sizes and habitat extents
to our study area, perhaps due to the geographical proximity. On
the other hand, Sheppard et al. (2007) reported considerably large
herd-sizes, extensive habitats, large movement ranges and
traveling distances, which differed from our dugong observations.
Sampling units were nested under larger ‘island-groups’ within a
range of 500–800 km2 along the 50 m bathymetry contour (Fig.
1).
We also measured meadow characteristics including depth,
wave exposure, seagrass species composition, shoot density, and
patchiness. Depth and wave exposure were determined using
bathymetric data [40] and our ground surveys. We recorded
seagrass species composition within each meadow using three
quadrats of 20620 cm2. Meadow composition was classified as
1 = Halophila sp. (Halophila ovalis and Halophila minor) dominated
(95% abundance) or Halodule sp. dominated (95% abundance),
2 = Halophila sp. + Halodule sp. co-dominants (either species ,95%
abundance), 3 = Halophila sp. and/or Halodule sp. plus other species
(out of Thalassia hemprichii, Cymodocea rotundata, Cymodocea serrulata,
Enhalus acoroides, Syringodium isoetifolium); and 4 = mixed meadows
without Halophila and Halodule spp. [41], [47]. We assessed
meadow patchiness while looking for dugong feeding signs along
50 m strip transects, along which we recorded transitions in
benthic cover (seagrass to sand/others) at a minimum inter-
val. = 20 cm. We estimated percent seagrass cover and classified
meadows with patchy (,50%) seagrass cover as fragmented, and
meadows with over 50% cover as continuous. Shoot densities were
estimated and tracked across 14 out of the 57 meadows.
We recorded anthropogenic disturbance with direct observa-
tions at 38 out of the total sampled meadows (57). This included 1)
gillnet fishing (1 = presence of at least one gillnet in the area during
the sampling period and 0 = absence of gillnets on all sampling
days), 2) hunting (present/absent) based on records of legal (by
tribes) or illegal hunting (by settlers) and 3) level of boat traffic
observed on each sampling day (low = 0–1 boats/day, moder-
ate = 2–5 boats/day and high = 5+ boats/day) averaged across all
sampling days and years (minimum of 5 days per site).
Data analysisTwo separate sets of dynamic occupancy models were applied
to detection and non–detection data from 1) long-term (historical)
records, and 2) short-term or current surveys respectively, based
on standard methods developed by MacKenzie et al. (2006) (2002)
[7], [37], MacKenzie and Royle (2005) [35], Royle and Kery
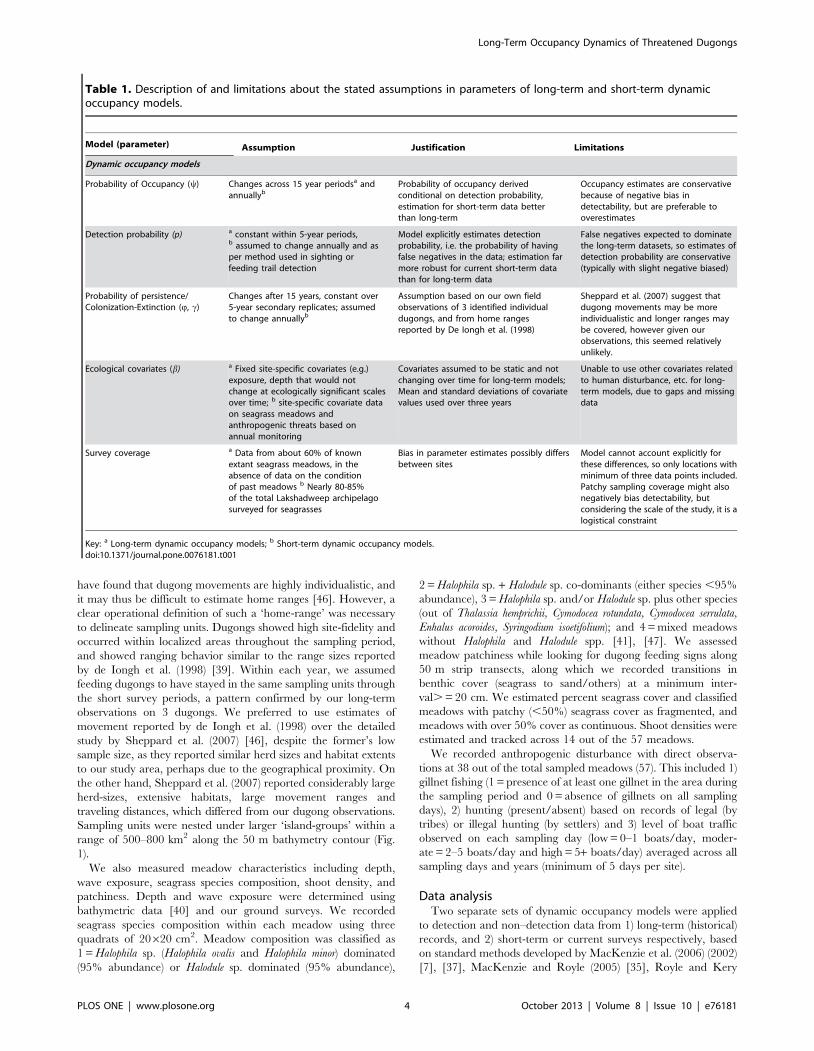
Table 1. Description of and limitations about the stated assumptions in parameters of long-term and short-term dynamicoccupancy models.
Model (parameter) Assumption Justification Limitations
Dynamic occupancy models
Probability of Occupancy (y) Changes across 15 year periodsa andannuallyb
Probability of occupancy derivedconditional on detection probability,estimation for short-term data betterthan long-term
Occupancy estimates are conservativebecause of negative bias indetectability, but are preferable tooverestimates
Detection probability (p) a constant within 5-year periods,b assumed to change annually and asper method used in sighting orfeeding trail detection
Model explicitly estimates detectionprobability, i.e. the probability of havingfalse negatives in the data; estimation farmore robust for current short-term datathan for long-term data
False negatives expected to dominatethe long-term datasets, so estimates ofdetection probability are conservative(typically with slight negative biased)
Probability of persistence/Colonization-Extinction (Q, c)
Changes after 15 years, constant over5-year secondary replicates; assumedto change annuallyb
Assumption based on our own fieldobservations of 3 identified individualdugongs, and from home rangesreported by De Iongh et al. (1998)
Sheppard et al. (2007) suggest thatdugong movements may be moreindividualistic and longer ranges maybe covered, however given ourobservations, this seemed relativelyunlikely.
Ecological covariates (b) a Fixed site-specific covariates (e.g.)exposure, depth that would notchange at ecologically significant scalesover time; b site-specific covariate dataon seagrass meadows andanthropogenic threats based onannual monitoring
Covariates assumed to be static and notchanging over time for long-term models;Mean and standard deviations of covariatevalues used over three years
Unable to use other covariates relatedto human disturbance, etc. for long-term models, due to gaps and missingdata
Survey coverage a Data from about 60% of knownextant seagrass meadows, in theabsence of data on the conditionof past meadows b Nearly 80-85%of the total Lakshadweep archipelagosurveyed for seagrasses
Bias in parameter estimates possibly differsbetween sites
Model cannot account explicitly forthese differences, so only locations withminimum of three data points included.Patchy sampling coverage might alsonegatively bias detectability, butconsidering the scale of the study, it is alogistical constraint
Key: a Long-term dynamic occupancy models; b Short-term dynamic occupancy models.doi:10.1371/journal.pone.0076181.t001
Long-Term Occupancy Dynamics of Threatened Dugongs
PLOS ONE | www.plosone.org 4 October 2013 | Volume 8 | Issue 10 | e76181
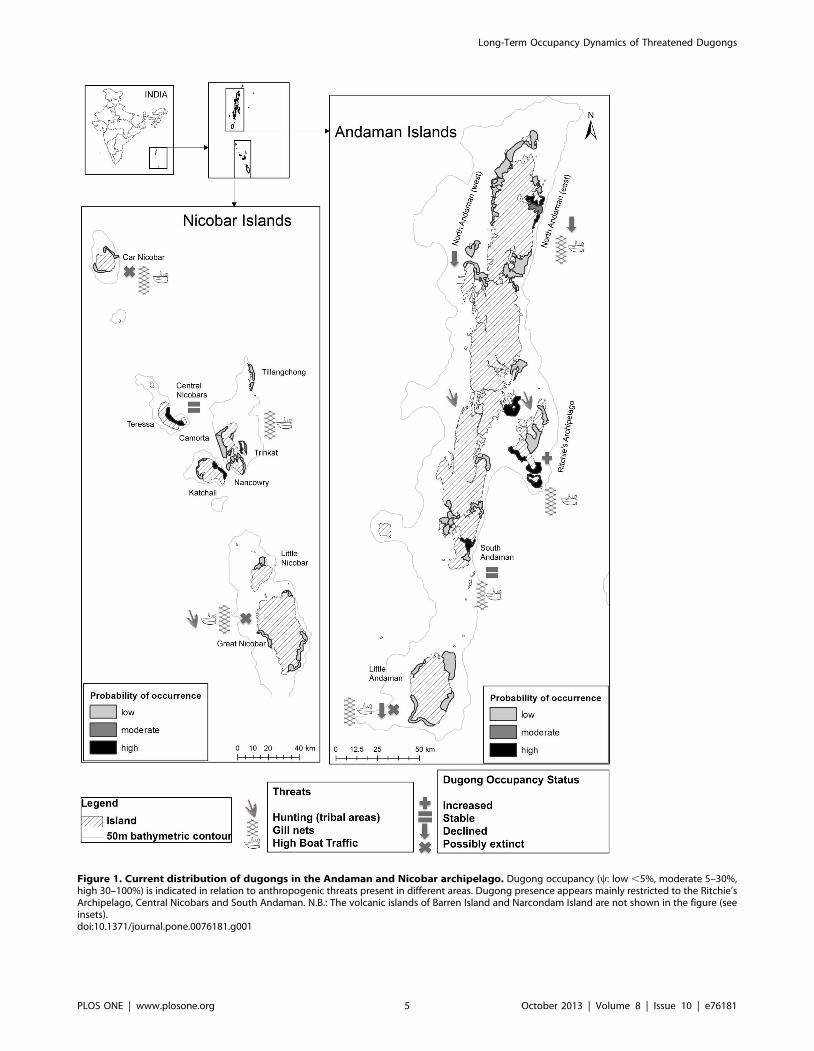
Figure 1. Current distribution of dugongs in the Andaman and Nicobar archipelago. Dugong occupancy (y: low ,5%, moderate 5–30%,high 30–100%) is indicated in relation to anthropogenic threats present in different areas. Dugong presence appears mainly restricted to the Ritchie’sArchipelago, Central Nicobars and South Andaman. N.B.: The volcanic islands of Barren Island and Narcondam Island are not shown in the figure (seeinsets).doi:10.1371/journal.pone.0076181.g001
Long-Term Occupancy Dynamics of Threatened Dugongs
PLOS ONE | www.plosone.org 5 October 2013 | Volume 8 | Issue 10 | e76181
(2007) [48], Bailey et al. (2007) [49] and Royle and Dorazio (2008)
[50]. Short-term occupancy models were further modified to
incorporate false-positive detection errors [36], [51], multiple
detection methods [52] and spatial random effects [53] between
adjacent meadows included within a larger ‘island-group’.
We estimated false-positive detection errors to account for
possible misidentification of dugongs by informants. However, all
informants gave highly accurate descriptions of their encounters,
and we expected false-positive errors to be fairly low. We modeled
long-term occupancy dynamics using the covariates ‘exposure’ and
‘depth’ at each meadow. For modeling current occupancy
dynamics, ‘meadow persistence’, ‘depth’, ‘wave exposure’, and
‘seagrass species composition’ were the ecological covariates used.
Due to missing data on seagrass shoot density, meadow cover and
anthropogenic threats (data available from 20, 26 and 38 meadows
respectively), we did not directly model effects of these covariates
on occupancy. Post-hoc, we compared numbers of live and dead
dugong sighting records across meadows where occupancy had
declined over time, versus meadows where occupancy was
estimated as stable. We also compared present-day occupancy
rates at meadows from where data on anthropogenic threats were
available (n = 38).
Bayesian hierarchical modeling helped us describe complex
dynamic occupancy models using information from multiple
sources. Estimates from historical models were used for construct-
ing appropriate prior distributions of current occupancy, thereby
linking historical occupancy with present occurrences. Detection
and non-detection (1/0) data were updated using the Bayes
theorem p(h|data) / p(data|h).p(h) where h represented the set of
model parameters (e.g. occupancy, persistence, detection), and
‘posterior’ probabilities for these parameters conditional on the
actual data were estimated. Hierarchical modeling of occupancy
data was based on parameter estimation at two levels: 1) the actual
process of dugong occupancy and 2) the imperfect detection of this
process [50]. We modeled occupancy y as a function of habitat
and spatial random effects, specifying the model as a binomial
GLM logit(yi),-b0+b1*habitat covariate [i]+spatial effects where the
actual ‘presence or absence at a meadow i at time t’ is treated as a
Bernoulli random variable Zit , Bernoulli(yi). The imperfect
detection of Z was modeled as mu [i,j,t],-Z [i,1]*Pr [i,j,t]; where Pr
was the detection probability for meadow i, observation j and time
t, and Y the observed fraction of sites, as Yijt , Bernoulli(mu [i,w,t]).
The probabilities of occupancy yi and detection Pr [i,j,t], as well
as persistence/colonization were generally described with a
Uniform (0,1) prior distribution. Based on the quality and quantity
of information available on historical occupancy at a meadow, we
specified appropriate prior distributions, by scaling their variance
terms as high (for anecdotal records) and relatively low (very
believable records or photographs). Other than this specification,
we mostly used uninformative prior distributions for intercept and
slope parameters of the models, with a normal distribution
centered on zero mean and high variance: Normal (0, 1000). For
expected positive and negative slopes, we used lognormal and
normal distributions with positive or negative means; but with high
variance. We conducted all analyses in R 2.15.0 and OpenBUGS
2.2.0 [54], [55]. Details of Bayesian model specification are given
in Appendix S2.
Results
Long-term occupancy dynamicsDugong occupancy was higher at meadows around clusters of
islands (e.g. Ritchie’s Archipelago, south Andaman, central
Nicobar; mean y = 0.30 (SD 0.14)) than at meadows at relatively
distant islands (Little Andaman, Car Nicobar; mean y = 0.02 (SD
0.0005), Figure 1, Figure 2). Overall occupancy (mean y = 0.28,
range 0.17–0.45) over primary (15-year) periods was positively
influenced by meadow sheltering but not by the depth of seagrass
beds (Table 2). Detectability (mean p = 0.24) ranged between 14–
30%. Colonization probabilities ranged between 20–43% across
meadows. Persistence probabilities declined considerably through
time (c. 55%; Table 1). Dugong occupancy across the archipelago
also showed significant reduction (by 60%; from 0.45 to 0.18),
especially from 1991 onwards (Table 2, Table 3). Long-term
declines in dugong occupancy were correlated with the recorded
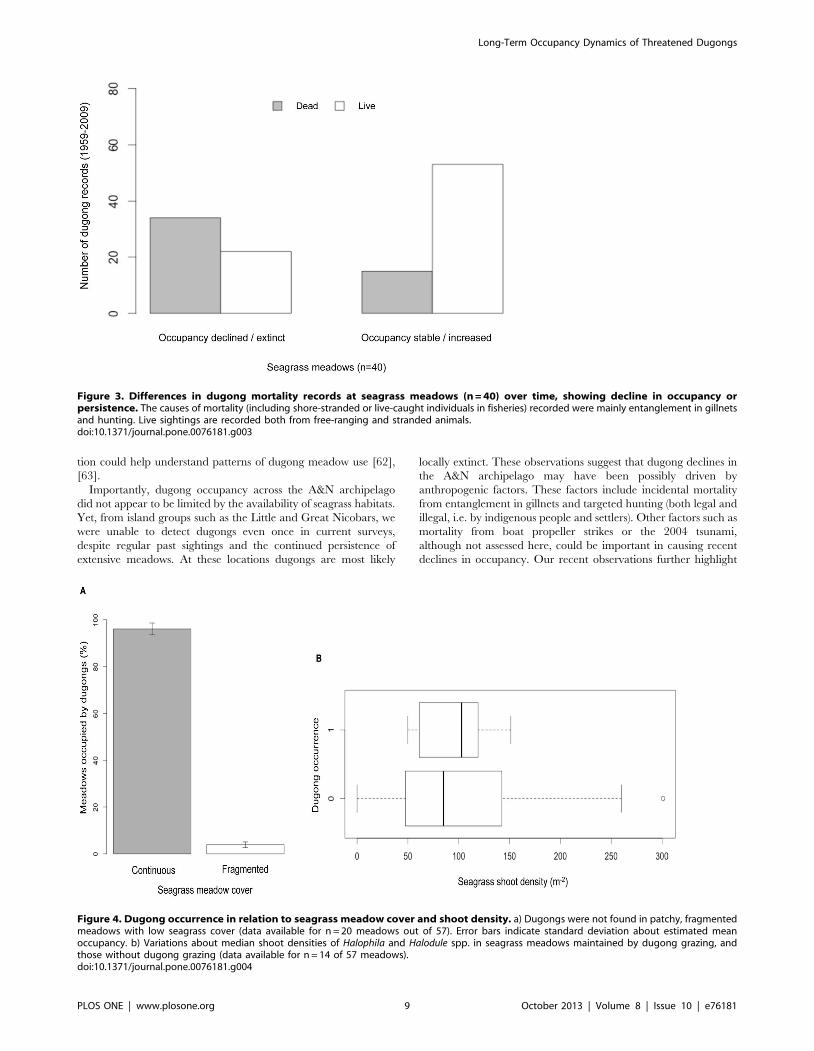
magnitude of mortality. Sites where dugongs were estimated
absent had more past records of gillnet catches and legal hunting
by indigenous tribes, as compared to live-sightings (Figure 3).
Illegal hunting by settlers might also have probably contributed to
declines, but these cases were seldom documented in past reports.
Owing to such unavoidable gaps in the data, the proportion of
decline in occupancy is at best a conservative estimate.
Short-term dynamicsIndividual dugong encounter-rates, based on direct sightings
were low (seven individuals seen in six meadows over three years),
and locations where dugongs persist might only have a few
individuals. Sightings of calves are also rather uncommon (two
calves in the last three years). Detections mostly corresponded to
dugong feeding trails observed in seagrass meadows and a few
additional direct sightings by key informants. Long-term mean
occupancy probability was not related to current occupancy at a
location, suggesting that occupancy at a meadow might be
influenced more by recent factors. Dugong occupancy (y) across
the entire archipelago declined from 0.18 in 2010 (first year of
sampling) to 0.09 in the next two years. Detection probabilities
were similar between feeding trail surveys (mean p = 0.57, 0.41–
0.65) and direct sightings/informant reports (mean p = 0.53, 0.33–
0.77) (Table 2). These were nearly 2.5 times higher than estimated
p for historical occurrence records. Persistence probabilities were
60% (SD = 27%) between years, and annual colonization rates
were low (3–5%) indicating persistence of dugongs at the same
meadows in the short-term (Table 3). Current dugong occupancy
was positively influenced by the presence of sheltered meadows
dominated by Halophila sp. and Halodule pinifolia, suggesting
persistence at least between 1995 and 2010 (Table 3). Occupancy
appears to have been stable in three regions: Ritchie’s Archipel-
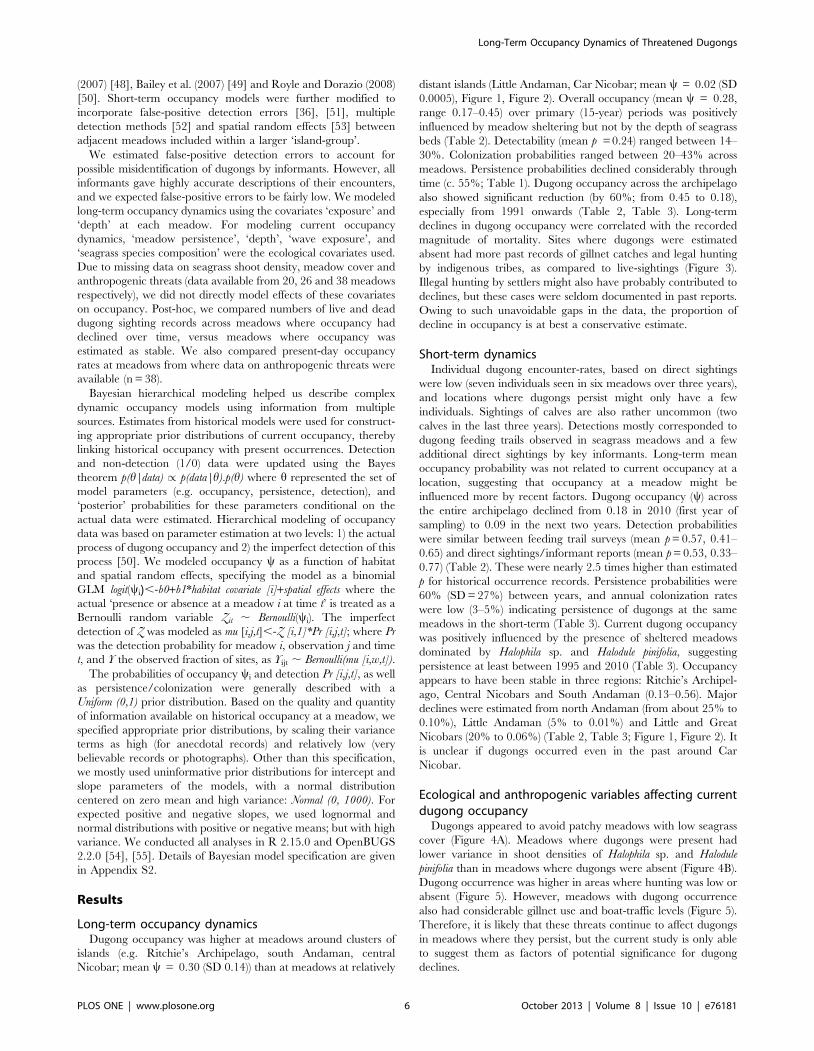
ago, Central Nicobars and South Andaman (0.13–0.56). Major
declines were estimated from north Andaman (from about 25% to
0.10%), Little Andaman (5% to 0.01%) and Little and Great
Nicobars (20% to 0.06%) (Table 2, Table 3; Figure 1, Figure 2). It
is unclear if dugongs occurred even in the past around Car
Nicobar.
Ecological and anthropogenic variables affecting currentdugong occupancy
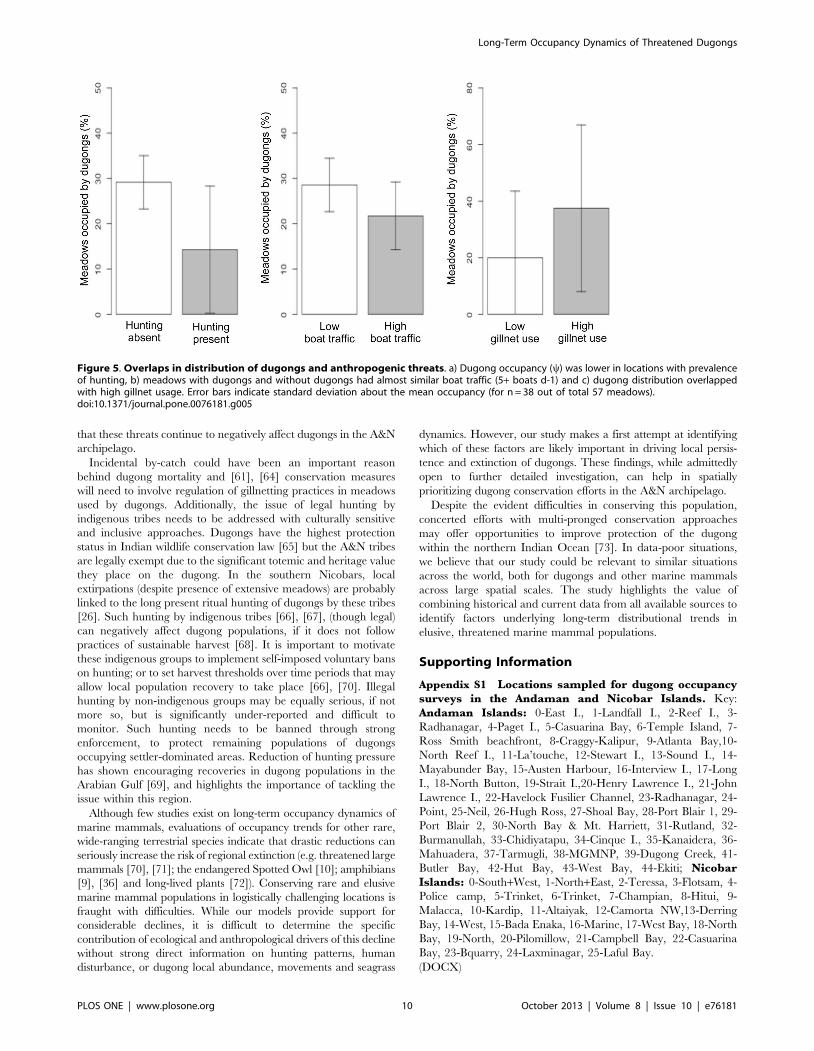
Dugongs appeared to avoid patchy meadows with low seagrass
cover (Figure 4A). Meadows where dugongs were present had
lower variance in shoot densities of Halophila sp. and Halodule
pinifolia than in meadows where dugongs were absent (Figure 4B).
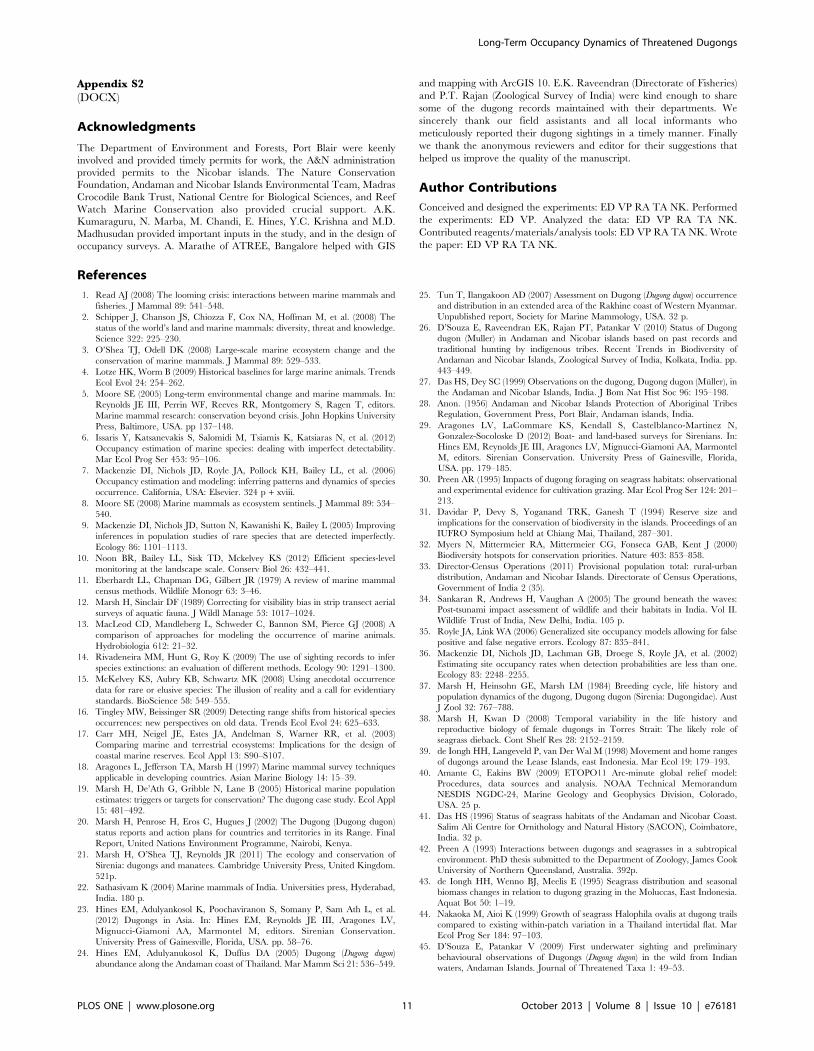
Dugong occurrence was higher in areas where hunting was low or
absent (Figure 5). However, meadows with dugong occurrence
also had considerable gillnet use and boat-traffic levels (Figure 5).
Therefore, it is likely that these threats continue to affect dugongs
in meadows where they persist, but the current study is only able
to suggest them as factors of potential significance for dugong
declines.
Long-Term Occupancy Dynamics of Threatened Dugongs
PLOS ONE | www.plosone.org 6 October 2013 | Volume 8 | Issue 10 | e76181
Discussion
Our results indicate that dugongs in the Andaman and Nicobar
archipelago have declined significantly (about 60%) in their
occupancy over the last two decades. It is uncertain if dugong
populations can sustain such declines in spatial distribution. This
trend of decline is similar to cases of dugong declines in many
seascapes in south and southeastern Asia [20], [23], [56]. The
occupancy framework we employed provides a conservative yet
useful approach to assess long-term distributional dynamics from
‘imperfect’ and fragmentary long-term occurrence records that
include false negatives. This approach can also be effectively used
to identify factors influencing current patterns of persistence and
local extinction.
We use the Bayesian approach to make best use of the typically
fragmentary data available for rare, vulnerable species like the
dugong, with minimal data available. Given the patchiness of data
Figure 2. Changes in dugong occupancy (y) across the Andaman and Nicobar archipelago over 50 years (1959–2009). Dugongoccupancy (y) appears to have been stable in three regions: Ritchie’s Archipelago, Central Nicobars and South Andaman (0.13–0.56). Major historicaldeclines were estimated from north Andaman (from 25% to 0.10%), Little Andaman (5% to 0.01%) and Little and Great Nicobars (20% to 0.06%). It isunclear if dugongs occurred, even in the past, around the Car Nicobar Island. Error bars indicate standard deviation.doi:10.1371/journal.pone.0076181.g002
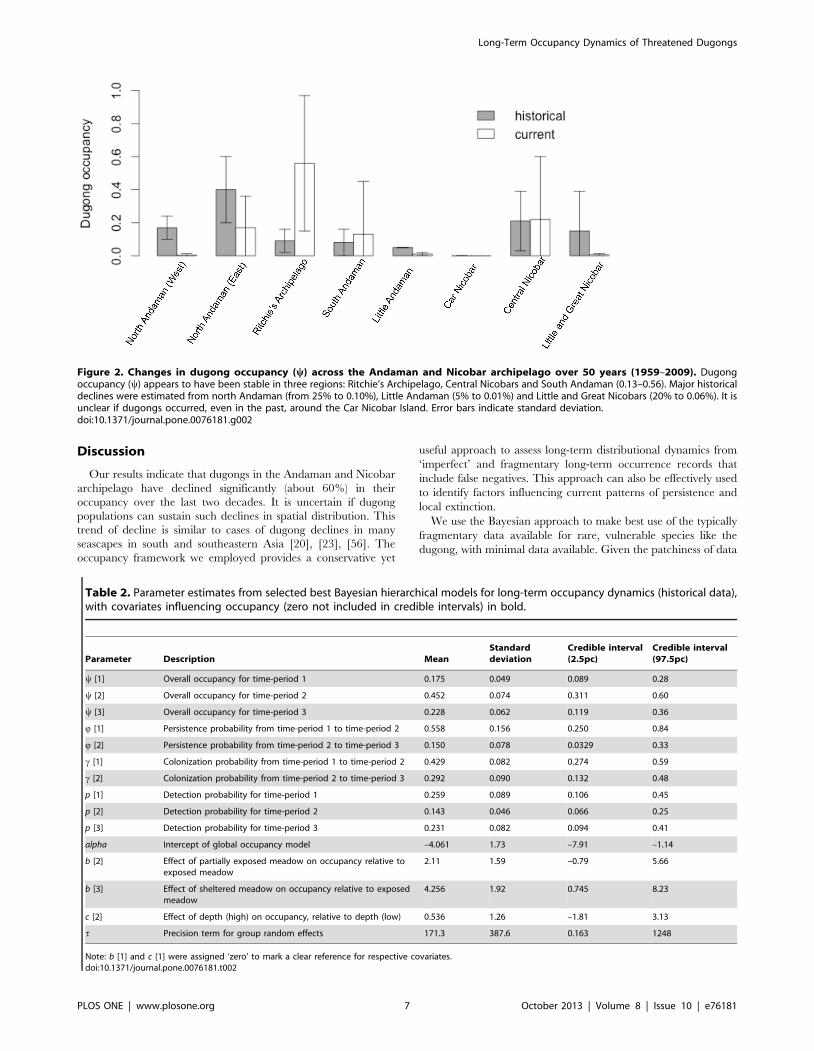
Table 2. Parameter estimates from selected best Bayesian hierarchical models for long-term occupancy dynamics (historical data),with covariates influencing occupancy (zero not included in credible intervals) in bold.
Parameter Description MeanStandarddeviation
Credible interval(2.5pc)
Credible interval(97.5pc)
y [1] Overall occupancy for time-period 1 0.175 0.049 0.089 0.28
y [2] Overall occupancy for time-period 2 0.452 0.074 0.311 0.60
y [3] Overall occupancy for time-period 3 0.228 0.062 0.119 0.36
Q [1] Persistence probability from time-period 1 to time-period 2 0.558 0.156 0.250 0.84
Q [2] Persistence probability from time-period 2 to time-period 3 0.150 0.078 0.0329 0.33
c [1] Colonization probability from time-period 1 to time-period 2 0.429 0.082 0.274 0.59
c [2] Colonization probability from time-period 2 to time-period 3 0.292 0.090 0.132 0.48
p [1] Detection probability for time-period 1 0.259 0.089 0.106 0.45
p [2] Detection probability for time-period 2 0.143 0.046 0.066 0.25
p [3] Detection probability for time-period 3 0.231 0.082 0.094 0.41
alpha Intercept of global occupancy model –4.061 1.73 –7.91 –1.14
b [2] Effect of partially exposed meadow on occupancy relative toexposed meadow
2.11 1.59 –0.79 5.66
b [3] Effect of sheltered meadow on occupancy relative to exposedmeadow
4.256 1.92 0.745 8.23
c [2] Effect of depth (high) on occupancy, relative to depth (low) 0.536 1.26 –1.81 3.13
t Precision term for group random effects 171.3 387.6 0.163 1248
Note: b [1] and c [1] were assigned ‘zero’ to mark a clear reference for respective covariates.doi:10.1371/journal.pone.0076181.t002
Long-Term Occupancy Dynamics of Threatened Dugongs
PLOS ONE | www.plosone.org 7 October 2013 | Volume 8 | Issue 10 | e76181
and evident differences in the robustness of different data sources,
we employed a relatively conservative approach to modeling
population trends, treating such information as ‘weak or sugges-
tive’ in the Bayesian framework. We have taken care to make the
ecological criteria for model assumptions explicit to specify bounds
to the interpretation of these results. Though we appreciate that
there is no substitute for ‘robust’ data with large sample sizes, in
reality data on rare species may be very difficult to obtain, even
with the most detailed surveys and robustly designed methods. In
some such cases the methods presented may be useful to
conservationists and ecologists to quantitatively estimate long-
term trends in species’ distribution using past occurrence records.
Dugong populations are currently restricted to a few areas
where they seem to have persisted over several years. These
locations typically have sheltered and continuous seagrass mead-
ows dominated by short-lived species. Dugongs are known to
incidentally consume invertebrates along with seagrasses, and
sometimes selectively feed on ascidians and polychaetes, possibly
due to nutritional stress caused by seasonality in seagrasses [57].
However, seagrasses still form the dominant diet (about 74%
documented by Preen, 1995) of dugongs and it is unlikely that
other food items alone will enable dugongs to persist despite loss of
seagrasses [58]. Seagrass shoot densities of occupied meadows in
the A&N archipelago were more homogeneous than unoccupied
meadows with similar species composition, indicating that
continued dugong grazing might be maintaining these meadows
with pioneer, fast-growing seagrass species [30], [59], [60].
Dugong declines will lead to reduction in herbivory, which along
with factors such as altered coastal sedimentation levels, could
accelerate seagrass succession towards fibrous species or make
meadow cover patchy. This may in turn make meadows
unavailable to recolonizing dugongs. We did not find dugongs in
patchy meadows with low seagrass cover. Meadow fragmentation
could be linked to sedimentation-related burial caused by seasonal
storms or anthropogenic factors (e.g. increased coastal develop-
ment/land-use practices) [61]. The volcanic origin of the A&N
archipelago [33] makes sedimentation a key process in coastal
waters. Understanding its effects on seagrass cover and composi-
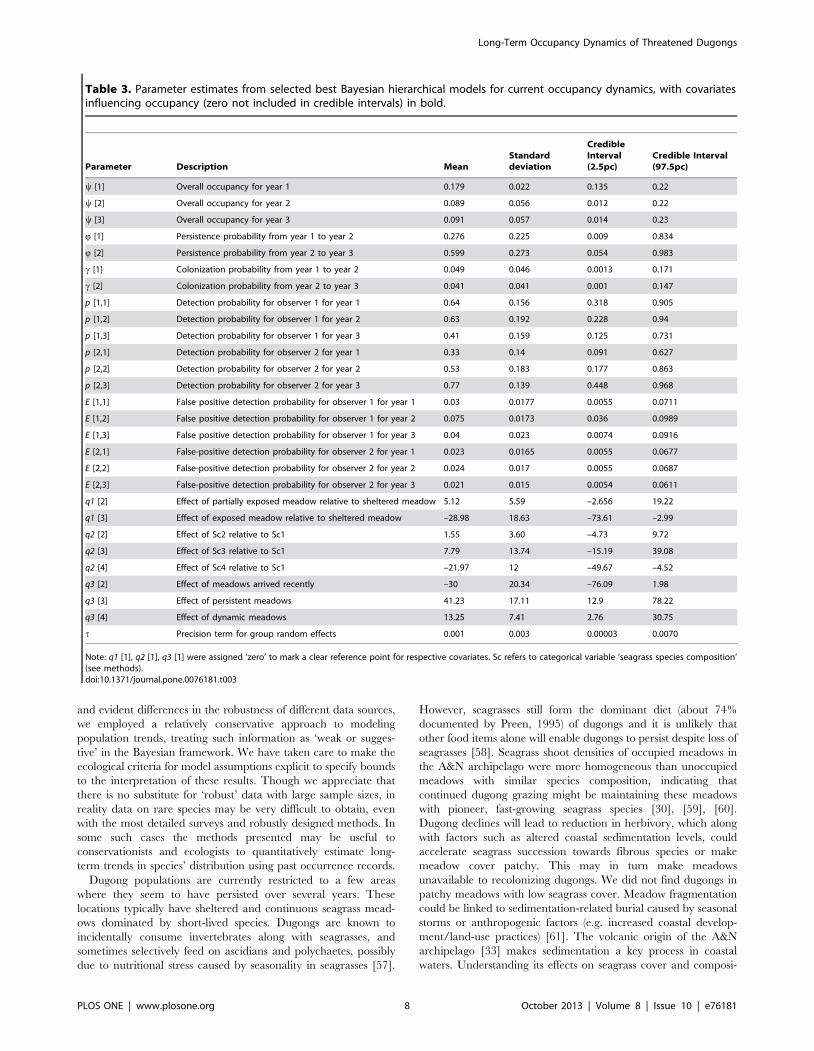
Table 3. Parameter estimates from selected best Bayesian hierarchical models for current occupancy dynamics, with covariatesinfluencing occupancy (zero not included in credible intervals) in bold.
Parameter Description MeanStandarddeviation
CredibleInterval(2.5pc)
Credible Interval(97.5pc)
y [1] Overall occupancy for year 1 0.179 0.022 0.135 0.22
y [2] Overall occupancy for year 2 0.089 0.056 0.012 0.22
y [3] Overall occupancy for year 3 0.091 0.057 0.014 0.23
Q [1] Persistence probability from year 1 to year 2 0.276 0.225 0.009 0.834
Q [2] Persistence probability from year 2 to year 3 0.599 0.273 0.054 0.983
c [1] Colonization probability from year 1 to year 2 0.049 0.046 0.0013 0.171
c [2] Colonization probability from year 2 to year 3 0.041 0.041 0.001 0.147
p [1,1] Detection probability for observer 1 for year 1 0.64 0.156 0.318 0.905
p [1,2] Detection probability for observer 1 for year 2 0.63 0.192 0.228 0.94
p [1,3] Detection probability for observer 1 for year 3 0.41 0.159 0.125 0.731
p [2,1] Detection probability for observer 2 for year 1 0.33 0.14 0.091 0.627
p [2,2] Detection probability for observer 2 for year 2 0.53 0.183 0.177 0.863
p [2,3] Detection probability for observer 2 for year 3 0.77 0.139 0.448 0.968
E [1,1] False positive detection probability for observer 1 for year 1 0.03 0.0177 0.0055 0.0711
E [1,2] False positive detection probability for observer 1 for year 2 0.075 0.0173 0.036 0.0989
E [1,3] False positive detection probability for observer 1 for year 3 0.04 0.023 0.0074 0.0916
E [2,1] False-positive detection probability for observer 2 for year 1 0.023 0.0165 0.0055 0.0677
E [2,2] False-positive detection probability for observer 2 for year 2 0.024 0.017 0.0055 0.0687
E [2,3] False-positive detection probability for observer 2 for year 3 0.021 0.015 0.0054 0.0611
q1 [2] Effect of partially exposed meadow relative to sheltered meadow 5.12 5.59 –2.656 19.22
q1 [3] Effect of exposed meadow relative to sheltered meadow –28.98 18.63 –73.61 –2.99
q2 [2] Effect of Sc2 relative to Sc1 1.55 3.60 –4.73 9.72
q2 [3] Effect of Sc3 relative to Sc1 7.79 13.74 –15.19 39.08
q2 [4] Effect of Sc4 relative to Sc1 –21.97 12 –49.67 –4.52
q3 [2] Effect of meadows arrived recently –30 20.34 –76.09 1.98
q3 [3] Effect of persistent meadows 41.23 17.11 12.9 78.22
q3 [4] Effect of dynamic meadows 13.25 7.41 2.76 30.75
t Precision term for group random effects 0.001 0.003 0.00003 0.0070
Note: q1 [1], q2 [1], q3 [1] were assigned ‘zero’ to mark a clear reference point for respective covariates. Sc refers to categorical variable ‘seagrass species composition’(see methods).doi:10.1371/journal.pone.0076181.t003
Long-Term Occupancy Dynamics of Threatened Dugongs
PLOS ONE | www.plosone.org 8 October 2013 | Volume 8 | Issue 10 | e76181
tion could help understand patterns of dugong meadow use [62],
[63].
Importantly, dugong occupancy across the A&N archipelago
did not appear to be limited by the availability of seagrass habitats.
Yet, from island groups such as the Little and Great Nicobars, we
were unable to detect dugongs even once in current surveys,
despite regular past sightings and the continued persistence of
extensive meadows. At these locations dugongs are most likely
locally extinct. These observations suggest that dugong declines in
the A&N archipelago may have been possibly driven by
anthropogenic factors. These factors include incidental mortality
from entanglement in gillnets and targeted hunting (both legal and
illegal, i.e. by indigenous people and settlers). Other factors such as
mortality from boat propeller strikes or the 2004 tsunami,
although not assessed here, could be important in causing recent
declines in occupancy. Our recent observations further highlight
Figure 3. Differences in dugong mortality records at seagrass meadows (n = 40) over time, showing decline in occupancy orpersistence. The causes of mortality (including shore-stranded or live-caught individuals in fisheries) recorded were mainly entanglement in gillnetsand hunting. Live sightings are recorded both from free-ranging and stranded animals.doi:10.1371/journal.pone.0076181.g003
Figure 4. Dugong occurrence in relation to seagrass meadow cover and shoot density. a) Dugongs were not found in patchy, fragmentedmeadows with low seagrass cover (data available for n = 20 meadows out of 57). Error bars indicate standard deviation about estimated meanoccupancy. b) Variations about median shoot densities of Halophila and Halodule spp. in seagrass meadows maintained by dugong grazing, andthose without dugong grazing (data available for n = 14 of 57 meadows).doi:10.1371/journal.pone.0076181.g004
Long-Term Occupancy Dynamics of Threatened Dugongs
PLOS ONE | www.plosone.org 9 October 2013 | Volume 8 | Issue 10 | e76181
that these threats continue to negatively affect dugongs in the A&N
archipelago.
Incidental by-catch could have been an important reason
behind dugong mortality and [61], [64] conservation measures
will need to involve regulation of gillnetting practices in meadows
used by dugongs. Additionally, the issue of legal hunting by
indigenous tribes needs to be addressed with culturally sensitive
and inclusive approaches. Dugongs have the highest protection
status in Indian wildlife conservation law [65] but the A&N tribes
are legally exempt due to the significant totemic and heritage value
they place on the dugong. In the southern Nicobars, local
extirpations (despite presence of extensive meadows) are probably
linked to the long present ritual hunting of dugongs by these tribes
[26]. Such hunting by indigenous tribes [66], [67], (though legal)
can negatively affect dugong populations, if it does not follow
practices of sustainable harvest [68]. It is important to motivate
these indigenous groups to implement self-imposed voluntary bans
on hunting; or to set harvest thresholds over time periods that may
allow local population recovery to take place [66], [70]. Illegal
hunting by non-indigenous groups may be equally serious, if not
more so, but is significantly under-reported and difficult to
monitor. Such hunting needs to be banned through strong
enforcement, to protect remaining populations of dugongs
occupying settler-dominated areas. Reduction of hunting pressure
has shown encouraging recoveries in dugong populations in the
Arabian Gulf [69], and highlights the importance of tackling the
issue within this region.
Although few studies exist on long-term occupancy dynamics of
marine mammals, evaluations of occupancy trends for other rare,
wide-ranging terrestrial species indicate that drastic reductions can
seriously increase the risk of regional extinction (e.g. threatened large
mammals [70], [71]; the endangered Spotted Owl [10]; amphibians
[9], [36] and long-lived plants [72]). Conserving rare and elusive
marine mammal populations in logistically challenging locations is
fraught with difficulties. While our models provide support for
considerable declines, it is difficult to determine the specific
contribution of ecological and anthropological drivers of this decline
without strong direct information on hunting patterns, human
disturbance, or dugong local abundance, movements and seagrass
dynamics. However, our study makes a first attempt at identifying
which of these factors are likely important in driving local persis-
tence and extinction of dugongs. These findings, while admittedly
open to further detailed investigation, can help in spatially
prioritizing dugong conservation efforts in the A&N archipelago.
Despite the evident difficulties in conserving this population,
concerted efforts with multi-pronged conservation approaches
may offer opportunities to improve protection of the dugong
within the northern Indian Ocean [73]. In data-poor situations,
we believe that our study could be relevant to similar situations
across the world, both for dugongs and other marine mammals
across large spatial scales. The study highlights the value of
combining historical and current data from all available sources to
identify factors underlying long-term distributional trends in
elusive, threatened marine mammal populations.
Supporting Information
Appendix S1 Locations sampled for dugong occupancysurveys in the Andaman and Nicobar Islands. Key:
Andaman Islands: 0-East I., 1-Landfall I., 2-Reef I., 3-
Radhanagar, 4-Paget I., 5-Casuarina Bay, 6-Temple Island, 7-
Ross Smith beachfront, 8-Craggy-Kalipur, 9-Atlanta Bay,10-
North Reef I., 11-La’touche, 12-Stewart I., 13-Sound I., 14-
Mayabunder Bay, 15-Austen Harbour, 16-Interview I., 17-Long
I., 18-North Button, 19-Strait I.,20-Henry Lawrence I., 21-John
Lawrence I., 22-Havelock Fusilier Channel, 23-Radhanagar, 24-
Point, 25-Neil, 26-Hugh Ross, 27-Shoal Bay, 28-Port Blair 1, 29-
Port Blair 2, 30-North Bay & Mt. Harriett, 31-Rutland, 32-
Burmanullah, 33-Chidiyatapu, 34-Cinque I., 35-Kanaidera, 36-
Mahuadera, 37-Tarmugli, 38-MGMNP, 39-Dugong Creek, 41-
Butler Bay, 42-Hut Bay, 43-West Bay, 44-Ekiti; NicobarIslands: 0-South+West, 1-North+East, 2-Teressa, 3-Flotsam, 4-
Police camp, 5-Trinket, 6-Trinket, 7-Champian, 8-Hitui, 9-
Malacca, 10-Kardip, 11-Altaiyak, 12-Camorta NW,13-Derring
Bay, 14-West, 15-Bada Enaka, 16-Marine, 17-West Bay, 18-North
Bay, 19-North, 20-Pilomillow, 21-Campbell Bay, 22-Casuarina
Bay, 23-Bquarry, 24-Laxminagar, 25-Laful Bay.
(DOCX)
Figure 5. Overlaps in distribution of dugongs and anthropogenic threats. a) Dugong occupancy (y) was lower in locations with prevalenceof hunting, b) meadows with dugongs and without dugongs had almost similar boat traffic (5+ boats d-1) and c) dugong distribution overlappedwith high gillnet usage. Error bars indicate standard deviation about the mean occupancy (for n = 38 out of total 57 meadows).doi:10.1371/journal.pone.0076181.g005
Long-Term Occupancy Dynamics of Threatened Dugongs
PLOS ONE | www.plosone.org 10 October 2013 | Volume 8 | Issue 10 | e76181
Appendix S2
(DOCX)
Acknowledgments
The Department of Environment and Forests, Port Blair were keenly
involved and provided timely permits for work, the A&N administration
provided permits to the Nicobar islands. The Nature Conservation
Foundation, Andaman and Nicobar Islands Environmental Team, Madras
Crocodile Bank Trust, National Centre for Biological Sciences, and Reef
Watch Marine Conservation also provided crucial support. A.K.
Kumaraguru, N. Marba, M. Chandi, E. Hines, Y.C. Krishna and M.D.
Madhusudan provided important inputs in the study, and in the design of
occupancy surveys. A. Marathe of ATREE, Bangalore helped with GIS
and mapping with ArcGIS 10. E.K. Raveendran (Directorate of Fisheries)
and P.T. Rajan (Zoological Survey of India) were kind enough to share
some of the dugong records maintained with their departments. We
sincerely thank our field assistants and all local informants who
meticulously reported their dugong sightings in a timely manner. Finally
we thank the anonymous reviewers and editor for their suggestions that
helped us improve the quality of the manuscript.
Author Contributions
Conceived and designed the experiments: ED VP RA TA NK. Performed
the experiments: ED VP. Analyzed the data: ED VP RA TA NK.
Contributed reagents/materials/analysis tools: ED VP RA TA NK. Wrote
the paper: ED VP RA TA NK.
References
1. Read AJ (2008) The looming crisis: interactions between marine mammals and
fisheries. J Mammal 89: 541–548.
2. Schipper J, Chanson JS, Chiozza F, Cox NA, Hoffman M, et al. (2008) The
status of the world’s land and marine mammals: diversity, threat and knowledge.
Science 322: 225–230.
3. O’Shea TJ, Odell DK (2008) Large-scale marine ecosystem change and the
conservation of marine mammals. J Mammal 89: 529–533.
4. Lotze HK, Worm B (2009) Historical baselines for large marine animals. Trends
Ecol Evol 24: 254–262.
5. Moore SE (2005) Long-term environmental change and marine mammals. In:
Reynolds JE III, Perrin WF, Reeves RR, Montgomery S, Ragen T, editors.
Marine mammal research: conservation beyond crisis. John Hopkins University
Press, Baltimore, USA. pp 137–148.
6. Issaris Y, Katsanevakis S, Salomidi M, Tsiamis K, Katsiaras N, et al. (2012)
Occupancy estimation of marine species: dealing with imperfect detectability.
Mar Ecol Prog Ser 453: 95–106.
7. Mackenzie DI, Nichols JD, Royle JA, Pollock KH, Bailey LL, et al. (2006)
Occupancy estimation and modeling: inferring patterns and dynamics of species
occurrence. California, USA: Elsevier. 324 p + xviii.
8. Moore SE (2008) Marine mammals as ecosystem sentinels. J Mammal 89: 534–
540.
9. Mackenzie DI, Nichols JD, Sutton N, Kawanishi K, Bailey L (2005) Improving
inferences in population studies of rare species that are detected imperfectly.
Ecology 86: 1101–1113.
10. Noon BR, Bailey LL, Sisk TD, Mckelvey KS (2012) Efficient species-level
monitoring at the landscape scale. Conserv Biol 26: 432–441.
11. Eberhardt LL, Chapman DG, Gilbert JR (1979) A review of marine mammal
census methods. Wildlife Monogr 63: 3–46.
12. Marsh H, Sinclair DF (1989) Correcting for visibility bias in strip transect aerial
surveys of aquatic fauna. J Wildl Manage 53: 1017–1024.
13. MacLeod CD, Mandleberg L, Schweder C, Bannon SM, Pierce GJ (2008) A
comparison of approaches for modeling the occurrence of marine animals.
Hydrobiologia 612: 21–32.
14. Rivadeneira MM, Hunt G, Roy K (2009) The use of sighting records to infer
species extinctions: an evaluation of different methods. Ecology 90: 1291–1300.
15. McKelvey KS, Aubry KB, Schwartz MK (2008) Using anecdotal occurrence
data for rare or elusive species: The illusion of reality and a call for evidentiary
standards. BioScience 58: 549–555.
16. Tingley MW, Beissinger SR (2009) Detecting range shifts from historical species
occurrences: new perspectives on old data. Trends Ecol Evol 24: 625–633.
17. Carr MH, Neigel JE, Estes JA, Andelman S, Warner RR, et al. (2003)
Comparing marine and terrestrial ecosystems: Implications for the design of
coastal marine reserves. Ecol Appl 13: S90–S107.
18. Aragones L, Jefferson TA, Marsh H (1997) Marine mammal survey techniques
applicable in developing countries. Asian Marine Biology 14: 15–39.
19. Marsh H, De’Ath G, Gribble N, Lane B (2005) Historical marine population
estimates: triggers or targets for conservation? The dugong case study. Ecol Appl
15: 481–492.
20. Marsh H, Penrose H, Eros C, Hugues J (2002) The Dugong (Dugong dugon)
status reports and action plans for countries and territories in its Range. Final
Report, United Nations Environment Programme, Nairobi, Kenya.
21. Marsh H, O’Shea TJ, Reynolds JR (2011) The ecology and conservation of
Sirenia: dugongs and manatees. Cambridge University Press, United Kingdom.
521p.
22. Sathasivam K (2004) Marine mammals of India. Universities press, Hyderabad,
India. 180 p.
23. Hines EM, Adulyankosol K, Poochaviranon S, Somany P, Sam Ath L, et al.
(2012) Dugongs in Asia. In: Hines EM, Reynolds JE III, Aragones LV,
Mignucci-Giamoni AA, Marmontel M, editors. Sirenian Conservation.
University Press of Gainesville, Florida, USA. pp. 58–76.
24. Hines EM, Adulyanukosol K, Duffus DA (2005) Dugong (Dugong dugon)
abundance along the Andaman coast of Thailand. Mar Mamm Sci 21: 536–549.
25. Tun T, Ilangakoon AD (2007) Assessment on Dugong (Dugong dugon) occurrence
and distribution in an extended area of the Rakhine coast of Western Myanmar.
Unpublished report, Society for Marine Mammology, USA. 32 p.
26. D’Souza E, Raveendran EK, Rajan PT, Patankar V (2010) Status of Dugong
dugon (Muller) in Andaman and Nicobar islands based on past records and
traditional hunting by indigenous tribes. Recent Trends in Biodiversity of
Andaman and Nicobar Islands, Zoological Survey of India, Kolkata, India. pp.
443–449.
27. Das HS, Dey SC (1999) Observations on the dugong, Dugong dugon (Muller), in
the Andaman and Nicobar Islands, India. J Bom Nat Hist Soc 96: 195–198.
28. Anon. (1956) Andaman and Nicobar Islands Protection of Aboriginal Tribes
Regulation, Government Press, Port Blair, Andaman islands, India.
29. Aragones LV, LaCommare KS, Kendall S, Castelblanco-Martinez N,
Gonzalez-Socoloske D (2012) Boat- and land-based surveys for Sirenians. In:
Hines EM, Reynolds JE III, Aragones LV, Mignucci-Giamoni AA, Marmontel
M, editors. Sirenian Conservation. University Press of Gainesville, Florida,
USA. pp. 179–185.
30. Preen AR (1995) Impacts of dugong foraging on seagrass habitats: observational
and experimental evidence for cultivation grazing. Mar Ecol Prog Ser 124: 201–
213.
31. Davidar P, Devy S, Yoganand TRK, Ganesh T (1994) Reserve size and
implications for the conservation of biodiversity in the islands. Proceedings of an
IUFRO Symposium held at Chiang Mai, Thailand, 287–301.
32. Myers N, Mittermeier RA, Mittermeier CG, Fonseca GAB, Kent J (2000)
Biodiversity hotspots for conservation priorities. Nature 403: 853–858.
33. Director-Census Operations (2011) Provisional population total: rural-urban
distribution, Andaman and Nicobar Islands. Directorate of Census Operations,
Government of India 2 (35).
34. Sankaran R, Andrews H, Vaughan A (2005) The ground beneath the waves:
Post-tsunami impact assessment of wildlife and their habitats in India. Vol II.
Wildlife Trust of India, New Delhi, India. 105 p.
35. Royle JA, Link WA (2006) Generalized site occupancy models allowing for false
positive and false negative errors. Ecology 87: 835–841.
36. Mackenzie DI, Nichols JD, Lachman GB, Droege S, Royle JA, et al. (2002)
Estimating site occupancy rates when detection probabilities are less than one.
Ecology 83: 2248–2255.
37. Marsh H, Heinsohn GE, Marsh LM (1984) Breeding cycle, life history and
population dynamics of the dugong, Dugong dugon (Sirenia: Dugongidae). Aust
J Zool 32: 767–788.
38. Marsh H, Kwan D (2008) Temporal variability in the life history and
reproductive biology of female dugongs in Torres Strait: The likely role of
seagrass dieback. Cont Shelf Res 28: 2152–2159.
39. de Iongh HH, Langeveld P, van Der Wal M (1998) Movement and home ranges
of dugongs around the Lease Islands, east Indonesia. Mar Ecol 19: 179–193.
40. Amante C, Eakins BW (2009) ETOPO11 Arc-minute global relief model:
Procedures, data sources and analysis. NOAA Technical Memorandum
NESDIS NGDC-24, Marine Geology and Geophysics Division, Colorado,
USA. 25 p.
41. Das HS (1996) Status of seagrass habitats of the Andaman and Nicobar Coast.
Salim Ali Centre for Ornithology and Natural History (SACON), Coimbatore,
India. 32 p.
42. Preen A (1993) Interactions between dugongs and seagrasses in a subtropical
environment. PhD thesis submitted to the Department of Zoology, James Cook
University of Northern Queensland, Australia. 392p.
43. de Iongh HH, Wenno BJ, Meelis E (1995) Seagrass distribution and seasonal
biomass changes in relation to dugong grazing in the Moluccas, East Indonesia.
Aquat Bot 50: 1–19.
44. Nakaoka M, Aioi K (1999) Growth of seagrass Halophila ovalis at dugong trails
compared to existing within-patch variation in a Thailand intertidal flat. Mar
Ecol Prog Ser 184: 97–103.
45. D’Souza E, Patankar V (2009) First underwater sighting and preliminary
behavioural observations of Dugongs (Dugong dugon) in the wild from Indian
waters, Andaman Islands. Journal of Threatened Taxa 1: 49–53.
Long-Term Occupancy Dynamics of Threatened Dugongs
PLOS ONE | www.plosone.org 11 October 2013 | Volume 8 | Issue 10 | e76181
46. Sheppard JK, Preen AR, Marsh H, Lawler IR, Whiting SD, et al. (2006)
Movement heterogeneity of dugongs, Dugong dugon (Muller), over large spatialscales. J Exp Mar Biol Ecol 344: 64–83.
47. Jagtap TG (1992) Marine flora of Nicobar group of islands in Andaman Sea.
Indian J Mar Sci 21: 56–58.48. Royle JA, Kery M (2007) A Bayesian state-space formulation of dynamic
occupancy models. Ecology 88: 1813–1823.49. Bailey L, Hines J, Nichols J (2007) Sampling design trade-offs in occupancy
studies with imperfect detection: examples and software. Ecol Appl 17: 281–290.
50. Royle JA, Dorazio R (2008) Hierarchical modeling and inference in ecology -the analysis of data from populations, metapopulations and communities.
Academic Press, San Diego, USA. pp. 297–324.51. Aing C, Halls S, Oken K, Dobrow R, Fieberg J (2011) A Bayesian hierarchical
occupancy model for track surveys conducted in a series of linear, spatiallycorrelated, sites. J Appl Ecol 48: 1508–1517.
52. Nichols JD, Bailey LL, O’Connell Jr AF, Talancy NW, Grant EHC, et al. (2008)
Multi-scale occupancy estimation and modeling using multiple detectionmethods. J Appl Ecol 45: 1321–1329.
53. Saracco JF, Siegel RB, Wilkerson RL (2011) Occupancy modeling of black-backed woodpeckers on burned Sierra Nevada forests. Ecosphere 2: 1–17.
54. R Development Core Team (2012) R: A language and environment for
statistical computing. R Foundation for Statistical Computing, Vienna, Austria.ISBN 3-900051-07-0, URL: http://www.R-project.org.
55. Lunn D, Spiegelhalter D, Thomas A, Best N (2009) The BUGS project:Evolution, critique, and future directions. Stat Med 28: 3049–3067.
56. Marsh H, Helen P, Eros C (2003) A future for the dugong. In: Gales N, HindellM, Kirkwood R, editors. Marine mammals and humans: fisheries, tourism and
management. Melbourne, Australia: CSIRO Publishing (xii+ 446). pp. 383–399.
57. Preen A (1995) Diet of dugongs: Are they omnivores? J American Soc of Mamm76 (1): 163–171.
58. Sheppard JK, Lawler IR, Marsh H (2007) Seagrass as pasture for seacows:Landscape-level dugong habitat evaluation. Estuar Coast Shelf Sci 71: 117–132.
59. Aragones LV, Marsh H (2000) Impact of dugong grazing and turtle cropping on
tropical seagrass communities. Pacific Conservation Biology, 5, 277–288.60. Aragones LV, Lawler IR, Foley WJ, Marsh H (2006) Dugong grazing and turtle
cropping: grazing optimization in tropical seagrass systems? Oecologia 149:635–647.
61. Grech A (2009) Spatial models and risk assessments to inform marine planning
at ecosystem-scales: seagrasses and dugongs as a case study. Thesis submitted forthe degree of Doctor of Philosophy, to the School of Earth and Environmental
Sciences, James Cook University, Australia. 186 p.
62. Preen A, Marsh H (1995) Response of dugongs to large-scale loss of seagrassfrom Hervey Bay, Queensland, Australia. Wildlife Res 22: 507–519.
63. Van der Heide T, Eklof JS, van Nes EH, van der Zee EM, Donadi S, et al.(2012) Ecosystem engineering by seagrasses interacts with grazing to shape an
intertidal landscape. PloS One 7: e42060.
64. Hodgson AJ, Marsh H (2006) Response of dugongs to boat traffic: the risk ofdisturbance and displacement. J Exp Mar Biol Ecol 340: 50–61.
65. Ministry of Environment and Forests, Government of India (MoEF-GoI) (1972)The Indian Wildlife (Protection) Act, (1972). Available: http://moef.nic.in/
modules/rules-and-regulations/wildlife/# Accessed 2012 October 20.66. Kwan D, Marsh H, Delean S (2006) Factors affecting the sustainability of
customary dugong hunting by a remote indigenous community. Environ
Conserv 33: 164–171.67. Garrigue C, Patenaude N, Marsh H (2008) Distribution and abundance of the
dugong in New Caledonia, southwest Pacific. Mar Mamm Sci 24: 81–90.68. Marsh H, Gardner BR, Heinsohn GE (1981) Present-day hunting and
distribution of dugongs in the Wellesley Islands (Queensland): Implications for
conservation. Biol Conserv 19: 255–267.69. Preen A, Das H, Al-Rumaidh M, Hodgson A (2012) Dugongs in Arabia. In:
Hines EM, Reynolds JE III, Aragones LV, Mignucci-Giamoni AA, MarmontelM, editors. Sirenian Conservation. University Press of Gainesville, Florida, USA.
70. Karanth KK, Nichols JD, Hines JE, Karanth KU, Christensen NL (2009)Patterns and determinants of mammal species occurrence in India. J Appl Ecol
46: 1189–1200.
71. Pillay R, Johnsingh AJT, Raghunath R, Madhusudan MD (2011) Patterns ofspatiotemporal change in large mammal distribution and abundance in the
southern Western Ghats, India. Biol Conserv 144: 1567–1576.72. Herben TS, Munzbergova Z, Milden M, Ehrlen J, Cousins SAO, et al. (2006)
Long-term spatial dynamics of Succisa pratensis in a changing rural landscape:
linking dynamical modelling with historical maps. J Ecol 94: 131–143.73. Davidson AD, Boyer AG, Kim H, Pompa-Mansilla S, Hamilton MJ, et al. (2012)
Drivers and hotspots of extinction risk in marine mammals. PNAS 109: 3395–3400.
Long-Term Occupancy Dynamics of Threatened Dugongs
PLOS ONE | www.plosone.org 12 October 2013 | Volume 8 | Issue 10 | e76181
Recommended


