
http://tih.sagepub.com/Toxicology and Industrial Health
http://tih.sagepub.com/content/early/2012/10/01/0748233712462442The online version of this article can be found at:
DOI: 10.1177/0748233712462442
published online 2 October 2012Toxicol Ind HealthSarmishtha Chatterjee, Atish Ray, Sandip Mukherjee, Soumik Agarwal, Rakesh Kundu and Shelley Bhattacharya
Low concentration of mercury induces autophagic cell death in rat hepatocytes
Published by:
http://www.sagepublications.com
can be found at:Toxicology and Industrial HealthAdditional services and information for
http://tih.sagepub.com/cgi/alertsEmail Alerts:
http://tih.sagepub.com/subscriptionsSubscriptions:
http://www.sagepub.com/journalsReprints.navReprints:
http://www.sagepub.com/journalsPermissions.navPermissions:
What is This?
- Oct 2, 2012OnlineFirst Version of Record >>
at UNIV CALIFORNIA SAN DIEGO on October 6, 2012tih.sagepub.comDownloaded from

Article
Low concentration of mercuryinduces autophagic cell death inrat hepatocytes
Sarmishtha Chatterjee1, Atish Ray1, Sandip Mukherjee1,Soumik Agarwal1, Rakesh Kundu2 andShelley Bhattacharya1
AbstractIn the present study, we attempted to elucidate the induction of autophagy in rat hepatocytes by a lowconcentration of mercury. Hepatocytes treated with different doses of mercuric chloride (HgCl2; 1, 2.5, 5 and10 mM) and at different time intervals (0 min, 30 min, 1 h, 2 h and 4 h) show autophagic cell death only at 5 mMHgCl2 within 30 min of incubation. At 1 and 2.5 mM HgCl2, no cell death is recorded, while apoptosis is found at10 mM HgCl2, as evidenced by the activation of caspase 3. Autophagic cell death is confirmed by the presence ofmonodansylcadaverine (MDC) positive hepatocytes which is found to be highest at 1 h. Atg5-Atg12 covalent-conjugation triggers the autophagic pathway within 30 min of 5 mM HgCl2 treatment and continues till 4 h ofincubation. In addition, damage-regulated autophagy modulator (DRAM) expression gradually increases from30 min to 4 h of treatment with mercury and a corresponding linear decrease in p53 has been observed. It isconcluded that a low concentration (5 mM HgCl2) of mercury induces autophagy or nonapoptotic programmedcell death following an Atg5-Atg12 covalent-conjugation pathway, which is modulated by DRAM in ap53-dependent manner.
KeywordsRat liver, autophagy, mercury, Atg 5-12, MDC, DRAM
Introduction
Mercury is an all pervasive environmental contami-
nant, which gets fixed and stored in tissues of organ-
isms directly affecting the individual’s health (Streit,
1992). It interacts with the sulfhydryl group of pro-
teins by displacing other metals from their natural-
binding sites (Flora et al., 2008). Constant exposure
of liver to heavy metals causes programmed cell death
by apoptosis, autophagy or necrosis. Although pro-
grammed cell death occurs at a negligible rate under
normal conditions (Bursch et al., 1985; James and
Muskhelishvili, 1994), autophagy has been observed
under pathological conditions (Martinet et al., 2006;
Wang et al., 2010). Although autophagy, the type II
programmed cell death, is considered a genetically
programmed mechanism by which cellular proteins
and organelles are degraded nonselectively (Kopitz
et al., 1990; Levine and Klionsky, 2004), there is an
evidence from several independent groups, indicating
a selective autophagic elimination of depolarized
mitochondria, endoplasmic reticulum and peroxi-
somes (Elmore et al., 2001; Hamasaki et al., 2005;
Iwata et al., 2006; Kissova et al., 2004). Yu et al.
(2006) showed that catalase, a key enzyme of the
antioxidant defense mechanism, was selectively
1 Environmental Toxicology Laboratory, Department of Zoology,Centre for Advanced Studies, Visva-Bharati University, Santinike-tan, West Bengal, India2 Molecular Endocrinology Laboratory, Department of Zoology,Centre for Advanced Studies, Visva-Bharati University, Santinike-tan, West Bengal, India
Corresponding author:Shelley Bhattacharya, Environmental Toxicology Laboratory,Department of Zoology, Centre for Advanced Studies,Visva-Bharati University, Santiniketan 731235, West Bengal,IndiaEmail: [email protected]
Toxicology and Industrial Health1–10© The Author(s) 2012Reprints and permissions:sagepub.co.uk/journalsPermissions.navDOI: 10.1177/0748233712462442tih.sagepub.com
at UNIV CALIFORNIA SAN DIEGO on October 6, 2012tih.sagepub.comDownloaded from

eliminated during autophagic cell death. Therefore,
an alternative death induction mechanism by autop-
hagy may consist of selective elimination of vital
organelles and/or proteins may be involved in cell
survival and homeostasis, although the mechanism
regulating this selectivity still remains obscure. This
process has been implicated in a range of disorders
and therefore is of major interest. Formation of the
double membrane cytosolic vesicle, the autophago-
some, is the hallmark of this evolutionary-conserved
process.
During the early formation of autophagosome, the
membranes enlarge in magnitude by altering the
shape to form a cup-fashioned structure called phago-
pores (Chan et al., 2006). Phagopores are formed
either by the isolation of original membrane or by the
assimilation of additional lipids or tubulation of the
existing compartments. Sequestration of cytosolic
content finally takes place in these vesicles (Klionsky
et al., 2007; Mizushima et al., 2008) and the mature
autophagosome is formed by the fusion of autophagic
vesicle and lysosome (Martinet et al., 2006). Mono-
dansylcadaverine (MDC) is a potential marker to
detect these autophagic vesicles (Biederbick et al.,
1995). However, some specific molecular markers are
also known to express during this complex process.
Several proteins that are involved in the formation
of autophagosomes are identified. Atg6/Beclin-1
(BCN1, homolog of yeast Atg6), a lipid kinase
Bcl-2 interacting protein, mediates the autophagy
induction (Cao and Klionsky, 2007; Klionsky and
Emr, 2000). Atg5-Atg12 conjugation is also a partici-
pant in the initial autophagosome formation. Further-
more, damage-regulated autophagy modulator
(DRAM), composed of 238 amino acid proteins and
transactivated by p53, is a modulator of autophagic
regulation (Crighton et al., 2007).
We have reported earlier (Ray et al., 2008) that the
higher concentration of metals drives the rat hepato-
cytes toward caspase-dependent pathway with an
indication of vacuolization in the cell before the onset
of apoptosis. However, a few recent reports demon-
strated that the lower concentration of metals causes
the induction of autophagic cell death in different cell
types; arsenic was reported to induce autophagy at a
concentration of 2 mM in malignant glioma cell lines
(Kanzawa et al., 2003) and at 6 mM in lymphoblastoid
cell lines (Bolt et al., 2010); Dong et al. (2009)
recorded autophagy in vascular endothelial cells at
less than 10 mM cadmium (Cd); while more recently,
Chargui et al. (2011) reported Cd-induced autophagy
in rat kidney at an in vivo dose of 0.3 mg Cd/kg body
mass. Mercury is a ubiquitous hepatotoxicant that
affects all the organisms deleteriously. Considering
the dearth of information on the nature of cytotoxicity
of low concentration of mercury, we have attempted
here to elucidate autophagic cell death in rat hepato-
cytes at low levels of mercury exposure.
Materials and methods
Chemicals and reagents
Collagenase type IV, MDC, Hoechst-33258, Annexin
V-Cy3™ (Apoptotic detection kit; Cat. no. APO-AC),
poly-L-lysine, primary antibodies for anti-Atg5 (anti-
rabbit; Cat. no. A0856), anti-Atg12 (anti-rabbit; Cat.
no. PRS4421), anti-Atg6 (anti-rabbit; Cat. no.
B6061) and alkaline phosphatase (ALP)-conjugated
anti-rabbit secondary antibody were procured from
Sigma-Aldrich Chemicals Private Ltd (St Louis,
Missouri, USA). Other primary antibodies such as,
anti-TIGAR (Tp53-induced glycolysis and apoptosis
regulator) (sc-67273), anti-DRAM (sc-98654), anti-
caspase 3 (sc-7148), anti-p53 (sc-6243) and anti-Bcl-
2 (sc-492) were purchased from Santa Cruz Biotech-
nology Inc. (Madison, Wisconsin, USA). Dulbecco’s
Modified Eagle Medium (DMEM) and other tissue
culture materials were obtained from Gibco-BRL (Life
Technologies Inc., Gaithersburg, Maryland, USA). All
other chemicals used were of analytical grade, pur-
chased from Sisco Research Laboratories (Mumbai,
India) and E. Merck (Darmstadt, Germany).
Animals and their maintenance
Adult male albino rats of the Sprague–Dawley strain
weighing 180–220 g were maintained under standard
laboratory conditions in clean polypropylene cages
(two animals per cage) under 12 h of light/dark cycle
at 25 + 2�C, with food (rat chow; Hindustan Lever
Ltd, Bombay, India) and water provided ad libitum
(Inglis, 1980). Animals were acclimated for about a
week prior to use. Rats showing any abnormal
behavior were removed from the cage immediately.
All the experiments were performed following the
guidelines prescribed by the Institutional Animal
Ethics Committee.
Isolation of hepatocytes
A two-step collagenase digestion method (Shimano
et al., 2003) with some modifications was used to isolate
hepatocytes. In brief, livers were perfused at 37�C with
2 Toxicology and Industrial Health
at UNIV CALIFORNIA SAN DIEGO on October 6, 2012tih.sagepub.comDownloaded from

200 ml of Ca2þ free Hanks’-balanced salt solution
(HBSS), containing 0.05% collagenase type IV. The
livers were promptly removed and minced with a razor.
For the isolation of parenchymal cells, the minced livers
were incubated in 50 ml of Ca2þ-HBSS containing
0.1% of collagenase type IV for 60 min at 38�C, filtered
through a 60-mm nylon mesh and centrifuged at 50g for
2 min. Pellets were used as a sample of parenchymal
cells containing differentiated hepatocytes.
Mercuric chloride treatment of isolatedhepatocytes
An aliquot of 1 � 106 cells were cultured in 24-well
plates in DMEM and nonessential amino acids
supplemented with penicillin (100 U/ml) and strepto-
mycin (100 mg/ml) in a humidified 95% O2/5% CO2
atmosphere at 37�C. The cells were treated with mer-
curic chloride (HgCl2) at different doses (1, 2.5 , 5 and
10 mM) and different time intervals (30 min, 1 h, 2 h
and 4 h) or as per the design of the experiment keep-
ing a concurrent control.
Assessment of cell viability
Aliquots of 5 mL of control and HgCl2-treated cell
suspensions were taken for Trypan blue dye exclu-
sion assay to check the viability of the cells using a
hemocytometer slide and are represented as percent-
age viability. The rate of cytotoxicity of HgCl2was determined in a 96-well plate by estimating
the formation of 3-(4,5-dimethylthiazol-2-yl)-2,5-
diphenyltetrazolium bromide (MTT) formazan using
the MTT Cell Growth Assay kit (Millipore, Chemi-
con, Cat. No. CT02, Bedford, Massachusetts, USA)
following the manufacturer’s instructions. The
absorbance was measured at 570 nm (test wave-
length) and 630 nm (reference wavelength) in a
Thermo Multiskan Ascent 96/384 Plate Reader
(Thermo Labsystems, Massachusetts, USA). Results
of all the three individual experiments are calculated
as percentage cell death and are expressed as
mean + SEM.
Detection of autophagolysosome by MDC
Control and HgCl2-treated cells were fixed in ice-cold
methanol and allowed to adhere on poly-L-lysine coated
slides. Cells were incubated with 0.05 mM MDC dis-
solved in phosphate-buffered saline (PBS) at 37�C for
10 min to label the autophagic vesicles by following a
previously described method (Biederbick et al., 1995).
After incubation, cells were thoroughly washed with
PBS (four times) and images were captured in fluores-
cence microscope (Carl Zeiss, Goettingen, Germany)
using Jenoptik software (ProgRes1 CapturePro 2.7).
Nuclear staining by Hoechst-33258 and EtBr
Nuclear DNA was visualized in liver cells by staining
with the DNA-specific dye Hoechst-33258 (Bisbenzi-
mide H). Ice-cold methanol-fixed liver cells were resus-
pended in 200ml of PBS and 2 ml of Hoechst-33258 was
added to a final concentration of 1 mg/ml and incubated
for 10 min. Excess stain was washed with PBS, and the
cells were observed immediately under the fluorescence
microscope (Carl Zeiss) using blue filter. Ethidium bro-
mide (EtBr at 1 mg/ml) staining was also carried out in a
similar manner and visualized under the microscope
with an ultraviolet filter.
AnnexinV-Cy3 and 6-CFDA staining ofhepatocytes
AnnexinV-Cy3 and 6-CFDA (6-carboxyfluorescein-
diacetate) staining was performed following the man-
ufacturer’s protocol (Sigma-Aldrich Chemicals
Private Ltd). Briefly, liver cells were allowed to
adhere on poly-L-lysine-coated slide and then stained
with AnnexinV-Cy3 and 6-CFDA reagents in 1X
binding buffer at room temperature for 10 min in the
dark. Excess stain was removed by blotting the slides
with 1X binding buffer and images were captured in
fluorescence microscope (Carl Zeiss) using Jenoptik
software (ProgRes1 CapturePro 2.7). The cells
could be visualized as green (live cells), red (necro-
tic) and green plus red (apoptotic).
Electrophoresis and immunoblotting
Control and HgCl2-treated hepatocytes were lysed and
the protein content was measured according to Lowry
et al. (1951). A total of 60 mg of protein was resolved
on 10% SDS-PAGE (Sodium Dodecyl Sulfate Poly
Acrylamide Gel Electrophoresis) and transferred to
PVDF (Poly Vinylidene Fluoride) membranes (Milli-
pore) with the help of semidry trans blot apparatus
(Bio-Rad Trans-Blot1 SD Cell, Hercules, California
USA) using transfer buffer (25 mM Tris, 193 mM gly-
cine, 20% methanol, pH 8.5). The membranes were first
incubated with primary antibodies of Atg5 (rabbit poly-
clonal), DRAM (rabbit polyclonal), p53 (rabbit polyclo-
nal), Atg12 (rabbit polyclonal) and caspase 3 (rabbit
polyclonal) followed by ALP-conjugated anti-rabbit
Chatterjee et al. 3
at UNIV CALIFORNIA SAN DIEGO on October 6, 2012tih.sagepub.comDownloaded from

secondary antibody at 1:1000 dilution following a pre-
viously described method from our laboratory (Roy and
Bhattacharya, 2006). The protein bands were detected
using 5-bromo 4-chloro 3-indolyl phosphate/nitroblue
tetrazolium.
Results
Assessment of cell viability of rat hepatocytes
There was no mortality of cells exposed to 1 and
2.5 mM of mercury. Cell viability decreased from
95% at 30 min to 89.7% and 89.4% at 4 h when
exposed to 5 and 10 mM of HgCl2, respectively
(Table 1), indicating gradual increase in the percentage
cell death for up to 4 h of treatment with mercury.
Reduction in viability (% control) was 5.17% and
5.49% at 5 and 10 mM, respectively, after 4 h of treat-
ment with mercury. Since treatment with mercury
results in cytotoxicity, we performed MTT assay to
check the effect of low concentration (5 mM) of treat-
ment with mercury on hepatocytes. A minimal increase
in cell death upon treatment with mercury was
recorded and compared with the corresponding con-
trols, and the significant cell death was noted only
between 1 h (2.4% death) and 2 h (5.4% death) of incu-
bation when compared with the 0 h control (Figure 1).
Low concentration of mercury-induced formationof autophagosomes
MDC is a well known indicator of autophagosome for-
mation and the rat hepatocytes treated with 5 mM HgCl2clearly demonstrated an appearance of autophagic vesi-
cles from 30 min to 4 h of incubation, whereas highest
number of MDC-positive hepatocytes was observed at
1 h (Figure 2). However, at 10 mM of HgCl2, no autop-
hagic cell death was seen (result not shown). Therefore,
5 mM of HgCl2 was selected for further investigations.
Treatment with mercury did not alter nuclear andcellular morphology
It was abundantly clear from Figures 3(a) and (b) that
no apoptotic degradation of nucleus occurred until 4 h
of 5 mM HgCl2 treatment. Change in cellular mor-
phology was also assessed in treated rat hepatocytes
by labeling them with AnnexinV-Cy3 and 6-CFDA
double stain, which would indicate apoptotic (green
plus red) or necrotic (red) cell death. In the present
experiment, the majority of cells were AnnexinV-
Cy3 negative, indicating the absence of any type of
programmed cell death (Figure 4).
Expression of the potential autophagic markerson exposure to mercury
Autophagosome signal is initiated by Atg5-Atg12 cova-
lent conjugation, which is evidently demonstrated.
Table 1. Determination of hepatocyte viability (%) by Trypan blue dye exclusion
Time ofincubation
Hepatocyte viability (%)Reduction in hepatocyteviability (% of control)
ControlTreated with5 mM HgCl2
Treated with10 mM HgCl2
Treated with5 mM HgCl2
Treated with10 mM HgCl2
30 min 96.10 + 0.6 95.50 + 0.5 95.60 + 0.5 0.62 0.521 h 95.50 + 0.5 94.20 + 0.4 94.40 + 0.6 1.36 1.152 h 94.80 + 0.4 91.30 + 0.5 91.20 + 0.7 3.69 3.794 h 94.60 + 0.4 89.70 + 0.6 89.40 + 0.3 5.17 5.49
HgCl2: mercuric chloride.
Figure 1. Assessment of cell death by MTT assay. Isolatedrat hepatocytes were incubated with 5 mM HgCl2 from 0 to4 h; white columns correspond to every time period. Lysateswere prepared and subjected to MTT analysis. Each value isthe mean + SEM of five independent experiments; *p < 0.05(versus control). HgCl2: mercuric chloride; MTT: (3-(4,5-dimethylthiazol-2-yl)-2,5-diphenyltetrazolium bromide).
4 Toxicology and Industrial Health
at UNIV CALIFORNIA SAN DIEGO on October 6, 2012tih.sagepub.comDownloaded from
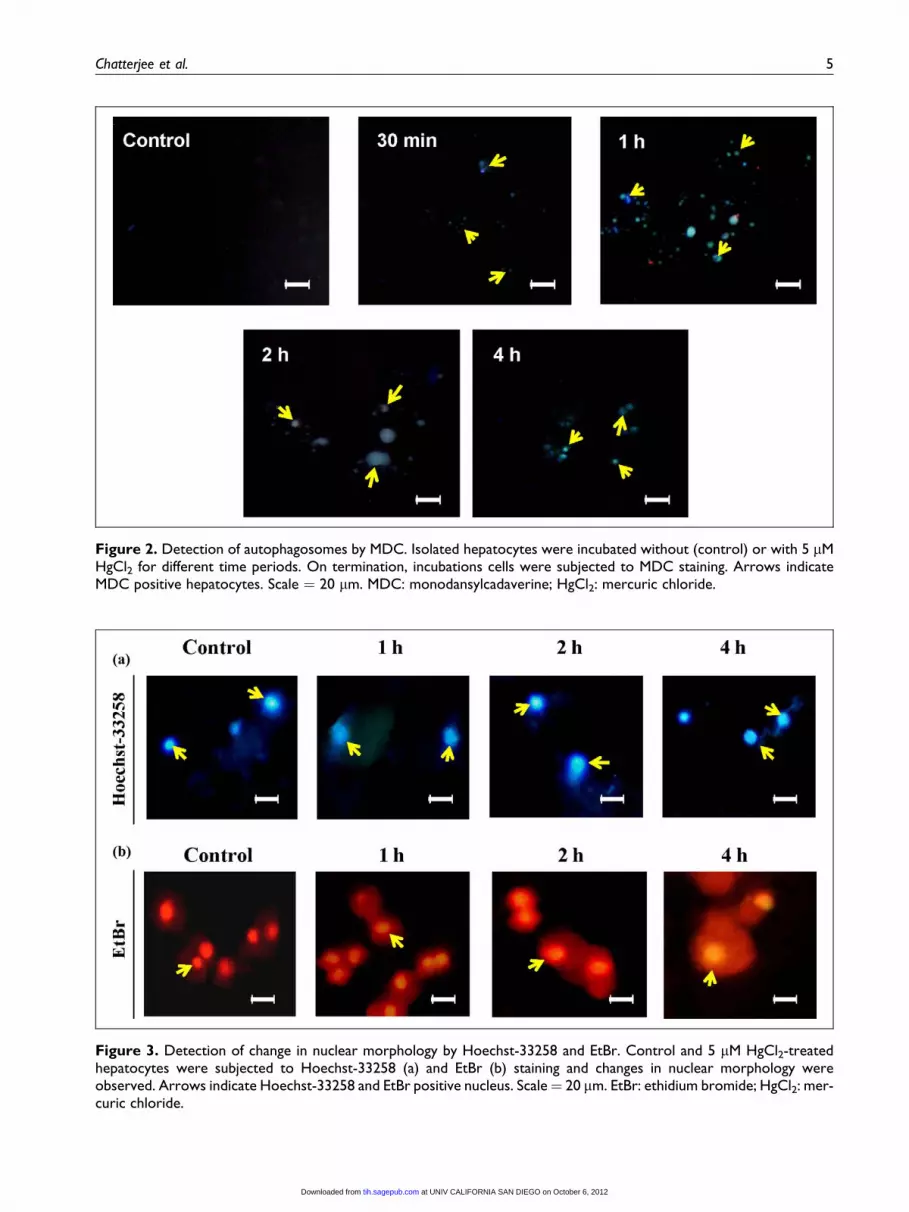
Figure 2. Detection of autophagosomes by MDC. Isolated hepatocytes were incubated without (control) or with 5 mMHgCl2 for different time periods. On termination, incubations cells were subjected to MDC staining. Arrows indicateMDC positive hepatocytes. Scale ¼ 20 mm. MDC: monodansylcadaverine; HgCl2: mercuric chloride.
Figure 3. Detection of change in nuclear morphology by Hoechst-33258 and EtBr. Control and 5 mM HgCl2-treatedhepatocytes were subjected to Hoechst-33258 (a) and EtBr (b) staining and changes in nuclear morphology wereobserved. Arrows indicate Hoechst-33258 and EtBr positive nucleus. Scale¼ 20 mm. EtBr: ethidium bromide; HgCl2: mer-curic chloride.
Chatterjee et al. 5
at UNIV CALIFORNIA SAN DIEGO on October 6, 2012tih.sagepub.comDownloaded from

Treatment of hepatocytes with 5 mM HgCl2 induced
the expression of Atg5-Atg12 complex from 30 min
to 4 h of incubation. However, at 1 and 2 h, expres-
sion of Atg5-Atg12 complex remained remarkably
high, which decreased in 4 h indicating autophago-
some formation within 30 min and continuing up
to 4 h of treatment with mercury (Figure 5(a)).
Similar result was observed for Atg12 expression.
As Atg5 and Atg12 proteins exist in the form of
Atg5-Atg12 complex, it is difficult to detect the
monomeric forms of these proteins. Therefore, when
the blots were probed to detect free Atg5 (*32 kDa)
or Atg12 (*21 kDa), both of them showed a single
band for Atg5-Atg12 dimer at 55 kDa (Figure 5(a)).
However, TIGAR was not expressed at any time
point of the experimental incubations (Figure not
shown). Therefore, to confirm the phenomenon of
autophagy in hepatocytes at 5 mM HgCl2, we
checked the expression levels of DRAM and p53,
which are the modulators of this process. Interest-
ingly, the expression of DRAM linearly increased
from 30 min to 4 h of treatment with mercury
(Figure 5(b)) in contrast to the level of p53, which
gradually decreased throughout the incubation period
(Figure 5(c)). Moreover, there was no change in the
expression of cytosolic Atg6, Bcl2 and caspase 3
indicating that 5 mM HgCl2 did not trigger apoptosis
(data not shown). To check whether a higher concen-
tration of HgCl2 induced apoptosis, we performed
the Western blot analysis for caspase 3 expression.
A linear increase in the expression of both pro-
caspase and caspase 3 from 30 min to 4 h of incuba-
tion of hepatocytes with 10 mM HgCl2 substantiated
the induction of apoptosis (Figure 6).
Discussion
Mercury is a well-established environmental toxicant
that affects the immune system, damages the nervous
system and gastrointestinal tract and also activates
numerous intracellular signal transduction pathways,
resulting in the induction of programmed cell death
due to apoptosis (Shenker et al., 2000). Induction of
autophagy at a low concentration of heavy metals has
been reported earlier in cell types other than hepato-
cytes (Bolt et al., 2010; Chargui et al., 2011; Dong
et al., 2009; Kanzawa et al., 2003). However, there
is no report on autophagic cell death at low
Figure 4. AnnexinV-Cy3 staining of live cells. Hepatocytes were treated with or without 5 mM HgCl2 for 4 h and weresubjected to AnnexinV-Cy3 and CFDA (6-carboxyfluorescein diacetate) double staining as described in the Materials andMethods section. Viable cells are indicated (arrow) as CFDA positive (green). AnnexinV-Cy3 positive and dual positivecells were absent. Scale ¼ 20 mm. HgCl2: mercuric chloride.
6 Toxicology and Industrial Health
at UNIV CALIFORNIA SAN DIEGO on October 6, 2012tih.sagepub.comDownloaded from

concentration of HgCl2. Herein, we report for the first
time that hepatocytes exposed to low concentration
(5 mM) of HgCl2 lead to autophagic cell death. The
time kinetics of the type II programmed cell death
correlates well with the cellular deformation, where pro-
nounced autophagosome formation at 5 mM HgCl2 was
visualized under the microscope. Thus, it is abundantly
clear that autophagy initiates before apoptosis dur-
ing concentration-dependent metal exposures corro-
borating earlier observations (Dong et al., 2009;
Gonzalez-Polo et al., 2005).
In the present investigation, hepatocytes exposed
to low concentration of HgCl2 resulted in minimal
cell death from 30 min to 4 h of incubation. To con-
firm whether this cell death was due to autophagy or
apoptosis, we used a specific autophagic marker
(MDC) and found autophagic vesicles within 30 min
of treatment continuing until 4 h of incubation. How-
ever, nuclear staining by Hoechst 33258 and EtBr
confirmed no nuclear deformation, indicating nona-
poptotic cell death. Externalization of phosphatidyl-
serine and phosphatidylethanolamine (PE) is a
hallmark of the changes in the cell surface during
apoptosis (Koopman et al., 1994; Lecoeur et al.,
1997). Negative staining by AnnexinV-Cy3 con-
firmed the absence of apoptosis in 5 mM HgCl2-
treated hepatocytes. Since all the microscopic obser-
vations indicated the induction of autophagic cell
death, a study with specific protein markers of autop-
hagy was worth pursuing to confirm these
observations.
There are several isoforms of Atg proteins that are
indicative of cell death following the autophagic
pathway. The autophagic protein Atg5 remains con-
jugated to Atg12, an ubiquitin-like modifier, and two
other proteins Atg7 and Atg10 for the formation of
autophagosome (Wang and Klionsky, 2003). The
conjugation of Atg5 to Atg12 normally occurs soon
after the individual proteins have been synthesized
(Mehrpour et al., 2010). The Atg5-Atg12 conjugate
localizes to the preautophagosomal structure, a puta-
tive center for autophagosome formation in mam-
mals (Suzuki et al., 2001). Almost all the
conjugates of Atg5 and Atg12 exist in the form of
Atg5-Atg12 dimer, and therefore, it is difficult to
detect the monomeric form of these proteins. Atg5-
Atg12 conjugate is translocated from the cytosol to
the membranes of autophagosome during nutrient
deprivation and immediately upon the completion
of autophagic vacuole formation (Mizushima et al.,
2001). These two autophagic proteins are known to
participate in elongation of the autophagosome
membrane during vacuole formation (Hanada
et al., 2007). Atg5-Atg12 complex facilitates LC3-
PE mediated autophagy (Eisenberg-Lerner et al.,
2009). However, in the present study, we have not
yet been able to clearly establish the role of LC3-
PE; our preliminary data suggest that there is an
Figure 5. Immunoblotting of autophagic markers. Thehepatocytes treated with 5 mM HgCl2 were incubated fordifferent time periods and lysates were subjected to immu-noblot analyses with anti-Atg5 and anti-Atg12 (a), anti-DRAM (b) and anti-p53 (c) antibodies. b-Actin served asan internal control. Figures are representative of one of thefive independent experiments. DRAM: damage-regulatedautophagy modulator; HgCl2: mercuric chloride.
Figure 6. Induction of apoptosis by 10 mM HgCl2. Hepato-cytes treated with 10 mM HgCl2 were subjected to immu-noblot analysis with anti-caspase 3 antibody. Two bands,one of pro-caspase 3 (34 kDa) and another of caspase 3(17 kDa) are observed. b-Actin served as an internal con-trol. Figures are the representatives of one of the threeindependent experiments. HgCl2: mercuric chloride.
Chatterjee et al. 7
at UNIV CALIFORNIA SAN DIEGO on October 6, 2012tih.sagepub.comDownloaded from

involvement of LC3 in mercury-induced autophagy
(data not shown). Thus, our model indicates that
Atg5-12 complex is playing an important role in
mercury-induced autophagic pathway. In autophagy,
there is a membrane-trafficking process that serves
to deliver cytoplasmic proteins and organelles to the
lysosome for degradation. The major modulators of
the events are TIGAR, DRAM and p53 (Bensaad
et al., 2009; Crighton et al., 2007). The p53-
inducible TIGAR (Tp53-induced glycolysis and
apoptosis regulator) protein has a role in the deple-
tion of reactive oxygen species (Bensaad et al.,
2009). Thus, TIGAR can limit autophagy and drive
the cells toward apoptosis. We checked the expres-
sion level of TIGAR and no notable change was
observed, which clearly indicates that the exposure to
low levels of mercury leads to autophagy. Recent
reports suggested that p53 inhibits mTOR (mammalian
target of rapamycin) (a cell growth regulator) via acti-
vation of AMP (adenosine mono phosphate)-
responsive protein kinase (AMPK) and regulates its
downstream targets including autophagy (Budanov and
Karin, 2008; Feng et al., 2005). Autophagosome for-
mation is promoted by p53 (Crighton et al., 2006) and
DRAM, a lysosomal membrane-spanning protein, acts
at the final stage of autophagy to form autophagolyso-
some (Green and Chipuk, 2006). In the present study,
we have amply demonstrated the inverse relationship
of p53 and DRAM expressions in the event of autop-
hagy induced by a low concentration of mercury.
Conclusion
It is concluded that a low concentration (5 mM) of
HgCl2 has a direct autophagic effect on hepatocytes
as evidenced by the formation of autophagosomes,
where Atg5-Atg12 covalent-conjugation has a direct
role and DRAM has a distinct p53-dependent regula-
tory role in nonapoptotic programmed cell death.
Acknowledgements
SC and SB are grateful to the Department of Science and
Technology, Ministry of Science and Technology; AR and
SA are grateful to Council of Scientific and Industrial
Research (CSIR) for providing the Senior Research
Fellowship and SM acknowledges University Grants
Commission for providing the Research Fellowship in
Sciences to Meritorious Students. RK is thankful to CSIR
for his Research Associateship. All the authors gratefully
acknowledge Prof Samir Bhattacharya, Molecular Endocri-
nology Laboratory for his critical suggestions.
Funding
Financial support for this research work was from the
Department of Science and Technology, Ministry of Sci-
ence and Technology, Government of India (Project No.
SR/SO/AS-22/2008). Authors also appreciate the Univer-
sity Grants Commission–Centre for Advanced Studies
(UGC-CAS) grants (UGC No. F 5-3/2007 (SAP II) to the
department, which enabled the present study.
Conflict of interest
The authors declared no conflicts of interest.
References
Bensaad K, Cheung EC and Vousden KH (2009) Modulation
of intracellular ROS levels by TIGAR controls autophagy.
EMBO Journal 28: 3015–3026.
Biederbick A, Kern HF and Elsasser HP (1995) Monodan-
sylcadaverine (MDC) is a specific in vivo marker for
autophagic vacuoles. European Journal of Cell Biology
66: 3–14.
Bolt M, Byrd RM and Klimecki WT (2010) Autophagy is a
biological target of arsenic. In: Jean JS, Bundschuh J
and Bhattacharya P (eds) Arsenic in Geosphere and
Human Diseases. Boca Raton, FL: CRC Press, pp.
291–292.
Budanov AV, Karin M (2008) p53 target genes sestrin1 and
sestrin2 connect genotoxic stress and mTOR signaling.
Cell 134: 451–460.
Bursch W, Taper HS, Laver B and Schulte-Hermann R
(1985) Quantitative histological and histochemical stud-
ies on the occurrence and stages of controlled cell death
(apoptosis) during regression of liver hyperplasia.
Virchows Archiv-B Cell Pathology 50: 153–166.
Cao Y, Klionsky DJ (2007) Physiological functions of
Atg6/Beclin1: a unique autophagy-related protein. Cell
Research 17: 839–849.
Chan E, KOchl R and Tooze SA (2006) Cell biology and
biochemistry of autophagy. In: Deretic V (ed) Autop-
hagy in Immunity and Infection. Weinheim, Germany:
Wiley-VCH, pp. 19–49.
Chargui A, Zerki S, Jacquillet G, Rubera I, Ilie M, Belaid
A, et al. (2011) Cadmium-induced autophagy in rat kid-
ney: an early biomarker of subtoxic exposure. Toxicolo-
gical Sciences 121: 31–42.
Crighton D, Wilkinson S and Ryan KM (2007) DRAM
links autophagy to p53 and programmed cell death.
Autophagy 3: 72–74.
Crighton D, Wilkinson S, Prey JO, Syed N, Smith P,
Harrison PR, et al. (2006) DRAM, a p53-induced
modulator of autophagy, is critical for apoptosis. Cell
126: 121–134.
8 Toxicology and Industrial Health
at UNIV CALIFORNIA SAN DIEGO on October 6, 2012tih.sagepub.comDownloaded from

Dong Z, Wang L, Xu J, Li Y, Zhang Y, Zhang S, et al.
(2009) Promotion of autophagy and inhibition of apop-
tosis by low concentrations of cadmium in vascular
endothelial cells. Toxicology In Vitro 23: 105–110.
Eisenberg-Lerner A, Bailik S, Simon HU and Kimchi A
(2009) Life and death partners: apoptosis, autophagy
and the cross-talk between them. Cell Death and Differ-
entiation 16: 966–975.
Elmore SP, Qian T, Grissom SF and Lemasters JJ (2001)
The mitochondrial permeability transition initiates
autophagy in rat hepatocytes. FASEB Journal 15:
2286–2287.
Feng Z, Zhang H, Levine AJ and Jin S (2005) The coordi-
nate regulation of the p53 and mTOR pathways in cells.
Proceedings of National Academy of Sciences USA 102:
8204–8209.
Flora SJS, Mittal M and Mehta A (2008) Heavy metal
induced oxidative stress and its possible reversal by che-
lation therapy. Indian Journal of Medical Research 128:
501–523.
Gonzalez-Polo RA, Boya P, Pauleau AL, Jalil A, Larochette
N, Souquere S, et al. (2005) The apoptosis/autophagy par-
adox: autophagic vacuolization before apoptotic death.
Journal of Cell Science 118: 3091–3102.
Green DR, Chipuk JE (2006) p53 and metabolism: inside
the TIGAR. Cell 126: 30–32.
Hamasaki M, Noda T, Baba M and Ohsumi Y (2005) Star-
vation triggers the delivery of the endoplasmic reticu-
lum to the vacuole via autophagy in yeast. Traffic 6:
56–65.
Hanada T, Noda NN, Satomi Y, Ichimura Y, Fujioka Y,
Takao T, et al. (2007) The Atg12-Atg5 conjugation
has a novel E3-like activity for protein lipidation in
autophagy. Journal of Biological Chemistry 282:
37298–37302.
Inglis JK (1980) Introduction to Laboratory Animal
Science and Technology. Oxford, UK: Pergamon Press.
Iwata J, Ezaki J, Komatsu M, Yokota S, Ueno T, Tanida I,
et al. (2006) Excess peroxisomes are degraded by autop-
hagic machinery in mammals. Journal of Biological
Chemistry 281: 4035–4041.
James SJ, Muskhelishvili L (1994) Rates of apoptosis and
proliferation vary with caloric intake and may influence
incidence of spontaneous hepatoma C57 BL/6 x C3HF1
mice. Cancer Research 54: 5508–5510.
Kanzawa T, Kondo Y, Ito H, Kondo S and Germano I
(2003) Induction of autophagic cell death in malignant
glioma cells by arsenic trioxide. Cancer Research 63:
2103–2108.
Kissova I, DeYeu M, Manon S and Camougrand N (2004)
Uth1p is involved in the autophagic degradation of
mitochondria. Journal of Biological Chemistry 279:
39068–39074.
Klionsky DJ, Emr SD (2000) Autophagy as a regulated
pathway of cellular degradation. Science 290:
1717–1721.
Klionsky DJ, Cuervo AM and Seglen PO (2007) Methods
for monitoring autophagy from yeast to human. Autop-
hagy 3: 181–206.
Koopman G, Reutelingsperger CP, Kuijten GA, Keehen
RM, Pals ST and van-Oers MH (1994) Annexin V for
flow cytometric detection of phosphatidylserine expres-
sion on B cells undergoing apoptosis. Blood 84:
1415–1420.
Kopitz J, Kisen GØ, Gordon PB, Bohley P and Seglen PO
(1990) Nonselective autophagy of cytosolic enzymes by
isolated rat hepatocytes. Journal of Cell Biology 111:
941–953.
Lecoeur H, Ledru E, Prevost MC and Gougeon ML (1997)
Strategies for phenotyping apoptotic peripheral human
lymphocytes comparing ISNT, annexin-V and 7-AAD
cytofluorometric staining methods. Journal of Immuno-
logical Methods 209: 111–123.
Levine B, Klionsky DJ (2004) Development by self-
digestion: molecular mechanisms and biological func-
tions of autophagy. Developmental Cell 6: 463–477.
Lowry OH, Rosebrough NJ, Farr AL and Randall RJ (1951)
Measurement of protein with the folin phenol reagent.
Journal of Biological Chemistry 193: 265–275.
Martinet W, De-Meyer GR, Andries L, Herman AG and
Kockx MM (2006) In situ detection of starvation-
induced autophagy. Journal of Histochemistry Cyto-
chemistry 54: 85–96.
Mehrpour M, Esclatine A, Beau I and Codogno P (2010)
Overview of macroautophagy regulation in mammalian
cells. Cell Research 20:748–762.
Mizushima N, Levine B, Cuervo AM and Klionsky DJ
(2008) Autophagy fights disease through cellular self-
digestion. Nature 451: 1069–1074.
Mizushima N, Yamamoto A, Hatano M, Kobayashi Y,
Kabeya Y, Suzuki K, et al. (2001) Dissection of autop-
hagosome formation using Apg5-deficient mouse
embryonic stem cells. Journal of Cell Biology 152:
657–668.
Ray A, Roy S, Agarwal S and Bhattacharya S (2008) As2O3
toxicity in rat hepatocytes: manifestation of caspase-
mediated apoptosis. Toxicology and Industrial Health
24: 643–653.
Roy S, Bhattacharya S (2006) Arsenic-induced histopathol-
ogy and synthesis of stress proteins in liver and kidney
of channa punctatus. Ecotoxicology and Environmental
Safety 65: 218–229.
Chatterjee et al. 9
at UNIV CALIFORNIA SAN DIEGO on October 6, 2012tih.sagepub.comDownloaded from

Shenker BJ, Guo TL and Shapiro IM (2000) Mercury-
induced apoptosis in human lymphoid cells: evidence
that the apoptotic pathway is mercurial species depen-
dent. Environmental Research 84: 89–99.
Shimano K, Satake M, Okaya A, Kitanaka J, Kitanaka N
and Takemura M (2003) Hepatic oval cell have the side
population phenotype defined by expression of ATP
binding cassette transporter ABCG2/BCRP1. American
Journal of Pathology 163: 3–9.
Streit B (1992) Bioaccumulation process in ecosystems.
Experientia 48: 955–970.
Suzuki K, Kirisako T, Kamada Y, Mizushima N, Noda T
and Ohsumi Y (2001) The pre-autosomal structure
organized by concentrated functions of APG genes is
essential for autophagosome formation. EMBO Journal
20: 5971–5981.
Wang CW, Klionsky DJ (2003) The molecular mechanism
of autophagy. Molecular Medicine 9: 65–76.
Wang Y, Singh R, Xiang Y and Czaja MJ (2010) Macroau-
tophagy and chaperone-mediated autophagy are
required for hepatocytes resistance to oxidant stress.
Hepatology 56: 266–277.
Yu L, Wan F, Dutta S, Welsh S, Liu Z, Freundt E, et al.
(2006) Autophagic programmed cell death by selective
catalase degradation. Proceedings of the National
Academy of Sciences of the USA 103: 4952–4957.
10 Toxicology and Industrial Health
at UNIV CALIFORNIA SAN DIEGO on October 6, 2012tih.sagepub.comDownloaded from
Recommended


