Mapping Small-World Properties through Developmentin the Human Brain: Disruption in SchizophreniaDardo Tomasi1*, Nora D. Volkow1,2
1 National Institute on Alcohol Abuse and Alcoholism, Bethesda, Maryland, United States of America, 2 National Institute on Drug Abuse, Bethesda, Maryland, United
States of America
Abstract
Evidence from imaging studies suggests that the human brain has a small-world network topology that might be disruptedin certain brain disorders. However, current methodology is based on global graph theory measures, such as clustering, C,characteristic path length, L, and small-worldness, S, that lack spatial specificity and are insufficient to identify regional brainabnormalities. Here we propose novel ultra-fast methodology for mapping local properties of brain network topology suchas local C, L and S (lC, lL and lS) in the human brain at 3-mm isotropic resolution from ‘resting-state’ magnetic resonanceimaging data. Test-retest datasets from 40 healthy children/adolescents were used to demonstrate the overall goodreliability of the measures across sessions and computational parameters (intraclass correlation . 0.5 for lC and lL) and theirlow variability across subjects (, 29%). Whereas regions with high local functional connectivity density (lFCD; local degree)in posterior parietal and occipital cortices demonstrated high lC and short lL, subcortical regions (globus pallidus, thalamus,hippocampus and amygdala), cerebellum (lobes and vermis), cingulum and temporal cortex also had high, lS,demonstrating stronger small-world topology than other hubs. Children/adolescents had stronger lFCD, higher lC andlonger lL in most cortical regions and thalamus than 74 healthy adults, consistent with pruning of functional connectivityduring maturation. In contrast, lFCD, lC and lL were weaker in thalamus and midbrain, and lL was shorter in frontal corticalregions and cerebellum for 69 schizophrenia patients than for 74 healthy controls, suggesting exaggerated pruning ofconnectivity in schizophrenia. Follow up correlation analyses for seeds in thalamus and midbrain uncovered lower positiveconnectivity of these regions in thalamus, putamen, cerebellum and frontal cortex (cingulum, orbitofrontal, inferior frontal)and lower negative connectivity in auditory, visual, motor, premotor and somatosensory cortices for schizophrenia patientsthan for controls, consistent with prior findings of thalamic disconnection in schizophrenia.
Citation: Tomasi D, Volkow ND (2014) Mapping Small-World Properties through Development in the Human Brain: Disruption in Schizophrenia. PLoS ONE 9(4):e96176. doi:10.1371/journal.pone.0096176
Editor: Gaolang Gong, Beijing Normal University, China
Received January 8, 2014; Accepted April 4, 2014; Published April 30, 2014
This is an open-access article, free of all copyright, and may be freely reproduced, distributed, transmitted, modified, built upon, or otherwise used by anyone forany lawful purpose. The work is made available under the Creative Commons CC0 public domain dedication.
Funding: This work was accomplished with support from the National Institutes of Alcohol Abuse and Alcoholism (2RO1AA09481). The funders had no role instudy design, data collection and analysis, decision to publish, or preparation of the manuscript.
Competing Interests: The authors have declared that no competing interests exist.
* E-mail: [email protected]
Introduction
Graph theory postulates that real networks have a ‘small-world’
topology with high clustering and short path length that ensures
within-network maximal communication rate with minimal wiring
cost [1]. The human brain is a complex network of highly
interconnected regions and an example of a real network with
small-world topology [2]. Its complex organization can be
characterized by two meaningful global parameters, clustering
and path length [3–6], that can reveal global functional and/or
structural abnormalities in the human brain [7]. However, global
brain parameters lack regional specificity and might have limited
impact for the identification of dysfunctional brain regions and for
monitoring therapeutic responses in specific networks. Here we
propose novel voxelwise methodology for mapping local small-
world network properties in the human brain.
Consistent with the small-world network topology [1], the
architecture of the brain include few ‘‘hubs’’ (nodes with high
connectivity degree) interconnecting distributed local networks,
and abundant weakly connected nodes [7]. Brain functional
connectivity computed from magnetic resonance imaging (MRI)
data collected in resting conditions demonstrated the distribution
of functional connectivity hubs in the human brain [8–11], and is a
powerful method for studying the topology of the brain in health
and disease conditions [10,12,13] with high spatial resolution (3-
mm isotropic). However, the lack of additional voxelwise graph
theory measures (clustering and path length) limits our interpre-
tation of abnormalities in the strength of the connectivity hubs in
psychiatric populations.
Schizophrenia is characterized by abnormal structural and
functional connectivity between distributed brain networks, which
results in disconnection of neuronal processing [14–16]. Func-
tional connectivity studies in 12 schizophrenia patients that
assessed network topology from 72 anatomical regions-of-interest
in the brain reported reduced clustering and small-worldness, a
measure that gauges the strength of the small-world characteristics
of a network [17], in schizophrenia [18]. Similar results were
reported for 24 schizophrenia patients in studies of brain topology
that used 75 functional regions-of-interest identified by indepen-
dent component analysis [19]. We hypothesized that voxelwise
functional connectivity studies at 3-mm spatial resolution in
schizophrenia patients would reveal abnormal degree, clustering
and characteristic path length in specific brain regions.
PLOS ONE | www.plosone.org 1 April 2014 | Volume 9 | Issue 4 | e96176
Here, we propose a voxelwise approach to map graph theory
properties in the brain. Specifically, we show that functional
connectivity density (FCD) mapping [11] can be extended to map
the characteristic path length, clustering and small-worldness of
the local networks functionally connected to each brain voxel.
Since the default mode network (DMN) and visual cortex are
highly interconnected with other brain regions and include the
most prominent connectivity hubs in the brain [20] we hypoth-
esized uneven spatial distributions with local maxima in DMN and
in the visual cortex for the graph theory metrics. We assessed the
reliability of the graph theory metrics across subjects, sessions and
parameters using intraclass correlation (ICC) and test-retest MRI
datasets from 40 healthy children/adolescents. Since functional
connectivity can detect brain maturation changes from childhood
to adulthood [21], we tested the sensitivity of the graph theory
measures to brain development with the hypothesis that children/
adolescents would show lower local FCD (lFCD), clustering (lC),
characteristic path length (lL) and small-worldness (lS) than adults.
To test the sensitivity of the method to brain pathology we assessed
differences in lFCD, lC, lL and lS between schizophrenia patients
and healthy control subjects using statistical parametric mapping.
Based on prior reports of disrupted brain organization in
schizophrenia [22,23] we hypothesized that patients would show
lower lFCD and lC in subcortical and prefrontal brain regions than
controls.
Methods
Ethics StatementThis study is based on existing datasets that were distributed
with the approval of the corresponding Institutional Review
Boards (IRB) and in compliance with the Health Insurance
Portability and Accountability (HIPAA) privacy rules via the
International Neuroimaging Data-sharing Initiative (http://
fcon_1000.projects.nitrc.org/). The authors did not have any role
in the collection of the data nor had access to any identifying
information from the participants. The test-retest study included
40 children from the WashU research site of the ADHD-200
dataset (http://fcon_1000.projects.nitrc.org/indi/adhd200/),
which gave assent with parental written informed consent in
accordance with the guidelines and approval of the Washington
University Human Studies Committee. The schizophrenia study
included 143 adult subjects from the COBRE dataset (http://
fcon_1000.projects.nitrc.org/indi/retro/cobre.html), which gave
written informed consent in accordance with the Human Subjects
Research Review Committee (HRRC) of the University of New
Mexico Health Sciences Center.
SubjectsThe test-retest studies included 40 healthy young subjects (age:
136 4 years; 17 females), each contributing with 3 resting state
scans that were collected in a 3T Siemens Magnetom Trio MRI
scanner while the subjects kept their eyes open using a single-shot
gradient echo planar (EPI) imaging pulse sequence with 64 phase
encodings, 132 time points, 4-mm isotropic resolution, 2500 ms
repetition time (TR), 27 ms echo time (TE) and 32 axial slices
covering the whole brain. All subjects were recruited and screened
at St. Louis Children’s Hospital, Washington University in Saint
Louis.
The schizophrenia study included 69 patients (age: 38 6 14
years; 14 females) and 74 (age: 36 6 12 years; 23 females) control
adult subjects. The corresponding MRI time series had 150 time
points and were collected in a 3T Siemens Magnetom Trio MRI
scanner using single-shot gradient EPI (TE/TR = 29/2000ms;
3.75 6 3.75 6 4 mm3 resolution; 32 slices). All subjects were
recruited and screened at the University of New Mexico by
personnel of the Mind Research Network. Subjects were excluded
if they had; history of neurological disorder, history of mental
retardation, history of severe head trauma with more than 5
minutes loss of consciousness, history of substance abuse or
dependence within the last 12 months. Diagnostic information was
collected using the Structured Clinical Interview for DSM
Disorders (SCID). Patients were diagnosed as paranoid (40),
residual (12), schizoaffective (5), unspecified (8), and with co-
morbidity [24,25] [bipolar I disorder (1) and senile delirium (1)].
Unfortunately the database did not contain information regarding
the medication status of the schizophrenia patients.
Image preprocessingThe statistical parametric mapping package SPM8 (Wellcome
Trust Centre for Neuroimaging, London, UK) was used for image
realignment and spatial normalization to the stereotactic space of
the Montreal Neurological Institute (MNI). For this purpose a 12-
parameters affine transformation with medium regularization, 16-
nonlinear iterations, voxel size of 36363 mm3 and the EPI.mnc
template included in the SPM package were used. Subsequent
preprocessing steps were carried out using IDL (ITT Visual
Information Solutions, Boulder, CO).
Time points that were severely contaminated with motion were
removed using a ‘‘scrubbing’’ method [26]. Specifically, we
computed the root mean square variance across voxels (DVARS)
of the differences in % BOLD intensity, Ii, between adjacent
time points, DVARSi~
ffiffiffiffiffiffiffiffiffiffiffiffiffiffiffiffiffiffiffiffiffiffiffiffiffiffiS Ii{Ii{1½ �2T
q, where the brackets
denote averaging over imaging voxels. For every time
point, i, we also computed framewise displacements,
FDi~ Ddixj jz Ddiy
�� ��z Ddizj jzr Daij jzr Dbij jzr Dcij j, from head
translations (dix,diy,diz) and rotations (ai,bi,ci), the six image
realignment parameters from SPM. A radius r = 50 mm,
approximately the mean distance from the center of the MNI
space to the cortex, was used to convert angle rotations to
displacements. The average head displacement across time points
was significantly higher for adults than for children and for
schizophrenia patients than for controls (,FD. = 0.26 6 0.16
for patients, 0.17 6 0.10 for controls and 0.07 6 0.04 for children;
P , 0.0002). Image time points with FDi . 0.5 mm and DVARSi
. 0.5% were considered potentially contaminated with motion
artifacts and excluded from the time series [26]. The scrubbing
algorithm excluded a maximum of 5 time points per time series (,
3% of the time points).
The global signal intensity was normalized across time points
and the time-varying realignment parameters (3 translations and 3
rotations) were used in a multilinear regression approach to
minimize motion related fluctuations in the MRI signals [11].
Magnetic field drifts of the scanner and physiologic noise of high
frequency components were minimized using 0.01–0.10 Hz band-
pass temporal filtering [11]. Voxels with poor signal-to-noise as a
function of time (SNRt , 50) were eliminated to minimize voxels
with excessive susceptibility-related signal-loss artifacts. These
preprocessed MRI time series were saved in hard drive for
subsequent analyses.
Local degreeThe strength of the functional connectivity, qij , between voxels i
and j in the brain, was assessed with Pearson correlations, and a
correlation threshold of RT1 = 0.40 was used to compute binary
coefficients, Aij~1uqijwRT1
0uqijƒRT1
�. In this study, the selected
Mapping Small World Properties
PLOS ONE | www.plosone.org 2 April 2014 | Volume 9 | Issue 4 | e96176
correlation threshold ensures significant correlations between
time-varying signal fluctuations at P , 0.0005. Two additional
values, RT1 = 0.45 and 0.50, were used to assess the robustness of
the results as a function of different threshold criteria. The local
functional connectivity density (lFCD), which reflects the number
of neighbors in the local functional connectivity cluster,
Ki~P
Aij
� �local
, was computed in IDL using a ’growing’
algorithm [11]. Specifically, a voxel (xj) was added to the list of
voxels functionally connected with xi only if it was adjacent to a
voxel that was linked to xi by a continuous path of functionally
connected voxels and Aij~1. This calculation was repeated for all
voxels that were adjacent to voxels that belong to the list of voxels
functionally connected to xi in an iterative manner until no new
voxel could be added to the list. Then the calculation was initiated
for a different xi.
Local clustering and path lengthClustering is a property of densely interconnected groups of
voxels that reflects their functional segregation, i.e. their ability to
perform specialized neural processing in the brain [27]. A second
correlation threshold, RT2 = 0.65 . RT1, was used to construct
the binary undirected connectivity matrix, aijk~
1uqjkwRT2
0uqjkƒRT2
�,
which was used to estimate the clustering, path length and small-
worldness of the local network functionally connected to voxel i.
Two additional values, RT2 = 0.70 and 0.75, were used to assess
the robustness of these measures as a function of different
threshold criteria. Note that the (Ki 6 Ki) ai adjacency matrix
has m edges (aijk~1) representing significant interactions
(qjkwRT2) between nodes in the local network of voxel i.
The number of ‘‘triangles’’ (i.e. sets of three neighbor nodes
interconnected by edges) in the vicinity of j-node is a measure of
the segregation of the network [27]. The number of triangles
within the network of voxel i was computed using the adjacency
matrix according to [27],
tij~
Xl,h[Ki
(aijla
ijhai
lh)
2; ð1Þ
from which the clustering coefficient for the local network
functionally connected to node i, lC(i), was computed in terms of
the degree (number of edges), kij , of each node in the local network
in analogy with the definition of clustering [1],
lC ið Þ~ 1
Ki
Xj[Ki
2tij
kij ki
j{1� �: ð2Þ
This measure of segregation quantify the presence of clusters/
modules surrounding each voxel within the local network
functionally connected to voxel i.
The shortest path length or distance between two nodes (l and j)
of the local network of voxel i was computed using the adjacency
matrix as the minimum number of edges that must be traversed to
get from one node to the other [27],
dilj~
Xaiuv [ l <j
g
aiuv: ð3Þ
Where l <g
j is the shortest geodesic path between nodes l and j.
The characteristic path length of the local network functionally
connected to voxel i, lL(i), was computed as the mean value of the
shortest path length over all node pairs in the local network in
analogy with the definition of characteristic path length [1],
lL ið Þ~ 1
Ki Ki{1ð ÞX
j,l [ Kij=l
dijl : ð4Þ
Note that lLi measures of the functional integration of the local
networks, which is predominantly influenced by long paths.
Local small-worldnessFormally, a real network is considered to be a small-world
network if it has a similar path length but greater clustering than
an equivalent random graph, constructed with a uniform
probability and the same numbers of nodes, K, and edges, m, as
the real network. We computed the local small-worldness in
analogy to the definition small-worldness [17],
lS ið Þ~lC ið Þ
lC ið Þð ÞrandlL ið Þ
lL ið Þð Þrand
; ð5Þ
of the local networks functionally connected to the brain voxels to
assess the small-world topology of the brain regions. Comparable
random graphs were constructed with the same Ki and mi as the
local network functionally connected to voxel i, using an IDL
uniform random number generator with Bays-Durham shuffling
[28]. Note that we mapped small-world properties in the brain by
computing lL, lC and lS for a total of 57,713 local networks (one
network per voxel in the gray matter) for each of the resting state
MRI scans in this study. The average computation time required
for the calculation of these graph theory metrics was 15 6 5
minutes per subject in a dual Xeon (X5680; 3.33GHz; 24 threads)
personal computer with 28 GB of random access memory running
64-bit Windows 7.
Intraclass correlationThe two-way mixed single measures intraclass correlation
coefficient (ICC) was used to assess the reliability of the lFCD,
lC, lL and lS maps. Specifically, the consistency of these graph
theory measures across all different raters (correlation thresholds
and resting-state sessions) was computed in terms of between-
subjects mean squares (BMS), residuals mean squares (EMS) and
the number of raters,
ICC 3,1ð Þ~ BMS{EMS
BMSz raters{1ð Þ � EMS; ð6Þ
using the IPN toolbox for test-retest reliability analysis of
imaging datasets (http://www.mathworks.com/matlabcentral/
Mapping Small World Properties
PLOS ONE | www.plosone.org 3 April 2014 | Volume 9 | Issue 4 | e96176
fileexchange/22122-ipn-tools-for-test-retest-reliability-analysis).
Independent ICC analyses were carried for each of the graph
theory measures, which included maps corresponding to all
subjects and sessions in the WashU dataset as well as maps
computed with different RT1 and RT2 thresholds. Note that the
ICC(3,1) voxel values range from 0 (no reliability) to 1 (perfect
reliability across sessions and thresholds) and that ICC(3,1) . 0.5
indicate significant reliability in this study. The (RT1, RT2) set that
maximized the whole-brain mean ICC(3,1) was used for subse-
quent analyses.
Seed-voxel correlationsStandard seed-voxel correlation analyses were used to compute
the functional connectivity (FC) for a bilateral thalamic seed (x =
66 mm, y = 23 mm, z = 0 mm; 54 voxels) and for a bilateral
seed in the substantia nigra (SN) of midbrain (x = 612 mm, y =
215 mm, z = 212 mm; 54 voxels), regions that demonstrated
lower lC, shorter lL and weaker lFCD in schizophrenic patients
compared to controls. These patterns were used to identify the
patients’ dysfunctional thalamocortical, mesocortical and nigro-
striatal connectivity pathways.
Statistical AnalysesThe maps (lFCD, lC, lL, lS and FC) were spatially smoothed (8-
mm) to minimize the variability of brain anatomy across subjects.
As in our previous studies [11], grand mean scaling was used to
control for differences in pulse sequence parameters and scanner
between the WashU dataset and the COBRE dataset, allowing us
to merge datasets from different research sites. Specifically, the
mean value of the connectivity metrics across voxels in the brain
and subjects was computed independently for the WashU dataset
and the COBRE dataset as well as for lFCD, lC, lL and lS. These
values were used as scaling factors for the corresponding individual
maps. Principal component analysis (PCA), using the covariance of
the imaging data without mean centering, was performed in IDL
to analyze the variability of the graph theory measures across
subjects.
Like Pearson correlation factors, which are distributed in the
[21, 1] interval, the lC coefficients are not suitable for statistical
purposes because they do not have normal distribution in the
interval (2‘, ‘). Specifically, lC coefficients lie in the interval [0,
1], and must be converted to standard scores, z, into the interval
(2‘, ‘) for statistical purposes. Correlation factors were converted
into standard scores using the Fisher transformation,
z~1
2ln
1zx
1{x
: ð7Þ
For lC coefficients, a Fisher-like transformation was obtained by
substituting x = 2 lC – 1 in Eq. [7],
z~1
2ln
lC
1{lC
: ð8Þ
This transformation was used to convert lC coefficients into
standard scores for statistical purposes. One-way ANOVA with
two zero-mean covariates (,FD. and gender) controlling for the
confounding effects of micro movement [29] and gender [30] was
used to assess differences in lFCD, lC, lL and lS between 40 healthy
children from the WashU dataset (resting-state session 1) and 74
healthy adults from the COBRE dataset. Similarly, one-way
ANOVA SPM8 model with two groups (74 healthy controls and
69 schizophrenia patients from the COBRE dataset) and three
zero-mean covariates controlling for the confounding effects of
micro movement, age [31] and gender was used to assess effects of
schizophrenia, independently for lFCD, lC, lL, and lS as well as for
thalamic and midbrain FC. For all voxelwise analyzes, statistical
significance was set as PFWE , 0.05, corrected for multiple
comparisons at the cluster level with the random field theory and a
family-wise error correction using a cluster-forming threshold P ,
0.0005 and a minimum cluster size of 10 voxels.
Region-of-interest (ROI) analysesThe population-average landmark- and surface-based atlas of
the cerebral cortex [32] and the Automated Anatomical Labeling
(AAL) atlas [33] provided in the installation package of the
MRIcron image viewer (http://www.nitrc.org/projects/mricron)
were used to identify cortical Brodmann areas (BA) and subcortical
regions (thalamus, caudate, putamen, globus pallidus, hippocam-
pus, parahippocampus, and amygdala, cerebellar lobes and
cerebellar vermis in the MNI stereotactic space. Average values
of lC, lL, lS and lFCD and their standard errors were computed
within these ROIs using a custom IDL program.
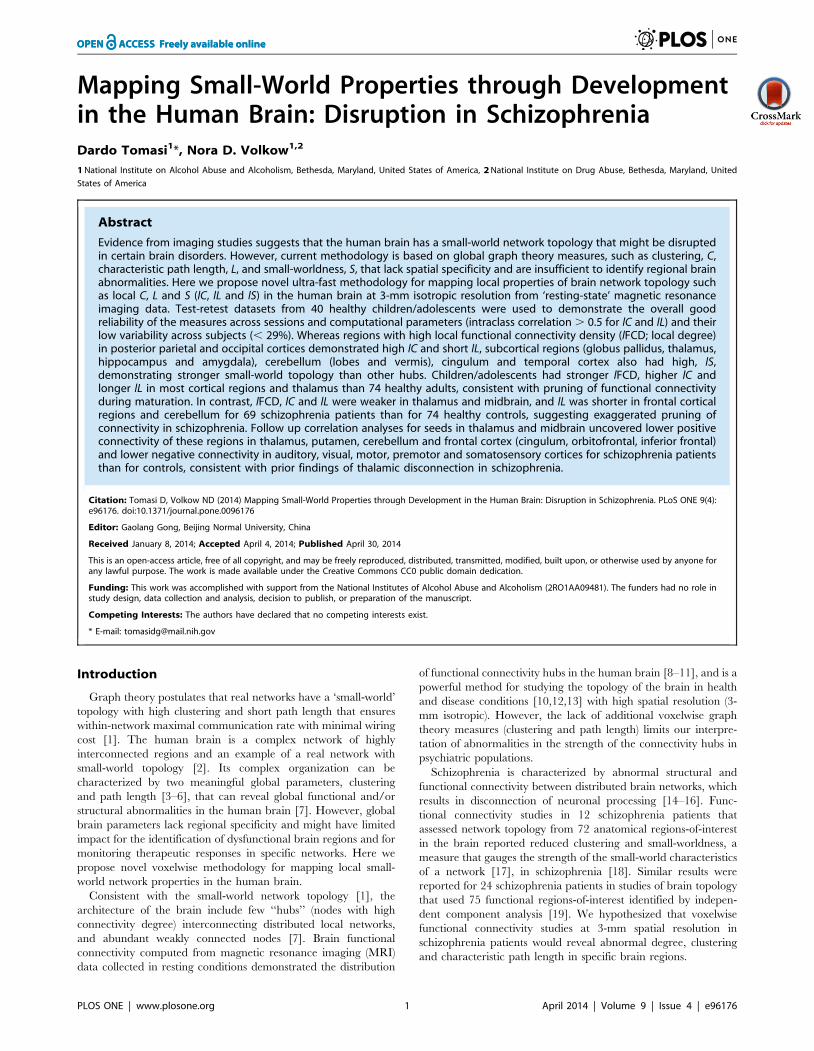
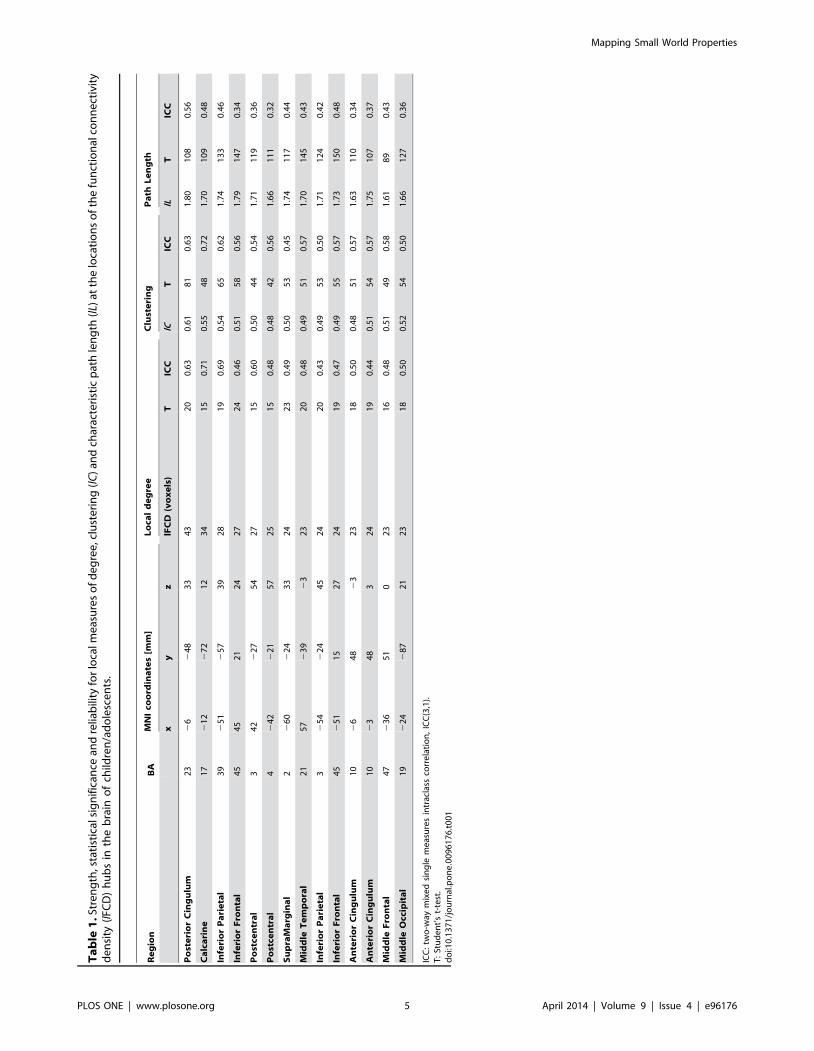
Figure 1. Statistical significance of graph theory metrics. T-scoremaps corresponding to local clustering, lC, characteristic path length, lL,and functional connectivity density (degree), lFCD, for 40 typicallydeveloping children, 74 healthy adults and 69 schizophrenia patients,superimposed on lateral and medial views of the human brain surface.Correlation thresholds: RT1 = 0. 50; RT2 = 0.65.doi:10.1371/journal.pone.0096176.g001
Mapping Small World Properties
PLOS ONE | www.plosone.org 4 April 2014 | Volume 9 | Issue 4 | e96176
Ta
ble
1.
Stre
ng
th,s
tati
stic
alsi
gn
ific
ance
and
relia
bili
tyfo
rlo
calm
eas
ure
so
fd
eg
ree
,clu
ste
rin
g(l
C)
and
char
acte
rist
icp
ath
len
gth
(lL)
atth
elo
cati
on
so
fth
efu
nct
ion
alco
nn
ect
ivit
yd
en
sity
(lFC
D)
hu
bs
inth
eb
rain
of
child
ren
/ad
ole
sce
nts
.
Re
gio
nB
AM
NI
coo
rdin
ate
s[m
m]
Lo
cal
de
gre
eC
lust
eri
ng
Pa
thL
en
gth
xy
zlF
CD
(vo
xe
ls)
TIC
ClC
TIC
ClL
TIC
C
Po
ste
rio
rC
ing
ulu
m2
32
62
48
33
43
20
0.6
30
.61
81
0.6
31
.80
10
80
.56
Ca
lca
rin
e1
72
12
27
21
23
41
50
.71
0.5
54
80
.72
1.7
01
09
0.4
8
Infe
rio
rP
ari
eta
l3
92
51
25
73
92
81
90
.69
0.5
46
50
.62
1.7
41
33
0.4
6
Infe
rio
rF
ron
tal
45
45
21
24
27
24
0.4
60
.51
58
0.5
61
.79
14
70
.34
Po
stce
ntr
al
34
22
27
54
27
15
0.6
00
.50
44
0.5
41
.71
11
90
.36
Po
stce
ntr
al
42
42
22
15
72
51
50
.48
0.4
84
20
.56
1.6
61
11
0.3
2
Su
pra
Ma
rgin
al
22
60
22
43
32
42
30
.49
0.5
05
30
.45
1.7
41
17
0.4
4
Mid
dle
Te
mp
ora
l2
15
72
39
23
23
20
0.4
80
.49
51
0.5
71
.70
14
50
.43
Infe
rio
rP
ari
eta
l3
25
42
24
45
24
20
0.4
30
.49
53
0.5
01
.71
12
40
.42
Infe
rio
rF
ron
tal
45
25
11
52
72
41
90
.47
0.4
95
50
.57
1.7
31
50
0.4
8
An
teri
or
Cin
gu
lum
10
26
48
23
23
18
0.5
00
.48
51
0.5
71
.63
11
00
.34
An
teri
or
Cin
gu
lum
10
23
48
32
41
90
.44
0.5
15
40
.57
1.7
51
07
0.3
7
Mid
dle
Fro
nta
l4
72
36
51
02
31
60
.48
0.5
14
90
.58
1.6
18
90
.43
Mid
dle
Occ
ipit
al
19
22
42
87
21
23
18
0.5
00
.52
54
0.5
01
.66
12
70
.36
ICC
:tw
o-w
aym
ixe
dsi
ng
lem
eas
ure
sin
trac
lass
corr
ela
tio
n,
ICC
(3,1
).T
:St
ud
en
t’s
t-te
st.
do
i:10
.13
71
/jo
urn
al.p
on
e.0
09
61
76
.t0
01
Mapping Small World Properties
PLOS ONE | www.plosone.org 5 April 2014 | Volume 9 | Issue 4 | e96176
Results
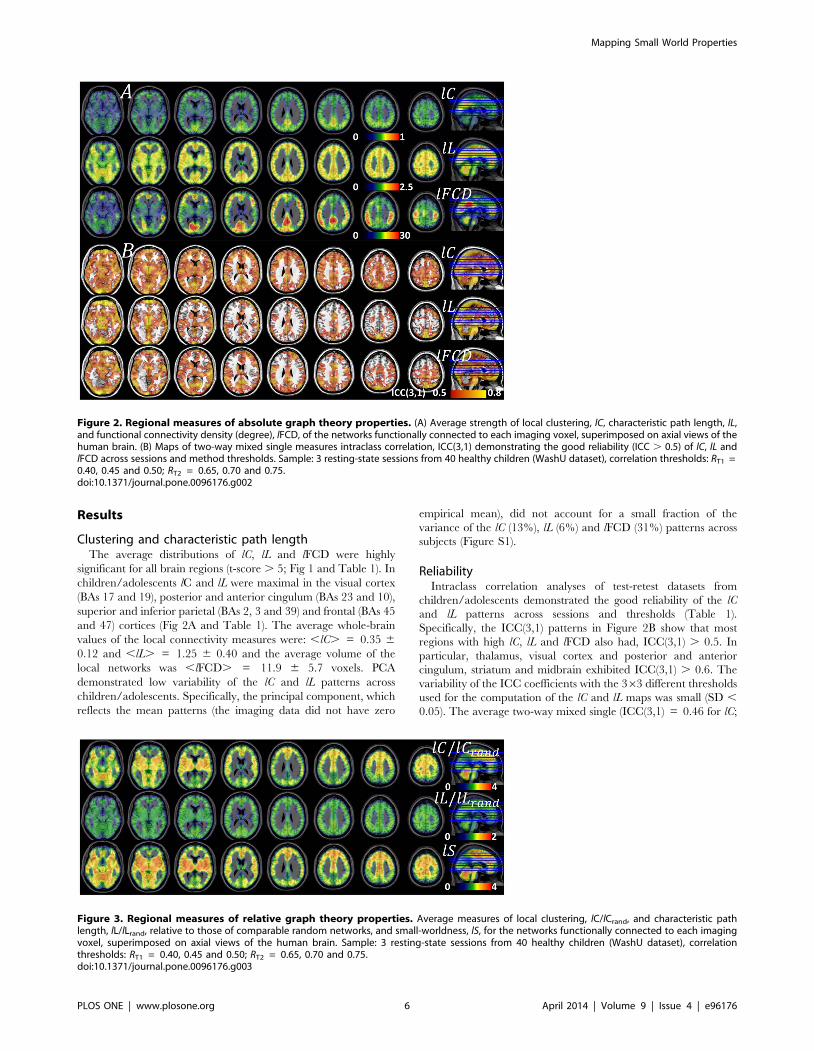
Clustering and characteristic path lengthThe average distributions of lC, lL and lFCD were highly
significant for all brain regions (t-score . 5; Fig 1 and Table 1). In
children/adolescents lC and lL were maximal in the visual cortex
(BAs 17 and 19), posterior and anterior cingulum (BAs 23 and 10),
superior and inferior parietal (BAs 2, 3 and 39) and frontal (BAs 45
and 47) cortices (Fig 2A and Table 1). The average whole-brain
values of the local connectivity measures were: ,lC. = 0.35 6
0.12 and ,lL. = 1.25 6 0.40 and the average volume of the
local networks was ,lFCD. = 11.9 6 5.7 voxels. PCA
demonstrated low variability of the lC and lL patterns across
children/adolescents. Specifically, the principal component, which
reflects the mean patterns (the imaging data did not have zero
empirical mean), did not account for a small fraction of the
variance of the lC (13%), lL (6%) and lFCD (31%) patterns across
subjects (Figure S1).
ReliabilityIntraclass correlation analyses of test-retest datasets from
children/adolescents demonstrated the good reliability of the lC
and lL patterns across sessions and thresholds (Table 1).
Specifically, the ICC(3,1) patterns in Figure 2B show that most
regions with high lC, lL and lFCD also had, ICC(3,1) . 0.5. In
particular, thalamus, visual cortex and posterior and anterior
cingulum, striatum and midbrain exhibited ICC(3,1) . 0.6. The
variability of the ICC coefficients with the 363 different thresholds
used for the computation of the lC and lL maps was small (SD ,
0.05). The average two-way mixed single (ICC(3,1) = 0.46 for lC;
Figure 2. Regional measures of absolute graph theory properties. (A) Average strength of local clustering, lC, characteristic path length, lL,and functional connectivity density (degree), lFCD, of the networks functionally connected to each imaging voxel, superimposed on axial views of thehuman brain. (B) Maps of two-way mixed single measures intraclass correlation, ICC(3,1) demonstrating the good reliability (ICC . 0.5) of lC, lL andlFCD across sessions and method thresholds. Sample: 3 resting-state sessions from 40 healthy children (WashU dataset), correlation thresholds: RT1 =0.40, 0.45 and 0.50; RT2 = 0.65, 0.70 and 0.75.doi:10.1371/journal.pone.0096176.g002
Figure 3. Regional measures of relative graph theory properties. Average measures of local clustering, lC/lCrand, and characteristic pathlength, lL/lLrand, relative to those of comparable random networks, and small-worldness, lS, for the networks functionally connected to each imagingvoxel, superimposed on axial views of the human brain. Sample: 3 resting-state sessions from 40 healthy children (WashU dataset), correlationthresholds: RT1 = 0.40, 0.45 and 0.50; RT2 = 0.65, 0.70 and 0.75.doi:10.1371/journal.pone.0096176.g003
Mapping Small World Properties
PLOS ONE | www.plosone.org 6 April 2014 | Volume 9 | Issue 4 | e96176
Ta
ble
2.
Stre
ng
than
dst
atis
tica
lsi
gn
ific
ance
for
loca
lclu
ste
rin
g(l
C)
and
char
acte
rist
icp
ath
len
gth
(lL)
,re
lati
veto
com
par
able
ran
do
mn
etw
ork
s,an
dfo
rlo
cals
mal
l-w
orl
dn
ess
(lS)
and
de
gre
efo
rth
eM
NI
coo
rdin
ate
so
flC
/lC
ran
dlo
cal
max
ima
fro
mch
ildre
n/a
do
lesc
en
ts.
Re
gio
nB
A/l
ob
eM
NI
coo
rdin
ate
s[m
m]
Clu
ste
rin
gP
ath
Le
ng
thS
ma
ll-w
orl
dn
ess
Lo
cal
de
gre
e
xy
zlC
/lC
ran
dT
lL/l
L ra
nd
TlS
TlF
CD
(vo
xe
ls)
T
Ce
reb
ell
um
IV–
V2
92
48
22
43
.32
41
.01
28
3.4
22
19
18
Th
ala
mu
s2
12
21
83
3.3
28
1.0
90
3.6
25
14
15
Ve
rmis
IV–
V6
25
42
24
3.4
23
1.1
13
63
.42
22
11
9
Ce
reb
ell
um
VI
92
63
22
43
.32
31
.01
08
3.5
22
19
18
Ce
reb
ell
um
VIII
22
12
51
23
63
.32
71
.08
93
.52
31
71
4
Ce
reb
ell
um
VI
18
25
42
30
3.2
21
1.0
11
03
.42
01
71
7
Th
ala
mu
s1
22
15
33
.22
51
.09
23
.52
21
41
6
Pa
race
ntr
al
42
12
23
36
33
.12
41
.01
22
3.3
21
18
18
Insu
la4
73
61
50
3.2
29
1.0
10
23
.52
61
22
6
Pa
race
ntr
al
62
15
21
26
63
.12
51
.01
17
3.3
23
17
16
Insu
la1
32
39
36
3.1
26
1.0
99
3.4
23
14
22
Pu
tam
en
27
26
63
.12
60
.99
23
.62
31
22
0
Insu
la1
33
90
63
.12
50
.99
43
.52
31
22
4
Ca
ud
ate
/Pu
tam
en
15
12
33
.02
61
.09
33
.22
31
51
9
lFC
D:F
un
ctio
nal
con
ne
ctiv
ity
de
nsi
ty.T
:Stu
de
nt’
st-
test
.Sam
ple
:Was
hU
(40
he
alth
ysu
bje
cts,
3‘r
est
ing
-sta
te’M
RIs
ess
ion
s).R
OI
anal
ysis
:Ave
rag
eva
lue
sin
9-m
mcu
bic
RO
Is(2
7vo
xels
)ce
nte
red
atth
eM
NI
coo
rdin
ate
so
fth
elo
cal
max
ima.
do
i:10
.13
71
/jo
urn
al.p
on
e.0
09
61
76
.t0
02
Mapping Small World Properties
PLOS ONE | www.plosone.org 7 April 2014 | Volume 9 | Issue 4 | e96176
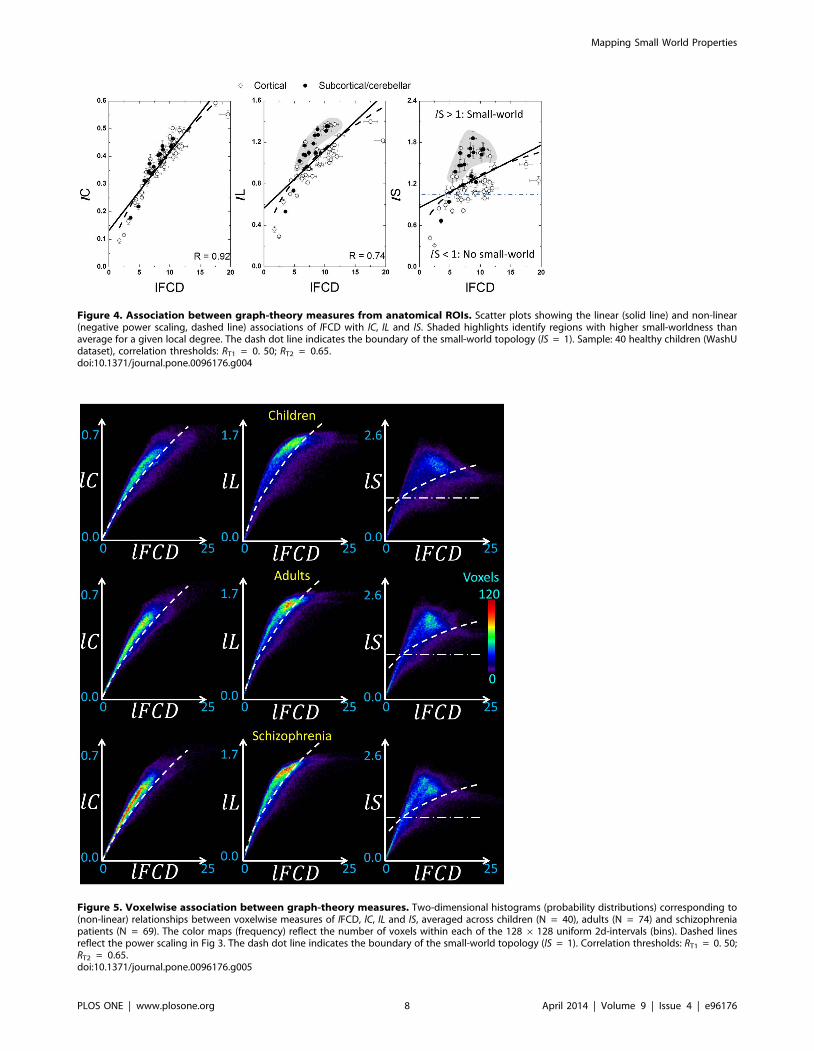
Figure 4. Association between graph-theory measures from anatomical ROIs. Scatter plots showing the linear (solid line) and non-linear(negative power scaling, dashed line) associations of lFCD with lC, lL and lS. Shaded highlights identify regions with higher small-worldness thanaverage for a given local degree. The dash dot line indicates the boundary of the small-world topology (lS = 1). Sample: 40 healthy children (WashUdataset), correlation thresholds: RT1 = 0. 50; RT2 = 0.65.doi:10.1371/journal.pone.0096176.g004
Figure 5. Voxelwise association between graph-theory measures. Two-dimensional histograms (probability distributions) corresponding to(non-linear) relationships between voxelwise measures of lFCD, lC, lL and lS, averaged across children (N = 40), adults (N = 74) and schizophreniapatients (N = 69). The color maps (frequency) reflect the number of voxels within each of the 128 6128 uniform 2d-intervals (bins). Dashed linesreflect the power scaling in Fig 3. The dash dot line indicates the boundary of the small-world topology (lS = 1). Correlation thresholds: RT1 = 0. 50;RT2 = 0.65.doi:10.1371/journal.pone.0096176.g005
Mapping Small World Properties
PLOS ONE | www.plosone.org 8 April 2014 | Volume 9 | Issue 4 | e96176
Ta
ble
3.
Stat
isti
cal
sig
nif
ican
cefo
rd
iffe
ren
ces
ing
rap
hth
eo
rym
eas
ure
sb
etw
ee
nch
ildre
nan
dad
ult
s.
Re
gio
nB
AM
NI
coo
rdin
ate
s[m
m]
Ch
ild
ren
.A
du
lts
[T]
xy
ZlC
lL*
lSlF
CD
Cu
ne
us
19
32
90
36
8.1
9.5
4.8
7.0
Po
stce
ntr
al3
30
23
96
62
.67
.9N
S3
.3
Th
alam
us
32
99
NS
6.3
4.7
NS
Sup
eri
or
Fro
nta
l1
12
21
66
04
.86
.24
.37
.3
Lin
gu
al1
92
36
29
32
21
NS
6.0
5.6
5.6
Sup
eri
or
OFC
11
15
66
23
4.3
5.9
3.1
5.5
Te
mp
ora
lP
ole
38
45
18
23
03
.85
.3N
S4
.0
Infe
rio
rT
em
po
ral
37
48
26
32
12
4.2
4.5
NS
3.0
Mid
dle
Fro
nta
l4
63
64
82
45
.15
.7N
S4
.7
Infe
rio
rFr
on
tal
45
48
27
21
5.6
6.3
NS
5.8
Infe
rio
rFr
on
tal
45
45
33
15
4.0
5.5
NS
4.6
Re
ctu
s1
16
36
21
55
.95
.7N
S3
.9
Re
ctu
s1
12
63
92
18
5.3
4.3
NS
5.0
Mid
dle
Fro
nta
l4
62
24
54
30
5.3
4.4
NS
5.4
Sam
ple
:4
0h
eal
thy
child
ren
and
74
he
alth
yad
ult
s.lC
:lo
cal
clu
ste
rin
g;
lL:l
oca
lch
arac
teri
stic
pat
hle
ng
th;
lS:
loca
lsm
all-
wo
rld
ne
ss;
lFC
D:
loca
ld
eg
ree
.*O
ne
way
AN
OV
A:
PF
WE
,0
.05
clu
ste
r-le
vel
corr
ect
ed
.SP
M8
mo
de
l:o
ne
-way
AN
OV
Aw
ith
ge
nd
er
and
mo
tio
nco
vari
ate
s.d
oi:1
0.1
37
1/j
ou
rnal
.po
ne
.00
96
17
6.t
00
3
Mapping Small World Properties
PLOS ONE | www.plosone.org 9 April 2014 | Volume 9 | Issue 4 | e96176
0.47 for lL; and 0.39 for lFCD) and average (ICC(3,k) = 0.71 for
lC; 0.70 for lL; and 0.62 for lFCD) measures in the whole brain
were maximal for RT1 = 0.50 and RT2 = 0.65.
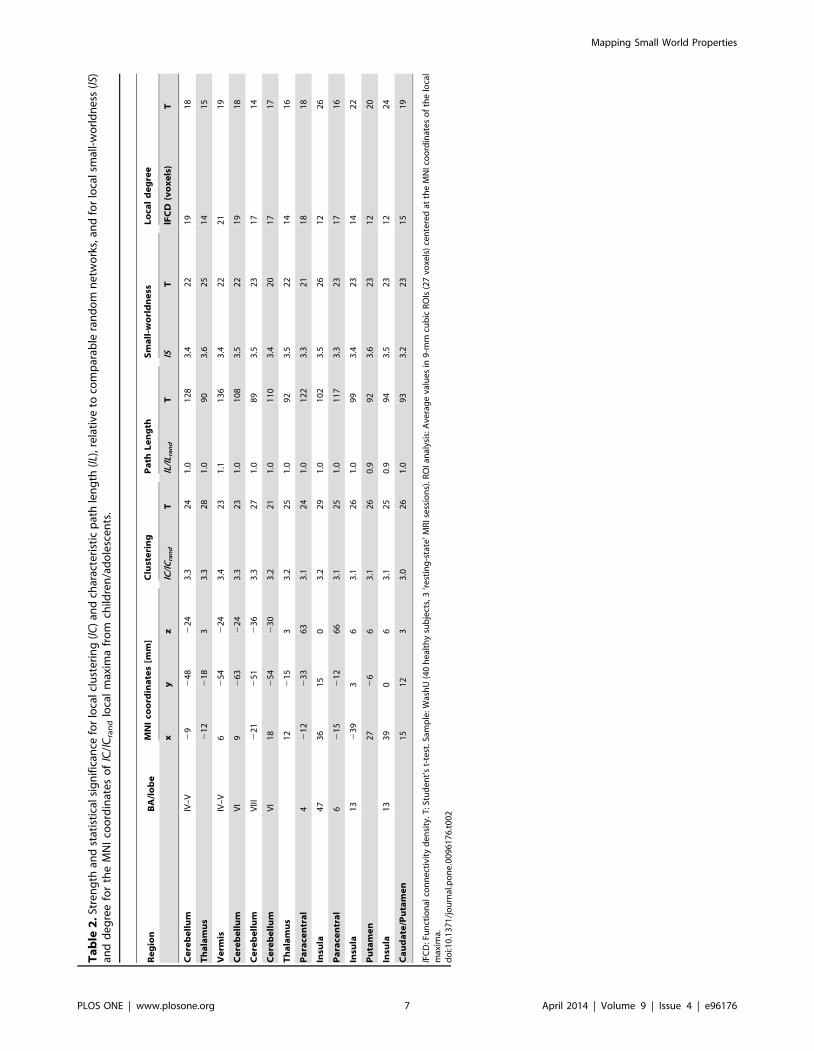
Brain networks versus random networks: Small-worldness.
In children/adolescents, the local functional connectivity
networks had higher clustering and similar characteristic path
length, compared to random networks with the same number of
nodes and edges. Precisely, lC=lCrand , was maximal for subcortical
regions (thalamus, caudate and putamen), cerebellum (hemi-
spheres and vermis) and insula, regions that demonstrated . 3
times higher clustering than the comparable random networks (Fig
3 and Table 2). Motor and premotor cortical regions also showed
higher clustering than the comparable random networks. Howev-
er, the strength of the relative characteristic path length, lL=lLrand ,
did not vary significantly across regions (Fig 3 and Table 2). Thus,
the path length of the local functional connectivity networks was
similarlL
lLrand
*1
and did not demonstrate statistically
significant lL-differences with comparable random networks in
any brain region. Therefore, the distribution of the small-
worldness peaked at the same regions as lC=lCrand (Fig 3 and
Table 2), revealing the small-world topology of the functional
connectivity in subcortical and cerebellar regions. lS had
significant variability across imaging voxels but low variability
across subjects, as demonstrated by PCA (the principal component
accounted for up to 87% of the variance of lS, Fig S2) and
Student’s t-tests (t-score . 20; Table 2). However, the reliability of
the lS patterns across sessions and thresholds [ICC(3,1) = 0.16
and ICC(3,k) = 0.79; whole-brain average values] was markedly
reduced compared to those of lC, lL and lFCD, probably reflecting
the low reliability of the lC=lCrand patterns [ICC(3,1) = 0.17 and
ICC(3,k) = 0.80; whole-brain average values]. On the other hand,
the reliability of the lL=lLrand patterns [ICC(3,1) = 0.57 and
ICC(3,k) = 0.97; whole-brain average values] was similar to that
of lC, lL and lFCD. It is noteworthy that the main lFCD hub in the
brain (ventral precuneus/posterior cingulum) had weaker lS than
other cortical, subcortical or cerebellar areas (Fig 3), suggestive of a
different pattern of organization in this brain region.
ROI analysesSince Pearson correlations across the hub regions (Table 1)
demonstrated a strong linear association between lC and lFCD [lC
= (0.0056 6 0.0008) 6 lFCD + (0.36 6 0.02); R = 0.91] and
between lL and lFCD [lL = (0.0054 6 0.0024)6 lFCD + (1.56 6
0.07); R , 0.55], we quantified lC, lL, lS and lFCD in
anatomically defined ROIs in cortical, subcortical and cerebellar
regions (Table S1). Linear regressions demonstrated the strong
association of lFCD with lC and lL [lC = (0.028 6 0.002)6 lFCD
+ (0.13 6 0.02); R = 0.91] and between lL and lFCD [lL =
(0.056 6 0.007) 6 lFCD + (0.56 6 0.06); R = 0.74] such that
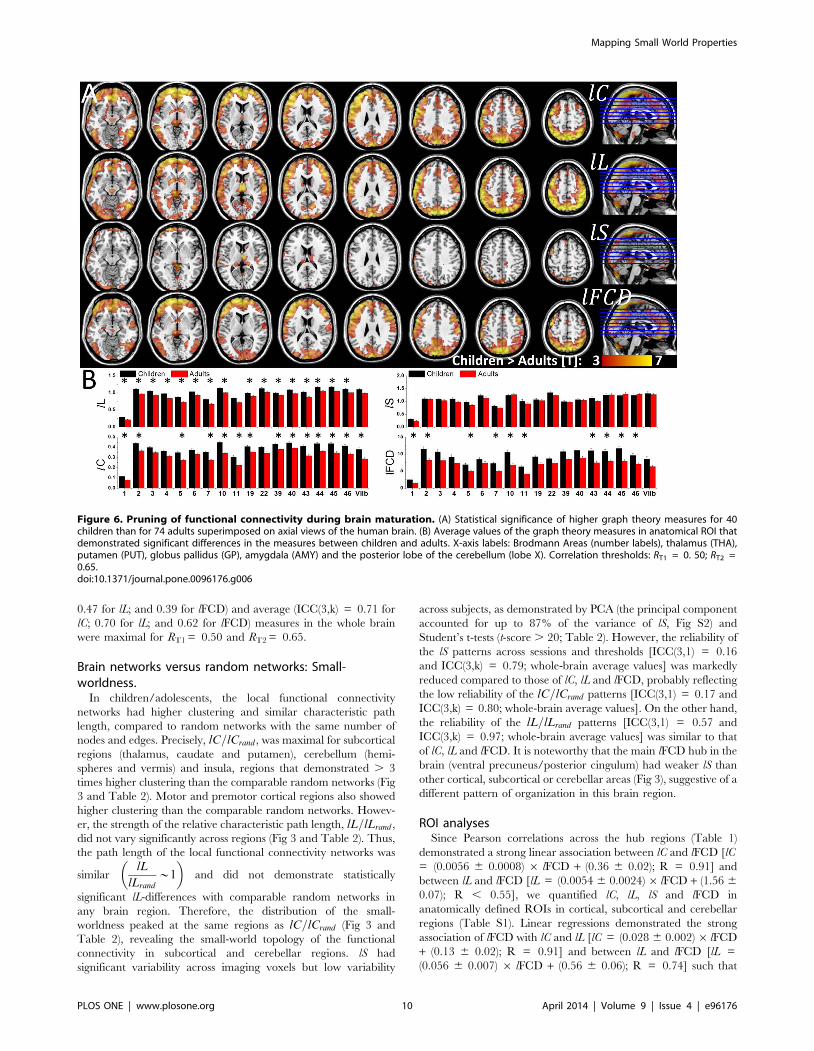
Figure 6. Pruning of functional connectivity during brain maturation. (A) Statistical significance of higher graph theory measures for 40children than for 74 adults superimposed on axial views of the human brain. (B) Average values of the graph theory measures in anatomical ROI thatdemonstrated significant differences in the measures between children and adults. X-axis labels: Brodmann Areas (number labels), thalamus (THA),putamen (PUT), globus pallidus (GP), amygdala (AMY) and the posterior lobe of the cerebellum (lobe X). Correlation thresholds: RT1 = 0. 50; RT2 =0.65.doi:10.1371/journal.pone.0096176.g006
Mapping Small World Properties
PLOS ONE | www.plosone.org 10 April 2014 | Volume 9 | Issue 4 | e96176
brain regions with stronger lFCD also exhibited higher lC and
longer lL (Fig 4). Note that non-linear power scaling curves also
fitted the lC vs. lFCD and the lL vs. lFCD datasets (R2 . 0.66; Fig
4, dashed lines). However, lFCD and lS showed much weaker
linear [lS = (0.045 6 0.01) 6 lFCD + (0.86 6 0.11); R = 0.44]
and non-linear (R2 = 0.29) associations; lS was maximal for globus
pallidus, which exhibited moderate lFCD and was not considered
a hub region in this study; other brain regions with high lS (. 1.4)
were cerebellum (lobes III, IV-V, VI, VIII, IX and vermis),
anterior and posterior cingulum (BA 23, 24 and 32), hippocampus,
amygdala and thalamus, posterior transverse temporal (BA 42),
retrosplenial and entorhinal cortices (BAs 30 and 34). Seven
cortical areas (BAs 24, 27, 32, 34, 38 and 42), 6 subcortical areas
(thalamus, putamen, globus pallidus, hippocampus, parahippo-
campus, amygdala) and the cerebellar lobes (III, IV-V, VI, VIII,
IX) and cerebellar vermis showed higher lS for a given lFCD than
the corresponding linear fit (Fig 4 shaded highlight), suggesting
special (perhaps small-world) network topology in these regions.
The same regions also showed longer lL for a given lFCD than the
corresponding linear fit. The 2-dimensional density functions
(histograms) in Fig 5 demonstrate similar relationships between
lFCD, lC, lL and lS at the voxel level.
AdultsThe spatial distributions of the lC, lL, lS and lFCD measures in
the healthy adults and schizophrenia patients were similar to those
in children/adolescents (Figs 5 and S3). Specifically, in healthy
adults and schizophrenia patients, lC and lFCD were high in
posterior cingulum/ventral percuneus, cerebellum, and visual and
parietal cortices; lL was high in cerebellum, posterior and anterior
cingulum, and inferior frontal and inferior parietal cortices; and lS
was high in putamen, insula, inferior and superior frontal cortex,
anterior cingulum cerebellum, thalamus and hippocampus (Tables
3, S2 and S3).
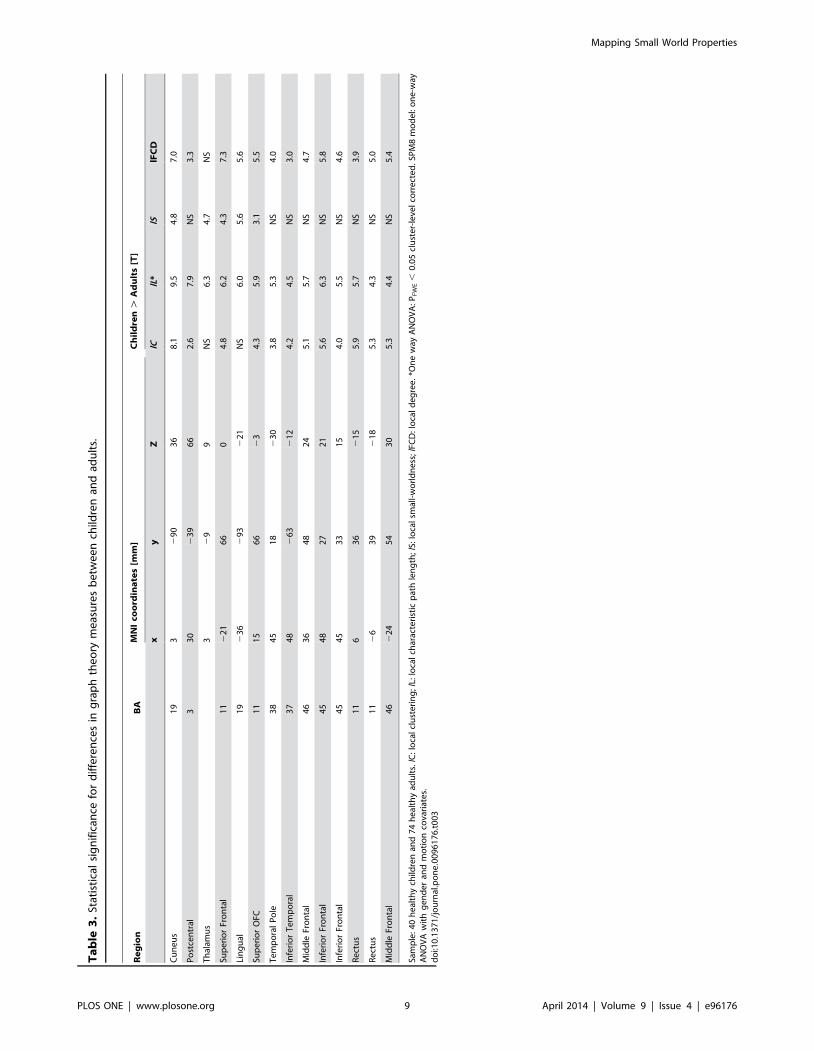
Brain maturationDirect comparison of graph theory metrics between children/
adolescents and adults showed that children/adolescents had
longer lL, higher lC and stronger lFCD in cortical regions and
longer lL and higher lC and lS in thalamus than adults (PFWE ,
0.05; Fig 6A and Table 3). However, group differences in lFCD for
the thalamus did not reach statistical significance. Similarly group
differences in lS for cuneus, postcentral, inferior, middle and
superior frontal gyri did not reach statistical significance. The
anatomical ROI analysis confirmed the higher lC, longer lL and
stronger lFCD in language areas (BAs 44, 45 and 46) for children/
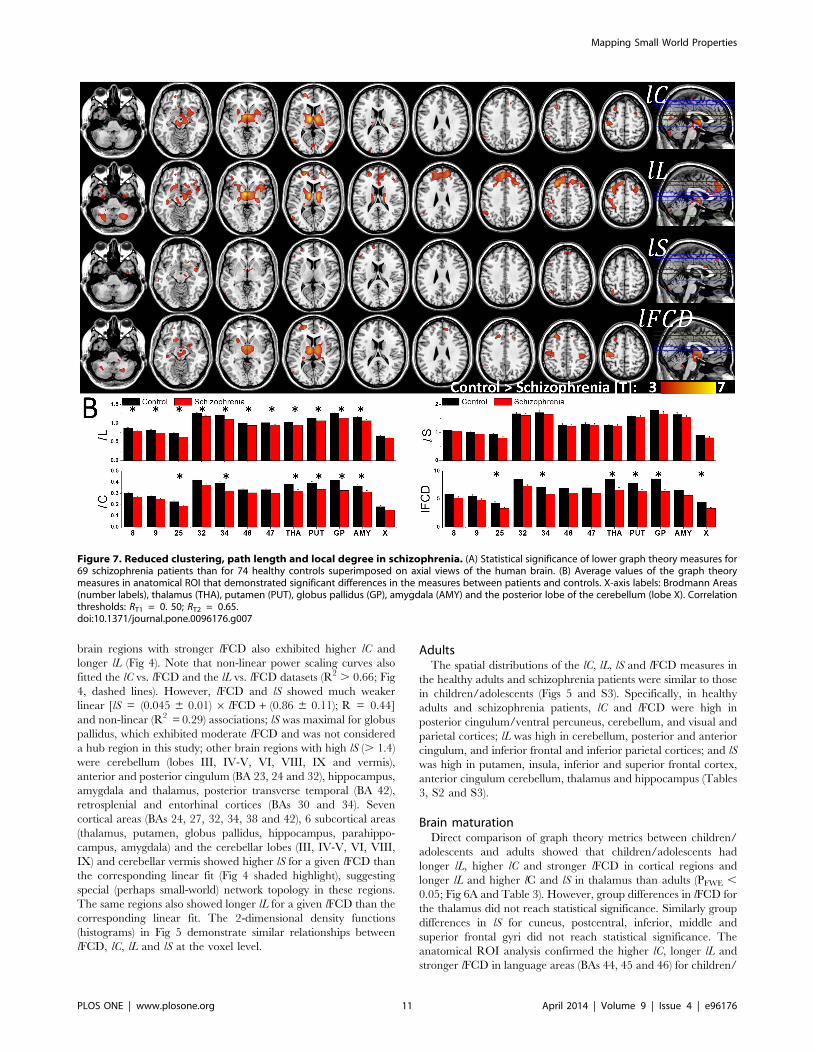
Figure 7. Reduced clustering, path length and local degree in schizophrenia. (A) Statistical significance of lower graph theory measures for69 schizophrenia patients than for 74 healthy controls superimposed on axial views of the human brain. (B) Average values of the graph theorymeasures in anatomical ROI that demonstrated significant differences in the measures between patients and controls. X-axis labels: Brodmann Areas(number labels), thalamus (THA), putamen (PUT), globus pallidus (GP), amygdala (AMY) and the posterior lobe of the cerebellum (lobe X). Correlationthresholds: RT1 = 0. 50; RT2 = 0.65.doi:10.1371/journal.pone.0096176.g007
Mapping Small World Properties
PLOS ONE | www.plosone.org 11 April 2014 | Volume 9 | Issue 4 | e96176
adolescents than for adults (Pc , 0.05, Bonferroni corrected for
multiple comparisons; Fig 6B). In addition, the average values in
somatosensoty (BAs 1, 2 and 5) and gustatory (BA 43) areas,
superior parietal (BA 7), frontopolar and rostrolateral prefrontal
(BA 10) cortices (lC, lL and lFCD), lateral parietal (BAs 39 and 40)
and association visual (BA 19) cortices (lC and lL), rectus (BA 11)
(lC and lFCD), motor (BA 4) and premotor (BA 6) and auditory
(BA 22, Heschl’s gyrus) areas (lL) and cerebellum (VIIb lobe; lC)
were higher for children/adolescents than for adults (Pc , 0.05;
Fig 6B). No anatomical region showed significant differences in
small-worldness between children/adolescents and adults.
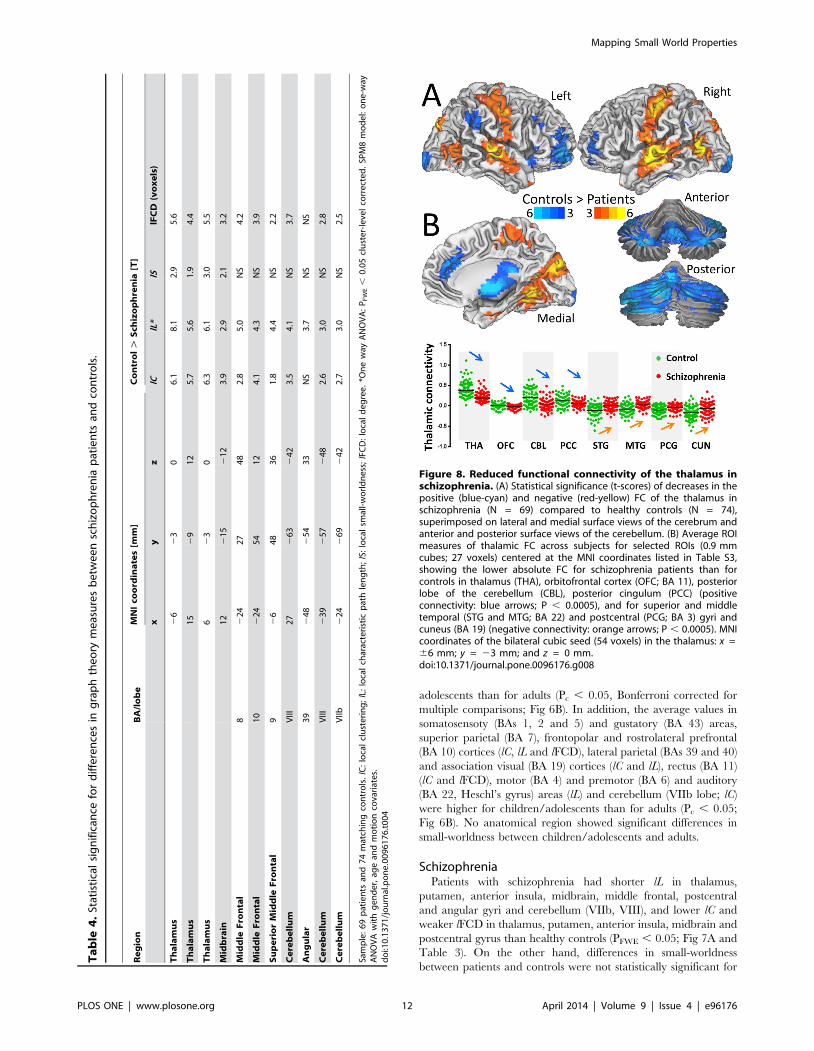
SchizophreniaPatients with schizophrenia had shorter lL in thalamus,
putamen, anterior insula, midbrain, middle frontal, postcentral
and angular gyri and cerebellum (VIIb, VIII), and lower lC and
weaker lFCD in thalamus, putamen, anterior insula, midbrain and
postcentral gyrus than healthy controls (PFWE , 0.05; Fig 7A and
Table 3). On the other hand, differences in small-worldness
between patients and controls were not statistically significant for
Figure 8. Reduced functional connectivity of the thalamus inschizophrenia. (A) Statistical significance (t-scores) of decreases in thepositive (blue-cyan) and negative (red-yellow) FC of the thalamus inschizophrenia (N = 69) compared to healthy controls (N = 74),superimposed on lateral and medial surface views of the cerebrum andanterior and posterior surface views of the cerebellum. (B) Average ROImeasures of thalamic FC across subjects for selected ROIs (0.9 mmcubes; 27 voxels) centered at the MNI coordinates listed in Table S3,showing the lower absolute FC for schizophrenia patients than forcontrols in thalamus (THA), orbitofrontal cortex (OFC; BA 11), posteriorlobe of the cerebellum (CBL), posterior cingulum (PCC) (positiveconnectivity: blue arrows; P , 0.0005), and for superior and middletemporal (STG and MTG; BA 22) and postcentral (PCG; BA 3) gyri andcuneus (BA 19) (negative connectivity: orange arrows; P , 0.0005). MNIcoordinates of the bilateral cubic seed (54 voxels) in the thalamus: x =66 mm; y = 23 mm; and z = 0 mm.doi:10.1371/journal.pone.0096176.g008
Ta
ble
4.
Stat
isti
cal
sig
nif
ican
cefo
rd
iffe
ren
ces
ing
rap
hth
eo
rym
eas
ure
sb
etw
ee
nsc
hiz
op
hre
nia
pat
ien
tsan
dco
ntr
ols
.
Re
gio
nB
A/l
ob
eM
NI
coo
rdin
ate
s[m
m]
Co
ntr
ol
.S
chiz
op
hre
nia
[T]
xy
zlC
lL*
lSlF
CD
(vo
xe
ls)
Th
ala
mu
s2
62
30
6.1
8.1
2.9
5.6
Th
ala
mu
s1
52
91
25
.75
.61
.94
.4
Th
ala
mu
s6
23
06
.36
.13
.05
.5
Mid
bra
in1
22
15
21
23
.92
.92
.13
.2
Mid
dle
Fro
nta
l8
22
42
74
82
.85
.0N
S4
.2
Mid
dle
Fro
nta
l1
02
24
54
12
4.1
4.3
NS
3.9
Su
pe
rio
rM
idd
leF
ron
tal
92
64
83
61
.84
.4N
S2
.2
Ce
reb
ell
um
VIII
27
26
32
42
3.5
4.1
NS
3.7
An
gu
lar
39
24
82
54
33
NS
3.7
NS
NS
Ce
reb
ell
um
VIII
23
92
57
24
82
.63
.0N
S2
.8
Ce
reb
ell
um
VIIb
22
42
69
24
22
.73
.0N
S2
.5
Sam
ple
:6
9p
atie
nts
and
74
mat
chin
gco
ntr
ols
.lC
:lo
cal
clu
ste
rin
g;
lL:
loca
lch
arac
teri
stic
pat
hle
ng
th;
lS:
loca
lsm
all-
wo
rld
ne
ss;
lFC
D:
loca
ld
eg
ree
.*O
ne
way
AN
OV
A:
PF
WE
,0
.05
clu
ste
r-le
vel
corr
ect
ed
.SP
M8
mo
de
l:o
ne
-way
AN
OV
Aw
ith
ge
nd
er,
age
and
mo
tio
nco
vari
ate
s.d
oi:1
0.1
37
1/j
ou
rnal
.po
ne
.00
96
17
6.t
00
4
Mapping Small World Properties
PLOS ONE | www.plosone.org 12 April 2014 | Volume 9 | Issue 4 | e96176
any brain region. No brain region showed significant differences in
small-worldness between patients and controls.
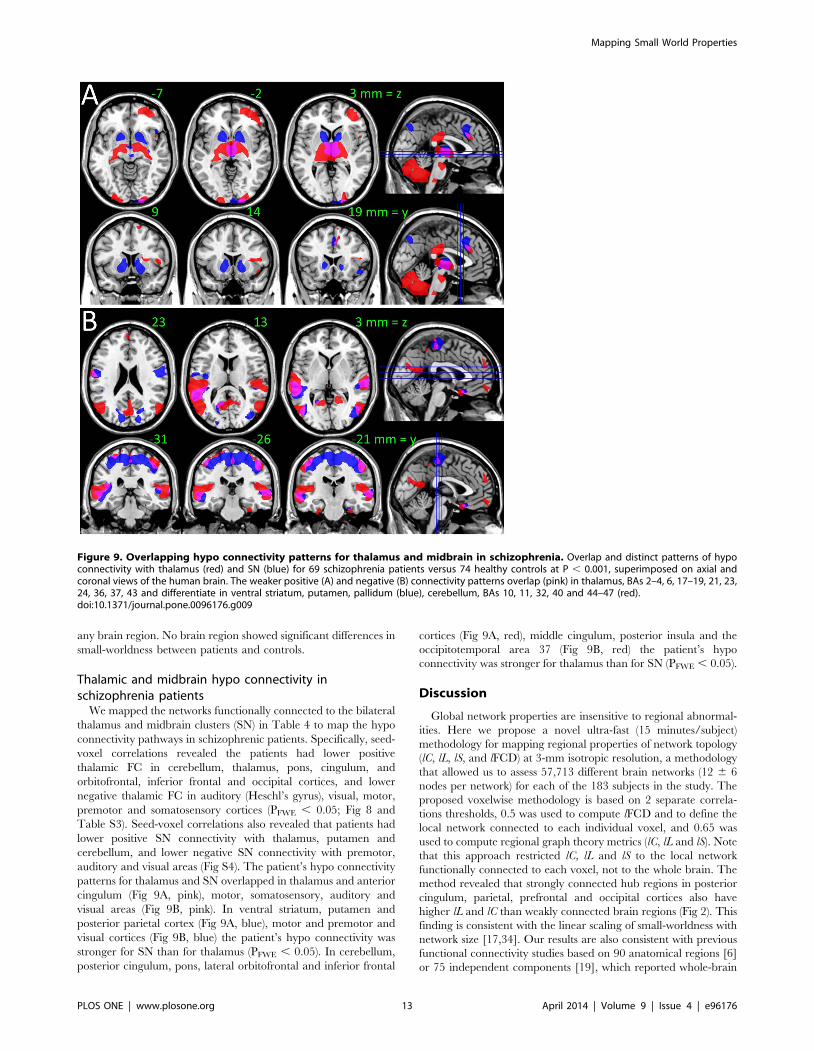
Thalamic and midbrain hypo connectivity inschizophrenia patients
We mapped the networks functionally connected to the bilateral
thalamus and midbrain clusters (SN) in Table 4 to map the hypo
connectivity pathways in schizophrenic patients. Specifically, seed-
voxel correlations revealed the patients had lower positive
thalamic FC in cerebellum, thalamus, pons, cingulum, and
orbitofrontal, inferior frontal and occipital cortices, and lower
negative thalamic FC in auditory (Heschl’s gyrus), visual, motor,
premotor and somatosensory cortices (PFWE , 0.05; Fig 8 and
Table S3). Seed-voxel correlations also revealed that patients had
lower positive SN connectivity with thalamus, putamen and
cerebellum, and lower negative SN connectivity with premotor,
auditory and visual areas (Fig S4). The patient’s hypo connectivity
patterns for thalamus and SN overlapped in thalamus and anterior
cingulum (Fig 9A, pink), motor, somatosensory, auditory and
visual areas (Fig 9B, pink). In ventral striatum, putamen and
posterior parietal cortex (Fig 9A, blue), motor and premotor and
visual cortices (Fig 9B, blue) the patient’s hypo connectivity was
stronger for SN than for thalamus (PFWE , 0.05). In cerebellum,
posterior cingulum, pons, lateral orbitofrontal and inferior frontal
cortices (Fig 9A, red), middle cingulum, posterior insula and the
occipitotemporal area 37 (Fig 9B, red) the patient’s hypo
connectivity was stronger for thalamus than for SN (PFWE , 0.05).
Discussion
Global network properties are insensitive to regional abnormal-
ities. Here we propose a novel ultra-fast (15 minutes/subject)
methodology for mapping regional properties of network topology
(lC, lL, lS, and lFCD) at 3-mm isotropic resolution, a methodology
that allowed us to assess 57,713 different brain networks (12 6 6
nodes per network) for each of the 183 subjects in the study. The
proposed voxelwise methodology is based on 2 separate correla-
tions thresholds, 0.5 was used to compute lFCD and to define the
local network connected to each individual voxel, and 0.65 was
used to compute regional graph theory metrics (lC, lL and lS). Note
that this approach restricted lC, lL and lS to the local network
functionally connected to each voxel, not to the whole brain. The
method revealed that strongly connected hub regions in posterior
cingulum, parietal, prefrontal and occipital cortices also have
higher lL and lC than weakly connected brain regions (Fig 2). This
finding is consistent with the linear scaling of small-worldness with
network size [17,34]. Our results are also consistent with previous
functional connectivity studies based on 90 anatomical regions [6]
or 75 independent components [19], which reported whole-brain
Figure 9. Overlapping hypo connectivity patterns for thalamus and midbrain in schizophrenia. Overlap and distinct patterns of hypoconnectivity with thalamus (red) and SN (blue) for 69 schizophrenia patients versus 74 healthy controls at P , 0.001, superimposed on axial andcoronal views of the human brain. The weaker positive (A) and negative (B) connectivity patterns overlap (pink) in thalamus, BAs 2–4, 6, 17–19, 21, 23,24, 36, 37, 43 and differentiate in ventral striatum, putamen, pallidum (blue), cerebellum, BAs 10, 11, 32, 40 and 44–47 (red).doi:10.1371/journal.pone.0096176.g009
Mapping Small World Properties
PLOS ONE | www.plosone.org 13 April 2014 | Volume 9 | Issue 4 | e96176
0.2 # C , 0.23 and 0.2 # L , 0.23, and with studies on the
anatomical connectivity in the macaque visual cortex [35,36] but
less so with results derived from magnetoencephalographic (MEG)
data in the 2–37.5 Hz bandwidth [4]. Specifically, Basset et al.
documented for the whole-brain 0.2 # C , 0.23, which did not
differ from the whole-brain average clustering coefficient in this
study (,lC. = 0.35 6 0.12), and 4.5 # L , 5.2 which is
significantly higher than the whole-brain average characteristic
path length in this study (,lL. = 1.25 6 0.40). These differences
could reflect methodological differences between MEG (electro-
physiological signals) and MRI (hemodynamic signals) as well as
differential network analysis (global versus local networks). We
show also that the graph theory properties of the brain networks
were not constant but vary significantly across regions, partially
reflecting the spatial variability of lFCD. Specifically, across the
anatomical ROIs the variability in these properties reached tenfold
(0.1 , lC , 0.59; 0.3 , lL , 1.4; 0.3 , lS , 1.9; and 2 , lFCD
, 20).
ReliabilityIntraclass correlation demonstrated the good reliability of the
graph theory measures across subjects, sessions and parameters of
the method (thresholds), particularly for basal ganglia, thalamus,
visual cortex and posterior and anterior cingulum (ICC(3,1) .
0.6). Overall, taking into account that the reliability of blood-
oxygenation-level-dependent (BOLD) functional MRI studies
typically ranges between 20% and 80% [37–39], the test-retest
reliability of lL, lC and lFCD measures is similar to that of standard
functional imaging techniques. The low average reliability of the lS
(two-way mixed single measures ICC = 0.16), which probably
reflects the variability induced by the clustering of the random
network, suggests high within-subjects variability and low statis-
tical power for lS, which could explain the lack of significant effects
of brain maturation and schizophrenia for lS in this study.
Furthermore, the principal component accounted for a large
fraction of the variance, demonstrating the low between-subjects
variability of the proposed voxelwise graph theory measures.
Across subjects, the variability of lL (6%) was lower than that of lC
(13%), lS (29%) and lFCD (31%), suggesting lower influence of
demographics (age, gender), state (alertness and fatigue) and/or
genetics factors for lL than for the other graph theory measures.
Small-worldnessTraditionally, the small-worldness coefficient S is considered a
measure of the balance of segregation and integration in a
functional/structural network. However, S is a global property of
the brain, which is not sensitive to regional abnormalities. Here we
define a local measure of small-worldness (lS) in analogy with the
global measure of S [17]. Thus lS reflects the efficiency of regional
segregation and integration for neural communication in the local
networks. The small-world topology (C/Crand . 1; L/Lrand ,1), as
revealed by lS, was more frequent in subcortical regions (globus
pallidus, cerebellum, thalamus, hippocampus, amygdala and
midbrain), cingulum (BAs 30, 23, 24 and 32) and temporal (BAs
34 and 42) cortices than in other cortical regions (Figs 3 and 4). We
hypothesized that the functional connectivity of the posterior
ventral parietal and occipital regions would demonstrate a small-
world topology characterized by higher clustering and similar path
length, compared to random networks because these hubs are
heavily interconnected [40] and energy demanding [41]. Note that
small-world networks achieve high communication efficiency
through few random connectivity changes between nodes that
retain the high clustering of the regular networks and the short
characteristic path length of the random networks [1]. Indeed, lL/
lLrand , 1 for the hubs in ventral and posterior parietal and
occipital cortices, regions that had high lC. However, whereas the
main functional connectivity hub of the brain (BA 23) had high
lC/lCrand, which demonstrated its small-world properties, most
cortical hub regions did not show high lC/lCrand, which is not
consistent with their small-world topology. Moreover the ventral
precuneus/posterior cingulum showed weaker lS than other
cortical, subcortical or cerebellar regions. The significance of this
unique pattern is unclear but is consistent with prior findings
showing that the precuneus is a brain region with much greater
heterogeneity than other cortical regions [42]. Overall these
findings highlight the variability of lS in the human brain but its
potential impact on functional connectivity could be limited by its
low reliability.
MaturationLocal clustering, path length and degree were higher for
children than for adults in most cortical regions (including
language areas, orbitofrontal, and inferior temporal and occipital
cortices) and thalamus, suggesting that functional connectivity
decreases in the transition into adulthood. Indeed histological
studies from postmortem brains show that synaptic density in the
cortex is maximal at 2–4 years of age (double adult levels), with
significant pruning occurring in the transition from adolescence
into adulthood [43]. These findings are also consistent with the
higher functional connectivity [21,44–46] and the lower levels of
hierarchical brain network organization for children than for
adults [47]. It has been proposed that connectivity decreases from
childhood to adulthood reflect less specialized or efficient
functional networks in children as brain networks develop from
a local to a distributed organization with decreased short-range
connections [48,49]. Indeed, the proposed graph theory measures
(lC, lL and lFCD) reflect the local connectivity of the brain regions
and their decreases from childhood to adulthood reveal decreased
short-range connectivity and weaker local small-world topology.
These findings support the thoughts that rapid changes in human
brain circuitry occur from childhood to adulthood, which could
explain the increased vulnerability to risk-taking behaviors [50]
and to psychiatric disorders such as schizophrenia [51,52] during
this transitional stage.
SchizophreniaThe local graph theory metrics (lC, lL and lFCD) were weaker
for patients with schizophrenia than for healthy controls,
consistently with the disconnection hypothesis of schizophrenia
[53], which postulates that hallucinations, delusions, loss of
initiative, and cognitive dysfunction result from abnormal wiring
of brain networks [54]. Indeed, previous imaging studies have
reported lower regional brain connectivity [16], loss of integrity of
frontal and temporal white matter connections [55–57] and
altered default mode network connectivity [58–61] in patients with
schizophrenia. More recently, reduced interconnectivity among
hubs has been reported in patients with schizophrenia [62]. The
present study reveals lower degree of connectivity, clustering and
path length in schizophrenia that was most prominent in the
thalamus and the midbrain. This is consistent with our prior
findings of thalamic and midbrain disconnection in patients with
schizophrenia [16,63]. Compared to controls the patients dem-
onstrated lower thalamic connectivity in cerebellum, cingulum,
frontal, visual, auditory, motor and premotor cortices, which is
consistent with the reduced connectivity between thalamus and
prefrontal cortex in schizophrenia patients [64,65]. In addition,
the present study demonstrates lower midbrain (centered in SN)
connectivity in thalamus and putamen for patients than for
Mapping Small World Properties
PLOS ONE | www.plosone.org 14 April 2014 | Volume 9 | Issue 4 | e96176
controls, which is consistent with our previous studies on the
functional connectivity of SN [21] and with the hypoconnectivity
of midbrain with thalamus and putamen in unmedicated patients
with schizophrenia [63]. The prefrontal cortex also showed
significantly shorter lL in schizophrenic patients than controls,
which is also consistent with reports of reduced connectivity of the
prefrontal cortex in schizophrenia [66,67]. Interestingly, decreased
metabolic activity in frontal cortex as well as decreased frontal
blood flow was one of the first brain imaging findings reported in
schizophrenia [16,68,69], which might reflect in part reduced
prefrontal connectivity since regional connectivity density is
linearly correlated with metabolic rate [41]. Similarly the findings
of reduced connectivity in left superior temporal cortex (Wer-
nicke’s area) in schizophrenia corroborate prior findings of
decreased connectivity of the planum temporale (superior tempo-
ral cortex within the Sylvian fissure, posterior to the auditory
cortex) in schizophrenia, which was associated with psychopathol-
ogy [70]. Since the superior temporal cortex is involved in the
generation of hallucinations [71] the reduced connectivity with
thalamus could underlie hallucinatory behaviors. The findings in
schizophrenic patients contrast with the increases in lC, lL and
lFCD in children when compared to adults and suggest that they
might reflect enhanced pruning in schizophrenic patients. Indeed
synaptic pruning has been hypothesized to underlie the neuropa-
thology of schizophrenia [72].
Study limitationsInformation about the use of antipsychotic medications was not
available in this work, which is a confounding factor for the
interpretation of the hypoconnectivity we observed in schizo-
phrenic patients. Previous studies have shown that resting state
fronto-temporal functional connectivity was increased in schizo-
phrenia patients compared to controls at baseline and subse-
quently normalized in patients after six weeks of antipsychotic
treatment [73]. Furthermore, an acute dose of sulpiride, a selective
dopamine D2 receptor antagonist was shown to affect global and
local efficiency of brain networks [74], and the disruption of small-
world properties was correlated with the chlorpromazine equiv-
alent dose that the patients were receiving in one resting-state
study [75]. Thus, further studies are needed to understand the
contribution of neuroleptic medications on the decreased connec-
tivity that we and others are reporting in the brain of
schizophrenic patients.
SummaryHere we propose novel ultra-fast graph theory measures to map
local network properties such as lC, lL and lS at 3-mm isotropic
resolution in the human brain. These measures exhibited good
reliability across test-retest measures and different computational
parameters for most brain regions (lC and lL: ICC(3,1) . 0.5) and
low variability across subjects (, 29%). Subcortical regions (globus
pallidus, thalamus, hippocampus and amygdala), cerebellum,
cingulum and temporal cortex demonstrated stronger small-world
topology than other brain regions. The present study reveals
higher lFCD, lC and lL values in cortical regions for children/
adolescents than adults suggesting maturation effects on the small-
world topology of the local connectivity and lower lFCD, lC and lL
values in thalamus and midbrain for patients with schizophrenia
than for controls, suggesting exaggerated pruning of connectivity
in these brain regions.
Supporting Information
Figure S1 Principal component analysis for local mea-sures of clustering, lC, and characteristic path length,lL, showing that the principal component (PC0) cap-tured a large fraction of the variance (. 87%). Sample: 40
healthy children (WashU dataset), correlation thresholds: RT1 =
0. 50; RT2 = 0.65.
(TIF)
Figure S2 Principal component analysis for local small-worldness, lS, and local functional connectivity density,lFCD, showing that the principal component (PC0)captured a large fraction of the variance (. 69%).Sample: 40 healthy children (WashU dataset), correlation
thresholds: RT1 = 0. 50; RT2 = 0.65.
(TIF)
Figure S3 Average strength of local measures of clus-tering, lC, characteristic path length, lL, small-world-ness, lS, and functional connectivity density (degree),lFCD, of the networks functionally connected to eachimaging voxel for 74 healthy adults (A) and 69 schizo-phrenia patients (B), superimposed on axial views of thehuman brain.
(TIF)
Figure S4 Statistical significance (t-scores) of decreasesin the positive (blue-cyan) and negative (red-yellow) FCof the SN seed between patients with schizophrenia (N =69) and healthy controls (N = 74), superimposed onlateral and medial surface views of the cerebrum andanterior and posterior surface views of the cerebellum.
(TIF)
Table S1 Strength of the local degree (lFCD), clustering(lC), characteristic path length (lL) and small-worldness(lS) at the locations of the lFCD-hubs in the brain ofschizophrenia patients (SCZ) and controls (CON).
(DOCX)
Table S2 Average values in anatomical ROIs for localclustering (lC), characteristic path length (lL), small-worldness (lS) and local degree (lFCD) from children/adolescents.
(DOCX)
Table S3 Average values in anatomical ROIs for localclustering (lC), characteristic path length (lL), small-worldness (lS) and local degree (lFCD) for healthy adult(CON) and schizophrenia patients (SCZ).
(DOCX)
Author Contributions
Conceived and designed the experiments: DT NDV. Performed the
experiments: DT. Analyzed the data: DT. Contributed reagents/
materials/analysis tools: DT. Wrote the paper: DT NDV. Developed the
software to compute voxelwise graph theory measures: DT.
References
1. Watts D, Strogatz S (1998) Collective dynamics of ’small-world’ networks.
Nature 393: 440–442.
2. Sporns O, Chialvo D, Kaiser M, Hilgetag C (2004) Organization, development
and function of complex brain networks. Trends Cogn Sci 8: 418–425.
3. Bassett D, Bullmore E (2006) Small-world brain networks. Neuroscientist 12:
512–523.
Mapping Small World Properties
PLOS ONE | www.plosone.org 15 April 2014 | Volume 9 | Issue 4 | e96176
4. Bassett D, Meyer-Lindenberg A, Achard S, Duke T, Bullmore E (2006) Adaptive
reconfiguration of fractal small-world human brain functional networks. Proc
Natl Acad Sci U S A 103: 19518–19523.
5. Sporns O, Tononi G, Edelman G (2000) Theoretical neuroanatomy: relating
anatomical and functional connectivity in graphs and cortical connection
matrices. Cereb Cortex 10: 127–141.
6. Achard S, Salvador R, Whitcher B, Suckling J, Bullmore E (2006) A resilient,
low-frequency, small-world human brain functional network with highly
connected association cortical hubs. J Neurosci 26: 63–72.
7. Bullmore E, Sporns O (2009) Complex brain networks: graph theoretical
analysis of structural and functional systems. Nat Rev Neurosci 10: 186–198.
8. van den Heuvel M, Stam C, Boersma M, Hulshoff Pol H (2008) Small-world
and scale-free organization of voxel-based resting-state functional connectivity in
the human brain. Neuroimage 43: 528–539.
9. Beu M, Baudrexel S, Hautzel H, Antke C, Mueller H-W (2009) Neural traffic as
voxel-based measure of cerebral functional connectivity in fMRI. J Neurosci
Methods 176: 263–269.
10. Buckner R, Sepulcre J, Talukdar T, Krienen F, Liu H, et al. (2009) Cortical
hubs revealed by intrinsic functional connectivity: mapping, assessment of
stability, and relation to Alzheimer’s disease. J Neurosci 29: 1860–1873.
11. Tomasi D, Volkow N (2010) Functional Connectivity Density Mapping. Proc
Natl Acad Sci U S A 107: 9885–9890.
12. Bassett D, Bullmore E, Verchinski B, Mattay V, Weinberger D, et al. (2008)
Hierarchical organization of human cortical networks in health and schizo-
phrenia. J Neurosci 28: 9239–9248.
13. Tomasi D, Volkow N (2012) Abnormal Functional Connectivity in Children
with Attention-Deficit/Hyperactivity Disorder. Biol Psychiatry 71: 443–450.
14. Yu Q, Allen E, Sui J, Arbabshirani M, Pearlson G, et al. (2012) Brain
connectivity networks in schizophrenia underlying resting state functional
magnetic resonance imaging. Curr Top Med Chem 12: 2415–2425.
15. Fitzsimmons J, Kubicki M, Shenton M (2013) Review of functional and
anatomical brain connectivity findings in schizophrenia. Curr Opin Psychiatry
26: 172–187.
16. Volkow N, Wolf A, Brodie J, Cancro R, Overall J, et al. (1988) Brain interactions
in chronic schizophrenics under resting and activation conditions. Schizophr Res
1: 47–53.
17. Humphries M, Gurney K (2008) Network ’small-world-ness’: a quantitative
method for determining canonical network equivalence. PLoS One 3: e0002051.
18. Lynall M, Bassett D, Kerwin R, McKenna P, Kitzbichler M, et al. (2010)
Functional connectivity and brain networks in schizophrenia. J Neurosci 30:
9477–9487.
19. Yu Q, Plis S, Erhardt E, Allen E, Sui J, et al. (2012) Modular Organization of
Functional Network Connectivity in Healthy Controls and Patients with
Schizophrenia during the Resting State. Front Syst Neurosci 5: 103.
20. Tomasi D, Volkow N (2011) Functional connectivity hubs in the human brain.
Neuroimage 57: 908–917.
21. Tomasi D, Volkow N (2012) Functional Connectivity of Substantia Nigra and
Ventral Tegmental Area: Maturation During Adolescence and Effects of
ADHD. Cereb Cortex: [Epub ahead of print] doi: 10.1093/cercor/bhs1382.
22. Volkow N, Brodie J, Wolf A, Gomez-Mont F, Cancro R, et al. (1986) Brain
organization in schizophrenia. J Cereb Blood Flow Metab 6: 441–446.
23. Skudlarski P, Jagannathan K, Anderson K, Stevens M, Calhoun V, et al. (2010)
Brain connectivity is not only lower but different in schizophrenia: a combined
anatomical and functional approach. Biol Psychiatry 68: 61–69.
24. Laursen T, Agerbo E, Pedersen C (2009) Bipolar disorder, schizoaffective
disorder, and schizophrenia overlap: a new comorbidity index. J Clin Psychiatry
70: 1432–1438.
25. Copeland J, Dewey M, Scott A, Gilmore C, Larkin B, et al. (1998)
Schizophrenia and delusional disorder in older age: community prevalence,
incidence, comorbidity, and outcome. Schizophr Bull 24: 153–161.
26. Power J, Barnes K, Snyder A, Schlaggar B, Petersen S (2012) Spurious but
systematic correlations in functional connectivity MRI networks arise from
subject motion. Neuroimage 59: 2142–2154.
27. Rubinov M, Sporns O (2010) Complex network measures of brain connectivity:
uses and interpretations. Neuroimage 52: 1059–1069.
28. Park S, Miller K (1988) Random number generators: good ones are hard to find.
Communications of the ACM 31: 1192–1201.
29. Van Dijk K, Sabuncu M, Buckner R (2012) The influence of head motion on
intrinsic functional connectivity MRI. Neuroimage 59: 431–438.
30. Tomasi D, Volkow N (2011) Gender differences in brain functional connectivity
density. Hum Brain Mapp 33: 849–860.
31. Tomasi D, Volkow N (2011) Aging and Functional Brain Networks. Mol
Psychiatry 17: 549–558.
32. Van Essen D (2005) A Population-Average, Landmark- and Surface-based
(PALS) atlas of human cerebral cortex. Neuroimage 28: 635–662.
33. Tzourio-Mazoyer N, Landeau B, Papathanassiou D, Crivello F, Etard O, N, et
al. (2002) Automated anatomical labeling of activations in SPM using a
macroscopic anatomical parcellation of the MNI MRI single-subject brain.
Neuroimage 15: 273–289.
34. Lago-Fernandez L, Huerta R, Corbacho F, Siguenza J (2000) Fast response and
temporal coherent oscillations in small-world networks. Phys Rev Lett 84:
2758,2761.
35. Hilgetag C, Burns G, O’Neill M, Scannell J, Young M (2000) Anatomical
connectivity defines the organization of clusters of cortical areas in the macaque
monkey and the cat. Philos Trans R Soc Lond B Biol Sci 355: 91–110.
36. Sporns O, Kotter R (2004) Motifs in brain networks. PLoS Biol 2: e369.
37. Aron A, Gluck M, Poldrack R (2006) Long-term test-retest reliability of
functional MRI in a classification learning task. Neuroimage 29: 1000–1006.
38. Kong J, Gollub R, Webb J, Kong J, Vangel M, et al. (2007) Test-retest study of
fMRI signal change evoked by electroacupuncture stimulation. Neuroimage 34:
1171–1181.
39. Manoach DS, Halpern EF, Kramer TS, Chang Y, Goff DC, et al. (2001) Test-
retest reliability of a functional MRI working memory paradigm in normal and
schizophrenic subjects. 158: 955–958.
40. van den Heuvel M, Kahn R, Goni J, Sporns O (2012) High-cost, high-capacity
backbone for global brain communication. Proc Natl Acad Sci U S A 109:
11372–11377.
41. Tomasi D, Wang G, Volkow N (2013) Energetic cost of brain functional
connectivity. Proc Natl Acad Sci U S A 110: 13642–13647.
42. Volkow N, Zhu W, Felder C, Mueller K, Welsh T, et al. (2002) Changes in brain
functional homogeneity in subjects with Alzheimer’s disease. Psychiatry Res 114:
39–50.
43. Huttenlocher P, Dabholkar A (1997) Regional differences in synaptogenesis in
human cerebral cortex. J Comp Neurol 387: 167–178.
44. Jolles D, van Buchem M, Crone E, Rombouts S (2011) A comprehensive study
of whole-brain functional connectivity in children and young adults. Cereb
Cortex 21: 385–391.
45. Kelly A, Di Martino A, Uddin L, Shehzad Z, Gee D, et al. (2009) Development
of anterior cingulate functional connectivity from late childhood to early
adulthood. Cereb Cortex 19: 640–657.
46. Stevens M, Pearlson G, Calhoun V (2009) Changes in the interaction of resting-
state neural networks from adolescence to adulthood. Hum Brain Mapp 30:
2356–2366.
47. Supekar K, Musen M, Menon V (2009) Development of large-scale functional
brain networks in children. PLoS Biol 7: e1000157.
48. Fair D, Dosenbach N, Church J, Cohen A, Brahmbhatt S, et al. (2007)
Development of distinct control networks through segregation and integration.
Proc Natl Acad Sci U S A 104: 13507–13512.
49. Fair D, Cohen A, Power J, Dosenbach N, Church J, et al. (2009) Functional
brain networks develop from a "local to distributed" organization. PLoS Comput
Biol 5: e1000381.
50. Steinberg L (2008) A Social Neuroscience Perspective on Adolescent Risk-
Taking. Dev Rev 28: 78–106.
51. Kessler R, Berglund P, Demler O, Jin R, Merikangas K, et al. (2005) Lifetime
prevalence and age-of-onset distributions of DSM-IV disorders in the National
Comorbidity Survey Replication. Arch Gen Psychiatry 62: 594–602.
52. Paus T, Keshavan M, Giedd J (2008) Why do many psychiatric disorders emerge
during adolescence? Nat Rev Neurosci 9: 947–957.
53. Friston K (1999) Schizophrenia and the disconnection hypothesis. Acta Psychiatr
Scand Suppl 395: 68–79.
54. Fornito A, Zalesky A, Pantelis C, Bullmore E (2012) Schizophrenia,
neuroimaging and connectomics. Neuroimage 62: 2296–2314.
55. Kanaan R, Kim J, Kaufmann W, Pearlson G, Barker G, et al. (2005) Diffusion
tensor imaging in schizophrenia. Biol Psychiatry 58: 921–929.
56. Ellison-Wright I, Bullmore E (2009) Meta-analysis of diffusion tensor imaging
studies in schizophrenia. Schizophr Res 108: 3–10.
57. Voineskos A, Lobaugh N, Bouix S, Rajji T, Miranda D, et al. (2010) Diffusion
tensor tractography findings in schizophrenia across the adult lifespan. Brain
133: 1494–1504.
58. Whitfield-Gabrieli S, Thermenos H, Milanovic S, Tsuang M, Faraone S, et al.
(2009) Hyperactivity and hyperconnectivity of the default network in
schizophrenia and in first-degree relatives of persons with schizophrenia. Proc
Natl Acad Sci U S A 106: 1279–1284.
59. Mannell M, Franco A, Calhoun V, Canive J, Thoma R, et al. (2010) Resting
state and task-induced deactivation: A methodological comparison in patients
with schizophrenia and healthy controls. Hum Brain Mapp 31: 424–437.
60. Bluhm R, Miller J, Lanius R, Osuch E, Boksman K, et al. (2007) Spontaneous
low-frequency fluctuations in the BOLD signal in schizophrenic patients:
anomalies in the default network. Schizophr Bull 33: 1004–1012.
61. Garrity A, Pearlson G, McKiernan K, Lloyd D, Kiehl K, et al. (2007) Aberrant
"default mode" functional connectivity in schizophrenia. Am J Psychiatry 164:
450–457.
62. van den Heuvel M, Sporns O, Collin G, Scheewe T, Mandl R, et al. (2013)
Abnormal rich club organization and functional brain dynamics in schizophre-
nia. JAMA Psychiatry 70: 783–792.
63. Hadley J, Nenert R, Kraguljac N, Bolding M, White D, et al. (2013) Ventral
Tegmental Area/Midbrain Functional Connectivity and Response to Antipsy-
chotic Medication in Schizophrenia. Neuropsychopharmacology: [Epub ahead
of print] 10.1038/npp.2013.1305.
64. Marenco S, Stein J, Savostyanova A, Sambataro F, Tan H, et al. (2012)
Investigation of anatomical thalamo-cortical connectivity and FMRI activation
in schizophrenia. Neuropsychopharmacology 37: 499–507.
65. Woodward N, Karbasforoushan H, Heckers S (2012) Thalamocortical
dysconnectivity in schizophrenia. Am J Psychiatry 169: 1092–1099.
Mapping Small World Properties
PLOS ONE | www.plosone.org 16 April 2014 | Volume 9 | Issue 4 | e96176

66. Rasetti R, Sambataro F, Chen Q, Callicott J, Mattay V, et al. (2011) Altered
cortical network dynamics: a potential intermediate phenotype for schizophrenia
and association with ZNF804A. Arch Gen Psychiatry 68: 1207–1217.
67. Ottet M, Schaer M, Debbane M, Cammoun L, Thiran J, et al. (2013) Graph
theory reveals dysconnected hubs in 22q11DS and altered nodal efficiency in
patients with hallucinations. Front Hum Neurosci 7: 402.
68. Farkas T, Wolf A, Jaeger J, Brodie J, Christman D, et al. (1984) Regional brain
glucose metabolism in chronic schizophrenia. A positron emission transaxial
tomographic study. Arch Gen Psychiatry 41: 293–300.
69. Weinberger D, Berman K, Zec R (1986) Physiologic dysfunction of dorsolateral
prefrontal cortex in schizophrenia. I. Regional cerebral blood flow evidence.
Arch Gen Psychiatry 43: 114–124.
70. Oertel-Knochel V, Knochel C, Matura S, Prvulovic D, Linden D, et al. (2013)
Reduced functional connectivity and asymmetry of the planum temporale in
patients with schizophrenia and first-degree relatives. Schizophr Res 147: 331–
338.71. Linden D, Thornton K, Kuswanto C, Johnston S, van de Ven V, et al. (2011)
The brain’s voices: comparing nonclinical auditory hallucinations and imagery.
Cereb Cortex 21: 330–337.72. Boksa P (2012) Abnormal synaptic pruning in schizophrenia: Urban myth or
reality? J Psychiatry Neurosci 37: 75–77.73. Lui S, Li T, Deng W, Jiang L, Wu Q, et al. (2010) Short-term effects of
antipsychotic treatment on cerebral function in drug-naive first-episode
schizophrenia revealed by "resting state" functional magnetic resonanceimaging. Arch Gen Psychiatry 67: 783–792.
74. Achard S, Bullmore E (2007) Efficiency and cost of economical brain functionalnetworks. PLoS Comput Biol 3: e17.
75. Liu Y, Liang M, Zhou Y, He Y, Hao Y, et al. (2008) Disrupted small-worldnetworks in schizophrenia. Brain 131: 945–961.
Mapping Small World Properties
PLOS ONE | www.plosone.org 17 April 2014 | Volume 9 | Issue 4 | e96176
Recommended


